Embed Size (px)
Citation preview

EVALUATION OF THE RELATIONSHIP BETWEEN
BODY MASS INDEX, DENTAL CARIES AND DIET
AMONG A GROUP OF 6-12 YEARS OLD SCHOOL
GOING CHILDREN IN CHENNAI CITY
Dissertation submitted to
THE TAMILNADU Dr. M.G.R. MEDICAL UNIVERSITY
In partial fulfillment for the degree of
MASTER OF DENTAL SURGERY
BRANCH VIII
PEDODONTICS AND PREVENTIVE DENTISTRY
APRIL 2012


ACKNOWLEDGEMENT
I would like to take this opportunity to thank my mentor and guide
Dr.M.Jayanthi, MDS, Professor and Head of the Department of Pedodontics and
Preventive Dentistry, Ragas Dental College and Hospital, Chennai, who has been a
constant inspiration and instrumental in shaping my views. Her enthusiasm, unmatched
tireless patience and unlimited zeal proved to be a major driving force throughout my
post graduation life. Madam, I solemnly express my deep felt gratitude for your
valuable and great guidance and suggestions.
I take this opportunity to thank Dr. S. Ramachandran, MDS, Principal, Ragas
Dental College & Hospital, for his constant support throughout my post graduation
course.
I express my deep sense of gratitude to Dr.Elizabeth Joseph, MDS, Professor,
Department of Pedodontics and Preventive Dentistry, Ragas Dental College and
Hospital, Chennai, who was there at each step guiding me to prepare this dissertation. I
am deeply grateful for her detailed and constructive comments and for her important
support throughout this work.
I would like to thank Dr.Senthil, MDS, Reader, Department of Pedodontics and
Preventive Dentistry, Ragas Dental College and Hospital, Chennai for his continuous
encouragement throughout my study period.
I extend my sincere thanks to Dr.Shakthivel, MDS, Senior Lecturer,
Dr.Poornima, MDS, Senior Lecturer and Dr.Girija, MDS, Senior Lecturer,
Department of Pedodontics and Preventive Dentistry, Ragas Dental College and
Hospital, Chennai for their motivation towards the completion of the dissertation.

I take this opportunity to thank Dr.N.S.Azhagarasan, MDS, and
Dr.N.R.Krishnaswamy, MDS, Vice-Principals, Ragas Dental College and Hospital, for
their generous support rendered throughout my post graduation course.
I would like to thank the Management of Ragas Dental College and Hospital
for their help and support.
I would like to extend my gratitude to Mr. Porchelvan, Statistician, for his
valuable help in statistical analysis.
I would also like to thank the management of all the schools for giving me
permission to carry out this dissertation in their esteemed institutions. A special thanks
to all the children participated in this study without whom this project would have ever
been possible.
I am profoundly thankful to my batch mate Dr. Madhulika Injeti for
encouraging me and helping me throughout my post graduation course. I extend my
gratitude to my Seniors Dr.Madhavan, Dr. Arun Prasad and Juniors Dr.John Philip,
Dr.Rajakumar, Dr. Vignesh Guptha and Dr.Shilpa Priya for their friendly help,
support and cooperation throughout my postgraduate life.
I express my love and thanks to my loving Dad, Mom and my grand father for
their love, support and encouragement throughout these years without which I would
not have reached so far.
This dissertation is dedicated to my HOD who had been my support from the day
one till today, who really deserves more than a mere word of acknowledgement.

TABLE OF CONTENTS
S.NO.
TITLE
PAGE NO.
1.
INTRODUCTION
1
2.
AIMS AND OBJECTIVES
3
3.
REVIEW OF LITERATURE
4
4.
MATERIALS AND METHODS
23
5.
RESULTS
28
6.
DISCUSSION
44
7.
CONCLUSION
52
8.
SUMMARY
54
9.
BIBLIOGRAPHY
55
10.
ANNEXURE
-

LIST OF TABLES
S.NO
TITLE
PAGE
NO.
1.
DISTRIBUTION OF THE STUDY POPULATION
ACCORDING TO BMI-FOR-AGE
33
2.
CARIES PREVALENCE OF THE STUDY
POPULATION ACCORDING TO BMI-FOR-AGE
34
3.
CARIES PREVALENCE OF MALES AND
FEMALES ACCORDING TO BMI-FOR-AGE
35
4.
MEAN CARIES SCORE AND STANDARD
DEVIATION OF CHILDREN ACCORDING TO
BMI-FOR-AGE
36
5.
DISTRIBUTION OF MEAN CARIES SCORES OF
MALES AND FEMALES ACCORDING BMI-
FOR-AGE
37
6.
MEAN DAILY DIETARY INTAKE ACCORDING
TO BMI-FOR-AGE CATEGORIES
38
6a.
COMPARISON OF MEAN DAILY DIETARY
INTAKE BETWEEN BMI-FOR-AGE
CATEGORIES
39
7.
MEAN DIETARY INTAKE AND CARIES
SCORES AMONG VARIOUS BMI-FOR-AGE
CATEGORIES
40
7a.
RELATIONSHIP OF CARIES WITH BMI-FOR-
AGE AND DIETARY INTAKE
41

LIST OF GRAPHS
S.NO.
TITLE
1.
DISTRIBUTION OF THE STUDY POPULATION ACCORDING
TO BMI-FOR-AGE
2.
CARIES PREVALENCE OF THE STUDY POPULATION
ACCORDING TO BMI-FOR-AGE
3.
CARIES PREVALENCE OF MALES AND FEMALES
ACCORDING TO BMI-FOR-AGE
4.
MEAN CARIES SCORES OF PRIMARY AND PERMANENT
DENTITION
5.
DISTRIBUTION OF MEAN CARIES SCORES OF MALES AND
FEMALES ACCORDING BMI-FOR-AGE
6.
MEAN DAILY DIETARY INTAKE OF ALL BMI-FOR-AGE
CATEGORIES
7.
MEAN DIETARY INTAKE AND CARIES SCORES AMONG
VARIOUS BMI-FOR-AGE CATEGORIES

LIST OF FIGURES
S.NO.
TITLE
1.
MATERIALS USED TO MEASURE HEIGHT AND WEIGHT
2.
MATERIALS USED FOR INTRA ORAL EXAMINATION
3.
HEIGHT MEASUREMENT
4.
WEIGHT MEASUREMENT
5.
INTRA ORAL EXAMINATION

ANNEXURE
S.NO.
TITLE
1.
DATA RECORDING PROFORMA
2.
CONSENT FORM (ENGLISH)
3.
CONSENT FORM (TAMIL)
4.
CDC BMI-FOR-AGE PERCENTILES- BOYS
5.
CDC BMI-FOR-AGE PERCENTILES- GIRLS
6.
DIET RECORDING SHEET (ENGLISH)
7.
DIET RECORDING SHEET (TAMIL)

Introduction
1
INTRODUCTION
Obesity has become an epidemic in many parts of the world.1 Obesity is not only
a problem found in the adult population but has also become an increasing problem in
paediatrics.2,3
Obesity appears to influence the general health as well as oral health of an
individual. Obesity in children increases the risk of subsequent morbidity, increased
prevalence of hypertension, type 2 diabetes mellitus, dyslipidaemia, left ventricular
hypertrophy, non-alcoholic steatohepatitis, obstructive sleep apnoea, and orthopaedic
and psychosocial problems,4,5,6
accelerates dental development7 and decreases
masticatory performance.8
Several characteristics of today’s society contribute to the widespread
childhood obesity problem. Children today lead more sedentary life style.9 The factors
contributing to the increase in childhood obesity include excessive consumption of
soda10-12
and juice13
, large sized portions of food served over the past ten years10
, fewer
meals eaten with together as a family and consumption of fewer fruits and
vegetables14,15
, dependency on readymade food items, decreased physical activity with
great popularity of television and computer games16
, shortage of space in many schools
for sports (play grounds).
An increase in energy stored, as fat, can lead to obesity and a number of
mechanisms can contribute to an increase in stored energy.17
If energy intake is in
excess of energy expenditure or normal intake with reduced expenditure, it results in the

Introduction
2
disturbance in the energy balance equation and increases the stored energy resulting in
increase in weight or obesity.17
On the other hand, one of the most common oral diseases is dental caries which
has multifactorial aetiology among which diet plays a vital role. The relationship
between ingestion of refined carbohydrates, especially sugars and the prevalence of
dental caries is well documented in the literature.18
Childhood obesity and childhood
dental caries are co-incidental in many populations, probably due to common
confounding risk factors such as intake frequency, cariogenic diet and poor oral health.9
As diet is a risk factor common to both obesity and dental caries, this study was
set to explore the relationship between body mass index, dental caries and dietary
pattern amongst a group of children between 6-12years of age and to utilize the data in
educating parents and their children through health care providers regarding the ill
effects of excessive/frequent consumption high caloric and cariogenic foods.

Aims and Objectives
3
AIMS AND OBJECTIVES
The aim of the study was
1. To determine the association between body mass index-for-age and dental caries
in children.
2. To find out if there is any relationship between body mass index-for-age and
dietary pattern of children.

Review of Literature
4
REVIEW OF LITERATURE
Willershausen B et al (2004)19
studied the relationship between height, weight
and caries frequency in elementary school children. 842 children between the ages 6-
11 years from Germany were included in the study and DF-T/ df-t values were
determined along with height, body weight and body mass index. The results of the
study showed that 33.7% of the children had no decayed or filled teeth, 73.9% were
within the normal weight range, 12.9% of the children were overweight and 13.2%
children were obese. 35.5% of the children with normal weight had healthy teeth
while 27.5% of children in the overweight category had healthy teeth and 29.7% of
the obese children had healthy teeth. Children with normal weight had mean df-t value
of 2.09 and DF-T value of 0.57, overweight children had average df-t value of 2.48
and DF-T value of 0.91 and obese children had average df-t value of 3.3 and DF-T
value of 0.88. The caries prevalence showed a significant association to weight when
Fisher test was carried out. It was concluded that there is an association between an
increase in dental caries and high weight in children going to elementary school.
Patricia Vasconcelos Leitao Moreira et al (2006)20
conducted a cross-
sectional study to know the prevalence of dental caries in obese and normal weight
Brazilian adolescents aged 12 to 15 years. Initially a pilot study was carried out to
obtain the prevalence of dental caries among obese and normal weight individuals.
1665 normal weight and 1665 obese individuals from seven state schools and six
private schools in the state of Paraiba, Brazil were included in the study. Height and

Review of Literature
5
weight measurements were recorded and were compared with growth standards
established by the National centre for health statistics (NCHS) for age and gender.
The WHO (1997) dental caries diagnostic criteria were used for the calculation of
caries. Caries in primary teeth were not calculated. The results showed that the mean
DMFT for obese adolescents from private schools was 1.90 and for those of normal
weight was 1.91. The mean DMFT for obese adolescents from state schools was 4.27
and for those of normal weight were 4.25. Caries prevalence in obese groups was
9.0% and 50.9% in private and state schools respectively. Likewise, caries prevalence
in normal weight group was 9.6% in private schools and 52.4% in state schools. The
overall caries prevalence irrespective of the schools was 30.0% in obese and 31.0% in
normal weight group. From this result, it was concluded that there was no statistically
significant association between dental caries and obesity.
Hilgers KK, Kinane DF, Scheetz JP (2006)9
conducted a preliminary study to
determine whether childhood obesity is positively associated with increased risk for
smooth surface caries in posterior teeth. The study included 178 children between 8 to
11 years of age who participated in a school based dental treatment program called
“Smile Kentucky”. Comprehensive dental examination, height and weight
measurements and prescribed bitewing radiographs were taken for all the children
who participated in the program. Body mass index was calculated for age and gender
and children were grouped as recommended by the International obesity task force. A
published caries index by Pitts in 2001 was modified and used to rank caries severity.
The results showed that the overall caries average ranged from 0.00 to 4.40, but did
not vary significantly with patient age, BMI or gender. But, permanent molar caries
average significantly increased with increase in body mass index. This study

Review of Literature
6
concluded that children with increased body mass indices had an increased
interproximal caries incidence in their permanent molars. Neither age nor gender was
found to be related to the incidence of proximal caries.
Macek MD, David J. Mitola (2006)21
explored the association between
overweight and dental caries among US children. The study was conducted to
examine the relationship between age- specific body mass index and dental caries in
children between 2 to 17 years old. Survey data (NHANES) from 1999 to 2002 were
used in this study and body measures and oral health (dentition section) were merged
for this analysis. The outcome variables were measure of dental caries prevalence and
severity for primary and permanent dentition. BMI for age percentiles were used.
From the results it was found that approximately 36% of overweight children between
2 to 6 years old and 39% of overweight children between 6 to 17 years old had dental
caries. Mean dental caries scores for overweight children were dft= 3.3 and DMFT=
2.5 for primary and permanent dentitions, respectively. The study showed that there
was no significant association between BMI for age and dental caries prevalence in
both the dentitions. There was also no significant association between BMI for age
and dental caries severity in children in primary dentition. Overweight children with a
positive history of dental caries in the permanent dentition exhibited fewer decayed,
missing, filled teeth than normal weight group.
Willershausen.B et al (2007)22
studied the correlation between oral health and
body mass index in 2071 children including 1073 girls and 998 boys attending
primary school. Children aged 6 to 10 years attending primary schools in the city of
Mainz were enrolled in this study. A dental examination including the assessment of

Review of Literature
7
carious lesions (df-t and DF-T) and measurements of height and weight in order to
determine the BMI were done. Results showed that 6.8% of the elementary school
children were underweight, 76.4% had normal weight, and 10.5% were overweight
and 6.3% were obese. 50% of the underweight children showed healthy teeth, 47.4%
with normal weight showed healthy teeth, while 41.5% of overweight and 38.3% of
obese children displayed healthy teeth. No gender related differences, regarding the
prevalence rates for high weight and obesity could be established. The study
concluded that there was significant correlation between body mass index and caries
frequency.
Marshall TA et al (2007)23
conducted a study to determine whether caries and
obesity were associated in paediatric population and if found associated, then to
explore the role of diet and socio economic status. Children and their parents who
were participants in the Iowa fluoride study and Iowa bone development study were
included in this study. A questionnaire to gather information regarding parental age,
parental educational levels and family income was mailed. Children’s primary
dentition was examined for dental caries and their anthropometric measurements were
recorded at 4.5 – 6.9 years of age. Dietary data was collected from a three day food
and beverage diaries which was completed at 1,2,3,4 and 5 years of child’s age. The
results showed that children at the risk of overweight had higher caries than normal
and overweight children. Further, children with caries had low family incomes, less
parental education than children without caries. The study concluded that caries and
obesity coexists in children belonging to low socio economic status.

Review of Literature
8
Isabelle Bailleul-Forestier et al (2007)24
conducted a transversal study to assess
the caries experience in severely obese adolescent population who were treated for
obesity. Eighty two adolescents aged 12- 18 years from the suburbs of Paris were
included in the study. The study population was categorized into obese group (n=41)
and non-obese group (n=41). None of the study population had taken part in
preventive dental program in the past. Body mass index was calculated and in the
obese group, the values ranged from 29 to 66.6 while, in the non-obese group the BMI
values ranged from 14.7 to 23.9. Dental examination was conducted and the caries
experience of both the groups was expressed using DMFT index. Restorative index
(RI) was calculated using the formulae: (F/D+F) * 100%. The results showed the
mean DMFT index of obese group was 6.9 + 4.1 and for the non-obese group was 4.3
+ 3.5. Further, there was significant association between body mass index and DMFT
indices in the obese group. The obese adolescents had more caries than the non-obese
adolescents. It was concluded that severely obese children had high caries experience.
Pinto A et al (2007)25
conducted a study to evaluate the association between
weight and dental caries among children during their first dental visit at an urban
dental school in Pennsylvania. It was hypothesized that there was a significant
association between obesity and presence of untreated dental caries. The study was
conducted on 135 children for a period of four months. Anthropometric measurements
were taken and BMI percentile was calculated prior to dental examination. DS/ds
index was used to assess dental caries. Results showed that approximately 12% of the
subjects fell into the risk of being overweight category and 15% were considered over
weight. Mean Ds scores was 2.06% with 16% in 2 subjects, 14% in 1 subject and 10%
Review of Literature
9
in 3 subjects. Spearman’s correlation between DS/ds and BMI was not significant.
The study concluded that no correlation between obese and non- obese children exists.
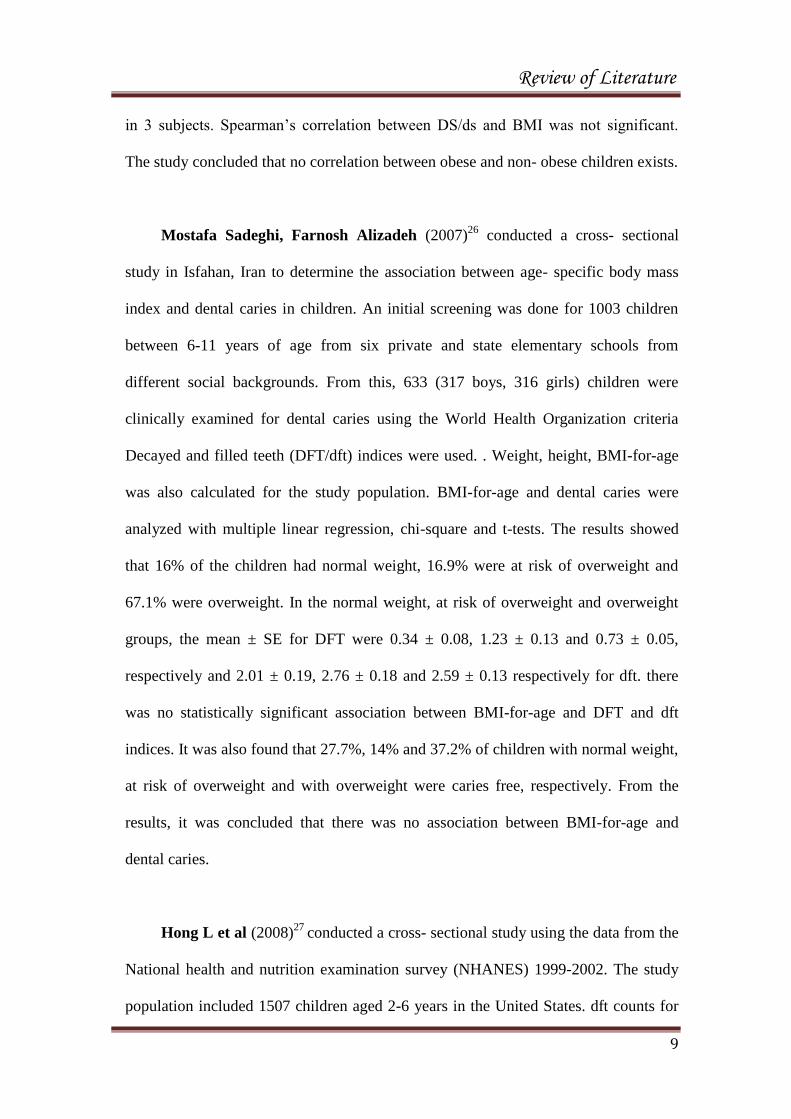
Mostafa Sadeghi, Farnosh Alizadeh (2007)26
conducted a cross- sectional
study in Isfahan, Iran to determine the association between age- specific body mass
index and dental caries in children. An initial screening was done for 1003 children
between 6-11 years of age from six private and state elementary schools from
different social backgrounds. From this, 633 (317 boys, 316 girls) children were
clinically examined for dental caries using the World Health Organization criteria
Decayed and filled teeth (DFT/dft) indices were used. . Weight, height, BMI-for-age
was also calculated for the study population. BMI-for-age and dental caries were
analyzed with multiple linear regression, chi-square and t-tests. The results showed
that 16% of the children had normal weight, 16.9% were at risk of overweight and
67.1% were overweight. In the normal weight, at risk of overweight and overweight
groups, the mean ± SE for DFT were 0.34 ± 0.08, 1.23 ± 0.13 and 0.73 ± 0.05,
respectively and 2.01 ± 0.19, 2.76 ± 0.18 and 2.59 ± 0.13 respectively for dft. there
was no statistically significant association between BMI-for-age and DFT and dft
indices. It was also found that 27.7%, 14% and 37.2% of children with normal weight,
at risk of overweight and with overweight were caries free, respectively. From the
results, it was concluded that there was no association between BMI-for-age and
dental caries.
Hong L et al (2008)27
conducted a cross- sectional study using the data from the
National health and nutrition examination survey (NHANES) 1999-2002. The study
population included 1507 children aged 2-6 years in the United States. dft counts for

Review of Literature
10
the primary dentition was recorded followed by measuring height and weight. Body
mass index was calculated and the participants were categorized using age and gender
specific criteria given by centre for disease control, 2000. The results showed that
48% were male and 52% were female children and 74% of the children had normal
BMI, 11% were at the risk of overweight, and 11% were in overweight category.
30% of the study population had 1-5 dft and 12% had more than 5 dft. Significant
relationship between caries and obesity was found only for children between 60-72
months of age and not in any other age groups. From the results, the study concluded
that there appears no association between childhood obesity and caries experience.
Ana F. Granville-Garcia et al (2008)28
studied the relationship between
childhood obesity and dental caries. The study was done in the city of Recife, Brazil
and included 2651 children between 1- 5 years of age from 84 public and private
elementary schools. Dental caries and anthropometric measurements were calculated
according to WHO criteria. The results showed that obesity was present in 9% of the
children and dental caries prevalence was 19%. Upon statistical analysis, it was found
that there was no difference in DMFT score between the obese and non- obese
children. Based on these results, it was concluded that there was no relationship
between dental caries and childhood obesity.
Anita Alm, Christina Fahraeus Lill-Kari Wendt, Goran Koch (2008)29
investigated the relationship between body weight status in adolescents and snacking
habits in early childhood to approximal caries prevalence at 15 years of age. The cross
sectional study was conducted a part of the longitudinal surveys of oral health in
children followed from the ages of 1-15 years in Sweden. A total of 402 teenagers

Review of Literature
11
were included in the study and body adiposity status was estimated at 13.5-16.4 years
using International Obesity Task Force cut-off values (isoBMI). Information about
snacking habits in early childhood was obtained from interviews conducted at 1 year
and 3 years. Approximal caries information was obtained from Bitewing radiographs
at 15 years. The results showed that adolescents with isoBMI ≥25 had an approximal
caries prevalence that was a mean of 1.6 times higher than those with isoBMI < 25.
Furthermore, it was found that children’s snacking habits at an early age were
associated with approximal caries at 15 years (P<0.05). The study concluded that
overweight and obese teenagers had more approximal caries than normal weight
individuals and the frequent consumption of snacking products during early childhood
appeared to be a risk indicator for caries at 15 years. The study recommended that
preventive programs should include multidisciplinary level approach to prevent and
reduce both obesity and dental caries at an early age.
Gerdwin EW et al (2008)30
conducted a study in Sweden to evaluate the
association between dental caries, childhood body mass index and socio economic
status. The study population included 2303 children who were born in 1991 and living
in the country of Ostergotland, Sweden in 2001. Data on weight and height at 4, 5, 7
and 10 years of age were extracted from the records of child welfare centres and
school health services. Data on dental caries was obtained from the country council at
6, 10 and 12 years of age. deft score was calculated for primary teeth at 6 years and
DFT and DFSa was calculated for permanent teeth at 10 and 12 years of age. The
results showed that 69%, 76.9% and 68% were caries free at 6, 10 and 12 years
respectively. Likewise obese, but not overweight children had more caries affected
teeth than non- obese children. The study confirmed that caries prevalence is

Review of Literature
12
positively associated with obesity in the study population but the association was
weak .it was also concluded that childhood BMI and socio economic status were
unrelated.
Freire MCM et al (2008)31
studied the relationship between height and dental
caries in adolescents in Brazil. The study was conducted to test the hypothesis that
taller Brazilian adolescents have lower levels of caries experience. A questionnaire
was used to collect the data for 664 adolescents aged 15 from a cross sectional study
on the relationship between psychosocial factors and oral health in Brazilian
adolescents. Sampling method used was two staged sampling and stratified sampling.
Height measurements were taken. Caries experience was calculated using DMFT
AND DMFS index. Information regarding socio economic status, frequency of sugar
consumption, fluoride exposure and school performance were also obtained. The
results clearly stated that there was a decreased risk of having higher DMFT/DMFS
levels among taller adolescents. Further, caries experience was higher among low
socio economic status. This study concluded that taller adolescents have low caries
experience.
Sheller B et al (2009)32
conducted a retrospective case study to describe the
body mass index of children with severe early childhood caries receiving dental
rehabilitation under general anaesthesia. The study population included 293 healthy
children between 2-5 years of age. Demographic measurements like birth date,
gender, and ethnicity were obtained. Anthropometric measurements were recorded
and BMI for age and gender was calculated based on recommendations given by
centers for disease control. Radiographs were used to determine dmft index and

Review of Literature
13
number of pulp involved teeth. The results showed that 11% of the study population
was under weight, 67% had normal weight, 9% was at the risk of overweight and 11%
was obese. The mean dmft score was 11.8. It was found that the BMI percentile did
not have any correlation with neither dmft index nor pulp involved teeth. From this
study, it was concluded that age and gender specific BMI percentile had no correlation
with caries experience or pulp involvement.
Sharma A, Hegde AM (2009)33
studied the relationship between body mass
index, dental caries experience and preferences of diet in children in the age group 8-
12 years. The study was done in Mangalore, India and it included 500 children of
whom 255 were boys and 245 were girls. Anthropometric measurements were
calculated using balanced beam scale and stadiometer and BMI was calculated. Caries
experience was calculated using DMFS/dmfs index by a single examiner. Preferences
to various sweet and fatty foods were obtained using a 35 item food frequency
questionnaire. Older children completed the questionnaire by themselves while
parents of the younger children were asked to fill the questionnaire. The results
showed that 58.4% children had normal weight, 8.6% were under weight, 22.2% were
at the risk of overweight and 10.8% were obese. The mean DMFS for obese children
was 2.85 and normal weight children was 1.58 (p- 0.013). The mean dfs for normal
weight was 2.14 where as in obese group, it was 3.25. It was found that there was an
increase in mean caries experience in both primary and permanent dentition as body
weight increases from underweight to obese with an exception of higher increase in
caries experience in permanent dentition among underweight children compared to
children with normal body weight, over weight and obese. Likewise, 25.2% of the
overweight and 25.9% of obese children preferred sweet and fatty foods more

Review of Literature
14
frequently whereas only 7.9% of children in normal weight group preferred sweet and
fatty foods more frequently. From this study, it was concluded that there is a higher
prevalence of dental caries in over weight and obese children in both permanent and
primary dentition and children who are obese and overweight prefer sweet and fatty
foods more frequently than children with normal weight. The study recommended that
calculation of BMI in routine examination of the children.
Tripathi S et al (2010)34
studied the relation between dental caries and obesity
among 2688 students between 6-17 years of age from two private schools and one
government schools, India. Teeth missing for orthodontic reasons, extraction or trauma
were not included in the DMFT scores. Caries in primary teeth was not recorded.
Radiographs were not taken. For anthropometric assessment, a 150 KG digital scale, a
100 g scale and a 200 cm tape were used according to WHO criteria and National Centre
for Health Statistics guidelines. Assessment and classification of BMI were performed
following established guidelines by National Center for Health Statistics (NCHS, 1976)
for age and gender. The results showed that 7.5% of students from private schools were
obese while 1.57% from government school was obese. Likewise, 92.6% students from
private schools were non- obese while 98.4% students from government schools were
non- obese. Dental caries prevalence was 27.6% in private school students and 9.6% in
public school students. The mean DMFT score in obese and non- obese group from
private school students were 1.163 and 1.072 respectively (p-0.836). The mean DMFT
score in obese and non- obese group from government school students were 0.298 and
0.490 respectively (p-0.098). The study concluded that although the obese children
studying both in private and government schools had more dental caries in comparison to

Review of Literature
15
non-obese children, there was no significant association between obesity and increase
incidence of dental caries.
Kelishadi R et al (2010)35
conducted a case control study to find out whether
there is any association between dental caries and cardio metabolic risk factors among
youths in Isfahan. The study population included 132 participants between 11 to 16
years. Cardio metabolic risk factors like body mass index, blood pressure, blood
glucose level, cholesterol level and serum lipid profile were measured from blood
samples. Decayed, missing, filled surfaces were calculated based on WHO criteria.
The study results showed a significant difference between mean values of DMFS,
BMI and other measured variables. The authors recommended that more attention
should be paid to oral health and to create a sense of responsibility among medical
health professionals to inform children and families about hazards of having high
caries index and poor oral hygiene and their potential association with cardiovascular
disease risk factors.
Tambelini CA et al (2010)36
conducted a cross sectional study in Brazil to
evaluate the prevalence of dental caries and investigate its association with excess
weight in adolescents and socio demographic factors. The study included a sample of
424 adolescents between 15 to 19 years of age. The prevalence of dental caries was
assessed according to the WHO criteria (1997). Body mass index was calculated from
anthropometric measurements and the samples were assigned into one of the four
groups namely obese, overweight, normal weight and underweight. Socio
demographic characteristics were obtained through interviews with the adolescents.
The results showed that prevalence of dental caries was 72.9% and excess weight

Review of Literature
16
(overweight and obese) was diagnosed in 22.4% of the sample. 5.4% had low weight,
72.2% had normal weight. The study stated that socio demographic factors like age,
skin colour and area of residence had a positive influence on the prevalence of dental
caries but, excess weight was not found to be associated with the prevalence of dental
caries.
Niraj Gokhale et al (2010)37
conducted a study to find out if there was any
correlation between dental caries and body mass index among 100 children aged 3 to
14 years at Nellore, India. Dental examination included DMFT and def indices
followed by weight and height measurements and socioeconomic status
determination. Body mass index was calculated and children were categorized into
one of the three groups namely ideal weight (BMI 14-17), underweight (BMI less than
14) and over weight (BMI more than 17). The results showed no statistically
significant values between body mass index, socioeconomic status and dental caries.
From this study it was concluded that there was no association between body mass
index and dental caries and as well as socioeconomic status and dental caries. Other
factors have a role to play in caries process.
Giselle D’Mello et al (2011)38
studied the relationship between dental caries
experience in deciduous dentition and Body mass index among pediatric dental clinic
attenders in Newzeland. The study included 200 children aged 8 years for whom
height and weight were measured and BMI was calculated and deciduous dental caries
experience was recorded. The results showed that the overall mean BMI was 16 and
dmft ranged from 0 to 15 with a mean of 6. 24% had dmft less than 3 and 38% had

Review of Literature
17
dmft greater than 8. It was concluded that there was no association between BMI and
dental caries experience.
Davies PSW (1997)39
conducted a study to investigate the relationship between
composition of the diet and body mass index in children between 1.5 years to 4.5
years. The study included 1444 children from Great Britain. Data regarding diet were
obtained from the National Diet and Nutrition Survey (NDNS) were used to calculate
percentage of total energy intake derived from fat, carbohydrate and protein following
a four day weighed intake carried out by the parents or care givers of the children.
Height and weight measurements were used to calculate the body mass index the
children. The results showed that taller and heavier than girls and there was a
significant difference between mean energy intake in the boys and girls (P<0.01).
Girls consumed more energy from proteins and less from carbohydrates than the boys
(P<0.05). There was no significant difference in the percentage energy obtained from
fat between boys and girls. The results also revealed that there were no obvious trends
for BMI and carbohydrates, fat and protein intake. The study concluded that it was not
possible to confirm the recent findings in much smaller samples that diet composition
affects body size. It was suggested that other findings like energy intake per se and
habitual physical activities might have an important role on the size, BMI and body
composition of pre-school children.
Atkin LM and Davies PSW (1999)40
conducted a study to determine whether
diet composition was related to percentage body weight in children aged 1.5 – 4.5
years. The study included 77 preschool children for whom the data were provided by
the feasibility study for the National Diet and Nutritional Survey, Great Britain. The

Review of Literature
18
child’s mother or primary caregiver was asked to keep a weighed food record for a
period of 4 consecutive days including a Saturday and a Sunday. Comprehensive
instructions on how to weigh and record all the food and drinks consumed were
provided by a field worker before the recording period began. Likewise, body
composition was assessed by measurement of total body water (oxygen 18- dilution
method). Habitual physical activity was assessed by calculating the ratio of total
energy expenditure to predicted basal metabolic rate. Dietary intake and body
composition were analyzed to evaluate whether diet composition was related to body
fat. The results showed that the average energy intake was 4759KJ/d for the total
sample. Mean values for diet composition indicated that carbohydrate provided 57.4%
of energy, fat provided 30.5% and protein provided 12.1% of energy. It was found
that there were no significant correlations between percentage body fat and dietary
intake or percentage of energy from carbohydrate, fat or protein 9dietary intake). The
study concluded that physical activity level may have a greater influence on body
composition in early childhood.
Brien GO and Davies M (2006)41
conducted a study to investigate the
relationship between nutritional knowledge and body mass index. The study was
conducted on first 500 patients (261 females and 239 males) listed in alphabetical
order aged between 18 and 65 years on the database of a general practice in Belfast,
Northern Ireland. Levels of nutritional knowledge were assessed using the general
nutritional questionnaire which is a self-reported measure. Demographic questions
concerned age and gender. Participants were asked to report their weight and height in
order to calculate their BMI. The results showed that 145 people returned completed
questionnaires. The sample comprised 91 females (63%) and 54 males (37%). The

Review of Literature
19
mean age of responders was 43.8 years. The World Health Organisation obesity
classification system was used to categorize participants according to their BMI:
underweight (2.8%), normal (43.4%), overweight (31%), obese class I (22.1%) and
obese class II (0.7%). There was no significant correlation between levels of nutrition
knowledge and BMI; however, a high level of nutrition knowledge was found among
the sample. The study stated that a knowledge deficit may not be the most significant
factor preventing overweight individuals from adopting a healthier diet and questions
the utility of purely educational approaches to dietary behaviour change.
LaRowe TL, Moeller SM and Adams AK (2007)42
conducted a study to
evaluate diet quality and body mass index (BMI) by beverage patterns in children
aged 2 to 11 years. The sample consisted of 541 children aged 2 to 5 years and 793
children aged 6 to 11 years. Beverage patterns were formed using 24-hour dietary
recall diet variables from the 2001-2002 National Health and Nutrition Examination
Survey. Beverages were aggregated into eight beverage groups: high-fat milk,
reduced-fat milk, fruit juices, soda, diet soda, sweetened beverages, coffee and tea,
and water. Anthropometric data were collected at the medical portions of the mobile
examination centre. Height and weight were used to calculate BMI and BMI
percentiles for age and sex according to Centers for Disease Control and Prevention
growth reference charts Cluster analysis was used to identify beverage patterns in
preschool and school-aged children. The results showed that four and five beverage
clusters were identified for children aged 2 to 5 and 6 to 11 years, respectively.
Among children aged 2 to 5 years, they were labelled as mix/ light drinker, high-fat
milk, water, and fruit juices. Similar beverage patterns were also observed for children
aged 6 to 11 years and were labelled the five beverage patterns as mix/light drinker,
Review of Literature
20
high-fat milk, water, sweetened drinks, and soda. The average percentage of total
energy from beverages differed significantly across beverage clusters. Children aged 2
to 5 and 6 to 11 years in the high-fat milk pattern had significantly higher total
percentage of energy intakes from beverages (35.2% of energy and 25.7% of energy,
respectively) compared to other beverage clusters. 29% of energy came from
beverages in the fruit juice cluster for preschool children and 24.3% and 22.8% of
total daily energy intake came from beverages in the sweetened drinks and soda
clusters, respectively, for school-aged children. BMI was not significantly different
across beverage patterns for children aged 2 to 5 years. For children aged 6 to 11
years, BMI was significantly higher in the water, sweetened drinks, and soda patterns
compared to the mix/light drinker and high-fat milk patterns The study concluded that
beverage patterns were related to diet quality among preschool and school-aged
children, but were only related to BMI in school-aged children. It was recommended
that children from all clusters could benefit by decreasing their intake of soda and
other calorically sweetened beverages that may displace important micronutrient-
dense foods needed for growth and development.
Heuberger R and Boyle IO (2009)43
conducted a non-experimental, cross
sectional study to examine the risks of beverage consumption choices and the intake
of beverages. a convenience sample of 706 community participants aged 17 to 72
years living in rural Michigan were included in the study. Standard health and lifestyle
questionnaires adapted from the Chronic Illness Resources Survey (CIRS), Harvard
Food Frequency Questionnaire, Michigan alcohol screening test and alcohol use
disorders identification test and 24 hour food recall for food, alcohol and beverage
were used in this study. The participant’s body mass index was calculated by the

Review of Literature
21
interviewers using self-reported height and weight. Nutrient composition for classes
of beverages was determined using the Nutrition Pro Software System. The results
showed that the mean age of the participants was 23.67 years and 49.7% were females
and 50.1% were males. 86% of the sample consumed carbonated beverages. 99%
were alcohol drinkers. For all the participants’ coffee, tea and hot chocolate
consumption showed an inverse relationship with body mass index but statistical
significance was not achieved. The level of alcohol intake was found to be
significantly associated with increase in BMI. Older persons drank fewer carbonated
beverages and consumed significantly more caffeinated beverages. The results of this
study provides an opportunity for discussion for health education professionals in all
disciplines to work together to impact the overall health outcome of the communities.
Collison KS et al (2010)44
conducted a study to examine the dietary patterns
that may affect anthropological factors. The cross sectional study was conducted in
Saudi Arabia among 9433 (5033 boys and 4400 girls) children aged 10 to 19 years.
Anthropometric measurements like height, weight and waist circumference were
measured and Body Mass Index was calculated for all the participants. A 7- day food
frequency questionnaire translated in Arabic and including coloured pictures of the food
items was used in the study. The frequency of physical activity was monitored by
asking the students to report the number of occasions per week they took part in
exercise consisting of 30 or more minutes. The results showed that the overall
prevalence of overweight children was 15.5%, obese children was 21.1%. 55% of the
children in the study population were in normal range and 16.8% were in underweight
category. The mean waist circumference significantly increased with age with boys
having larger waist circumference. Sugar- sweetened carbonated beverage consumption

Review of Literature
22
varied from 5.93 to 9. 04 servings a week and was found to be significantly higher than
consumption of non- caloric sweetened diet carbonated beverage, which varied between
0.92 and 1.52 servings per week. Older children reported eating significantly less fruits
and vegetables, less egg, fish and cereals than younger children. The number of children
reporting less than 6 hours of night time sleep increased with advancing age and
frequency of exercise decreased with increasing age. Waist circumference and BMI
were positively correlated with sugar- sweetened carbonated beverage consumption in
boys, but not in girls. The study concluded that a high intake of sugar- sweetened
carbonated beverage is associated with poor dietary choices and it correlates with waist
circumference and BMI in boys.

Materials and Methods
23
MATERIALS AND METHODS
This cross sectional study was conducted to evaluate the relationship between
body mass index, dental caries and dietary pattern among a group of 600 healthy school
going children in Chennai between 6 to 12 years of age of both the genders.
Inclusion Criteria
1. Healthy school going children between 6-12 years of age.
2. Children for whom parental consents were obtained.
Exclusion Criteria
1. Children above 12 years and below 6 years of age.
2. Children with long standing systemic illness.
3. Children who were on any medication within the past 2 months.
4. Children with physical or mental disability.
5. Children for whom parental consent was rejected.
6. Children who are under any active medical/ dental treatment.
Armamentarium
The following materials were used in the study.
Stature meter, size 200 cm (Golechha Diagnostics, Chennai)
Portable electronic weighing scale (EB9003L, Ishimura med supplies, Japan)

Materials and Methods
24
Sterile mouth mirrors
Sterile CPI Probes
Sterile Tweezers
Sterile kidney trays
Sterile Cotton
Disposable gloves and mouth masks
Dettol antiseptic solution
Pen, Pencil
Data recording proforma (ANNEXURE-1)
Methodology
This study was conducted to evaluate the relationship between body mass index,
dental caries and dietary pattern among a group of 600 school going children in Chennai
between 6 to 12 years of age of both the genders by the department of Pedodontics and
Preventive dentistry, Ragas Dental College and Hospital, Chennai. After obtaining
approval of the study design from the Institutional review board, the study was
conducted for a period of 7 months from January 2011 to July 2011. Permission from
school authorities was obtained to conduct the study in schools. Following this, the
study design was explained to the teachers and consent forms were sent to parents
through the schools. (ANNEXURE-2&3) After obtaining parent’s consent, children
were randomly included in the study. Demographics including age were obtained from
school records, anthropometric measurements were recorded using stature meter and
electronic weighing machine and children were examined for their dental caries status.
Dietary patterns were obtained using diet charts.

Materials and Methods
25
Calculation of Body Mass Index
Height and weight measurements were recorded for all the children who
participated in the study. Weight of each child on bare foot was measured to the nearest
0.1 kg using a portable glass electronic personal weighing scale (EB9003L, Ishimura
med supplies, Japan) which was calibrated before use. Each child was instructed to
stand still, with mass equally distributed between feet, until the scale reading stabilized.
The reading was then recorded. Height was measured to the nearest 0.1cm using a
stature meter attached to the wall (size 200 cm, Golechha Diagnostics, Chennai). For the
calculation of body mass index, the following formula was used.
BMI = Weight in Kg
(Height in m)2
The value obtained was then plotted on age and gender specific percentile curves
given by the centres for disease control, 200045
and children were categorized into 4
groups based on their BMI percentiles as
UNDER WEIGHT group children with BMI for age less than 5th
percentile
NORMAL group children with BMI for age greater than or equal to 5th
percentile and less than 85th
percentile
OVER WEIGHT group children with BMI for age greater than or equal to 85th
percentile and less than 95th
percentile
OBESE group children with BMI greater than or equal to 95th
percentile.
(ANNEXURE-4&5)

Materials and Methods
26
Evaluation of Dentition status
Caries status (deft and DMFT) was recorded using WHO oral health assessment
form (1997).46
Children were made to sit on the chair and examination was conducted
under bright daylight by a single examiner. Sterile mouth mirrors and CPI probes were
used to examine the oral cavity and to detect caries. Caries was recorded as present
when a lesion in a pit and a fissure or on a smooth surface has an unmistakable cavity,
undermined enamel or a detectably softened floor or wall. Recording of the data was
performed by an assistant.
Diet recording
Food groups were divided into rice and cereal group, meat and poultry group,
dairy and dairy products group, vegetable and fruit group (four basic food groups), fat
and oil group and snacks for the study purpose.47
The most commonly eaten food items
and the food groups they belong to were enlisted in a sheet in their vernacular names for
clear understanding at the time of recording data. After obtaining anthropometric
measurements and caries status, dietary intake of children for three days including a
weekend was obtained by sending the recording sheet to parents through school
authorities.48.49
Children/parents were asked to mark the appropriate food group and
time of consumption in the recording sheet each time when anything is eaten. Older
children (9 years and above) were asked to fill the diet recording sheet by themselves
under parent’s supervision, while parents were asked fill the sheet for younger children
(children < 9 years of age). From the data obtained, mean intake of food groups was
calculated. (ANNEXURE-6&7)
Materials and Methods
27
All the data obtained from anthropometric measurements, dental examination
and diet records were analysed. The results were tabulated and statistical analysis was
done using Chi-square test, Tukey’s HSD Post Hoc test, Student t- test and Multiple
linear regression method (SPSS software version 11).

Figures
FIGURE 1: MATERIALS USED TO MEASURE HEIGHT AND WEIGHT
FIGURE 2: MATERIALS USED FOR INTRA ORAL EXAMINATION

Figures
FIGURE 3: HEIGHT MEASUREMENT
FIGURE 4: WEIGHT MEASUREMENT

Figures
FIGURE 5: INTRA ORAL EXAMINATION

Results
28
RESULTS
A total of 600 school going children in the age group of 6 to 12 years were screened
and examined in this study. Among them, 90 children who did not fill the diet recording sheet
properly were eliminated from the study and finally 510 children’s data were subjected to
statistical analysis.
Table 1 and Graph 1 shows distribution of the study population according to their
gender and body mass index for age. Of the 510 samples, 266 (52.15%) were males and 244
(47.84%) were females. A total of 113 (22.15%) samples belong to the underweight BMI-
for-age. Of them, 64 (56.63%) were males and 49 (43.36%) were females. 249 (48.82%)
children belong to normal BMI- for-age category and in them, 129 (51.80%) were males and
120 (48.19%) were females. 88 (17.25%) children belong to the overweight category. In this
category, 45 (51.13%) were males and 43 (48.85%) were females. A total of 60 (11.76%)
children belong to obese category. Of them, 28 (46.66%) were males and 32 (53.33%) were
females.
There was no statistically significant difference in the distribution of males and
females within each BMI group (P>0.05). On comparing the body mass index of both males
and females belonging to various BMI categories, there was statistical difference between
groups with more number of males and females belonging to the normal BMI-for-age
category followed by underweight category and the least in obese category.

Results
29
Table 2 and Graph 2 shows the caries prevalence of children belonging to various
BMI-for-age categories. Out of the total sample (n=510), 109 (21.40%) children were caries
free and 401 (78.60%) children had caries either in primary or permanent dentition. In the
underweight category, 22 (19.46%) children were free from caries and 91 (80.53%) children
had caries. In the normal BMI-for-age category, out of 249 children, 56 (22.50%) children
were free from caries and 193 (77.50%) children had carious teeth. In the overweight
category, out of 88 children, 22 (25%) children were free from caries and 66 (75%) children
had caries. In the obese category, out of 60 children, 9 (15%) children were caries free and 51
(85%) children had carious teeth.
Among the study population significant number of children were affected with caries
(overall caries prevalence-78.6%) with P=0.000**. On comparing caries affected children
belonging to various BMI categories, a statistically significant difference was observed
between all the categories (P=0.000**) except between overweight and obese category (P=
0.166). Highest prevalence of caries was seen in to obese category children followed by
underweight category, normal category and the least number of children affected by caries
belonged to overweight category.
Table 3 and Graph 3 shows gender distribution of the study population of the caries
affected and caries free children belonging to various BMI-for- age categories. Among the
109 (21.40%) caries free children, 55 (50.45%) were males and 54 (49.54%) were females.
Among the 401 (78.60%) caries affected children, 211 (52.61%) were males and 190
(47.38%) were females. In the underweight category, out of 113 children, 10 (8.84%) males
were caries free, 54 (47.78%) males were caries affected, 12 (10.61%) females were caries
free and 37 (32.74%) females were caries affected. In the normal BMI- for- age category, out

Results
30
of 249 children, 30 (12.04%) males were caries free, 99 (39.75%) males were caries affected,
26 (10.44%) females were caries free and 94 (37.75%) were caries affected. Among the 88
overweight children, 11 (12.5%) males were caries free, 34 (38.63%) were caries affected, 11
(12.5%) females were caries free and 32 (36.36%) females were caries affected. Among the
60 obese children, 4 (6.66%) males were caries free, 24 (40%) males were caries affected, 5
(8.33%) females were caries free and 27 (45%) females were caries affected. There was no
statistical difference between males and females in any BMI-for-age categories with respect
to their caries prevalence (P>0.05).
Table 4 and Graph 4 shows mean caries scores of the study population belonging to
various BMI-for-age categories. The overall mean deft score was 2.06±2.473 and overall
mean DMFT score was 1.025±1.129. The mean deft score and mean DMFT score for the
underweight category were 1.98 ± 2.735 and 0.85± 0.966 respectively. For the children in
normal BMI-for-age category, the mean deft score was 1.78 ± 2.205 and mean DMFT score
was 0.90 ± 1.137. The mean deft score for overweight category was 1.94 ± 2.246 and mean
DMFT score was 1.10 ± 1.077. The mean deft and DMFT scores in the obese category were
2.55± 3.191 and 1.25 ± 1.385 respectively. Caries scores in primary dentition was higher than
in the permanent dentition in all the BMI-for-age categories which was statistically
significant (P<0.01). There was no statistical significant difference in mean caries scores
(both deft and DMFT) between children belonging to various BMI-for-age categories
(P>0.05).
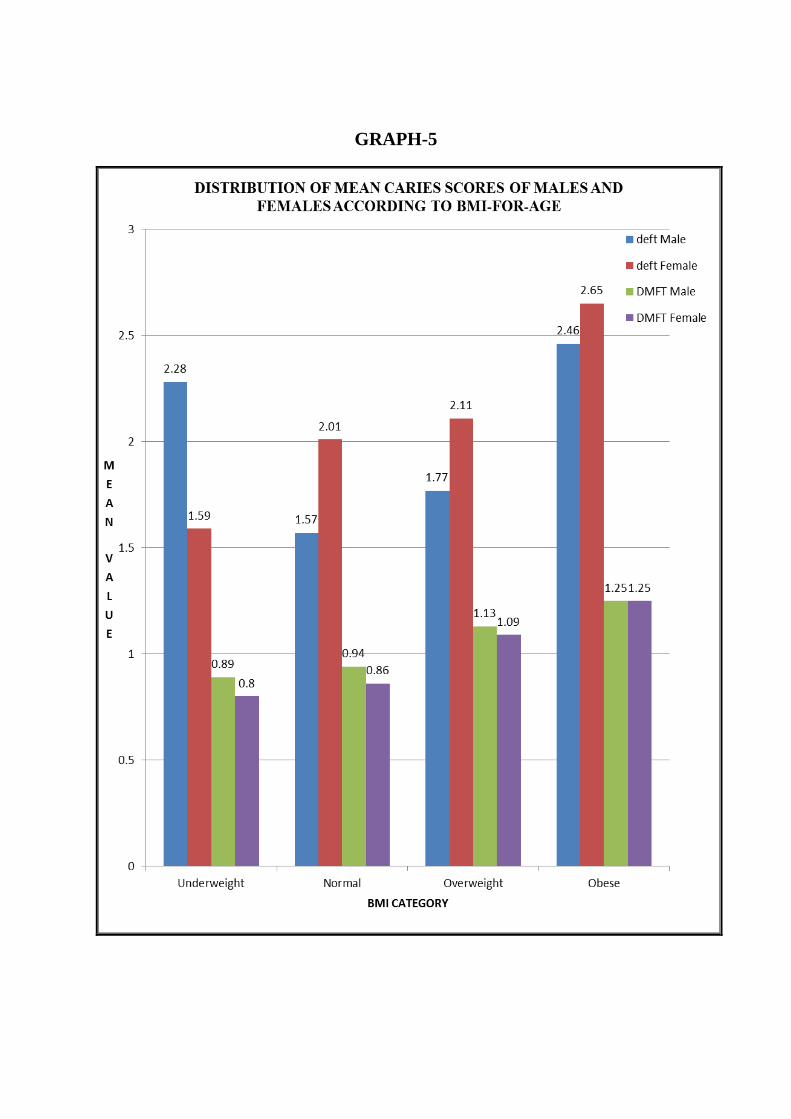
Table 5 and Graph 5 shows distribution of mean caries scores of males and females
belonging to different BMI-for-age categories. In the underweight group, the mean deft score
for males is 2.28 ± 3.139 and for females is 1.59 ± 2.061. The mean DMFT score for males in

Results
31
the underweight group is 0.89±0.945 and for females is 0.80±1.00. In the normal BMI-for-
age group, the mean deft score for males is 1.57±1.911 and mean deft score for females is
2.01±2.472. The mean DMFT score for males in the normal BMI-for-age category is
0.94±1.130 and for females is 0.86±1.147. In the overweight BMI-for-age category, the mean
deft scores for males and females are 1.77±1.698 and 2.11±2.719 respectively. The mean
DMFT score for boys in the overweight category is 1.13±1.014 and for girls is 1.09±1.151. In
the obese category, the mean deft scores for males and females are 2.46±3.727 and
2.65±2.697 respectively. The mean DMFT scores for males and females in the obese
category is 1.25±1.506 and 1.25±1.295 respectively. There was no statistical significant
difference in caries scores (deft and DMFT) between males and females in any BMI-for-age
category (P>0.05).
Table 6 and Graph 6 shows mean values of daily dietary intake of various food
groups of children in various BMI-for-age categories. In the underweight BMI-for-age
category, the mean score for rice and cereal group is 1.30±0.828, 0.59±0.516 for meat and
poultry group, 0.73±0.503 for dairy and dairy products group, 0.77±0.535 for fat and oil
group, 0.71±0.501 for vegetable and fruit group and 1.16±0.791 for snack group. In the
normal BMI-for-age category, the mean score for rice group is 1.44±0.745, 0.71±0.610 for
meat and poultry group, 0.93±0.579 for dairy and dairy products group, 0.82±0.669 for fat
and oil group, 0.77±0.537 for vegetable and fruit group and 1.55±0.887 for snack group. In
the overweight BMI-for-age category, the mean score for rice group is 1.53±0.723,
0.82±0.727 for meat and poultry group, 0.90±0.489 for dairy and dairy products group,
1.39±0.900 for fat and oil group, 0.75±0.532 for vegetable and fruit group and 1.83±0.872 for
snack group. In the obese BMI-for-age category, the mean score for rice group is 1.54±0.657,
0.84±0.595 for meat and poultry group, 0.91±0.563 for dairy and dairy products group,

Results
32
1.62±0.916 for fat and oil group, 0.80±0.650 for vegetable and fruit group and 2.10±1.094 for
snack group.
The mean values of all the food groups increased from underweight to obese group in
an ascending order except for dairy group and vegetable and fruit group. Maximum
consumption of dairy products was observed in normal BMI-for-age category children
followed by obese, overweight and underweight category in a descending order. Likewise,
maximum consumption of vegetables and fruits was observed in obese category followed by
normal, overweight and underweight category in a descending order.
Table 6a shows the comparison of mean daily dietary intake between various BMI-
for age categories. A statistical significant difference in the consumption of meat and poultry
food items was observed between underweight and overweight category with overweight
children taking more of meat and poultry items (P=0.05*) and between underweight and
obese categories (P=0.05*) with obese group taking more of meat and meat products. On
comparing dairy consumption between underweight and normal BMI categories, a statistical
significant difference was found (P=0.009**) with more of dairy product consumed by
normal BMI-for-age category children. Comparison of daily intake of fatty foods and oily
items showed statistically significant difference between all BMI-for-age categories (P<0.05)
except between underweight and normal BMI-for-age categories (P=0.936) and between
overweight and obese categories (P=0.210). Fat and oil consumption was more in obese
group followed by overweight, normal and underweight in a descending order. Likewise,
statistical significant difference in the daily consumption of snack items was found between
all the BMI-for-age categories (P<0.05) except between overweight and obese categories
(P=0.279). Daily consumption of snacks was more in obese group followed by overweight,

Results
33
normal and underweight in a descending order. There was not statistically significant
difference in the daily intake of other food groups between various BMI-for-age categories
(P>0.05).
Table 7 and Graph 7 shows the mean dietary intake of various food groups and
mean caries scores among various BMI-for-age categories. In underweight category, the
mean score for rice and cereal group was 1.30±0.828, 0.59±0.516 for meat and poultry group,
0.73±0.503 for dairy group, 0.77±0.535 for fat and oil group, 0.71±0.501 for vegetables and
fruits, 1.16±0.791 for snack items. The mean deft and DMFT scores for underweight
category are 1.98± 2.735 and 0.85± 0.966 respectively. In the normal BMI-for-age category,
the mean score for rice group is 1.44±0.745, 0.71±0.745 for meat and poultry group,
0.93±0.579 for dairy and dairy products group, 0.82±0.669 for fat and oil group, 0.77±0.537
for vegetable and fruit group and 1.55±0.887 for snack group. The mean deft and DMFT
scores for normal BMI-for-age category are 1.78± 2.205 and 0.90± 1.137 respectively. In the
overweight BMI-for-age category, the mean score for rice group is 1.53±0.723, 0.82±0.727
for meat and poultry group, 0.90±0.489 for dairy and dairy products group, 1.39±0.900 for fat
and oil group, 0.75±0.532 for vegetable and fruit group and 1.83±0.872 for snack group. The
mean deft and DMFT scores for overweight category are 1.94± 2.246 and 1.10± 1.077
respectively. In the obese BMI-for-age category, the mean score for rice group is
1.54±0.657, 0.84±0.595 for meat and poultry group, 0.91±0.563 for dairy and dairy products
group, 1.62±0.916 for fat and oil group, 0.80±0.650 for vegetable and fruit group and
2.10±1.094 for snack group. The mean deft and DMFT scores for obese category are 2.55±
3.191 and 1.25± 1.385 respectively.

Results
34
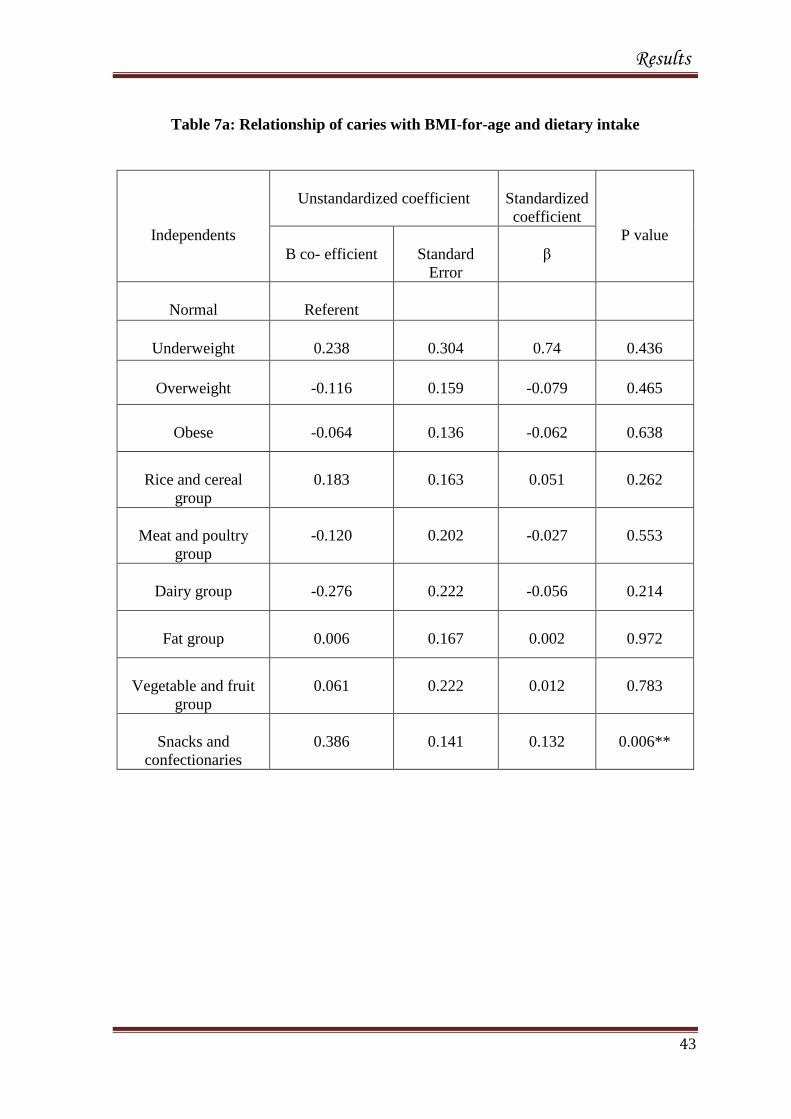
Table 7a shows the relationship between caries and BMI-for-age and dietary intake.
When compared to children in normal BMI-for-age, caries showed no statistically significant
relation to underweight, overweight or obese categories (P>0.05). A significant relation was
observed between caries and consumption of snack items (P=0.006**). No significant
relation was found between caries and any other food groups (P>0.05)

Results
35
Table 1: Distribution of study population according to BMI-for-age
Category
Male
n (%)
Female
n (%)
Total
n (%)
Male vs.
Female
( P value)
Underweight
64 (56.63%) 49 (43.36%) 113 (100%)
0.158 (24.06%) (20.08%) (22.15%)
Normal
129 (51.80%) 120 (48.19%) 249 (100%)
0.568 (48.49%) (49.18%) (48.82%)
Over weight
45 (51.13%) 43 (48.85%) 88 (100%)
0.831 (16.91%) (17.62%) (17.25%)
Obese
28 (46.66%) 32 (53.33%) 60 (100%)
0.606 (10.52%) (13.11%) (11.76%)
Total
266 (52.15%) 244 (47.84%) 510 (100%)
0.641 (100%) (100%) (100%)
P values
Male Female
Underweight vs. Normal 0.000** 0.000**
Underweight vs. Overweight 0.069 0.532
Underweight vs. Obese 0.000** 0.059
Normal vs. Overweight 0.000** 0.000**
Normal vs. Obese 0.000** 0.000**
Overweight vs. Obese 0.047 0.204
Among the various BMI-for-age categories, more children belong to normal BMI-for-
age category followed by underweight category and the least in obese category which
is statistically significant (P=0.000**)
Level of Significance*: P < 0.05
Not Significant: P > 0.05
Highly Significant** : P < 0.01

Results
36
Table 2: Caries prevalence of study population according to BMI-for-age
Category
Children
without caries
n (%)
Children with
caries
n (%)
Total
n (%)
Children without
caries vs. children
with caries
(P value)
Underweight
22 (19.46%)
91(80.53%)
113
0.000**
Normal
56 (22.50%)
193 (77.50%)
249
0.000**
Overweight
22 (25%)
66 (75%)
88
0.000**
Obese
9 (15%)
51 (85%)
60
0.000**
Total
109 (21.40%)
401 (78.60%)
510
0.000**
P values
Children without caries Children with caries
Underweight vs. Normal 0.000** 0.000**
Underweight vs. Overweight 1.000 0.046*
Underweight vs. Obese 0.020* 0.001**
Normal vs. Overweight 0.000** 0.000**
Normal vs. Obese 0.000** 0.000**
Overweight vs. Obese 0.020* 0.166
Significant number of study population were affected with caries (78.6%) P=0.000**
Maximum number of caries affected children belongs to obese group followed by
underweight, normal and least in overweight category.
Level of Significance*: P < 0.05
Not Significant: P > 0.05
Highly Significant** : P < 0.01

Results
37
Table 3: Caries prevalence of males and females according to BMI-for-age
Category
Caries free children
P value
Children with caries
P value
Male
n (%)
Female
n (%)
Male
n (%)
Female
n (%)
Underweight
10
(8.84%)
12
(10.61%)
0.670
54
(47.78%)
37
(32.74%)
0.075
Normal
30
(12.04%)
26
(10.44%)
0.593
99
(39.75%)
94
(37.75%)
0.719
Over weight
11
(12.5%)
11
(12.5%)
1.000
34
(38.63%)
32
(36.36%)
0.806
Obese
4
(6.66%)
5
(8.33%)
0.739
24
(40%)
27
(45%)
0.674
No difference in caries prevalence was seen among males and females belonging to
various BMI-for-age categories (P>0.05).
Level of Significance*: P < 0.05
Not Significant: P > 0.05
Highly Significant** : P < 0.01

Results
38
Table 4: Mean caries score and Standard Deviation of children according to
BMI-for-age
Category
deft
DMFT
P value
Underweight
1.98 ± 2.735
0.85 ± 0.966
0.000**
Normal
1.78 ± 2.205
0.90 ± 1.137
0.000**
Overweight
1.94 ± 2.246
1.10 ± 1.077
0.002**
Obese
2.55 ± 3.191
1.25 ± 1.385
0.005**
Total
2.06±2.473
1.025±1.129
0.000**
P values
deft DMFT
Underweight vs. Normal 0.893 0.979
Underweight vs. Overweight 1.000 0.350
Underweight vs. Obese 0.475 0.116
Normal vs. Overweight 0.954 0.417
Normal vs. Obese 0.136 0.134
Overweight vs. Obese 0.458 0.887
Mean scores of deft Vs. DMFT were highly significant among children belonging to
all the BMI-for-age categories (P<0.01).
Mean scores of both deft and DMFT were not significant between children belonging
to various BMI-for-age categories (P>0.05).
Level of Significance*: P < 0.05
Not Significant: P > 0.05
Highly Significant** : P < 0.01

Results
39
Table 5: Distribution of mean caries scores of males and females according
BMI-for-age
Category
Deft
P value
DMFT
P value
Male
Female
Male
Female
Underweight
2.28±3.139
1.59±2.061
0.562
0.89±0.945
0.80±1.00
0.476
Normal
1.57±+1.911
2.01±2.472
0.125
0.94±1.130
0.86±1.147
0.470
Over weight
1.77±1.698
2.11±2.719
0.844
1.13±1.014
1.09±1.151
0.707
Obese
2.46±3.727
2.65±2.697
0.203
1.25±1.506
1.25±1.295
0.809
Both deft and DMFT scores between males and females among various BMI-for-age
categories was not statistically significant (P>0.05).
Level of Significance*: P < 0.05
Not Significant: P > 0.05
Highly Significant** : P < 0.01

Results
40
Table 6: Mean daily dietary intake according to BMI-for-age categories
Category
Rice and
cereal
group
Meat and
poultry
group
Dairy
group
Fat and oil
group
Veg and
fruit group
Snacks
and
confectionaries
Underweight
(n= 113)
1.30±0.828
0.59±0.516
0.73±0.503
0.77±0.535
0.71±0.501
1.16±0.791
Normal
(n= 249)
1.44±0.745
0.71±0.610
0.93±0.579
0.82±0.669
0.77±0.537
1.55±0.887
Overweight
(n= 88)
1.53±0.723
0.82±0.727
0.90±0.489
1.39±0.900
0.75±0.532
1.83±0.872
Obese
(n= 60)
1.54±0.657
0.84±0.595
0.91±0.563
1.62±0.916
0.80±0.650
2.10±1.094
Mean scores of daily intake of rice and cereal group, meat and poultry group, fat and
oil group and snacks increased from underweight category to obese category.
Mean scores of snacks were more than other food groups in all the BMI-for-age
categories except in the underweight category.

Results
41
Table 6a: Comparison of mean daily dietary intake between BMI-for-age categories
Comparison
Rice and
cereal
group
(P value)
Meat and
poultry
group
(P value)
Dairy
group
(P value)
Fat and
oil group
(P value)
Veg and
fruit group
(P value)
Snacks and
confectionaries
(P value)
Underweight vs.
Normal
0.380
0.315
0.009**
0.936
0.779
0.001**
Underweight vs.
Overweight
0.130
0.05*
0.140
0.000**
0.944
0.000**
Underweight vs. Obese
0.185
0.05*
0.176
0.000**
0.738
0.000**
Normal vs. Overweight
0.728
0.509
0.974
0.000**
0.996
0.05*
Normal vs. Obese
0.764
0.454
0.996
0.000**
0.980
0.000**
Overweight vs. Obese
1.000
0.995
0.999
0.210
0.959
0.279

Results
42
Table 7: Mean dietary intake and caries scores among various BMI-for-age categories
Category
Rice and
cereal group
Meat and
poultry group
Dairy group
Fat and oil
group
Veg and fruit
group
Snacks and
confectionaries
deft
DMFT
Underweight
(n= 113)
1.30±0.828
0.59±0.516
0.73±0.503
0.77±0.535
0.71±0.501
1.16±0.791
1.98±2.735
0.85±0.966
Normal
(n= 249)
1.44±0.745
0.71±0.610
0.93±0.579
0.82±0.669
0.77±0.537
1.55±0.887
1.78±2.205
0.90±1.137
Overweight
(n= 88)
1.53±0.723
0.82±0.727
0.90±0.489
1.39±0.900
0.75±0.532
1.83±0.872
1.94±2.246
1.10±1.077
Obese
(n= 60)
1.54±0.657
0.84±0.595
0.91±0.563
1.62±0.916
0.80±0.650
2.10±1.094
2.55±3.191
1.25±1.385
Results
43
Table 7a: Relationship of caries with BMI-for-age and dietary intake
Independents
Unstandardized coefficient
Standardized
coefficient
P value
B co- efficient
Standard
Error
β
Normal
Referent
Underweight
0.238
0.304
0.74
0.436
Overweight
-0.116
0.159
-0.079
0.465
Obese
-0.064
0.136
-0.062
0.638
Rice and cereal
group
0.183
0.163
0.051
0.262
Meat and poultry
group
-0.120
0.202
-0.027
0.553
Dairy group
-0.276
0.222
-0.056
0.214
Fat group
0.006
0.167
0.002
0.972
Vegetable and fruit
group
0.061
0.222
0.012
0.783
Snacks and
confectionaries
0.386
0.141
0.132
0.006**

GRAPH-1

GRAPH-2

GRAPH-3

GRAPH-4
GRAPH-5

GRAPH-6

GRAPH-7

Discussion
44
DISCUSSION
Childhood overweight and obesity are global problems that are on the rise due to
modernization and change in life style.50
Despite many alarming findings, health
professionals in both medicine and dentistry have been slow to implement clinical
protocols to aid in the diagnosis and treatment of childhood overweight/obesity.51- 53
This may be due in part to the sensitive nature of the weight-related matters, but it has
been shown that health professionals also may lack self-efficacy, knowledge and
information needed to properly diagnose and address the problem.54
As the obesity
epidemic escalates, it is apparent that screening solely during well child visits may no
longer be a viable strategy for addressing the issue55
and dentists can play a role in
handling this problem as children can visit the dentists at the earliest age of 1 year or
below and they also can help by providing diet counselling and anticipatory guidance to
the parents. Even though the role of dentists is small compared to the physicians, this
small success, however, make a significant difference on a population level.56
Children’s dietary habits are significant contributors to childhood obesity30,33
and dietary imbalance causes dental caries which is well established in the literature.57,58
As both dental caries and obesity share some common risk factors like dietary,
biological, genetic, socioeconomic, cultural, environmental and lifestyle issues,23
the
current study was done to explore if there is any relationship between body mass index,
dental caries and diet in a group of healthy school going children between 6 – 12 years
of age in Chennai city.
Discussion
45
Ethical committee approval was obtained from the Institutional review board.
Children from 1st to 5
th standards were randomly included in the study. Demographics
like name, age, gender were recorded. Anthropometric measurements like height and
weight were measured and recorded. Obesity and malnutrition represent opposite
extremities on the spectrum of adiposity and both are routinely quantified in terms of
weight and height relative to the child’s age. The most convenient and commonly used
tool to screen for overweight/obesity is the BMI (Kg/m2), a measure of body weight
adjusted for height. Due to differential changes in height and weight during growth and
development, BMI percentiles specific for age and sex are used to describe childhood
weight status. The Centers for Disease Control and Prevention (CDC) have published
standardized BMI charts to determine BMI percentiles for children.45
Any weight
category other than “healthy weight” (5th
to 84th
percentile) as well as a rapidly rising
BMI growth trajectory may be a cause for concern and discussion among the providers,
parents and patient.
In the present study, intra oral examination was based on WHO oral health
assessment for caries detection (1997) using community periodontal index (CPI) probe
and mouth mirror.46
Caries was recorded following deft and DMFT criteria for primary
and permanent dentition respectively.
Dietary intake of children was obtained for three days including a weekend
through a self-reported diet record.48
Children above 9 years filled the diet recording
sheet by themselves under parental supervision. For younger children, parents filled the
diet recording sheet. After eliminating improperly filled diet recordings, 510 children’s
data were subjected to statistical analysis using SPSS software.

Discussion
46
Among the 510 children, 266 (52.15%) were males and 244 (47.84%) were
females and more children (48.82%) belonged to the normal BMI-for-age category
followed by underweight category (22.15%), overweight (17.25%) and obese categories
(11.76%) in descending order (Table-1). There was no statistically significant
association between BMI-for-age and gender in our study which is similar to the
findings of Mostafa Sadeghi, Ramachandran A et al.26,59
Further, the prevalence of
overweight in the present study (17.25%) is in accordance to the findings of
Ramachandran A et al (16.8%) and more than the findings of Kumar S et al (5.74%)
and Kotian MS et al (9.9%).59,60,61
It is worth mentioning that the calculated global
prevalence of overweight (including obesity) in children aged 5-17 years is estimated by
the WHO, IOTF to be approximately 10%, but this is “unequally distributed”.62
In the present study overall caries prevalence is 78.6%. The results of this study
are slightly higher than the findings of Willershausen (caries prevalence-63%),
Tambeline CA et al (caries prevalence- 72.9%), higher than the findings of and lesser
than the findings of Freire MCM et al (caries prevalence-87.8%).19,36,31
In the present
study, maximum number of children affected by caries belonged to obese category
followed by underweight category, normal BMI-for-age category and the least number
of children affected by caries belonged to overweight category and there was no
statistical difference between males and females in any BMI-for-age categories with
respect to their caries experience (P>0.05) (Table-3). The findings of the present study
are contrary to the findings of Mostafa Sageghi (maximum caries affected children in
overweight category (86%) followed by normal BMI-for-age (72.3%) and least in obese
category (62.8%).26

Discussion
47
In the present study, the mean deft score of the study population is 2.06±2.473
and mean DMFT score is 1.025±1.129 (Table-4). The mean deft and mean DMFT
scores in the present study are less compared to the findings of Mahesh KP et al (mean
deft - 3.51 and mean DMFT - 3.955), Macek MD (mean deft -3.3 and mean DMFT -
2.5), Moses J et al (deft- 2.33 and DMFT- 2.67), Saravanan S et al (deft- 3.00 and
DMFT- 0.42) .63,21,64,65
The results of the present study show that there is no statistically
significant difference in the caries scores of both primary and permanent dentition
between boys and girls in any BMI-for-age category (P>0.05). Similar findings were
seen in the study done by Hilgers KK et al.9
The present study findings shows an increase in mean deft and DMFT scores
from underweight (deft-1.98± 2.735, DMFT-0.85± 0.966) BMI-for-age category to
obese category (deft-2.55± 3.191, DMFT-1.25± 1.385) with exception of higher caries
scores in primary dentition in underweight category than in normal BMI-for-age
category and overweight category. This result is similar to the findings of Hilgers KK
et al (mean overall caries for low BMI -0.73 and mean overall caries for high BMI -
1.06) and Sharma A and Hegde AM (DMFS for underweight children-3.11, DMFS for
normal body weight children -1.58, DMFS for overweight children -2.48 and obese
DMFS for obese children-2.85). 9,33
In the present study, caries scores gradually increased in both primary and
permanent dentition as BMI increased which shows an association between BMI- for-
age and caries but this was not to the statistically significant level (P>0.05). An
association between BMI-for-age and dental caries was found in the studies done by

Discussion
48
Hilgers KK et al, Willershausen et al, Isabelle Baileul Forestier et al and Sharma A
and Hegde AM.9,19,24,33
On the contrary, the studies conducted by Patricia Vasconcelos LM et al,
Macek MD, Andres Pinto A et al, Mostafa Sadhegi, Hong L et al, Ana F. GG et al,
Tripathi S, Tambelini CA et al and Giselle D’Mello et al showed no correlation
between body mass index and dental caries.20,21,25,26,27,28,34,36,38
The findings of the present study shows that the mean scores of all the food
groups increased from underweight to obese group except for dairy group and vegetable
and fruit group. Except for the underweight group children (who ate more rice and
cereals than other food groups), children belonging to all other BMI categories
consumed more snacks compared to other food groups which seeks attention.
In the present study, a statistically significant difference in the intake of meat
and poultry items was seen between underweight and overweight children, underweight
and obese children. There is suggestion in the literature that protein intake, not fat
intake, may be associated with the development of adiposity in childhood.66
It has been
proposed that a high protein intake during early childhood stimulates insulin like growth
factor 1 production, thereby triggering precocious adipocyte multiplication.67
Consumption of dairy products showed statistically significant difference
between underweight and normal BMI-for-age children. Comparison of daily intake of
fatty foods showed statistically significant difference between BMI-for-age categories
except between underweight and normal BMI-for-age categories (P=0.936) and

Discussion
49
between overweight and obese categories (P=0.210). So it can be assumed that children
with high BMI values consume more of fatty foods than children with normal or low
BMI.
The results of the present study show that fatty food consumption was found to
more in obese group followed by overweight, normal and underweight in a descending
order. Fatty foods, which can be assumed to play a vital role in the in contributing to the
body mass or obesity was found to be consumed more by obese children than by
children in any other BMI-for-age category. Similar results are given by the study
conducted by Sharma A and Hegde AM who stated that children who were obese and
overweight preferred sweet and fatty foods more frequently compared to children with
normal weight.33
It is evident that the deposition of excess adipose tissue results from a
positive energy balance. However, a significant body of research findings suggests that
the macronutrient composition of the diet affects the composition of human body. In
particular, it appears that the proportion of fat ingested, compared to carbohydrates and
proteins, influences the amount of body fat. The greater energy density of lipids (38KJ/g
as opposed to 17 KJ/g for other macronutrients) may be one way in which fat exerts its
obesity promoting effect. Thus a higher fat diet necessarily results in a higher energy
intake, which leads to a positive energy balance if energy expenditure is not increased
proportionately.40
A statistical significant difference in the daily consumption of snack items was
found between all the BMI-for-age categories except between overweight and obese
categories (P=0.279). Obese category children consumed more snacks followed by
overweight, normal and underweight in a descending order.

Discussion
50
A balanced diet helps in the development of a healthy child. It should be noted
that a proper diet should include all the essential nutrients in adequate quantity. In the
modern society, people eat more of fast foods outside home; the frequency of snacking
as well as the contribution of snacks to the total caloric intake has drastically increased.
Drinks rich in free sugars increase overall energy intake by limiting the appetite control.
Thus, there is less of compensatory reduction of food intake after the consumption of
high sugar drinks than when additional foods of equivalent energy content are
provided.33
There are few other factors that contribute to the increase in body weight.
They are excessive consumption of soda and juices,10-12
larger sized proportions of food
served over the past 10 years,10
fewer meals eaten together as a family and consumption
of fewer fruits and vegetables, watching television for more hours, preference of
computer games over outdoor sports.
The present study is an attempt to find out if there is any relationship between
body mass index and dental caries and the role of diet in contributing to both the
problems. Using multiple linear regression, when BMI-for-age and diet were compared
with caries (Table 7a), a statistically significant association was found only between
snacks and caries (P=0.006**). It should be remembered that the concept of biological
plausibility suggests that neither the hypothesis “obesity increases risk of caries” nor
“caries increases the risk of obesity” is particularly logical. Rather, it is more realistic
that a common risk factor increases the likelihood of both diseases, which are then
observed in association.23

Discussion
51
The assumption that “overweight/obesity correlates with more caries” cannot be
statistically proved in this study though caries scores in both the dentitions increased as
BMI-for-age increased. Only one of the etiologies common to both dental caries and
obesity has been explored in the present study. The present study is cross sectional and
so a cause-effect relationship over a limited period of time cannot be established. Also,
the self-reporting of dietary data is worth mentioning. Both obesity and dental caries are
complex issues with multiple etiological factors. Our analysis was limited to dietary
pattern alone. Further studies should be targeted on exploring many other contributing
factors to obesity like physical activity, genetic makeup of the child and caloric
quantification of dietary intake on a larger scale.
Our country is in the midst of a childhood obesity epidemic that threatens
nation’s long term health. It is easy to speculate that we are only seeing the tip of the
iceberg and that the future economic, health and social consequences of this epidemic
may be one of our nation’s most serious challenges in this century. As members of the
pediatric health team, it is critical that pediatric dentists maintain awareness of this
epidemic and participate in the assessment and prevention of childhood obesity.68

Conclusion
52
CONCLUSION
Within the limitations of this study, it can be concluded
1. The overall caries prevalence is 78.6%. Caries prevalence was found to be
maximum in obese category children (85%) followed by underweight children
(80.53%), normal BMI-for-age children (77.50%) and overweight children
(75%) in descending order.
2. The present study shows that the overall mean deft score is 2.06±2.473 and the
overall mean DMFT score is 1.025±1.129 and there is no statistically significant
difference in the caries scores of boys and girls between any BMI-for-age
categories.
3. Caries scores gradually increased in both primary and permanent dentition as
BMI increased (except in the primary dentition of underweight children where
deft score was more than normal and overweight children) which shows an
association between BMI- for- age and caries but this was not statistically
significant (P>0.05).
4. Caries in primary dentition is more compared to permanent dentition (overall as
well as in all BMI-for-age categories) which is statistically significant (P<0.05)
but when compared between groups, there is no statistically significant
difference in caries scores both in primary and permanent dentition (P>0.05).

Conclusion
53
5. The mean scores of all the food groups increased from underweight to obese
group except for the dairy group and vegetable and fruit group. Except for the
underweight group, children belonging to all other BMI categories consumed
more snacks compared to other food groups.
6. Comparison of daily intake of fatty foods showed statistically significant
difference between BMI-for-age categories (P<0.05) except between
underweight and normal BMI-for-age categories (P=0.936) and between
overweight and obese categories (P=0.210).
7. A statistical significant difference in the daily consumption of snack items was
found between all the BMI-for-age categories (P<0.05) except between
overweight and obese categories (P=0.279).
8. When compared to children in normal BMI-for-age, caries showed no
statistically significant relationship to underweight, overweight or obese
categories and with any food groups (P>0.05) except with snack items (P<0.05).
Based on the conclusion from this study, it is recommended to create a sense of
responsibility among the health care professionals dealing with children especially
dentists to inform children and parents about the short term and long term effects of
obesity, caries and improper dietary patterns and their potential association with cardio
vascular diseases. The importance of diet counselling is worth mentioning in this
regard.

Summary
54
SUMMARY
The present study was done to find out if there is any relationship between body
mass index, dental caries and dietary intake on a group of 6-12 years old healthy school
going children in Chennai city. Demographics were obtained from school records and
height was measured using stature meter and weight was measured using a portable
electronic weighing machine. BMI-for-age was calculated using CDC growth charts
(2000). Caries was assessed through intra oral examination based on WHO (1997)
criteria. Dietary intake was obtained for three consecutive days including a weekend
through a self-reported diet history.
The overall caries prevalence of the study population was found to be 78.6%
with mean deft score of 2.06 and mean DMFT score of 1.025. As BMI-for-age
increased, the overall caries scores gradually increased (primary and permanent
dentitions) which showed an association between BMI- for- age and caries but this was
not statistically significant in the present study (P>0.05).The mean scores of all the food
groups increased from underweight to obese group except for the dairy group and
vegetable and fruit group. Except for the underweight group, children belonging to all
other BMI categories consumed more snacks compared to other food groups. As BMI-
for-age increased, consumption of fatty foods and snacks gradually increased.
When compared to children in normal BMI-for-age, caries showed no
statistically significant relation with any BMI-for-age categories and with any food
groups except with snack items.
Both childhood obesity and caries have common determinants and require a
comprehensive, integrated management approach by multidisciplinary medical teams
and Pediatric dentists should thus be actively involved in limiting this global issue.

Bibliography
55
BIBLIOGRAPHY
1. Strauss RS, Pollack HA. Epidemic increase in childhood overweight, 1986-
1998. JAMA: 2845-8, 2001.
2. Ogden CL, Flegal KM, Carroll MD, Johnson CL. Prevalence and trends in
overweight among US children and adolescents 1999-2000. JAMA 2002; 288:
1728-1732.
3. US Department of Health and Human Services. The surgeon General’s call to
action to prevent and decrease overweight and obesity. Rockville, Md: US
DHHS, Public Health Service, Office of the surgeon General; 2001.
4. Barlow SE, Dietz WH. Obesity evaluation and treatment: Expert Committee
Recommendations. The Maternal and Child Health Bureau, Health resources
and Services Administration and the Department of Health and Human Services.
Pediatrics 1998;102:E29.
5. Nanda K. Non-alcoholic Steatohepatitis in Children. Pediatr transplant
2004;8:613-18.
6. Li X, Li S, Ulusoy E, Chen W, Srinivasan SR Berenson GS. Childhood
Adiposity as a Predictor of Cardiac Mass in Adulthood: The Bogalusa Heart
Study. Circulation 2004;110:3488-92.
7. Hilgers KK, Matthew Akridge BA, Scheetz JP, Kinane DF. Childhood
Obesity and Dental Development. Pediatr Dent 2006;28:18-22.
8. Maria CM, Tais SB, Maria BD. Associations of Masticatory Performance with
Body and Dental Variables in Children. Pediatr Dent 2010;32:283-88.

Bibliography
56
9. Hilgers KK, Kinane DF, Scheetz JP. Association between Childhood Obesity
and Smooth Surface Caries in Posterior Teeth: A Preliminary Study. Pediatr
Dent 2006;28:23-8.
10. Matthiessen J, Fagt S, Biltoft-Jensen A, Beck AM, Ovensen L. Size makes a
difference. Public Health Nutr 2003;6:65-72.
11. Rampersaud GC, Bailey LB, Kauwell GP. National survey beverage
consumption data for children and adolescents indicate the need to encourage
shift toward more nutritive beverages. J AM Diet Assoc 2003;103:97-100.
12. French SA, Lin BH, Githrie JF. National trends in soft drink consumption
among children and adolescents 6 to 17 years: Prevalence, amounts and sources,
1977/1987 to 1994/1998. J Am Diet Assoc 2003;103:1326-1331.
13. Dennison B. Fruit juice consumption by infants and children: A review. J Am
Coll Nutr 1996;15(suppl):4S-11S.
14. American Academy of Pediatrics. Prevention of pediatric overweight and
obesity. Pediatrics 2003;112:424-430.
15. Birch LL, Davison K. Family environmental factors influencing the developing
behavioural controls of food intake and childhood overweight. Pediatr Clin
North Am 2001;48:893-907.
16. Dietz WH. The obesity epidemic in young children. Reduce television viewing
and promote playing. Br Med J 2001;322:313-14.
17. Davies PSW, Coward WA, Gregory J, White A, Millis A. Total energy
expenditure and energy intake in the pre-school child: A comparision. Br J Nutr
1994;72:13-20.
18. Shigeyuki Hamada. Role of sweeteners in the etiology and prevention of dental
caries. Pure Appl Chem 2002;74:1293-1300.

Bibliography
57
19. Willershausen B, Haas G, Krummenauer F, Hohenfellner K. Relationship
between High Weight and Caries Frequency in German Elementary School
Children. Eur J Med Res 2004;9:400-404.
20. Patricia Vasconcelos LM, Rosenblatt A, Ribeiro Severo AM. Prevalence of
dental caries in obese and normal- weight Brazilian adolescents attending state
and private schools. Community Dental Health 2006;23:251-53.
21. Macek MD, Mitola DJ. Exploring the Association between Overweight and
Dental Caries among Us Children. Pediatr Dent 2006;28:375-380.
22. Willershausen B, Moschos D, Azrak B, Blenttner M. Correlation between
oral health and body mass index (BMI) in 2071 primary school pupils. Eur J
Med Res 2007;12:295-99.
23. Marshall TA, Eichenberger-Gilmore JM, Broffitt BA, Warren JJ, Levy
SM. Dental caries and childhood obesity: roles of diet and socioeconomic status.
Community Dent Oral Epidemiol 2007;35:449-458.
24. Isabelle Bailleul-Forestier, Lopes K, Souames M, Azoguy-Levy S, Frelut
ML, Lefevre ML. Caries experience in a severely obese adolescent population.
Int J Pediatr Dent 2007;17:358-363.
25. Pinto A, Kim S, Wadenya R, Rosenberg H. Is there an association between
weight and dental caries among pediatric patients in an urban dental school? A
correlation study. J Dent Educ 2007:71:1435-1440.
26. Mostafa Sadeghi, Farnosh Alizedeh. Association between Dental Caries and
Body Mass Index-for-Age among 6-11 Year Old Children in Isfahan in 2007.
JODDD;1:119-124.
27. Hong L, Ahmed A, McCunniff M, Overman P, Mathew M. Obesity and
Dental Caries in Children Aged 2-6 years in the United States: National Health

Bibliography
58
and Nutrition Examination Survey 1999-2002. J Public Health Dent
2008;68:227-233.
28. Ana F. GG, Menezes VA, Lira PI, Ferreira JM Cavalcanti AL. Obesity and
Dental Caries among Preschool Children in Brazil. Rev Salud Publica
2008;10:788-795.
29. Alm A, Fahraeus C, Wendt LK, Koch G, Gare BA, Birkhed D. Body
adiposity status in teenagers and snacking habits in early childhood in relation to
approximal caires at 15 years of age. Int J Pediatr Dent 2008; 18:189-196.
30. Gerdwin EW, Angbratt M, Aronsson K, Eriksson E, Johansson I. Dental
caries and body mass index by socio-econimic status in Swedish children.
Community Dent Oral Epidemiol 2008;36:459-465.
31. Freire MCM, Sheiham A, Netuveli G. Relationship between Height and
Dental Caries in Adolescents. Caries Res 2008;42:134-140.
32. Sheller B, Churchill SS, Williams BJ, Davidson B. Body Mass Index of
Children with Severe Early Childhood Caries. Pediatr Dent 2009;31:216-221.
33. Sharma A, Hegde AM. Relationship between Body Mass Index, Caries
Experience and Dietary Preferences in Children. J Clin Pediatr Dent
2009;34:49-52.
34. Tripathi S, Kiran K, Kamala BK. Relationship between obesity and dental
caries in children- A preliminary study. J Int Oral Health 2010;2:65-72.
35. Kelishadi R, Mortazavi S, Hossein TR, Poursafe P. Association of
cardiometabolic risk factors and dental caries in a population based sample of
youths. Diabetology & Metabolic Syndrome 2010;2:1-5.
36. Tambelini CA, Ramos DM, Frederico RC, Tomasetti CS, Maciel SM. Dental
caries in adolescents and its association with excess weight and

Bibliography
59
sociodemographic factors in Londrina, Parana, Brazil. Rev Odonto Cienc
2010;25:245-49.
37. Gokhale N, Sivakumar N, Nirmala SVSG, Abinash M. Dental Caries and
Body Mass Index in Children of Nellore. J Orofac Sci 2010;2:4-6.
38. Giselle D’Mello, Chia L, Hamilton SD, Thomson WM, Drummon BK.
Childhood obesity and dental caries among paediatric dental clinic attenders. Int
J Pediatr Dent 2011;21:217-222.
39. Davies PSW. Diet composition and body mass index in pre-school children. Eur
J Clin Nutr 1997;51:443-48.
40. Atkin LM, Davies PSW. Diet composition and body composition in preschool
children. Am J Clin Nutr 2000;72:15-21.
41. Brien GO, Davies M. nutrition knowledge and body mass index. Health Educ
Res 2006;22:571-75.
42. LaRowe TL, Moeller SM, Adams AK. Beverage patterns, Diet quality and
body mass index of US preschool and school aged children. J Am Diet Assc
2007;107:1124-1133.
43. Heuberger R, Boyle IO. Beverage Consumption and its Association with BMI
and Lifestyle factors in Rural Community Participants. Californian J Health
Prom 2009;7:62-74.
44. Collison KS, Subani SN, Rubeaan KA, Shoukri M, Mohanna FA. Sugar
sweetened carbonated beverage consumption correlates with BMI, waist
circumference and poor dietary choices in school children. BMC Public Health
2010;10:1-13.

Bibliography
60
45. Centers for Disease Control and Prevention. Growth charts body mass index
for age percentiles, boys and girls. Avaliable at
htpp://www.cdc.gov/bmi/bmimeans.htm. Accessed July 13 2005.
46. World health organization. Oral health survey, basic methods. 4th
Ed Geneva:
World Health Organization; 1997.
47. U.S. Department of Agriculture. Human Nutrition Information Service. 1992.
The Food Guide Pyramid. Home and Garden Bull. No. 252, 32 pp.
48. Per.Axelson. Diagnosis and risk prediction of dental caries. Vol II quintessence
publishing co.inc, Sweden; pg 71, 2002.
49. Burke BS. The dietary history as a tool in research. J. Am. Diet. Assoc. 1947.23,
1041–1046.
50. World Health Organization. Preventing chronic diseases: A vital investment.
World Global Report. Geneva: World Health Organization; 2005.
51. Kolagotla L, Adams W. Ambulatory management of childhood obesity. Obes
Res 2004;12:275-83.
52. Braithwaite AS, Vann WF Jr, Switzer BR. Nutritional counselling practices;
how do North Carolina pediatric dentists weigh in? Pediatr Dent 2008;30:488-
95.
53. Perrin EM, Flower KB, Garrett J. Preventing and treating obesity.
Pediatrician’s self-effeciency, barriers resources and advocacy. Ambul Pediatr
2005;5:150-56.
54. Jelalian E, Boergers J, Alday CS. Survey of physician’s attitudes and practices
related to pediatric obesity. Clin Pediatr 2003;42:235-45.

Bibliography
61
55. Tseng R, Vann WF, Perrin EM. Addressing Childhood Overweight and
Obesity in the Dental Office: Rationale and Practical Guidelines. Pediatr Dent
2010;32:417-23.
56. Cabana MD, Ebel BE, Cooper-Patrick L. Barriers pediatricians face when
using asthma practice guidelines. Arch Pediatr Adolesc Med 2000;154:685-93.
57. Krasse B. The Vipeholm Dental Caries Study: recollections and reflections 50
years later. J Dent Res 2001;80:1785-88.
58. Moynihan P. The interrelationship between diet and oral health. Proc Nutr Soc
2005;64:571-80.
59. Ramachandran A, Snehalatha C, Vinitha R et al. Prevalence of overweight in
urban Indian adolescent school children. Diabetes Res Clin Pract 2002;57:185-
190.
60. Kumar S, Mahabalaraju DK, Anuroopa MS. Prevalence of obesity and its
influencing factor among affluent school children of Davangere city. Indian J
Community Med 2007;32:15-17.
61. Kotian MS, Kumar SG, Kotian SS. Prevalence and determinants of
overweight and obesity among adolescent school children of South Karnataka,
India. Indian J Community Med 2010;35:176-78.
62. Lobstein T, Baur L, Uauy R. Obesity in children and young people: A crisis in
public health. Obesity reviews 2004;5:4–85.
63. Mahesh KP, Joseph T, Varma RB, Jayanthi M. Oral health status of 5 years
and 12 years school going children in Chennai city. An epidemiological survey.
J Indian Soc Pedod Prev Dent 2005;23:17-22.

Bibliography
62
64. Moses J, Rangeeth BN, Gurunathan D. Prevalence of dental caries,
socioeconomic status and treatment deeds among 5 to 15 year old school going
children of Chidambaram. J Clin & Diagn Res 2011;5:146-51.
65. Saravanan S, Kalyani V, Vijayarani MP et al. Caries prevalence and
treatment needs of rural school going children in Chidambaram Taluk,
TamilNadu, South India. Indian J Dent Res 2008; 19:186-90.
66. Rolland-Cachera MF. Prediction of adult body composition from infant and
child measurements. In: Davies PSW, Cole TJ, eds. Body composition
techniques in health and disease. Cambridge, United Kingdom: Cambridge
University Press, 1995:100-45.
67. Rolland-Cachers MF. Adiposity rebound and prediction of adult fatness. In:
Ulijaszek SJ, Johnston FE, Preece MA, eds. The Cambridge encyclopedia of
human growth and development. Cambridge, United Kingdom: Cambridge
University Press, 1998:51-3.
68. Vann WF, Bouwens TJ, Braithwaite AS, Lee JY. The Childhood Obesity
Epidemic: A Role for Pedatric Dentist? Pediatr Dent;27:271-76.

ANNEXURE-1
DATA RECORDING PROFORMA
Name: Date:
Age/ Gender:
Date of Birth:
School and Class:
Height (in metre):
Weight (in Kilogram):
Body mass index (BMI) = Weight (in kg) =
(Height in meter)2
BMI Category:
Underweight
Normal
Overweight
Obese
Dentition status (WHO criteria- 1997)
55 54 53 52 51 61 62 63 64 65
17 16 15 14 13 12 11 21 22 23 24 25 26 27
47 46 45 44 43 42 41 31 32 33 34 35 36 37
85 84 83 82 81 71 72 73 74 75
Primary dentition caries score (deft):
Permanent dentition caries score (DMFT):

ANNEXURE-2
CONSENT FORM (ENGLISH)
I, _________________, the parent/ guardian of _________________ hereby give
consent for the participation of my son/ daughter in the study. I have been informed clearly
about the procedure/ techniques of the study and I voluntarily, unconditionally, freely give
my consent for the active participation of my son/ daughter without any form of pressure in
mentally sound and conscious state.
SIGNATURE OF THE DOCTOR SIGNATURE OF THE CHILD’S
PARENT/ GUARDIAN

ANNEXURE-3
rpfpr;ir xg;Gjy; gbtk;
_____________________ Mfpa ehd; _________________vd;fpw
(ngw;Nwhhpd; ngah;) (Foe;ijapd; ngah;> taJ)
vd; Foe;ijapd; vil kw;Wk; cauj;jpid Fwpf;fTk;>
tha; / gy; gFjpia Muha;e;J ghu;f;fTk; xg;Gjy; mspf;fpNwd;.
NkYk;> ,e;j Muha;r;rpapid Nkw;nfhs;tjpdhy; tpisaf;$ba
ed;ikfisAk;> mjdhy; tpisaf;$ba mnrsfupaq;fisAk;
mwpag;ngw;wg;gpd;> ehd; vt;tpj mr;rKkpd;wp jd;dpr;irahf>
KOkdJld; vd;Dila rk;kjj;jpid mspf;fpNwd;.
ifnahg;gk; :
Njjp / ,lk; :
rhl;rpfs; :
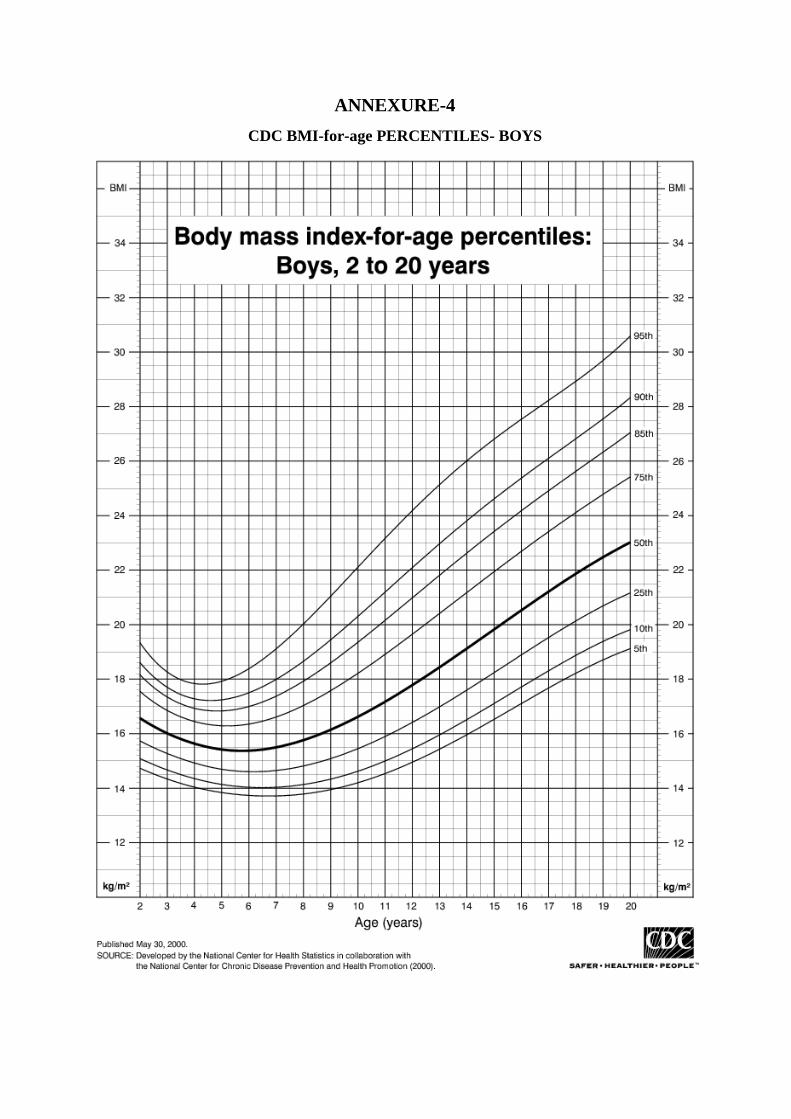
ANNEXURE-4
CDC BMI-for-age PERCENTILES- BOYS

ANNEXURE-5
CDC BMI-for-age PERCENTILES- GIRLS

ANNEXURE-6
DIET RECORDING SHEET-ENGLISH
FOOD GROUP
DAY-1
DAY-2
DAY-3
MEAN
Rice and cereal group
(rice, idly, dosai, Bun,
noodles, cornflakes etc)
Meat and poultry group
(fish, egg, chicken, beef,
mutton etc)
Dairy and dairy products
(milk, butter, ghee, cheese,
curd, butter milk)
Fat and oil group
(fried items, oily foods)
Vegetables and fruits
(carrot, beans, brinjal,
mango, banana, apple etc)
Snacks and Sweet items
(biscuits, chocolates,
beverages, chips etc)

ANNEXURE-7
DIET RECORDING SHEET-TAMIL
czT tif Kjy; ehs; ,uz;lhk;
ehs;
%d;whk;
ehs;
ruhrhp
njhif
muprp> NfhJik>
jhdpa tif czTg;
nghUl;fs;
(rg;ghj;jp>,l;yp>
nuhl;b>Njhir> gpnul;>
E}by;];> Nrhsk;> kw;Wk;
,ju czTfs;)
Gujrj;J epiwe;j
czTg; nghUl;fs;
(Nrhah> kPd;> ,iwr;rp>
Kl;il> mirtk; kw;Wk;
,ju czTfs;)
ghy; kw;Wk; ghy; rhh;e;j
czTg; nghUl;fs;
(ghy;> japh;> Nkhh;>
ntz;nza; kw;Wk;
,ju ghy; rhh;e;j
czTg; nghUl;fs;)
nfhOg;G kw;Wk;
vz;nza; tif
czTg; nghUl;fs;
(vz;nzapy;
nghwpf;fg;gl;l czTg;
nghUl;fs;)
fha;fwp kw;Wk; goq;fs;
(Nful;> gPd;];>
ntz;ilf;fha;>
fj;jhpf;fha;> khk;gok;>
thiog;gok;>
md;dhr;rpgok;> Mg;gps;
kw;Wk; ,ju fha; / go
tiffs;)
nehWf;F jPdpfs;
(gp];nfl;>
,dpg;Gfs;>KWf;F>
rhf;nyl;> rpg;];> Nff;>
kw;Wk; ,ju nehWf;F
jPdpfs;)