Embed Size (px)
Citation preview

Evaluation of the Receiver Function in earthquake and exploration seismologyBy Michael Veen
Intro• Aim: Develop high resolution layered Earth model using seismic data.
• Method: Utilize and compare various 3 Multi-component spectral ratio methods to reveal near surface layering
• Multicomponent receivers sense wave components in NS, EW, vertical directions
• Allows isolation of P and S wavefields
• Horizontal component contains S wave data provides info on elastic properties of subsurface
• Joint analysis of P and S data provides info on lithology, porosity, fracturing and anisotropy
Very attractive for oil and gas exploration
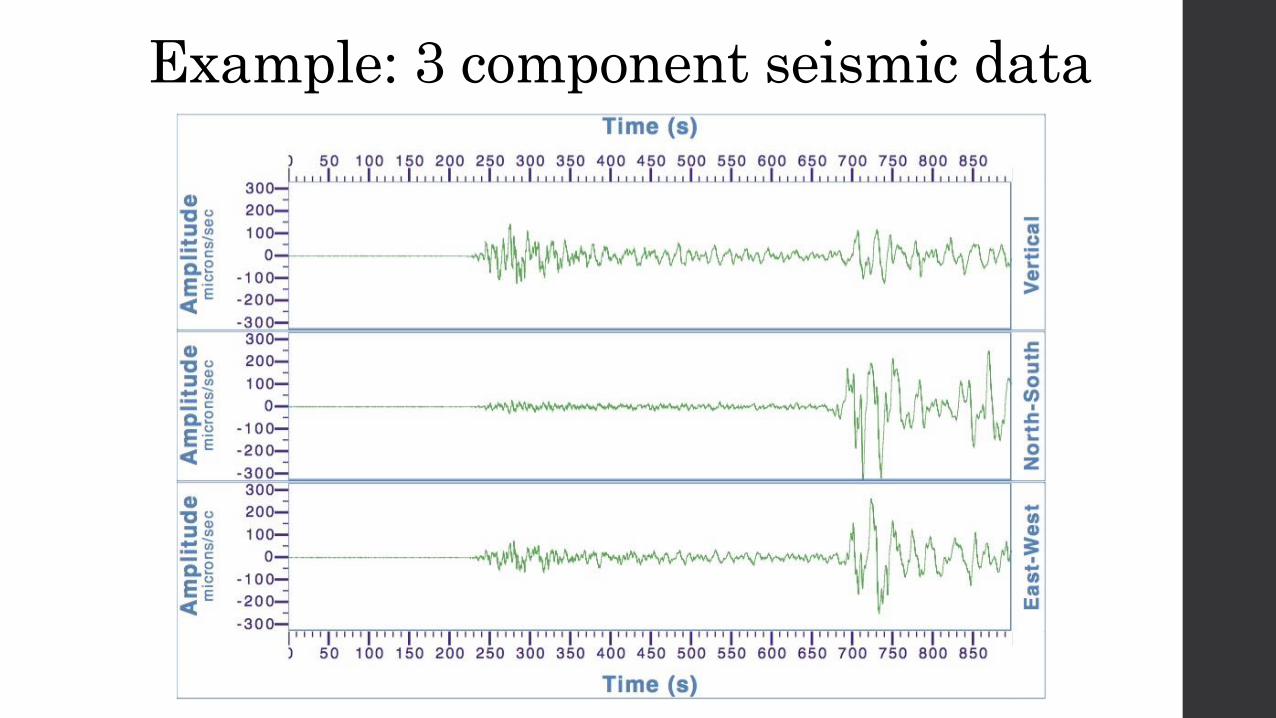
Example: 3 component seismic data
Techniques:• 1. Crustal transfer function (Phinney, 1964)
• 2. Periodicity analysis (Gir et al., 1978)
• 3. Receiver function (Langston, 1979)
Spectral ratio• Ratio of frequency components in signal. Eg. Horizontal(w) to vertical(w)
• Important in determining earth structure immediately beneath a recording station
• Requires P wave signal from distant earthquakes
• Fourier analysis to convert signal to frequency domain
Transfer function• Uses spectral ratio of horizontal over vertical components
• Develop theoretical curves expressing this transfer function ratio as a function of angular frequency.
• Vary parameters to obtain a theoretical curve that matches experimental result
• Provides representation of the velocity-density structure beneath the station
• Able to isolate effects of intermediate and deep crustal structure, by observing peaks and troughs in the plots.
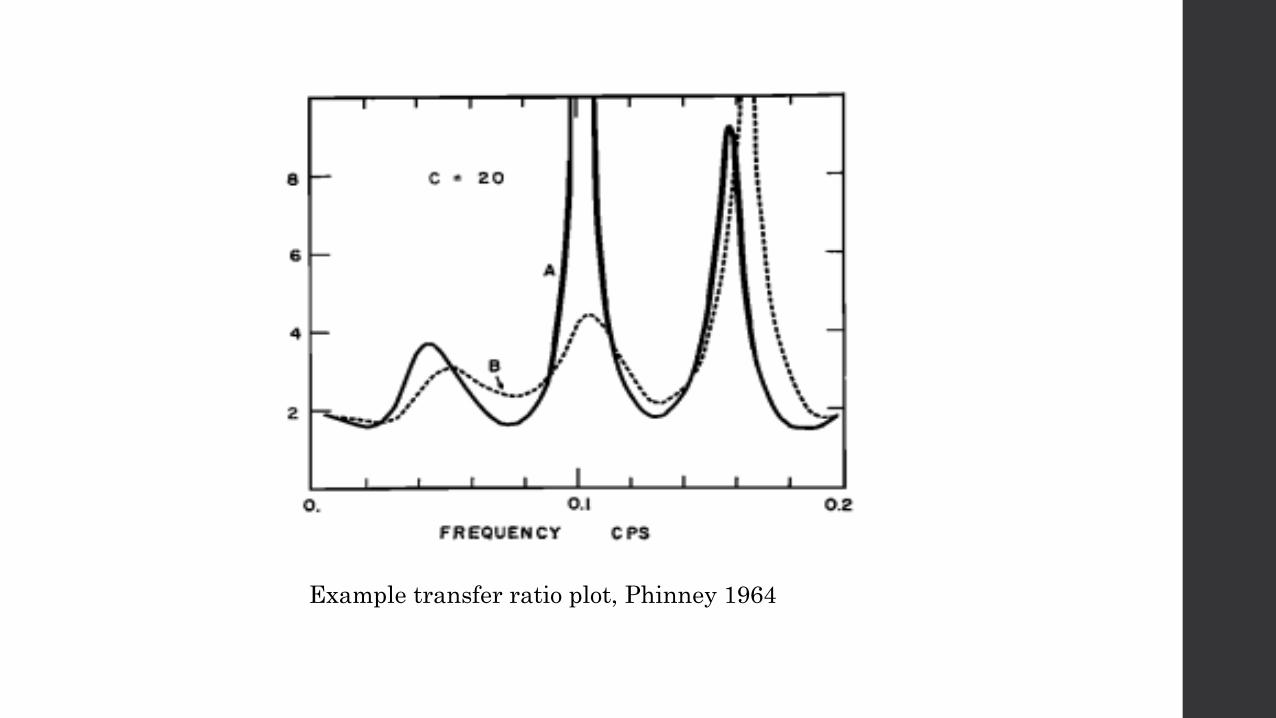
Example transfer ratio plot, Phinney 1964
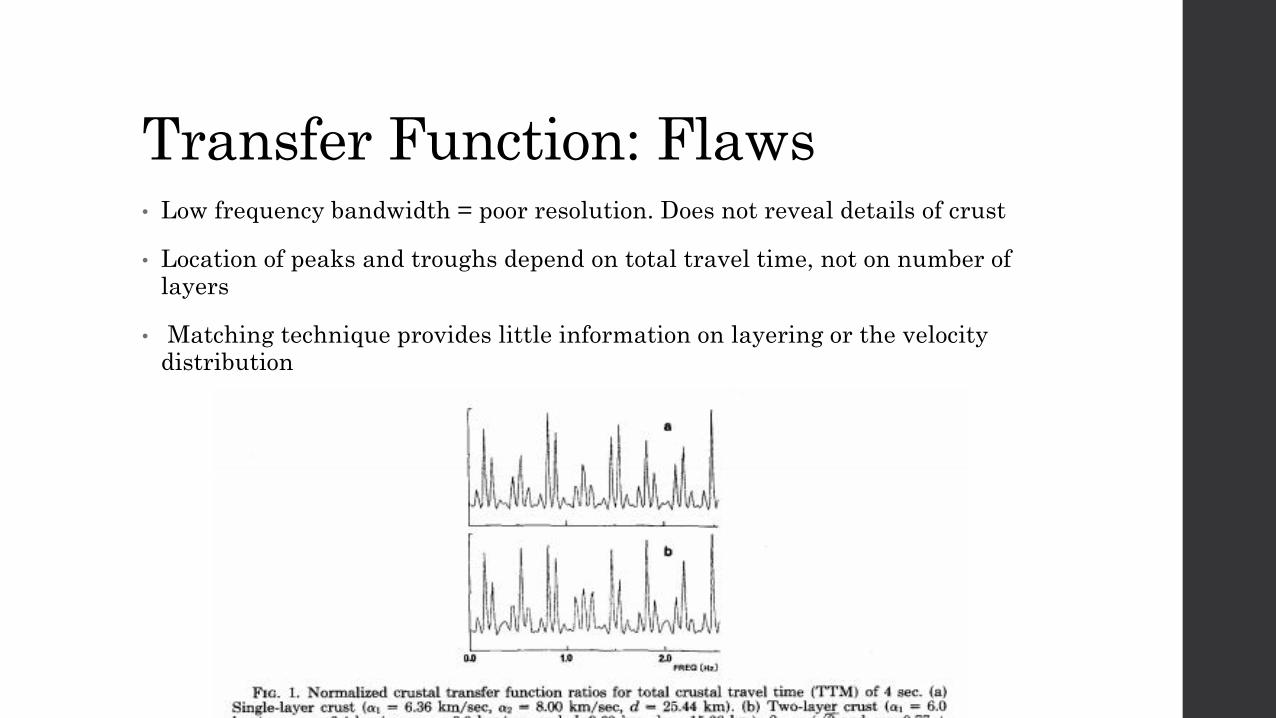
Transfer Function: Flaws• Low frequency bandwidth = poor resolution. Does not reveal details of crust
• Location of peaks and troughs depend on total travel time, not on number of layers
• Matching technique provides little information on layering or the velocity distribution
Periodicity analysis• Requires much shorter data length than the crustal transfer function
9 – 12 seconds compared to 40 seconds
• Uses technique called cepstral analysis on the spectral ratio
• Cepstral anaylsis: Representation of how energy in a waveform is distributed among its frequency components
• Periodic peaks occur in the spectrum
• These peaks are caused by echoes in the signal.
• Periodicity can be thought of as the frequency of these frequency peaks.
• Units: cycles/Hz = seconds
• This method of analysis separates zones of different periodicities within the crust
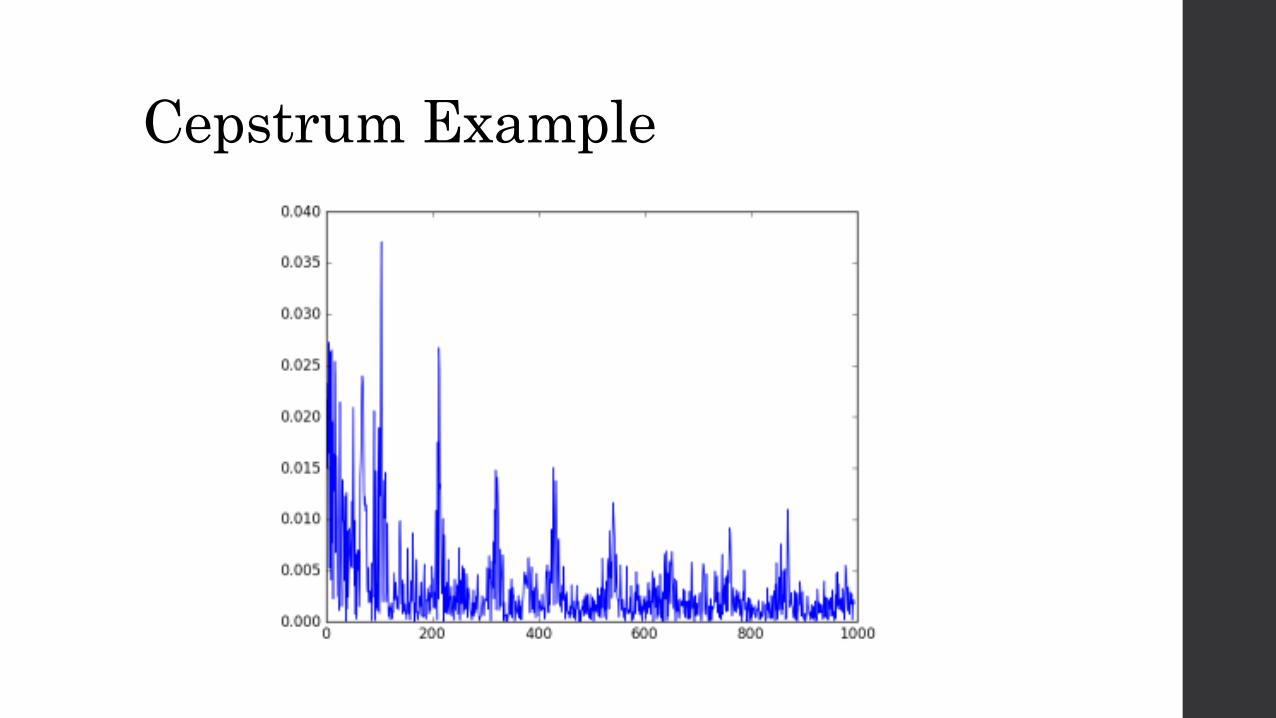
Cepstrum Example
Periodicity analysis (Gir et al., 1978)
• Provides total thickness of crust and locations of intermediate discontinuities
• Utilizes higher frequency content than CTM = finer detail model
Receiver Function• Best known method for determining earth structure below seismographic
station
• Used over the past 20 years
• Estimate crustal thickness and Vp/Vs ratio beneath station
• Map impedance contrasts in time domain
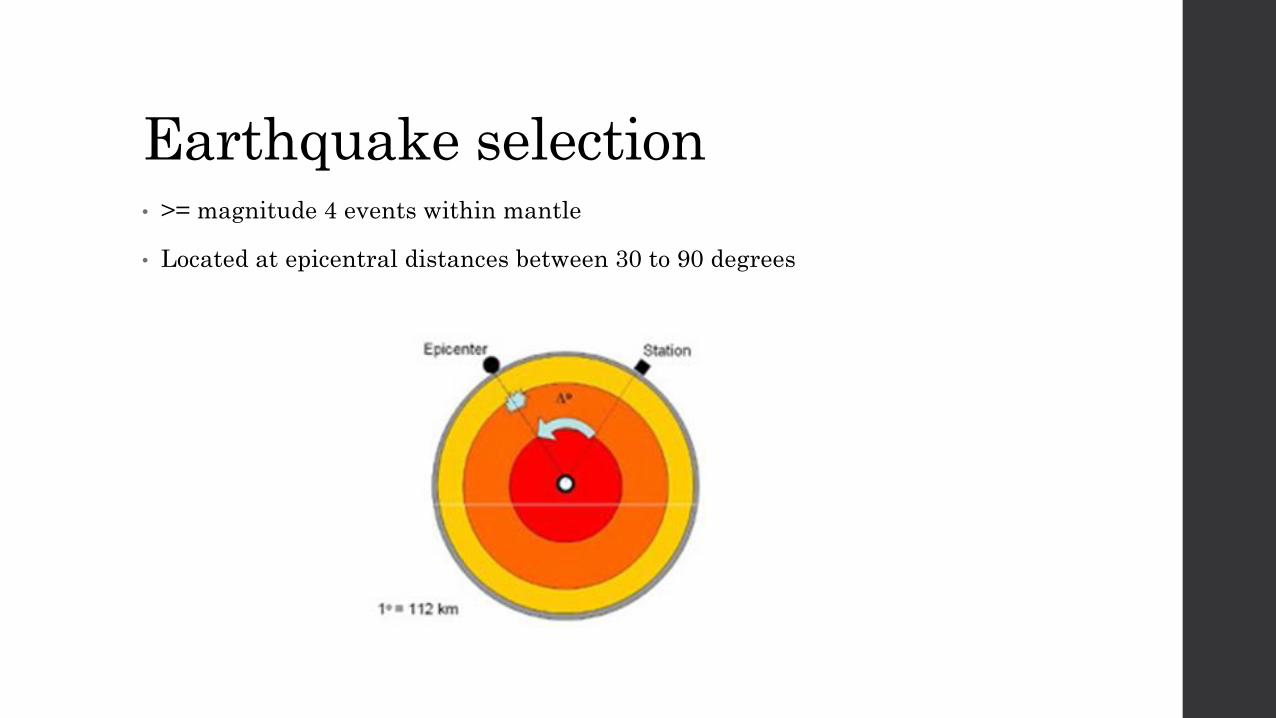
Earthquake selection• >= magnitude 4 events within mantle
• Located at epicentral distances between 30 to 90 degrees
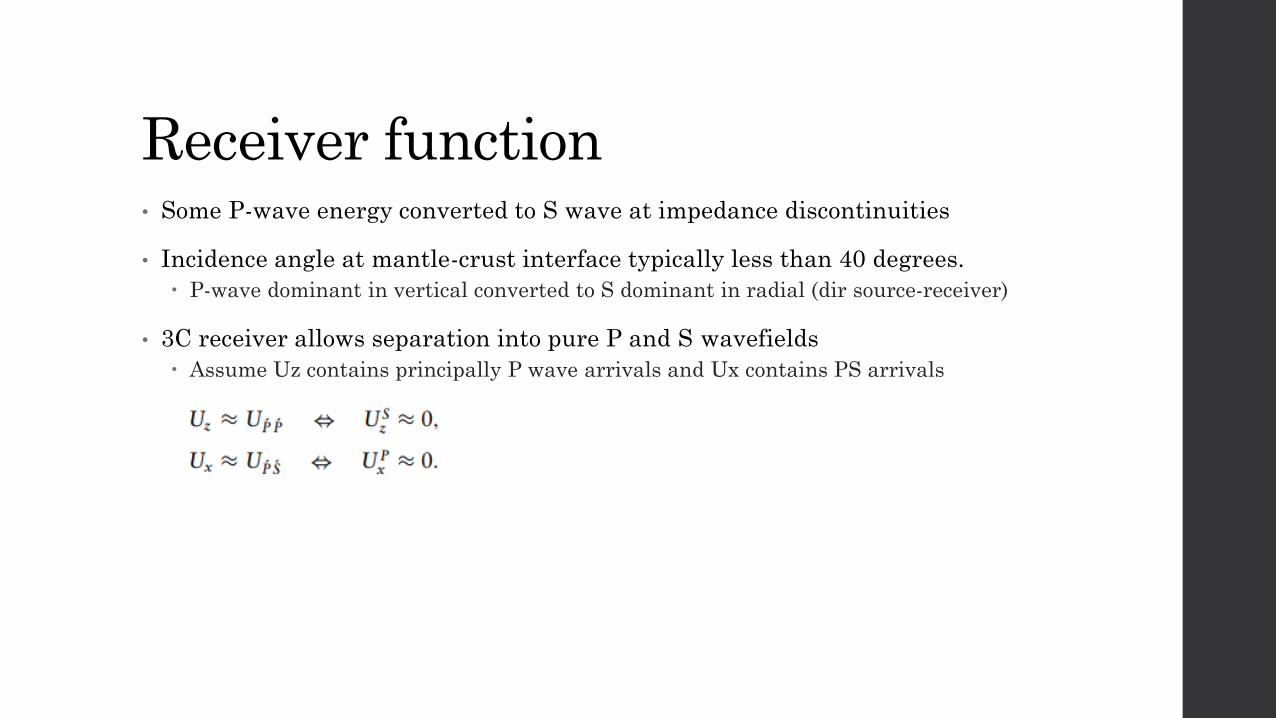
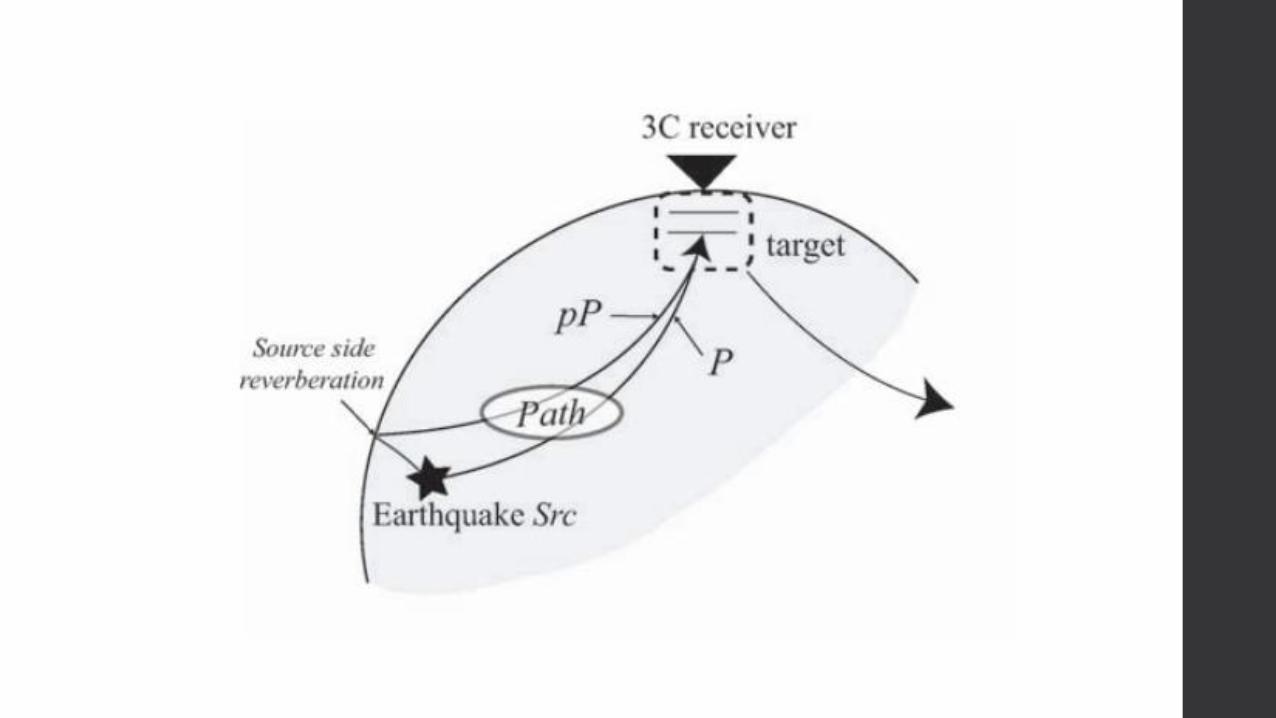
Receiver function• Some P-wave energy converted to S wave at impedance discontinuities
• Incidence angle at mantle-crust interface typically less than 40 degrees.
P-wave dominant in vertical converted to S dominant in radial (dir source-receiver)
• 3C receiver allows separation into pure P and S wavefields
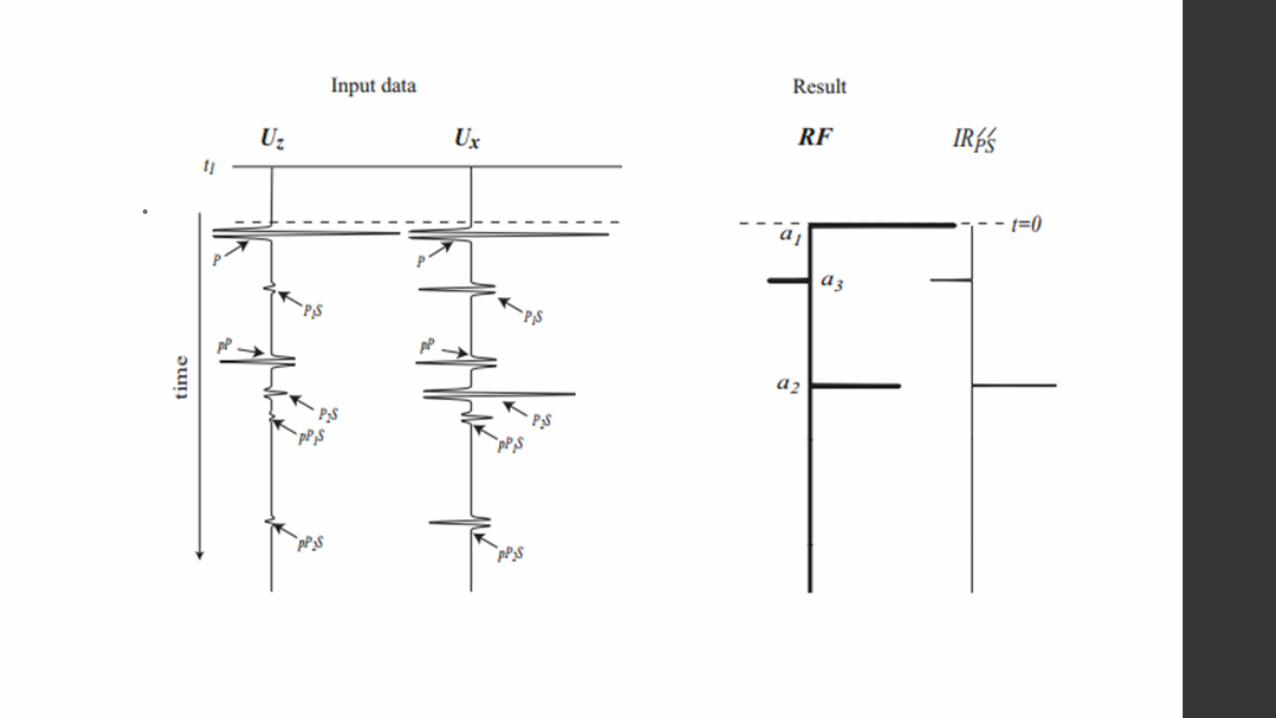
Assume Uz contains principally P wave arrivals and Ux contains PS arrivals
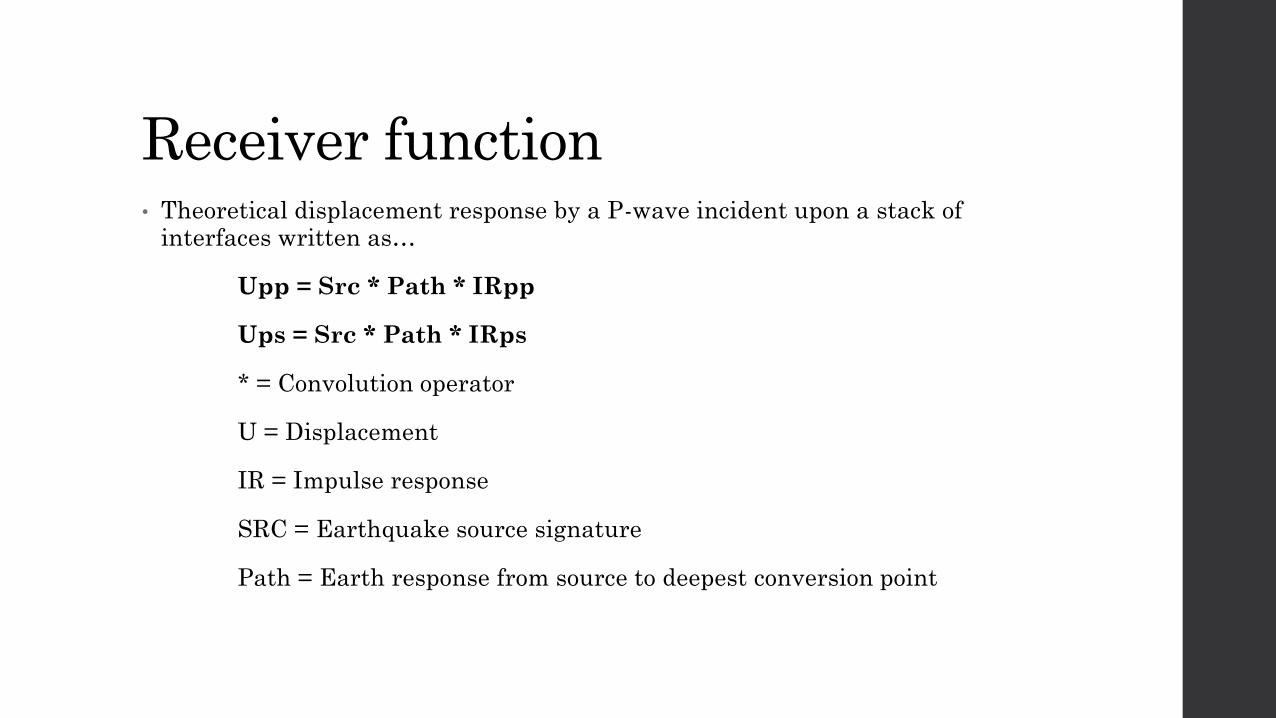
Receiver function• Theoretical displacement response by a P-wave incident upon a stack of
interfaces written as…
Upp = Src * Path * IRpp
Ups = Src * Path * IRps
* = Convolution operator
U = Displacement
IR = Impulse response
SRC = Earthquake source signature
Path = Earth response from source to deepest conversion point
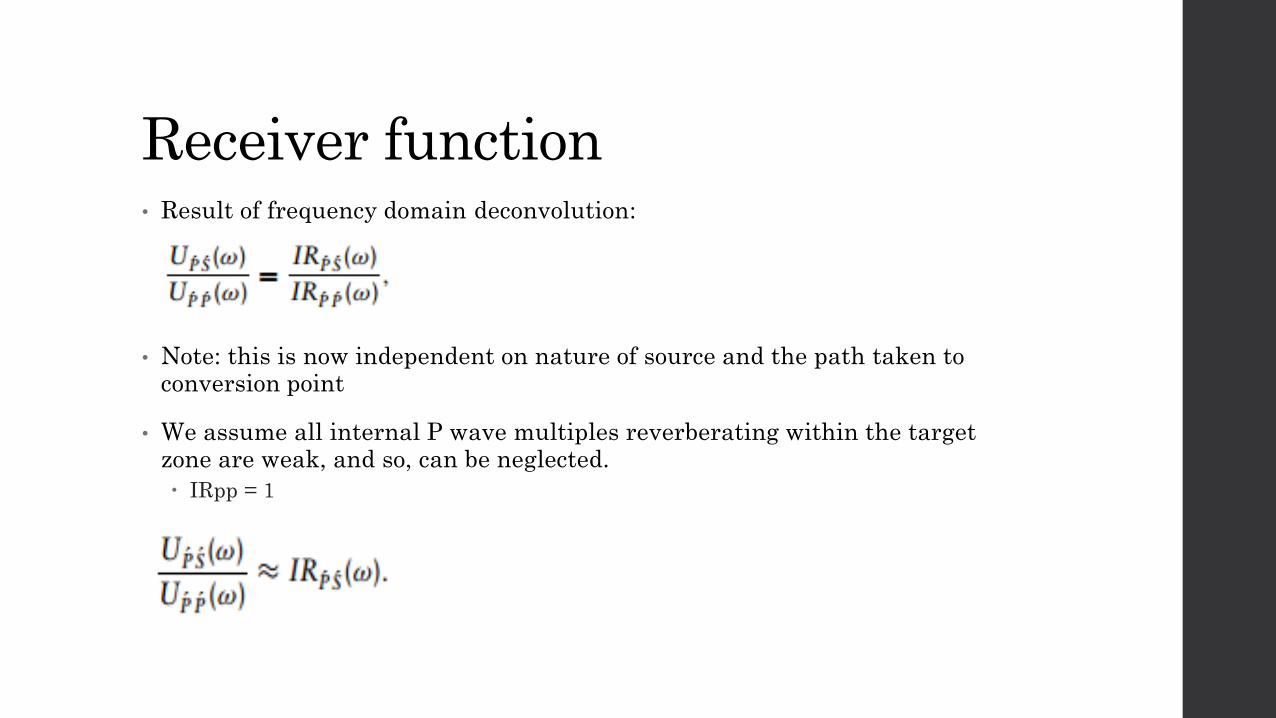
Receiver function• Result of frequency domain deconvolution:
• Note: this is now independent on nature of source and the path taken to conversion point
• We assume all internal P wave multiples reverberating within the target zone are weak, and so, can be neglected.
IRpp = 1
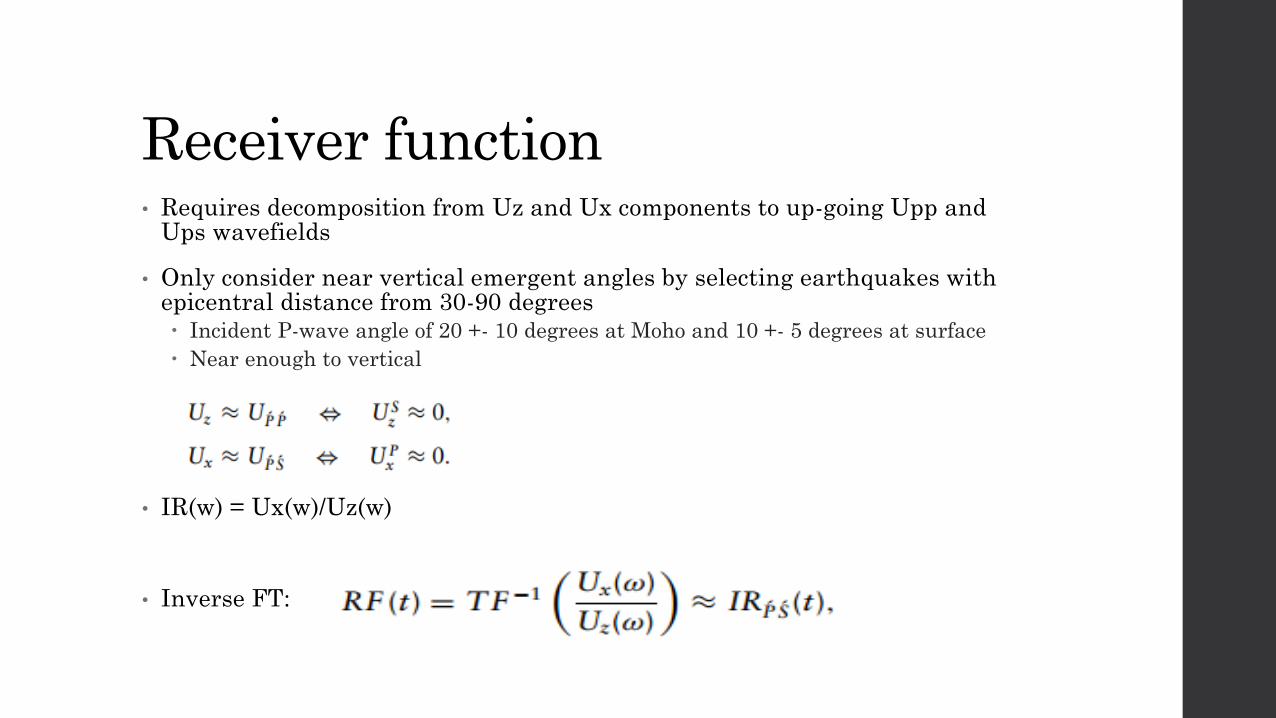
Receiver function• Requires decomposition from Uz and Ux components to up-going Upp and
Ups wavefields
• Only consider near vertical emergent angles by selecting earthquakes with epicentral distance from 30-90 degrees Incident P-wave angle of 20 +- 10 degrees at Moho and 10 +- 5 degrees at surface
Near enough to vertical
• IR(w) = Ux(w)/Uz(w)
• Inverse FT:
• Note that
Receiver function• Note that RF result is just an impulse/spike at the converted S wave
arrivals.
• Timing and amplitude of arrivals in RF are sensitive to the receiver side earth structure
• RF signals from different earthquakes originating from the same location are stacked to boost S/N, events are migrated to their correct location and inverted to recover elastic (Vp, Vs) properties of the target zone.