Embed Size (px)
Citation preview
11/29/2011
1
Liquefaction Hazard to Bridge Foundations
T. Leslie Youd, PhD
NAE, Dist Mem ASCE, Hon Mem EERI
Professor Emeritus, Civil Engineering
Brigham Young University
Provo, Utah, USA
Mechanism of LiquefactionSeismic waves propagating through soils generate shear deformations that collapse loose granular structures
Collapses of granular structures transfer stress from particle contacts to the interstitial pore water
When the pore pressure reaches a critical level, the previously solid granular soil transforms into a viscous liquid and liquefaction has occurred
Effective stressσ’ = σ - u
increasing pore water pressure and reducing effective stress
Statically stable void
Distortion causes void to collapse
Liquefaction: “the transformation of granular material from a solid state to a liquid state as a consequence of increased pore water pressure and reduced effective stress” (ASCE Committee on Soil Dynamics, 1978)
DefinitionEvaluation of Liquefaction Hazard
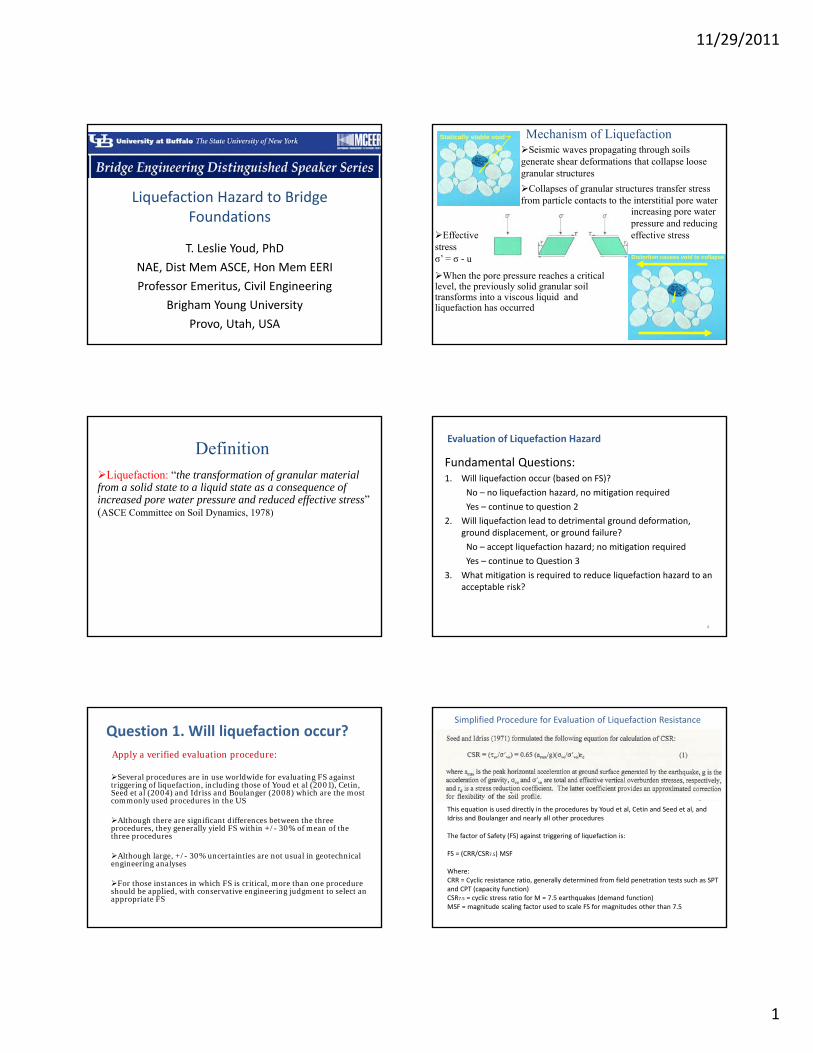
Fundamental Questions:1. Will liquefaction occur (based on FS)?
No – no liquefaction hazard, no mitigation required
Yes – continue to question 2
2. Will liquefaction lead to detrimental ground deformation, ground displacement, or ground failure?
No – accept liquefaction hazard; no mitigation required
Yes – continue to Question 3
3. What mitigation is required to reduce liquefaction hazard to an acceptable risk?
4
Question 1. Will liquefaction occur?
Apply a verified evaluation procedure:
Several procedures are in use worldwide for evaluating FS against triggering of liquefaction, including those of Youd et al (2001), Cetin, Seed et al (2004) and Idriss and Boulanger (2008) which are the most commonly used procedures in the US
Although there are significant differences between the three procedures, they generally yield FS within +/- 30% of mean of the three procedures
Although large, +/- 30% uncertainties are not usual in geotechnical engineering analyses
For those instances in which FS is critical, more than one procedure should be applied, with conservative engineering judgment to select an appropriate FS
This equation is used directly in the procedures by Youd et al, Cetin and Seed et al, and Idriss and Boulanger and nearly all other procedures
The factor of Safety (FS) against triggering of liquefaction is:
FS = (CRR/CSR7.5) MSF
Where:CRR = Cyclic resistance ratio, generally determined from field penetration tests such as SPT and CPT (capacity function) CSR7.5 = cyclic stress ratio for M = 7.5 earthquakes (demand function) MSF = magnitude scaling factor used to scale FS for magnitudes other than 7.5
Simplified Procedure for Evaluation of Liquefaction Resistance

11/29/2011
2
CRR plot from Youd et al (2001) used to evaluate CRR from SPT measuremets
Both Cetin and Seed (2004) and Idriss and Boulanger (2008) made significant modifications to this chart and also to the term rd in the CSR equation
Bridge sites in Arkansas for which comparisons were made between procedures of (1) Idriss and Boulanger; (2) Cetin, Seed et al; and (3) Youd et al. Site 1 is used for comparisons in this presentation (Cox and Griffiths 2011)
Comparisons between procedures
8
Comparison of the factor of safety (FS) against liquefaction at Site No.1 for three procedures; MW = 7.6, pga = 0.82 g (Cox and Griffiths 2011)
clay
sand
Arkansas Site 1 For depths less than 70 ft, mean of calculated FS calculated at any depth are generally within +/‐10% of the mean of individual values, with Idriss and Boulanger FS generally highest and Cetin, Seed et al FS generally lowest
9
dense sand
Depth to which CRR is constrained by empirical data
∆
FS > 2 plotted as 2
Water table
Comparison of factor of safety (FS) against liquefaction for Sapanca Hotel site, MW = 7.0, pga= 0.40 by three procedures (Shawn Griffiths, University of Arkansas)
Sapanca Hotel site, Turkey (1999 eq)
Mean of calculated FS within +/‐ 30% of individual values with Idriss and Boulanger FS generally highest and Cetin, Seed et al FS generally lowest
10
∆
Question 2. Will liquefaction lead to detrimental ground deformation, ground displacement, or ground failure?
Types of liquefaction‐induced ground failureFlow failureLaterals spreadGround oscillationLoss of bearing strengthGround settlement
Before earthquake
After earthquake
Liquefiable soil
11/29/2011
3
Flow failure, Half Moon Bay, Calif., 1906 San Francisco Earthquake
Before earthquake
After earthquake
Aerial View of San Fernando Valley Juvenile Hall Lateral Spread area after 1971 San Fernando, California earthquake; ground slope across lateral spread zone about 1%
caption
Fissures and ground displacements (up to 2 m) generated by Juvenile Hall Lateral Spread
San Fernando Valley Juvenile Hall Damaged by Lateral SpreadDuring 1971 San Fernando, Calif. Earthquake caption
Ground beneath standing part of building moved 1 m toward camera relative to stable ground beyond left end of building
11/29/2011
4
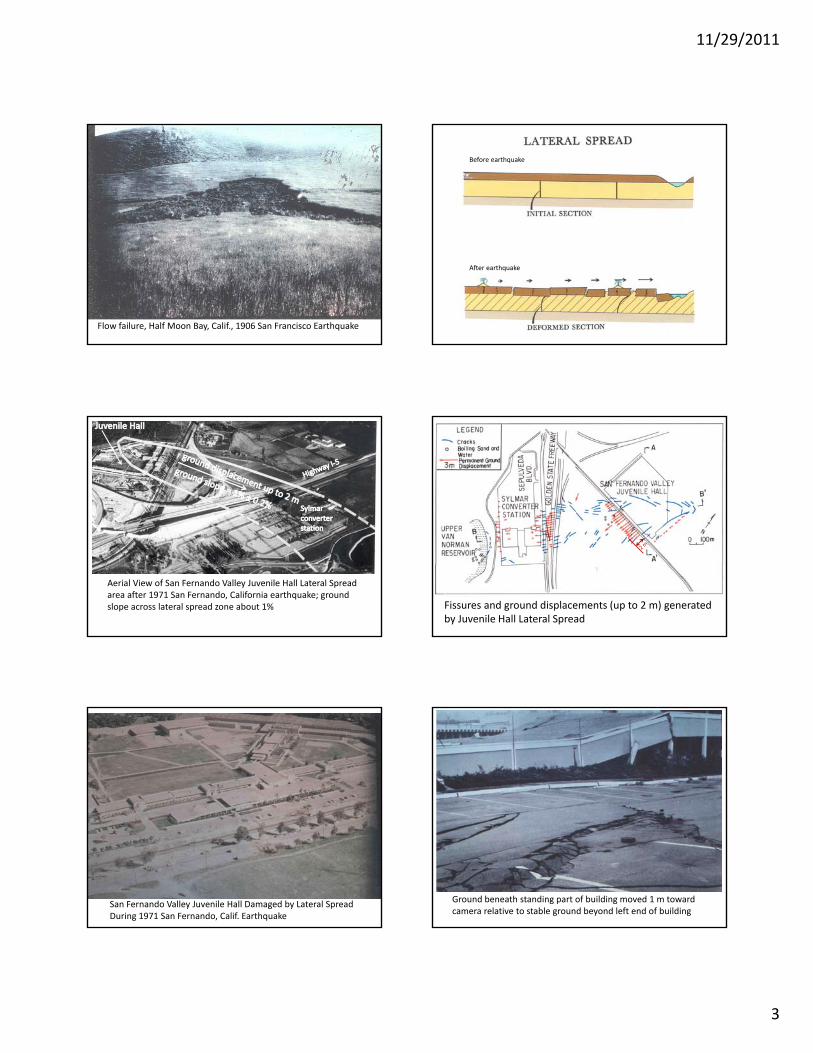
Interior view of building pulled apart by lateral spread, San Fernando Valley Juvenile Hall
Diagrammatic view of building damage caused by San Fernando Valley Juvenile Hall lateral spread
Wall around San Fernando Valley Juvenile Hall pulled apart by lateral spread during 1971 earthquake; about 50 juveniles escaped through hole shortly after earthquake
caption
Craters and flooding due to gas and water pipeline breaks, San Fernando Juvenile Hall lateral spread
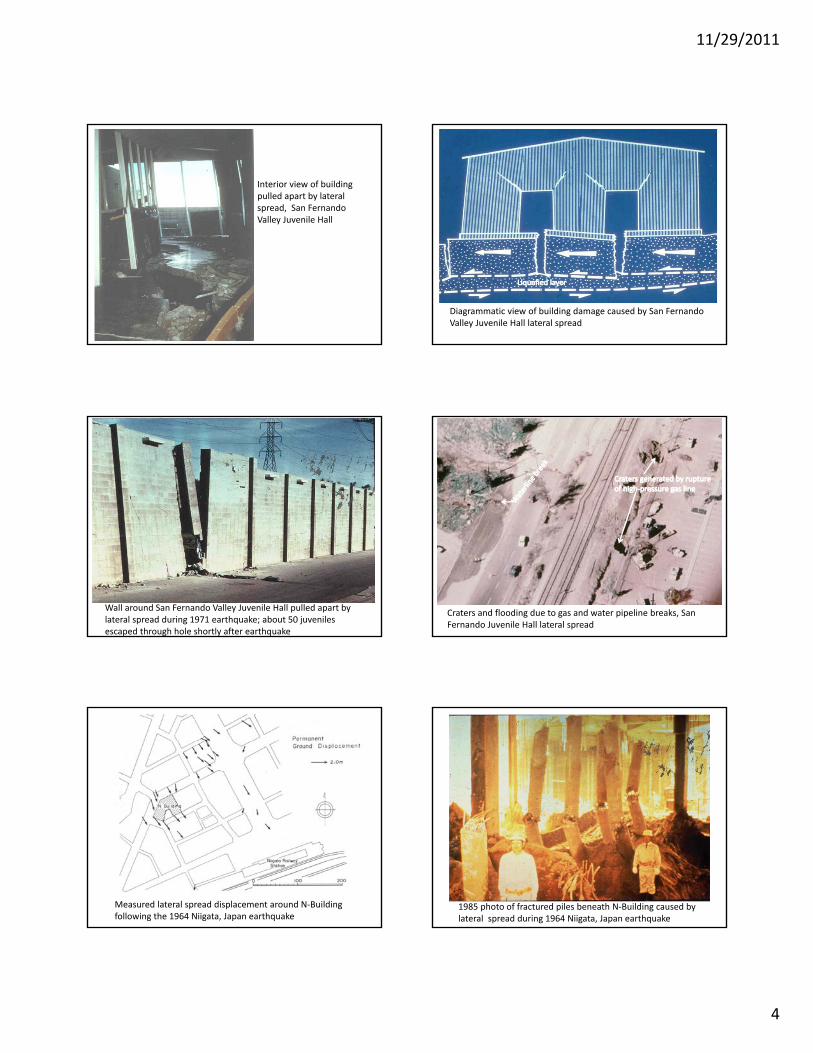
Measured lateral spread displacement around N‐Building following the 1964 Niigata, Japan earthquake caption
1985 photo of fractured piles beneath N‐Building caused by lateral spread during 1964 Niigata, Japan earthquake

11/29/2011
5
Diagrams of (a) post earthquake pile configuration at N-building site and (b) plot of standard penetration resistance, N, versus depth
water table
Soil too dense for lateral spread to occur
Liquefiable soil
Tall building supported on piles pulled apart at foundation level by lateral spread toward nearby island edge; building is located on, Rokko Island; damage occurred during 1995 Kobe, Japan earthquake (photo by Les Harder)
CaptionVectors of Lateral Spread Displacement, 1964 Niigata, Japan Earthquake caption
Bandai bridge pier displaced toward Shinano River during 1964 Niigata, Japan earthquake (M = 7.5); bridge deck acted as buttress causing the bridge pier to tilt away from the river rather than toward it
Rio Bananitio railway bridge that tipped downstream during the 1991 Limon Province, Costa Rica earthquake (M = 7.6)
Lateral spread tilted the caisson toward river with capital block sliding off, allowing bridge truss to tip; note that in this instance the truss did restrain the tops of the caissons allowing them to tip freely toward the river

11/29/2011
6
Before earthquake
After earthquake
captionPavement and curb damage caused by ground oscillation during 1989Loma Prieta, California earthquake
Before earthquake
After earthquake
Apartment buildings that settled and tipped during 1964 Niigata, Japan earthquake
Ground Settlement
0.75 m of differential ground settlement between top of pile cap and surrounding ground due to liquefaction and compaction of 12 m of loose artificial fill during 1995 Kobe, Japan earthquake (M = 7.6)
Prediction of Lateral Spread Displacement
Empirical MLR EquationsYoud, Hanson and Bartlett, 2002
Widely used for prediction of lateral spread displacement
Based on case history data from several U.S. and Japanese earthquakes
Data complied from about 500 lateral spread locations
Equations regressed using multiple linear regression (MLR) procedure
11/29/2011
7
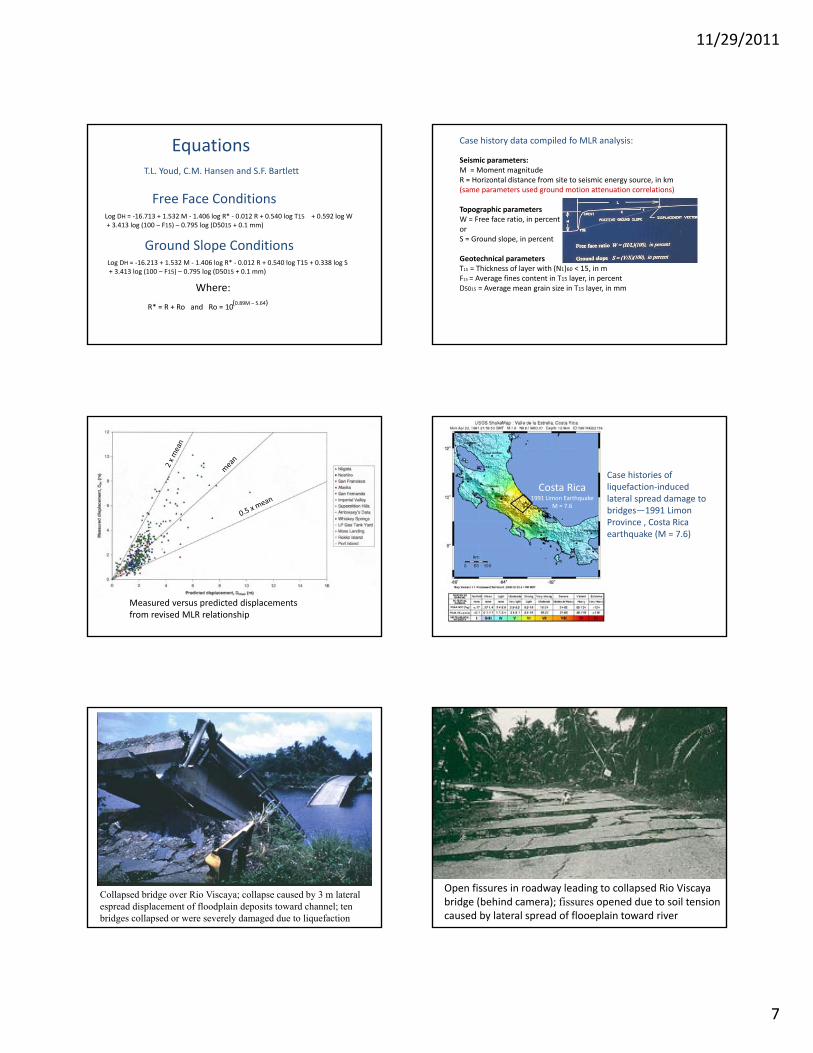
EquationsT.L. Youd, C.M. Hansen and S.F. Bartlett
Free Face ConditionsLog DH = ‐16.713 + 1.532 M ‐ 1.406 log R* ‐ 0.012 R + 0.540 log T15 + 0.592 log W+ 3.413 log (100 – F15) – 0.795 log (D5015 + 0.1 mm)
Ground Slope ConditionsLog DH = ‐16.213 + 1.532 M ‐ 1.406 log R* ‐ 0.012 R + 0.540 log T15 + 0.338 log S+ 3.413 log (100 – F15) – 0.795 log (D5015 + 0.1 mm)
Where:
R* = R + Ro and Ro = 10(0.89M – 5.64)
Case history data compiled fo MLR analysis:
Seismic parameters:M = Moment magnitudeR = Horizontal distance from site to seismic energy source, in km(same parameters used ground motion attenuation correlations)
Topographic parametersW = Free face ratio, in percentorS = Ground slope, in percent
Geotechnical parametersT15 = Thickness of layer with (N1)60 < 15, in mF15 = Average fines content in T15 layer, in percentD5015 = Average mean grain size in T15 layer, in mm
Measured versus predicted displacements from revised MLR relationship
Costa Rica1991 Limon Earthquake
M = 7.6
Case histories of liquefaction‐induced lateral spread damage to bridges—1991 Limon Province , Costa Rica earthquake (M = 7.6)
Collapsed bridge over Rio Viscaya; collapse caused by 3 m lateral espread displacement of floodplain deposits toward channel; ten bridges collapsed or were severely damaged due to liquefaction
Open fissures in roadway leading to collapsed Rio Viscayabridge (behind camera); fissures opened due to soil tension caused by lateral spread of flooeplain toward river

11/29/2011
8
Location map (courtesy of Google Earth ™ 2011)with locations of damaged bridges analyzed by Kevin Franke (BYU PhD dissertation) and bridges discussed herein
Highway bridge over Rio Cuba compressed by lateral spread of floodplain toward river channel
Rotated eastern abutment
View of Eastern abutment and bridge girders Eastern abutment bridge over Rio Cuba
Displaced and Rotatedabutment
Pushed abutment contacted girder, preventing further displacement of top of abutment
Sheared bridge seating due to compression of ground between abutments
East abutment
Bridge Plan, Rio Cuba crossing
Lateral spread displacement

11/29/2011
9
According to bridge plans provided by the Costa Rican Ministry of Transportation, bridge is founded on a series of 14‐inch square reinforced concrete piles. The abutments are supported by two rows of piles (8 piles in front row, 7 piles in second row) that are approximately 14 meters long and spaced at 4.1 diameters in the transverse direction and 2.5 diameters in the longitudinal direction. The dimensions of the pile cap at each abutment is 10.36 meters (transverse) x 1.90 meters (longitudinal) x 2.60 meters (vertical). (Kevin Franke, PhD dissertation, BYU)
Foundation Description
Log of Boring P1 at Rio Cuba Bridge, drilled April 2010 (courtesy of Kevin Franke)
Liquefiable layer, 2.5 m thick (T15)
Soil data and liquefaction FS calculation for Borehole P1, Rio Cuba Bridge (courtesy Kevin Franke)
2.5 m
Cross section East abutment area Rio Cuba bridge
= FS against rotational slide
Lateral Spread Displacement Calculation—Rio Cuba Bridge
Project:Borehole: H (m) L (m)Date: 11/1/2011 10 60
W (%) = 16.6666667Horizontal Displacement CalculationDoes the site contain a free face (f) or a ground slope (g)? f
Mw R (km) W (%) T15 (m) F15 (%) D5015 (mm)
7.6 41 12 2.5 12 1.1 R0 R*
Displacement: 0.27 m 13.30 54.30
Initials DateCompleted By: TLYChecked By:
Revised MLR Equations for Prediction of Lateral Spread DisplacementT.L. Youd, C.M. Hansen, and S.F. Bartlett
R* Calculation
W Calculation**Rio CubaP1
Ground Slope Equation:Log Dh = -16.213 + 1.532 M - 1.406 Log R* - 0.012 R + 0.338 Log S + 0.540 Log T15 + 3.413 Log (100 - F15) - 0.795 Log (D5015 + 0.1 mm)
Free Face Equation:Log Dh = -16.713 + 1.532 M - 1.406 Log R* - 0.012 R + 0.592 Log W + 0.540 Log T15 + 3.413 Log (100 - F15) - 0.795 Log (D5015 + 0.1 mm)
Dh = Horizontal Displacement, (meters)M = Moment Magnitude of Earthquake, MwR = Horizontal Distance to Nearest Seismic Energy Source or Fault Rupture, (kilometers)R* = R + R0R0 = 10(0.89 M -5.64)
W = (H/L)*100 = Free Face Ratio, (percent)H = Height of the Free Face, (meters)L = Length to the Free Face from the Point of Displacement (meters)S = Ground Slope, (percent)T15 = Thickness of Saturated Cohesionless Soils with (N1)60 <= 15, (meters)F15 = Average Fines Content in T15, (particle size <0.075 millimeters, in percent)D5015 = Average D50 in T15, (millimeters)
Distribution of lateral spread shear deformation through soil profile (courtesy Kevin Franke)

11/29/2011
10
Deterministically computed pile response for east abutment, Rio Cuba Bridge (courtesy Kevin Franke)
Pinned by bridge girder
Collapsed Rio Estrella Bridge
Western truss
Collapsed Estrella bridge with improvised temporary ramp
Western truss
Eastern truss
Central pier of collapsed Rio Estrella highway bridge
Shattered and spread highway embankment approaching eastern end of Rio Estrellabridge
Eastern truss
Cracked and settled highway embankment at eastern abutment of collapsed Rio Estrella highway bridge (University of Costa Rica photo)

11/29/2011
11
Eastern abutment of Rio Estrella highway bridge
1991 Limon Costa Rica: Plans for highway bridge over Rio Estrella
Eastern abutmentWestern abutment
Note: liquefaction and lateral spread did not generate significant displacement of bridge piers or abutments at Rio Estrella bridge
WEST
WEST
WEST & EAST
EAST
The eastern bent is founded on two 3.94‐meter x 4.94‐meter pile caps. Each pile cap is supported by twenty 12BP53 steel piles (four rows of five piles) that are 20 meters in length and spaced at 1 meter intervals in both the transverse and longitudinal directions. The eastern abutment of the bridge was designed to be converted into a bent in the event of a bridge expansion. The abutment is founded on two 3.96‐meter x 5.96 meter pile caps. Each of these pile caps is supported by 24 12BP53 steel piles (four rows of six piles) that are 20 meters in length and spaced at 1 meter intervals in both the transverse and longitudinal directions. Finally, the front row of piles at each abutment and bent are battered at approximately 5V:1H.(Franke, BYU PhD dissertation)
Foundation Data for Eastern Bent and Abutment
Bridge Eastern abutment
Borehole Logs, Rio Estraela Bridge
Liquefiable sediment

11/29/2011
12
Borehole P1
4.0 m
Project:Borehole: H (m) L (m)Date: 11/1/2011 10 60
W (%) = 16.6666667Horizontal Displacement CalculationDoes the site contain a free face (f) or a ground slope (g)? f
Mw R (km) W (%) T15 (m) F15 (%) D5015 (mm)
7.6 21 20 4.0 3 3 R0 R*
Displacement: 1.01 m 13.30 34.30
Initials DateCompleted By: TLYChecked By:
Revised MLR Equations for Prediction of Lateral Spread DisplacementT.L. Youd, C.M. Hansen, and S.F. Bartlett
R* Calculation
W Calculation**Rio EstrellaP1
Ground Slope Equation:Log Dh = -16.213 + 1.532 M - 1.406 Log R* - 0.012 R + 0.338 Log S + 0.540 Log T15 + 3.413 Log (100 - F15) - 0.795 Log (D5015 + 0.1 mm)
Free Face Equation:Log Dh = -16.713 + 1.532 M - 1.406 Log R* - 0.012 R + 0.592 Log W + 0.540 Log T15 + 3.413 Log (100 - F15) - 0.795 Log (D5015 + 0.1 mm)
Dh = Horizontal Displacement, (meters)M = Moment Magnitude of Earthquake, MwR = Horizontal Distance to Nearest Seismic Energy Source or Fault Rupture, (kilometers)R* = R + R0R0 = 10(0.89 M -5.64)
W = (H/L)*100 = Free Face Ratio, (percent)H = Height of the Free Face, (meters)L = Length to the Free Face from the Point of Displacement (meters)S = Ground Slope, (percent)T15 = Thickness of Saturated Cohesionless Soils with (N1)60 <= 15, (meters)F15 = Average Fines Content in T15, (particle size <0.075 millimeters, in percent)D5015 = Average D50 in T15, (millimeters)
Lateral Spread Displacement Calculation— Eastern Abutment Rio Estrella Bridge
0 0.5 1.0 m
Procedures for Mitigation of Liquefaction and Ground Failure Hazards
Avoid liquefiable sitesAccept liquefaction hazard Strengthen the Structure Stabilize the ground
72

11/29/2011
13
Avoid the Hazard
Valdez, Alaska,1964 Alaska Earthquake
73
Mw=9.2
Valdez and docks before earthquake After earthquake
Valdez docks were destroyed by flow slides and community was pulled apart by lateral spread during 1964 Great Alaska earthquake, Mw = 9.2
74
To avoid liquefaction hazard, Valdez was rebuilt on a non‐liquefiable site
Liquefiable glacial outwash deposit (undeveloped)
Oil terminal for Trans Alaska Pipeline
Old Valdez(abandoned)
75
3 km
Diagrams showing depths and locations of liquefiable layers beneath highway I‐15, Salt Lake City, Utah, interpreted from CPT data
Log analyzed in next slide
Accept The HazardFS < 1
76
Pre 2000 highway embankment for 5th South on‐ramp to I‐15, Salt Lake City, Utah
Liquefiable layers
Slope stability analysis for highway embankment underlain by liquefiable layers, Salt Lake City, Utah, USA; with FS = 1.46, liquefaction hazard was accepted without requiring remediation
9 m
77
Although very near a seismic source for M = 7 earthquakes, due too flat topography and silty nature of soils, predicted lateral spread displacements are too small (< 0.1 m) to cause bridge damage. Liquefaction hazard was accepted with no special mitigation required
Strengthen the structure
78
House pulled apart at foundation level by lateral spread during 1997 Varancia, Romania earthquake, causing partial collapse
11/29/2011
14
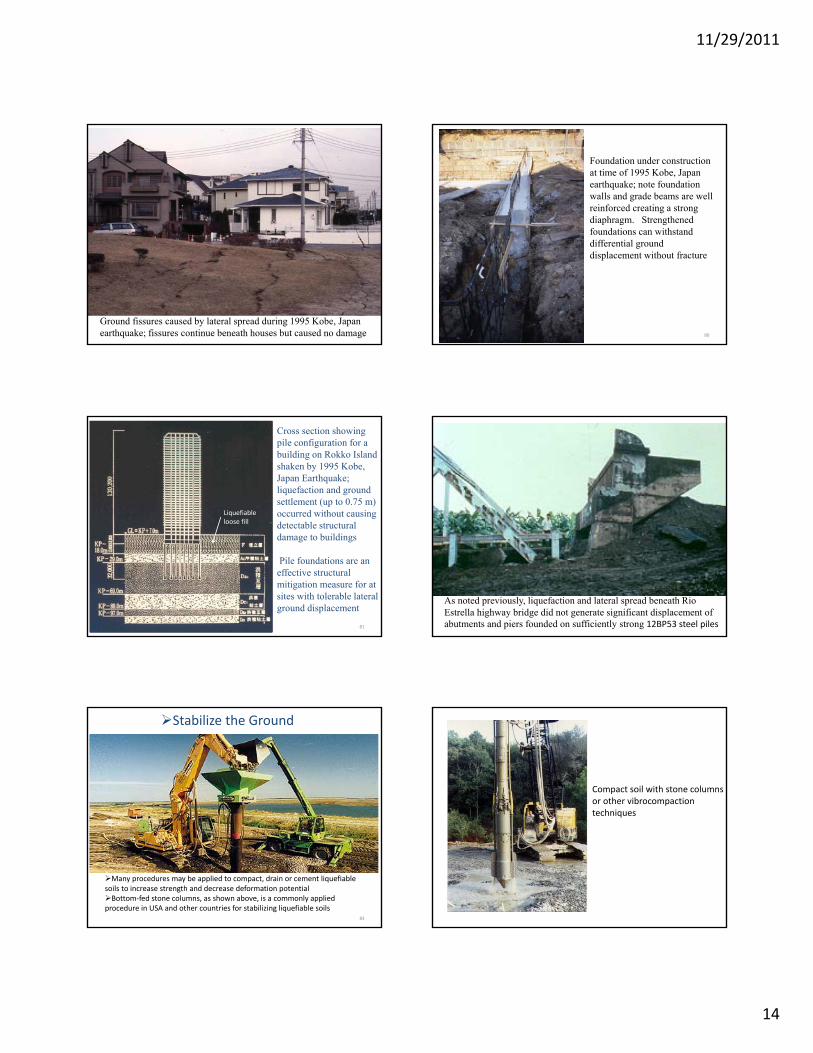
Ground fissures caused by lateral spread during 1995 Kobe, Japan earthquake; fissures continue beneath houses but caused no damage79
Foundation under construction at time of 1995 Kobe, Japan earthquake; note foundation walls and grade beams are well reinforced creating a strong diaphragm. Strengthened foundations can withstand differential ground displacement without fracture
80
Cross section showing pile configuration for a building on Rokko Island shaken by 1995 Kobe, Japan Earthquake; liquefaction and ground settlement (up to 0.75 m) occurred without causing detectable structural damage to buildings
Pile foundations are an effective structural mitigation measure for at sites with tolerable lateral ground displacement
Liquefiable loose fill
81
As noted previously, liquefaction and lateral spread beneath Rio Estrella highway bridge did not generate significant displacement of abutments and piers founded on sufficiently strong 12BP53 steel piles
Stabilize the Ground
Many procedures may be applied to compact, drain or cement liquefiable soils to increase strength and decrease deformation potentialBottom‐fed stone columns, as shown above, is a commonly applied procedure in USA and other countries for stabilizing liquefiable soils
83
Compact soil with stone columns or other vibrocompactiontechniques
11/29/2011
15
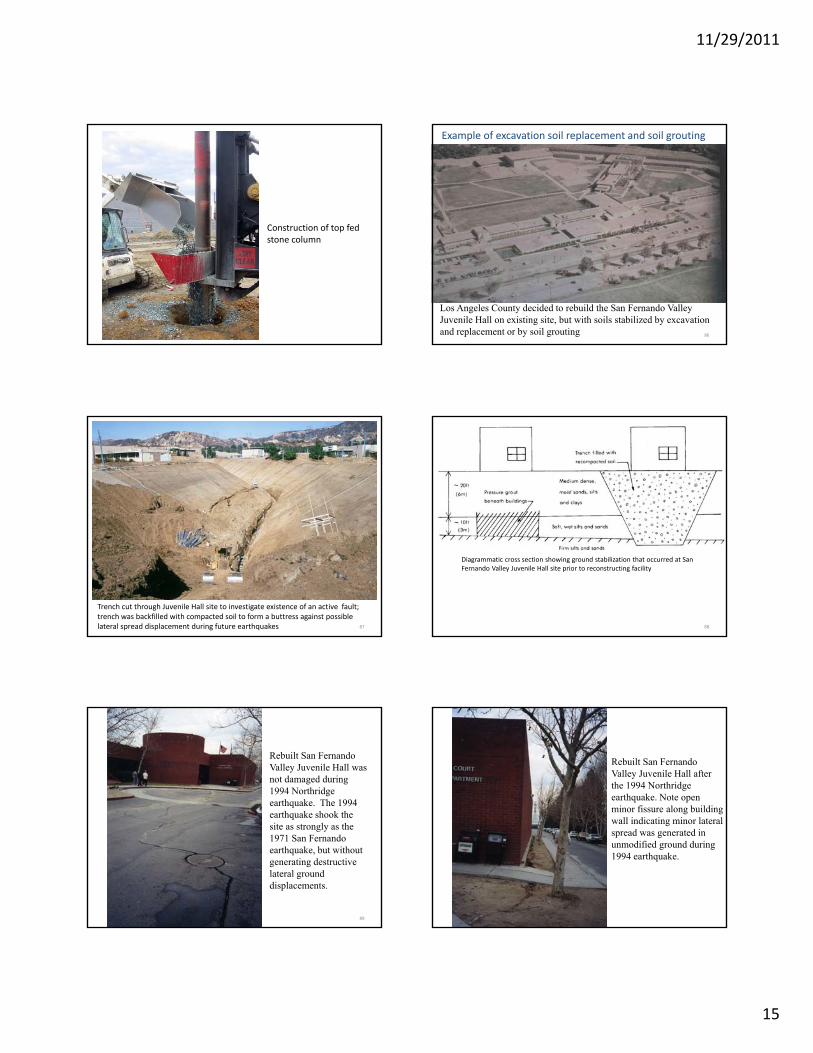
Construction of top fed stone column
caption
Los Angeles County decided to rebuild the San Fernando Valley Juvenile Hall on existing site, but with soils stabilized by excavation and replacement or by soil grouting 86
Example of excavation soil replacement and soil grouting
Trench cut through Juvenile Hall site to investigate existence of an active fault; trench was backfilled with compacted soil to form a buttress against possible lateral spread displacement during future earthquakes 87
Diagrammatic cross section showing ground stabilization that occurred at San Fernando Valley Juvenile Hall site prior to reconstructing facility
88
Rebuilt San Fernando Valley Juvenile Hall was not damaged during 1994 Northridge earthquake. The 1994 earthquake shook the site as strongly as the 1971 San Fernando earthquake, but without generating destructive lateral ground displacements.
89
Rebuilt San Fernando Valley Juvenile Hall after the 1994 Northridge earthquake. Note open minor fissure along building wall indicating minor lateral spread was generated in unmodified ground during 1994 earthquake.

11/29/2011
16
Soil DrainsSummary:
1. Liquefaction may cause any of the following types of ground failure:Flow failureLateral Spread Ground OscillationLoss of bearing strengthGround Settlement
2. Amount of potential liquefaction‐induced ground deformations or displacements associated should be determined. If amount of ground displacement is tolerable to the structure, mitigation is not required.
3. The following mitigation measures may be applied:Avoid the hazardAccept the hazardStrengthen the structureStabilize the ground
92