Embed Size (px)
Citation preview

Evaluation of Rainfall Baseline and Projections for the Greater Horn of Africa
Countries Using Cordex Models
In Support of;
Planning for Resilience in East Africa through Policy, Adaptation, Research and
Economic Development (PREPARED) Project
November 2014

2
ICPAC MEMBERS Djibouti I Ethiopia I Eritrea I Kenya I Sudan I South Sudan I Somalia I Uganda I Burundi I Rwanda I Tanzania www.icpac.net
Background
The Coordinated Regional Downscaling Experiment (CORDEX) is a program sponsored by World Climate
Research Program (WCRP) to develop an improved framework for generating regional-scale climate projections for
impact assessment and adaptation studies worldwide within the IPCC AR5 timeline and beyond. The program aims
to produce an ensemble of multiple dynamical and statistical downscaling models considering multiple forcing
GCMs from the CMIP5 archive. 50 km grid spacing has been selected, favouring engagement of wider community.
For the list of CORDEX RCMs and their details (Table 1)
An essential component of CORDEX is the evaluation of the ability of the ten Regional Climate Models (RCMs)
from CORDEX in simulating the characteristics of rainfall patterns over the Greater Horn of Africa (GHA) sub-
region for a 20-year (1989-2007) hindcast period with the lateral boundary forcing obtained from ERA-Interim
reanalysis. These evaluations are critical to characterizing the strengths and weaknesses of these models for their
use in producing future projections regional climate change where the lateral boundary forcing is provided by
multiple GCMs and emissions scenarios from the CMIP5 archive.
Climatology
Figure 1 shows the spatial rainfall climatology for (i) June-August (JJA) (ii) October-December (OND) seasons
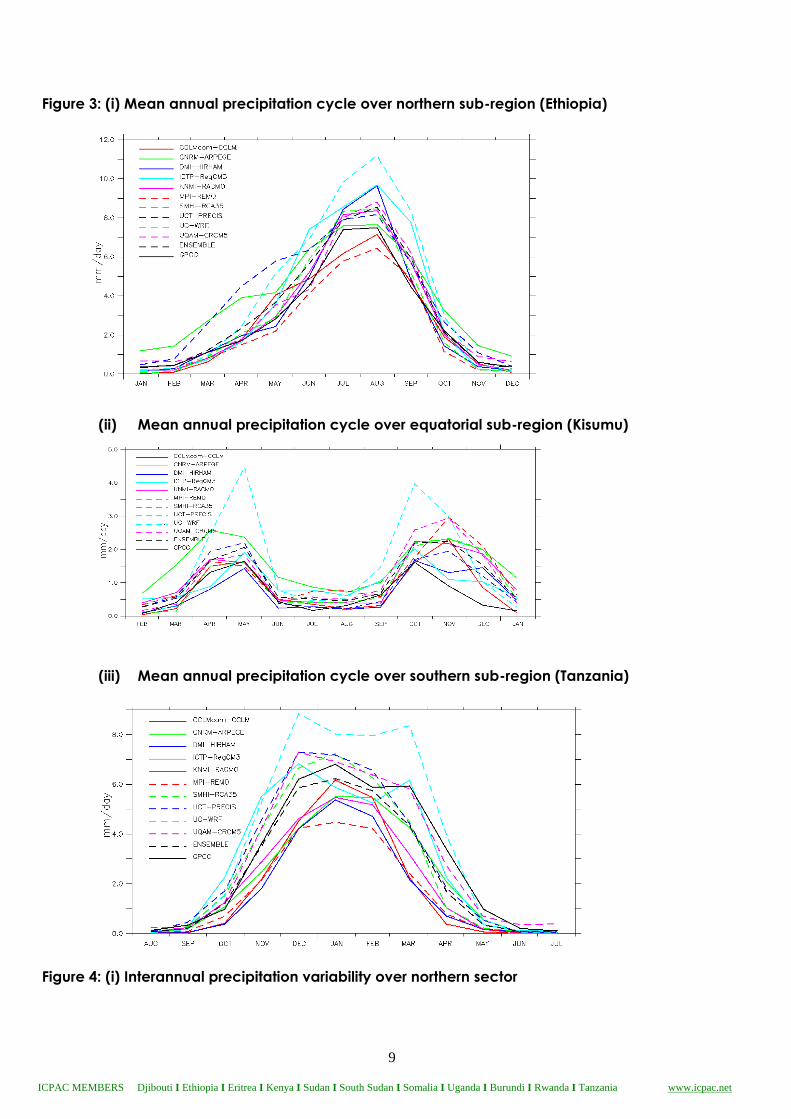
with figure 2 showing their biases respectively. Figure 3 depicts mean annual precipitation cycle over (i) northern
(ii) equatorial and (iii) southern sectors. The ability of the RCMs in simulating large-scale global climate forcing
signals such as El Niño Southern Oscillation (ENSO) and Indian Ocean Dipole (IOD) are shown by Figure 4 for
interannual variability over the (i) northern (ii) equatorial and (iii) southern sectors.
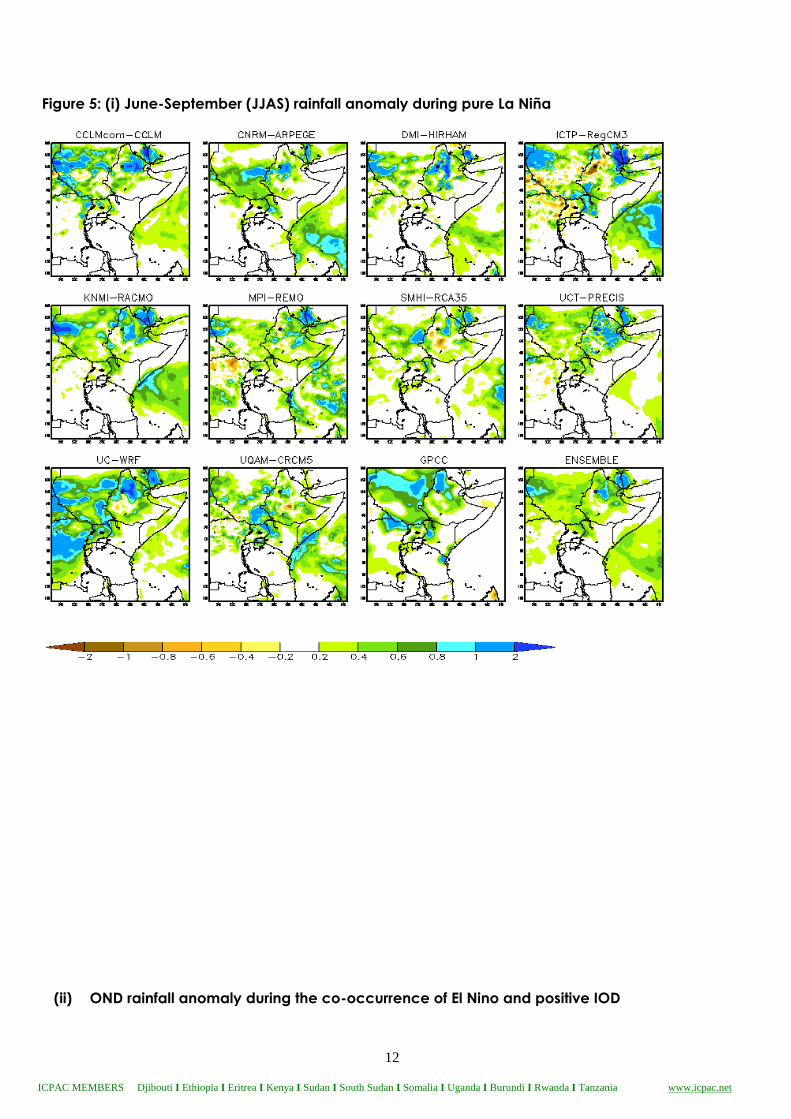
The spatial characteristics of the RCMs in simulating these large-scale global climate forcing signals were further
tested by compositing the ENSO and IOD events. These are shown in figure 5 for (i) pure La Niña (ii) co-
occurrence of El Niño and positive IOD in October-December (OND) rainfall (iii) OND rainfall anomaly during
positive IOD.
All the RCMs realistically simulated the rainfall belt associated with the Intertropical Convergence Zone (ITCZ)
during all the seasons although most of the models show wet bias apart from REMO and CCLM, which showed dry
bias. During OND, all RCMs captured well the ITCZ belt. It was noted that the 10 RCMs indicated wet bias over
equatorial sector while CCLM, ARPEGE, HIRHAM, RECMO, and REMO show dry bias in reproducing OND
rainfall over southern sector. CRCM5, RACMO, RegCM3, and RCA showed high spatial correlations together with
consistency in reproducing spatial patterns of rainfall over time for JJAS in northern sector and RACMO and
RegCM3 during OND in equatorial sector.
Summary
Most of the RCMs reasonably simulate the main features of the rainfall climatology over the region and also
reproduce ENSO and IOD signals. There are significant biases in individual model however, the ensemble mean
show better agreement with observation. In general, the analysis demonstrates that the multimodel ensemble mean
simulates regional rainfall adequately and this motivates their use for future climate projections.
Future Rainfall Projections over the GHA sub-region
Within the CORDEX-Africa initiative a large ensemble of regional climate simulations over Africa has been
produced by dynamical downscaling of a subset of GCMs from the CMIP5 project.
Eight GCMs, based on availability of boundary conditions in the CMIP5 data base, have been chosen for
downscaling (see Table 2). The downscaling of the GCM simulations has been performed with the latest version of

3
ICPAC MEMBERS Djibouti I Ethiopia I Eritrea I Kenya I Sudan I South Sudan I Somalia I Uganda I Burundi I Rwanda I Tanzania www.icpac.net
the Rossby Centre Regional Climate Model - RCA4 for the GHA sub-region domain at 0.44º resolution. First we
have downscaled the ERA-Interim Reanalysis (1980-2010) and then all 8 GCMs sampling both RCP4.5 and 8.5
climate change scenarios and running in transient mode for the period 1951-2100 (historical 1951-2005 and
scenario 2006-2100). We have also downscaled one RCP2.6 scenario for 2006-2100 (EC-EARTH).
Figure 6 gives future (i) MAM (ii) OND 2030 rainfall climatology for the projected datasets under RCP 4.5
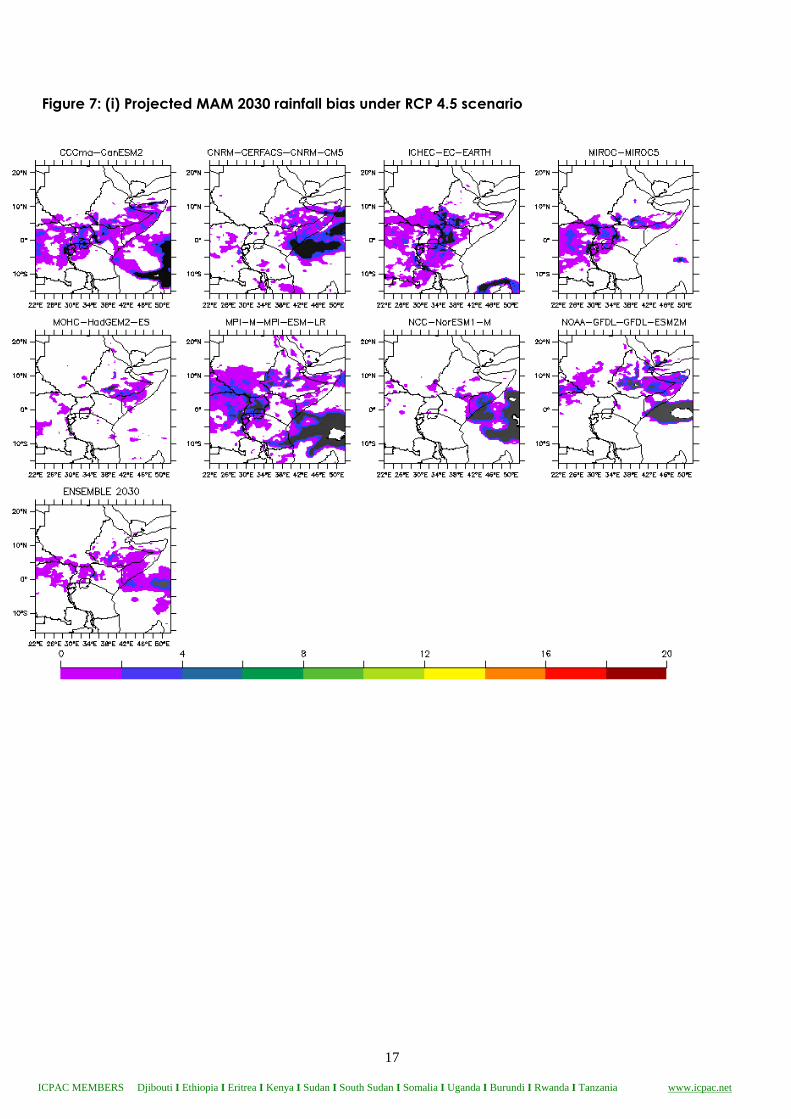
scenario. The future climatologies show similarites to present climatologies in all the seasons. Figure 7 on the other
hand shows (i) Projected MAM 2030 rainfall bias under RCP 4.5 scenario (baseline 1961-1990). Detailed
discussion on future projected climate will be given later.

4
ICPAC MEMBERS Djibouti I Ethiopia I Eritrea I Kenya I Sudan I South Sudan I Somalia I Uganda I Burundi I Rwanda I Tanzania www.icpac.net
Table 1: List of CORDEX RCMs and their details

5
ICPAC MEMBERS Djibouti I Ethiopia I Eritrea I Kenya I Sudan I South Sudan I Somalia I Uganda I Burundi I Rwanda I Tanzania www.icpac.net
Figure 1: (i) The seasonal climatology of Rainfall over GHA region during JJA season, observations
(GPCC) and ensemble of the ten RCMs.

6
ICPAC MEMBERS Djibouti I Ethiopia I Eritrea I Kenya I Sudan I South Sudan I Somalia I Uganda I Burundi I Rwanda I Tanzania www.icpac.net
Figure 1: (ii) Climatology of Rainfall over GHA region during OND season as simulated by CORDEX
RCMs, observations (GPCC) and ensemble of the ten RCMs.
Figure 2: (i) Spatial plots of the RCMs bias (1990-2008) during JJAS

7
ICPAC MEMBERS Djibouti I Ethiopia I Eritrea I Kenya I Sudan I South Sudan I Somalia I Uganda I Burundi I Rwanda I Tanzania www.icpac.net
Figure 2: (ii) Spatial plots of the RCMs bias (1990-2008) during OND

8
ICPAC MEMBERS Djibouti I Ethiopia I Eritrea I Kenya I Sudan I South Sudan I Somalia I Uganda I Burundi I Rwanda I Tanzania www.icpac.net
9
ICPAC MEMBERS Djibouti I Ethiopia I Eritrea I Kenya I Sudan I South Sudan I Somalia I Uganda I Burundi I Rwanda I Tanzania www.icpac.net
Figure 3: (i) Mean annual precipitation cycle over northern sub-region (Ethiopia)
(ii) Mean annual precipitation cycle over equatorial sub-region (Kisumu)
(iii) Mean annual precipitation cycle over southern sub-region (Tanzania)
Figure 4: (i) Interannual precipitation variability over northern sector

10
ICPAC MEMBERS Djibouti I Ethiopia I Eritrea I Kenya I Sudan I South Sudan I Somalia I Uganda I Burundi I Rwanda I Tanzania www.icpac.net
(ii) Interannual precipitation variability over equatorial
(iii) Interannual precipitation variability over southern sector

11
ICPAC MEMBERS Djibouti I Ethiopia I Eritrea I Kenya I Sudan I South Sudan I Somalia I Uganda I Burundi I Rwanda I Tanzania www.icpac.net
12
ICPAC MEMBERS Djibouti I Ethiopia I Eritrea I Kenya I Sudan I South Sudan I Somalia I Uganda I Burundi I Rwanda I Tanzania www.icpac.net
Figure 5: (i) June-September (JJAS) rainfall anomaly during pure La Niña
(ii) OND rainfall anomaly during the co-occurrence of El Nino and positive IOD

13
ICPAC MEMBERS Djibouti I Ethiopia I Eritrea I Kenya I Sudan I South Sudan I Somalia I Uganda I Burundi I Rwanda I Tanzania www.icpac.net
(iii) OND rainfall anomaly during positive IOD

14
ICPAC MEMBERS Djibouti I Ethiopia I Eritrea I Kenya I Sudan I South Sudan I Somalia I Uganda I Burundi I Rwanda I Tanzania www.icpac.net
Figure 6: (i) Future (2030) climatology for March – May (MAM) rainfall

15
ICPAC MEMBERS Djibouti I Ethiopia I Eritrea I Kenya I Sudan I South Sudan I Somalia I Uganda I Burundi I Rwanda I Tanzania www.icpac.net
(ii) Future climatology for OND season

16
ICPAC MEMBERS Djibouti I Ethiopia I Eritrea I Kenya I Sudan I South Sudan I Somalia I Uganda I Burundi I Rwanda I Tanzania www.icpac.net
17
ICPAC MEMBERS Djibouti I Ethiopia I Eritrea I Kenya I Sudan I South Sudan I Somalia I Uganda I Burundi I Rwanda I Tanzania www.icpac.net
Figure 7: (i) Projected MAM 2030 rainfall bias under RCP 4.5 scenario

18
ICPAC MEMBERS Djibouti I Ethiopia I Eritrea I Kenya I Sudan I South Sudan I Somalia I Uganda I Burundi I Rwanda I Tanzania www.icpac.net

19
ICPAC MEMBERS Djibouti I Ethiopia I Eritrea I Kenya I Sudan I South Sudan I Somalia I Uganda I Burundi I Rwanda I Tanzania
www.icpac.net
(iii) annual rainfall cycles (a) Nothern sector - Ethiopia
(iv) annual rainfall cycles (a) Equatorial sector - Kenya