Embed Size (px)
Citation preview
Alake et al., Cogent Food & Agriculture (2016), 2: 1246116http://dx.doi.org/10.1080/23311932.2016.1246116
FOOD SCIENCE & TECHNOLOGY | RESEARCH ARTICLE
Evaluation of physico-chemical properties and sensory attributes of cassava enriched custard powderO.O. Alake1*, J.M. Babajide2, A.A. Adebowale2 and M.A. Adebisi3
Abstract: In view of the increasingly produced biofortified cassava roots in Nigeria, it becomes necessary to assess more of its utilization. This study therefore aimed at evaluating the nutrients value of custard powder produced from HQYCS (High quality yellow cassava starch) enriched with PDSF (Partially defatted soybean flour) at varying proportions of 10, 20, 30 and 40%. Proximate composition, carotenoid content, func-tional and pasting properties of the mixture were determined. Gruel prepared from the mixture were evaluated for consumer acceptability using commercial custard as control. Data obtained were subjected to analysis of variance (ANOVA) and significant means were separated using Tukey’s Test. Correlation analysis were performed on the data to determine the association between the parameters. Proximate composi-tion that contains 13.29% protein, 8.31% fat, 1.24% fibre, 1.18% ash at 10% PDSF enrichment level increased to 15.45, 10.05, 3.96 and 2.15% for protein, fat, fibre and ash at 40% PDSF respectively. The highest total carotenoid content (9.42 ± 0.70 μg/g) was obtained in 100% custard powder. There was significant difference (p < 0.05) in the water absorption capacity of custard sample with a range of 103–189 g/g. Range values for pasting properties were peak viscosity (170.12–393.4 RVU), final viscosity (49.25–346.12 RVU), trough (104.00–264.92 RVU), setback (45.25–81.21 RVU), and
*Corresponding author: O.O. Alake, Department of Hospitality and Tourism, Federal University of Agriculture, Abeokuta, Ogun, NigeriaE-mails: [email protected], [email protected]
Reviewing editor:Fatih Yildiz, Middle East Technical University, Turkey
Additional information is available at the end of the article
ABOUT THE AUTHORSO.O. Alake is a young scientist with master degree in Food Processing and Storage Technology from Federal University of Agriculture, Abeokuta Ogun State Nigeria.
J.M. Babajide is an associate professor in the Department of Food Science and Technology, Federal University of Agriculture, Abeokuta, Ogun state Nigeria. She has published a number of research papers in journals of repute.
A.A Adebowale is a senior lecturer, a research fellow with specialization in Food processing and quality control in the Department of Food Science and Technology, Federal University of Agriculture, Abeokuta, Ogun state Nigeria. He has published a number of research papers in journals of repute.
Adebisi, M.A. is an associate professor, a seed scientist in the Department of Plant Breeding and Seed Technology, Federal University of Agriculture, Abeokuta, Ogun state Nigeria. He has published a number of research papers in journals of repute.
PUBLIC INTEREST STATEMENTYellow cassava is similar to ordinary varieties of cassava (Manihot esculentum) but it has a yellow flesh. The yellow concentration colour is an important part of nutritional information of the yellow fleshed cassava root which is known as the beta-carotene, a component which is converted by the body into vitamin A. Since one of the most common micronutrient deficiencies worldwide are those of vitamin A, therefore, this could help in reducing the effect of vitamin A deficiency. However, this makes yellow cassava varieties more relevant in food industry. The presence of high concentration of beta-carotene in the yellow flesh cassava varieties necessitates its utilization in the production of custard powder. Therefore, it is recommended that some innovations could increase acceptability and nutritional content of locally prepared cassava-based foods. This study can help industries to develop custard food products with the use of yellow cassava starch.
Received: 21 July 2016Accepted: 05 October 2016Published: 14 October 2016
© 2016 The Author(s). This open access article is distributed under a Creative Commons Attribution (CC-BY) 4.0 license.
Page 1 of 14
Page 2 of 14
Alake et al., Cogent Food & Agriculture (2016), 2: 1246116http://dx.doi.org/10.1080/23311932.2016.1246116
breakdown (66.13–144.59 RVU). The sensory colour and the degree of (redness) of the sample were correlated at (p < 0.05) level. There was a significant difference between the overall acceptability of the entire enriched products and the control.
Subjects: Bioscience; Nutrition; Food Science & Technology; Food Additives & Ingredients; Food Laws & Regulations
Keywords: HCYCS (high quality yellow fleshed cassava starch); PDSF (partially defatted soybean flour) custard powder; thick custard gruel
1. IntroductionThe problem of malnutrition as a results of vitamin A deficiency in the developing countries has been a challenge (Mayer, Pfeiffer, & Beyer, 2008). Millions of people in the world not minding the vulnerable group now get fewer vitamins than what is needed in the diet. As a result of this, most research insti-tutes like National Root Crops Research Institute (NRCRI), Umudike, International Institute of Tropical Research Institute (IITA), Ibadan to mention but few now involved in biofortification of some major stable crops such as cassava roots to minimize the effect and complement Nigeria Government’s ef-forts to check vitamin A malnutrition (Mayer et al., 2008; Tanumihardjo, 2008). The recent introduc-tion of yellow root cassava or β-carotene cassava varieties have potential of providing up to 25% of daily vitamin A required by the body thereby improves the nutritional status of the consumers (Ferreira et al., 2008). Therefore, there is a need to evaluate some of the foods that consumers eat every day from these newly breed crops for value addition as well as enhancing better and wide range utilization of the crop (Mayer et al., 2008). Cassava roots are rich in carbohydrates, but deficient in proteins and many essential micronutrients. Cassava roots have high starch content, about 60%, and it is therefore a cheap and excellent source of dietary carbohydrate but contain low protein which can only be improved by incorporating high protein containing crops such as cowpeas and soybeans as a means of protein enrichment (Muoki, Kock, & Emmambux, 2012). The use of the starch produced from biofortified cassava roots in the production of custard powder which has gradually find its application in food formulation and composite flour preparations in Nigeria would be one of the sustainable strategy to prevent and minimize the deficiency of vitamin A. Custard powder is an edible yellow coloured starch, sweetened and flavoured in which when hot milk is added, the gruel gives the desired colour, taste and aroma (Okoye et al., 2007). The addition of animal protein egg can also serves as a source of protein in custard production (Awoyale, Sanni, Shittu, & Adegunwa, 2015). However, as a result of financial situation of the populace, many consume custard without addition of milk or egg, which results in dietary deficiencies of protein, and this has been another growing nutritional problem in Nigeria. Many people have been implicated in malnutrition (Akoja & Mohammed, 2011) therefore; protein supplementation of cassava-based products is essential. One way of improv-ing the protein content of cassava products is to add protein-rich material such as soybean flour (Muoki et al., 2012). Soybean (Glycine max) is one such protein source, which when used partially to enrich cassava starch-based custard would help tremendously in improving the nutritional quality of the product. According to Iwe (2003), soybean plays a very important role in enrichment of cereals and tuber crops based food products due to its nutritional quality and functional properties. However, incorporating soybean-flour into cassava starch may change the physicochemical properties, there-fore this work was aimed to determine the effect of soybean flour enrichment on the chemical and physicochemical properties of custard powder and also to evaluate the consumer acceptability of the reconstituted thick gruel, a common food similar to ogi in Nigeria.
2. Materials and methods
2.1. MaterialsYellow fleshed cassava roots (05/1601) were collected from the Research farm of the International Institute of Tropical Agriculture, Ikene, Ogun state, Nigeria. Soybean seeds were obtained from Kuto market in Abeokuta, Ogun state, Nigeria while colourant and vanilla were purchased at recognized food chemical store in Abeokuta.
Page 3 of 14
Alake et al., Cogent Food & Agriculture (2016), 2: 1246116http://dx.doi.org/10.1080/23311932.2016.1246116
2.2. Methods
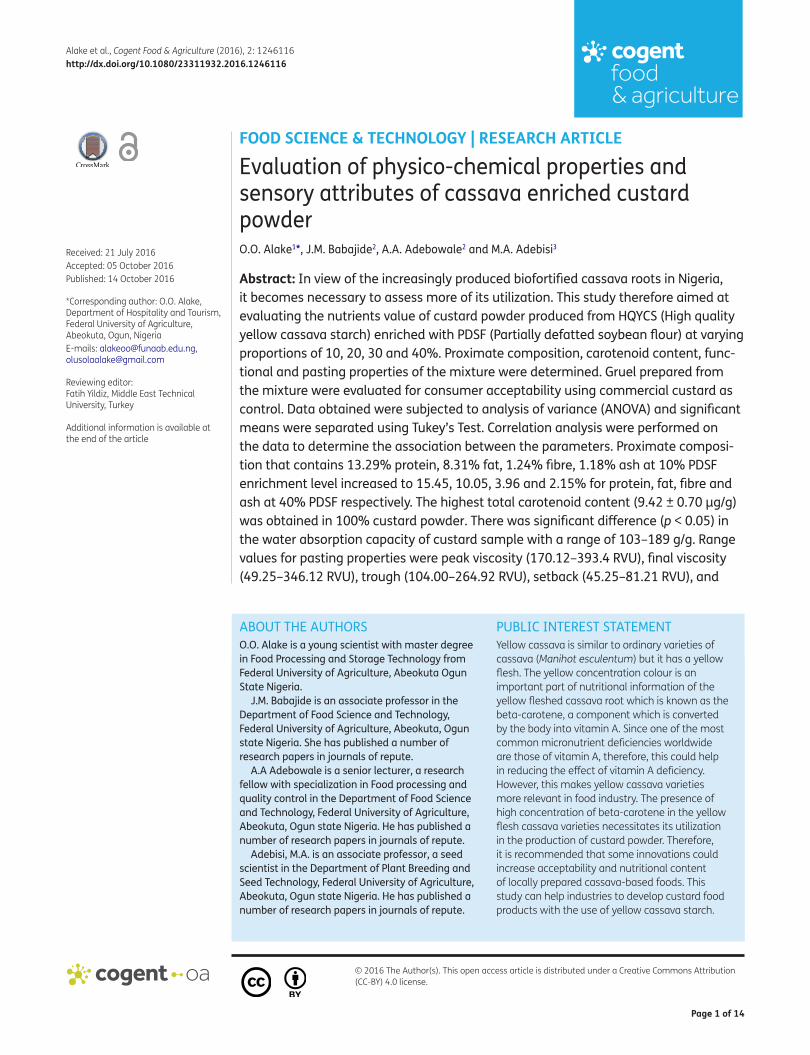
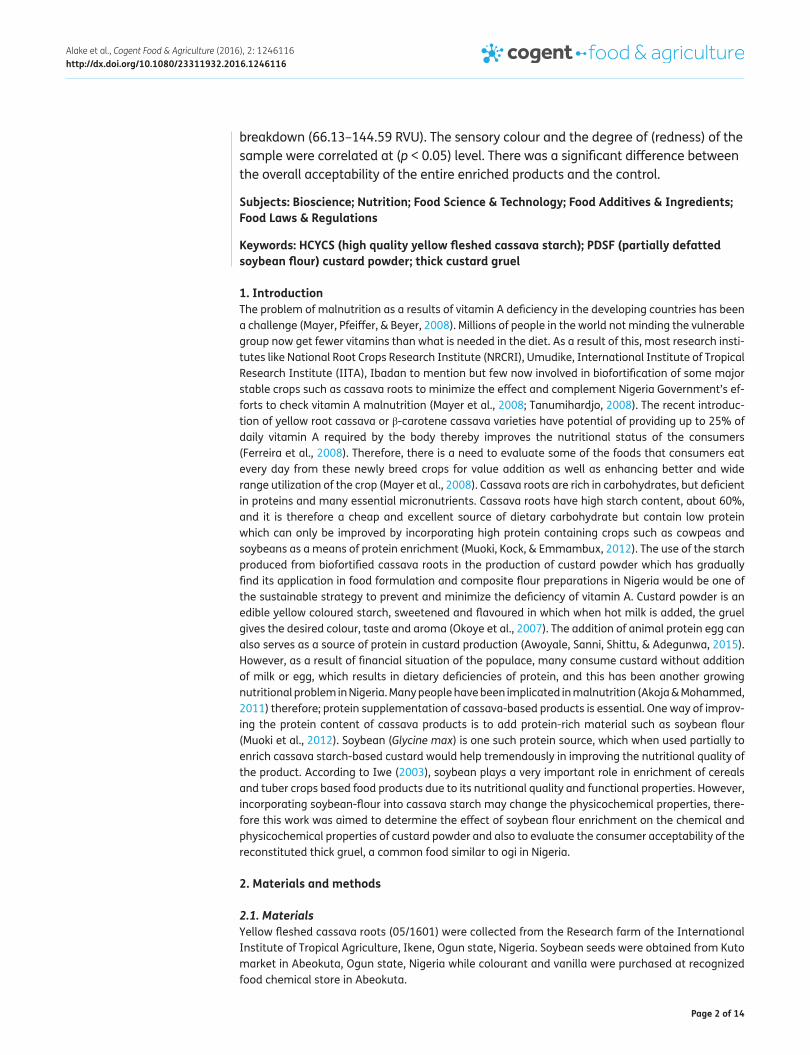
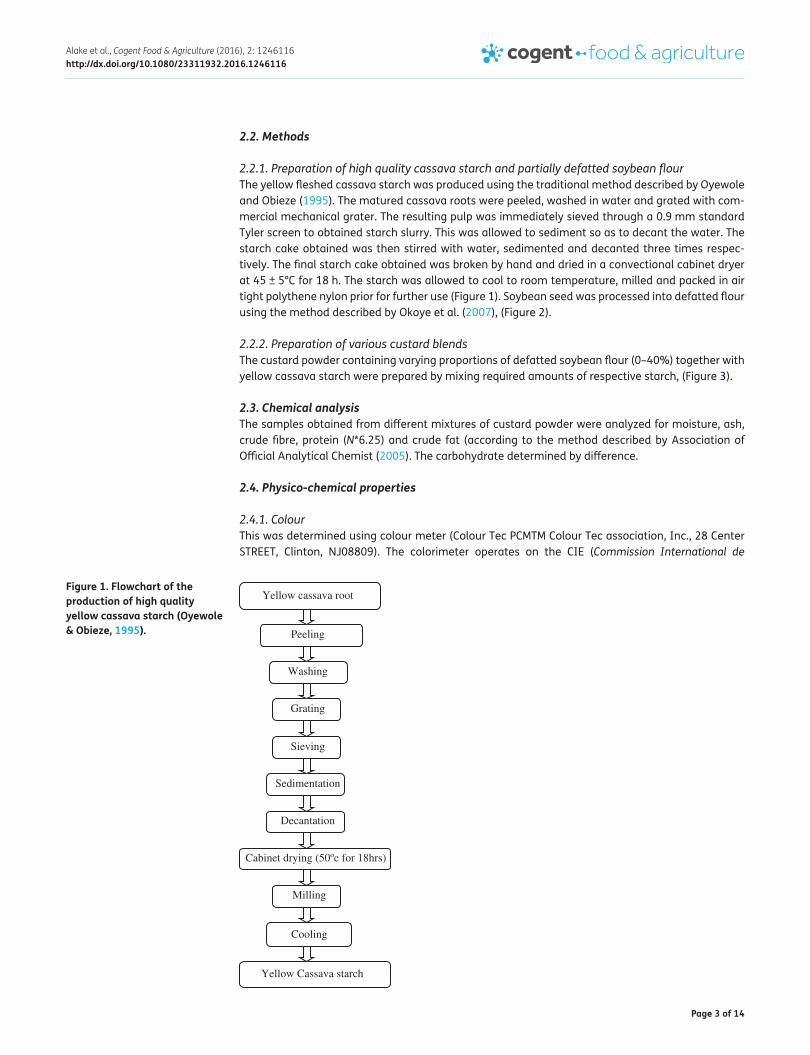
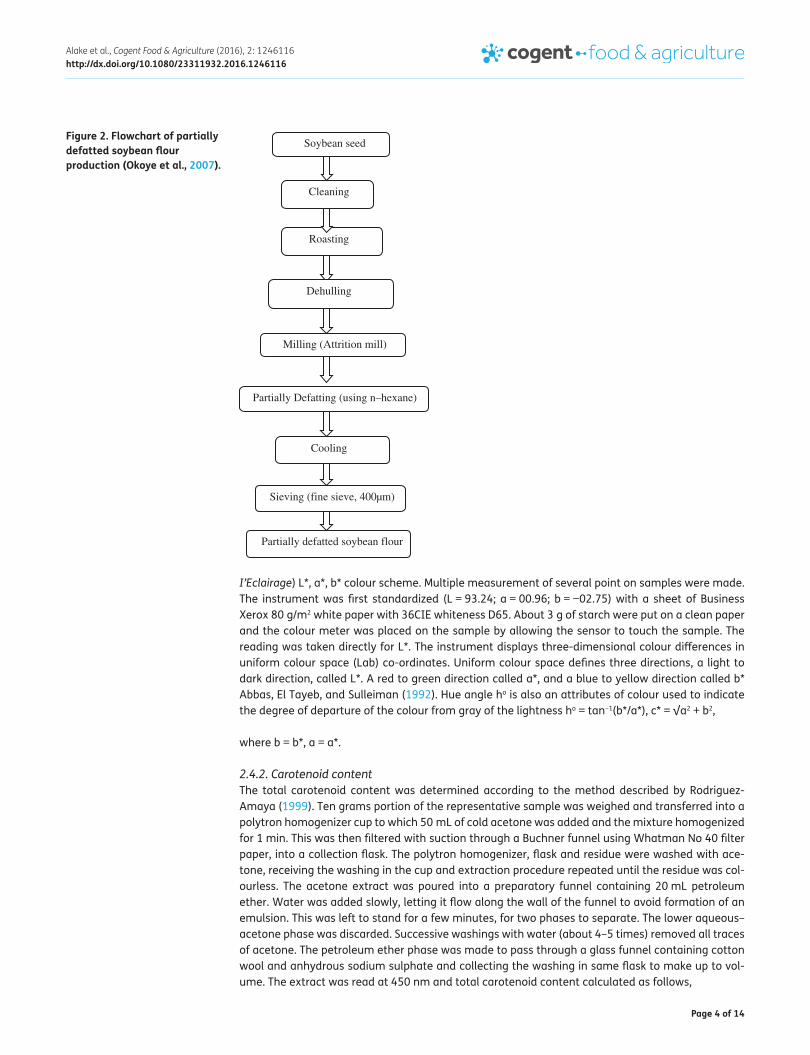
2.2.1. Preparation of high quality cassava starch and partially defatted soybean flourThe yellow fleshed cassava starch was produced using the traditional method described by Oyewole and Obieze (1995). The matured cassava roots were peeled, washed in water and grated with com-mercial mechanical grater. The resulting pulp was immediately sieved through a 0.9 mm standard Tyler screen to obtained starch slurry. This was allowed to sediment so as to decant the water. The starch cake obtained was then stirred with water, sedimented and decanted three times respec-tively. The final starch cake obtained was broken by hand and dried in a convectional cabinet dryer at 45 ± 5°C for 18 h. The starch was allowed to cool to room temperature, milled and packed in air tight polythene nylon prior for further use (Figure 1). Soybean seed was processed into defatted flour using the method described by Okoye et al. (2007), (Figure 2).
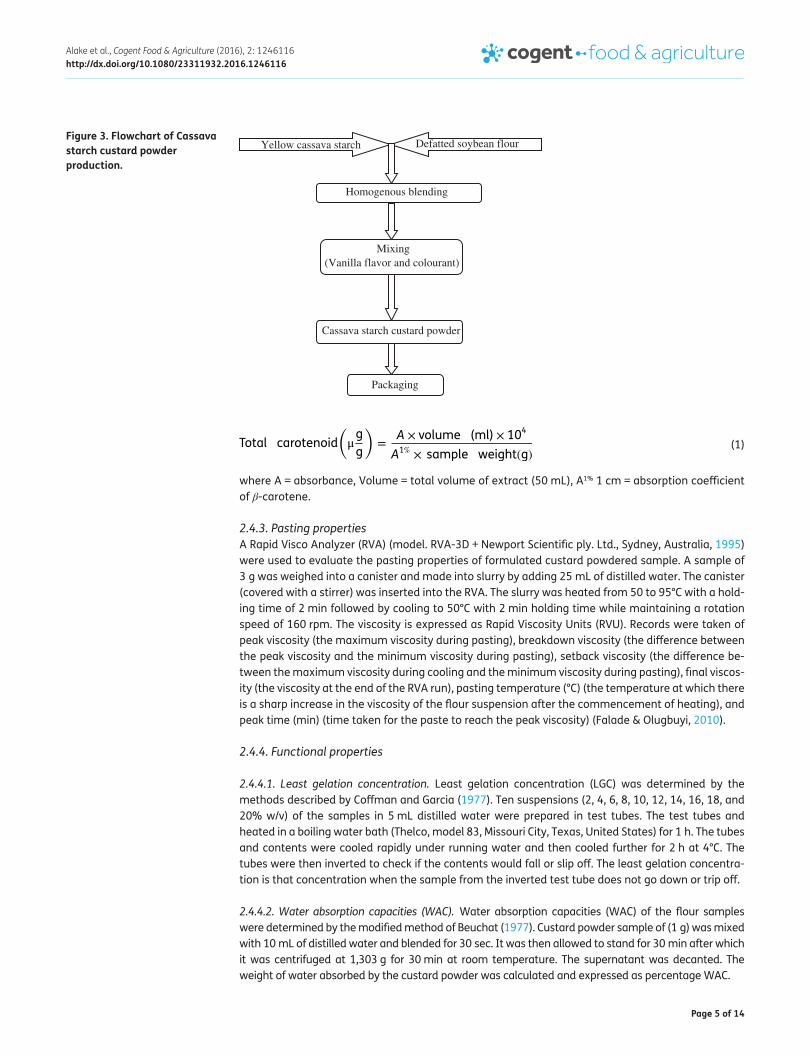
2.2.2. Preparation of various custard blendsThe custard powder containing varying proportions of defatted soybean flour (0–40%) together with yellow cassava starch were prepared by mixing required amounts of respective starch, (Figure 3).
2.3. Chemical analysisThe samples obtained from different mixtures of custard powder were analyzed for moisture, ash, crude fibre, protein (N*6.25) and crude fat (according to the method described by Association of Official Analytical Chemist (2005). The carbohydrate determined by difference.
2.4. Physico-chemical properties
2.4.1. ColourThis was determined using colour meter (Colour Tec PCMTM Colour Tec association, Inc., 28 Center STREET, Clinton, NJ08809). The colorimeter operates on the CIE (Commission International de
Figure 1. Flowchart of the production of high quality yellow cassava starch (Oyewole & Obieze, 1995). Peeling
Washing
Grating
Sieving
Sedimentation
Decantation
Cabinet drying (50oc for 18hrs)
Milling
Yellow Cassava starch
Cooling
Yellow cassava root
Page 4 of 14
Alake et al., Cogent Food & Agriculture (2016), 2: 1246116http://dx.doi.org/10.1080/23311932.2016.1246116
I’Eclairage) L*, a*, b* colour scheme. Multiple measurement of several point on samples were made. The instrument was first standardized (L = 93.24; a = 00.96; b = −02.75) with a sheet of Business Xerox 80 g/m2 white paper with 36CIE whiteness D65. About 3 g of starch were put on a clean paper and the colour meter was placed on the sample by allowing the sensor to touch the sample. The reading was taken directly for L*. The instrument displays three-dimensional colour differences in uniform colour space (Lab) co-ordinates. Uniform colour space defines three directions, a light to dark direction, called L*. A red to green direction called a*, and a blue to yellow direction called b* Abbas, El Tayeb, and Sulleiman (1992). Hue angle ho is also an attributes of colour used to indicate the degree of departure of the colour from gray of the lightness ho = tan−1(b*/a*), c* = √a2 + b2,
where b = b*, a = a*.
2.4.2. Carotenoid contentThe total carotenoid content was determined according to the method described by Rodriguez-Amaya (1999). Ten grams portion of the representative sample was weighed and transferred into a polytron homogenizer cup to which 50 mL of cold acetone was added and the mixture homogenized for 1 min. This was then filtered with suction through a Buchner funnel using Whatman No 40 filter paper, into a collection flask. The polytron homogenizer, flask and residue were washed with ace-tone, receiving the washing in the cup and extraction procedure repeated until the residue was col-ourless. The acetone extract was poured into a preparatory funnel containing 20 mL petroleum ether. Water was added slowly, letting it flow along the wall of the funnel to avoid formation of an emulsion. This was left to stand for a few minutes, for two phases to separate. The lower aqueous–acetone phase was discarded. Successive washings with water (about 4–5 times) removed all traces of acetone. The petroleum ether phase was made to pass through a glass funnel containing cotton wool and anhydrous sodium sulphate and collecting the washing in same flask to make up to vol-ume. The extract was read at 450 nm and total carotenoid content calculated as follows,
Figure 2. Flowchart of partially defatted soybean flour production (Okoye et al., 2007).
Cleaning
Roasting
Partially defatted soybean flour
Sieving (fine sieve, 400µm)
Cooling
Partially Defatting (using n–hexane)
Dehulling
Milling (Attrition mill)
Soybean seed
Page 5 of 14
Alake et al., Cogent Food & Agriculture (2016), 2: 1246116http://dx.doi.org/10.1080/23311932.2016.1246116
where A = absorbance, Volume = total volume of extract (50 mL), A1% 1 cm = absorption coefficient of β-carotene.
2.4.3. Pasting propertiesA Rapid Visco Analyzer (RVA) (model. RVA-3D + Newport Scientific ply. Ltd., Sydney, Australia, 1995) were used to evaluate the pasting properties of formulated custard powdered sample. A sample of 3 g was weighed into a canister and made into slurry by adding 25 mL of distilled water. The canister (covered with a stirrer) was inserted into the RVA. The slurry was heated from 50 to 95°C with a hold-ing time of 2 min followed by cooling to 50°C with 2 min holding time while maintaining a rotation speed of 160 rpm. The viscosity is expressed as Rapid Viscosity Units (RVU). Records were taken of peak viscosity (the maximum viscosity during pasting), breakdown viscosity (the difference between the peak viscosity and the minimum viscosity during pasting), setback viscosity (the difference be-tween the maximum viscosity during cooling and the minimum viscosity during pasting), final viscos-ity (the viscosity at the end of the RVA run), pasting temperature (°C) (the temperature at which there is a sharp increase in the viscosity of the flour suspension after the commencement of heating), and peak time (min) (time taken for the paste to reach the peak viscosity) (Falade & Olugbuyi, 2010).
2.4.4. Functional properties
2.4.4.1. Least gelation concentration. Least gelation concentration (LGC) was determined by the methods described by Coffman and Garcia (1977). Ten suspensions (2, 4, 6, 8, 10, 12, 14, 16, 18, and 20% w/v) of the samples in 5 mL distilled water were prepared in test tubes. The test tubes and heated in a boiling water bath (Thelco, model 83, Missouri City, Texas, United States) for 1 h. The tubes and contents were cooled rapidly under running water and then cooled further for 2 h at 4°C. The tubes were then inverted to check if the contents would fall or slip off. The least gelation concentra-tion is that concentration when the sample from the inverted test tube does not go down or trip off.
2.4.4.2. Water absorption capacities (WAC). Water absorption capacities (WAC) of the flour samples were determined by the modified method of Beuchat (1977). Custard powder sample of (1 g) was mixed with 10 mL of distilled water and blended for 30 sec. It was then allowed to stand for 30 min after which it was centrifuged at 1,303 g for 30 min at room temperature. The supernatant was decanted. The weight of water absorbed by the custard powder was calculated and expressed as percentage WAC.
(1)Total carotenoid
(
μg
g
)
=A × volume (ml) × 104
A1% × sample weight(g)
Figure 3. Flowchart of Cassava starch custard powder production.
Defatted soybean flourYellow cassava starch
Cassava starch custard powder
Homogenous blending
Mixing(Vanilla flavor and colourant)
Packaging
Page 6 of 14
Alake et al., Cogent Food & Agriculture (2016), 2: 1246116http://dx.doi.org/10.1080/23311932.2016.1246116
2.4.4.3. Swelling power and solubility. Swelling power and solubility were determined as described by Oladele and Aina (2007). Flour samples (10 g) were placed in a preweighed graduated measuring cylinder and 100 ml of distilled water was added. The suspension was stirred and allowed to set for 1 h. The super-natant was discarded and the cylinder with its content weighed to obtain the weight of the net sample. Swelling capacity on volume basis was calculated as difference in final to initial volume of the sample.
2.4.4.4. Bulk density. The methods described by Oladele and Aina (2007) were used for the determi-nation of bulk density. The custard powder samples were weighed (7 g) into a 50 mL graduated meas-uring cylinder. The cylinder was tapped gently against the palm of the hand until a constant volume was obtained. Bulk density was calculated as weight of sample/volume of sample after tapping.
2.5. Sensory evaluationTwenty grams of each sample including the commercial custard was measured into a clean beaker, 100 mL of tap water was added and the mixture was measured and 80 mL of boiling water was added to form paste. The paste was served to the panelists at 50°C with addition of sucrose. The samples were rated on the following quality attributes; colour, taste, aroma and overall acceptability using a nine-point hedonic scale system Meilgaard, Civille, and Thomas Carr (1999). A 50-member panel including staff and students randomly selected from Federal University of Agriculture, Abeokuta was used with the following individual scores: 1 = Extremely dislike, 5 = neither like nor dislike and 9 = Extremely like. The scores obtained were subjected to analysis of variance at 5% level of significance and means separated using Turkey test.
2.6. Statistical analysisAll data obtained were subjected to analysis of variance (ANOVA) in triplicates and means were separated by Turkey’s Test using SPSS (version 16.0) (SPSS Inc., USA). Correlation analysis was per-formed on the data to determine the association between the parameters.
3. Results and discussion
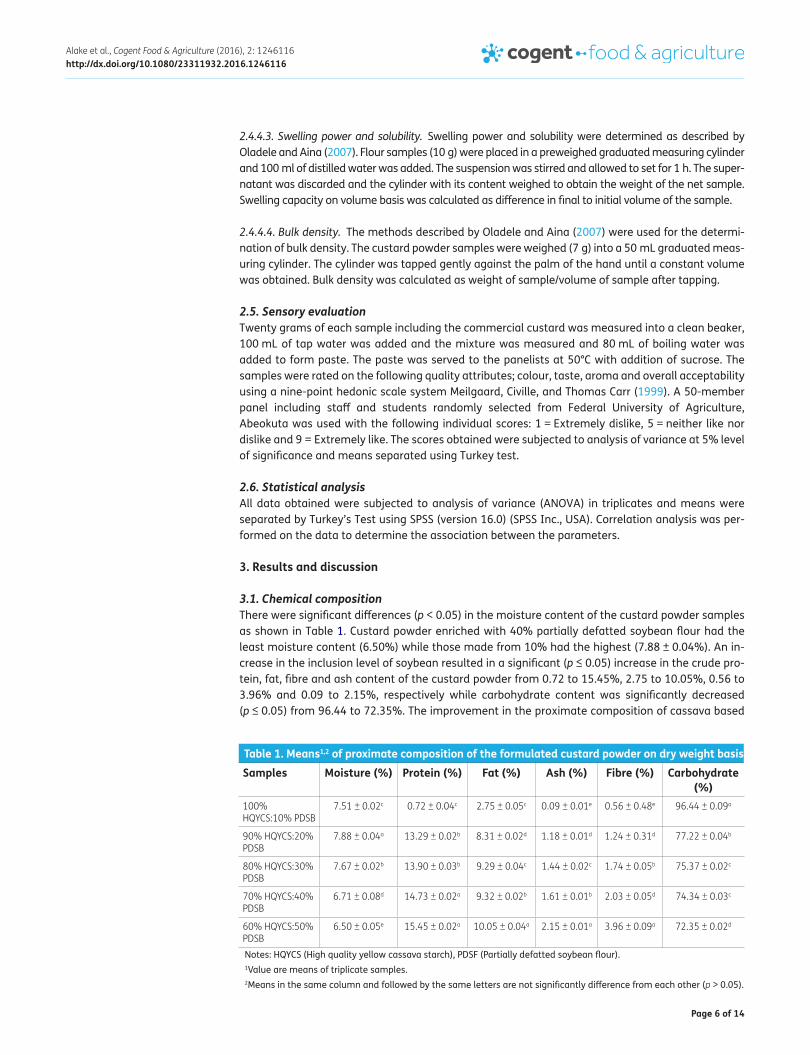
3.1. Chemical compositionThere were significant differences (p < 0.05) in the moisture content of the custard powder samples as shown in Table 1. Custard powder enriched with 40% partially defatted soybean flour had the least moisture content (6.50%) while those made from 10% had the highest (7.88 ± 0.04%). An in-crease in the inclusion level of soybean resulted in a significant (p ≤ 0.05) increase in the crude pro-tein, fat, fibre and ash content of the custard powder from 0.72 to 15.45%, 2.75 to 10.05%, 0.56 to 3.96% and 0.09 to 2.15%, respectively while carbohydrate content was significantly decreased (p ≤ 0.05) from 96.44 to 72.35%. The improvement in the proximate composition of cassava based
Table 1. Means1,2 of proximate composition of the formulated custard powder on dry weight basis
Notes: HQYCS (High quality yellow cassava starch), PDSF (Partially defatted soybean flour).1Value are means of triplicate samples.2Means in the same column and followed by the same letters are not significantly difference from each other (p > 0.05).
Samples Moisture (%) Protein (%) Fat (%) Ash (%) Fibre (%) Carbohydrate (%)
100% HQYCS:10% PDSB
7.51 ± 0.02c 0.72 ± 0.04c 2.75 ± 0.05c 0.09 ± 0.01e 0.56 ± 0.48e 96.44 ± 0.09a
90% HQYCS:20% PDSB
7.88 ± 0.04a 13.29 ± 0.02b 8.31 ± 0.02d 1.18 ± 0.01d 1.24 ± 0.31d 77.22 ± 0.04b
80% HQYCS:30% PDSB
7.67 ± 0.02b 13.90 ± 0.03b 9.29 ± 0.04c 1.44 ± 0.02c 1.74 ± 0.05b 75.37 ± 0.02c
70% HQYCS:40% PDSB
6.71 ± 0.08d 14.73 ± 0.02a 9.32 ± 0.02b 1.61 ± 0.01b 2.03 ± 0.05d 74.34 ± 0.03c
60% HQYCS:50% PDSB
6.50 ± 0.05e 15.45 ± 0.02a 10.05 ± 0.04a 2.15 ± 0.01a 3.96 ± 0.09a 72.35 ± 0.02d
Page 7 of 14
Alake et al., Cogent Food & Agriculture (2016), 2: 1246116http://dx.doi.org/10.1080/23311932.2016.1246116
custard powder enriched with defatted soybean flour observed in this study is in agreement with the observations of Osho (2003); Monayajo and Nupo (2011) and Muoki et al. (2012) on cassava based products enriched with soybean flour. Olatidoye, Sobowale, Adeleke, and Adegbite (2010) also re-ported nutritional improvement in the end product of a food enriched with soybean flour. However, there was no significant difference (p ≥ 0.05) in the protein content of cassava custard powder en-riched with 10 and 20% as well as 30 and 40% soybean flour. The increase in protein content is simi-lar to some other research study in which soy flour was used in products enrichment (Jimoh & Olatidoye, 2009; Kolapo & Sanni, 2005). This increase in the protein content of soybean flour en-riched product has been attributed to the significant quality of protein in soybean seeds. Therefore, the high protein content of soy enriched “custard powder” would be of nutritional importance in most developing countries like Nigeria where the cost of obtaining high protein food is high.
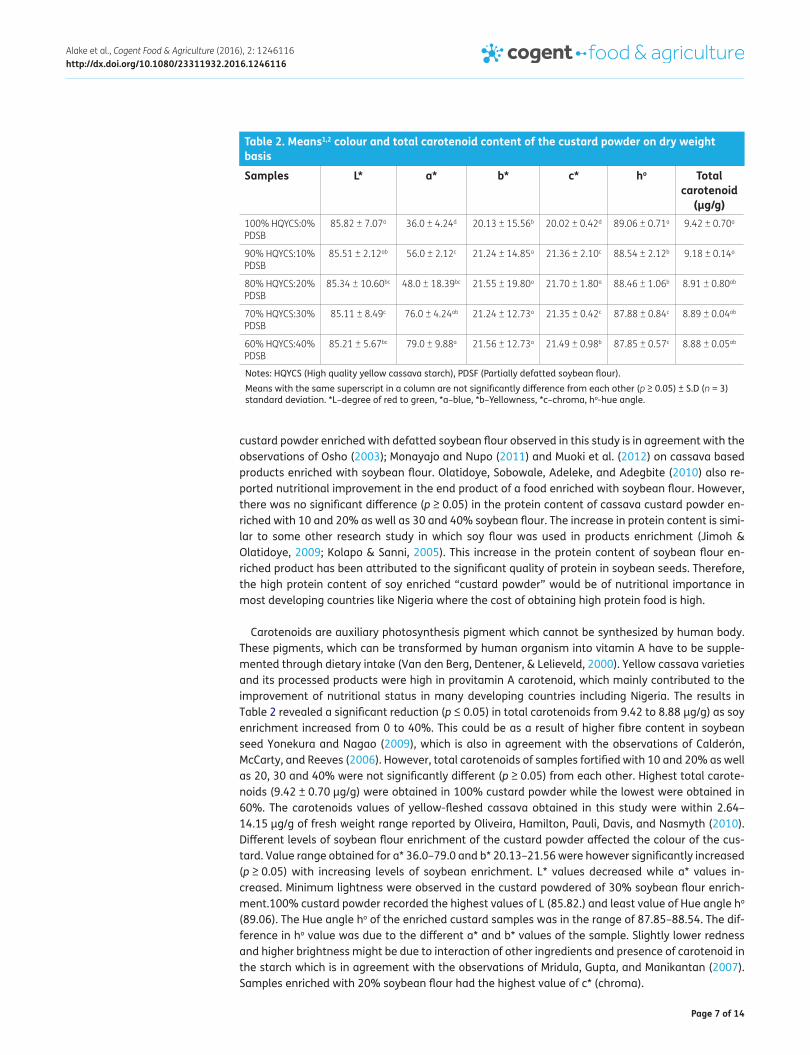
Carotenoids are auxiliary photosynthesis pigment which cannot be synthesized by human body. These pigments, which can be transformed by human organism into vitamin A have to be supple-mented through dietary intake (Van den Berg, Dentener, & Lelieveld, 2000). Yellow cassava varieties and its processed products were high in provitamin A carotenoid, which mainly contributed to the improvement of nutritional status in many developing countries including Nigeria. The results in Table 2 revealed a significant reduction (p ≤ 0.05) in total carotenoids from 9.42 to 8.88 μg/g) as soy enrichment increased from 0 to 40%. This could be as a result of higher fibre content in soybean seed Yonekura and Nagao (2009), which is also in agreement with the observations of Calderón, McCarty, and Reeves (2006). However, total carotenoids of samples fortified with 10 and 20% as well as 20, 30 and 40% were not significantly different (p ≥ 0.05) from each other. Highest total carote-noids (9.42 ± 0.70 μg/g) were obtained in 100% custard powder while the lowest were obtained in 60%. The carotenoids values of yellow-fleshed cassava obtained in this study were within 2.64–14.15 μg/g of fresh weight range reported by Oliveira, Hamilton, Pauli, Davis, and Nasmyth (2010). Different levels of soybean flour enrichment of the custard powder affected the colour of the cus-tard. Value range obtained for a* 36.0–79.0 and b* 20.13–21.56 were however significantly increased (p ≥ 0.05) with increasing levels of soybean enrichment. L* values decreased while a* values in-creased. Minimum lightness were observed in the custard powdered of 30% soybean flour enrich-ment.100% custard powder recorded the highest values of L (85.82.) and least value of Hue angle ho (89.06). The Hue angle ho of the enriched custard samples was in the range of 87.85–88.54. The dif-ference in ho value was due to the different a* and b* values of the sample. Slightly lower redness and higher brightness might be due to interaction of other ingredients and presence of carotenoid in the starch which is in agreement with the observations of Mridula, Gupta, and Manikantan (2007). Samples enriched with 20% soybean flour had the highest value of c* (chroma).
Table 2. Means1,2 colour and total carotenoid content of the custard powder on dry weight basis
Notes: HQYCS (High quality yellow cassava starch), PDSF (Partially defatted soybean flour). Means with the same superscript in a column are not significantly difference from each other (p ≥ 0.05) ± S.D (n = 3) standard deviation. *L–degree of red to green, *a–blue, *b–Yellowness, *c–chroma, ho-hue angle.
Samples L* a* b* c* ho Total carotenoid
(μg/g)100% HQYCS:0% PDSB
85.82 ± 7.07a 36.0 ± 4.24d 20.13 ± 15.56b 20.02 ± 0.42d 89.06 ± 0.71a 9.42 ± 0.70a
90% HQYCS:10% PDSB
85.51 ± 2.12ab 56.0 ± 2.12c 21.24 ± 14.85a 21.36 ± 2.10c 88.54 ± 2.12b 9.18 ± 0.14a
80% HQYCS:20% PDSB
85.34 ± 10.60bc 48.0 ± 18.39bc 21.55 ± 19.80a 21.70 ± 1.80a 88.46 ± 1.06b 8.91 ± 0.80ab
70% HQYCS:30% PDSB
85.11 ± 8.49c 76.0 ± 4.24ab 21.24 ± 12.73a 21.35 ± 0.42c 87.88 ± 0.84c 8.89 ± 0.04ab
60% HQYCS:40% PDSB
85.21 ± 5.67bc 79.0 ± 9.88a 21.56 ± 12.73a 21.49 ± 0.98b 87.85 ± 0.57c 8.88 ± 0.05ab
Page 8 of 14
Alake et al., Cogent Food & Agriculture (2016), 2: 1246116http://dx.doi.org/10.1080/23311932.2016.1246116
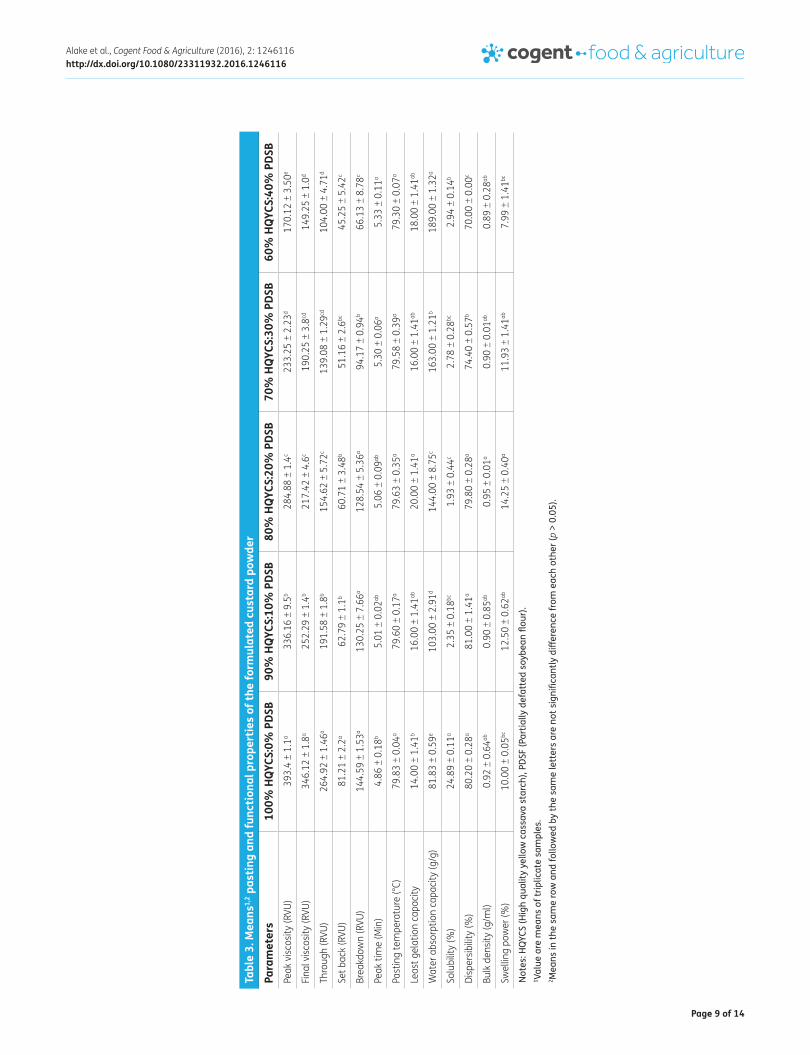
3.2. Pasting properties of yellow-fleshed cassava custard powderThe pasting properties of starch depend on the amylose content of the flour along with the amount of non- starchy components (protein and fat) and processing techniques (Onitilo, Sanni, Daniel, Maziyadixon, & Dixon, 2007). Table 3 presented the effect of soy flour enrichment on the pasting and functional properties of custard powder. The result revealed that the peak viscosity, final viscosity, trough and set back among the enrichment levels reduced significantly (p ≤ 0.05) from (393.47 to 170 RVU, 346.12 to 149.25 RVU, 264.92 to 104 RVU, 81.21 to 45.25 RVU, respectively). This may be attributed to the limited starch content of the soybean seeds therefore the physical reduction of starch available in the continuous phase of the sample may have reduced the resulting viscosity. Tan and Corke (2002) reported that protein content is negatively correlated with peak viscosity and hot paste viscosity. The final viscosities as well as the trough were also reduced as soybean enrichment increased which is in agreement with findings of Abioye, Ade-Omowaye, Babarinde, and Adesigbin (2011). Peak time is the time at which the peak viscosity occurs Adebowale, Olu-Owolabi, Olawumi, and Lawal (2004). Highest peak time values of 5.30 ± 0.06 and 5.33 ± 0.11 min were obtained in custard enriched with 30 and 40% soybean respectively. Breakdown viscosity decreased significantly (p ≤ 0.05) from 128.54 to 144.59 RVU, as soybean inclusion in the custard increased from 0 to 10%. Setback is the difference between the final viscosity and the paste viscosity or trough (Sanni, Adebowale, Filani, Oyewole, & Westby, 2006). It is the measure of stability of a paste after cooking. It is the phase where the mixture’s reassociation between the starches molecules (during cooling) occurs to a greater or lesser degree. It, therefore, affect retro gradation or re-ordering of the starch molecules Sanni et al. (2006). Setback also reflects the retro gradation tendency of starch, which inhibits the increase in the minimum viscosity upon cooling Zaidul, Yamauchi, Kim, Hashimoto, and Noda (2007). The values obtained for setback of soybean enriched cassava custard were higher than those reported by Awoyale, Sanni, Shittu, and Adegunwa (2016) who reported that lower setback viscosity during the cooling of custard indicates higher resistance to retrogradation. The high set-back viscosity could be an indication that the texture of such gruel may not be stable and might undergo syneresis faster (Maziya-Dixon, Sanni, Adebowale, Onabanjo, & Dixon, 2005). Shimels, Meaza, and Rakshit (2006) reported that final viscosity is used to indicate the ability of starch to form various paste or gel after cooling and that less stability of starch paste is commonly accompanied with high value of breakdown. This implies that samples without soybean fortification will be less stable after cooling compared to fortified samples. Peak viscosity is often correlated with the final product quality. It also provides an indication of the viscous load likely to be encountered during mixing (Maziya-Dixon, et al., 2005). Pasting temperature is the temperature where the viscosity first increases by at least 2 RVU over a 20 sec period. It gives an indication of temperature required to cook the flour beyond its gelatinization points. The effect of soy flour enrichment was not significant (p ≥ 0.05) on the pasting temperature. The present research shows that all the samples can be cooked beyond their gelatinization stage at almost the same temperature. Breakdown viscosity is regarded as the measure of the degree of disintegration of granules or paste stability during the holding period of viscosity test (Newport Scientific, 1995). This fact had also been established by Adebowale, Olu-Owolabi, Olayinka, and Olajide (2005) that the lower the breakdown viscosity, the higher the paste stability. High value of breakdown is associated with high peak viscosity, which in turn is related to the degree of swelling of the starch granules during heating Ragaee and Abdel-Aal (2006). Adebowale et al. (2005) reported that the higher the breakdown viscosity, the lower the abil-ity of the sample to withstand heating and shear stress during cooking. The observation of this study therefore suggests that higher level of soy flour inclusion in cassava based custard increases the ability of the custard to withstand heating and shear stress.
3.3. Functional propertiesFunctional properties are referred to as those physical and chemical properties that influence the behaviour of proteins in food systems during processing, storage, cooking and consumption (Mahajan & Dua, 2002). The Least gelation concentration (LGC) of the formulated custard sample significantly increased (p < 0.05) from 14.0 to 20.0 ± 1.41 as soybean enrichment increased from 0 to 20%. The increase in the least gelation concentration of soybean-enriched custard powder ob-served in this study was in agreement with the findings of Lorena, Pablo, Ribotta, León, and Gabriela
Page 9 of 14
Alake et al., Cogent Food & Agriculture (2016), 2: 1246116http://dx.doi.org/10.1080/23311932.2016.1246116
Tabl
e 3.
Mea
ns1,
2 pas
ting
and
func
tiona
l pro
pert
ies
of th
e fo
rmul
ated
cus
tard
pow
der
Not
es: H
QYC
S (H
igh
qual
ity y
ello
w c
assa
va s
tarc
h), P
DSF
(Par
tially
def
atte
d so
ybea
n flo
ur).
1 Val
ue a
re m
eans
of t
riplic
ate
sam
ples
.2 M
eans
in th
e sa
me
row
and
follo
wed
by
the
sam
e le
tter
s ar
e no
t sig
nific
antly
diff
eren
ce fr
om e
ach
othe
r (p
> 0.
05).
Para
met
ers
100%
HQY
CS:0
% P
DSB
90%
HQY
CS:1
0% P
DSB
80%
HQY
CS:2
0% P
DSB
70%
HQY
CS:3
0% P
DSB
60%
HQY
CS:4
0% P
DSB
Peak
visc
osity
(RVU
)39
3.4
± 1.
1a33
6.16
± 9
.5b
284.
88 ±
1.4
c23
3.25
± 2
.23d
170.
12 ±
3.5
0e
Final
visc
osity
(RVU
)34
6.12
± 1
.8a
252.
29 ±
1.4
b21
7.42
± 4
.6c
190.
25 ±
3.8
cd14
9.25
± 1
.0d
Thro
ugh
(RVU
)26
4.92
± 1
.46a
191.
58 ±
1.8
b15
4.62
± 5
.72c
139.
08 ±
1.2
9cd10
4.00
± 4
.71d
Set b
ack
(RVU
)81
.21
± 2.
2a62
.79
± 1.
1b60
.71
± 3.
48b
51.1
6 ±
2.6bc
45.2
5 ±
5.42
c
Brea
kdow
n (R
VU)
144.
59 ±
1.5
3a13
0.25
± 7
.66a
128.
54 ±
5.3
6a94
.17
± 0.
94b
66.1
3 ±
8.78
c
Peak
tim
e (M
in)
4.86
± 0
.18b
5.01
± 0
.02ab
5.06
± 0
.09ab
5.30
± 0
.06a
5.33
± 0
.11a
Past
ing
tem
pera
ture
(°C)
79.8
3 ±
0.04
a79
.60
± 0.
17a
79.6
3 ±
0.35
a79
.58
± 0.
39a
79.3
0 ±
0.07
a
Leas
t gel
atio
n ca
paci
ty14
.00
± 1.
41b
16.0
0 ±
1.41
ab20
.00
± 1.
41a
16.0
0 ±
1.41
ab18
.00
± 1.
41ab
Wat
er a
bsor
ptio
n ca
paci
ty (g
/g)
81.8
3 ±
0.59
e10
3.00
± 2
.91d
144.
00 ±
8.7
5c16
3.00
± 1
.21b
189.
00 ±
1.3
2a
Solu
bilit
y (%
)24
.89
± 0.
11a
2.35
± 0
.18bc
1.93
± 0
.44c
2.78
± 0
.28bc
2.94
± 0
.14b
Disp
ersib
ility
(%)
80.2
0 ±
0.28
a81
.00
± 1.
41a
79.8
0 ±
0.28
a74
.40
± 0.
57b
70.0
0 ±
0.00
c
Bulk
den
sity
(g/m
l)0.
92 ±
0.6
4ab0.
90 ±
0.8
5ab0.
95 ±
0.0
1a0.
90 ±
0.0
1ab0.
89 ±
0.2
8ab
Swel
ling
pow
er (%
)10
.00
± 0.
05bc
12.5
0 ±
0.62
ab14
.25
± 0.
40a
11.9
3 ±
1.41
ab7.
99 ±
1.4
1bc
Page 10 of 14
Alake et al., Cogent Food & Agriculture (2016), 2: 1246116http://dx.doi.org/10.1080/23311932.2016.1246116
(2012) who reported a modification in the starch gelatinization enthalpy of a product as a results of soybean flour incorporation and this increase in LGC may be attributed to the protein concentration of the soybean seed (Iwe, 2003). This also means that the formulated product has increased capabil-ity to provide structural matrix for holding water, flavours, sugars and food ingredients, an attribute of practical importance in the development of new products (Aremu, Olonisakin, Atolaye, & Ogbu, 2006). The water absorption capacity (WAC) of the custard sample increased significantly (p ≤ 0.05) with range between 81.83 and 189% respectively. The increased in inclusion level of defatted soy-bean flour which resulted in increase in protein content, leads to high water binding capacity which improves the reconstitution and textural ability obtainable from the custard (Abioye et al., 2011; Adebowale, Sanni, & Oladapo, 2008). Thus, this observation suggests that cassava starch-soybean custard powder could be useful in soup formulations and may be desirable for making thinner gruels Sandhu, Gao, Cianzio, and Bhattacharyya (2004). Solubility of the custard sample decreased signifi-cantly (p ≤ 0.05) as soybean inclusion increased from 10 to 40%. The range of values obtained for solubility index of the enriched cassava custard powder was lower than those reported by (Baafi & Safo-Kantanka, 2007). This observation may be explained based on the principles that there is an inverse relationship between proteins that contain high non-polar patches (residues) and solubility. However, a significantly difference (p < 0.05) was observed between 30 and 40%. There was no sig-nificant difference (p > 0.05) in the dispersibility of 0–20% soybean inclusion). However, a signifi-cantly difference (p < 0.05) was observed between 30 and 40%. Bulk density is a measure of heaviness of flour Adejuyitan, Otunola, Akande, Bolarinwa, and Oladokun (2009) and an important parameter that determines the ease of handling during transportation and processing Shittu, Lasekan, Sanni, and Oladosu (2001) as well as suitability for infant food formulations. Bulk density of samples enriched with 10, 30 and 40% defatted soy were not significantly different (p > 0.05) from each other. The reduction in bulk density as a result of enrichment observed in this study is similar to the observations of Onimawo, Nmerole, Idoko, and Akubor (2003) and Elkhalifa, Schiffler, and Bernhardt (2005). The low values of bulk densities of soy flour fortified custard may suggest its suit-ability for high nutrient density and desirability for infant food preparation Nelson-Quartey, Amagloh, Oduro, and Ellis (2007). Granule swelling capacity plays an important role in the rheological behav-iour of starch suspensions. When starch granules are heated with sufficient water, the crystalline structure of starch is disrupted, which causes increased granule swelling Onitilo et al. (2007) and Huang, Wang, and Yu (2009). Swelling power was significantly increased (p < 0.05), as soy flour in-clusion increased from 10 to 20%. The swelling capacity of the custard powder decreased with in-creased fortification with soy flour in agreement with the observations of Abioye et al. (2011). The high swelling power of soy fortified custard (an important criterion for good quality) may suggests it’s applicability in noodle production McCormick, Panozzo, and Hong (1991). Thus, this observation suggests that cassava starch -soybean custard powder could be useful in soup formulations and may be desirable for making thinner gruels (Sandhu et al., 2004).
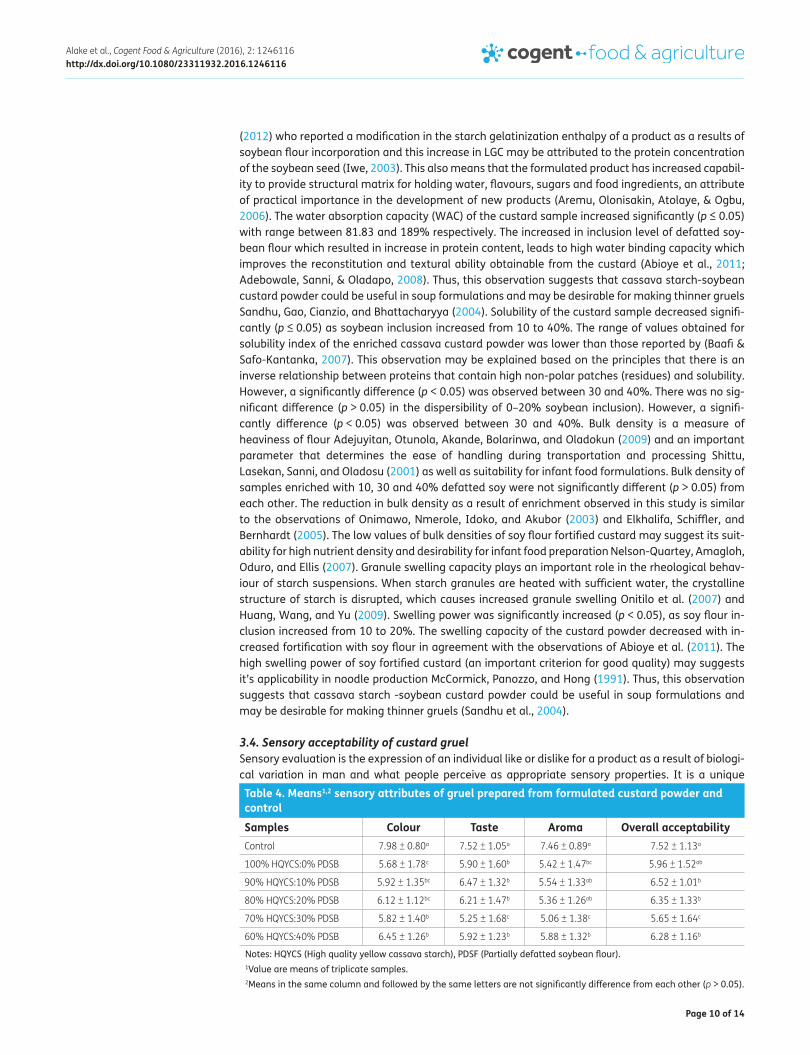
3.4. Sensory acceptability of custard gruelSensory evaluation is the expression of an individual like or dislike for a product as a result of biologi-cal variation in man and what people perceive as appropriate sensory properties. It is a unique Table 4. Means1,2 sensory attributes of gruel prepared from formulated custard powder and control
Notes: HQYCS (High quality yellow cassava starch), PDSF (Partially defatted soybean flour).1Value are means of triplicate samples.2Means in the same column and followed by the same letters are not significantly difference from each other (p > 0.05).
Samples Colour Taste Aroma Overall acceptabilityControl 7.98 ± 0.80a 7.52 ± 1.05a 7.46 ± 0.89a 7.52 ± 1.13a
100% HQYCS:0% PDSB 5.68 ± 1.78c 5.90 ± 1.60b 5.42 ± 1.47bc 5.96 ± 1.52ab
90% HQYCS:10% PDSB 5.92 ± 1.35bc 6.47 ± 1.32b 5.54 ± 1.33ab 6.52 ± 1.01b
80% HQYCS:20% PDSB 6.12 ± 1.12bc 6.21 ± 1.47b 5.36 ± 1.26ab 6.35 ± 1.33b
70% HQYCS:30% PDSB 5.82 ± 1.40b 5.25 ± 1.68c 5.06 ± 1.38c 5.65 ± 1.64c
60% HQYCS:40% PDSB 6.45 ± 1.26b 5.92 ± 1.23b 5.88 ± 1.32b 6.28 ± 1.16b
Page 11 of 14
Alake et al., Cogent Food & Agriculture (2016), 2: 1246116http://dx.doi.org/10.1080/23311932.2016.1246116
Tabl
e 5.
Cor
rela
tion
betw
een
func
tiona
l and
pas
ting
prop
ertie
s of
the
form
ulat
ed c
usta
rd p
owde
r
Not
es: W
AC–w
ater
abs
orpt
ion
capa
city
, SP–
swel
ling
pow
er, S
OL–
solu
bilit
y, DI
S–di
sper
sibi
lity,
BD–b
ulk
dens
ity, P
V–pe
ak
visc
osity
, BKD
–bre
akdo
wn,
FV–
final
vis
cosi
ty, S
TB–s
etba
ck, P
T–pa
stin
g tim
e, P
AT–p
astin
g te
mpe
ratu
re.
*Cor
rela
tion
is s
igni
fican
t at t
he 0
.05
leve
l (2-
taile
d).
**Co
rrel
atio
n is
sig
nific
ant a
t the
0.0
1 le
vel (
2-ta
iled)
.
WAC
SPSO
LDI
SBK
DPV
TRU
BDFV
STB
PTPA
TW
AC
SP−0
.719
**
SOL
0.57
9−0
.764
**
DIS
−0.9
80**
0.80
8**
−0.5
88
BKD
−0.8
13**
0.75
9**
−0.5
220.
841*
*
PV−0
.978
**0.
708*
*−0
.677
0.94
0**
0.80
5**
TRU
−0.9
55**
0.60
3−0
.625
0.89
1**
0.76
9**
0.98
6**
BD−0
.953
**0.
837*
*−0
.719
**0.
962*
*0.
813*
*0.
959*
*0.
897*
*
FV−0
.966
**0.
625
−0.6
200.
911*
*0.
785*
*0.
989*
*0.
998*
*0.
908*
*
STB
−0.9
76**
0.68
2−0
.581
0.95
4**
0.81
7**
0.97
3**
0.96
5**
0.92
3**
0.97
9**
PT−0
.878
**0.
684
−0.3
060.
918*
*0.
792*
*0.
768*
*0.
727*
*0.
787*
*0.
756*
*−0
.835
**
PAT
0.08
0−0
.031
0.12
9−0
.089
**0.
320
−0.0
71−0
.015
−0.1
66−0
.012
−0.0
12−0
.047
Page 12 of 14
Alake et al., Cogent Food & Agriculture (2016), 2: 1246116http://dx.doi.org/10.1080/23311932.2016.1246116
source of product information not easily obtained by other means. It measures the responses of people to products in terms of appearance, aroma, taste, texture, and after taste, without benefit of label, pricing, or other imagery (Iwe, 2003). The scores of the sensory evaluation performed on sam-ple of gruel prepared from commercial corn-based, cassava based and soybean flour fortified cas-sava custard powder are shown on Table 4. The results of the colour, taste and aroma ranges between 5.68–6.45, 5.90–6.47, 5.06–5.88 in the entire gruel sample. 40% having highest value of aroma. However, there was no significant difference (p > 0.05) between the colour of 30 and 40% enrichment. This may be due to the roasted soybean flour. It was also revealed that commercial corn based custard gruel had the best scores for colour, taste, aroma and overall acceptability (7.98, 7.52, 7.46 and 7.52, respectively) compared to all the other formulated.
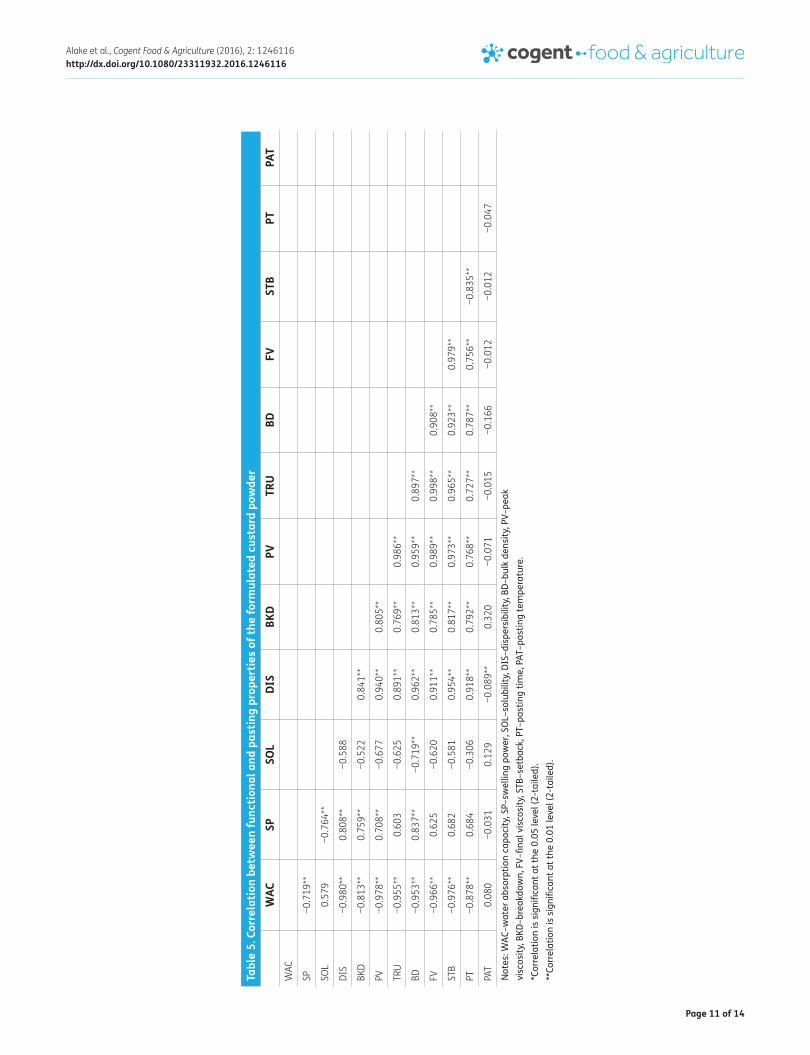
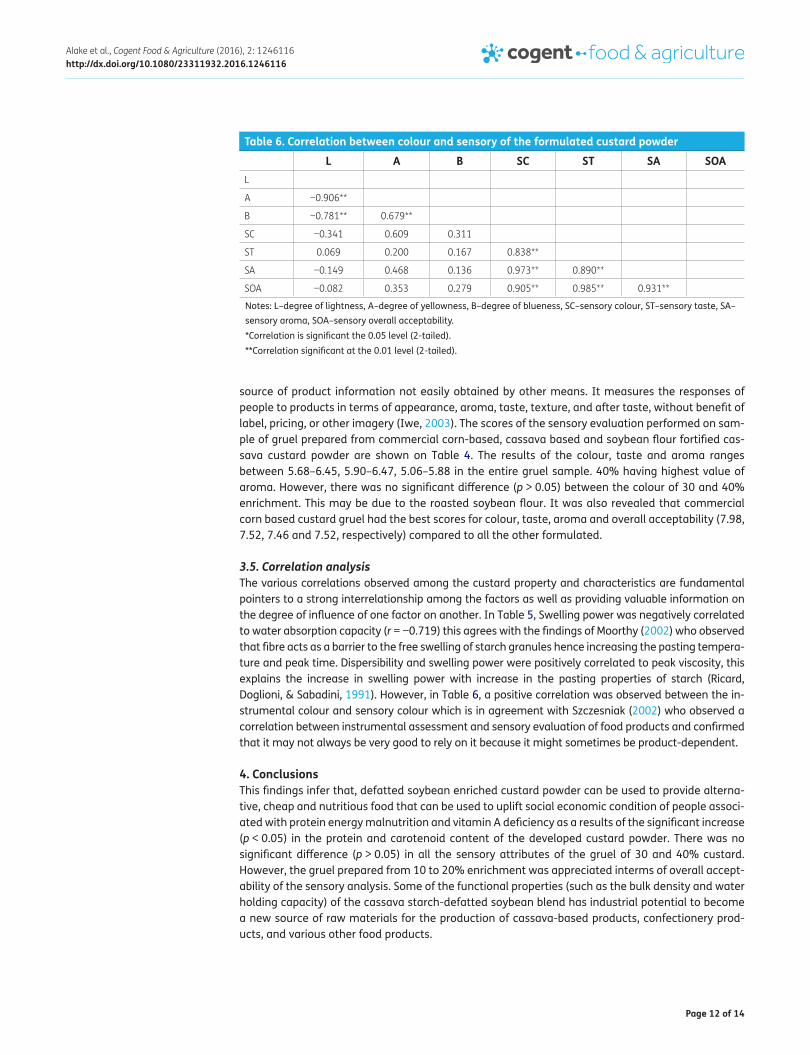
3.5. Correlation analysisThe various correlations observed among the custard property and characteristics are fundamental pointers to a strong interrelationship among the factors as well as providing valuable information on the degree of influence of one factor on another. In Table 5, Swelling power was negatively correlated to water absorption capacity (r = −0.719) this agrees with the findings of Moorthy (2002) who observed that fibre acts as a barrier to the free swelling of starch granules hence increasing the pasting tempera-ture and peak time. Dispersibility and swelling power were positively correlated to peak viscosity, this explains the increase in swelling power with increase in the pasting properties of starch (Ricard, Doglioni, & Sabadini, 1991). However, in Table 6, a positive correlation was observed between the in-strumental colour and sensory colour which is in agreement with Szczesniak (2002) who observed a correlation between instrumental assessment and sensory evaluation of food products and confirmed that it may not always be very good to rely on it because it might sometimes be product-dependent.
4. ConclusionsThis findings infer that, defatted soybean enriched custard powder can be used to provide alterna-tive, cheap and nutritious food that can be used to uplift social economic condition of people associ-ated with protein energy malnutrition and vitamin A deficiency as a results of the significant increase (p < 0.05) in the protein and carotenoid content of the developed custard powder. There was no significant difference (p > 0.05) in all the sensory attributes of the gruel of 30 and 40% custard. However, the gruel prepared from 10 to 20% enrichment was appreciated interms of overall accept-ability of the sensory analysis. Some of the functional properties (such as the bulk density and water holding capacity) of the cassava starch-defatted soybean blend has industrial potential to become a new source of raw materials for the production of cassava-based products, confectionery prod-ucts, and various other food products.
Table 6. Correlation between colour and sensory of the formulated custard powder
Notes: L–degree of lightness, A–degree of yellowness, B–degree of blueness, SC–sensory colour, ST–sensory taste, SA–sensory aroma, SOA–sensory overall acceptability.*Correlation is significant the 0.05 level (2-tailed).**Correlation significant at the 0.01 level (2-tailed).
L A B SC ST SA SOAL
A −0.906**
B −0.781** 0.679**
SC −0.341 0.609 0.311
ST 0.069 0.200 0.167 0.838**
SA −0.149 0.468 0.136 0.973** 0.890**
SOA −0.082 0.353 0.279 0.905** 0.985** 0.931**
Page 13 of 14
Alake et al., Cogent Food & Agriculture (2016), 2: 1246116http://dx.doi.org/10.1080/23311932.2016.1246116
FundingThe authors received no direct funding for this research.
Competing InterestThe authors declare no competing interest.
Author detailsO.O. Alake1
E-mails: [email protected], [email protected]. Babajide2
E-mail: [email protected]. Adebowale2
E-mail: [email protected]. Adebisi3
E-mail: [email protected] Department of Hospitality and Tourism, Federal University of
Agriculture, Abeokuta, Ogun, Nigeria.2 Department of Food Science and Technology, Federal
University of Agriculture, Abeokuta, Ogun, Nigeria.3 Department of Plant Breeding and Seed Technology, Federal
University of Agriculture, Abeokuta, Ogun, Nigeria.
Citation informationCite this article as: Evaluation of physico-chemical properties and sensory attributes of cassava enriched custard powder, O.O. Alake, J.M. Babajide, A.A. Adebowale & M.A. Adebisi, Cogent Food & Agriculture (2016), 2: 1246116.
ReferencesAbbas, B., El Tayeb, A. E., & Sulleiman, Y. R. (1992). Calotropis
procera: Feed potential for arid zones. Veterinary Record, 131, 132. http://dx.doi.org/10.1136/vr.131.6.132-a
Abioye, V. F., Ade-Omowaye, B. I., Babarinde, O. G. O., & Adesigbin, M. K. (2011). Chemical, physico-chemical and sensory properties of soy-plantain flour. African Journal of Food Science, 5, 176–180.
Adebowale, K. O., Olu-Owolabi, B. I., Olawumi, E. K., & Lawal, O. S. (2004). Functional properties of native, physically and chemically modified breadfruit (Artocarpus artilis) starch. Indian Crops and Products, 1, 343–351.
Adebowale, K. O., Olu-Owolabi, B. I., Olayinka, O. O., & Olajide, O. S. (2005). Effect of heat moist treatment and annealing on the physico chemical properties of red sorghum. African Journal of Biotechnology, 4, 928–933.
Adebowale, A. A., Sanni, S. A., & Oladapo, F. O. (2008). Chemical, functional and sensory properties of instant yam breadfruit flour. Nigeria Journal of Food Science, 26, 2–12.
Adejuyitan, J. A., Otunola, E. T., Akande, E. A., Bolarinwa, I. F., & Oladokun, F. M. (2009). Some properties of flour obtained from fermentation of tigernut (Cyperus esculentus) sourced from a market in Ogbomoso, Nigeria. African Journal of Food Science, 3, 51–055.
Akoja, S. S., & Mohammed, A. O. (2011). Evaluation of the proximate, pasting and sensory characteristics of cassava flour (Fufu) Fortified with Pigeon Pea Flour. Pakistan Journal of Nutrition, 10, 124–128.
Association of Official Analytical Chemist. (2005). Official methods of analysis international (18th ed.).
Aremu, M. O., Olonisakin, A., Atolaye, B. O., & Ogbu, C. F. (2006). Some nutritional and functional studies of Prosopis africana. Electronic Journal of Environmental, Agricultural and Food Chemistry, 5, 1640–1648.
Awoyale, W., Sanni, L. O. , Shittu, T. A., & Adegunwa, M. O. (2015). Effect of storage on the chemical composition, microbiological load, and sensory properties of cassava starch-based custard powder. Food Science & Nutrition, 3, 425–433. http://dx.doi.org/10.1002/fsn3.235
Awoyale, W., Sanni, L. O., Shittu, T. A., & Adegunwa, M. O. (2016). The pasting, chemical and sensory properties of biofortified cassava root starch-based custard powder. Journal of Food Measurement and Characterization, 9(4). doi:10.1007/s11694-016-9306-3
Baafi, E., & Safo-Kantanka, O. (2007). Effect of genotype, age and location on cassava flour yield and quality. Journal of Plant Science, 2, 607–612.
Beuchat, L. R. (1977). Functional and electrophoretic characteristics of succinylated peanut flour protein. Journal of Agricultural and Food Chemistry, 25, 258–261. http://dx.doi.org/10.1021/jf60210a044
Calderón, F. J., McCarty, G. W., & Reeves, J. B. (2006). Pyrolisis-MS and FT-IR analysis of fresh and decomposed dairy manure. Journal of Analytical and Applied Pyrolysis, 76, 14–23. http://dx.doi.org/10.1016/j.jaap.2005.06.009
Coffman, C. W. & Garcia, W. (1977). Functional properties and amino acid content of a protein isolated from mung bean flour. Journal of Food Technology, 12, 473–484.
Elkhalifa, A. O., Schiffler, B., & Bernhardt, R. (2005). Effect of fermentation on the functional properties of sorghum flour. Food Chemistry, 92, 1–5. http://dx.doi.org/10.1016/j.foodchem.2004.05.058
Falade, K. O., & Olugbuyi, A. O. (2010). Effects of maturity and drying method on the physico-chemical and reconstitution properties of plantain flour. International Journal of Food Science & Technology, 45, 170–178.
Ferreira, C. F., Alves, E., Pestana, K. N., Junghans, D. T., Kobayashi, A. K., Santos, V. J., … Fukuda, W. (2008). Molecular characterization of Cassava (Manihot esculenta Crantz) with yellow-orange roots for beta-carotene improvement. Crop Breeding and Applied Biotechnology, 8, 23–29. http://dx.doi.org/10.12702/1984-7033
Huang, M. F., Wang, H. Y., & Yu, J. G. (2009). Preparation and properties of green thermoplastic B. Saunders Company.
Iwe, M. O. (2003). The science and technology of soyabean (pp. 115–138). Enugu: Rejoint Communications Limited.
Jimoh, K. O., & Olatidoye, O. P. (2009). Evaluation of physico chemical and rheological characteristics of soybean fortified yam flour. Journal of Applied Bioscience, 13, 70706.
Kolapo, A. L., & Sanni, M. O. (2005). Processing and charactristics of soybean-fortified tapioca. Journal of Women in Technology Education, 4, 59–66.
Lorena, S., Pablo, D., Ribotta, E., León, A. E., & Gabriela, T. (2012). Influence of enzyme active and inactive soy flours on cassava and corn starch properties Conicet. Córdoba: Facultad de Ciencias Agropecuarias, Universidad Nacional de Córdoba.
Mahajan, A., & Dua, S. (2002). Salts and pH induced changes in functional properties of amaranth ( Amaranthus tricolor L.) seed meal. Cereal Chemistry, 79, 834–837. doi:10.1094/CCHEM.2002.79.6.834
Mayer, J. E., Pfeiffer, W. H., & Beyer, P. (2008). Biofortified crops to alleviate micronutrient malnutrition. Current Opinion in Plant Biology, 11, 166–170. http://dx.doi.org/10.1016/j.pbi.2008.01.007
Maziya-Dixon, B., Sanni, L. O., Adebowale, A. A., Onabanjo, O. O., & Dixon, A. G. O. (2005). Effect of variety and drying methods on proximate composition and pasting properties of high quality cassava flour from yellow cassava roots. In Proceedings of the African Crop Science Society Conference (pp. 5–9). Enttebe.
McCormick, K. M., Panozzo, J. F., & Hong, S. H. (1991). A swelling power test for selecting potential noodle quality wheats. Australian Journal of Agricultural Research, 42, 317–323. http://dx.doi.org/10.1071/AR9910317
Meilgaard, M., Civille, G. V., & Thomas Carr, B. (1999). Sensory evaluation techniques (3rd ed.). Boca Raton, FL: CRC Press. http://dx.doi.org/10.1201/9781439832271
Page 14 of 14
Alake et al., Cogent Food & Agriculture (2016), 2: 1246116http://dx.doi.org/10.1080/23311932.2016.1246116
© 2016 The Author(s). This open access article is distributed under a Creative Commons Attribution (CC-BY) 4.0 license.You are free to: Share — copy and redistribute the material in any medium or format Adapt — remix, transform, and build upon the material for any purpose, even commercially.The licensor cannot revoke these freedoms as long as you follow the license terms.
Under the following terms:Attribution — You must give appropriate credit, provide a link to the license, and indicate if changes were made. You may do so in any reasonable manner, but not in any way that suggests the licensor endorses you or your use. No additional restrictions You may not apply legal terms or technological measures that legally restrict others from doing anything the license permits.
Monayajo, S. A., & Nupo, S. S. (2011). Nutrient composition and acceptability of “Pupuru” fortified with soy flour. Journal of Agriculture and Veterinary Sciences, 3, 346–423.
Moorthy, S. (2002). Tuber crop starches (Tech Bulletin No. 18). Trivandrum: CTCRI.
Mridula, D., Gupta, R. K., & Manikantan, M. R. (2007). Effect of incorporation of sorghum flour to wheat flour on quality of biscuits fortified with defatted soy flour. Journal of Food Science Technology, 2, 428–434.
Muoki, P. N., Kock, L. H., & Emmambux, M. N. (2012). Effect of soy flour addition and heat-processing method on nutritional quality and consumer acceptability of cassava complementary porridges. Journal of Food Agriculture Science, 92, 1771–1779.
Nelson-Quartey, F. C., Amagloh, F. K., Oduro, I., & Ellis, W. O. (2007). Formulation of an infant food based on breadfruit (Artocarpus altilis) and breadnut (Artocarpus camansi). Acta Horticulturae, 757, 212–224.
Newport Scientific. (1995). Applications manual for the rapid viscoTM analyzer using thermocline for windows (pp. 2–26). Warriewood: Newport Scientific Pty.
Okoye, J. I., Nkwocha, A. C. 1., Agbo, A. O., Nascimento, P., Fernandes, N., Mauro, M., & Kimura, M. (2007). Nutrien composition and acceptability of soy-fortified custard. Science and Technology, 2, 37–44.
Oladele, A. K., & Aina, J. O. (2007). Chemical composition and functional properties of flour produced from two varieties of tigernut (Cyperus esculentus). African Journal of. Biotechnology, 6, 2473–2476. http://dx.doi.org/10.5897/AJB
Olatidoye, O. P., Sobowale, S. S., Adeleke, A. E., & Adegbite, S. A. (2010). Effect of soy-fortification on nutritional and physicochemical properties of cassava flour. International Journal of Food Science and Technology, 2, 85–97.
Oliveira, R. A., Hamilton, R. S., Pauli, A., Davis, I., & Nasmyth, K. (2010). Cohesin cleavage and Cdk inhibition trigger formation of daughter nuclei. Nature Cell Biology, 12, 185–192. http://dx.doi.org/10.1038/ncb2018
Onimawo, I. A., Nmerole, E. C., Idoko, P. I., & Akubor, P. I. (2003). Effects of fermentation on nutrient content and some functional properties of pumpkin seed (Telfariaoccidentalis). Plant Foods for Human Nutrition, 58(3), 1–9.
Onitilo, M. O., Sanni, L. O., Daniel, I., Maziyadixon, B., & Dixon, A. (2007). Physico-chemical and functional properties of native starches from cassava varieties in southwest Nigeria. Journals of Food Science and Agricultural Environment, 5, 108–114.
Osho, S. M. (2003). The processing and acceptability of a fortified cassava-based product (gari) with soybean. Journal of Food Science and Nutrition, 33, 278–283.
Oyewole, O. B., & Obieze, N. (1995). Processing and charcteristic of tapioca meal from cassava. Tropicl Science, 35, 401–404.
Ragaee, S., & Abdel-Aal, E. M. (2006). Pasting properties of starch and protein in selected cereals and quality of their food products. Food Chemistry, 95, 9–18. http://dx.doi.org/10.1016/j.foodchem.2004.12.012
Ricard, Y., Doglioni, C., & Sabadini, R. (1991). Differential rotation between lithosphere and mantle: A consequence of lateral mantle viscosity variations. Journal of Geophysical Research, 96, 8407–8415. http://dx.doi.org/10.1029/91JB00204
Rodriguez-Amaya, D. B. (1999). A guide to carotenoid analysis in foods. Washington, DC: ILSI Press.
Sandhu, D., Gao, H., Cianzio, S., & Bhattacharyya, M. K. (2004). Deletion of a disease resistance nucleotide-binding-site leucine-rich- repeat-like sequence is associated with the loss of the phytophthora resistance gene Rps4 in soybean. Genetics, 168, 2157–2167. http://dx.doi.org/10.1534/genetics.104.032037
Sanni, L. O., Adebowale, A. A., Filani, T. A., Oyewole, O. B., & Westby, A. (2006). Quality of flash and rotary dried fufu flour. Journal of Food, Agriculture and Environment, 4, 74–78.
Shimels, A. E., Meaza, M., & Rakshit, S. (2006). Physico chemical properties, pasting behaviour and functional characteristics of flour and starches from improved Bean(Phaseoluus vulgaris L.). Varieties Grown in East Africa, CIGRE Journal, 8, 1–18.
Shittu, T. A., Lasekan, O. O., Sanni, L. O., & Oladosu, M. O. (2001). The effect of drying method son the functional and sensory characteristics of pupuru- a fermented cassava product. ASSET Series A, 1, 9–16.
Szczesniak, A. S. (2002). Texture is a sensory property. Food Quality and Preference, 13, 215–225. http://dx.doi.org/10.1016/S0950-3293(01)00039-8
Tan, Y., & Corke, H. (2002). Factor analysis of physicochemical properties of 63 rice varieties. Journal of the Science of Food and Agriculture, 82, 745–752. http://dx.doi.org/10.1002/(ISSN)1097-0010
Tanumihardjo, S. A. (2008). Food-based approaches for ensuring adequate vitamin A nutrition. Tapioca starch materials. Beijing Ligong Daxue Xuebao, 26, 549–552.
Van den Berg, A., Dentener, F., & Lelieveld, J. (2000). Modeling the chemistry of the marine boundary layer: Sulphate formation and the role of sea-salt aerosol particles. Journal of Geophysical Research, 105, 11671–11698.
Yonekura, L., & Nagao, A. (2009). Soluble fibers inhibit carotenoid micellization invitro and uptake by Caco-2 cells. Bioscience, Biotechnology, and Biochemistry, 73, 196–199.
Zaidul, I. S. M., Yamauchi, H., Kim, S. J., Hashimoto, N., & Noda, T. (2007). RVA study of mixtures of wheat flour and potato starches with different phosphorus contents. Food Chemistry, 102, 1105–1111. http://dx.doi.org/10.1016/j.foodchem.2006.06.056