Embed Size (px)
Citation preview

Physico-chemical and functional properties of sunflower proteins

Promotor: Prof.dr.ir. A.G.J. Voragen
hoogleraar in de levensmiddelenchemie Co-promotoren: Dr.ir. H. Gruppen
universitair hoofddocent bij de leerstoelgroep Levensmiddelenchemie Dr. J. M. Vereijken senior scientific researcher, Agrotechnology and Food Innovations B.V.
Promotiecommissie: Dr. J. Guéguen
INRA, Nantes, France
Dr. R.P. Happe TNO Nutrition and Food Research, Zeist.
Prof.dr. W. Norde Rijksuniversiteit Groningen/ Wageningen Universiteit
Prof.dr. R.J. Hamer Wageningen Universiteit
Physico-chemical and functional properties of
sunflower proteins
Sergio González Pérez
Proefschrift ter verkrijging van de graad van doctor
op gezag van de rector magnificus van Wageningen Universiteit,
Prof. dr. ir. L. Speelman in het openbaar te verdedigen op maandag 1 december 2003
des namiddags om te half twee in de Aula

ISBN: 90-5808-904-5 Printing: Ponsen & Looijen B.V., Wageningen Front cover: Sunflowers, 1888 (Oil on Canvas; 95 × 73 cm). Vincent van Gogh. (Courtesy of the Van Gogh Museum, Amsterdam)

To all those who do not have access to education and live under the dictatorship of
poverty and fear


Abstract Sergio González Pérez (2003). Physico-chemical and functional properties of sunflower proteins. Ph.D. thesis, Wageningen University, Wageningen, The Netherlands. Key words: Sunflower protein, Helianthus annuus, helianthinin, albumins, solubility,
structure, denaturation, pH, temperature, ionic strength, phenolic compounds, chlorogenic acid, foams, emulsions, functionality
The research described in this thesis deals with the relation between specific sunflower proteins, their structure and their functional properties as a function of extrinsic factors as pH, ionic strength and temperature.
Sunflower protein isolate (SI) devoid of chlorogenic acid (CGA), the main phenolic compound present, was obtained without denaturation of the proteins. Sunflower proteins were found to be composed of two main protein fractions: 2S albumins or sunflower albumins (SFAs) and helianthinin. Subsequently, these protein fractions were biochemically and structurally characterized under conditions relevant to food processing.
Depending on pH, ionic strength, temperature and protein concentration, helianthinin occurs in the 15-18S (high molecular weight aggregate), 11 S (hexamer), 7S (trimer) or 2-3S (monomer) form. Dissociation into 7S from 11S gradually increased with increasing pH from 5.8 to 9.0. Enhancing the ionic strength resulted in stabilization of the 11S form. Heating and lowering the pH resulted in dissociation into the monomeric form of helianthinin. The 11S and 7S form of helianthinin differ in their secondary structure, tertiary structure, and thermal stability. With respect to solubility as a function of pH, helianthinin shows a bell shaped curve with a minimum at approximately pH 5.0 at low ionic strength. At high ionic strength, helianthinin is almost insoluble at pH< 5.0.
The second main sunflower fraction, SFAs, revealed to be very stable against pH changes (pH 3.0 to 9.0) and heat treatment (up to 100 °C), and their solubility was only marginally affected by pH and ionic strength. The solubility of the SI as a function of pH seems to be dominated by that of helianthinin. Foam and emulsion properties of the sunflower isolate as well as those of purified helianthinin, SFAs and combinations thereof were studied at various pH values and ionic strengths, and after heat treatment. Sunflower proteins were shown to form stable emulsions, with the exception of SFAs at alkaline and neutral pH values. Increasing amount of SFAs impaired the emulsifying properties. Regarding foam properties, less foam could be formed from helianthinin than from SFAs, but foam prepared with helianthinin was more stable against Ostwald ripening and drainage than foam prepared with SFAs. Increasing amounts of SFAs had a positive effect on foam volume and a negative one on foam stability and drainage. It was found that treatments that increase conformational flexibility improve the emulsion and foam properties of sunflower proteins.

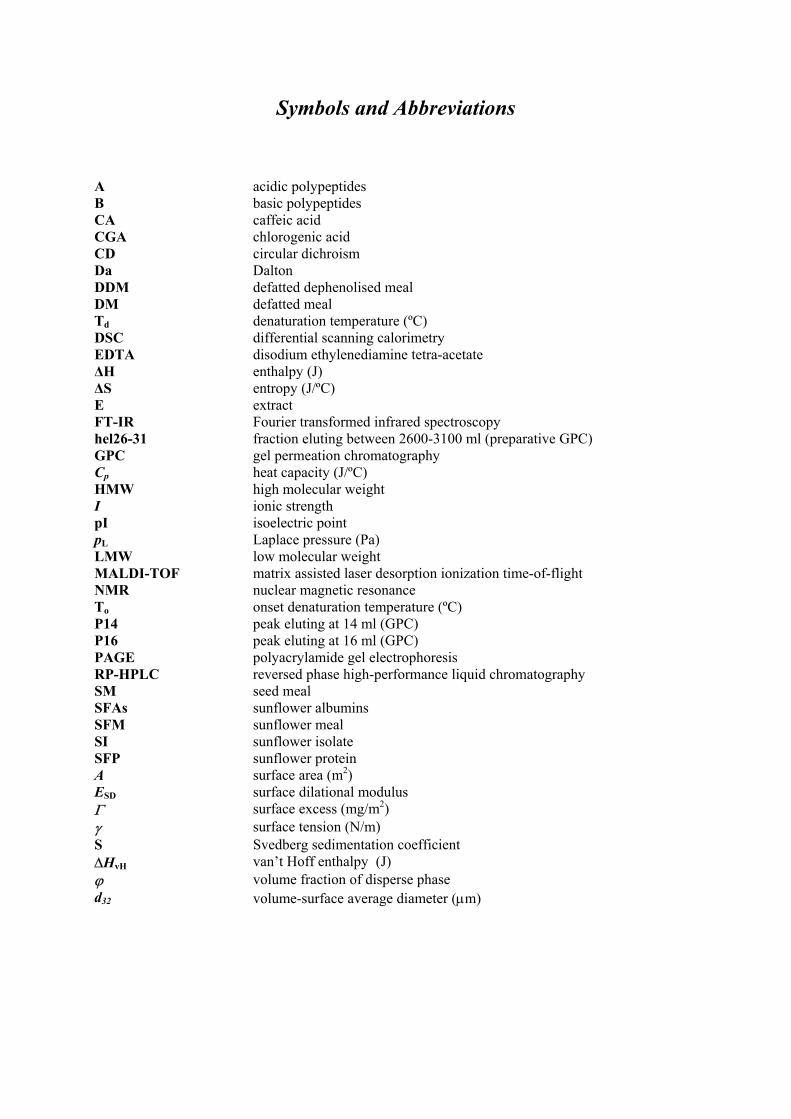
Symbols and Abbreviations
A acidic polypeptides B basic polypeptides CA caffeic acid CGA chlorogenic acid CD circular dichroism Da Dalton DDM defatted dephenolised meal DM defatted meal Td denaturation temperature (ºC) DSC differential scanning calorimetry EDTA disodium ethylenediamine tetra-acetate ∆H enthalpy (J) ∆S entropy (J/ºC) E extract FT-IR Fourier transformed infrared spectroscopy hel26-31 fraction eluting between 2600-3100 ml (preparative GPC) GPC gel permeation chromatography Cp heat capacity (J/ºC) HMW high molecular weight I ionic strength pI isoelectric point pL Laplace pressure (Pa) LMW low molecular weight MALDI-TOF matrix assisted laser desorption ionization time-of-flight NMR nuclear magnetic resonance To onset denaturation temperature (ºC) P14 peak eluting at 14 ml (GPC) P16 peak eluting at 16 ml (GPC) PAGE polyacrylamide gel electrophoresis RP-HPLC reversed phase high-performance liquid chromatography SM seed meal SFAs sunflower albumins SFM sunflower meal SI sunflower isolate SFP sunflower protein A surface area (m2) ESD surface dilational modulus Γ surface excess (mg/m2) γ surface tension (N/m) S Svedberg sedimentation coefficient ∆HvH van’t Hoff enthalpy (J) ϕ volume fraction of disperse phase d32 volume-surface average diameter (µm)

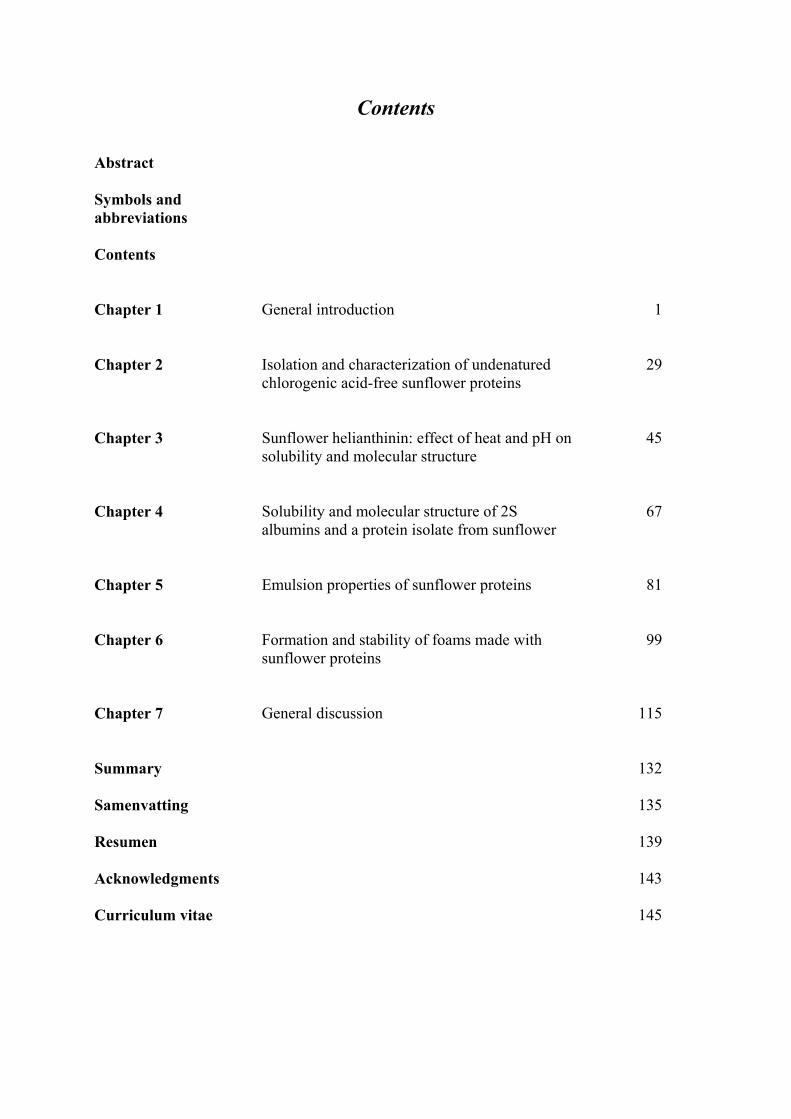
Contents Abstract Symbols and abbreviations
Contents Chapter 1 General introduction 1 Chapter 2 Isolation and characterization of undenatured
chlorogenic acid-free sunflower proteins 29
Chapter 3 Sunflower helianthinin: effect of heat and pH on
solubility and molecular structure 45
Chapter 4 Solubility and molecular structure of 2S
albumins and a protein isolate from sunflower 67
Chapter 5 Emulsion properties of sunflower proteins 81 Chapter 6 Formation and stability of foams made with
sunflower proteins 99
Chapter 7 General discussion 115 Summary 132 Samenvatting 135 Resumen 139 Acknowledgments 143 Curriculum vitae 145


Chapter 1
General Introduction

Chapter 1
Sunflower The cultivated sunflower (Helianthus annuus L.) is one of the 67 species in the genus Helianthus. It is a dicotyledonous plant and a member of the Compositae (Asteraceae) family and has a typical composite flower (Heiser, 1976). The inflorescence, or sunflower head, consists of 700 to 8000 flowers, depending on the cultivar (Lusas, 1985). Diploid, tetraploid and hexaploid species are known (Fick, 1989). The cultivated sunflower contains 34 chromosomes (2n = 34). The genus name for sunflower is derived from the Greek helios, meaning “sun” and anthos, meaning “flower”. The Spanish name for sunflower, “girasol”, and the French name, “tournesol”, literally mean “turn with the sun”, a trait exhibited by sunflower.
Sunflower was a common crop among American Indian tribes throughout North America. It was reported to be present in Arizona and New Mexico 3000 years BC (Fick, 1989). Some archeologists suggest that sunflower may have been domesticated before corn. The Spanish explorer Monardes brought the plant in Europe in 1569 and later tsar Peter the Great brought himself the plant from Europe to Russia. It was grown initially as an ornamental and later for food and medicinal purposes. Nowadays, two main types of sunflower are grown: (1) those for oilseed production and (2) non-oilseed or confectionery-type (Salunkhe et al., 1992). Less than 10 % of the total production consists of confectionary-type varieties that are consumed as snacks and pet foods. Originated in subtropical zones, it has been made highly adaptable through selective breeding, especially to temperate regions. Sunflower is adapted to a range of soil conditions, but grows best on well-drained, high water-holding capacity soils with a near neutral pH (6.5-7.5). In 1985 sunflower seed already was the fourth major oilseed produced in terms of tonnage (after soybeans, cottonseed, and peanuts) and the fourth major source of edible oil (after soybeans, cottonseed, and rapeseed) (Lusas, 1985). In 1999 over 28 million tonnes of sunflower were produced (FAO, 2001). Major producing countries are Argentina, EU countries, Russian Federation and other Eastern European countries. Sunflower seed composition The seed of sunflower is called an “achene” by botanists, and it is defined as a dry, simple, one-seeded fruit with the seed attached to the inner wall at only one point. The achene consists of a seed endosperm (often called kernel, dehulled seed or meats by oil millers) and an adhering pericarp (hull or shell), which is the wall of the fruit (Lusas, 1985). The proportion of hull and kernel in sunflower seed varies considerably (Salunkhe et al., 1992). The non-oilseed type sunflower contains more hull (47 %) than the oilseed-types (20-30 %). The composition of the seed is markedly affected by the
2

General introduction
Table 1: Average composition of sunflower seeds on dry basis. Component
Dehulled seeda-n (%) Whole seed b, f, j, l, m, n (%)
Proteins 20.4-40.0 10.0-27.1 Peptides, amino acids and other nonprotein nitrogen
1-13 -
Carbohydrates
4- 6 18-26
Lipids
47-65 34-55
Fatty acids Palmitic Stearic Arachidic Oleic Linoleic Linolenic
5-7 2-6
0.0-0.3 15-37 51-73 < 0.3
- - - - - - -
Tocopherol 0.07 - Carotenoids 0.01-0.02 - Vitamin B1 0.002 - Chlorogenic acid (CGA) 0.5-2.4 1.1-4.5 Quinic acid (QA) 0.12-0.25 - Caffeic acid (CA) 0.17-0.29 Total minerals 3-4 2-4 Potassium 0.67-0.75 - Phosphorus 0.60-0.94 - Sulfur 0.26-0.32 - Magnesium 0.35-0.41 - Calcium 0.08-010 - Sodium 0.02 -
Data deduced from own dataa, Earle et al (1968)b, Gheyasuddin et al (1970)c, Schwenke and Raab (1973)d, Sabir et al (1974b)e, Bau et al (1983)f, Berot and Briffaud (1983)g, Gassmann (1983)h, Madhusudhan et al (1986)i, Salunkhe et al (1992)j, www.franquart.fr (2001)k, Wan et al (1979)l, Robertson (1975)m, Lusas (1985)n
sunflower variety (Earle et al., 1968; Salunkhe et al., 1992). Table 1 shows the average composition of sunflower seed kernels and whole seeds. Oil and proteins are the main components of the sunflower seed. Sunflower kernels consists of about 20-40 % proteins. These values are strongly affected by the sunflower variety (Salunkhe et al., 1992). About 87-99 % of the seed nitrogen of sunflower is protein nitrogen. The other 1 to 13 % originates from peptides, amino acids or other nitrogenous substances. Carbohydrates are also an important component of sunflower seed. The ethanol-soluble sugars were reported as 4.4-6.3 % of the kernel weight in ten sunflower varieties (Pomenta and Burns, 1971). The concentrations of alkali-soluble hemicelluloses (arabinans and arabinogalactans) are 9 and 6 % (w/w) for sunflower flour and the hulls,
3

Chapter 1
respectively (Sabir et al., 1975). The hulls largely consist of lignin, pentosans, and cellulosic material (Robertson, 1975). Lipids are the major component of the sunflower seed, of which neutral triglycerides constitute the major lipid class. Other triglycerides include phospholipids and glycolipids, which constitute less than 4 % of the total lipids (Salunkhe et al., 1992). The turbidity of sunflower oil is usually attributed to the presence of wax that is mainly present in the hulls (83 %). Sunflower seeds contain also a substantial amount of minerals. However, they are often complexed with phytic acid, and therefore, biologically unavailable (Salunkhe et al., 1992).
Sunflower proteins
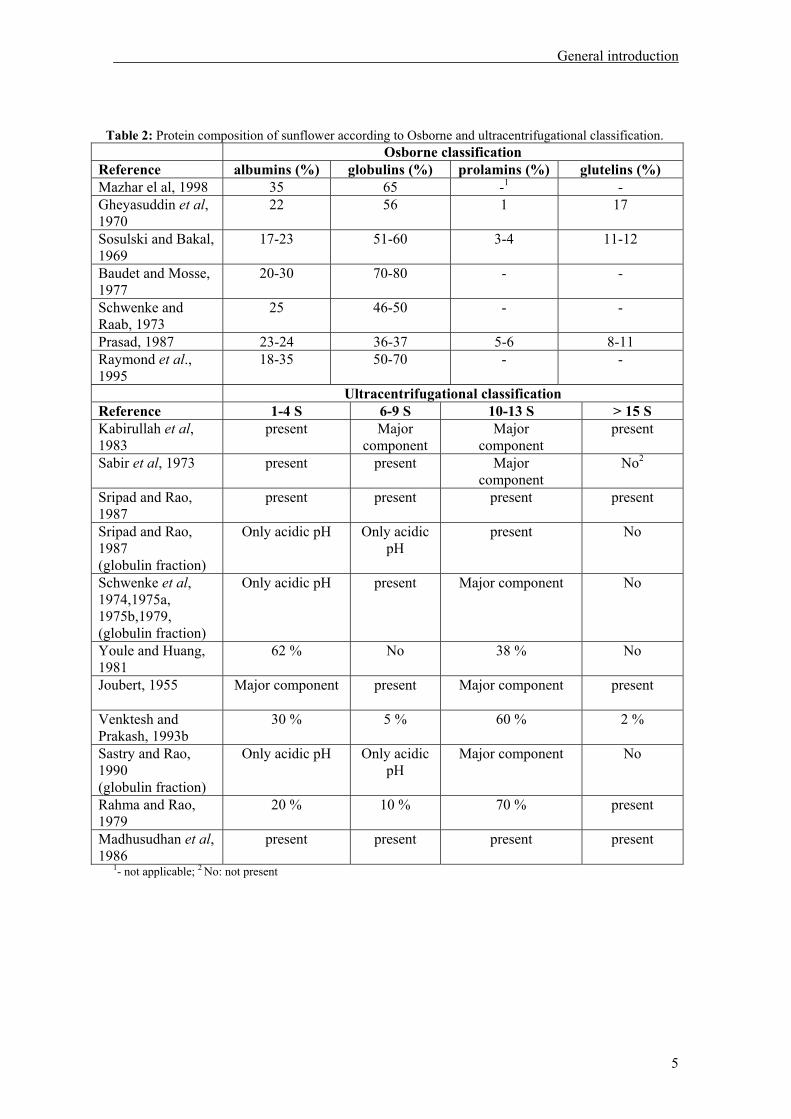
Sunflower proteins have been classified according to the classical definition of Osborne (Osborne, 1924) and to the Svedberg sedimentation coefficient. Table 2A shows the distribution of proteins over the different fractions according to the Osborne classification, as determined by several researchers. Globulins constitute most of the sunflower proteins. According to the definition of Osborne, albumins are soluble in water. Globulins are insoluble in water, but soluble in diluted salt solutions. From these salt solutions they can be precipitated by diluting with water or by dialysis against water. Prolamins are alcohol-soluble and glutelins are alkali soluble proteins. Albumins and globulins are referred as soluble proteins (Salunkhe et al., 1992). However, the solubility according to the Osborne fractionation depends on the conditions of the preliminary seed treatment and on the way the fractionation is performed (e.g. time of extraction, liquid to seed ratio, etc). Sunflower proteins were first characterized by Osborne and Campbell (Osborne and Campbell, 1897), who concluded that sunflower seed contained one major globular component. Later it was demonstrated that this globular component was heterogeneous and consists of two major classes of protein, the 11S globulin (or helianthinin) and the sunflower albumins (SFAs), also known as 2S albumins (Joubert, 1955; Youle and Huang, 1981; Dalgalarrondo et al., 1984; Mazhar et al., 1998; Anisimova et al., 2002). This nomenclature, based on sedimentation coefficient, is still being used throughout literature. It is, however, confusing since, in fact, the proportion of the proteins having different sedimentation coefficients, as well as these coefficients themselves, depend largely on conditions, such as the type of buffer, pH, ionic strength, etc. Literature data, therefore, show considerable variation in the sedimentation constants of the different protein fractions. Next to this, the variation can be explained by genetic and environmental factors (Salunkhe et al., 1992). Table 2B gives an overview of the distribution of proteins over the different fractions according to ultracentrifugational methods. From this table it can be deduced that 10-13S and 1-4S
4
General introduction
Table 2: Protein composition of sunflower according to Osborne and ultracentrifugational classification. Osborne classification Reference albumins (%) globulins (%) prolamins (%) glutelins (%) Mazhar el al, 1998 35 65 -1 - Gheyasuddin et al, 1970
22 56 1 17
Sosulski and Bakal, 1969
17-23 51-60 3-4 11-12
Baudet and Mosse, 1977
20-30 70-80 - -
Schwenke and Raab, 1973
25 46-50 - -
Prasad, 1987 23-24 36-37 5-6 8-11 Raymond et al., 1995
18-35 50-70 - -
Ultracentrifugational classification Reference 1-4 S 6-9 S 10-13 S > 15 S Kabirullah et al, 1983
present Major component
Major component
present
Sabir et al, 1973 present present Major component
No2
Sripad and Rao, 1987
present present present present
Sripad and Rao, 1987 (globulin fraction)
Only acidic pH Only acidic pH
present No
Schwenke et al, 1974,1975a, 1975b,1979, (globulin fraction)
Only acidic pH present Major component No
Youle and Huang, 1981
62 % No 38 % No
Joubert, 1955 Major component
present Major component
present
Venktesh and Prakash, 1993b
30 % 5 % 60 % 2 %
Sastry and Rao, 1990 (globulin fraction)
Only acidic pH Only acidic pH
Major component No
Rahma and Rao, 1979
20 % 10 % 70 % present
Madhusudhan et al, 1986
present present present present
1- not applicable; 2 No: not present
5

Chapter 1
are the major fractions, with also > 15S and 6-9S fractions present. Different from soybeans, the sunflower globulins do not contain any genetically independent 7S constituent (Youle and Huang, 1981; Gassmann, 1983; Anisimova and Gavrilyuk, 1990; Lakemond, 2001). Nevertheless, various amounts of proteins with Svedberg sedimentation coefficient of 7S have been detected (Sabir et al., 1973; Rahma and Rao, 1979; Kabirullah and Wills, 1983). These 7S constituents seem to be dissociation products of the 11S globulins as it has been observed for soy glycinin (Schwenke et al., 1974; Schwenke et al., 1979; Gassmann, 1983; Lakemond et al., 2000). Besides these main constituents, also a minor amount of a high molecular weight protein fraction with a 15-18 S sedimentation coefficient has been detected (Joubert, 1955; Rahma and Rao, 1979; Schwenke et al., 1979; Madhusudhan et al., 1986; Sripad and Rao, 1987; Venktesh and Prakash, 1993b). This fraction has been described as an aggregate of 11S or/and 7S constituents. The existence of such aggregate has also been reported for other oilseeds and legumes (Prakash and Rao, 1986; Guéguen et al., 1988). Despite the differences in sunflower protein classification found in literature, it can be concluded that helianthinin and SFAs are the two major protein fractions in sunflower seeds. Helianthinin Helianthinin has been reported to be present as a globular oligomeric protein with a molecular weight (MW) of 300-350 kDa (Sabir et al., 1973; Schwenke et al., 1979). However, Dalgalarrondo and co-workers (Dalgalarrondo et al., 1984) found also minor globulin fractions with masses about 190 kDa and 440 kDa, besides the major component of 300 kDa. Helianthinin belongs to the cupin superfamily that was identified by Dunwell in 1998 on the basis of a conserved domain comprising a six-stranded beta barrel structure (Dunwell, 1998). It was given the name cupin (from the Latin word cupa, meaning "small barrel"). The cupin superfamily of proteins is among the most functionally diverse of any described to date, comprising both enzymatic and non-enzymatic members (Aravind and Koonin Eugeney, 1999) and includes proteins that are found in all three kingdoms of life: Archaea, Eubacteria, and Eukaryota (Khuri et al., 2001). Among other proteins, this superfamily contains the 11S and 7S seed storage proteins. The 11S seed proteins are not glycosylated and form hexameric structures (Shotwell et al., 1988). Members of the 11S family include pea and broad bean legumins, rape cruciferin, rice glutelins, cotton β-globulins, soybean glycinins, pumpkin 11S globulin, oat globulin, sunflower helianthinin, etc. Quaternary structure studies by electron microscopy and small angle X-ray scattering indicate that helianthinin consists of an arrangement of six spherical subunits into a trigonal antiprism with a maximum dimension of 11 nm (Reichelt et al., 1980; Plietz et al., 1983). As in other 11S seed proteins, each subunit is post-translationally processed to give an acidic and a basic polypeptide linked by a single disulphide bond.
6

General introduction
Because there are several genetic variants of the 11S globulin subunit, there are groups of basic and acidic polypeptides, ranging in molecular weight from about 21 to 27 kDa and 32 to 44 kDa, respectively (Dalgalarrondo et al., 1984; Dalgalarrondo et al., 1985). The available gene sequence of one sunflower globulin subunit (Helianthinin G3 or HAG3) indicates that this particular subunit consists of an acidic chain of 285 amino acids (32643 Da) and basic chain of 188 amino acids (20981 Da) linked by a disulphide bond (103-312) (Vonder Haar et al., 1988; Swiss-prot, p19084). In addition to the presence of multiple subunits within a single genotype, there are also differences in the SDS-PAGE patterns of helianthinin components between different cultivars (Anisimova et al., 1991a; Anisimova et al., 1991b; Raymond et al., 1994; Raymond et al., 1995). Sunflower albumins (SFAs) Albumin seed proteins with sedimentation coefficients of approximately 2S have been reported to account for 20 to 60 % of the total proteins in seed of dicotyledonous plants (Youle and Huang, 1981). SFAs have molecular weights ranging from 10-18 kDa (Kortt and Caldwell, 1990; Anisimova et al., 1995). Contrary to 2S seed albumins from other species (Brazil nut, rapeseed, etc) that consist of two chains linked by disulfide bonds, SFAs consist of a single polypeptide chain (Allen et al., 1987; Kortt et al., 1991; Anisimova et al., 1995; Shewry and Pandya, 1999). SFAs are polymorphic and 8 to 13 individual SFA proteins have been separated by reversed-phase high-performance liquid-chromatography (RP-HPLC) and SDS-PAGE. However, the total number of components may be larger (Kortt and Caldwell, 1990; Anisimova et al., 1995). The levels at which these components are present vary widely between genotypes (Anisimova et al., 1995; Anisimova et al., 2002). The amino acid sequences of 2 sunflower albumins are currently available: 1) 2S albumin storage protein (HAG5) consisting of 134 amino acids, having a MW of 15 777 Da and a theoretical isoelectric point (pI) of 8.69; and 2) a methionine-rich 2S protein consisting of 103 amino acids, having a MW of 12133 Da and theoretical pI of 5.91 (Allen et al., 1987; Kortt et al., 1991; Swiss-prot, p15461; Swiss-prot, p23110). The latter is called SFA 8 based on its order of elution on RP-HPLC (Kortt and Caldwell, 1990) and contains an unusually high proportion of hydrophobic residues including 16 methionines and 8 cysteines. Molecular modeling studies predict that SFA8 has a compact structure with hydrophobic residues clustered to form a hydrophobic interface (Pandya et al., 2000). SFA 8 together with a protein called SFA 7 accounts for about 10-20 % of the total sunflower albumins (Anisimova et al., 2002). These two proteins are closely related, having similar masses (equal mobility on SDS-PAGE) and amino acid compositions, equal isoelectric points, and identical N-terminal amino acid sequences (Kortt and Caldwell, 1990; Anisimova et al., 2002; Burnett et al., 2002).
7

Chapter 1
Sunflower processing Sunflower oil represents about 9 % of the total oilseed world production (FAO, 1999). Sunflower oil is generally considered a premium oil compared to most other vegetable oils because of its light colour, bland flavour and high smoke point (Fick, 1989). Furthermore, sunflower oil contains a high proportion of unsaturated fatty acids (90 % linoleic and oleic acid), which are generally considered to be healthier than saturated fatty acids (Murphy, 1994). Figure 1 displays the main steps in the oil manufacture from sunflower seeds. Sunflower seeds are processed for oil extraction by two main methods. These are the full press method (screw press or expeller method) and the prepress solvent extraction. Prior to pressing, the seeds are usually partially (70 %) dehulled, ground, rolled and heated to 104 °C (Brueske, 1992; van Nieuwenhuyzen, 2003). Heating facilitates the disruption of tissues, coagulate the proteins (which facilitates oil separation), inactivates enzymes (such as phospholipases and lipases), increases the fluidity of the oil, eliminates moulds and bacteria and dries the seed to a suitable moisture content (Robertson, 1975). The prepress solvent extraction is the most common method for sunflower oil extraction. In this method, the seeds are screw-pressed to obtain oil and a cake, with an oil content of about 16 % (w/w). The cake obtained is subsequently granulated or flaked and the oil extracted with a solvent, usually hexane. The solvent is recovered from the meal by evaporation in a desolventiser-toaster. In addition to the main methods, the oil can also be obtained by direct solvent extraction. In this method, the kernels are conditioned, flaked and oil is extracted directly instead of expelled or screw-pressed (Salunkhe et al., 1992). Although the present study does not focus on dehulling, since the kernels were our starting material, it is necessary to emphasize the importance of this step for protein recovery and food applications (Gassmann, 1983). Sunflower proteins in food application Sunflower meal (SFM) is obtained as a by-product of the oil extraction process (Figure 1) and has a high protein content. It has been reported to be approximately 40 % when the seeds are mechanically-extracted, about 50 % when solvent extracted (Robertson and Russell, 1972) and 53 to 66 % for dehulled defatted meal (Bau et al., 1983). This high protein content makes SFM an attractive source for the isolation of proteins. The suitability for food applications of the SFM proteins depends mainly on the oil extraction method. Due to this process, the proteins may be denatured to a large extent, resulting in a SFM with high content of insoluble proteins (Parrado et al., 1993). Protein denaturation may occur during seed conditioning, expelling (up to 140 °C) and desolventising/toasting (van Nieuwenhuyzen, 2003). Therefore, the main outlet of sunflower proteins is in animal feed. Next to this use, there are some minor applications
8

General introduction
that use sunflower protein to fortify foods (especially meat and milk extenders, infant formulae, bakery and pasta products) (Fick, 1989). Sunflower proteins have been evaluated extensively as food ingredients (Sosulski, 1979; Lusas et al., 1982; Lusas, 1985). As compared to proteins from legumes and other oilseeds, sunflower proteins have been reported to contain no anti-nutritional components, such as protease inhibitors, and their amino acid composition complies with the FAO pattern, except for lysine (Gassmann, 1983).
Clean Sunflower Seed
(1420 kg)
Drying 9%Moisture(1370 kg)
Kemels(1000 kg)
Craking Flaking
Cooking-Drying (Pre-pressing)
PRESSING
Meal
Grinding
Cooling
PressureExtracted Meal
(640 kg)
Oil
Clarification
Crude oil(350 kg)
Refined Oil (330 kg)
GranulatingFlaking
SOLVENT EXTRACTION
Meal
Cooling
SolventExtracted Meal
(560 kg)
Crude Oil(425 kg)
Refined Oil(410 kg)
Shelling
Shells(100 kg)
Figure 1: Oil manufacture scheme (FAO, 1999).
Phenolic compounds of sunflower seed Sunflower seeds have a high content of phenolic compounds (Table 1), especially chlorogenic acid (CGA; Figure 2). A detailed description of the phenolic constituents of sunflower has been given by Sabir and co-workers (Sabir et al., 1974b) and Mikolajczak and co-workers (Mikolajczak et al., 1970). Osborne and Campbell (1897) already described the presence of an organic compound in sunflower seed, which they named helianthotannic acid. They attributed the dark colour of their protein
9

Chapter 1
preparation to this compound. Gorter (1909) identified the compound as chlorogenic acid, and later its structure was determined as an ester of quinic and caffeic acid (Rudkin and Nelson, 1947). The latter acids are also present in sunflower seeds, but in smaller quantities (Table 1). Phenolic compounds can combine with proteins in two different ways: (1) non-covalently by hydrogen bonding, ionic and hydrophobic interactions, and (2) covalently via oxidation to quinones, which may combine with reactive groups on protein molecules (Saeed and Cheryan, 1989). The oxidation of phenolic compounds takes place, either autocatalytically under alkaline conditions or enzymatically by polyphenol oxidase (PPO) (Pierpoint, 1969). Quinones are highly reactive and spontaneously undergo oxidation and form covalent bonds with the reactive groups on proteins such as amines, thiols, thioethers, indole, imidazole, and disulfide groups (Loomis, 1974). OH
O
OHO
OH
COOH
OHHO
Figure 2: Structure of chlorogenic acid [1,3,4,5-tetrahydroxycyclohexanecarboxylic acid 3-(3,4-dihydroxycinnamate)].
The interaction with phenolic compounds can affect sunflower protein in several ways, such as reducing protein digestibility and functionality, prolonging or shortening its storage life and stability, and altering its organoleptic properties (Sastry and Rao, 1990). Furthermore, the presence of CGA results in a dark colouration of sunflower protein products. Removal of phenolic compounds is, therefore, one of the main issues concerning the production of sunflower protein products (Milic et al., 1968; Gassmann, 1983; Sastry and Subramanian, 1984). Several attempts have been made to reduce the presence of phenolic compounds from sunflower protein products. They are mainly based on the following principles: a) extraction with mixtures of organic solvents and water (Mikolajczak et al., 1970; Pomenta and Burns, 1971; Cater et al., 1972; Sodini and Canella, 1977; Saeed and Cheryan, 1988; Prasad, 1990; Venktesh and Prakash, 1993a; Venktesh and Prakash, 1993b; Regitano d'Arce et al., 1994b; Sanchez and Burgos, 1995), b) extraction with aqueous solutions of acids, salts or/and reducing agents (O'Connor, 1971a; Hagenmaier, 1974; Rahma and Rao, 1981a; Pearce, 1984; Sastry and Subramanian, 1984; Sastry and Rao, 1990), c) membrane filtration (O'Connor, 1971b), d) precipitation of pigments and
10

General introduction
other non-protein compounds (Petit et al., 1979; Bau and Debry, 1980; Nuzzolo et al., 1980), and e) combinations thereof (Gheyasuddin et al., 1970; Sosulski et al., 1972; Fan et al., 1976; Rahma and Rao, 1979; Rahma and Rao, 1981b; Bau et al., 1983; Raymond et al., 1984). There is controversy about which method leads to the best results. Various methods yield a light coloured isolate with low CGA content. Others focus on isolates with a high protein yield and/or protein content. Some are aiming at minimizing protein denaturation. However, it is difficult to develop an economic method to obtain non-denatured proteins with a low CGA content and a high protein yield. It has been found that treatments with acidified water lead to low protein yields, low protein contents and even protein denaturation, whereas the use of organic solvents has been reported to be more promising (Tranchino et al., 1983; Vermeesch et al., 1987; Prasad, 1990). Some authors (Rahma and Rao, 1981b; Sripad and Rao, 1987) showed that aqueous solutions have a low capacity to remove phenolic compounds compared to organic solvents. Aqueous mixtures [50-60 % (v/v)] of methanol, ethanol and 2-propanol were shown to give much lower protein losses and a higher CGA extractability than propanol and isobutanol (Berot and Briffaud, 1983). Several studies have pointed out the denaturing effect of butanol (Rahma and Rao, 1981b; Venktesh and Prakash, 1993a; Venktesh and Prakash, 1993b) and acetone (Sanchez and Burgos, 1995; Sanchez and Burgos, 1997). Ethanol-water mixtures were reported to result in products with a low protein solubility (Fan et al., 1976; Regitano d'Arce et al., 1994a; Regitano d'Arce et al., 1994b) or a low degree of polyphenol extraction (Cater et al., 1972; Saeed and Cheryan, 1988). Procedures proposed for the removal of phenolic components generally alter and/or solubilize proteins, thereby increasing protein losses. Methanol-water mixtures have shown to have high extraction efficiency for phenolic compounds and to result in low protein losses (Mikolajczak et al., 1970; Berot and Briffaud, 1983; Sripad and Rao, 1987). The solubilities of CGA in methanol, ethanol, and water were reported to be 15.2, 6.2 and 0.6 g/100 ml of solvent at 20 °C, respectively (Sabir et al., 1974a). Properties of proteins
From the above it is clear that the solubility and structural stability of sunflower proteins at various conditions are of major importance for the recovery of useful sunflower protein preparations for food applications. Therefore, it is of utmost importance to know which conditions may affect structure, solubility and conformational stability of proteins. Protein structure Proteins are complex macromolecules. The linear sequence of amino acids in a protein is known as the primary structure and determines in a very complex way the secondary, tertiary and quaternary structure of the molecule (Creighton, 1996). The
11
Chapter 1
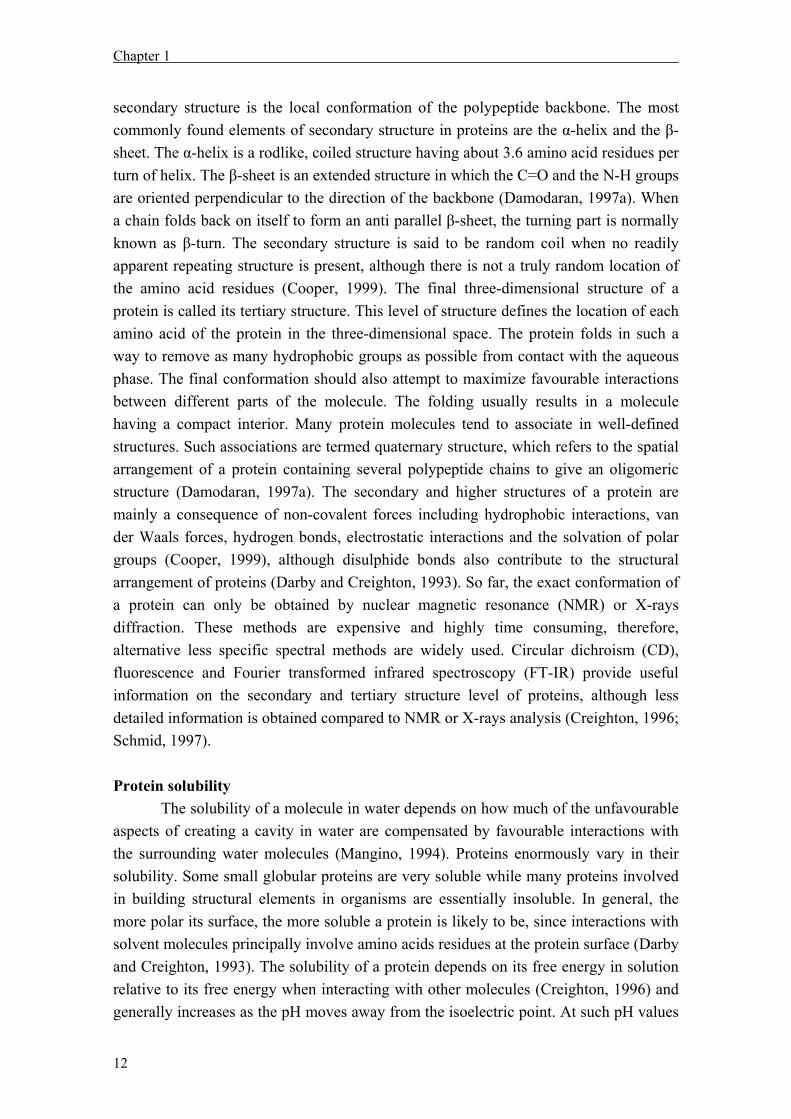
secondary structure is the local conformation of the polypeptide backbone. The most commonly found elements of secondary structure in proteins are the α-helix and the β-sheet. The α-helix is a rodlike, coiled structure having about 3.6 amino acid residues per turn of helix. The β-sheet is an extended structure in which the C=O and the N-H groups are oriented perpendicular to the direction of the backbone (Damodaran, 1997a). When a chain folds back on itself to form an anti parallel β-sheet, the turning part is normally known as β-turn. The secondary structure is said to be random coil when no readily apparent repeating structure is present, although there is not a truly random location of the amino acid residues (Cooper, 1999). The final three-dimensional structure of a protein is called its tertiary structure. This level of structure defines the location of each amino acid of the protein in the three-dimensional space. The protein folds in such a way to remove as many hydrophobic groups as possible from contact with the aqueous phase. The final conformation should also attempt to maximize favourable interactions between different parts of the molecule. The folding usually results in a molecule having a compact interior. Many protein molecules tend to associate in well-defined structures. Such associations are termed quaternary structure, which refers to the spatial arrangement of a protein containing several polypeptide chains to give an oligomeric structure (Damodaran, 1997a). The secondary and higher structures of a protein are mainly a consequence of non-covalent forces including hydrophobic interactions, van der Waals forces, hydrogen bonds, electrostatic interactions and the solvation of polar groups (Cooper, 1999), although disulphide bonds also contribute to the structural arrangement of proteins (Darby and Creighton, 1993). So far, the exact conformation of a protein can only be obtained by nuclear magnetic resonance (NMR) or X-rays diffraction. These methods are expensive and highly time consuming, therefore, alternative less specific spectral methods are widely used. Circular dichroism (CD), fluorescence and Fourier transformed infrared spectroscopy (FT-IR) provide useful information on the secondary and tertiary structure level of proteins, although less detailed information is obtained compared to NMR or X-rays analysis (Creighton, 1996; Schmid, 1997). Protein solubility The solubility of a molecule in water depends on how much of the unfavourable aspects of creating a cavity in water are compensated by favourable interactions with the surrounding water molecules (Mangino, 1994). Proteins enormously vary in their solubility. Some small globular proteins are very soluble while many proteins involved in building structural elements in organisms are essentially insoluble. In general, the more polar its surface, the more soluble a protein is likely to be, since interactions with solvent molecules principally involve amino acids residues at the protein surface (Darby and Creighton, 1993). The solubility of a protein depends on its free energy in solution relative to its free energy when interacting with other molecules (Creighton, 1996) and generally increases as the pH moves away from the isoelectric point. At such pH values
12
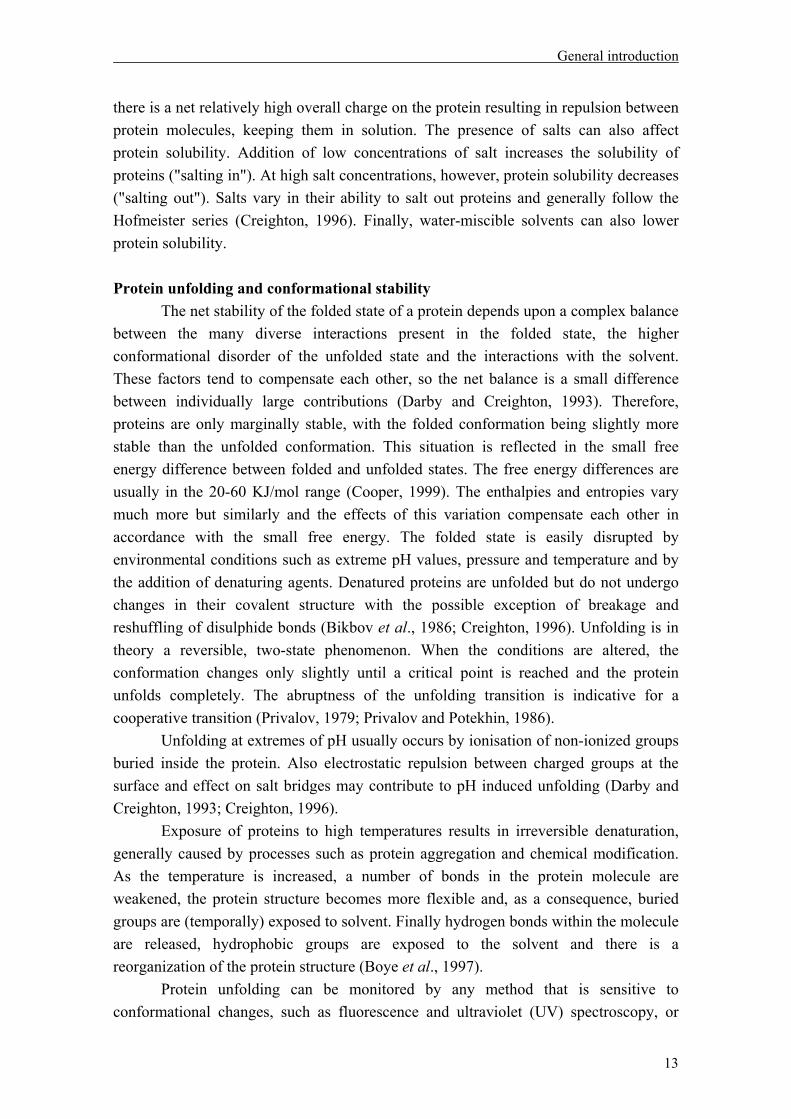
General introduction
there is a net relatively high overall charge on the protein resulting in repulsion between protein molecules, keeping them in solution. The presence of salts can also affect protein solubility. Addition of low concentrations of salt increases the solubility of proteins ("salting in"). At high salt concentrations, however, protein solubility decreases ("salting out"). Salts vary in their ability to salt out proteins and generally follow the Hofmeister series (Creighton, 1996). Finally, water-miscible solvents can also lower protein solubility. Protein unfolding and conformational stability The net stability of the folded state of a protein depends upon a complex balance between the many diverse interactions present in the folded state, the higher conformational disorder of the unfolded state and the interactions with the solvent. These factors tend to compensate each other, so the net balance is a small difference between individually large contributions (Darby and Creighton, 1993). Therefore, proteins are only marginally stable, with the folded conformation being slightly more stable than the unfolded conformation. This situation is reflected in the small free energy difference between folded and unfolded states. The free energy differences are usually in the 20-60 KJ/mol range (Cooper, 1999). The enthalpies and entropies vary much more but similarly and the effects of this variation compensate each other in accordance with the small free energy. The folded state is easily disrupted by environmental conditions such as extreme pH values, pressure and temperature and by the addition of denaturing agents. Denatured proteins are unfolded but do not undergo changes in their covalent structure with the possible exception of breakage and reshuffling of disulphide bonds (Bikbov et al., 1986; Creighton, 1996). Unfolding is in theory a reversible, two-state phenomenon. When the conditions are altered, the conformation changes only slightly until a critical point is reached and the protein unfolds completely. The abruptness of the unfolding transition is indicative for a cooperative transition (Privalov, 1979; Privalov and Potekhin, 1986). Unfolding at extremes of pH usually occurs by ionisation of non-ionized groups buried inside the protein. Also electrostatic repulsion between charged groups at the surface and effect on salt bridges may contribute to pH induced unfolding (Darby and Creighton, 1993; Creighton, 1996). Exposure of proteins to high temperatures results in irreversible denaturation, generally caused by processes such as protein aggregation and chemical modification. As the temperature is increased, a number of bonds in the protein molecule are weakened, the protein structure becomes more flexible and, as a consequence, buried groups are (temporally) exposed to solvent. Finally hydrogen bonds within the molecule are released, hydrophobic groups are exposed to the solvent and there is a reorganization of the protein structure (Boye et al., 1997). Protein unfolding can be monitored by any method that is sensitive to conformational changes, such as fluorescence and ultraviolet (UV) spectroscopy, or
13

Chapter 1
circular dichroism (CD) spectroscopy. Also methods that detect changes in solubility, biological activity or resistance to proteolysis can be used, as well as, native electrophoresis and tritium-hydrogen exchange rate measurements. However, the thermodynamics of protein unfolding are usually studied using differential scanning calorimetry (DSC). With this technique a solution of protein can be heated very gradually and accurately and the amount of energy required is plotted after subtraction of the energy required to heat the solvent alone. Functional properties Functional properties refer to the overall physical behaviour or performance of proteins in food, and reflect the various interactions in which proteins take part. Functional properties of proteins are related to the physical, chemical and conformational properties, which include e.g. size, shape, amino-acid composition and sequence, and charge distribution (Boye et al., 1997). Functionality may vary with the source of protein, its composition, the method of preparation, its thermal history and the prevailing environment i.e. pH, ionic strength, temperature, presence of salts etc. In this thesis, emphasis is on two technologically important functional properties, i.e. foam and emulsion properties. Therefore, these properties will be discussed in more detail. Formation and stability of emulsions and foams Foams and emulsions are colloidal systems in which one phase (air for foam and oil for oil-in-water emulsions) is dispersed in another phase. Although foams and emulsions are both dispersed systems and the processes that occur in the formation and stabilization are similar, there are several important differences from the physical point of view. Gas bubbles are larger (≈ 103 times), much more compressible (≈ 105 times) and more susceptible to disturbing influences (i.e. temperature gradients, dust, evaporation, etc) than emulsion droplets. Furthermore, the solubility of the dispersed phase in the continuous phase, and the density differences are higher in foams than in emulsions (Walstra, 1987; Dickinson, 1992). The latter will result in significant differences in the importance of the mechanisms involved in destabilization of these systems. It is important to discriminate between the formation and the stabilization of foams and emulsions, since different mechanisms and time-scales play a role in these processes. In foams, formation and stability can often not be discriminated, whereas in emulsions these processes are clearly distinguishable (Walstra and Smulders, 1997). To make foams and emulsions, bubbles or droplets, respectively, have to be generated from the interface between the phases and subsequently broken into smaller ones. The break-up of particles requires a large amount of energy to overcome the Laplace pressure (pL),
14

General introduction
which opposes the deformation and break-up of bubbles and droplets. The Laplace pressure is given by:
pL = 2γ/R
where γ stands for the surface tension [N/m] and R [m] is the radius of the particle. During this process, proteins, or any other surfactant, may adsorb at the particle interface and lower the interfacial tension and subsequently facilitate bubble or droplet break-up (Walstra and Smulders, 1997). Another role of the surfactant during emulsion and foam formation is to prevent particles from immediate recoalescence by its ability to form γ-gradients. The potential to form a γ-gradient increases with increasing surface dilational modulus ESD (Lucassen, 1981), which is given by:
ESD = dγ/d ln A
where A [m2] is the surface area. ESD reflects the interactions between protein molecules at the surface (Burnett et al., 2002). Other aspects are also important during formation and stabilization of these systems, such as the adsorption rate of the surfactant or viscosity of the continuous phase (Halling, 1981).
Foams and emulsions are exposed to changes through various instability mechanisms (Figure 3). Creaming and drainage are caused by density differences between the phases. Particle size and the viscosity of the continuous phase influence the rate of creaming and drainage. Furthermore, creaming is opposed by the Brownian or heat motion of droplets and by convection currents due to temperature gradients. Ostwald ripening is probably the most important type of instability in protein foams, but it is of minor importance in oil-in-water emulsions. The driving force is the Laplace pressure difference over a curved bubble surface, which results in a higher air solubility around a small bubble than around a larger one, as described by Henry’s Law. In principle, Ostwald ripening can be retarded or stopped if the surfactant stays adsorbed at the interface of the shrinking bubble, because then the surface tension will decrease due to the reduced surface area. The relation between the surface tension and change in surface area is given by ESD. It has been shown that Ostwald ripening in foams will completely stop if the relation ESD ≥ γ/2 is satisfied (Lucassen, 1981). Aggregation (or flocculation) is the process in which particles stick together. Aggregation is normally not important in foams, but it is probably one of the main instability mechanisms in emulsions. The magnitude of the interaction forces between two particles depends on the distance between the droplets and the film thickness. Therefore, the balance of the attractive and repulsive forces between the droplets governs aggregation. In emulsions specific mechanisms of aggregation may occur such as bridging and depletion flocculation. Bridging flocculation can be observed at low concentrations of polymeric surfactant due to the adsorption of one polymer chain at
15

Chapter 1
two separate droplets. Depletion flocculation may occur if non-adsorbing polymers are present in solution. Due to their size, these polymers are depleted near the droplet interface with respect to the bulk, leading to an increased osmotic pressure of the bulk phase. Therefore, droplets aggregate to decrease this osmotic pressure by reducing the size of the depleted region near the droplets. Coalescence occurs if the film between two particles is ruptured and the particles join to form a single, larger one (Walstra, 1996). Figure 3: Instability mechanisms of foams and emulsions.
All the mentioned instability mechanisms affect each other. The rate of creaming e.g. depends on the size of the particles and on the extent of aggregation The latter favours coalescence by holding the particles together, which results in larger particles and thus increased creaming rate. The role of proteins in foam and emulsion formation and stabilization Many food products are foams or emulsions, and often proteins play a role in stabilising these systems. Most water-soluble proteins adsorb spontaneously at liquid interfaces by lowering the Gibbs free energy of the interfacial system. The Gibbs free energy of adsorption ∆Gads [J] consists of an enthalpy term ∆Hads [J] and an entropy term ∆Sads [J/K]
∆Gads = ∆Hads +T∆Sads
in which T [K] is the temperature. The contribution to ∆Gads is mainly caused by entropy changes, whereas the enthalpic contribution is relatively less important. The
16

General introduction
increased entropy at the interface consists of two components, one due to the conformational entropy of the protein and the other to the change in the structure of water near hydrophobic groups (Mangino, 1994; Damodaran, 1997b; Martin, 2003). Proteins predominantly adsorb at interfaces via their hydrophobic segments (Smulders, 2000). Once at the interface, proteins unfold at varying extents, reorient, and rearrange their conformation to expose these segments to the interface, thus attaining an energetically most favourable conformation (Das and Kinsella, 1990; German and Phillips, 1991; Dickinson, 1994). The extent to which this happens depends on the interface, the local environment, the protein and its concentration (Martin, 2003). In order to increase the amount of protein adsorbed, the protein already present at the surface must be compressed to make room. The amount of compression that is possible depends on the rigidity of the protein and on the amount of residual charge near the surface. At some level of compression, the adsorption of more protein will require more energy than can be gained by the insertion of hydrophobic groups into the interface. Further growth of the adsorbed layer can be obtained by interactions of protein molecules in the bulk phase with those already adsorbed to the interface, and this may result in the formation of multilayers. Molecular properties such as conformational stability/flexibility, surface hydrophobicity and molecular weight govern the ability of proteins to lower the interfacial tension during foam and emulsion formation, hence, facilitate the formation of small particles (Wagner and Guéguen, 1995; Wagner and Guéguen, 1999a; Wagner and Guéguen, 1999b; Smulders, 2000; Martin, 2003). After foam and emulsion formation, proteins determine the properties of the adsorbed layer by affecting its rheological properties and also by providing steric and electrostatic repulsion, which may stabilize the particles against aggregation, and therefore also against creaming and coalescence (Halling, 1981; Prins, 1988). In the stability of protein foams, however, electrostatic repulsion between the bubbles is not important, and higher net charges involve that the adsorbing protein molecule has to overcome increased charge repulsion. Therefore, foams are believed to be more stable close to the isoelectric point (Bacon et al., 1988; German and Phillips, 1991). Contrary, emulsions are generally found to be more stable away from the isoelectric pH values of the adsorbed proteins, and to loose stability when the electrostatic repulsion is reduced (Halling, 1981). Unfolding and dissociation of polymeric proteins by heat treatment, or other treatments, may improve foam and emulsion properties of proteins. Unfolding, however, often results in protein aggregation, due to the exposure of hydrophobic residues of the protein, and subsequently a loss of solubility, which is one of the most important properties determining the ability to form and stabilise foams and emulsions (Kinsella, 1979; Halling, 1981).
17
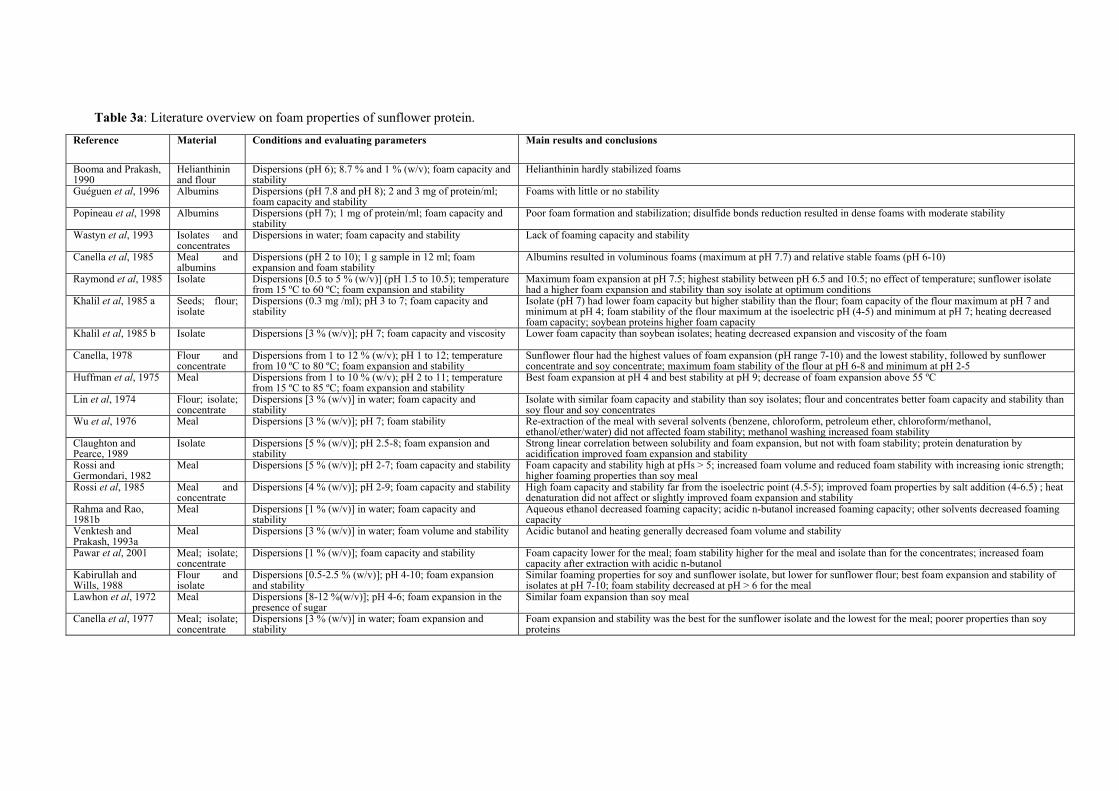
Table 3a: Literature overview on foam properties of sunflower protein.
Reference Material Conditions and evaluating parameters Main results and conclusions
Booma and Prakash, 1990
Helianthinin and flour
Dispersions (pH 6); 8.7 % and 1 % (w/v); foam capacity and stability
Helianthinin hardly stabilized foams
Guéguen et al, 1996 Albumins Dispersions (pH 7.8 and pH 8); 2 and 3 mg of protein/ml; foam capacity and stability
Foams with little or no stability
Popineau et al, 1998 Albumins Dispersions (pH 7); 1 mg of protein/ml; foam capacity and stability
Poor foam formation and stabilization; disulfide bonds reduction resulted in dense foams with moderate stability
Wastyn et al, 1993 Isolates and concentrates
Dispersions in water; foam capacity and stability Lack of foaming capacity and stability
Canella et al, 1985
Meal and albumins
Dispersions (pH 2 to 10); 1 g sample in 12 ml; foam expansion and foam stability
Albumins resulted in voluminous foams (maximum at pH 7.7) and relative stable foams (pH 6-10)
Raymond et al, 1985 Isolate
Dispersions [0.5 to 5 % (w/v)] (pH 1.5 to 10.5); temperature from 15 ºC to 60 ºC; foam expansion and stability
Maximum foam expansion at pH 7.5; highest stability between pH 6.5 and 10.5; no effect of temperature; sunflower isolate had a higher foam expansion and stability than soy isolate at optimum conditions
Khalil et al, 1985 a
Seeds; flour; isolate
Dispersions (0.3 mg /ml); pH 3 to 7; foam capacity and stability
Isolate (pH 7) had lower foam capacity but higher stability than the flour; foam capacity of the flour maximum at pH 7 and minimum at pH 4; foam stability of the flour maximum at the isoelectric pH (4-5) and minimum at pH 7; heating decreased foam capacity; soybean proteins higher foam capacity
Khalil et al, 1985 b
Isolate
Dispersions [3 % (w/v)]; pH 7; foam capacity and viscosity Lower foam capacity than soybean isolates; heating decreased expansion and viscosity of the foam
Canella, 1978
Flour and concentrate
Dispersions from 1 to 12 % (w/v); pH 1 to 12; temperature from 10 ºC to 80 ºC; foam expansion and stability
Sunflower flour had the highest values of foam expansion (pH range 7-10) and the lowest stability, followed by sunflower concentrate and soy concentrate; maximum foam stability of the flour at pH 6-8 and minimum at pH 2-5
Huffman et al, 1975 Meal
Dispersions from 1 to 10 % (w/v); pH 2 to 11; temperature from 15 ºC to 85 ºC; foam expansion and stability
Best foam expansion at pH 4 and best stability at pH 9; decrease of foam expansion above 55 ºC
Lin et al, 1974
Flour; isolate; concentrate
Dispersions [3 % (w/v)] in water; foam capacity and stability
Isolate with similar foam capacity and stability than soy isolates; flour and concentrates better foam capacity and stability than soy flour and soy concentrates
Wu et al, 1976 Meal Dispersions [3 % (w/v)]; pH 7; foam stability Re-extraction of the meal with several solvents (benzene, chloroform, petroleum ether, chloroform/methanol, ethanol/ether/water) did not affected foam stability; methanol washing increased foam stability
Claughton and Pearce, 1989
Isolate Dispersions [5 % (w/v)]; pH 2.5-8; foam expansion and stability
Strong linear correlation between solubility and foam expansion, but not with foam stability; protein denaturation by acidification improved foam expansion and stability
Rossi and Germondari, 1982
Meal
Dispersions [5 % (w/v)]; pH 2-7; foam capacity and stability Foam capacity and stability high at pHs > 5; increased foam volume and reduced foam stability with increasing ionic strength; higher foaming properties than soy meal
Rossi et al, 1985 Meal and concentrate
Dispersions [4 % (w/v)]; pH 2-9; foam capacity and stability High foam capacity and stability far from the isoelectric point (4.5-5); improved foam properties by salt addition (4-6.5) ; heat denaturation did not affect or slightly improved foam expansion and stability
Rahma and Rao, 1981b
Meal Dispersions [1 % (w/v)] in water; foam capacity and stability
Aqueous ethanol decreased foaming capacity; acidic n-butanol increased foaming capacity; other solvents decreased foaming capacity
Venktesh and Prakash, 1993a
Meal Dispersions [3 % (w/v)] in water; foam volume and stability Acidic butanol and heating generally decreased foam volume and stability
Pawar et al, 2001 Meal; isolate; concentrate
Dispersions [1 % (w/v)]; foam capacity and stability Foam capacity lower for the meal; foam stability higher for the meal and isolate than for the concentrates; increased foam capacity after extraction with acidic n-butanol
Kabirullah and Wills, 1988
Flour and isolate
Dispersions [0.5-2.5 % (w/v)]; pH 4-10; foam expansion and stability
Similar foaming properties for soy and sunflower isolate, but lower for sunflower flour; best foam expansion and stability of isolates at pH 7-10; foam stability decreased at pH > 6 for the meal
Lawhon et al, 1972 Meal Dispersions [8-12 %(w/v)]; pH 4-6; foam expansion in the presence of sugar
Similar foam expansion than soy meal
Canella et al, 1977 Meal; isolate; concentrate
Dispersions [3 % (w/v)] in water; foam expansion and stability
Foam expansion and stability was the best for the sunflower isolate and the lowest for the meal; poorer properties than soy proteins

Table 3b: Literature overview on emulsion properties of sunflower protein.
Reference Material Conditions Main results and conclusions
Booma and Prakash, 1990
Helianthinin and flour
Dispersions (pH 6); 8.7 % and 4 % (w/v); emulsion capacity
The emulsification capacity of helianthinin is double as compared to that of the flour
Guéguen et al, 1996 Albumins Dispersions (pH 8); 0.5 and 1 mg of protein/ml; creaming flocculation and resistance to coalescence
Stable emulsions; different emulsion stabilization activities between several albumins; a methionine-rich (SFA8) albumin was the most active in emulsion stabilization
Popineau et al, 1998 Albumins Dispersions (pH 7); 1 mg of protein/ml; creaming flocculation and resistance to coalescence
Resistance to coalescence was much higher with methionine-rich albumins than with methionine-poor albumins; disulfide bonds reduction resulted in very stable emulsions
Burnett et al, 2002 Albumins Dispersions (pH 7); up to 5 mg of protein/ml; droplet size, surface tension and surface dilation viscosity
Stable emulsions with SFA8 and SFA7 (methionine-rich proteins); less hydrophobic sunflower albumin proteins (lipid transfer proteins, SF-LTP) gave unstable emulsions
Wastyn et al, 1993 Protein isolates and concentrates
Dispersions in water; emulsion capacity Good emulsion capacity
Canella et al, 1985
Meal; albumins; helianthinin
Dispersions in water (50 mg in 5 ml) for emulsion capacity; 0.7 g in 10 ml for emulsion activity and stability
Low emulsion activity and stability of helianthinin compared to albumins and sunflower meal; thermal denaturation of helianthinin improved emulsion activity and stability; emulsion capacity lower for albumins and helianthinin than for the meal
Raymond et al, 1985 Isolate Dispersions [0.1 % (w/v)]; pH 3 to 10 Maximum emulsion capacity at pH 8; equivalent to soy isolate Brueckner et al, 1986
Concentrate and isolate
Dispersions in water; emulsion activity, capacity and stability
Emulsion activity and stability of sunflower concentrates similar to soy concentrates , but higher emulsion capacity; emulsion activity, capacity and stability much better for soy isolates
Khalil et al, 1985 b Isolate Dispersions [10 % (w/v)]; pH 8; emulsion capacity Lower emulsion capacity than for soy isolate; heating improved emulsion capacity Schwenke et al, 1981
Isolate Dispersions [0.5 % (w/w)]; pH 5 and 7; emulsion activity, capacity and stability
Emulsion activity, capacity and stability higher at pH 7 than at pH 5; protein denaturation (pH 2, 24h) had not effect on emulsion activity and stability but decreased emulsion capacity; better emulsion properties than soy proteins
Huffman et al, 1975 Meal Dispersions [6 % (w/w)]; pH 5.2, 7 and 10.8; emulsion capacity
Highest emulsion capacity at pH 7
Lin et al, 1974 Flour; concentrate; isolate
Dispersions [5.5 % (w/w)] in water; emulsion capacity Emulsion capacity of the flour superior to that of the concentrates and isolates of sunflower and to that of the soy flour, isolates and concentrates
Wu et al, 1976 Meal Dispersions in water; pH 7; emulsion capacity Re-extraction of the meal with several solvents (benzene, chloroform, methanol, petroleum ether, chloroform/methanol, ethanol/ether/water) did not affect emulsion capacity
Rossi andGermondari, 1982
Meal
Dispersions [7 % (w/w)]; pH 5.2, 7 and 10.8; emulsion activity and stability
Emulsion activity and stability high pH > 5; minimum emulsion activity close to pH 3.75; higher emulsion properties than soy meal
Rossi et al, 1985 Meal and concentrate
Dispersions [4 % (w/v)]; pH 2-9; emulsion activity and stability
Emulsion activity maximum (meal and concentrate) between 6.5 and 7.5 and minimum (pH 4.5-5); high emulsion stability of the concentrate and independent of pH; emulsion properties improved close to the isoelectric point by salt addition; heat denaturation reduced emulsion properties
Rahma and Rao, 1981b
Meal Dispersions (2 g in 23 ml water); emulsion capacity Aqueous ethanol decreases emulsification capacity
Venktesh andPrakash, 1993a
Meal Dispersions [5 % (w/v)]; pH 7; emulsion activity, capacity and stability
Higher emulsion stability in water than in the presence of NaCl (1M); increased emulsion capacity and stability after heating in the presence of salt
Pawar et al, 2001 Meal; concentrate; isolate
Dispersions in water (2 g in 23 ml water); emulsion activity, capacity and stability
Increased emulsion activity, capacity and stability for protein products with small amounts of phytate and phenolic compound
Canella et al, 1977 Flour; concentrate; isolate
Dispersions 5.5 % (w/v) in water; emulsion capacity Emulsion capacity of the isolate higher than for sunflower the meal, but smaller than the concentrate; emulsion capacity of the isolate better than soy isolates; emulsion capacity of the concentrate poorer than for soy concentrate

Chapter 1
Functionality of sunflower proteins Sunflower proteins have been reported to possess good emulsification and foaming properties (Sosulski and Fleming, 1977; Schwenke et al., 1981; Raymond et al., 1985; Vermeesch et al., 1987; Kabirullah and Wills, 1988; Lasztity et al., 1992; Salunkhe et al., 1992; Pawar et al., 2001; etc.), and poor gelling properties (Fleming and Sosulski, 1975; Bilani et al., 1989; Sanchez and Burgos, 1995; Pawar et al., 2001). An overview of the foam and emulsion properties of sunflower proteins, as determined in several studies is given in Table 3. Functional properties vary extensively with both the method used for preparing the protein products and with the method used to test their functionality. Mainly comparisons between flours, concentrates and isolates have been reported and, therefore, other constituents of the meal and the concentrates, such as pectins and fibres may interfere and subsequently contribute to the functionality of the system. In addition, some of the protein products investigated contained CGA, which is known to interact with proteins, thereby affecting protein functionality.
Comparison with soy protein products is frequently found throughout literature and it shows the potential uses of sunflower protein. Sunflower protein products have been reported to have better functionality than soy protein products under specific pH and ionic strength conditions (Table 3). However, conflicting results can be observed by comparing the results of the different studies.
With respect to the foam properties of the individual proteins, it can be observed that recent publications (Guéguen et al., 1996; Popineau et al., 1998) report no foam stabilization effect of albumins, whereas previous publications (Canella et al., 1985; Booma and Prakash, 1990) report a stabilizing effect of sunflower albumins and not stabilizing effect for helianthinin. Concerning the emulsion properties it was found that helianthinin had a low stabilizing effect as compared to albumins (Canella et al., 1985). Later publications (Guéguen et al., 1996; Popineau et al., 1998; Burnett et al., 2002) show different stabilizing and forming properties of the various sunflower albumins. Most of the studies did not provide any information on the structure of the proteins under the studied conditions, and the functionality tests were performed with protein products of which the extent of denaturation was marginally or not studied. Therefore, despite all the research performed on sunflower proteins functionality, only limited information is available on the functional properties of the individual and gentle purified protein fractions and on the relation between protein structure and functionality. Aim and outline of the study
Sunflower proteins are reported to have a high potential for food applications. These applications have a substantial higher added value than the current feed applications. However, limited information on structure and functionality of purified protein fractions is available. The research described in this thesis is, therefore, aimed at providing knowledge about the relation between specific sunflower proteins, their
20

General introduction
structure and their functional properties as a function of extrinsic factors as pH, ionic strength and temperature. Chapter 2 describes the method used to obtain a protein isolate, undenatured and free of phenolic compounds. Furthermore, the isolate is biochemically characterized and information is provided about CGA-protein interactions. Chapters 3 and 4 describe the effects of pH, temperature and ionic strength on the structure of helianthinin and SFAs. Chapter 5 discusses the foam properties of sunflower proteins based on the structural information acquired in Chapters 3 and 4. In Chapter 6 the emulsion properties of sunflower protein preparations are described. Finally, Chapter 7 discusses the results described in this thesis in a larger and general perspective. Literature cited Allen R.D., Cohen E.A., Vonder Haar R.A., Adams C.A., Ma D.P., Nessler C.L. and Thomas T.L.
Sequence and expression of a gene encoding an albumin storage protein in sunflower. Mol. Gen. Genet. 1987, 210, 211-218.
Anisimova I.N., Fido R.J., Tatham A.S. and Shewry P.R. Genotypic variation and polymorphism of 2S albumins of sunflower. Euphytica 1995, 83, 15-23.
Anisimova I.N., Gavriljuk I.P. and Konarev V.G. Identification of sunflower lines and varieties by helianthinin electrophoresis. Plant Var. Seeds 1991a, 4, 133-141.
Anisimova I.N. and Gavrilyuk I.P. Heterogeneity and polymorphism of 11S globulin in sunflower seeds. Sov. Genet. 1990, 25, 811-815.
Anisimova I.N., Konarev A.V., Gavrilova V.A., Rozhkova V.T., Fido R.F., Tatham A.S. and Shewry P.R. Polymorphism and inheritance of methionine-rich 2S albumins in sunflower. Euphytica 2002, 129, 99-107.
Anisimova I.N., Loskutov A.V. and Borovkova I.G. Identification of sunflower lines by electrophoresis of helianthinine and isozymes. Sov. Agric. Sci. 1991b, 6, 11-13.
Aravind L. and Koonin Eugeney V. Gleaning non-trivial structural, functional and evolutionary information about proteins by iterative database searches. J. Mol. Biol. 1999, 287, 1023-1040.
Bacon J.R., Hemmant J.W., Lambert N., Moore R. and Wright D.J. Characterization of the foaming properties of lysozymes and α-lactalbumins: a structural evaluation. Food Hydrocolloids 1988, 2, 225-245.
Bau H.M. and Debry G. Colourless sunflower protein products: chemical and nutritional evaluation of the presence of phenolic compounds. J. Food Techn. 1980, 15, 207-215.
Bau H.M., Mohtadi Nia D.J., Mejean L. and Debry G. Preparation of colorless sunflower protein products: Effect of processing on physicochemical and nutritional properties. J. Am. Oil Chem. Soc. 1983, 60, 1141-1148.
Baudet J. and Mosse J. Fractionation of sunflower seed proteins. J. Am. Oil Chem. Soc. 1977, 54, 82A-86A.
Berot S. and Briffaud J. Parameters for obtaining concentrates from rapeseed and sunflower meal. Qual. Plant. 1983, 33, 237-242.
21

Chapter 1
Bikbov T.M., Grinberg V., Grinberg N.V., Varfolomeeva E.P. and Likhodzeivskaya I.B. Thermotropic gelation of proteins. Nahrung 1986, 30, 369-373.
Bilani N., Hayashi K., Haraguchi K. and Kasumi T. Utilization of sunflower proteins in yogurt. J. Food Sci. Techn. 1989, 26, 205-209.
Booma K. and Prakash V. Functional properties of the flour and the major protein fraction from sesame seed, sunflower seed and safflower seed. Acta Alimentaria 1990, 19(2), 163-176.
Boye J.I., Ma C.-Y. and Harwalkar Thermal Denaturation and Coagulation of Protein. In Food Proteins and Their Applications; Damodaran S. and Paraf A., eds; Marcel Dekker, INC.: Madison, Wiscosin, 1997; 25-56.
Brueckner J., Mieth G. and Muschiolik G. Functional properties of plant proteins in selected foods. Nahrung 1986, 30, 428-429.
Brueske G.D. 1992. Oil/meal separation processes. Applewhite T. H., ed. In proceedings of the world conference on oilseed technology and utilization. Budapest, Hungary, 126-136.
Burnett G.R., Rigby N.M., Mills E.N.C., Belton P.S., Fido R.J., Tatham A.S. and Shewry P.R. Characterization of the emulsification properties of 2S albumins from sunflower seed. J. Colloid Interface Sci. 2002, 247, 177-185.
Canella M. Whipping properties of sunflower protein dispersions. Food Sci. Technol-Leb. 1978, 11, 259-263.
Canella M., Castriotta G., Bernardi A. and Boni R. Functional properties of individual sunflower albumin and globulin. Lebensm.-Wiss. Technol.-Food Sci. Technol. 1985, 18, 288-292.
Canella M., Castriotta G. and Sodini G. Functional properties of sunflower products after extraction of phenolic pigments by acid butanol. Riv. Ital. Sostanze Grasse 1977, 54, 73-76.
Cater C.M., Gheyasuddin S. and Mattil K.F. The effect of chlorogenic, quinic, and caffeic acids on the solubility and color of protein isolates, especially from sunflower seed. Cereal Chem. 1972, 49, 508-514.
Claughton S.M. and Pearce R.J. Preparation and properties of acid-modified sunflower protein isolate. J. Food Sci. 1989, 54, 357-361.
Cooper A. Thermodynamics of protein folding and stability. In Protein: a comprehensive treatise; Allen G., eds; JAI Press Inc.: 1999; 217-270.
Creighton T.E. Proteins: Structures and molecular properties, W.H. Freeman, New York, 1996. Dalgalarrondo M., Raymond J. and Azanza J.L. Sunflower seed proteins: characterization and subunit
composition of the globulin fraction. J. Exp. Bot. 1984, 35, 1618-1628. Dalgalarrondo M., Raymond J. and Azanza J.L. Sunflower seed protein: size and charge heterogeneity in
subunits of the globulin fraction. Biochimie 1985, 67, 629-632. Damodaran S. Food proteins: an overview. In Food Proteins and Their Applications; Damodaran S. and
Paraf A., eds; Marcel Dekker, INC.: Madison, Wiscosin, 1997a; 1-24. Damodaran S. Protein-stabilized foams and emulsions. In Food Proteins and Their Applications;
Damodaran S. and Paraf A., eds; Marcel Dekker, INC.: Madison, Wiscosin, 1997b; 57-110. Darby N.J. and Creighton T.E. Protein Structure, Oxford University Press, Oxford, 1993. Das K.P. and Kinsella J.E. Stability of food emulsions: physicochemical role of protein and nonprotein
emulsifiers. Adv. Food Nutr. Res. 1990, 34, 81-201. Dickinson E. Foams. In An introduction to food colloids; Dickinson E., eds; Oxford Univerity Press:
Oxford, 1992; 123-139. Dickinson E. Protein-stabilized emulsions. J. Food Eng. 1994, 22, 59-74. Dunwell J.M. Cupins: a new superfamily of functionally diverse proteins that include germins and plant
storage proteins. Biotechnol. Genet. Eng. Rev. 1998, 15, 1-32.
22

General introduction
Earle F.R., Vanetten C.H., Clark T.F. and Wolff I.A. Compositional data on sunflower seed. J. Am. Oil Chem. Soc. 1968, 45, 876-879.
Fan T.Y., Sosulski F.W. and Hamon N.W. New techniques for preparation of improved sunflower protein concentrates. Cereal Chem. 1976, 53, 118-125.
FAO Sunflower. In Agribusiness Handbooks: Crude and refined oils; 1999; 17-26. FAO Production Yearbook 1999, Rome, 2001. Fick G.N. Sunflower. In Oil crops of the world; Robbelen G., Downey R. K. and Ashri A., eds; Mc
Graw-Hill: 1989; 301-318. Fleming S.E. and Sosulski F. Gelation and thickening phenomena of vegetable protein products. J. Food
Sci. 1975, 40, 805-807. Gassmann B. Preparation and application of vegetable proteins, especially proteins from sunflower seed,
for human consumption. An approach. Nahrung 1983, 27, 351-369. German J.B. and Phillips L. Protein interactions in foams. In Protein functionality in food systems;
Hettiarachy N. S. and Ziegler G. R., eds; IFT Basic Symposium Series: Chicago, 1991; 181-208. Gheyasuddin S., Cater C.M. and Mattil K.F. Preparation of a colourless sunflower protein isolate. Food
Tech. 1970, 24, 242-243. Gorter K. Identity of helianthic acid with chlorogenic acid. Archiv der Pharmazie 1909, 247, 436-438. Guéguen J., Chevalier M., Barbot J. and Schaeffer F. Dissociation and aggregation of pea legumin
induced by pH and ionic strength. J. Sci. Food Agric. 1988, 44, 167-182. Guéguen J., Popineau Y., Anisimova I.N., Fido R.J., Shewry P.R. and Tatham A.S. Functionality of the
2S albumin seed storage proteins from sunflower (Helianthus annuus L.). J. Agric. Food Chem. 1996, 44, 1184-1189.
Hagenmaier R.D. Aqueous processing of full-fat sunflower seeds: yields of oil and protein. J. Am. Oil Chem. Soc. 1974, 51, 470-471.
Halling P.J. Protein-stabilized foams and emulsions. CRC Crit. Rev. Food Sci. Nutr. 1981, 15, 155-203. Heiser C.B. Sunflowers: Helianthus (Compositae-Heliantheae). In Evolution of Crop Plants; Simmonds
N. W., eds; Longman Green: London, 1976; 36-38. Huffman V.L., Lee C.K. and Burns E.E. Selected functional properties of sunflower meal (Helianthus
annuus). J. Food Sci. 1975, 40, 70-74. Joubert F.J. Sunflower seed proteins. Biochim. Biophys. Acta 1955, 16, 520-523. Kabirullah M. and Wills R.B.H. Characterization of sunflower protein. J. Agric. Food Chem. 1983, 31,
953-956. Kabirullah M. and Wills R.B.H. Foaming properties of sunflower seed protein. J. Food Sci. Techn. 1988,
25, 16-19. Khalil M., Ragab M. and Abd El Aal M.H. Foaming properties of oilseed proteins. Nahrung 1985a, 29,
201-207. Khalil M., Ragab M. and Hassanien F.R. Some functional properties of oilseed proteins. Nahrung 1985b,
29, 275-282. Khuri S., Bakker F.T. and Dunwell J.M. Phylogeny, function, and evolution of the cupins, a structurally
conserved, functionally diverse superfamily of proteins. Mol. Biol. Evol. 2001, 18, 593-605. Kinsella J.E. Functional properties of soy proteins. J. Am. Oil Chem. Soc. 1979, 56, 242-258. Kortt A.A. and Caldwell J.B. Low molecular weight albumins from sunflower seed: Identification of a
methionine-rich albumin. Phytochemistry 1990, 29, 2805-2810. Kortt A.A., Caldwell J.B., Lilley G.G. and Higgins T.J.V. Amino acid and complementary DNA
sequences of a methionine-rich 2S protein from sunflower seed (Helianthus annuus L.). Eur. J. Biochem. 1991, 195, 329-334.
23

Chapter 1
Lakemond C.M.M. Heat denaturation of soy glycinin: structural characteristics in relation to aggregation and gel formation. Ph.D Thesis. Wageningen University, Wageningen (The Netherlands). 2001.
Lakemond C.M.M., de Jongh H.H.J., Hessing M., Gruppen H. and Voragen A.G.J. Soy glycinin: influence of pH and ionic strength on solubility and molecular structure at ambient temperatures. J. Agric. Food Chem. 2000, 48, 1985-1990.
Lasztity R., Goma M., Toemoeskoezi S. and Nagy J. 1992. Functional and nutritive properties of sunflower seed protein preparations. Applewhite T. H., ed. In proceedings of the world conference on oilseed technology and utilization. Budapest, Hungary, 430-432.
Lawhon J.T., Cater C.M. and Mattil K.F. A comparative study of the whipping potential of an extract from several oilseed flours. Cereal Sci. Today 1972, 17, 240-244.
Lin M.J.Y., Humbert E.S. and Sosulski F.W. Certain functional properties of sunflower meal products. J. Food Sci. 1974, 39, 368-370.
Loomis W.D. Overcoming problems of phenolics and quinones in the isolation of plant enzymes and organelles. Methods Enzymol. 1974, 31, 528-544.
Lucassen J. In Anionic surfactants; Lucassen-Reijnders E. H., eds; Marcel Dekker: New York, 1981; 217. Lusas E.W. Sunflower seed protein. In New protein foods; Altschul A. M. and Wilcke H. L., eds;
Academic Press Inc.: Orlando, USA, 1985; 393-433. Lusas E.W., Lawhon J.T. and Rhee K.C. Producing edible oil and protein from oilseeds by aqueous
processing. Preprints of Papers of the Oilseed Processing Clinic 1982, 23-40. Madhusudhan K.T., Sastry M.C.S. and Srinivas H. Effect of roasting on the physico-chemical properties
of sunflower proteins. Food Sci. Technol-Leb. 1986, 19, 292-296. Mangino E.M. Protein Interactions in Emulsions: Protein-Lipid Interactions. In Protein functionality in
food systems; Hettiarachchy N. S. and R. Z. G., eds; Marcel Dekker: New York, 1994; 147-179. Martin A.H. Mechanical and conformational aspects of protein layers on water. Ph.D Thesis. Wageningen
University, Wageningen, The Netherlands. 2003. Mazhar H., Quayle R., Fido R.J., Stobart A.K., Napier J.A. and Shewry P.R. Synthesis of storage reserves
in developing seeds of sunflower. Phytochemistry 1998, 48, 428-432. Mikolajczak K.L., Smith C.R., Jr. and Wolff I.A. Phenolic and sugar components of Armavirec variety
sunflower (Helianthus annuus) seed meal. J. Agric. Food Chem. 1970, 18, 27-32. Milic B., Stojanovic S., Vucurevic N. and Turcic M. Chorogenic and quinic acids in sunflower meal. J.
Sci. Food Agric. 1968, 19, 108-113. Murphy D.J. Designer oil crops : breeding, processing and biotechnology, Weinheim, New York, 1994. Nuzzolo C., Vignola R. and Groggia A. Method for preparing a proteinic isolate from sunflowerseed meal
using aluminum salts. United States Patent (4,212,799), 1980. O'Connor D.E. Preparing light-colored protein isolate from sunflower meal by acid washing prior to
alkaline extraction. United States Patent (3,586,662), 1971a. O'Connor D.E. Preparing light-coloured protein isolate from sunflower meal by alkali extraction under an
inert gas blanket followed by membrane ultrafiltration. United States Patent (3,622,556), 1971b. Osborne T.B. In The vegetable proteins; Longmans, Green: London, 1924; 154. Osborne T.B. and Campbell G.F. The proteids of the sunflower seed. J. Am. Chem. Soc. 1897, 19, 487-
494. Pandya M.J., Sessions R.B., Williams P.B., Dempsey C.E., Tatham A.S., Shewry P.R. and Clarke A.R.
Structural characterization of a methionine-rich, emulsifying protein from sunflower seed. Proteins: Str. Funct. Gen. 2000, 38, 341-349.
Parrado J., Millan F., Hernandez Pinzon I., Bautista J. and Machado A. Characterization of enzymatic sunflower protein hydrolysates. J. Agric. Food Chem. 1993, 41, 1821-1825.
24

General introduction
Pawar V.D., Patil J.N., Sakhale B.K. and Agarkar B.S. Studies on selected functional properties of defatted sunflower meal and its high protein products. J. Food Sci. Techn. 2001, 38, 47-51.
Pearce R.J. Preparation of protein isolate from sunflower seed. United States Patent (4,435,319), 1984. Petit L., Davin A. and Guéguen J. Purified sunflower seed protein isolates. United States Patent
(4,174,313), 1979. Pierpoint W.S. O-Quinones formed in plant extracts; their reactions with amino acids and peptides.
Biochem. J. 1969, 112, 609-616. Plietz P., Damaschun G., Muller J.J. and Schwenke K.D. The structure of 11-S globulins from sunflower
and rape seed. A small-angle X-ray scattering study. Eur. J. Biochem. 1983, 130, 315-20. Pomenta J.V. and Burns E.E. Factors affecting chlorogenic, quinic and caffeic acid levels in sunflower
kernels. J. Food Sci. 1971, 36, 490-492. Popineau Y., Tatham A.S., Shewry P.R., Marion D. and Guéguen J. 2S sunflower albumins : functional
properties of native and modified proteins. In Plant Proteins from European Crops. Food and non-food applications; Guéguen J. and Popineau Y., eds; INRA Editions: Nantes (France), 1998; 131-135.
Prakash V. and Rao M.S.N. Physicochemical properties of oilseed proteins. CRC Crit. Rev. Biochem. 1986, 20, 265-363.
Prasad D.T. Characterization of sunflower albumins. Food Sci. Technol-Leb. 1987, 20, 22-25. Prasad D.T. Proteins of the phenolic extracted sunflower meal: I. Simple method for removal of
polyphenolic components and characteristics of salt soluble proteins. Lebensm.-Wiss. Technol.-Food Sci. Technol. 1990, 23, 229-235.
Prins A. Principles of foam stability. In Advances in food emulsions and foams; Dickinson E. and Stainsby G., eds; Elsevier: London, 1988; 91-121.
Privalov P.L. Stability of proteins. Small globular proteins. Adv. Protein Chem. 1979, 33, 167-241. Privalov P.L. and Potekhin S.A. Scanning microcalorimetry in studying temperature-induced changes in
proteins. Methods Enzymol. 1986, 131, 4-51. Rahma E.H. and Rao M.S.N. Characterization of sunflower proteins. J. Food Sci. 1979, 579-582. Rahma E.H. and Rao M.S.N. Isolation and characterization of the major protein fraction of sunflower
seeds. J. Agric. Food Chem. 1981a, 29, 518-521. Rahma E.H. and Rao M.S.N. Removal of polyphenols from sunflower meal by various solvents: effects
on functional properties. J. Food Sci. 1981b, 46, 1521-1522. Raymond J., Dalgalarrondo M., Azanda J.L. and Ducastaing A. Preparation of protein isolates from
sunflower cakes. Re. Fr. Corps Gras 1984, 6, 233-242. Raymond J., Mimouni B. and Azanza J.L. Variability in the 11S globulin fraction of seed storage protein
of Helianthus (Asteraceae). Plant Syst. Evol. 1994, 193, 69-79. Raymond J., Rakariyatham N. and Azanza J.L. Functional properties of a new protein isolate from
sunflower oil cake. Food Sci. Technol-Leb. 1985, 18, 256-263. Raymond J., Robin Jean M. and Azanza Jean L. 11 S seed storage proteins from Helianthus species
(Compositae): Biochemical, size and charge heterogeneity. Plant Syst. Evol. 1995, 198, 195-208. Regitano d'Arce M.A., Assis R.d.P. and Lima U.d.A. Functional properties of sunflower seed meal
obtained by ethanol extraction. Arch. Latinoam. Nutr. 1994a, 44, 29-32. Regitano d'Arce M.A., Gutierrez E.M. and Lima U.d.A. Sunflower seed protein concentrates and isolates
obtention from ethanol oil extraction meals (technical note). Arch. Latinoam. Nutr. 1994b, 44, 33-5.
25

Chapter 1
Reichelt R., Schwenke K.D., Konig T., Pahtz W. and Wangermann G. Electron microscopic studies for estimation of the quaternary structure of the 11S globulin (helianthinin) from sunflower seed (Helianthus annuus L.). Biochemie und Physiologie der Pflanzen 1980, 175, 653-663.
Robertson J.A. Use of sunflower seed in food products. CRC Crit. Rev. Food Sci. Nutr. 1975, 6, 201-240. Robertson J.A. and Russell R.B. Sunflower: America's neglected crop. J. Am. Oil Chem. Soc. 1972, 49,
239-244. Rossi M. and Germondari I. Production of a food-grade protein meal from defatted sunflower. II.
Functional properties evaluation. Lebensm.-Wiss. Technol.-Food Sci. Technol. 1982, 15, 313-316.
Rossi M., Pagliarini E. and Peri C. Emulsifying and foaming properties of sunflower protein derivatives. Lebensm.-Wiss. Technol.-Food Sci. Technol. 1985, 18, 293-299.
Rudkin G.O. and Nelson J.M. Chlorogenic acid and respiration of sweet potatoes. J. Am. Chem. Soc. 1947, 69, 1470.
Sabir M.A., Sosulski F.W. and Finlayson A.J. Chlorogenic acid-protein interactions in sunflower. J. Agric. Food Chem. 1974a, 22, 575-578.
Sabir M.A., Sosulski F.W. and Hamon N.W. Sunflower carbohydrates. J. Agric. Food Chem. 1975, 23, 16-19.
Sabir M.A., Sosulski F.W. and Kernan J.A. Phenolic constituents in sunflower flour. J. Agric. Food Chem. 1974b, 22, 572-574.
Sabir M.A., Sosulski F.W. and MacKenzie S.L. Gel chromatography of sunflower proteins. J. Agric. Food Chem. 1973, 21, 988-993.
Saeed M. and Cheryan M. Sunflower protein concentrates and isolates low in polyphenols and phytate. J. Food Sci. 1988, 53, 1127-1143.
Saeed M. and Cheryan M. Chlorogenic acid interactions with sunflower proteins. J. Agric. Food Chem. 1989, 37, 1270-1274.
Salunkhe D.K., Chavan J.K., Adsule R.N. and Kadam S.S. Sunflower. In World oilseeds: chemistry, technology and utilization; Van Nostrand Reinhold: New York, 1992; 97-139.
Sanchez A.C. and Burgos J. Thermal Gelation of Sunflower Proteins. In Food Macromolecules and Colloids; Dickinson E. and Lorient D., eds; Royal Society of Chemistry: Cambridge, United Kingdom, 1995; 426-430.
Sanchez A.C. and Burgos J. Gelation of sunflower globulin hydrolysates: Rheological and calorimetric studies. J. Agric. Food Chem. 1997, 45, 2407-2412.
Sastry M.C.S. and Rao M.S.N. Binding of chlorogenic acid by the isolated polyphenol-free 11S protein of sunflower (Helianthus annuus) seed. J. Agric. Food Chem. 1990, 38, 2103-2110.
Sastry M.C.S. and Subramanian N. Preliminary studies on processing of sunflower seed to obtain edible protein concentrates. J. Am. Oil Chem. Soc. 1984, 61, 1039-1042.
Schmid F.X. Spectral methods of characterizing protein conformation and conformational changes. In Protein Structure: A practical approach; Creighton T. E., eds; IRL PRESS: Oxford, 1997; 251-284.
Schwenke K.D., Paehtz W., Linow K.J., Raab B. and Schultz M. On seed proteins. XI. Purification, chemical composition, and some physico-chemical properties of the 11 S globulin (Helianthinin) in sunflower seed. Nahrung 1979, 23, 241-254.
Schwenke K.D., Prahl L., Rauschal E., Gwiazda S., Dabrowski K. and Rutkowski A. Functional properties of plant proteins. II. Selected physico-chemical properties of native and denatured isolates from faba beans, soybeans, and sunflower seed. Nahrung 1981, 25, 59-69.
26

General introduction
Schwenke K.D. and Raab B. Uber Samenproteine. 1. Mitt. Fraktionenverteilung der proteine aus sonnenblumensamen. Nahrung 1973, 17, 373-379.
Schwenke K.D., Schultz M. and Linow K.J. Isolierung und Charakterisierung des 11-S-Globulins aus Sonnenblumensamen (Helianthus annuus L.). Nahrung 1975a, 19, 817-822.
Schwenke K.D., Schultz M. and Linow K.J. Ueber Samenproteine. 5. Dissoziationsverhalten des 11-S-Globulins aus Sonnenblumensamen. Nahrung 1975b, 19, 425-432.
Schwenke K.D., Schultz M., Linow K.J., Uhlig J. and Franzke C. Ueber Samenproteine. 4. Isolierung der Globulin-Hauptkomponente aus Sonnenblumensamen. Nahrung 1974, 18, 709-719.
Shewry P.R. and Pandya M.J. The 2S albumins storage proteins. In Seed Proteins; Shewry P. R. and Casey R., eds; Kluwer Academic Publishers: Amsterdam, 1999; 619-664.
Shotwell M.A., Afonso C., Davies E., Chesnut R.S. and Larkins B.A. Molecular characterization of oat seed globulins. Plant Physiol. 1988, 87, 698-704.
Smulders P.A.E. Formation and stability of emulsions made with proteins and peptides. Ph.D Thesis. Wageningen University, Wageningen (The Netherlands). 2000.
Sodini G. and Canella M. Acidic butanol removal of color-forming phenols from sunflower meal. J. Agric. Food Chem. 1977, 25, 822-825.
Sosulski F. Organoleptic and nutritional effects of phenolic compounds on oilseed protein products: a review. J. Am. Oil Chem. Soc. 1979, 56, 711-715.
Sosulski F. and Fleming S.E. Chemical, functional, and nutritional properties of sunflower protein products. J. Am. Oil Chem. Soc. 1977, 54, 100A-104A.
Sosulski F.W. and Bakal A. Isolated proteins from rapeseed, flax and sunflower meals. Can. I. Food. Tech. J. 1969, 2, 28-32.
Sosulski F.W., McCleary C.W. and Soliman F.S. Diffusion extraction of chlorogenic acid from sunflower kernels. J. Food Sci. 1972, 37, 253-256.
Sripad G. and Rao M.S.N. Effect of methods to remove polyphenols from sunflower meal on the physicochemical properties of the proteins. J. Agric. Food Chem. 1987, 35, 962-967.
Swiss-prot http://us.expasy.org/cgi-bin/niceprot.pl?P15461, p15461. Swiss-prot http://us.expasy.org/cgi-bin/niceprot.pl?P19084, p19084. Swiss-prot http://us.expasy.org/cgi-bin/niceprot.pl?P23110, p23110. Tranchino L., Costantino R. and Sodini G. Food grade oilseed protein processing: sunflower and
rapeseed. Qual. Plant. 1983, 32, 305-334. van Nieuwenhuyzen W. 2003. Central Soya. Personal Communication. Aarthus C, Denmark. Venktesh A. and Prakash V. Functional properties of the total proteins of sunflower (Helianthus annuus
L.) seed: effect of physical and chemical treatments. J. Agric. Food Chem. 1993a, 41, 18-23. Venktesh A. and Prakash V. Low molecular weight proteins from sunflower (Helianthus annuus L.) seed:
effect of acidic butanol treatment on the physicochemical properties. J. Agric. Food Chem. 1993b, 41, 193-198.
Vermeesch G., Briffaud J. and Joyeux J. Sunflower proteins in human food. Re. Fr. Corps Gras 1987, 7-8, 333-344.
Vonder Haar R.A., Allen R.D., E.A. C., Nessler C.L. and Thomas T.L. Organization of the sunflower 11S storage protein gene family. Gene 1988, 74, 433-443.
Wagner J.R. and Guéguen J. Effects of dissociation, deamidation, and reducing treatment on structural and surface active properties of soy glycinin. J. Agric. Food Chem. 1995, 43 (8), 1993-2000.
Wagner J.R. and Guéguen J. Surface functional properties of native, acid-treated and reduced soy glycinin. 1. Foaming properties. J. Agric. Food Chem. 1999a, 47, 2173-2180.
27

Chapter 1
28
Wagner J.R. and Guéguen J. Surface functional properties of native, acid-treated and reduced soy glycinin. 2. Emulsifying properties. J. Agric. Food Chem. 1999b, 47, 2181-2187.
Walstra P. Overview of emulsion and foam stability. In Food emulsions and foams; Dickinson E., eds; Royal Society of Chemistry: London, 1987; 242-257.
Walstra P. Emulsion stability. In Encyclopedia of emulsion technology; Becher P., eds; Marcel Dekker: New York, 1996; 1-62.
Walstra P. and Smulders P.A.E. Making emulsions and foams: An overview. In Food colloids: Proteins, lipids and polysaccharides; Dickinson E. and Bergenståhl B., eds; The Royal Society of Chemistry: Cambridge, 1997; 367-381.
Wan P.J., Baker G.W., Clark S.P. and Matlock S.W. Characteristics of sunflower seed meal. Cereal Chem. 1979, 56, 352-355.
Wastyn M.M., Zhang A., Hagen A., Kastner R. and Taufratzhofer E. Functionality of protein isolates and concentrates from pea, sunflower, rapeseed and potato. In Food proteins: structure and functionality; Schwenke D. K. and Mothes R., eds; VCH publishers Weinheim: 1993; 324-326.
Wu J.S., Wisakowsky E.E. and Burns E.E. Emulsion capacity and foam stability of re-extracted sunflower meal (Helianthus annuus). J. Food Sci. 1976, 41, 965-966.
www.franquart.fr Youle R.J. and Huang A.H.C. Occurrence of low molecular weight and high cysteine containing albumin
storage proteins in oilseeds of diverse species. Am. J. Bot. 1981, 68, 44-48.

Chapter 2
Isolation and characterization of undenatured chlorogenic acid-free sunflower proteins*
Abstract
A method for obtaining sunflower protein isolate, undenatured and free of chlorogenic acid, has been developed. During the isolating procedure, the extent of CGA removal and protein denaturation was monitored. The defatted flour contained 2.5 % (w/w) CGA as main phenolic compound. Phenolic compounds were removed by aqueous methanol 80 % (v/v) extraction, before protein extraction at alkaline pH and diafiltration. Differential scanning calorimetry and solubility tests indicated that no denaturation of the proteins had occurred. The resulting protein products were biochemically characterised and the presence of protein-CGA complexes was investigated. Sunflower proteins of the studied variety were found to be composed of two main protein fractions: 2S albumins and 11S globulins. In contrast to what has been previously reported, CGA was found to elute as free CGA, being not covalently associated to any protein fraction. *Based on: Sergio Gonzalez-Perez, Karin B. Merck, Johan M. Vereijken, Gerrit A. van Koningsveld, Harry Gruppen, Alphons G.J. Voragen. Isolation and characterization of undenatured chlorogenic acid free sunflower (Helianthus annuus) proteins. Journal of Agricultural and Food Chemistry. 2002, 50, 1713-1719.

Chapter 2
Introduction Sunflower seeds are used in the food industry as a source of oil. One of the by-
products of the oil extraction process is sunflower meal which has a high protein content (40-50 %), making sunflower meal an attractive protein source. Furthermore, sunflower protein (SFP) is reported to contain no antinutritional components, such as protease inhibitors, and the amino acid composition of its proteins complies largely with the FAO (Food and Agriculture Organisation) pattern with the exception of lysine (Miller and Pretorius, 1985). Moreover, SFP consists mainly of albumins and globulins (70-85 %) and, therefore, has a high intrinsic solubility. As solubility is a prerequisite for many functional properties, SFP may prove to have high potential for use as a food ingredient.
However, nowadays the main outlet of SFP is in animal feed. One of the reasons is that during oil production, due to mechanical pressing and solvent extraction at elevated temperatures, protein denaturation occurs, resulting in an insoluble and non-functional protein fraction (Lusas, 1985). Another reason that hampers the application of SFP as a food ingredient is the presence of relatively high amounts of phenolic compounds, especially chlorogenic acid (CGA). Phenolic compounds interact and form complexes with proteins, thereby reducing both their digestibility and functionality (Sripad and Narasinga Rao, 1987; Sastry and Rao, 1990). Furthermore, the presence of CGA results in a dark colour of sunflower protein products (Mikolajczak et al., 1970; Sabir et al., 1974b; Lawhon et al., 1982). The interaction may become irreversible when, under alkaline conditions, phenolic compounds autocatalytically oxidise to quinones and react with functional protein groups, such as amines, thiols, thioethers, indole, imidazole, and disulfide groups (Venktesh and Prakash, 1993b).
Many methods have been proposed for isolating SFP and removing phenolic compounds from sunflower seeds. They are mainly based on the following principles: (i) extraction with mixtures of organic solvents and water (Mikolajczak et al., 1970; Pomenta and Burns, 1971; Cater et al., 1972; Sodini and Canella, 1977; Saeed and Cheryan, 1988; Prasad, 1990; Venktesh and Prakash, 1993a; Venktesh and Prakash, 1993b; Regitano d'Arce et al., 1994; Sanchez and Burgos, 1995), (ii) extraction with aqueous solutions of acids, salts or/and reducing agents (O'Connor, 1971a; Hagenmaier, 1974; Rahma and Narasinga Rao, 1981a; Pearce, 1984; Sastry and Subramanian, 1984; Sastry and Rao, 1990), (iii) membrane filtration (O'Connor, 1971b), (iv) precipitation of pigments and non-protein compounds (Petit et al., 1979; Bau and Debry, 1980; Nuzzolo et al., 1980) and (v) combinations thereof (Gheyasuddin et al., 1970; Sosulski et al., 1972; Fan et al., 1976; Rahma and Narasinga Rao, 1979; Rahma and Narasinga Rao, 1981b; Raymond et al., 1984). Of all the methods described, the most promising ones with respect to efficiency of CGA-extraction are those which extract phenolic compounds with mixtures of organic solvents and water (Tranchino et al., 1983; Sripad and Narasinga Rao, 1987; Vermeesch et al., 1987; Prasad, 1990). However, a major
30

Isolation of undenatured CGA free sunflower proteins
disadvantage of these methods may be that organic solvent water mixtures are known (Lustig and Fink, 1992; Srinivasulu and Rao, 1995; Bakhuni, 1998; Grinberg et al., 1998) to cause protein denaturation which may result in diminished solubility and protein recovery. Methanol, ethanol and 2-propanol are especially promising with respect to both protein recovery (Berot and Briffaud, 1983; Vermeesch et al., 1987) and CGA extractability (Berot and Briffaud, 1983; Sripad and Narasinga Rao, 1987). In contrast, several studies have revealed the protein denaturing effect (Rahma and Narasinga Rao, 1981b; Venktesh and Prakash, 1993a; Venktesh and Prakash, 1993b; Sanchez and Burgos, 1997) of butanol and acetone, mainly monitored by the decrease in protein solubility. No information, other than that on solubility properties, is known about the protein denaturing effect of methanol, ethanol and 2-propanol mixtures during the CGA removal in sunflower meal.
To be able to assess the intrinsic properties of SFP as a functional food ingredient, the protein should be both free of CGA and non-denatured. In the research described in this paper, an isolation procedure is set-up to meet these requirements. Therefore, during the isolation procedure, the extent of CGA removal, the presence of protein-CGA complexes and the protein denaturation are monitored. Furthermore, the resulting protein products are biochemically characterised. Materials and Methods
Materials Dehulled “Mycogen Brand” sunflower seeds were purchased from H.Ch. Schobbers B.V. (Echt, The Netherlands). Chlorogenic acid (CGA) and caffeic acid (CA) were purchased from Sigma (Zwijndrecht, The Netherlands). Hexane was purchased from Chemproha (Dordrecht, The Netherlands). All other chemicals were obtained from Merck (Darmstadt, Germany). Preparation of the defatted meal (DM)
The dehulled seeds were milled in a laboratory grinder (Janke and Kunkel GmbH, Staufen, Germany) for 3 min, avoiding high temperature by cooling the grinder periodically with liquid nitrogen. The resulting meal (named seed meal, SM) was defatted by hexane extraction at room temperature. The meal was extracted 4 times, each during 2 hr, using a meal to solvent ratio of 1:5 (w/v). The defatted meal was separated by paper filtration (Whatman no1) and left to dry overnight at room temperature.
31

Chapter 2
Preparation of the defatted dephenolised meal (DDM) DM was extracted with cold (4 °C) mixtures of organic solvents and water [ethanol 95 % (v/v), 2-propanol 70 % (v/v) and methanol, 80 % (v/v)] at a meal to solvent ratio of 1:20 (w/v) by stirring the suspension for 4 hr. After filtration, the extraction was repeated until the extract no longer developed a yellow colour upon addition of NaOH. Finally, the defatted dephenolised protein (DDM) was dried in a vacuum oven at 30° C, overnight. Chemical analysis Moisture and ash content were determined gravimetrically according to Method 44-15A (AACC, 1995) and Method 08-16 (AACC, 1995), respectively. Fat content was determined according to the Method 30-25 (AACC, 1995). Crude protein content (N x 6.25) of meal and protein products was determined by the Kjeldahl method, 46-12 (AACC, 1995). All analyses were carried out at least in duplicate. Preparation of the sunflower isolate (SI) The DDM obtained was suspended in water [2 %, (w/v)] and stirred for 30 min while keeping the pH at 9.0 by addition of 1 N NaOH. Soluble protein was recovered by centrifugation (30000g, 20 min, 20 °C). The pellet was re-extracted (similar conditions) and the two supernatants combined to render the extract (E). This extract was subjected to diafiltration using extensive washing. This filtration process was carried out by circulation through a 10 kDa TFF cartridge (Millipore Corporation, Bedford). The retentate obtained was subsequently freeze-dried and denoted sunflower isolate (SI). Protein extractability Protein extractability of DM or DDM was studied as a function of pH. A dispersion of DM or DDM representing 0.5 g of protein in 45 ml of water was stirred for 5 min at room temperature. Then, the pH was adjusted to the desired value by addition of 1 N NaOH or HCl. Stirring was continued for 1h, while the pH was monitored every 15 min and readjusted, if necessary. The final volume was adjusted to 50 ml using water. After centrifugation (30000 g, 30 min, 20 ºC), the supernatant was filtered to remove floating particles. Aliquots of the supernatant were freeze-dried, and their protein content was determined by Kjeldahl analysis. Extractability measurements were performed at least in duplicate. Sugar content
The neutral sugar content and composition of the fractions were analysed as alditol acetates (Englyst and Cummings, 1984). Fractions were subjected to pretreatment with 72 % (w/w) H2SO4 for 1 h at 30 ºC prior to hydrolysis with 1M H2SO4 for 3 h at 100 ºC using inositol as an internal standard. Alditol acetates were separated on a DB-225 [5 m × 0.53 mm internal diameter; film thickness 1.0 µm] (J&W
32
Isolation of undenatured CGA free sunflower proteins
Scientific Folsom, Ca, USA) in a CE Instruments GC 8000 TOP (ThermoQuest Italia, Milan, Italy) and operated at 200 ºC and equipped with a F.I.D (ThermoQuest Italia, Milan, Italy) detector set at 270 ºC. Uronic acid content was determined according to Thibault (Thibault, 1979) using glucuronic acid as standard. In this method, 96 % (w/w) H2SO4 containing 0.0125 M sodium tetraborate was used in order to quantify glucuronic acid as well as galacturonic acid residues.
Gel electrophoresis
Sodium dodecyl sulfate polyacrylamide gel electrophoresis (SDS-PAGE) was performed according to the method of Laemmli (Laemmli, 1970) on a Mini-PROTEAN II electrophoresis Cell (BIO-RAD, Veenendaal, The Netherlands), following the instruction of the manufacturer. Protein samples of 10-15 µg were dissolved in either reducing or non-reducing sample buffer, and applied to homogeneous 12 % gels. After electrophoresis the gels were stained with Coomassie Brilliant Blue. Low molecular weight markers ranged from 14 to 94 kDa (Amersham, Pharmacia Biotech, Uppsala, Sweden): α-lactalbumin (14,400), soybean trypsin inhibitor (20,100), carbonic anhydrase (30,000), ovalbumin (43,000), BSA (67,000) and phosphorylase b (94,000).
Differential scanning calorimetry (DSC)
The calorimetric studies were performed using a differential scanning calorimeter Micro-DSC III (Seteram, Caluire, France). A 9 % (w/w) protein dispersion in 50 mM sodium phosphate buffer, pH 7.0, containing 0.2 M NaCl was used. Heating was performed at a rate of 1 °C/min over the temperature range 20-120 °C. The measurements were carried out in duplicate.
Gel permeation chromatography
Gel permeation chromatography was performed on an Äkta Explorer System (Amersham, Pharmacia Biotech, Uppsala, Sweden). Protein (5-10 mg/ml) was extracted at room temperature from SM, DM, DDM and SI with 50 mM sodium phosphate buffer, pH 6.9, containing 0.25 M NaCl. After centrifugation, the supernatants were applied directly to a Superose 6 HR 10/30 column and eluted with the same buffer at a flow rate of 0.5 ml/min at room temperature. The eluate was monitored at 214 and 324 nm. Solutions of CGA were analysed according to the same procedure to determine its elution volume.
Determination of chlorogenic acid (CGA) and caffeic acid (CA) CGA and CA were extracted by incubating 250 mg of sample with 25 ml of 80 % (v/v) aqueous methanol at 60 ºC during 1 hour. The extraction was performed 4 times. The extracts were filtered, pooled, dried in a GyroVap speed-vacuum (HOWE, Etten-Leur, the Netherlands) and redissolved in 4 % acetic acid (v/v) in water. CGA and CA content were determined by reversed-phase HPLC (Waters TM 2690 Separations
33

Chapter 2
Module, Etten-Leur, the Netherlands), using a SymmetryTM C18 column at room temperature and at a flow rate of 1 ml/min. The eluent was a mixture of A (4 % acetic acid (v/v) in methanol) and B (4 % acetic acid (v/v) in water). After isocratic elution during 5 minutes with 10 % A/ 90 % B, linear gradient to 25 % A/ 75 % B in 10 min and to 90 % A/ 10 % B in 1 minute were used, followed by isocratic elution for 1 minute 90 % A/ 10 % B . The eluate was monitored at 324 nm. Pure CGA and CA were employed as standards. Results and discussion Preparation of sunflower products Defatting
In order to remove oil, the dehulled sunflower seeds were extracted with hexane at room temperature. This gentle treatment resulted in a reduction of the fat content from 55 % (w/w) to 4 %(w/w). As a result, the protein content increased from 26 to 55 % (w/w) and the ash content from 3.3 to 7.0 % (w/w). The DM contains 2.5 % (w/w) CGA and 0.1 % (w/w) CA. Similar figures using dehulled seeds have been found previously (Berot and Briffaud, 1983; Vermeesch et al., 1987).
Dephenolising
Based on results obtained by other investigators (Moores et al., 1948; Milic et al., 1968; Mikolajczak et al., 1970; Pomenta and Burns, 1971; Sosulski et al., 1972; Rossi et al., 1980; Prasad, 1990), fixed concentrations of organic solvents in water were tested for their ability to extract phenolic compounds. Table 1 shows the amounts of CGA and CA extracted with the different solvents used. From this table it can be concluded that aqueous methanol and 2-propanol are equally efficient with respect to the amount of CGA and CA extracted, whereas aqueous ethanol turned out to be a poor extraction solvent for CGA. This finding is in agreement with previous publications (Cater et al., 1972; Sabir et al., 1974a). Because aqueous methanol and 2-propanol gave the best results, the use of these solvents was examined further.
Table 1: Protein extractability at pH 7.0 and 10.0 of the defatted meal (DM) before and after dephenolisation by different solvents and CGA and CA extracted by these solvents.
CGA a
extractability
CAa
extractability
Protein extractability (%) b
pH 7.0
Protein extractability (%) b
pH 10.0
DM - - 21 ± 1 79 ± 2 Methanol 80 % 100 ± 4 100 ± 6 19 ± 2 80 ± 2
2-propanol 70 % 88 ± 12 96 ± 8 18 ± 2 72 ± 1 Ethanol 95 % 24 ± 8 90 ± 4 - -
a Expressed as proportion (%) of extracted CGA or CA;b Amount of soluble protein expressed as proportion (%)
34

Isolation of undenatured CGA free sunflower proteins
Treatment of proteins with mixtures of water and organic solvent may lead to protein denaturation and a subsequent decrease in protein solubility. Therefore, the protein extractability of the dephenolised meals in water at two different pH’s was determined (Table 1). Aqueous 2-propanol clearly reduced protein extractability at pH 10.0 but only slightly at pH 7.0, whereas aqueous methanol did not affect the extractability at either values. Therefore, we further examined the effect of aqueous methanol on protein denaturation by DSC. Table 2 shows the enthalpy, temperature and onset temperature of denaturation of several sunflower products. In the DSC thermograms only one endothermic peak appears for the SM, DM and DDM samples around 100 ºC with a similar onset temperature of 95 ºC. Moreover, the enthalpy of denaturation per gram of protein does not differ significantly between the samples. This clearly indicates that the protein remained undenatured and is not affected by the treatments with either hexane (for defatting) or 80 % (v/v) aqueous methanol (for dephenolising). Denaturation temperatures found are in agreement with values previously reported (Tolstoguzov, 1988; Grinberg et al., 1989; Sanchez and Burgos, 1997). The calorimetric enthalpy of denaturation is similar to the one obtained by Sanchez and Burgos (Sanchez and Burgos, 1997), but is markedly lower than the value presented by other authors (Tolstoguzov, 1988; Grinberg et al., 1989). This discrepancy may be due to differences in experimental conditions, such as buffer used, pH and protein composition (11S/2S ratio).
Table 2: Enthalpy, temperature and onset temperature of denaturation as measured by DSC for sunflower products: seed meal (SM), defatted meal (DM), defatted and dephenolised meal (DDM) and sunflower isolate (SI).
Onset temperature of denaturation (°C)
Temperature of denaturation (°C)
Enthalpy of denaturation (J/g) a
SM 95.1 ± 0.2 101.5 ± 0.3 14.5 ± 0.2 DM 95.6 ± 0.3 101. 9 ± 0.1 15.2 ± 0.6
DDM 95.0 ± 0.1 101.1 ± 0.1 14.2 ± 0.5 SI 93.6 ± 0.2 99.7 ± 0.2 14.9 ± 0.4
aThe enthalpy values have been normalised for the protein content
The use of 80 % (v/v) aqueous methanol does not seem to result in protein denaturation, probably due to the low temperature applied during extraction and the presence of a high methanol concentration in the water mixture. The latter assures negligible protein solubility, preventing the hydration of proteins and, therefore, the binding of CGA. Subsequently, 80 % aqueous methanol was used for CGA removal in the remainder of this study.
35
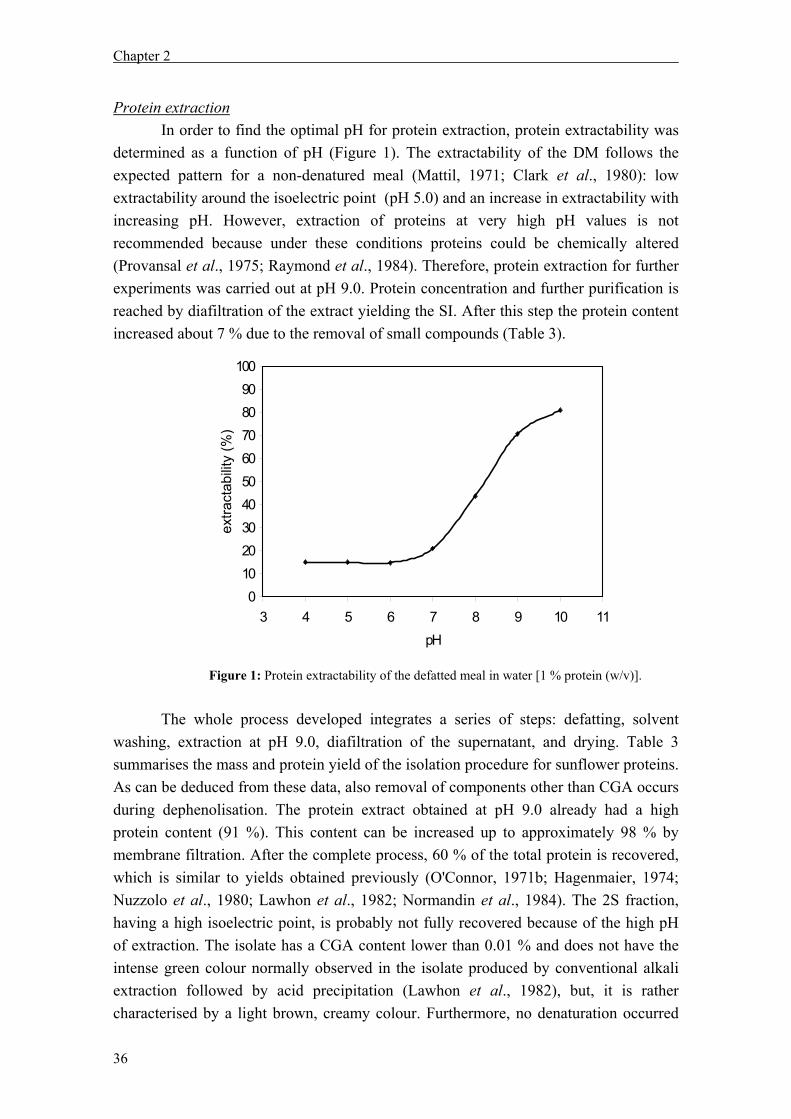
Chapter 2
Protein extraction In order to find the optimal pH for protein extraction, protein extractability was determined as a function of pH (Figure 1). The extractability of the DM follows the expected pattern for a non-denatured meal (Mattil, 1971; Clark et al., 1980): low extractability around the isoelectric point (pH 5.0) and an increase in extractability with increasing pH. However, extraction of proteins at very high pH values is not recommended because under these conditions proteins could be chemically altered (Provansal et al., 1975; Raymond et al., 1984). Therefore, protein extraction for further experiments was carried out at pH 9.0. Protein concentration and further purification is reached by diafiltration of the extract yielding the SI. After this step the protein content increased about 7 % due to the removal of small compounds (Table 3).
0102030405060708090
100
3 4 5 6 7 8 9 10 1pH
extra
ctab
ility
(%)
1
Figure 1: Protein extractability of the defatted meal in water [1 % protein (w/v)].
The whole process developed integrates a series of steps: defatting, solvent
washing, extraction at pH 9.0, diafiltration of the supernatant, and drying. Table 3 summarises the mass and protein yield of the isolation procedure for sunflower proteins. As can be deduced from these data, also removal of components other than CGA occurs during dephenolisation. The protein extract obtained at pH 9.0 already had a high protein content (91 %). This content can be increased up to approximately 98 % by membrane filtration. After the complete process, 60 % of the total protein is recovered, which is similar to yields obtained previously (O'Connor, 1971b; Hagenmaier, 1974; Nuzzolo et al., 1980; Lawhon et al., 1982; Normandin et al., 1984). The 2S fraction, having a high isoelectric point, is probably not fully recovered because of the high pH of extraction. The isolate has a CGA content lower than 0.01 % and does not have the intense green colour normally observed in the isolate produced by conventional alkali extraction followed by acid precipitation (Lawhon et al., 1982), but, it is rather characterised by a light brown, creamy colour. Furthermore, no denaturation occurred
36

Isolation of undenatured CGA free sunflower proteins
during the complete isolation procedure, as can be deduced from the DSC analysis of the SI (Table 2), since also the enthalpy of denaturation per gram of protein is the same as the one found for the proteins in the seed. Table 3: Yield of the isolation procedure and protein content of sunflower products: seed meal (SM), defatted meal (DM), defatted and dephenolised meal (DDM), extract (E) and sunflower isolate (SI).
Yield
Protein content (%) a Solids (%) b
Proteins (%) c
SM 26 ± 1 100 100 DM 55 ± 1 46 ± 2 98 ± 2
DDM 66 ± 1 36 ± 2 94 ± 3 E 91 ± 3 17 ± 2 61 ± 4 SI 98 ± 2 15 ± 2 59 ± 2
a Expressed as percentage of proteins in the sunflower protein product; b Expressed as percentage of solids respect to the amount present in the seeds; c Expressed as percentage of proteins respect to the proteins present in the seeds
Characterisation of sunflower products Protein characterization
SDS-PAGE analysis under non-reducing (Figure 2a) and reducing (Figure 2b) conditions was performed to identify the protein composition of SFP and to investigate the effect of the isolation procedure on protein composition. In Figure 2a, two main groups of proteins can be distinguished: the group of high molecular weight (HMW) proteins consisting mainly of proteins having a molecular weight of about 60-70 kDa, and low molecular weight (LMW) proteins having a molecular weight of less than 20 kDa. These proteins have been previously identified as 11S globulins and 2S albumins (Dalgalarrondo et al., 1985; Kortt and Caldwell, 1990). The 11S fraction is reported to have a molecular weight of 300-350 kDa and to be composed of six subunits (Sabir et al., 1973; Schwenke et al., 1979). Each subunit contains two disulfide linked polypeptide chains (Grinberg et al., 1989). After reduction (Figure 2b), the HMW fraction appears to be split into polypeptides of approximately 40, 30 and 24 kDa, as previously reported (Dalgalarrondo et al., 1984 and 1985).
These findings indicate that this sunflower variety consists of 11S and 2S proteins. This is further confirmed by gel permeation chromatography. The protein present in the DDM and SI eluted into two major peaks (Figure 3, panels A and B) corresponding to the 11S (Peak I) and 2S (peak II) fraction, respectively, as confirmed by the SDS-PAGE analysis of the proteins present in the peaks (results not shown).
37

Chapter 2
MW 1 2 3 4 5 6 MW
94 kDa
67 kDa
43 kDa
30 kDa
20.1 kDa
14.4 kDa
MW 1 2 3 4 5 6 MW
94 kDa
67 kDa
43 kDa
30 kDa
20.1 kDa
14.4 kDa
b
a Figure 2: SDS-polyacrylamide gel electrophoresis patterns of SFP products analysed using 12 % gels. (a) Without and (b) with reduction. Lane 1, seed meal (SM); lane 2, defatted meal (DM); lane 3, defatted and dephenolised meal (DDM); lane 4, extract (E); lane 5, pellet (P); and lane 6, sunflower isolate (SI). The molecular weights of marker proteins (MW lines) are indicated.
38

Isolation of undenatured CGA free sunflower proteins
A
0
20
40
60
80
100
120
140
160
180
200
10 15 20 25 30 35 40 45elution volume (ml)
abso
rban
ce (2
14 n
m)
0
10
20
30
40
50
60
70
80
abso
rban
ce (3
24 n
m)
B
0
20
40
60
80
100
120
140
160
180
200
10 15 20 25 30 35 40 45elution volume (ml)
abso
rban
ce (2
14 n
m)
0
10
20
30
40
50
60
70
80
abso
rban
ce (3
24 n
m)
C
0
20
40
60
80
100
120
140
160
180
200
10 15 20 25 30 35 40 45elution volume (ml)
abso
rban
ce (2
14 n
m)
0
80
160
abso
rban
ce (3
24 n
m)
D
0
20
40
60
80
100
120
140
160
180
200
10 15 20 25 30 35 40 45elution Volume (ml)
abso
rban
ce (2
14 n
m)
0
20
40
60
80
Abso
rban
ce (3
24 n
m)
Peak I Peak II Peak I
Peak II
Peak IV Peak I Peak II Peak IV
Peak III
Figure 3: Chromatograms of sunflower proteins monitored at 214 nm (thin line), and 324 nm (thick line); the absorbance is given in milli-absorbance units (mAU). Panel A, defatted dephenolised meal (DDM); panel B, sunflower isolate (SI); panel C, pure chlorogenic acid (CGA); panel D, seed meal (SM).
Characterisation of carbohydrates
Table 4 shows the total sugar content and molar neutral sugar composition of the mono-, oligo- and polysaccharides present in the different sunflower products. From the total sugar content it can be seen that, as expected, most of the carbohydrates are removed during the production of the isolate. The carbohydrate composition of the SI, high amounts of arabinose, galactose and uronic acid, is typical for pectic substances and strongly resembles that of a 0.05 M Na2CO3 extract of sunflower meal (Dusterhoft et al., 1991).
Dispersion of the freeze-dried SI in sodium acetate buffer pH 5.0 and extensive washing resulted in liberation of arabinose and galactose rich pectic material and lowered the total sugar content of the SI to 0.6 % (w/v) being relatively enriched in uronic acid (no further results shown). Incubation of the SI fraction with specific pectinolytic enzymes (polygalacturonase, pectin lyase, pectin methylesterase, rhanogalacturonase, rhamnogalacturonan acetyl esterase, endo-arabanase, endo-
39

Chapter 2
galactanase, endo-glucanase V and combinations thereof) did not result in a further lowering of the total sugar content compared to the addition of sodium acetate buffer alone. This points at either physically or chemically enzyme inaccessible pectic material rather than a specific covalently carbohydrate-protein complex.
Table 4: Total sugar content and molar neutral sugar composition of the mono-, oligo- and polysaccharides present in the different sunflower products
Molar composition (%)
Total sugar content a Ara Xyl Man Gal Glc UA
SM 10 16 6 7 11 46 14DM 18 19 7 7 10 42 15
DDM 14 27 10 9 7 27 22 SI 2 29 6 9 21 11 27
a expressed as weight percentage of each fraction; Ara= arabinose; Xyl= xylose; Man = mannose; Gal = galactose; Glc = glucose; UA = uronic acids
Interaction of CGA with proteins
In order to determine whether CGA is bound to the proteins, gel permeation chromatography was performed. Absorbance was monitored at 214 nm to detect proteins and at 324 nm to specifically monitor CGA. However, it should be emphasised that not only proteins, but also CGA absorbs at 214 nm (Figure 3, panel C).
In the chromatograms of DDM and SI (Figure 3, panels A and B), no absorbance was measured at 324 nm, which is a clear indication that CGA has been removed efficiently. Subsequently, all 214 nm peaks in these chromatograms (denoted peak I and peak II) can be ascribed to the sunflower proteins.
However, the 214 nm chromatogram of sunflower seed (Figure 3, panel D) reveals two additional peaks. Peak III, which absorbs at 214 nm, but not at 324 nm, can be attributed to small molecular weight material eluting at the total volume of the column (about 25 ml). Peak IV is most probably due to the presence of CGA. It has maximum absorbance at 324 nm and it elutes at the same position as free CGA (Figure 3, panel C). Furthermore, spiking of DM with pure CGA showed that this peak can be attributed to free CGA. After spiking, the ratio of the total area of all peaks at 214 nm over those at 324 nm decreased, whereas it was constant when evaluated only for peak IV. Moreover, its position far behind the total volume of the column is in accordance with the observations that aromatic compounds interact with agarose or dextran-based gel materials (Haslam, 1998).
Many authors reported that CGA appeared mainly in the form of complexes or with proteins in sunflower products, either preferentially, with LMW proteins (Sabir et al., 1973; Sabir et al., 1974a; Kabirullah and Wills, 1983; Prasad, 1990; Venktesh and Prakash, 1993b), or HMW protein (Sastry and Rao, 1990), or non-preferentially (Rahma and Narasinga Rao, 1979; Rahma and Narasinga Rao, 1981a). Some of these authors
40

Isolation of undenatured CGA free sunflower proteins
detected, using gel permeation chromatography, peaks similar to the denoted peak IV. These detected peaks had their maximum absorbance at 324-328 nm and also their elution was retarded by the column. These peaks were interpreted as CGA-protein complexes rather than CGA. This interpretation was mainly based on the absorbance reduction at 280 nm upon dialysis. However, to our opinion this reduction is due to removal of CGA since this compound also absorbs at 280 nm. On the contrary, the absence of staining for protein in the polyacrylamide electrophoresis (results not shown) and the experiments described above confirm that peak IV solely consists of CGA. Our observations clearly show that most of the CGA elutes as free CGA at high elution volumes rather than as protein-CGA complexes.
Summarising, when aqueous methanol is used for removal of CGA from sunflower seed meal, a protein isolate free of CGA and consisting of non-denatured protein can be obtained. In addition, with the method used, the CGA does not form complexes with proteins.
Literature cited AACC Approved Methods of the American Association of Cereal Chemists, 9th ed, The American
Association of Cereal Chemists Inc, St. Paul, USA, 1995. Bakhuni V. Alcohol-induced molten globule intermediates of proteins: Are they really folding
intermediates or off pathway products? Arch. Biochem. Biophys. 1998, 357, 274-284. Bau H.M. and Debry G. Colourless sunflower protein products: chemical and nutritional evaluation of the
presence of phenolic compounds. J. Food Techn. 1980, 15, 207-215. Berot S. and Briffaud J. Parameters for obtaining concentrates from rapeseed and sunflower meal. Qual.
Plant. 1983, 33, 237-242. Cater C.M., Gheyasuddin S. and Mattil K.F. The effect of chlorogenic, quinic, and caffeic acids on the
solubility and color of protein isolates, especially from sunflower seed. Cereal Chem. 1972, 49, 508-514.
Clark S.P., Wan P.J. and Matlock S.W. Pilot plant production of sunflower seed flour. J. Am. Oil Chem. Soc. 1980, 57, 267-279.
Dalgalarrondo M., Raymond J. and Azanza J.L. Sunflower seed proteins: characterization and subunit composition of the globulin fraction. J. Exp. Bot. 1984, 35, 1618-1628.
Dalgalarrondo M., Raymond J. and Azanza J.L. Sunflower seed protein: size and charge heterogeneity in subunits of the globulin fraction. Biochimie 1985, 67, 629-632.
Dusterhoft E.M., Engels F.M. and Voragen A.G.J. Non-starch polysaccharides from sunflower (Helianthus annuus) meal and palm-kernel (Elaeis guineensis) meal. I. Preparation of cell wall material and extraction of polysaccharide fraction. J. Sci. Food Agric. 1991, 55, 411-422.
Englyst H.N. and Cummings J.H. Simplified method for the measurement of total non-starch polysaccharides by gas-liquid chromatography of constituent sugars as alditol acetates. Analyst 1984, 109, 938-942.
Fan T.Y., Sosulski F.W. and Hamon N.W. New techniques for preparation of improved sunflower protein concentrates. Cereal Chem. 1976, 53, 118-125.
41

Chapter 2
Gheyasuddin S., Cater C.M. and Mattil K.F. Preparation of a colourless sunflower protein isolate. Food Tech. 1970, 24, 242-243.
Grinberg V., Danilenko A.N., Burova T.V. and Tolstoguzov V.B. Conformational stability of 11S globulins from seeds. J. Sci. Food Agric. 1989, 49, 235-248.
Grinberg V.Y., Grinberg N.Y., Burova T.V., Dalgalarrondo M. and Haertlé T. Biopolymers ethanol-induced conformational transitions in holo-α−lactalbumin: Spectral and calorimetric studies. Biopolymers 1998, 46, 253-265.
Hagenmaier R.D. Aqueous processing of full-fat sunflower seeds: yields of oil and protein. J. Am. Oil Chem. Soc. 1974, 51, 470-471.
Haslam E. Molecular recognition-Phenols and polyphenols. In Practical polyphenolics. From structure to molecular recognition and physiological action; Haslam E., eds; Cambridge University Press: Cambridge, United Kingdom, 1998; 138-177.
Kabirullah M. and Wills R.B.H. Characterization of sunflower protein. J. Agric. Food Chem. 1983, 31, 953-956.
Kortt A.A. and Caldwell J.B. Low molecular weight albumins from sunflower seed: Identification of a methionine-rich albumin. Phytochemistry 1990, 29, 2805-2810.
Laemmli U.K. Cleavage of structural proteins during the assembly of the head of bacteriophage T4. Nature 1970, 227, 681-685.
Lawhon J.T., Glass R.W., Manak L.J. and Lusas E.W. White-colored protein isolate from sunflower: processes and products. Food Tech. 1982, 36, 86-87.
Lusas E.W. Sunflower seed protein. In New protein foods; Altschul A. M. and Wilcke H. L., eds; Academic Press Inc.: Orlando, USA, 1985; 393-433.
Lustig B. and Fink A.L. The thermal denaturation of ribonuclease A in aqueous methanol solvents. Biochim. Biophys. Acta. 1992, 1119, 205-210.
Mattil K.F. The functional requirements of proteins for foods. J. Am. Oil Chem. Soc. 1971, 48, 477-480. Mikolajczak K.L., Smith C.R., Jr. and Wolff I.A. Phenolic and sugar components of Armavirec variety
sunflower (Helianthus annuus) seed meal. J. Agric. Food Chem. 1970, 18, 27-32. Milic B., Stojanovic S., Vucurevic N. and Turcic M. Chorogenic and quinic acids in sunflower meal. J.
Sci. Food Agric. 1968, 19, 108-113. Miller N. and Pretorius E. Evaluation of the effect of processing on sunflower protein quality. Food
Chem. 1985, 17, 65-70. Moores R.G., McDermott D.L. and Wood T.R. Determination of chlorogenic acid in coffee. Anal. Chem.
1948, 20, 620-624. Normandin F.C., Ducastaing A., Prevot A. and Raymond J. Preparation of protein isolates from
sunflower cakes. Re. Fr. Corps Gras 1984, 7-8, 293-299. Nuzzolo C., Vignola R. and Groggia A. Method for preparing a proteinic isolate from sunflowerseed meal
using aluminum salts. United States Patent (4,212,799), 1980. O'Connor D.E. Preparing light-colored protein isolate from sunflower meal by acid washing prior to
alkaline extraction. United States Patent (3,586,662), 1971a. O'Connor D.E. Preparing light-coloured protein isolate from sunflower meal by alkali extraction under an
inert gas blanket followed by membrane ultrafiltration. Unites States Patent (3,622,556), 1971b. Pearce R.J. Preparation of protein isolate from sunflower seed. United States Patent (4,435,319), 1984. Petit L., Davin A. and Guéguen J. Purified sunflower seed protein isolates. United States Patent
(4,174,313), 1979. Pomenta J.V. and Burns E.E. Factors affecting chlorogenic, quinic and caffeic acid levels in sunflower
kernels. J. Food Sci. 1971, 36, 490-492.
42

Isolation of undenatured CGA free sunflower proteins
Prasad D.T. Proteins of the phenolic extracted sunflower meal: I. Simple method for removal of polyphenolic components and characteristics of salt soluble proteins. Food Sci. Technol-Leb. 1990, 23, 229-235.
Provansal M.M.P., Cuq J.L.A. and Cheftel J.C. Chemical and nutritional modifications of sunflower proteins due to alkaline processing. Formation of amino acid cross-links and isomerization of lysine residues. J. Agric. Food Chem. 1975, 23, 938-943.
Rahma E.H. and Narasinga Rao M.S. Characterization of sunflower proteins. J. Food Sci. 1979, 579-582. Rahma E.H. and Narasinga Rao M.S. Isolation and characterization of the major protein fraction of
sunflower seeds. J. Agric. Food Chem. 1981a, 29, 518-521. Rahma E.H. and Narasinga Rao M.S. Removal of polyphenols from sunflower meal by various solvents:
effects on functional properties. J. Food Sci. 1981b, 46, 1521-1522. Raymond J., Dalgalarrondo M., Azanda J.L. and Ducastaing A. Preparation of protein isolates from
sunflower cakes. Re. Fr. Corps Gras 1984, 6, 233-242. Regitano d'Arce M.A., Gutierrez E.M. and Lima U.d.A. Sunflower seed protein concentrates and isolates
obtention from ethanol oil extraction meals (technical note). Arch. Latinoam. Nutr. 1994, 44, 33-5.
Rossi M., Peri C. and Riva M. Protein concentrate production from sunflower cakes:II. Simultaneous extraction of oil and clorogenic acid. Riv. Ital. Sostanze Grasse 1980, 509-513.
Sabir M.A., Sosulski F.W. and Finlayson A.J. Chlorogenic acid-protein interactions in sunflower. J. Agric. Food Chem. 1974a, 22, 575-578.
Sabir M.A., Sosulski F.W. and Kernan J.A. Phenolic constituents in sunflower flour. J. Agric. Food Chem. 1974b, 22, 572-574.
Sabir M.A., Sosulski F.W. and MacKenzie S.L. Gel chromatography of sunflower proteins. J. Agric. Food Chem. 1973, 21, 988-993.
Saeed M. and Cheryan M. Sunflower protein concentrates and isolates low in polyphenols and phytate. J. Food Sci. 1988, 53, 1127-1143.
Sanchez A.C. and Burgos J. Thermal Gelation of Sunflower Proteins. In Food Macromolecules and Colloids; Dickinson E. and Lorient D., eds; Royal Society of Chemistry: Cambridge, United Kingdom, 1995; 426-430.
Sanchez A.C. and Burgos J. Gelation of sunflower globulin hydrolysates: Rheological and calorimetric studies. J. Agric. Food Chem. 1997, 45, 2407-2412.
Sastry M.C.S. and Rao M.S.N. Binding of chlorogenic acid by the isolated polyphenol-free 11S protein of sunflower (Helianthus annuus) seed. J. Agric. Food Chem. 1990, 38, 2103-2110.
Sastry M.C.S. and Subramanian N. Preliminary studies on processing of sunflower seed to obtain edible protein concentrates. J. Am. Oil Chem. Soc. 1984, 61, 1039-1042.
Schwenke K.D., Paehtz W., Linow K.J., Raab B. and Schultz M. On seed proteins. XI. Purification, chemical composition, and some physico-chemical properties of the 11 S globulin (Helianthinin) in sunflower seed. Nahrung 1979, 23, 241-254.
Sodini G. and Canella M. Acidic butanol removal of color-forming phenols from sunflower meal. J. Agric. Food Chem. 1977, 25, 822-825.
Sosulski F.W., McCleary C.W. and Soliman F.S. Diffusion extraction of chlorogenic acid from sunflower kernels. J. Food Sci. 1972, 37, 253-256.
Srinivasulu S. and Rao A.G.A. Structure and kinetic thermal stability studies of the interaction of monohydric alcohols with lipoxygenase 1 from soybeans (glycine max). J. Agric. Food Chem. 1995, 43, 562-567.
43

Chapter 2
44
Sripad G. and Narasinga Rao M.S. Effect of methods to remove polyphenols from sunflower meal on the physicochemical properties of the proteins. J. Agric. Food Chem. 1987, 35, 962-967.
Thibault J.-F. Automatisation du dosage des substances pectiques par la méthode au métahydroxydiphenyl. Lebensm. -Wiss. Technol. 1979, 12, 247-251.
Tolstoguzov V.B. Some physico-chemical aspects of protein processing into foodstuffs. Food Hydrocolloids 1988, 2, 339-370.
Tranchino L., Costantino R. and Sodini G. Food grade oilseed protein processing: sunflower and rapeseed. Qual. Plant. 1983, 32, 305-334.
Venktesh A. and Prakash V. Functional properties of the total proteins of sunflower (Helianthus annuus L.) seed: effect of physical and chemical treatments. J. Agric. Food Chem. 1993a, 41, 18-23.
Venktesh A. and Prakash V. Low molecular weight proteins from sunflower (Helianthus annuus L.) seed: effect of acidic butanol treatment on the physicochemical properties. J. Agric. Food Chem. 1993b, 41, 193-198.
Vermeesch G., Briffaud J. and Joyeux J. Sunflower proteins in human food. Re. Fr. Corps Gras 1987, 7-8, 333-344.

Chapter 3
Sunflower helianthinin: effect of heat and pH on solubility and molecular structure*
Abstract
Helianthinin, also known as 11S globulin, is the major sunflower protein. This research presents a detailed study on the influence of pH on its protein structure and solubility. The effect of heat denaturation on protein structure is also studied. Furthermore, the dissociation of helianthinin under alkaline, neutral and mild acid conditions was quantified. The quaternary structure of helianthinin is modulated by both ionic strength and pH. Dissociation into 7S (trimer) from 11S (hexamer) gradually increased with increasing pH from 5.8 to 9.0. High ionic strength (I = 250 mM) stabilizes the 11S form of helianthinin at pH values above pH 7.0. Heating and low pH resulted in dissociation into the monomeric constituents (2-3S). The 11S and 7S form of helianthinin differ in their secondary structure, tertiary structure, and thermal stability. The DSC-profiles of helianthinin at pH 8.5 showed two endothermic transitions at temperatures of about 65 °C and 90 °C, for the trimeric and hexameric form of helianthinin, respectively. Furthermore, the existence of two populations of monomeric form of helianthinin with denaturation temperatures of approximately 65 °C and 90 °C was reported.
The results describe in this study lead to the hypothesis that helianthinin can adopt two different conformational states: one state with a denaturation temperature of 65 °C and a second state with a denaturation temperature of 90 °C. * Submitted for publication

Chapter 3
Introduction
The approximate composition of sunflower seed is 50 % lipids, 20 % carbohydrates and 20 % proteins (Salunkhe et al., 1992). The high protein content makes sunflower seed an attractive protein source. Sunflower seed contains two major groups of proteins, 11S globulin, also known as helianthinin, and 2S albumins, also known as sunflower albumins (SFAs). The two groups are present in a ratio of about 2:1 (11S:2S, respectively) (Mazhar et al., 1998). Helianthinin has been reported to be present as a globular oligomeric protein with a molecular weight (MW) of 300-350 kDa (Sabir et al., 1973; Schwenke et al., 1979). Studies on the quaternary structure of helianthinin by electron microscopy and small angle X-ray scattering indicate that the molecule consists of an arrangement of six spherical subunits into a trigonal antiprism with a maximum dimension of 11 nm (Reichelt et al., 1980; (Plietz et al., 1983). As in other 11 S seed globulins (pea, faba, soy or lupin) each subunit consist of an acidic (32-44 kDa) and a basic (21-27 kDa) polypeptide, linked by a single disulphide bond, derived by post-translational cleavage of a parental protein (Dalgalarrondo et al., 1984; Vonder Haar et al., 1988; Raymond et al., 1995). Besides the heterogeneity of the multiple polypeptide chains within a single genotype (Dalgalarrondo et al., 1984 and 1985), there are also differences in helianthinin between varieties (Raymond et al., 1994 and 1995). The available gene sequence of one sunflower globulin subunit (Helianthinin G3 or HAG3) reveals that it consists of an acidic chain of 285 amino acids (MW: 32643 Da) and a basic chain of 188 amino acids (MW: 20981 Da) linked by a disulphide bond (103-312) (Vonder Haar et al., 1988; Swiss-prot, p19084). Association and dissociation phenomena are a common feature of many 11S seed globulins (Prakash and Rao, 1986; Marcone, 1999). Several 11S globulins from soy bean (Lakemond et al., 2000b), sesame (Prakash and Nandi, 1977), kidney bean (Sun et al., 1974) or pea (Guéguen et al., 1988) have been shown to undergo reversible or irreversible pH-dependent dissociation. Helianthinin association-dissociation has not received much attention. Although dissociation of sunflower 11S into 7S and 2-3S has been reported (Schwenke et al., 1979; Sripad and Rao, 1987a), limited data on the effects of pH and ionic strength on the structure of helianthinin have been published. This research presents a detailed study of the influence of pH on helianthinin structure and solubility. The effect of temperature on protein structure at several pH values is also studied. Furthermore, an attempt to quantify the dissociation of helianthinin under alkaline, neutral and mild acid conditions has been done.
46

Structure and solubility of helianthinin
Materials and methods Protein Isolation Defatting and dephenolising Dehulled “Mycogen Brand” sunflower seeds, purchased from H.Ch. Schobbers B.V. (Echt, The Netherlands), were milled in a laboratory grinder (Janke and Kunkel GmbH, Staufen, Germany) for 3 min. High temperatures were avoided by cooling the grinder periodically with liquid nitrogen. The resulting meal was defatted with hexane and dephenolised by cold extraction of the phenolic compounds with 80 % (v/v) aqueous methanol as described previously (Chapter 2). This procedure yields the defatted dephenolised meal. Helianthinin isolation The defatted dephenolised meal obtained was suspended in water [2 % (w/v)] and stirred for 2 h while keeping the pH at 5.0 by addition of small volumes of 1 N HCl. Next, continuous centrifugation was carried out in a vertical centrifuge type V30-O/703 (Heine; GFT Trenntechnik, Viersen, Germany) at the maximum speed of 3500 rpm. Filter cloths (mesh size 1 µm) were purchased from Lampe Technical Textiles BV in Sneek (Netherlands). Insoluble protein was recovered and washed once [2 % (w/v)] suspension, pH 5.0). Afterwards, the pellet was re-suspended in water [2 % (w/v)] and stirred for 2 h while keeping the pH at 8.5 by addition of small volumes of 1 N NaOH. Soluble protein was recovered by filter centrifugation (1 µm, 20 °C). The remaining pellet was re-extracted (similar conditions) and the two supernatants were combined. Subsequently, the total supernatant was diafiltrated using Xampler UFP-3-C cross-flow hollow fiber laboratory cartridges with a molecular weight cut-off of 100 kDa (A/G Technology Corp., Needham, USA) until the conductivity of the retentate remained constant, freeze-dried and denoted helianthinin extract. Further purification was performed by gel permeation chromatography. The helianthinin extract was dissolved [1 % (w/v)] in 30 mM sodium phosphate buffer (pH 8.0), and 150 ml of the solution were applied, after filtration (0.45 µm), to a Superdex 200 column (68 x 10 cm) (Amersham Pharmacia Biotech AB, Uppsala, Sweden). The column was eluted with the same buffer at a linear flow rate of 30 cm/h. The eluate was monitored at 280 nm. Fractions eluting between 1500 and 2500ml were pooled, diafiltrated using Xampler UFP-3-C cross-flow hollow fiber laboratory cartridges with a molecular weight cut-off of 100 kDa (A/G Technology Corp., Needham, USA) until the conductivity of the retentate remained constant, and freeze-dried to yield pure helianthinin. Fractions eluting between 2600 and 3100 ml were also collected and processed in the same way as helianthinin, and denoted Hel26-31.
47

Chapter 3
Purification of 7S and 11S forms of helianthinin In order to obtain the pure 7S and 11S forms of helianthinin, the helianthinin extract was fractionated by gel permeation on a semi-preparative Superdex 200 column 16/60 (60 x 1.6 cm) (Amersham Pharmacia Biotech AB, Uppsala, Sweden) eluted with 30 mM sodium phosphate buffer (pH 8.0) at a flow rate of 1ml/min. Two peaks were detected at 280 nm. The peaks were individually collected and concentrated to 1.0 mg/ml with Microcon centrifugal filters YM-10 (Millipore, Etten-Leur, The Netherlands). Determination of protein solubility The purified helianthinin was dispersed to a final concentration of 4.0 mg/ml in water with the pH adjusted to 8.5 by addition of small amounts of NaOH solutions. The ionic strength was adjusted to 0.03 and 0.25 by adding NaCl. The pH of the helianthinin solution was lowered by adding various amounts of HCl solutions to obtain final pH values ranging from 2.0 to 8.5 with 0.5 pH unit intervals, and the samples were stored for about 2 hours at room temperature. Next, the samples were centrifuged for 15 min at 15,800 × g at 20 °C. The protein concentration of the supernatants was determined in triplicate using the Bradford’s method with bovine serum albumin (BSA) as a standard. Solubility was expressed as proportion (%) of the amount of protein dissolved at pH 8.5. All the solubility experiments were performed at least in duplicate. Protein concentration as estimated by Bradford (Bradford, 1976) and Dumas method were compared and found to be similar. For the latter method, a NA 2100 nitrogen analyser was used according to the instructions of the manufacturer. Analysis Protein content Protein content (N x 6.25) of the protein preparations was determined by the Kjeldahl method, AACC 46-12 (AACC, 1995). Protein size and composition Protein size and composition was estimated by analytical gel permeation chromatography and gel electrophoresis. Gel permeation chromatography (GPC) Gel permeation chromatography was performed using an Äkta Explorer System (Amersham, Pharmacia Biotech, Uppsala, Sweden). The isolated samples (0.2-2mg/ml) were dissolved at room temperature in 50 mM sodium phosphate buffer, pH 6.9, containing 0.25 M NaCl. After filtration over a 0.2 µm filter, the samples were applied (0.2 ml filter) on a Superdex 200 HR 10/30 (30 x 1 cm) column and eluted with the same buffer at a flow rate of 0.5 ml/min at room temperature.
48

Structure and solubility of helianthinin
The quaternary structure of helianthinin was also monitored by gel permeation chromatography. The effect of pH on the 7S/11S ratio was studied at various pH values. In this case, helianthinin was dissolved (0.2 mg/ml) in a NaCl solution (I =30 and 250 mM) while keeping the pH at 9.0 by addition of small amounts of NaOH solutions (0.1-2 M). The pH of parts of the solution was lowered by adding different amounts of HCl solutions (0.1-2 M) to obtain final pH values of 8.0, 7.0, 6.2, and 5.8. After filtration (0.2 µm filter), the samples (0.2 ml) were applied directly to a Superdex 200 HR 10/30 column and eluted at a flow rate of 0.5 ml/min with the following buffers matching the pH of the samples: 30 mM sodium acetate buffer, pH 5.8; 30 mM sodium phosphate buffer, pH 6.2; 30 mM sodium phosphate buffer, pH 7.0; 30 mM sodium phosphate buffer, pH 8.0; 30 mM sodium borate buffer, pH 9.0. The ionic strength of the buffers was adjusted to 30 and 250 mM by adding NaCl. The effect of a higher ionic strength on the 7S/11S ratio was also studied at pH 7.0. Helianthinin was dissolved (0.2 mg/ml) in 30 mM sodium phosphate buffer (I = 50, 250, 500, 1000 and 1250 mM). After filtration (0.2 µm filter), the samples (0.2 ml) were applied to a Superdex 200 HR 10/30 column and eluted at a flow rate of 0.5 ml/min with the buffers matching the ionic strength of the samples. The ionic strength of the buffers was adjusted by adding NaCl. For these experiments the column was calibrated using protein markers ranging from 13 to 2000 kDa (Amersham, Pharmacia Biotech, Uppsala, Sweden): Ribonuclease A (13,700 Da), ovalbumin (43,000 Da), BSA (67,000 Da), aldolase (158,000 Da), catalase (232,000 Da), ferritin (440,000 Da) and blue dextran (2,000,000 Da). The eluate was monitored at 214 and 280 nm. Gel electrophoresis Sodium dodecyl sulfate polyacrylamide gel electrophoresis (SDS-PAGE) was performed on a Mini-PROTEAN II electrophoresis system (BIO-RAD Laboratories), following the instructions of the manufacturer. Protein samples of 10-15 µg were dissolved in either reducing or non-reducing sample buffer, and applied to homogeneous 12 % gels. After electrophoresis, the gels were stained with Coomassie Brilliant Blue. Low molecular weight markers ranged from 14 to 94 kDa (Amersham, Pharmacia Biotech, Uppsala, Sweden): α-lactalbumin (14,400 Da), soybean trypsin inhibitor (20,100 Da), carbonic anhydrase (30,000 Da), ovalbumin (43,000 Da), BSA (67,000 Da) and phosphorylase b (94,000 Da) were used as calibration proteins. SDS-PAGE was also performed according to the method of Schägger and Jagow (1987) in order to determine low molecular weight proteins. Protein samples of 10-15 µg were applied to a precast 16.5 % Tris-tricine gels (Bio-Rad laboratories). Markers ranging from 3.5 to 26.6 kDa were applied in this case (Bio-Rad laboratories): bovine insulin (3,496 Da), aprotinin (6,500 Da), lysozyme (14,400 Da), myoglobin (16,950 Da) and triosephosphate isomerase (26,625 Da).
49

Chapter 3
Isoelectric focusing Isoelectric focusing was performed on a LKB 2117 MULTIPHOR II isoelectric focusing module (Pharmacia LKB Biotechnology), following the instructions of the manufacturer. Protein samples of 10-15 µg were dissolved in sample buffer, and applied to IEF 3.0-9.0 gels (Servalyt Precotes 150 µm, 125 x 125 mm, Serva, Heidelberg, Germany). The gels were run for 3 hours following the instruction of the manufacturer. IEF standards (Amersham, Pharmacia Biotech, Uppsala, Sweden) were used to calculate the pI of each band after staining with Coomassie Blue G250: trypsinogen (pI: 9.30), lentil lectin-basic band (pI: 8.65), lentil lectin-middle band (pI: 8.45), lentil lectin-acidic band (pI: 8.15), myoglobin-basic band (pI: 7.35), myoglobin-acidic band (pI: 6.85), human carbonic anhydrase B (pI: 6.55), bovine carbonic anhydrase B (pI: 5.85), β-lactoglobulin A (pI 5.20), soybean trypsin inhibitor (pI: 4.55) and amyloglucosidase (pI 3.50). Differential scanning calorimetry (DSC) Calorimetric studies were performed using a VP-DSC MicroCalorimeter (MicroCal Incorporated, Northhampton MA, USA). Thermograms were recorded from 20 °C to 130 °C with a heating rate of 1 °C/min. Experiments were performed with helianthinin, at concentrations 1.0-4.0 mg/ml at several pH values: pH 3.0 (10 mM sodium phosphate buffer), pH 7.0 (10 mM sodium phosphate buffer) and pH 8.5 (10 mM sodium borate buffer). The final ionic strengths (10, 30 or 250 mM) of the buffers were adjusted by adding NaCl. The protein concentration of the solutions was estimated by absorbance measurement at 280 nm, using sunflower isolate (Chapter 2) as standard. All measurements were carried out in duplicate. Circular dichroism (CD) spectroscopy Protein concentration of the solutions was routinely estimated by absorbance measurement at 280 nm, using sunflower protein as standard. Far-UV CD Far-UV CD spectra of helianthinin samples were recorded at 20, 110 °C and at 20°C after heat treatment at 110 °C, as averages of 10 spectra on a Jasco J-715 spectropolarimeter (Jasco Corp., Japan) at several pH values: pH 3.0 (10 mM sodium phosphate buffer), pH 7.0 (10 mM sodium phosphate buffer) and pH 8.5 (10 mM sodium borate buffer). The final ionic strengths (30, 250 mM) of the buffers were adjusted by adding NaF. Quartz cells with an optical path length of 1 mm and 0.2 mm at protein concentrations of approximately 0.1 mg/ml and 0.04 mg/ml, respectively, were used. The scan interval was 180-260 nm, the scan speed was 100 nm/min, the data interval was 0.2 nm, the bandwidth 1.0 nm, the sensitivity was 20 mdeg and the response time 0.125 seconds. Spectra were corrected by subtracting the spectrum of a
50

Structure and solubility of helianthinin
protein-free sample obtained under identical conditions. Noise reduction was applied using the Jasco software. The spectra were analysed from 240 to 190 nm to calculate the secondary structure content of the protein using a non-linear regression procedure as described in detail by Pots and co-workers (Pots et al., 1998). Changes in thermal stability of the secondary structure of helianthinin were also monitored by measuring the ellipticity at 200 nm as a function of temperature at a heating rate of 1 °C/min. Near-UV CD Near-UV CD spectra of 2.0-3.0 mg protein/ml solutions of helianthinin were recorded at 20 °C as averages of 25 spectra on a Jasco J-715 spectropolarimeter (Jasco Corp., Japan) at pH 3.0 (10 mM sodium phosphate buffer) and pH 7.0 (10 mM sodium phosphate buffer). The final ionic strengths (30 or 250 mM) of the buffers were adjusted by adding NaF. Quartz cells with an optical path length of 10 mm were used. The scan speed was 50 nm/min, the scan interval was 250-350 nm, the data interval was 0.5 nm, the bandwidth 1.0 nm, the sensitivity was 10 mdeg and the response time 0.25 seconds. Near-UV CD spectra of helianthinin were also recorded at 105 °C and at 20 °C (after heat treatment at 105 °C during 10 minutes). Spectra were corrected by subtracting the spectrum of a protein-free sample obtained under identical conditions. Changes in thermal stability of the tertiary structure of sunflower proteins were also monitored by measuring the ellipticity at 285 nm as a function of temperature at a heating rate of 1 °C/min. Amino acid analysis Amino acid analysis was performed after protein hydrolysis using an amino acid analyser equipped with Ninhydrin detection system. Acid hydrolysis was carried out with 6M HCl during 22 h at 105-110 °C. In order to analyse cysteine and methionine the sample underwent oxidation with performic acid during 16 h at 0-5 °C, followed by acid hydrolysis with 6M HCl during 22 h at 105-110 C°. For tryptophan determination, alkaline hydrolysis was performed with 4.2 M NaOH during 22 h at 105-110 °C.
51

Chapter 3
Results Protein composition The protein content of the helianthinin extract and of the purified helianthinin was above 95 % on dry matter basis. The helianthinin extract was subjected to gel permeation chromatography, both on an analytical as well as on a preparative scale. Analytical gel permeation chromatography (Figure 1) showed four peaks with elution volumes of approximately 10.3 ± 0.2, 11.4 ± 0.2, 14.0 ± 0.3 and 17.0 ± 0.2 ml. Calibration of the column revealed apparent molecular weights of 300, 150, 45 and 14 kDa, respectively. The results obtained with preparative chromatography closely resembled those obtained using analytical chromatography, also showing four peaks. Fractions (1500-2500ml) corresponding to the peaks at 10.3 and 11.4 ml were collected, isolated and denoted as (purified) helianthinin.
0
50
100
150
200
250
300
350
400
450
8 10 12 14 16 18 2
elution volume (ml)
abso
rban
ce (2
14 n
m)
11S
7S
P14
P16
SFAs
HMW
0
Figure 1: Chromatograms of helianthinin preparations under various conditions: helianthinin extract (thin
black line), purified helianthinin (dashed black line), purified helianthinin after heat treatment (grey line),
helianthinin at pH 3.0 (grey thick line) and Hel26-31 preparation (black thick line) at pH 7.0. The
absorbance is monitored at 214 nm and is given in milliabsorbance units (mAU). The identity of the
peaks is indicated on the chromatogram.
52

Structure and solubility of helianthinin
Analytical GPC of the purified helianthinin preparation showed only the two peaks at 10.3 ± 0.2 and 11.4 ± 0.2 ml, denoted 11S and 7S in Figure 1. SDS-PAGE of these fractions under reducing and non-reducing conditions confirmed the identity of helianthinin with the presence of bands as those described by Dalgalarrondo and co-workers (Dalgalarrondo et al., 1984 and 1985; Chapter 2). IEF of these fractions (10.3 ± 0.2 and 11.4 ± 0.2 ml) displayed eight bands with pI’s between 5.0 and 5.9. The pooled fraction that eluted between 2600 and 3100 ml on the preparative column (Hel26-31) corresponded to the peak eluting at 14 ± 0.3 ml on the analytical column (Figure 1), and had an estimated MW of 45 kDa. SDS-PAGE of this fraction under reducing conditions showed bands with approximate molecular weights of 24, 30 and 40 kDa as described for helianthinin (Chapter 2). The 30 kDa band was the main band. Tricine SDS-PAGE of the peak eluting at 17 ml showed two bands with an estimated MW of approximately 12 and 15 kDa. Proteins with these molecular weights have been reported to be sunflower albumins (SFAs) (Kortt and Caldwell, 1990; Anisimova et al., 1995). Protein solubility Since protein solubility is a prerequisite for functional application of proteins in foods (Kinsella, 1979), the effects of pH and ionic strength on protein solubility were studied. This investigation was aimed at measuring changes in protein solubility in the pH range 2.0-8.5, at I = 30 and 250 mM. The solubility of helianthinin as a function of pH is shown in Figure 2A. At low ionic strength (I = 30 mM), helianthinin shows a bell
0
20
40
60
80
100
120
1 2 3 4 5 6 7 8 9
pH
solu
bilit
y (%
)
0
20
40
60
80
100
120
0 100 200 300ionic strength (mM)
solu
bilit
y (%
)
B A
Figure 2: A) pH-dependent solubility profiles of helianthinin (4.0 mg/ml) at I = 30mM (solid line) and 250 mM (dashed line). Solubility is expressed as proportion (%) of the amount of protein dissolved at pH 8.5. B) Helianthinin (4.0 mg/ml) solubility versus ionic strength at pH 3.0. Solubility is expressed as proportion (%) of the amount of protein dissolved at pH 3.0 (I = 30 mM).
53

Chapter 3
shaped curve with a minimum solubility at pH 4.0-5.5. At high ionic strength (I = 30 mM), helianthinin is almost insoluble at pH< 5.0. It was found that the solubility of helianthinin at pH 3.0 is strongly affected by ionic strength (Figure 2B). The solubility remained more or less constant between 0-150 mM, and exhibited a decrease above 150 mM. To investigate whether the solubility behaviour relates to differences in the molecular structure of sunflower proteins at secondary, tertiary and quaternary level, experiments described in the following sections were performed at those conditions in which proteins were found to be soluble. Secondary and tertiary structure of helianthinin at various pH values Circular dichroism spectroscopy (CD) was used to investigate the secondary and tertiary structure of sunflower proteins. The far-UV CD spectrum of a globular protein primarily reflects its secondary structure, while the near-UV CD spectrum gives an indication of the interactions of aromatic side-chains with other side-chain groups and peptide bonds, reflecting the tertiary structure (Kelly and Price, 1997). Secondary folding Far-UV CD spectra of helianthinin were recorded at pH 7.0 (30 and 250 mM), pH 8.5 (10mM) and pH 3.0 (30 mM) at 20 °C (Figure 3). The characteristic features at neutral and weakly alkaline pH values are a minimum about 210 nm and a zero crossing around 200 nm. On the basis of comparison with reference spectra (Johnson, 1990),
-15
-10
-5
0
5
10
190 200 210 220 230 240 250 260wavelength (nm)
ellip
ticity
(mde
g)
Figure 3: Far-UV CD spectra of helianthinin at pH 7.0 (I = 30mM; black thin line), pH 7.0 (I = 250 mM; black thick line), pH 8.5 (I = 10mM; thin grey line) and pH 3.0 (I = 30mM; thick grey line).
54

Structure and solubility of helianthinin
helianthinin mainly consists of α-helical structures. Using curve-fitting procedures, the secondary structure content was estimated, confirming the high content of α-helical structures. At both ionic strengths (30 and 250 mM) at pH 7.0, α-helices account for 60 %, random coil approximately 10 % and no β-sheet elements were present. Far-UV CD spectra of helianthinin at pH 8.5 did not differ much from those at pH 7.0; the estimated amount of the non-structured protein was about 5-10 % lower at neutral pH. However, at pH 3.0 the far-UV CD spectrum is totally altered. The zero crossing has shifted from 200 to 190 nm, the spectrum shows only negative ellipticity and the estimation of secondary structure revealed the presence of approximately 50 % non-structured protein. Tertiary folding At neutral pH the near-UV CD spectra of helianthinin (Figure 4) at both ionic strengths (30 and 250 mM) were very similar. They showed a maximum at 285 nm and a shoulder at 292 nm, both probable due to mainly tryptophan and also tyrosine contributions (Pain, 1996; Kelly and Price, 1997). The intensity was slightly lower at I = 30 mM compared to I = 250 mM, which generally points at a destabilization of the protein structure (Vuillemier et al., 1993). The near-UV CD spectrum of helianthinin at acidic pH is clearly different from that at neutral pH. Compared to pH 7.0, a drastic decline of intensity over the full range is observed pointing to a total unfolding of the tertiary structure.
-5
0
5
10
15
20
25
250 260 270 280 290 300 310 320wavelength (nm)
ellip
ticity
(mde
g)
Figure 4: Near-UV CD spectra of helianthinin at pH 7.0 (I = 30 mM; thin line), pH 7.0 (I = 250 mM; thick line) and pH 3.0 (I = 30mM; dotted line) at 20 °C.
55

Chapter 3
Quaternary structure As mentioned before, gel permeation chromatography (GPC) showed two peaks for purified helianthinin. The MW of these two peaks suggests partial dissociation of the 11S form into a 7S form, as previously reported (Schwenke et al., 1979; Kabirullah and Wills, 1983). Therefore, it was studied how the ratio 11S/7S is affected by pH (5.8 to 9.0; I = 30 and 250 mM) and by ionic strength (50, 250, 500, 1000 and 1250 mM; pH 7.0) using GPC. Figure 5 shows that for I = 30 mM the amount of 11S decreases with increasing pH. At pH 9.0 an additional peak, eluting at 8.7 ± 0.4 ml was observed in the gel permeation chromatogram (no further data shown). This peak is likely due to the aggregation of helianthinin into a higher molecular weight form, presumably 15-18S (Joubert, 1955; Rahma and Rao, 1979; Kabirullah and Wills, 1983; Sripad and Rao, 1987b) and is, therefore, not illustrated in Figure 5. Small amounts (1-5 %) of this aggregate were also found at other pH values; this aggregate appears to be more abundant at higher protein concentrations (results not shown). The amount of 11S also decreased with increasing pH at high ionic strength (I = 250 mM), although to a lesser extent. However, no aggregation into 15S was found above pH 8.0. No effect of the ionic strength on the 11S/7S ratio was observed at pH 7.0, even up to values of 1250 mM (results not shown).
10
20
30
40
50
60
70
80
90
5 6 7 8 9 10pH
prot
ein
form
(%)
Figure 5: Proportion of 11S (■) and 7S (▲) forms of helianthinin as a function of pH, at I = 30 mM
(solid line) and I = 250 mM (dashed line).
56

Structure and solubility of helianthinin
In order to further investigate differences in quaternary structure, the 7S and 11S form of helianthinin were isolated by preparative GPC. SDS-PAGE did not show differences between the molecular subunits of the 11S and 7S forms under both reducing and non-reducing conditions (results not shown). The near and far UV CD spectra of these forms of helianthinin were apparently similar to those of the non-fractionated helianthinin. However, the intensities of the near-UV CD spectra of 7S were lower than those of 11S, and the far-UV CD spectra revealed a higher content of random coil (i.e. at pH 8.0 and I = 30 mM, 25 % versus 3 %) in the 7S form (spectra not shown). GPC of the soluble part of helianthinin at pH 3.0, as obtained in the solubility experiment (Figure 2A), indicated that helianthinin is fully dissociated into two kinds of smaller fragments; a peak eluting at 14.0 ± 0.3 ml (as Hel26-31) and a smaller fragment eluting at 16 ml (P16; estimated Mw 25 kDa; Figure 1). Structure of Helianthinin as a function of temperature Heat denaturation Figure 6 shows the DSC thermograms of the purified helianthinin and its 7S and 11S forms. At pH 8.5 (I = 10 mM) helianthinin showed two endothermic transitions at approximately 65 °C and 90 °C. All the transitions were irreversible as observed from
Figure 6: DSC thermogram of purified helianthinin (thick line), purified 11S form (gray line) and 7S
form (thin line) of helianthinin at pH 8.5 and I = 10 mM.
-2,50E-05
2,50E-05
7,50E-05
1,25E-04
1,75E-04
2,25E-04
2,75E-04
3,25E-04
3,75E-04
4,25E-04
4,75E-04
30 40 50 60 70 80 90 100 110 120 130
temperature (°C)
Cp
(cal
/°C
)
57

Chapter 3
rescanning of the samples (not shown). The denaturation temperatures were independent of protein concentration (0.5-4.0 mg/ml) and of scan rate employed (0.5-1.5 °C/min). At pH 3.0 helianthinin was already denatured as can be deduced from the absence of endothermic transitions (results not shown). To investigate the nature of the two endothermic transitions observed for helianthinin, helianthinin was heated (I = 10 mM; pH 8.5) up to 65 °C during 5, 30 and 60 minutes and subsequently re-scanned. Figure 7A shows that upon increasing the preheating time at 65 °C, the area of the first DSC peak of helianthinin decreased. The second peak is not affected by preheating at 65 °C. Subsequent GPC analyses of the samples showed a progressive disappearance of the 7S form by heating at 65 °C, whereas the area of 11S peak remained constant (Figure 7B). The disappearance of the peak was even proportional to the time that helianthinin was heated at 65 °C. Furthermore, isolated 7S and 11S forms of helianthinin showed denaturation temperatures of 65 °C and 90 °C, respectively (Figure 6). These experiments demonstrate that the 7S form of helianthinin denatures at a lower temperature than the 11S form. In Figure 7B it can be also observed that heating of helianthinin up to 65 °C resulted in protein dissociation into a peak eluting at 14 ± 0.3 ml (P14), suggesting that this peak corresponds to a dissociated part of helianthinin. Secondary and tertiary folding as a function of temperature To monitor changes in the secondary structure of helianthinin as a function of temperature, far-UV CD temperature scans were recorded at 200 nm from 20 to 110 °C (Figure 8A). The ellipticity was monitored at this wavelength because it showed the largest changes as a function of temperature (Figure 8B). Figure 8A indicates that at pH 8.5 two successive transitions occurred with midpoints at approximately 65 °C and 90 °C, respectively. These data are very similar to the DSC results. Isolated 11S and 7S forms of helianthinin showed a single transition at approximately 90 °C and 65 °C, respectively (Figure 8A), also in accordance with the DSC results. At pH 3.0, helianthinin showed only a slight change in the ellipticity upon heating. By curve fitting procedures, a similar content of non-structured protein for heat treated (110 °C) helianthinin at pH 7.0 (60 %) was estimated as for unheated helianthinin at pH 3.0 (50 %). The near-UV CD spectra of helianthinin at pH 7.0 (I = 30 mM) after heating up to 105 °C resembled the spectrum of helianthinin at pH 3.0 (I = 30 mM) (Figure 4) although the decline of intensity over the full range was somewhat more drastic after heating (no further data shown). As it was observed for the secondary structure, heat and low pH resulted in similar changes in the tertiary structure.
58
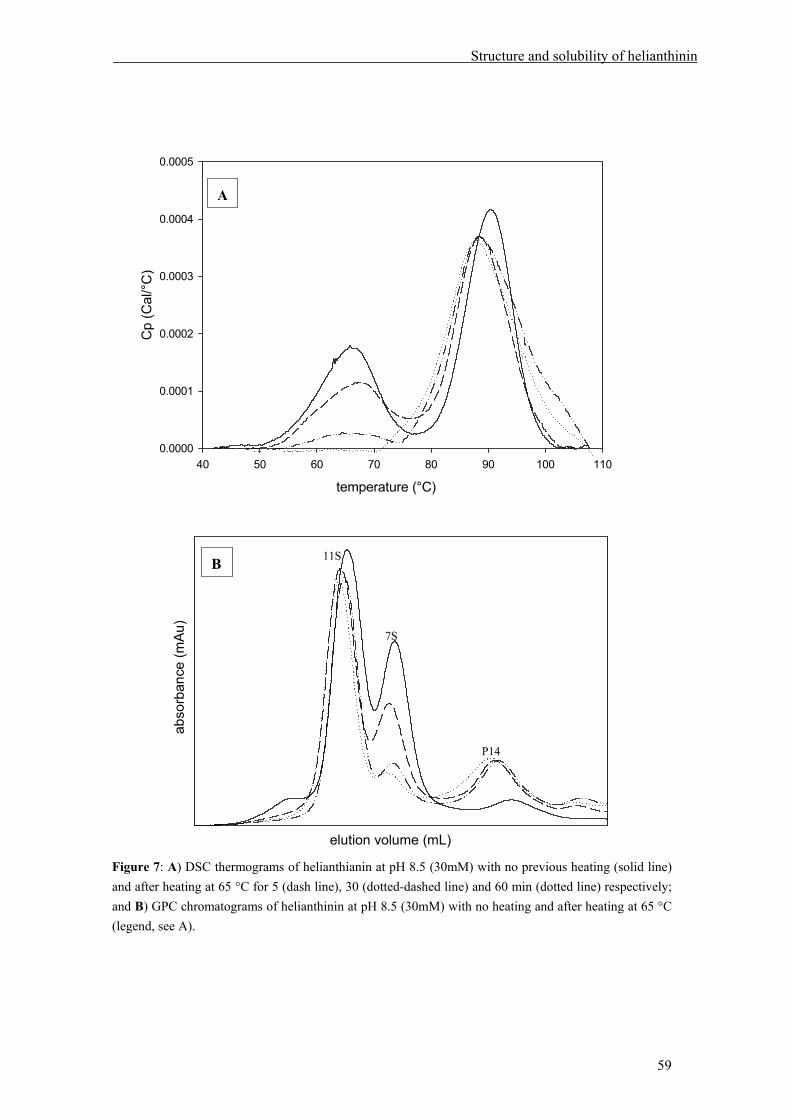
Structure and solubility of helianthinin
elution volume (mL)
abso
rban
ce (m
Au)
B
temperature (°C)40 50 60 70 80 90 100 110
Cp
(Cal
/°C
)
0.0000
0.0001
0.0002
0.0003
0.0004
0.0005
A
P14
7S
11S
Figure 7: A) DSC thermograms of helianthianin at pH 8.5 (30mM) with no previous heating (solid line) and after heating at 65 °C for 5 (dash line), 30 (dotted-dashed line) and 60 min (dotted line) respectively; and B) GPC chromatograms of helianthinin at pH 8.5 (30mM) with no heating and after heating at 65 °C (legend, see A).
59

Chapter 3
-12
-8
-4
0
4
20 40 60 80 100temperature (°C)
ellip
ticity
(mde
g)
-15
-10
-5
0
5
10
190 200 210 220 230 240 250 260wavelength (nm)
ellip
ticity
(mde
g)
A 4
3
2
1
B
Figure 8: A) Far-UV CD temperature traces of purified helianthinin at pH 3.0 (I = 30 mM; trace 1) and at pH 8.5 (10 mM, trace 2) and isolated 7S (trace 3) and 11S (trace 4) forms of helianthinin (pH 8.5, I = 10 mM) recorded at 200 nm. B) Far-UV CD spectra of helianthinin at 20°C (thick solid line), 110 °C (thin solid line) and 20 °C after heating at 110 °C (grey line) (pH 7.0, I = 30 mM).
Discussion Structure of helianthinin. Subunit arrangement at various conditions Like other 11S seed globulins, helianthinin seems to dissociate into subunits according to the following scheme:
11S ⇒ 7S ⇒ 3-2S
Dissociation of helianthinin at acidic conditions has been reported (Schwenke et al., 1975a; Schwenke et al., 1975b; Sripad and Rao, 1987a), but the dissociation products were not identified and no data on changes in the neutral pH range were reported.
60

Structure and solubility of helianthinin
Our results show that the quaternary structure of helianthinin is modulated by both ionic strength and pH. Dissociation into 7S from 11S gradually increased with increasing pH from 5.8 to 9.0 at both ionic strengths. However, high ionic strength seems to stabilize the 11S form of helianthinin at pH values above 7.0, probably by decreasing electrostatic repulsion. Both, low pH and heating (Figure 1) induced dissociation of helianthinin into two protein fragments, P14 and P16. P14 has an estimated MW of 45 kDa. Since the monomeric subunit of helianthinin has a MW of about 50 kDa (300kDa/6), it can be assumed that this fragment corresponds to the monomeric subunit. The amino acid composition of P14 (Hel26-31) was shown to be identical to that of helianthinin (results not shown). Furthermore, SDS-PAGE under reducing conditions showed the same MW distribution as helianthinin. Assuming the generally adopted 6(AB) oligomeric structure for the 11S form, in which A and B are the acidic and basic polypeptides, respectively, these results show that these dissociated fragment may correspond to the trimer 3(AB) for 7S and to the monomer (AB) for 3S. The identity of the P16 fragment remains unclear. The dissociation of helianthinin involves significant changes in secondary and tertiary structure. The low intensity of the near-UV CD spectrum for the 7S form points to destabilization of tertiary structure. Furthermore, dissociation into 7S seems to be associated with a higher amount of non-structured secondary folding as estimated from far-UV CD. It could also be observed that a somewhat higher amount of random coil for helianthinin is present at pH 8.5 compared to pH 7.0, which is in agreement with the higher ratio 7S/11S at alkaline pH values (Figure 5). Far-UV CD spectra of the monomer (3S; Hel26-31) at pH 8.5 revealed that the content of non-structured protein was close to that found for helianthinin at pH 3.0. These results lead to the conclusion that dissociation of helianthinin is either the cause or the result of conformational changes at both secondary and tertiary level. Heat denaturation of helianthinin At pH 7.0, helianthinin severely aggregated, and therefore other conditions were tested. In many cases, aggregation can be avoided by keeping the ionic strength of the solvent low and by using pH values far from the isoelectric point (Makhatadze, 1998). Therefore, DSC scans were performed at pH 8.5 (I = 10 mM). The DSC-profiles of helianthinin at these conditions showed two peaks at temperatures of about 65 °C and 90 °C, for the trimeric and hexameric form of helianthinin, respectively. If the dissociation of the hexamer or the trimer occurs during thermal denaturation, the denaturation temperature (Td) should rise with increasing protein concentration (Privalov and Potekhin, 1986; Sturtevant, 1987; Makhatadze, 1998). Variation of the protein concentration (0.5-3.0 mg/ml) did, however, not result in significant changes in the values of Td. If the reacting species is known to be oligomeric at ambient temperature and Td is concentration independent, it may be concluded that either the
61

Chapter 3
oligomer has become monomeric by the time the denaturation temperature is reached or that no dissociation or association accompanies heat denaturation (Sturtevant, 1987). Gel permeation chromatography of samples submitted to thermal denaturation indicated that irreversible dissociation has occurred for both the 7S and 11S form. Our results, however, provide no conclusive evidence that dissociation takes place before or after denaturation. It seems, however, likely that dissociation occurs before denaturation. Formally the application of thermodynamic equations is only allowed for a reversible two-state transition. These conditions are not entirely fulfilled here because the thermal denaturation is not fully reversible. Nevertheless, many empirical results provide some measure of validity of the application of equilibrium thermodynamics to apparently irreversible processes (Sturtevant, 1987). Furthermore, Schwenke et al (Schwenke et al., 1987) have demonstrated that the thermal unfolding of 11S globulin from soy, faba, sunflower and rapeseeds can be described sufficiently adequately by a two-state model. We also observed Td to be independent of the scan rate, indicating chemical equilibrium during thermal denaturation. Thermodynamic data were also obtained from the far-UV CD thermal unfolding curves of helianthinin according to the model of Van Mierlo et al (1998) and from DSC data by applying equilibrium thermodynamic expressions (Privalov, 1979; Sturtevant, 1987; Pace et al., 1989). Table 1 shows the values of the van’t Hoff enthalpy (∆HvH) and Td obtained from the CD-unfolding curve and DSC together with the calorimetric enthalpy values (∆Hcal). An average molar mass of the cooperative unit of 25.400 g/mol was taken as suggested by Schwenke et al (1987). As can be calculated from Table 1, the ratio (∆Hcal)/(∆HvH) obtained for the 7S and 11S form of helianthinin is close to unity. Therefore, the denaturation can be described with a two-state model. DSC experiments demonstrate that the trimer (7S) denatures at a lower temperature than the hexamer (11S). This behavior was also found for soy glycinin (Lakemond et al., 2000a). Danilenko et al.(1987) explained the different denaturation temperatures of soy glycinin based on the lower free energy of the 11S form compared to the 7S form of soy glycinin. The lower amount of tertiary structure of 7S according to the near-UV CD and the higher amount of random coil for 7S helianthinin as estimated by far-UV CD are consistent with the thermodynamic differences found for 7S and 11S. Although the monomer, 3S (Hel26-31), has much lower ∆Hcal values than the oligomeric molecules, it shows denaturation temperatures similar to 7S and 11S (Table 1), pointing to the existence of two populations of monomers. Furthermore, the ∆HvH values of the 65 °C and 90 °C populations of monomers did not significantly differ from the ∆HvH values of 7S and 11S. Hence, the same unfolding seems to take place in which less energy is involved. This result would imply that only a small fraction of the monomer exists in folded form as indicated by the higher random coil content found using far-UV CD. Therefore, the determined protein concentration of the monomer for the DSC analysis is likely an overestimation, because both folded and unfolded monomers are taken into account when only the folded monomers contribute to the
62

Structure and solubility of helianthinin
endothermic transitions. In addition, the ratio (∆Hcal)11S/(∆Hcal)7S was equal to the ratio (∆Hcal) 3S (90 °C)/(∆Hcal) 3S (65 °C). These results indicate that the two populations of monomers can presumably be assigned as subunits of the oligomeric molecules (11S and 7S).
Table 1: Transition temperatures and enthalpies of denaturation of helianthinin at pH 8.5 (I = 10mM) as measured by DSC and far-UV CD temperature scanning at 200 nm.
DSC CD
Protein pH ∆Hcal
(kJ/mole)
∆HvH
(kJ/mole)
Td (°C) ∆HvH
(kJ/mole)
Td (°C)
11S 8.5 440 ± 46 455 ± 30 90.1 ± 0.7 456 ± 13 90.9 ± 0.9
7S 8.5 297 ± 23 311 ± 29 66.4 ± 1.1 299 ± 6 66.5 ± 0.1
3S (P14)90* 8.5 86 ± 8 395 ± 32 89.6 ± 0.2 - -
3S (P14)65* 8.5 57 ± 3.3 325 ± 22 64.9 ± 0.9 - -
*Calculated independently for the peaks with denaturation temperatures of 65 and 90 °C.
Solubility of helianthinin The solubility of helianthinin as a function of pH is in agreement with previous publications, which reported a minimum between 4.0 and 5.5 for pure helianthinin and other sunflower protein products (Gheyasuddin et al., 1970; Mattil, 1971; Sosulski and Fleming, 1977; Canella, 1978; Rossi et al., 1985; Vermeesch et al., 1987), etc. The decreased solubility of helianthinin at pH 3.0 (I = 30 mM) can be attributed to acid induced denaturation and dissociation of the protein. At high ionic strength (I = 250 mM) helianthinin is almost insoluble below its pI, as can be explained by the decrease in the distance at which electrostatic repulsion acts at high ionic strength, thus allowing the unfolded proteins to approach each other closely enough to form aggregates via non-electrostatic interactions. A similar trend has been found by several authors (Gheyasuddin et al., 1970; Mattil, 1971; Cater et al., 1972; Canella et al., 1985).
Summarizing, the results presented in this study show that the quaternary structure of helianthinin is modulated by both ionic strength and pH. Dissociation into 7S (trimer) from 11S (hexamer) gradually increases with increasing pH from 5.8 to 9.0. High ionic strength (I = 250 mM) stabilizes the 11S form of helianthinin at pH values above pH 7.0. Further dissociation of helianthinin into the monomeric form (2-3S) occurs at both, low pH and high temperatures, however, the monomeric form of helianthinin is also present in small amounts under non-denaturing conditions. The 11S and 7S form of helianthinin differ in their secondary structure, tertiary structure, and
63

Chapter 3
thermal stability. The DSC-profiles of helianthinin at pH 8.5 showed two endothermic transitions at temperatures of about 65 °C and 90 °C, for the trimeric and hexameric form of helianthinin, respectively. Furthermore, the DSC-profiles of the monomeric form of helianthinin also showed two endothermic transitions with similar denaturation temperatures, pointing to the existence of two populations of monomers. The results described in this study lead to the hypothesis that helianthinin can adopt two different conformational states: one state with a denaturation temperature of 65 °C and a second state with a denaturation temperature of 90 °C. Literature cited AACC Approved Methods of the American Association of Cereal Chemists, 9th ed, The American
Association of Cereal Chemists Inc, St. Paul, USA, 1995. Anisimova I.N., Fido R.J., Tatham A.S. and Shewry P.R. Genotypic variation and polymorphism of 2S
albumins of sunflower. Euphytica 1995, 83, 15-23. Bradford M.M. A rapid and sensitive method for the quantification of microgram quantities of protein
utilizing the principle of protein-dye binding. Anal. Biochem. 1976, 72, 248-254. Canella M. Whipping properties of sunflower protein dispersions. Food Sci. Technol-Leb. 1978, 11, 259-
263. Canella M., Castriotta G., Bernardi A. and Boni R. Functional properties of individual sunflower albumin
and globulin. Lebensm.-Wiss. Technol.-Food Sci. Technol. 1985, 18, 288-292. Cater C.M., Gheyasuddin S. and Mattil K.F. The effect of chlorogenic, quinic, and caffeic acids on the
solubility and color of protein isolates, especially from sunflower seed. Cereal Chem. 1972, 49, 508-514.
Dalgalarrondo M., Raymond J. and Azanza J.L. Sunflower seed proteins: characterization and subunit composition of the globulin fraction. J. Exp. Bot. 1984, 35, 1618-1628.
Dalgalarrondo M., Raymond J. and Azanza J.L. Sunflower seed protein: size and charge heterogeneity in subunits of the globulin fraction. Biochimie 1985, 67, 629-632.
Danilenko A.N., Bikbov T.M., Grinberg N.V., Leont'eva A.L., Burova T.V., Surikov V.V., Borisov Y.A. and Tolstoguzov V.B. Effect of pH on the thermal stability of 11S-globulin of Glycine Max seeds as indicated by differential scanning microcalorimetry. Biophysics 1987, 32, 434-439.
Gheyasuddin S., Cater C.M. and Mattil K.F. Effect of several variables on the extractability of sunflower seed proteins. J. Food Sci. 1970, 35, 453-56.
Guéguen J., Chevalier M., Barbot J. and Schaeffer F. Dissociation and aggregation of pea legumin induced by pH and ionic strength. J. Sci. Food Agric. 1988, 44, 167-182.
Johnson J. Protein structure and circular dichroism: A practical guide. Proteins: Str. Funct. Gen. 1990, 7, 205-214.
Joubert F.J. Sunflower seed proteins. Biochim. Biophys. Acta 1955, 16, 520-523. Kabirullah M. and Wills R.B.H. Characterization of sunflower protein. J. Agric. Food Chem. 1983, 31,
953-956. Kelly S.M. and Price N.C. The application of circular dichroism to studies of protein folding and
unfolding. Biochim. Biophys. Acta 1997, 1338, 161-185.
64

Structure and solubility of helianthinin
Kinsella J.E. Functional properties of soy proteins. J. Am. Oil Chem. Soc. 1979, 56, 242-258. Kortt A.A. and Caldwell J.B. Low molecular weight albumins from sunflower seed: Identification of a
methionine-rich albumin. Phytochemistry 1990, 29, 2805-2810. Lakemond C.M.M., de Jongh H.H.J., Hessing M., Gruppen H. and Voragen A.G.J. Heat denaturation of
soy glycinin: influence of pH and ionic strength on molecular structure. J. Agric. Food Chem. 2000a, 48, 1991-1995.
Lakemond C.M.M., de Jongh H.H.J., Hessing M., Gruppen H. and Voragen A.G.J. Soy glycinin: influence of pH and ionic strength on solubility and molecular structure at ambient temperatures. J. Agric. Food Chem. 2000b, 48, 1985-1990.
Makhatadze G.I. Measuring protein thermostability by differential scanning calorimetry. In Current protocols in protein science; Coligan J. E., Dunn B. M., Ploegh H. L., Speicher D. W. and Wingfield P. T., eds; John Wiley & sons: New York, 1998; 7.9.1-7.9.14.
Marcone M.F. Biochemical and biophysical properties of plant storage proteins: a current understanding with emphasis on 11S seed globulins. Food Res. Int. 1999, 32, 79-92.
Mattil K.F. The functional requirements of proteins for foods. J. Am. Oil Chem. Soc. 1971, 48, 477-480. Mazhar H., Quayle R., Fido R.J., Stobart A.K., Napier J.A. and Shewry P.R. Synthesis of storage reserves
in developing seeds of sunflower. Phytochemistry 1998, 48, 428-432. Pace C.N., Shirley B.A. and Thomson J.A. Measuring the conformational stability of a protein. In Protein
structure; a practical approach; Creighton T. E., eds; IRL Press: Oxford: 1989; 311-330. Pain R. Determining the CD spectrum of a protein. In Current protocols in protein science; Coligan J. E.,
Dunn B. M., Ploegh H. L., Speicher D. W. and Wingfield P. T., eds; John Wiley & sons: New York, 1996; 7.6.1-7.6.23.
Plietz P., Damaschun G., Muller J.J. and Schwenke K.D. The structure of 11-S globulins from sunflower and rape seed. A small-angle X-ray scattering study. Eur. J. Biochem. 1983, 130, 315-20.
Pots A.M., De Jongh H.H.J., Gruppen H., Hamer R.J. and Voragen A.G.J. Heat-induced conformational changes of patatin the major potato tuber protein. Eur. J. Biochem. 1998, 252, 66-72.
Prakash V. and Nandi P.K. Association-dissociation and denaturation behaviour of an oligomeric seed protein α-globulin of Sesamum indicum L., in acid and alkaline solutions. Int. J. Pept. Protein Res. 1977, 9, 319.
Prakash V. and Rao M.S.N. Physicochemical properties of oilseed proteins. CRC Crit. Rev. Biochem. 1986, 20, 265-363.
Privalov P.L. Stability of proteins. Small globular proteins. Adv. Protein Chem. 1979, 33, 167-241. Privalov P.L. and Potekhin S.A. Scanning microcalorimetry in studying temperature-induced changes in
proteins. Methods Enzymol. 1986, 131, 4-51. Rahma E.H. and Rao M.S.N. Characterization of sunflower proteins. J. Food Sci. 1979, 579-582. Raymond J., Mimouni B. and Azanza J.L. Variability in the 11S globulin fraction of seed storage protein
of Helianthus (Asteraceae). Plant Syst. Evol. 1994, 193, 69-79. Raymond J., Robin Jean M. and Azanza Jean L. 11 S seed storage proteins from Helianthus species
(Compositae): Biochemical, size and charge heterogeneity. Plant Syst. Evol. 1995, 198, 195-208. Reichelt R., Schwenke K.D., Konig T., Pahtz W. and Wangermann G. Electron microscopic studies for
estimation of the quaternary structure of the 11S globulin (helianthinin) from sunflower seed (Helianthus annuus L.). Biochemie und Physiologie der Pflanzen 1980, 175, 653-663.
Rossi M., Pagliarini E. and Peri C. Emulsifying and foaming properties of sunflower protein derivatives. Lebensm.-Wiss. Technol.-Food Sci. Technol. 1985, 18, 293-299.
Sabir M.A., Sosulski F.W. and MacKenzie S.L. Gel chromatography of sunflower proteins. J. Agric. Food Chem. 1973, 21, 988-993.
65

Chapter 3
66
Salunkhe D.K., Chavan J.K., Adsule R.N. and Kadam S.S. Sunflower. In World oilseeds: chemistry, technology and utilization; Van Nostrand Reinhold: New York, 1992; 97-139.
Schagger H. and von Jagow G. Tricine-sodium dodecyl sulfate-polyacrylamide gel electrophoresis for the separation of proteins in the range from 1 to 100 kDa. Anal. Biochem. 1987, 166, 368-379.
Schwenke K.D., Grinberg V., Danilenko A.N., Burova T.V. and Tolstoguzov V.B. On the acceptability of the two-state model of protein unfolding to the 11 S globulins from plant seeds. Nahrung 1987, 31, 183-184.
Schwenke K.D., Paehtz W., Linow K.J., Raab B. and Schultz M. On seed proteins. XI. Purification, chemical composition, and some physico-chemical properties of the 11 S globulin (Helianthinin) in sunflower seed. Nahrung 1979, 23, 241-254.
Schwenke K.D., Schultz M. and Linow K.J. Isolierung und Charakterisierung des 11-S-Globulins aus Sonnenblumensamen (Helianthus annuus L.). Nahrung 1975a, 19, 817-822.
Schwenke K.D., Schultz M. and Linow K.J. Ueber Samenproteine. 5. Dissoziationsverhalten des 11-S-Globulins aus Sonnenblumensamen. Nahrung 1975b, 19, 425-432.
Sosulski F. and Fleming S.E. Chemical, functional, and nutritional properties of sunflower protein products. J. Am. Oil Chem. Soc. 1977, 54, 100A-104A.
Sripad G. and Rao M.S.N. Effect of acid pH on the 11S protein of sunflower seed. J. Agric. Food Chem. 1987a, 35, 668-672.
Sripad G. and Rao M.S.N. Effect of methods to remove polyphenols from sunflower meal on the physicochemical properties of the proteins. J. Agric. Food Chem. 1987b, 35, 962-967.
Sturtevant J.M. Biochemical applications of differential scanning calorimetry. Annual Review of Physical Chemistry 1987, 38, 463-488.
Sun S.M., McLeester R.C., Bliss F.A. and Hall T.C. Reversible and irreversible dissociation of globulins from Phaseolus vulgaris seed. J. Biol. Chem. 1974, 249, 2118-2121.
Swiss-prot http://us.expasy.org/cgi-bin/niceprot.pl?P19084, p19084. van Mierlo C.P.M., van Dongen W.M.A.M., Vergeldt F., van Berkel W.J.H. and Steensma E. The
equilibrium unfolding of Azotobacter vinelandii apoflavodoxin II occurs via a relatively stable folding intermediate. Protein Science 1998, 7, 2331-2344.
Vermeesch G., Briffaud J. and Joyeux J. Sunflower proteins in human food. Re. Fr. Corps Gras 1987, 7-8, 333-344.
Vonder Haar R.A., Allen R.D., E.A. C., Nessler C.L. and Thomas T.L. Organization of the sunflower 11S storage protein gene family. Gene 1988, 74, 433-443.
Vuillemier S., Sancho J., Loewenthal R. and Fersht A.D. Circular dichroism studies on barnase and its mutants: Characterization of the contribution of aromatic side-chains. Biochemistry 1993, 32, 10303-10313.

Chapter 4
Solubility and molecular structure of 2S albumins and a
protein isolate from sunflower
Abstract Two main groups of proteins are present in a sunflower isolate (SI) obtained in Chapter 2: helianthinin and sunflower albumins (SFAs). SFAs are a diverse group of proteins, with a sedimentation coefficient of approximately 2S. This research presents a detailed study of the influence of pH on the structure and solubility of SFAs. The effect of temperature on the structure of SFAs was also studied. Furthermore, the solubility of the sunflower isolate was studied and discussed in terms of its main protein components. The native structure of SFAs revealed to be very stable against pH changes (pH 3.0 to 9.0) and heat treatment (> 100 °C), and their solubility was only marginally affected by pH and ionic strength. The solubility of the sunflower isolate as a function of pH seems to be dominated by that of helianthinin: SI (I = 30 mM) showed a U-shape solubility curve with a minimum between pH 4.0 and pH 6.0.

Chapter 4
Introduction In Chapter 2 the preparation of a sunflower isolate is described, which is free of phenolic compounds and nondenatured. Two main groups of proteins are present in this sunflower isolate (SI): helianthinin and the sunflower albumins (SFAs). Several studies have shown that these proteins are the two major classes of globular proteins present in sunflower seeds (Youle and Huang, 1981; Dalgalarrondo et al., 1984; Mazhar et al., 1998; Anisimova et al., 2002). SFAs are a diverse group of proteins, usually soluble in water, with a sedimentation coefficient of approximately 2S, of which some are rich in cysteine. They have been reported to be basic proteins (isoelectric pH (pI) around 8.8) and to have molecular weights (MW) ranging from about 10 to 18 kDa (Kortt and Caldwell, 1990; Anisimova et al., 1995; Raymond et al., 1995; Popineau et al., 1998). In contrast to 2S albumins from other seed species (i.e. Brazil nut, oilseed rape, mustard seed, etc), which are consisting of two chains linked by disulfide bonds, SFAs consist of a single polypeptide chain (Allen et al., 1987; Anisimova et al., 1995; Shewry and Pandya, 1999). SFAs are polymorphic and 8 to 13 individual SFA proteins have been separated by reverse-phase high-performance liquid-chromatography (RP-HPLC) and SDS-PAGE. However, the total number of components may be larger (Kortt and Caldwell, 1990; Anisimova et al., 1995). The levels at which these components are present vary widely between different genotypes (Anisimova et al., 1995; Anisimova et al., 2002). The amino acid sequences of two SFA proteins are available: 1) the so-called 2S albumin storage protein (HAG5) consisting of 134 amino acids, having a MW of 15777 Da and a theoretical isoelectric pH (pI) of 8.69; and 2) a methionine-rich 2S protein consisting of 103 amino acids, having a MW of 12133 Da and theoretical pI of 5.91 (Allen et al., 1987; Kortt et al., 1991; Swiss-prot, p15461; Swiss-prot, p23110). The latter protein is called SFA8 based on its order of elution on RP-HPLC (Kortt and Caldwell, 1990). Despite the research performed in the past decades, not much is known about the structure and behaviour of SFAs in solution. Heat treatments and treatment at acidic pH values are common in food industry and may alter protein structure. These structural modifications may easily result in changes in the functional properties of a protein, e.g. its solubility, which is a prerequisite for various functional properties such as emulsion and foam properties (Kinsella, 1979). Therefore, knowledge on protein structure and conformational stability at various conditions is important, in connection with solubility, during protein isolation and subsequent application in food products. This research presents a detailed study of the influence of pH on the structure and solubility of SFAs. The effect of temperature on protein structure is also studied. Furthermore, the solubility of the sunflower isolate is studied and discussed in terms of its main protein components.
68

Structure and solubility of sunflower albumins and a protein isolate
Materials and methods Protein Isolation Defatting and dephenolising Dehulled “Mycogen Brand” sunflower seeds, purchased from H.Ch. Schobbers B.V. (Echt, The Netherlands), were milled in a laboratory grinder (Janke and Kunkel GmbH, Staufen, Germany) for 3 min. High temperatures were avoided by cooling the grinder periodically with liquid nitrogen. The resulting meal was defatted with hexane and dephenolised by cold extraction of the phenolic compounds with 80 % (v/v) methanol as described previously (Chapter 2). This procedure yields the defatted dephenolised meal (DDM). Sunflower isolate preparation The DDM obtained was suspended in water [2 % (w/v)] and stirred for 30 min while keeping the pH at 9.0 by addition of 1 N NaOH. Soluble protein was recovered after centrifugation (30000 × g, 20 min, 20 °C). The pellet was re-extracted (similar conditions) and the two supernatants were combined to yield the extract. This extract was subjected to diafiltration using extensive washing. This filtration process was carried out by circulation through a 10 kDa TFF cartridge (Millipore Corporation, Bedford). The retentate obtained was subsequently freeze-dried and denoted SI. Sunflower albumins (SFAs) isolation The DDM obtained was suspended in water [2 % (w/v)] and stirred for 2 h while keeping the pH at 5.0 by addition of small volumes of 1 N HCl. Continuous centrifugation was carried out in a vertical centrifuge type V30-O/703 (Heine; GFT Trenntechnik, Viersen, Germany) at the maximum speed of 3500 rpm. Filter cloths (mesh size 1 µm) were purchased at Lampe technical textiles BV in Sneek (The Netherlands). The pellet was re-extracted at similar conditions [2 % (w/v)] suspension, pH 5.0) and the two supernatants were combined. Ammonium sulfate was added to the total supernatant up to 90 % saturation and the mixture was stored for 30 minutes at 4 °C. After centrifugation (10000 × g, 20 min, 4 °C), the supernatant was discarded and the pellet was washed [2 % (w/v)] once with an ammonium sulphate solution (90 % saturation) at 4 °C. After centrifugation (10000 × g, 20 min, 4 °C), the final pellet was dissolved in distilled water and desalted by diafiltration using Xampler UFP-3-C cross-flow hollow fiber laboratory cartridges with a molecular weight cut-off of 3 kDa (A/G Technology Corp., Needham, USA) until the conductivity of the retentate remained constant. The retentate obtained was freeze-dried to yield the SFAs extract. Further purification was performed by gel permeation chromatography. The SFAs extract was dissolved [1 % (w/v)] in 30 mM sodium phosphate buffer (pH 8.0), and 150 ml of the
69

Chapter 4
solution was applied, after filtration over 0.45 µm filter, on a Superdex 200 column (68 x 10 cm) (Amersham Pharmacia Biotech AB, Uppsala, Sweden). The column was eluted with the same buffer at a linear flow rate of 30 cm/h. The second peak, as observed from the absorbance at 280 nm, was collected, diafiltrated using Xampler UFP-3-C cross-flow hollow fiber laboratory cartridges with a molecular weight cut-off of 3 kDa (A/G Technology Corp., Needham, USA) until the conductivity of the retentate remained constant, and freeze-dried to produce purified SFAs. Determination of protein solubility Protein solubility experiments were performed with SI and SFAs. The proteins were dispersed to a final concentration of 4.0 mg/ml in water and the pH adjusted to 8.5 by addition of small amounts of NaOH solutions. The ionic strength was adjusted to 0.03 M or 0.25 M by adding NaCl. The pH of the protein solutions was lowered by adding various amounts of HCl solutions to obtain final pH values ranging from 2.0 to 8.5 with 0.5 pH unit intervals. The samples were stored for about 2 hours at room temperature. Next, the samples were centrifuged for 15 min at 15,800 × g at 20 °C. The protein concentration of the supernatants was determined in triplicate using the Bradford method (Bradford, 1976) with bovine serum albumin (BSA) as a standard. Solubility was expressed as proportion (%) of the amount of protein dissolved at pH 8.5. All the solubility experiments were performed at least in duplicate. Protein concentration as estimated by Bradford (Bradford, 1976) and Dumas method were compared and found to be similar. For the latter method, a NA 2100 nitrogen analyser was used according to the instructions of the manufacturer. Analysis Protein content Protein content (N x 6.25) of the SI and SFAs isolate was determined by the Kjeldahl method, AACC 46-12 (AACC, 1995). Protein size and composition Protein size and composition was estimated by analytical gel permeation chromatography and gel electrophoresis.
70

Structure and solubility of sunflower albumins and a protein isolate
Gel permeation chromatography Gel permeation chromatography was performed using an Äkta Explorer System (Amersham, Pharmacia Biotech, Uppsala, Sweden). Protein samples (0.2-2.0 mg/ml) were dissolved at room temperature in 50 mM sodium phosphate buffer, pH 6.9, containing 0.25 M NaCl. After filtration over a 0.2 µm filter, the samples were applied (0.2 ml) on a Superdex 200 HR 10/30 (30 x 1 cm) column and eluted with the same buffer at a flow rate of 0.5 ml/min at room temperature. The column was calibrated using markers ranging from 13 to 2000 kDa (Amersham, Pharmacia Biotech, Uppsala, Sweden): Ribonuclease A (13,700 Da), ovalbumin (43,000 Da), BSA (67,000 Da), aldolase (158,000 Da), catalase (232,000 Da), ferritin (440,000 Da) and blue dextran (2,000,000 Da). The absorbance of the eluate was monitored at 214 and 280 nm. Gel electrophoresis Sodium dodecyl sulphate polyacrylamide gel electrophoresis (SDS-PAGE) was performed according to the method of Schägger and von Jagow (Schagger and von Jagow, 1987) on a Mini-PROTEAN II electrophoresis system (Bio-Rad, Veenendaal, The Netherlands), following the instruction of the manufacturer. Protein samples of 10-15 µg were dissolved in sample buffer, and applied to precast 16.5 % Tris-tricine gels (Bio-Rad, Veenendaal, The Netherlands). After electrophoresis the gels were stained with Coomassie Brilliant Blue. Protein markers used ranged from 3.5 to 26.6 kDa (Bio-Rad, Veenendaal, The Netherlands): bovine insulin (3,496 Da), aprotinin (6,500 Da), lysozyme (14,400 Da), myoglobin (16,950 Da) and triosephosphate isomerase (26,625 Da). Differential scanning calorimetry (DSC) Calorimetric studies were performed using a VP-DSC MicroCalorimeter (MicroCal Incorporated, Northhampton MA, USA). Thermograms were recorded from 20 °C to 130 °C with a heating rate of 1 °C/min. Experiments were performed with SFAs at protein concentrations of 1.0-3.0 mg/ml at several pH values: pH 3.0 (10 mM sodium phosphate buffer), pH 6.2 (10 mM sodium phosphate buffer), pH 7.0 (10 mM sodium phosphate buffer) and pH 9.0 (10 mM sodium borate buffer). The final ionic strength of the buffers was adjusted to 30 mM by adding NaCl. Protein concentration of the solutions was estimated by absorbance measurement at 280 nm, using sunflower isolate as standard. All measurements were carried out at least in duplicate. Circular dichroism (CD) spectroscopy (Far-UV) The protein concentration of the solutions used for the CD experiments was estimated by absorbance measurement at 280 nm, using sunflower isolate as standard. Far-UV CD spectra of SFAs samples were recorded at 20 °C, 110 °C and at 20 °C after heat treatment at 110 °C, as averages of 10 spectra on a Jasco J-715 spectropolarimeter
71

Chapter 4
(Jasco Corp., Japan) at several pH values: pH 3.0 (10 mM sodium phosphate buffer), pH 6.2 (10 mM sodium phosphate buffer), pH 7.0 (10 mM sodium phosphate buffer) and pH 9.0 (10 mM sodium borate buffer). The final ionic strength of the buffers was adjusted to 30 mM by adding NaF. Quartz cells with an optical path length of 1 mm and 0.2 mm with protein concentrations of approximately 0.1 mg/ml and 0.04 mg/ml, respectively, were used. The scan range was 180-260 nm, the scan speed was 100 nm/min, the data interval was 0.2 nm, the bandwidth 1.0 nm, the sensitivity was 20 mdeg and the response time 0.125 seconds. Spectra were corrected by subtracting the spectrum of a protein-free sample obtained under identical conditions. Noise reduction was applied using the Jasco software. The spectra were analysed from 240 to 190 nm to calculate the secondary structure content of the protein using a non-linear regression procedure as described in detail by Pots et al. (Pots et al., 1998). Changes in thermal stability of the secondary structure of proteins were also monitored by measuring the ellipticity at 200 nm as a function of temperature at a heating rate of 1 °C/min. Mass spectrometry (MALDI-TOF) Matrix assisted laser desorption ionization time-of-flight (MALDI-TOF) mass spectra were acquired on a Voyager-DETMRP Mass spectrometer (PerSeptive Biosystems Inc., Framingham, U.S.A) equipped with UV nitrogen laser (337 nm). The instrument was operated in linear mode. Spectra were obtained in positive ion mode using an acceleration voltage of 25 kV and a delay time of 400 ns. The samples (1.0 mg/ml) were dissolved in a 20 mM sodium phosphate buffer (pH 7.0) with and without addition of 30 mM dithiothreitol for the reducing and non-reducing conditions respectively. Aliquots (1µl) of the protein solutions were mixed with 9 µl matrix solution. The matrix solution consisted of sinapinic acid (10 mg/ml) in 50 % (v/v) acetonitrile containing 0.3 % (v/v) trifluoroacetic acid. The final mixtures were loaded on a welled plate and allowed to dry. All samples were analysed at least in triplicate. Results Protein composition The protein contents of the SI and of the purified SFAs were both 98 ± 2 % on dry matter basis. Tricine SDS-PAGE of SFAs shows two main bands with approximate molecular weights (MW) of 12 and 15 kDa. Mass spectrometry confirmed the presence of a 12.117 Da protein, but no peak could be detected at 15 kDa (no further data shown). Gel permeation chromatography (pH 6.9) of SFAs showed only 1 peak (Figure 1) with an elution volume of 17.0 ± 0.2 ml. Calibration of the column revealed an apparent molecular weight of 14 kDa.
72
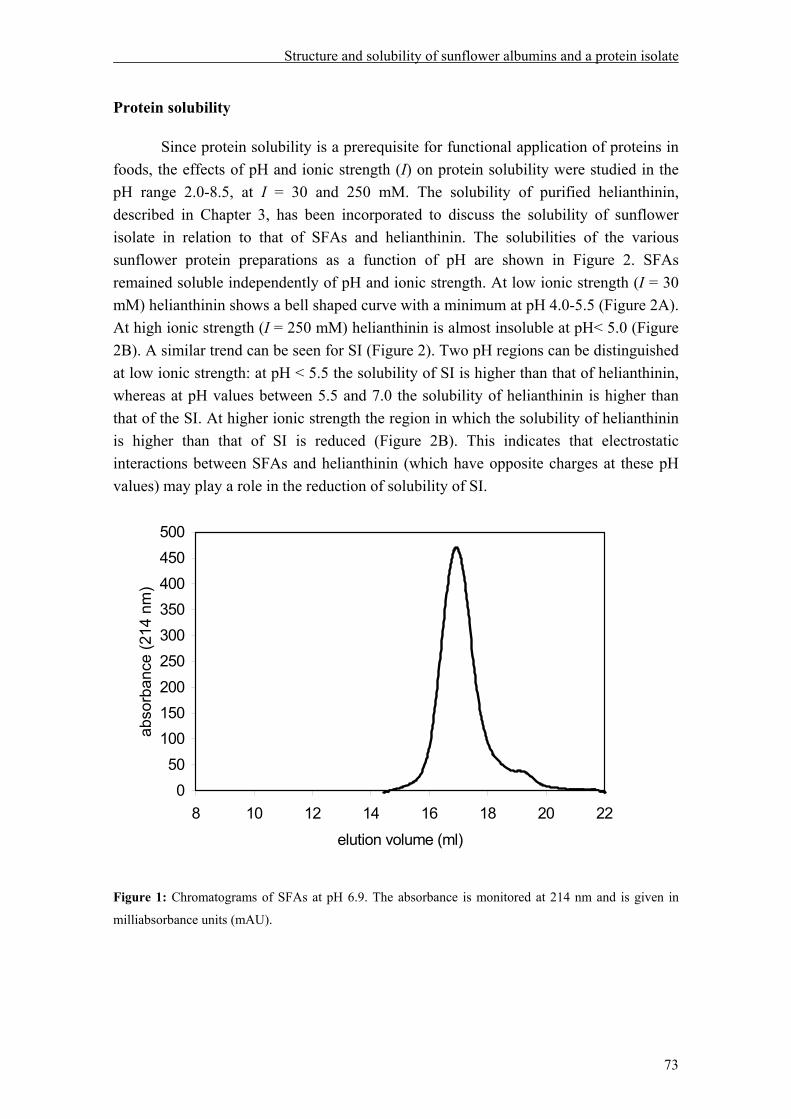
Structure and solubility of sunflower albumins and a protein isolate
Protein solubility Since protein solubility is a prerequisite for functional application of proteins in foods, the effects of pH and ionic strength (I) on protein solubility were studied in the pH range 2.0-8.5, at I = 30 and 250 mM. The solubility of purified helianthinin, described in Chapter 3, has been incorporated to discuss the solubility of sunflower isolate in relation to that of SFAs and helianthinin. The solubilities of the various sunflower protein preparations as a function of pH are shown in Figure 2. SFAs remained soluble independently of pH and ionic strength. At low ionic strength (I = 30 mM) helianthinin shows a bell shaped curve with a minimum at pH 4.0-5.5 (Figure 2A). At high ionic strength (I = 250 mM) helianthinin is almost insoluble at pH< 5.0 (Figure 2B). A similar trend can be seen for SI (Figure 2). Two pH regions can be distinguished at low ionic strength: at pH < 5.5 the solubility of SI is higher than that of helianthinin, whereas at pH values between 5.5 and 7.0 the solubility of helianthinin is higher than that of the SI. At higher ionic strength the region in which the solubility of helianthinin is higher than that of SI is reduced (Figure 2B). This indicates that electrostatic interactions between SFAs and helianthinin (which have opposite charges at these pH values) may play a role in the reduction of solubility of SI.
050
100150200250300350400450500
8 10 12 14 16 18 20 22elution volume (ml)
abso
rban
ce (2
14 n
m)
Figure 1: Chromatograms of SFAs at pH 6.9. The absorbance is monitored at 214 nm and is given in
milliabsorbance units (mAU).
73

Chapter 4
0
20
40
60
80
100
120
1 3 5 7 9pH
solu
bilit
y (%
)
A
B
0
20
40
60
80
100
120
1 3 5 7 9pH
solu
bilit
y (%
)
Figure 2: pH-dependent solubility profiles of helianthinin (Chapter 3; ▲), SFAs (♦) and SI (■) at I =
30mM (A) and 250 mM (B). Secondary structure at various pH values Far-UV CD spectra of SFAs were recorded at pH 3.0, 6.2, 7.0 and 9.0 (I = 30) at 20 ° C (Figure 3). The far-UV spectra are almost identical at all the pH values studied (Figure 3). The characteristic features are two minima about 209 and 222 nm, and a zero crossing around 200 nm. Using curve-fitting procedures, the secondary structure content of SFAs was estimated. These estimations revealed that SFAs contain similar amounts (32 %) of α-helical, β-sheet and non-structured elements.
74
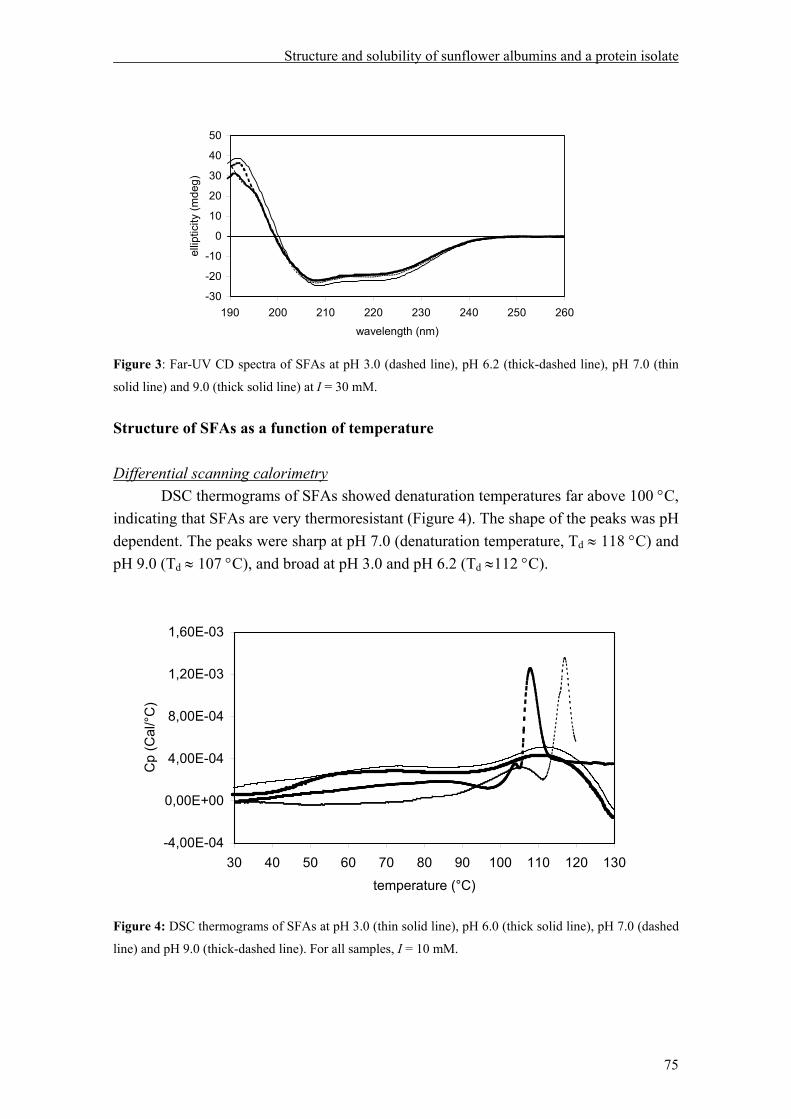
Structure and solubility of sunflower albumins and a protein isolate
-30
-20
-10
0
10
20
30
40
50
190 200 210 220 230 240 250 260wavelength (nm)
ellip
ticity
(mde
g)
Figure 3: Far-UV CD spectra of SFAs at pH 3.0 (dashed line), pH 6.2 (thick-dashed line), pH 7.0 (thin
solid line) and 9.0 (thick solid line) at I = 30 mM. Structure of SFAs as a function of temperature Differential scanning calorimetry DSC thermograms of SFAs showed denaturation temperatures far above 100 °C, indicating that SFAs are very thermoresistant (Figure 4). The shape of the peaks was pH dependent. The peaks were sharp at pH 7.0 (denaturation temperature, Td ≈ 118 °C) and pH 9.0 (Td ≈ 107 °C), and broad at pH 3.0 and pH 6.2 (Td ≈112 °C).
-4,00E-04
0,00E+00
4,00E-04
8,00E-04
1,20E-03
1,60E-03
30 40 50 60 70 80 90 100 110 120 130temperature (°C)
Cp
(Cal
/°C)
Figure 4: DSC thermograms of SFAs at pH 3.0 (thin solid line), pH 6.0 (thick solid line), pH 7.0 (dashed
line) and pH 9.0 (thick-dashed line). For all samples, I = 10 mM.
75

Chapter 4
Secondary folding as a function of temperature Figure 5A shows the far-UV CD spectra of SFAs at pH 7.0 (I = 30 mM) at 20 °C, 110 °C and 20 °C after heating at 110 °C. To monitor changes in secondary structure, far-UV CD temperature scans were recorded at 200 nm from 20 to 110 °C (Figure 5B). In agreement with the DSC results, far-UV CD temperature scans showed only minor changes in the ellipticity between 20 °C and 110 °C (Figure 5B). Higher temperatures could not be tested due to limitation of the apparatus. In contrast to the DSC experiments, the thermal unfolding of the SFAs in the far-UV CD experiments seems to be partially reversible (Figure 5A). This is most likely due to the lower concentration used in the far-UV CD experiments compared to that in the DSC experiments.
-2
-1
0
1
2
3
4
5
20 40 60 80 100temperature (°C)
ellip
ticity
(mde
g)
-20-15-10-505
1015202530
190 200 210 220 230 240 250 260wavelength (nm)
ellip
ticity
(mde
g)
A
B
Figure 5: A) Far-UV CD spectra of SFAs (pH 7.0; I =30mM) recorded at 20°C (thick solid line), 110 °C
(thin solid line) and 20 °C after heating up to 110°C (dashed line); and B) Far-UV CD temperature scan
of SFAs at pH 7.0 (I = 30 mM), recorded at 200nm.
76

Structure and solubility of sunflower albumins and a protein isolate
Discussion SFAs revealed to be a group of proteins with a high conformational stability with respect to both pH (Figure 3) and heat treatments (Figure 5). DSC as well as far-UV CD temperature scans revealed denaturation temperatures far above 100 °C. Although DSC scans showed a good repeatability, calculation of the thermodynamic data for SFAs was impaired by the difficulty to draw reasonable baselines, and therefore, no enthalpy values are shown. The data presented here are consistent with previous studies with a single sunflower albumin, SFA 8, in which the far-UV CD spectra of the protein did not vary over the pH range 2.0-10.0 or when heated up to 90 °C (Pandya et al., 1999). In the present research, however, no changes in secondary structure were observed at temperatures below 100 ºC. The latter authors demonstrated the important role of disulfide bonds in maintaining the stability of the protein native fold. Molecular modelling studies predict that SFA8 has a compact structure with hydrophobic residues clustered to form a hydrophobic interface (Pandya et al., 2000). This high stability seems to be a common feature of 2S seed proteins as 2S proteins from rapeseed were also found to be very stable (Muren et al., 1996; Folawiyo and Owusu Apenten, 1997; Krzyzaniak et al., 1998). Although the isolated SFAs consisted of at least two proteins according to their MW, and therefore no conclusive results can be deduced from the far-UV CD spectra, the similarity of the spectra of SFAs to those found for isolated SFA 8 in the research of Pandya et al (1999) is high. Both show a maximum at about 190 nm and minima close to 209 and 222 nm. Furthermore, our estimation in the amount of α-helical structure (32 %) coincides with that of these authors (30 %). Far-UV CD spectra for 2S albumins from rapeseed seed showed similar patterns (Krzyzaniak et al., 1998). The solubility of the sunflower isolate as a function of pH seems to be governed by helianthinin. The solubility of SFAs is not affected by pH at I = 30 and 250 mM, whereas helianthinin and SI showed a U-shape solubility curve with a minimum between pH 4.0 and pH 5.5-6.0 (I =30 mM) (Figure 2). These values are in agreement with previous publications dealing with the solubility of various sunflower protein products (Gheyasuddin et al., 1970; Mattil, 1971; Sosulski and Fleming, 1977; Canella, 1978; Rossi et al., 1985; Vermeesch et al., 1987). However, Canella et al. (1985) reported minimum solubility of SFAs at pH 5.0. This divergence is probably due to the different composition of the albumin fraction and to possible contamination of the preparation with helianthinin as could be inferred from the pH of minimum solubility. The decreased solubility of helianthinin at pH 3.0 (I = 30 mM), which could be attributed to denaturation and dissociation of the protein (Chapter 3), is also observed for SI. A similar trend has been found by several authors (Gheyasuddin et al., 1970; Mattil, 1971; Cater et al., 1972; Canella et al., 1985). SI is estimated to contain about 13-25 % SFAs according to the intensity of the bands in gel electrophoresis and to the
77
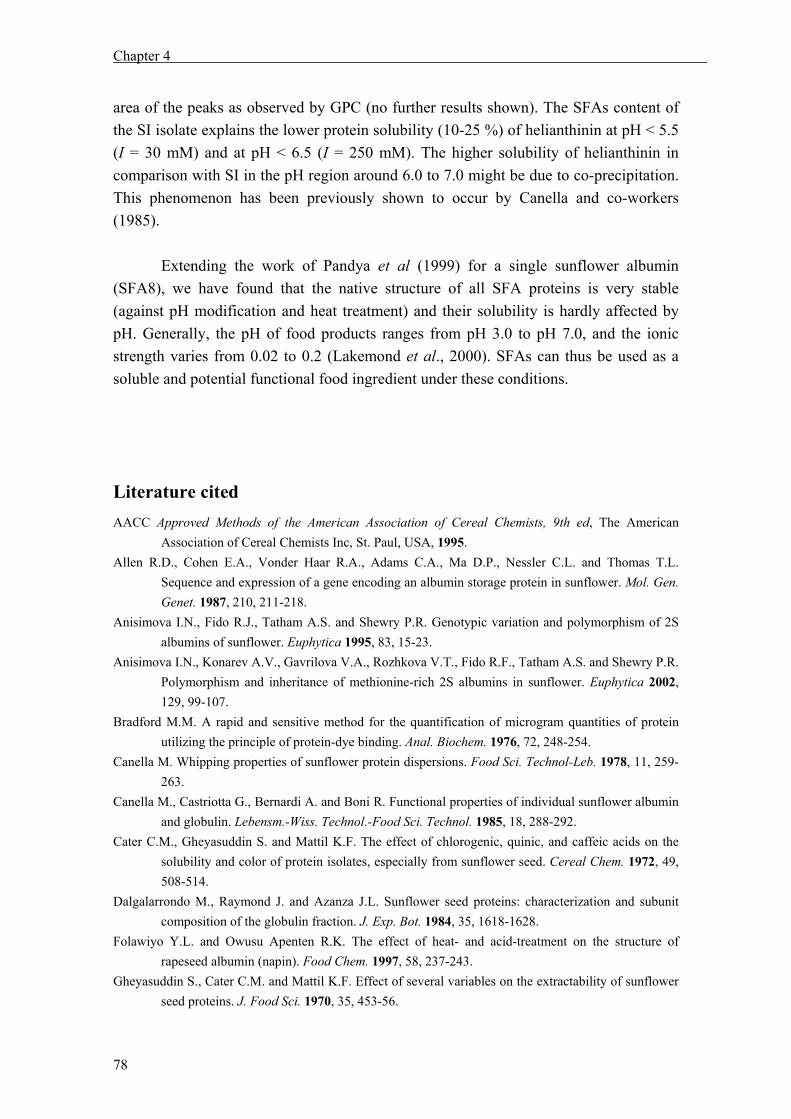
Chapter 4
area of the peaks as observed by GPC (no further results shown). The SFAs content of the SI isolate explains the lower protein solubility (10-25 %) of helianthinin at pH < 5.5 (I = 30 mM) and at pH < 6.5 (I = 250 mM). The higher solubility of helianthinin in comparison with SI in the pH region around 6.0 to 7.0 might be due to co-precipitation. This phenomenon has been previously shown to occur by Canella and co-workers (1985). Extending the work of Pandya et al (1999) for a single sunflower albumin (SFA8), we have found that the native structure of all SFA proteins is very stable (against pH modification and heat treatment) and their solubility is hardly affected by pH. Generally, the pH of food products ranges from pH 3.0 to pH 7.0, and the ionic strength varies from 0.02 to 0.2 (Lakemond et al., 2000). SFAs can thus be used as a soluble and potential functional food ingredient under these conditions.
Literature cited
AACC Approved Methods of the American Association of Cereal Chemists, 9th ed, The American Association of Cereal Chemists Inc, St. Paul, USA, 1995.
Allen R.D., Cohen E.A., Vonder Haar R.A., Adams C.A., Ma D.P., Nessler C.L. and Thomas T.L. Sequence and expression of a gene encoding an albumin storage protein in sunflower. Mol. Gen. Genet. 1987, 210, 211-218.
Anisimova I.N., Fido R.J., Tatham A.S. and Shewry P.R. Genotypic variation and polymorphism of 2S albumins of sunflower. Euphytica 1995, 83, 15-23.
Anisimova I.N., Konarev A.V., Gavrilova V.A., Rozhkova V.T., Fido R.F., Tatham A.S. and Shewry P.R. Polymorphism and inheritance of methionine-rich 2S albumins in sunflower. Euphytica 2002, 129, 99-107.
Bradford M.M. A rapid and sensitive method for the quantification of microgram quantities of protein utilizing the principle of protein-dye binding. Anal. Biochem. 1976, 72, 248-254.
Canella M. Whipping properties of sunflower protein dispersions. Food Sci. Technol-Leb. 1978, 11, 259-263.
Canella M., Castriotta G., Bernardi A. and Boni R. Functional properties of individual sunflower albumin and globulin. Lebensm.-Wiss. Technol.-Food Sci. Technol. 1985, 18, 288-292.
Cater C.M., Gheyasuddin S. and Mattil K.F. The effect of chlorogenic, quinic, and caffeic acids on the solubility and color of protein isolates, especially from sunflower seed. Cereal Chem. 1972, 49, 508-514.
Dalgalarrondo M., Raymond J. and Azanza J.L. Sunflower seed proteins: characterization and subunit composition of the globulin fraction. J. Exp. Bot. 1984, 35, 1618-1628.
Folawiyo Y.L. and Owusu Apenten R.K. The effect of heat- and acid-treatment on the structure of rapeseed albumin (napin). Food Chem. 1997, 58, 237-243.
Gheyasuddin S., Cater C.M. and Mattil K.F. Effect of several variables on the extractability of sunflower seed proteins. J. Food Sci. 1970, 35, 453-56.
78

Structure and solubility of sunflower albumins and a protein isolate
Kinsella J.E. Functional properties of soy proteins. J. Am. Oil Chem. Soc. 1979, 56, 242-258. Kortt A.A. and Caldwell J.B. Low molecular weight albumins from sunflower seed: Identification of a
methionine-rich albumin. Phytochemistry 1990, 29, 2805-2810. Kortt A.A., Caldwell J.B., Lilley G.G. and Higgins T.J.V. Amino acid and complementary DNA
sequences of a methionine-rich 2S protein from sunflower seed (Helianthus annuus L.). Eur. J. Biochem. 1991, 195, 329-334.
Krzyzaniak A., Burova T., Haertle T. and Barciszewski J. The structure and properties of napin-seed storage protein from rape (Brassica napus L.). Nahrung 1998, 42, 201-204.
Lakemond C.M.M., de Jongh H.H.J., Hessing M., Gruppen H. and Voragen A.G.J. Soy glycinin: influence of pH and ionic strength on solubility and molecular structure at ambient temperatures. J. Agric. Food Chem. 2000, 48, 1985-1990.
Mattil K.F. The functional requirements of proteins for foods. J. Am. Oil Chem. Soc. 1971, 48, 477-480. Mazhar H., Quayle R., Fido R.J., Stobart A.K., Napier J.A. and Shewry P.R. Synthesis of storage reserves
in developing seeds of sunflower. Phytochemistry 1998, 48, 428-432. Muren E., Ek B., Bjork I. and Rask L. Structural comparison of the precursor and the mature form of
napin, the 2S storage protein in Brassica napus. Eur. J. Biochem. 1996, 242, 214-219. Pandya M.J., Sessions R.B., Williams P.B., Dempsey C.E., Tatham A.S., Shewry P.R. and Clarke A.R.
Structural characterization of a methionine-rich, emulsifying protein from sunflower seed. Proteins: Str. Funct. Gen. 2000, 38, 341-349.
Pandya M.J., Williams P.B., Dempsey C.E., Shewry P.R. and Clarke A.R. Direct kinetic evidence for folding via a highly compact, misfolded state. J. Biol. Chem. 1999, 274, 26828-26837.
Popineau Y., Tatham A.S., Shewry P.R., Marion D. and Guéguen J. 2S sunflower albumins : functional properties of native and modified proteins. In Plant Proteins from European Crops. Food and non-food applications; Guéguen J. and Popineau Y., eds; INRA Editions: Nantes (France), 1998; 131-135.
Pots A.M., De Jongh H.H.J., Gruppen H., Hamer R.J. and Voragen A.G.J. Heat-induced conformational changes of patatin the major potato tuber protein. Eur. J. Biochem. 1998, 252, 66-72.
Raymond J., Robin Jean M. and Azanza Jean L. 11 S seed storage proteins from Helianthus species (Compositae): Biochemical, size and charge heterogeneity. Plant Syst. Evol. 1995, 198, 195-208.
Rossi M., Pagliarini E. and Peri C. Emulsifying and foaming properties of sunflower protein derivatives. Lebensm.-Wiss. Technol.-Food Sci. Technol. 1985, 18, 293-299.
Schagger H. and von Jagow G. Tricine-sodium dodecyl sulfate-polyacrylamide gel electrophoresis for the separation of proteins in the range from 1 to 100 kDa. Anal. Biochem. 1987, 166, 368-379.
Shewry P.R. and Pandya M.J. The 2S albumins storage proteins. In Seed Proteins; Shewry P. R. and Casey R., eds; Kluwer Academic Publishers: Amsterdam, 1999; 619-664.
Sosulski F. and Fleming S.E. Chemical, functional, and nutritional properties of sunflower protein products. J. Am. Oil Chem. Soc. 1977, 54, 100A-104A.
Swiss-prot http://us.expasy.org/cgi-bin/niceprot.pl?P15461, p15461. Swiss-prot http://us.expasy.org/cgi-bin/niceprot.pl?P23110, p23110. Vermeesch G., Briffaud J. and Joyeux J. Sunflower proteins in human food. Re. Fr. Corps Gras 1987, 7-
8, 333-344. Youle R.J. and Huang A.H.C. Occurrence of low molecular weight and high cysteine containing albumin
storage proteins in oilseeds of diverse species. Am. J. Bot. 1981, 68, 44-48.
79

Chapter 5
Emulsion properties of sunflower proteins*
Abstract Emulsions were made with sunflower protein isolate (SI), helianthinin and sunflower albumins (SFAs). Emulsion formation and stabilisation were studied as a function of pH, ionic strength and after heat treatment of the protein. The emulsions were characterized with respect to average droplet size, surface excess, and the occurrence of coalescence and/or droplet aggregation. Sunflower proteins were shown to form stable emulsions, with the exception of SFAs at alkaline and neutral pH values. Droplet aggregation occurred in emulsions made with SI, helianthinin and SFAs. Droplet aggregation and subsequent coalescence of emulsions made with SFAs could be prevented at pH 3. Calcium was found to cause droplet aggregation of emulsions made with helianthinin at neutral and alkaline pH values. It seems that treatments that increase conformational flexibility improve the emulsion properties of sunflower proteins. * This chapter will be submitted for publication

Chapter 5
Introduction
The global demand for protein is increasing and, as a consequence, there is a need for new sources of food proteins. Vegetable proteins are an economic and versatile substitute for animal proteins as functional ingredient in food formulations. Oilseeds are the most important source of vegetable protein ingredients. Up to now, soy protein is the main oilseed protein used as a functional ingredient in foods such as bakery products, milk substitutes and meat products. However, sunflower proteins might be a good alternative in view of their widespread availability in areas where soy is not or only slightly produced. Furthermore, sunflower seeds have been reported to contain low or no anti-nutritional factors (ANF’s), e.g. protease inhibitors, cyanogens, glusosinolates, etc (Gassmann, 1983). Although the absence of ANF’s is important, it is also necessary to characterize the functional properties of the sunflower proteins in order to identify their possible applications in foods.
The functional properties of sunflower proteins have been studied, revealing good emulsification and foaming properties (Huffman et al., 1975; Sosulski and Fleming, 1977; Schwenke et al., 1981; Raymond et al., 1985; Vermeesch et al., 1987; Kabirullah and Wills, 1988; Lasztity et al., 1992; Salunkhe et al., 1992; Pawar et al., 2001), and poor gelling properties (Fleming and Sosulski, 1975; Bilani et al., 1989; Sanchez and Burgos, 1995; Pawar et al., 2001). Many of the studies dealing with the functionality of sunflower proteins were performed with protein products of which the extent of denaturation was marginally or not studied. In some cases, however, the isolating procedures must have resulted in severe protein denaturation and subsequent modification of protein functionality (Chapter 2). In addition, some of the protein products investigated contained phenolic compounds, especially chlorogenic acid (CGA), which are known to interact and form complexes with proteins thereby affecting protein functionality (Sripad and Rao, 1987; Sastry and Rao, 1990). The functional properties of gently isolated individual proteins have, however, not been studied extensively. The two main groups of sunflower proteins are 11S globulin, also known as helianthinin, and 2S albumins, also known as sunflower albumins (SFAs). The currently most accepted model of helianthinin (11S) at neutral pH consists of an arrangement of six spherical subunits into a trigonal antiprism (Plietz et al., 1983). The monomeric subunits consist of an acidic (32-44 kDa) and a basic (21-27 kDa) polypeptide linked by a single disulphide bond. The structure of helianthinin can be modulated by ionic strength and pH, and helianthinin can occur as a monomer, trimer, hexamer or in higher aggregated forms (Chapter 3). Sunflower albumins are basic proteins with a molecular weight in the range 10-18 kDa (Kortt and Caldwell, 1990; Anisimova et al., 1995; Raymond et al., 1995). The physico-chemical properties of sunflower proteins have been characterised previously (Chapters 3 and 4).
82

Emulsion properties of sunflower proteins
One of the primary functional requirements of many food proteins is the ability to form and stabilise emulsions. Emulsions are mixtures of at least two immiscible liquids of which one is dispersed as droplets into the other, which forms the continuous phase. Emulsions are thermodynamically unstable; i.e. the free energy of two immiscible liquids forming an emulsion is higher than the energy of the separated liquid phases. Therefore, an energy input is necessary to form emulsions. The energy applied must be larger than the surface energy of contact resulting from the mixing (Mangino, 1994). Proteins generally have good emulsifying properties and are, therefore, often used in food emulsions. The emulsion forming properties depend on intrinsic protein properties such as molar mass, hydrophobicity, conformation stability, and charge, and on extrinsic physicochemical conditions such as pH, ionic strength and temperature (Kinsella, 1984). During emulsification proteins adsorb at the oil/water interface of the elongated oil droplets. The adsorbed proteins lower the interfacial tension, thus facilitating droplet break-up, and preventing immediate recoalescence of colloid droplets (Walstra and Smulders, 1997). Once at the interface, proteins are considered to unfold to varying extents, reorient, rearrange, and spread (Das and Kinsella, 1990). The hydrophobic loops orient towards the apolar oil phase, while polar charged segments extend into the aqueous phase (Das and Kinsella, 1990). Once emulsion is formed various instabilities may occur. Creaming is the rise of droplets to the top of the emulsion due to the density difference between the dispersed and the continuous phase. Droplet aggregation may also occur in emulsions, and may lead to coalescence if the thin film between two droplets is ruptured. In this paper the emulsion forming and stabilising properties of individual sunflower proteins are studied as a function of pH, ionic strength and after heat treatment. These properties are then used to explain the observed emulsion properties of sunflower isolate (SI) and helianthinin/SFAs mixtures. Materials and Methods Materials Dehulled “Mycogen Brand” sunflower seeds were purchased from H.Ch. Schobbers B.V. (Echt, The Netherlands). Tricaprylin oil (ρ = 0.9540 Kg.dm-3; nD = 1.4466) was purchased from Sigma (Zwijndrecht, The Netherlands). All other chemicals were of analytical grade and obtained from Merck (Darmstadt, Germany). Sunflower protein isolate (SI) was obtained as described in Chapter 2. Helianthinin and sunflower albumins (SFAs) were obtained as described in Chapter 3 and 4, respectively, but with omission of the last gel permeation chromatography step. The resulting helianthinin preparation was mostly in the 11S and 7S form (90 %), next to about 6 % in its monomeric form and the presence of other protein impurities (4 %). The resulting SFAs preparation contained about 4 % other protein impurities. Also a
83

Chapter 5
fraction corresponding to the monomeric form of helianthinin was isolated, as described in Chapter 3. Preparations of the proteins solutions Protein dispersions (5.0-8.0 mg/ml) were prepared from SI, SFAs and helianthinin in 22 mM Tris-HCl buffer (pH 7.1), 30 mM Tris-HCl buffer (pH 8.0) or 23 mM sodium phosphate buffer (pH 3.0), each having an ionic strength of 20 mM. Protein dispersions were also prepared from SFAs in 30 mM sodium acetate buffer (pH 5). In addition, all dispersions were prepared at an ionic strength of 100 mM using the same buffers containing 80 mM NaCl. The buffers solutions contained a preservative (0.02 % (w/v) sodium azide) to inhibit microbial growth. Mixtures of SFAs and helianthinin were prepared at pH 7.1 (22 mM Tris-HCl buffer) by mixing standard solutions (4.0 mg/ml) of these proteins to obtain protein solutions with 10, 25, 50 and 75 % SFAs. All proteins dispersions prepared were stirred overnight at 16 ºC after which the pH was measured and if necessary adjusted with small volumes of NaOH and HCl (0.1-1 M). Next, the protein dispersions were centrifuged (3000 × g, 30 min, 20 ºC) and filtered over a 0.2 µm filter (Schleicher and Schuell, Dassel, Germany). The protein concentration of the final protein solutions was estimated using the method of Bradford (Bradford, 1976) with bovine serum albumin as a standard. Part of the helianthinin dispersion at pH 3 was adjusted (after 10-15 minutes kept at the latter pH) to pH 7 and pH 8 by addition of NaOH (0.1-1 M) and subsequently centrifuged (3000 × g, 30 min, 20 ºC). The supernatant was further concentrated with Microcon centrifugal concentrators YM-3000 (Millipore, Etten-Leur, The Netherlands). These treatments are referred to as pH 3→ 7 and pH 3→ 8 treatment, respectively. Protein samples for testing the effect of heat treatment were prepared by making dispersions of 10.0 mg/ml of helianthinin in 30 mM Tris-HCl buffer (pH 8.0). The dispersions were centrifuged (3000 × g, 30 min, 20 ºC) and the supernatant filtered over a 0.2 µm filter (Schleicher and Schuell, Dassel, Germany), and subsequently heated in a thermostated waterbath at 65 ºC or 100 ºC for 30 min. Heated samples were cooled on ice, centrifuged (3000 × g, 30 min, 20 ºC) and the supernatants filtered over a 0.2 µm filter (Schleicher and Schuell, Dassel, Germany). The supernatant resulting from the heat treatment at 100 ºC was further concentrated with Microcon centrifugal concentrators YM-3000 (Millipore, Etten-Leur, The Netherlands). Finally, 0.2 g/l of sodium azide was added to the protein solutions. Part of the 100 ºC treated sample was also used at pH 7. Emulsion preparation Emulsions were made by mixing 1 ml tricaprylin oil and 9 ml of protein solution for 1 min at 11000 rpm with an Ultra Turrax type T-25B (Janke & Kunkel GmbH,
84

Emulsion properties of sunflower proteins
Germany). The coarse pre-emulsion was further homogenised by passing it 10 times at 6 MPa through a Delta Instruments HU 2.0 laboratory scale high-pressure homogeniser (Delta Instruments, Drachten, the Netherlands). The absence of flocs and/or aggregates was checked by light microscopy at a magnification of 400 ×. The droplet size was calculated as the volume-surface average diameter (d32) given by: d32 = S3/S2 = ∑Ni di
3/∑Ni di2, with Ni and di the number and
diameter of droplets in size class i, respectively (Walstra, 1968). The mentioned parameter was estimated using a Coulter Laser LS 230 (Beckman Coulter, Mijdrecht, The Netherlands) immediately after homogenising (t= 0 hour). When aggregation was detected the particle size distribution was measured after dilution (1:6 v/v) of the emulsion with 3 % (w/v) SDS. The instability of the emulsions against coalescence was estimated by measuring the decrease of the turbidity at 500 nm (Pearce and Kinsella, 1978). For this purpose, the emulsions were diluted (1:100 v/v) in a 0.1 % (w/v) SDS solution to stabilize the droplets and to disperse any aggregates present, as monitored by microscope. Creaming was monitored visually. To investigate the effect of calcium ions on emulsion properties at pH 7, 8 and 3, a 216 mM CaCl2 solution was added to emulsions prepared at pH 7, 8 and 3 (buffers above described; 4.0 mg/ml protein), resulting in a final Ca2+ concentration of 60 mM. Reference samples with the same ionic strength were prepared by adding NaCl. Furthermore, the creaming rate of helianthinin emulsions (10.0 mg/ml protein) at pH 8 after CaCl2 or NaCl addition was monitored using a TurbiScan MA 2000 (Sci-Tec Inc., Worthington, OH, USA). Various amounts of both salts were added resulting in ionic strengths of 60, 120, 180 and 300 mM. Emulsions were prepared and tested at least in duplicate. Surface excess The surface excess of emulsions was estimated using an indirect depletion method that is based on the estimation of the amount of unadsorbed protein and the interfacial area of the emulsion (Oortwijn and Walstra, 1979). The surface excess (Γ) of emulsions can be determined from the concentration (mg/m3) of the protein solution before emulsification, the concentration (mg/m3) of unadsorbed protein and, the specific area (m2/m3) of the emulsion (A). A can be calculated from A = 6 ϕ/ d32 (Walstra, 1983), in which ϕ is the volume fraction of oil in the emulsion. For helianthinin emulsions (pH 7, I = 50mM) the surface excess (Γ) was determined as a function of the protein concentration over the interfacial area of the emulsion (c/A), in which c is the protein concentration. For these experiments protein concentrations ranging from 0.21 to 6 mg/ml were used. For emulsions made at other conditions, Γ was determined at a single protein concentration. For determination of the concentration of unadsorbed protein, the emulsion droplets were separated from the aqueous phase by centrifugation at 12000 × g for 30 minutes, resulting in a cream layer and a serum layer. The serum layer was taken and again centrifuged. This procedure was repeated three times and the final
85

Chapter 5
serum was filtered over a 0.2 µm filter (Schleicher and Schuell, Dassel, Germany) and its protein content estimated. The cream layers were dispersed in the buffer solution, keeping the volume fraction of oil equal to that of the original emulsion. The washing buffer obtained after centrifuging (30 min, 12000 × g) the redispersed emulsion, was centrifuged at least two times more and then filtered over a 0.2 µm filter (Schleicher and Schuell, Dassel, Germany) and its protein content determined. This washing procedure was repeated once. The protein concentration was determined using the method of Bradford (Bradford, 1976) with bovine serum albumin as a standard. The surface excess was calculated as Γ = ∆c (mg/m3)/A (m2/m3), where ∆c is calculated as cemulsion – cserum – cwashing 1 – cwashing 2. Gel permeation chromatography Gel permeation chromatography was carried out in order to determine the relative amount of helianthinin and SFAs in SI and in the SFAs/helianthinin mixtures. Furthermore, the possible preferential adsorption of sunflower proteins to the oil/water interface in emulsions made with mixtures of SFAs and helianthinin was investigated by comparing the protein composition in the original protein solution to that in the serum. The serum was cleaned from residual oil before injection onto the gel permeation column using the procedure already described for determining the surface excess. Gel permeation chromatography was performed on an Äkta Explorer System (Amersham, Pharmacia Biotech, Uppsala, Sweden). Samples of 0.2 ml of the protein solutions, were applied directly to a Superdex 200 HR 10/30 column and eluted with the buffer solution used to prepare the emulsion, at a flow rate of 0.5 ml/min at room temperature. The absorbance of the eluate was monitored at 214 and 280 nm. Results Helianthinin and SFAs preparations Although, the helianthinin and SFAs preparations used to perform the experiments contained about 4 % impurities, the emulsion properties were not affected (pH 7; I = 20 mM) as compared to the pure preparations, which were obtained as described in Chapters 3 and 4 (results not shown). Therefore, we have used these preparations, to perform the emulsion experiments. Droplet size and surface excess of helianthinin emulsions The volume-surface average droplet size (d32) of emulsions made with helianthinin (pH 7, I = 20 mM) as a function of protein concentration is shown in Figure 1. At protein concentrations lower than 1.5 mg/ml, the average size of the oil droplets formed decreased sharply with increasing protein concentration. Above a concentration
86

Emulsion properties of sunflower proteins
of about 3.5 mg/ml, a surplus of protein was present and a more or less constant droplet size (≈ 1 µm) was obtained.
0123456789
10
0 1 2 3 4 5 concentration (mg/ml)
d32
( µm
)
6
Figure 1: Average droplet diameter (d32) of emulsions made with helianthinin (pH 7; I = 20 mM) as a function of protein concentration (mg/ml).
0
1
2
3
4
5
6
0 2 4 6 8
c/A (mg/m2)
Γ (m
g/m
2 )
Figure 2: Surface excess (Γ; mg/m2) of emulsions made with helianthinin (pH 7; I = 20 mM) as a function of protein concentration over specific surface area (c/A; mg/ m2). The maximum possible surface excess at any value of c/A is displayed as a dashed line.
87

Chapter 5
In Figure 2, the surface excess (or protein load) of emulsions droplets prepared with helianthinin (pH 7, I = 20) is shown. The surface excess is given as a function of protein concentration (c) over specific interfacial area (A) to allow comparison of the surface excess with emulsions made with other proteins and different interfacial areas. In Figure 2, the maximum possible surface excess at any value of c/A is displayed as a dashed line. At c/A values above 3.0 mg/m2 the droplet interface became saturated with protein and the experimental curve started to deviate more and more from the theoretical curve to finally reach a plateau surface excess was reached at about 3.6 mg/m2. Emulsion properties of helianthinin The emulsion properties of helianthinin were studied at pH 3, 7 and 8. Table 1 shows the results of these emulsion tests at various pH values. The average standard deviation of the average droplet size, σ(d32), was estimated as 0.05 µm based on the emulsions mentioned in Table 1. The accuracy of the Γ values was estimated as described by Oortwijn and Walstra (1979). This resulted, in the case of SFAs (pH 3, I = 20mM), with σ(d32) = 0.02 µm, in a σ(A) of 0.4 m2, in which σ (A) is the standard deviation of the surface area of 1 ml separated oil. The other parameters for this emulsion were estimated to be ∆c = 1.52 mg/ml; σ(c) = 0.065 mg/ml; A = 10.0 m2; ϕ = 0.1 and σ(ϕ) = 0.0005, where ∆c is the difference in protein concentration between the original protein solution and that in serum layer after centrifugation, A is the surface area of 1 ml separated oil, and ϕ is the volume fraction of oil in the emulsion. σ(ϕ) and σ(c) are the standard deviations of ϕ and ∆c, respectively. From these values the standard deviation of Γ was calculated as being 0.07 Γ. The average standard deviation of Γ was calculated to be 0.10 Γ. Based on these calculations, differences in surface excess of less than 10 % were considered not to be significant. Further details concerning the calculations can be found in the original publication. Microscopic studies indicated that part of the oil droplets had formed small aggregates at pH 7 (I = 20mM). Dilution (1:10) of these emulsions in 0.1 % SDS before microscopic inspection displayed only separate droplets. The average droplet sizes (d32) of emulsions made at pH 7, after dilution of the emulsion in SDS were larger than at pH 3 and pH 8 (I = 20mM; Table 1). All emulsions were stable against creaming for at least 12 h, although emulsions made at pH 8 and pH 3 were more stable against creaming than emulsions made at pH 7. Emulsions made with helianthinin did not show coalescence at any of the conditions investigated as indicated by the turbidity at 500 nm. Significant differences in Γ were found at the various pH values studied (I = 20 mM). The surface excess was relatively low at pH 7, while it was relatively high at pH 8 (Table 1), probably due to protein aggregation (Smulders, 2000).
88

Emulsion properties of sunflower proteins
Table 1: Characteristics of emulsions made with sunflower protein preparations at various conditions.
Sample pH I (mM)
∆T (°C)
C01
(mg/ml) d32
(µm) Γprotein
(mg/m2) Droplet2
Aggregation Coalescence
(24 h)3 Creaming4
7 20 4.3 1.05 3.5 * No S ≈ 12 h 7 100 3.8 1.04 3.4 *** No 1h < I 7 20 100 2.3 0.73 2.3 No No S ≈ 18 h 8 20 4.3 0.76 4.5 No No S ≈ 48 h 8 100 4.8 0.90 4.6 ** No I ≈1h 8 20 100 4.5 0.68 3.9 No No S > 48 h 8 20 65 4.9 0.79 4.2 No No S ≈ 24 h 3 20 4.8 0.91 3.9 No No S > 120 h 3 100 4.9 0.78 4.5 No No S > 48 h
3→7 20 2.5 0.83 2.4 No No S ≈ 18 h
Helianthinin5
3→8 20 5.0 0.67 3.7 No No S > 48 h Monomer5 8 20 3.9 0.65 3.3 No No S > 24 h
7 20 5.1 1.07 - ***** ***** IC 7 100 5.0 0.97 - ***** **** IC 8 20 4.0 1.20 - *** **** IC 8 100 4.0 0.94 - ** ** IC 5 20 3.9 0.92 1.21 *** No I < 15 min 5 100 3.7 0.89 1.32 *** No I < 15 min 3 20 4.8 0.60 1.52 No No S > 48 h
SFAs
3 100 4.6 0.57 1.39 No No S > 120 h 7 20 4.9 0.95 - *** * I < 1h 7 100 4.7 1.10 - **** * I < 1h 8 20 5.1 0.68 3.8 No No S ≈ 24 h 8 100 5.0 1.11 - *** * I < 1h 3 20 4.0 0.68 2.5 No No S > 48 h
SI
3 100 4.8 0.73 4.4 * No S > 24 h 10 7 20 4.2 0.87 - *** * I < 1h 25 7 20 4.1 0.98 - *** ** IC 50 7 20 3.9 0.97 - **** *** IC
SFA/Helian thinin
mixtures
(% SFAs)6 75 7 20 4.0 0.95 - **** **** IC Calcium addition to helianthinin emulsions
8 307 10 0.71 - **** No I ≈ 1h 8 607 10 0.71 - ***** No I ≈ 1h 8 1207 10 0.71 - ***** No I ≈ 1h 8 1807 10 0.71 - ***** No I ≈ 1h 8 3007 10 0.71 - ***** No I ≈ 1h 8 1207 4.0 0.76 - ***** No I < 1h 7 307 4.0 1.00 - ***** No I < 1h
Helianthinin5 +
Calcium
3 1207 4.8 0.91 - No No S 1C0 = protein concentration before emulsification; 2 more * indicate increasing size of aggregates, No: absence of aggregation; 3 more * indicate a higher extent of coalescence in 24 h, No: absence of coalescence; 4Visual observation of creaming: I, instable (within 1 hour); IC, creaming immediately (after emulsion formation); and S, stable (after 1 hour); 5helianthinin and monomer refer to the helianthinin preparation and the monomeric form of helianthinin, respectively, as described in materials and methods; 6proportion of SFAs in the protein mixture; 7 ionic strength due to CaCl2
89
Chapter 5
Droplet aggregation was observed at pH 8 upon increasing the ionic strength. At pH 7, droplet aggregation augmented when the ionic strength was increased from 20 mM to 100 mM (Table 1). Independent of the pH, increasing the ionic strength resulted in a lower stability of the emulsions against creaming. Aggregation was most pronounced at pH 7. Increasing the ionic strength resulted in an increase in droplet size at pH 8 and in a decrease in droplet size at pH 3. The ionic strength did not affect Γ at pH 7 and 8, but significantly increased it at pH 3 (Table 1). Heating of the helianthinin solutions at 65 ˚C (pH 8) and 100 ˚C (pH 7 and pH 8), resulted in emulsions that did not show droplet aggregation and were stable against coalescence. Heat treatment at 65 ˚C, however, resulted in emulsions that were less stable against creaming than those made from unheated helianthinin and helianthinin treated at 100 ˚C. The pH 3→ 8 and the pH 3→ 7 treatment resulted in emulsions with similar properties as the emulsions prepared after heating helianthinin at pH 8 (100 ˚C) and at pH 7 (100 ˚C). These emulsions were characterised by a smaller average droplet size, and the absence of droplet aggregation, compared to the untreated samples. Emulsions prepared with the monomeric form of helianthinin (pH 8, I = 20 mM) were similar to emulsions prepared with helianthinin heated at 100 ˚C. These emulsions did not show droplet aggregation and were stable against coalescence. Their average droplet size was also significantly smaller than for the native multimeric form of helianthinin (pH 8). Emulsions made with SFAs The emulsion properties of SFAs were studied at pH 3, 5, 7 and 8. The use of SFAs resulted in emulsions that were less stable against creaming than those made with helianthinin, except for emulsions made at pH 3 (Table 1). Emulsions at pH 5, 7 and 8 were destabilized by droplet aggregation resulting in instant creaming. Especially emulsions made at pH 7 and 8 were unstable against coalescence, as indicated by a drastic decrease in turbidity during the first hours. Interestingly, SFAs formed very stable emulsions at pH 3, especially at high ionic strength. The average droplet size of emulsions made with SFAs at pH 3 was the smallest of all the emulsions tested. Significantly smaller average droplet sizes were obtained at pH 8 after increasing the ionic strength. The surface excess of SFAs stabilised emulsions were significantly lower than for helianthinin stabilised emulsions. Emulsions made with SI The results of the emulsion experiments with SI at pH 3, 7 and 8 are also shown in Table 1. Emulsions made at pH 3 were the most stable against droplet aggregation and coalescence, and only minor aggregation occurred upon increasing ionic strength (100 mM). Although the average droplet size did not change significantly upon increasing ionic strength at pH 3, a significant increase in surface excess was observed. At pH 7 (I = 20 and 100 mM) and pH 8 (I = 100 mM), extensive droplet aggregation
90

Emulsion properties of sunflower proteins
and a small degree of coalescence resulted in a poor stability of SI emulsions against creaming. At low ionic strength (20 mM), the emulsions made at pH 8 were more stable against creaming and the average droplet size was much smaller than at high ionic strength. Furthermore, at pH 8 (I = 20 mM) no aggregation was observed. Emulsions made with mixtures of helianthinin and SFAs at pH 7 Clear correlations were found between emulsion properties and SFAs content in emulsions made with mixtures of helianthinin and SFAs at pH 7 (I = 20 mM; Table 1). Droplet aggregation and coalescence occurred in all the emulsions, but both processes were much more extensive for protein solutions containing high amounts of SFAs. Figure 3, which shows the particle size of deflocculated (using SDS) emulsion droplets made with various proportions of SFAs after 24 h, indicates that coalescence increases with SFAs content. Coalescence occurred in all the cases and was more pronounced for emulsions containing high amounts of SFAs. However, no significant differences in the initial average droplet size were observed for these emulsions (Table 1). Figure 4 displays, as a typical example, the gel permeation chromatogram of both the original protein solution before emulsification, as well as the serum obtained by centrifugation of the emulsion. From this figure it can be observed that the monomeric form of helianthinin was adsorbed readily at the surface of the emulsion droplets. This form of helianthinin was, however, present only in relatively small quantities compared to the oligomeric forms of helianthinin. SFAs are also adsorbed to a high extent as can be deduced from the decreasing area. The 7S and 11S forms of helianthinin were found to adsorb the least readily.
0123456789
0 1 2 3 4 5 6 7
particle diameter (µm)
volu
me
(%)
Figure 3: Average size of the (deflocculated) droplets in emulsions prepared with mixtures of helianthinin and SFAs at pH 7 (I = 20 mM) just after emulsification (10 % SFAs; thick line) and 24 h later for mixtures containing various amounts of SFA: 10 % (■), 25 % (▲), 50 % (●) and 75 % (♦).
91
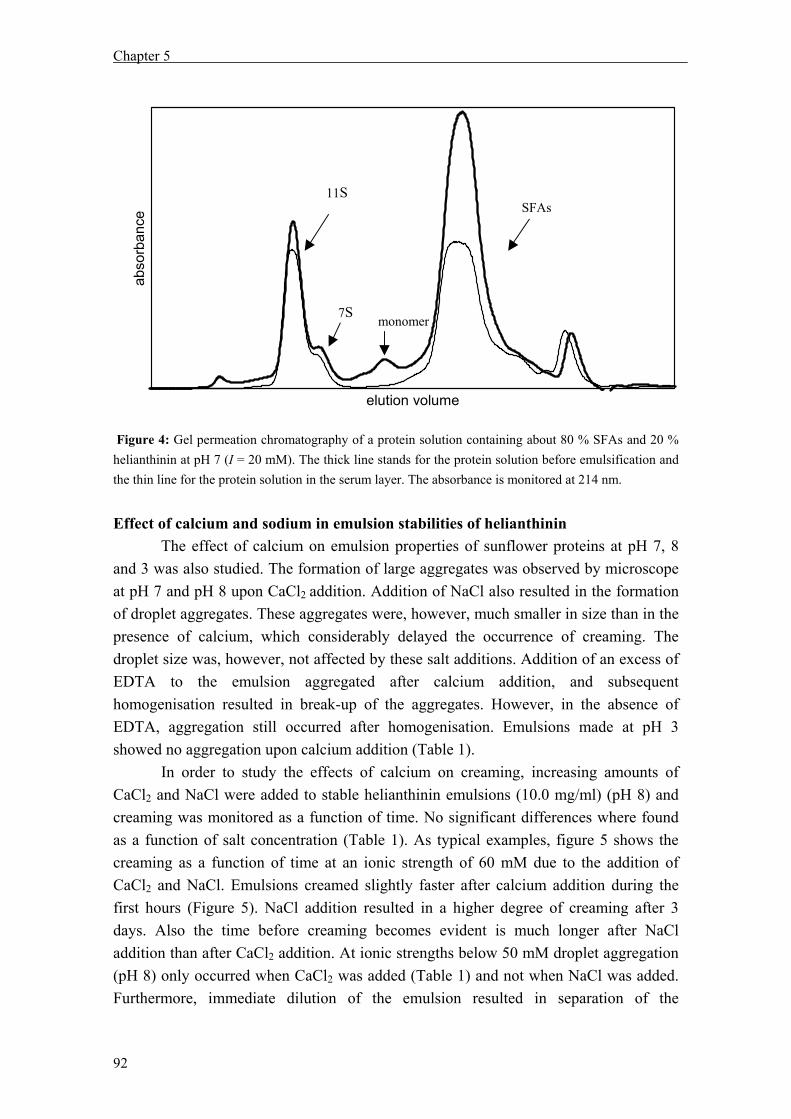
Chapter 5
elution volume
abso
rban
ce
SFAs
7S
11S
monomer
Figure 4: Gel permeation chromatography of a protein solution containing about 80 % SFAs and 20 % helianthinin at pH 7 (I = 20 mM). The thick line stands for the protein solution before emulsification and the thin line for the protein solution in the serum layer. The absorbance is monitored at 214 nm. Effect of calcium and sodium in emulsion stabilities of helianthinin The effect of calcium on emulsion properties of sunflower proteins at pH 7, 8 and 3 was also studied. The formation of large aggregates was observed by microscope at pH 7 and pH 8 upon CaCl2 addition. Addition of NaCl also resulted in the formation of droplet aggregates. These aggregates were, however, much smaller in size than in the presence of calcium, which considerably delayed the occurrence of creaming. The droplet size was, however, not affected by these salt additions. Addition of an excess of EDTA to the emulsion aggregated after calcium addition, and subsequent homogenisation resulted in break-up of the aggregates. However, in the absence of EDTA, aggregation still occurred after homogenisation. Emulsions made at pH 3 showed no aggregation upon calcium addition (Table 1). In order to study the effects of calcium on creaming, increasing amounts of CaCl2 and NaCl were added to stable helianthinin emulsions (10.0 mg/ml) (pH 8) and creaming was monitored as a function of time. No significant differences where found as a function of salt concentration (Table 1). As typical examples, figure 5 shows the creaming as a function of time at an ionic strength of 60 mM due to the addition of CaCl2 and NaCl. Emulsions creamed slightly faster after calcium addition during the first hours (Figure 5). NaCl addition resulted in a higher degree of creaming after 3 days. Also the time before creaming becomes evident is much longer after NaCl addition than after CaCl2 addition. At ionic strengths below 50 mM droplet aggregation (pH 8) only occurred when CaCl2 was added (Table 1) and not when NaCl was added. Furthermore, immediate dilution of the emulsion resulted in separation of the
92

Emulsion properties of sunflower proteins
aggregated droplets caused by NaCl addition, but not when calcium was the cause of droplet aggregation. It was also observed that decreasing the protein concentration of the original solution resulted in faster creaming of the emulsion upon salt (NaCl and CaCl2) addition (results not shown).
time (hours)
0 10 20 30 40 50 60 70 80
stab
ility
(%)
0
70
80
90
100
Figure 5: Creaming stability of helianthinin emulsions (pH 8, I = 20 mM) after addition of CaCl2 (▼; 20 mM final concentration) or NaCl (●; 60mM final concentration). Stability (%) = volume of emulsions without phase separation (i.e. 100 % when no phase separation has occurred; 75 % when 25 % is serum). Discussion Emulsion properties of SFAs Although, in addition to emulsions made with SFAs, also emulsions made with helianthinin showed droplet aggregation, extensive coalescence only occurred in SFAs stabilised emulsions. Coalescence is rarely the main destabilization process in protein-stabilised emulsions, but it is often induced by droplet aggregation and creaming. The high conformation stability of SFAs may facilitate coalescence since it probably only allows small conformational changes upon adsorption to the interface. Desorption from the interface is likely to occur when the conformational changes on adsorption are small (Tornberg et al., 1997), and, therefore, the formation of surface tension gradients may be impaired. Droplet aggregation and concomitant coalescence in emulsions made with SFAs could only be avoided at pH 3. The isoelectric range covered by SFAs is about pH
93

Chapter 5
6-10 (Raymond et al., 1995; Guéguen et al., 1996; Anisimova et al., 2002). It, therefore, appears that electrostatic repulsion at pH 3 is strong enough to prevent droplet aggregation. Furthermore, at pH 3 the repulsion of charged segments is maximised, which may significantly increase conformational flexibility and thus facilitate more extensive unfolding of SFAs upon adsorption. The surface excess of SFAs stabilised emulsions was significantly smaller than that of helianthinin stabilised emulsions. These results are in accordance with the finding that the surface excess of emulsion droplets is mainly determined by the conformational stability of proteins and the presence of aggregates (Smulders, 2000). Emulsion properties of helianthinin In helianthinin stabilised emulsions, lowering the pH from 8 to 7 and increasing the ionic strength from 20 to 100 mM reduced the electrostatic repulsion and favoured droplet aggregation (Table 1). The high surface excess at pH 8 is probably due to the formation of protein aggregates as also observed by gel permeation chromatography. Generally, the surface excess varies between 1.0 to 3.0 mg/m2 (Smulders, 2000), but when proteins aggregates are adsorbed, it can be greater than 5.0 mg/m2 (Hill, 1996). Despite protein aggregation, droplet aggregation did not occur at pH 8 (I = 20 mM). Effect of protein unfolding on the emulsion properties of helianthinin At pH 3, helianthinin dissociates into monomers and loses its tertiary and most of its secondary structure (Chapter 3). These structural changes have a positive effect on emulsion stability at pH 3. In addition, the increased emulsion stability is also observed in emulsions formed with helianthinin solutions that have been treated at pH 3 and then readjusted to pH 7 and pH 8, probably because changes in the structure of helianthinin due to low pH are irreversible (Chaper 3). Changes in conformation may also be the reason for the improvement of the emulsion stability by heating helianthinin solutions at 100 °C prior to emulsification. Improvement of emulsion properties of proteins by treatments that induce conformational changes and/or its flexibility has been previously reported (Nir et al., 1994; Hill, 1996; Wagner and Guéguen, 1999; Van Koningsveld, 2001). Effect of calcium on droplet aggregation The specific effect of calcium becomes apparent at relatively low concentrations (17 mM), which correspond to an ionic strength (50 mM) at which NaCl has not effect. Therefore, the formation of specific calcium cross-links between the carboxylic groups of proteins adsorbed at different oil droplets seems very likely. At pH 3, however, calcium bridges can not be formed due to protonation of the carboxylic groups.
94

Emulsion properties of sunflower proteins
Emulsion properties of protein mixtures Synergetic or antagonistic effects on emulsion properties have been reported when proteins differing in their intrinsic properties (molecular size, pI, conformational stability, etc) were mixed (Matringe et al., 1999; Aryana et al., 2002). The reconstitution experiments showed, however, an additive effect of helianthinin and SFAs, i.e., decreased stability when increasing proportions of SFAs were added to protein mixtures. The presence of only 10 % SFAs in the protein mixture already caused significant coalescence at pH 7. However, at pH 8 (I = 20 mM), where the soluble fraction of SI is estimated to contain about 10 % SFAs, a stable emulsion was obtained. The emulsion properties of SI stabilised emulsions at pH 7 were quite in agreement with those of the reconstituted protein mixtures. The percentage of SFAs in the soluble fraction of SI at pH 7 (I = 20 mM) was estimated to be approximately 20-30 %, which it is consistent with the properties observed for emulsions made with mixtures having this composition (Table 1). Summarizing, sunflower proteins were shown to form stable emulsions, with the exception of SFAs at alkaline and neutral pH values. Therefore, application of sunflower proteins in food emulsions would preferably be done at acidic pH. Treatments that increase conformational flexibility are shown to improve the emulsion properties, provided they do not lead to extensive protein aggregation and precipitation. Literature cited Anisimova I.N., Fido R.J., Tatham A.S. and Shewry P.R. Genotypic variation and polymorphism of 2S
albumins of sunflower. Euphytica 1995, 83, 15-23. Anisimova I.N., Konarev A.V., Gavrilova V.A., Rozhkova V.T., Fido R.F., Tatham A.S. and Shewry
P.R. Polymorphism and inheritance of methionine-rich 2S albumins in sunflower. Euphytica 2002, 129, 99-107.
Aryana K.J., Haque Z.Z. and Gerard P.D. Influence of whey protein concentrate on the functionality of egg white and bovine serum albumin. Int. J. Food Sci. Tech. 2002, 37, 643-652.
Bilani N., Hayashi K., Haraguchi K. and Kasumi T. Utilization of sunflower proteins in yogurt. J. Food Sci. Techn. 1989, 26, 205-209.
Bradford M.M. A rapid and sensitive method for the quantification of microgram quantities of protein utilizing the principle of protein-dye binding. Anal. Biochem. 1976, 72, 248-254.
Das K.P. and Kinsella J.E. Stability of food emulsions: physicochemical role of protein and nonprotein emulsifiers. Adv. Food Nutr. Res. 1990, 34, 81-201.
Fleming S.E. and Sosulski F. Gelation and thickening phenomena of vegetable protein products. J. Food Sci. 1975, 40, 805-807.
Gassmann B. Preparation and application of vegetable proteins, especially proteins from sunflower seed, for human consumption. An approach. Nahrung 1983, 27, 351-369.
95
Chapter 5
Guéguen J., Popineau Y., Anisimova I.N., Fido R.J., Shewry P.R. and Tatham A.S. Functionality of the 2S albumin seed storage proteins from sunflower (Helianthus annuus L.). J. Agric. Food Chem. 1996, 44, 1184-1189.
Hill S.E. Emulsions. In Methods of testing protein functionality; Hall G. M., eds; Blackie Academic & Professional: London, 1996; 153-185.
Huffman V.L., Lee C.K. and Burns E.E. Selected functional properties of sunflower meal (Helianthus annuus). J. Food Sci. 1975, 40, 70-74.
Kabirullah M. and Wills R.B.H. Foaming properties of sunflower seed protein. J. Food Sci. Techn. 1988, 25, 16-19.
Kinsella J.E. Milk proteins: Physicochemical and functional properties. CRC Crit. Rev. Food Sci. Nutr. 1984, 21, 197-262.
Kortt A.A. and Caldwell J.B. Low molecular weight albumins from sunflower seed: Identification of a methionine-rich albumin. Phytochemistry 1990, 29, 2805-2810.
Lasztity R., Goma M., Toemoeskoezi S. and Nagy J. 1992. Functional and nutritive properties of sunflower seed protein preparations. Applewhite T. H., ed. In proceedings of the world conference on oilseed technology and utilization. Budapest, Hungary, 430-432.
Mangino E.M. Protein Interactions in Emulsions: Protein-Lipid Interactions. In Protein functionality in food systems; Hettiarachchy N. S. and R. Z. G., eds; Marcel Dekker: New York, 1994; 147-179.
Matringe E., Phan Tan Luu R. and Lorient D. Functional properties of milk-egg mixtures. J. Food Sci. 1999, 64, 787-791.
Nir I., Feldman Y., Aserin A. and Garti N. Surface Properties and Emulsification Behavior of Denatured Soy Proteins. J. Food Sci. 1994, 59, 606-610.
Oortwijn H. and Walstra P. The membranes of recombined fat globules. 2. Composition. Netherlands Milk and Dairy Journal 1979, 33, 134-154.
Pawar V.D., Patil J.N., Sakhale B.K. and Agarkar B.S. Studies on selected functional properties of defatted sunflower meal and its high protein products. J. Food Sci. Techn. 2001, 38, 47-51.
Pearce R.J. and Kinsella J.E. Emulsifying properties of proteins: evaluation of a turbidimetric technique. J. Agric. Food Chem. 1978, 26, 716-723.
Plietz P., Damaschun G., Muller J.J. and Schwenke K.D. The structure of 11-S globulins from sunflower and rape seed. A small-angle X-ray scattering study. Eur. J. Biochem. 1983, 130, 315-20.
Raymond J., Rakariyatham N. and Azanza J.L. Functional properties of a new protein isolate from sunflower oil cake. Food Sci. Technol-Leb. 1985, 18, 256-263.
Raymond J., Robin Jean M. and Azanza Jean L. 11 S seed storage proteins from Helianthus species (Compositae): Biochemical, size and charge heterogeneity. Plant Syst. Evol. 1995, 198, 195-208.
Salunkhe D.K., Chavan J.K., Adsule R.N. and Kadam S.S. Sunflower. In World oilseeds: chemistry, technology and utilization; Van Nostrand Reinhold: New York, 1992; 97-139.
Sanchez A.C. and Burgos J. Thermal Gelation of Sunflower Proteins. In Food Macromolecules and Colloids; Dickinson E. and Lorient D., eds; Royal Society of Chemistry: Cambridge, United Kingdom, 1995; 426-430.
Sastry M.C.S. and Rao M.S.N. Binding of chlorogenic acid by the isolated polyphenol-free 11S protein of sunflower (Helianthus annuus) seed. J. Agric. Food Chem. 1990, 38, 2103-2110.
Schwenke K.D., Prahl L., Rauschal E., Gwiazda S., Dabrowski K. and Rutkowski A. Functional properties of plant proteins. II. Selected physico-chemical properties of native and denatured isolates from faba beans, soybeans, and sunflower seed. Nahrung 1981, 25, 59-69.
Smulders P.A.E. Formation and stability of emulsions made with proteins and peptides. Ph.D Thesis. Wageningen University, Wageningen (The Netherlands). 2000.
96

Emulsion properties of sunflower proteins
Sosulski F. and Fleming S.E. Chemical, functional, and nutritional properties of sunflower protein products. J. Am. Oil Chem. Soc. 1977, 54, 100A-104A.
Sripad G. and Rao M.S.N. Effect of methods to remove polyphenols from sunflower meal on the physicochemical properties of the proteins. J. Agric. Food Chem. 1987, 35, 962-967.
Tornberg E., Olsson A. and Perrson K. The structural and interfacial properties of food proteins in relation to their function in emulsions. In Food emulsions; Friberg S. E. and Larsson K., eds; Marcel Dekker: New York, 1997; 279-359.
Van Koningsveld G.A. Physico-chemical and functional properties of potato proteins. Ph.D Thesis. Wageningen University, Wageningen,The Netherlands. 2001.
Vermeesch G., Briffaud J. and Joyeux J. Sunflower proteins in human food. Re. Fr. Corps Gras 1987, 7-8, 333-344.
Wagner J.R. and Guéguen J. Surface functional properties of native, acid-treated and reduced soy glycinin. 2. Emulsifying properties. J. Agric. Food Chem. 1999, 47, 2181-2187.
Walstra P. Estimating globule-size distribution of oil-in-water emulsions by spectroturbidimetry. J. Colloid Interface Sci. 1968, 27, 493-500.
Walstra P. Formation of emulsions. In Encyclopedia of emulsion technology; Becher P., eds; Marcel Dekker: New York, 1983; 57-127.
Walstra P. and Smulders P.A.E. Making emulsions and foams: An overview. In Food colloids: Proteins, lipids and polysaccharides; Dickinson E. and Bergenståhl B., eds; The Royal Society of Chemistry: Cambridge, 1997; 367-381.
97


Chapter 6
Formation and stability of foams made with sunflower proteins*
Abstract Foam properties of a sunflower isolate (SI) as well as those of purified helianthinin and sunflower albumins (SFAs) were studied at various pH values and ionic strengths, and after heat treatment. These tests showed that less foam could be formed from helianthinin than from SFAs, but foam prepared with helianthinin was more stable against Ostwald ripening and drainage than foam prepared with SFAs. Foams made with SFAs suffered from extensive coalescence. The formation and stability of foams made from reconstituted mixtures of both proteins and from SI showed the deteriorating effect of SFAs on foam stability. Foam stability against Ostwald ripening increased after acid and heat treatment of helianthinin. Partial unfolding of sunflower proteins, probably resulting in increased structural flexibility, improved protein performance at the air/water interface. Furthermore, it was observed that the protein available is used inefficiently, and that typically only about 20 % of the protein present is incorporated in the foam. * This chapter will be submitted for publication
Chapter 6
Introduction The two main groups of sunflower proteins are 11S globulin, also known as helianthinin, and 2S albumins, also known as sunflower albumins (SFAs). The currently most accepted model of helianthinin at neutral pH consists of an arrangement of six spherical subunits into a trigonal antiprism (Plietz et al., 1983). The monomeric subunits consist of an acidic (32-44 kDa) and a basic (21-27 kDa) polypeptide linked by a single disulphide bond. The structure of helianthinin can be modulated by ionic strength and pH, and it can occur as a monomer, trimer, hexamer or in high aggregated forms (Chapter 3). Sunflower albumins are basic proteins with a molecular weight in the range 10-18 kDa (Kortt and Caldwell, 1990; Anisimova et al., 1995; Raymond et al., 1995). Foam formation and stability are considered important functional properties of food proteins and have a widespread applicability in many food products (Kinsella, 1976). During foaming proteins adsorb at the air/water interface thus lowering the interfacial tension (γ) and subsequently facilitating bubble break-up, which is opposed by the Laplace pressure (PLP = 4 γ/d; where d is the diameter). The most important role of the adsorbed proteins is, however, to prevent immediate recoalescence of the newly formed bubbles (Walstra and Smulders, 1997). Once at the interface, proteins may unfold to varying extents, reorient, rearrange, and spread. Several processes can destabilize foams and should, therefore, be monitored after foam formation. Because of the difference in density between air and water, gravitational (buoyancy) forces will tend to cause flow of the liquid out of the foam, which is called drainage. Coalescence is the merging of two bubbles into one bigger bubble due to the rupture of the liquid film (lamellae) between them. The presence of hydrophobic impurities as fat or other insoluble material large enough to touch both surfaces is a common cause of coalescence (Dickinson, 1992). Ostwald ripening, the growing of large bubbles at the expense of smaller ones, is probably the most important type of instability in foams. The driving force is the Laplace pressure difference over a curved bubble surface, which results in a higher solubility of air in the liquid around a small bubble than around a larger one, as described by Henry’s Law. Proteins may stabilize foams against Ostwald ripening if they remain adsorbed on the shrinking bubble. Then, γ will decrease due to an increase in surface excess (Γ, mg/m2). This decrease in γ will retard, or may theoretically even stop, Ostwald ripening (Lucassen, 1981). The foam properties of sunflower proteins have been previously studied (Huffman et al., 1975; Canella et al., 1977; Rossi and Germondari, 1982; Kabirullah and Wills, 1988; Booma and Prakash, 1990; Guéguen et al., 1996; Pawar et al., 2001); etc). However, limited information is provided about the relation between structure and foam properties of the purified fractions.
100

Foam properties of sunflower proteins
The aim of this study is to examine the foam formation and stability of the sunflower proteins by studying a sunflower isolate as well as purified helianthinin and SFAs as a function of pH, ionic strength and after heat treatment. These treatments will bring about changes in the structure and conformation of sunflower proteins, which may significantly alter their foam formation and stability. The results will provide knowledge about the relation between the conformation of sunflower proteins, their interactions and their functional properties, in a purified form as well as in mixtures. Materials and Methods Materials Dehulled “Mycogen Brand” sunflower seeds were purchased from H.Ch. Schobbers B.V. (Echt, The Netherlands). All chemicals were of analytical grade and obtained from Merck (Darmstadt, Germany). Sunflower protein isolate (SI) was obtained as described in Chapter 2. Helianthinin and sunflower albumins (SFAs) were obtained as described in Chapters 3 and 4, respectively, but with omission of the last gel permeation chromatography step. The resulting helianthinin preparation was mostly in the 11S and 7S form (90 %), next to about 6 % in its monomeric form and the presence of other protein impurities (4 %). The resulting SFAs preparation contained about 4 % other protein impurities. Preparations of the proteins solutions Protein dispersions (1.0-3.0 mg/ml) were prepared from bovine serum albumin (BSA), SI, SFAs and helianthinin by dispersing these proteins in 22 mM Tris-HCl buffer (pH 7.1; I = 20mM), 30 mM Tris-HCl buffer (pH 8; I = 20mM)(for SI, SFAs and helianthinin), 23 mM sodium phosphate buffer (pH 3; I = 20mM)(for SI, SFAs and helianthinin), and in 30 mM sodium acetate buffer (pH 5; I = 20mM) (for SFAs). When an ionic strength of 250 mM was used, 230 mM of sodium chloride was added to the buffers. At pH 3, for helianthinin and SI, only ionic strengths of 20 and 100 mM were used, because of the limited solubility of both protein preparations (Chapters 3 and 4). Part of the helianthinin dispersion at pH 3 was adjusted (after 10-15 minutes kept at the latter pH) to pH 7 by addition of NaOH (0.1-1 M) and will be referred to as the pH 3→ 7 sample. All protein dispersions prepared were stirred overnight at 16 ºC. The pH was checked and if necessary adjusted with NaOH or HCl (0.1-1 M). Next, the protein dispersions were centrifuged (3000 × g, 30 min, 20 ºC) and the supernatant was filtered over a 0.45 µm filter (Schleicher and Schuell, Dassel, Germany). Helianthinin samples used for testing the effect of heat treatment were prepared by dispersing the protein in buffers of pH 3, 7 and 8, as described above. Samples were heated in a waterbath for 30 min at 65 or 100 ºC and subsequently cooled in ice water,
101

Chapter 6
centrifuged (3000 × g, 30 min, 20 ºC), and the supernatant filtered over a 0.45 µm filter (Schleicher and Schuell, Dassel, Germany). The protein concentration of the solutions was estimated by absorbance measurement at 280 nm, using sunflower isolate as a reference. The final concentration was adjusted to 0.5 mg/ml using the corresponding buffer solution. Protein mixtures of SFAs and helianthinin were prepared by mixing solutions of these proteins to obtain protein solutions with a final concentration of 0.5 mg/ml containing 10, 25, 50,75 and 90 % SFAs. Foam preparation Foam forming and stabilising ability was tested using the whipping method described by Caessens and co-workers (Caessens et al., 1997). A volume of 100 ml of a 0.5 mg/ml protein solution was placed in a graduated glass cylinder and whipped for 70 seconds at 2500 rpm using a small impeller. Foam volume was monitored for 1 hour (at 2, 5, 10, 15, 30, 45, 60 minutes after whipping had started), and calculated as the difference between the higher foam boundary and the lower foam boundary, as measured in the graduated glass cylinder. Foam quality (bubble size, coalescence, drainage and Ostwald ripening) was evaluated visually. The average standard deviation of the volume of foam formed was estimated to be 3.5 ml. The effect of whipping speed on foam properties was tested using a whipping speed of 3500 rpm. All experiments were carried out at least in duplicate. Gel permeation chromatography Gel permeation chromatography was carried out in order to estimate the relative amount of helianthinin and SFAs in SI and in the protein mixtures. Furthermore, the competitive adsorption of sunflower proteins to the air/water interface with the SFAs/helianthinin mixtures was investigated by comparing the protein composition of the original protein solution to that of the (drained) liquid after foam formation. Gel permeation chromatography was performed on an Äkta Explorer System (Amersham, Pharmacia Biotech, Uppsala, Sweden). Protein solutions (0.2 ml), were applied directly to a Superdex 200 HR 10/30 column and eluted with the same buffer used to form the foam at a flow rate of 0.5 ml/min at room temperature. The absorbance of the eluate was monitored at 214 and 280 nm. Results Helianthinin and SFAs preparations Although the helianthinin and SFAs preparations used to perform the experiments contained about 4 % protein impurities, the foam properties were not affected (pH 7; I = 20 mM) as compared to the pure preparations, which were obtained
102

Foam properties of sunflower proteins
as described in Chapters 3 and 4 (results not shown). Therefore, we have used these preparations, to perform the foaming experiments. Foams made at pH 7 (I = 20 mM) Table 1 displays the characteristics of sunflower protein foams (made at 2500 rpm, 70s) at various conditions. BSA was used as a reference protein during the experiments. BSA formed foams that showed slow drainage, as about 15 % of the initial amount of liquid drained in 60 minutes (Table 1). At pH 7 foam volume was the highest for SFAs and SI and significantly less foam was formed with BSA and helianthinin (Table 1). The volume decrease in time of foams made with helianthinin and BSA was, however, very low (about 10 %), whereas, a much faster decrease in volume was observed in foams made with SFAs (36 %) and SI (20 %). Destabilization in foams made with SFAs at pH 7 was mainly due to coalescence. Coalescence was not observed in foams stabilized with helianthinin and SI. Typical examples of foam volumes and the upper and lower foam boundaries as a function of time are displayed in Figure 1. The amount of liquid drained from the foam is related to the change in the lower foam boundary, whereas the upper foam boundary indicates the foam volume decrease caused by other instabilities. A pronounced foam volume decrease, mainly due to drainage, is observed in foams made from SFAs and SI at pH 7 (Figure 1). Drainage of foams made at pH 7 increased in the order BSA < helianthinin < SI< SFAs (Table 1). For foams made with SFAs fast coalescence and continuous bursting of bubbles was observed. As a result, the final diameter of many bubbles was visibly larger than 500 µm. Therefore, the volume decrease of foams made from SFAs (Table 1) should be interpreted carefully, as the bursting of few bubbles after several minutes (5-10) later than the storage time shown in Table 1 resulted in almost complete collapse of the foam. Foams made with helianthinin at various conditions The influence of pH on formation and stability of foams formed with helianthinin was studied at pH 3 and 8, in addition to pH 7. At pH 3, foam formation for helianthinin was the highest. Significantly less foam was formed at pH 8 and even less at pH 7 (Table 1). Foams made from helianthinin at pH 3, despite their higher stability against Oswald ripening, drained faster than those made at pH 7 and 8. When helianthinin was dispersed at pH 3 and subsequently adjusted to pH 7 (pH 3 → 7 sample) it formed two times as much foam as at pH 7. The pH 3 → 7 foam was clearly more stable against Ostwald ripening, but drained faster. The effect of ionic strength (I) on the formation and stability of foams made from helianthinin is also displayed in Table 1. Increasing the ionic strength generally resulted in higher foam volumes, independent of the pH. In addition, a higher I seems to be associated with faster drainage, slower Ostwald ripening and a faster decrease in
103

Chapter 6
foam volume (Table 1). This faster decrease in foam volume for helianthinin foams is markedly higher at pH 8 and 7 (14 %) than at pH 3 (3 %). Table 1: Characteristics of foams made with sunflower protein preparations at various conditions (2500 rpm, 70s)
Foam Volume
(ml)
Sample
pH
I
(mM) Vmax (2 min)
Vmin (60 min)
Drainage1
(%)
ϕ2
(air)
Coalescence3
Ostwald4
Ripenining
BSA 7 20 35 31 15 0.67 − **** 8 20 44 31 25 0.68 − **** 8 250 65 47 41 0.66 − * 7 20 32 28 21 0.70 − **** 7 250 53 39 32 0.68 − * 3 20 55 43 39 0.63 − * 3 100 58 43 41 0.66 − *
3→7 20 60 49 41 0.63 − * 8100°C
5 20 74 61 40 0.68 − * 865°C
5 20 53 43 32 0.64 − ** 3100°C
5 20 59 48 39 0.68 − *
Helianthinin
365°C5 20 55 41 40 0.62 − *
8 20 61 40 66 0.64 + *** 8 250 66 40 66 0.66 + *** 7 20 59 38 60 0.66 + **** 7 250 66 42 68 0.66 + **** 5 20 67 32 79 0.67 + *** 5 250 64 0 100 0.67 + **** 3 20 65 43 73 0.69 + ***
SFAs
3 250 68 38 71 0.67 + *** 8 20 60 47 44 0.77 − **** 8 250 64 47 50 0.64 − *** 7 20 59 47 39 0.69 − **** 7 250 56 38 50 0.68 − *** 3 20 54 39 49 0.70 − **
SI
3 100 56 44 41 0.66 − ** 10 7 20 47 40 18 0.70 − **** 25 7 20 50 42 28 0.67 − **** 50 7 20 62 46 48 0.65 − **** 75 7 20 60 41 61 0.64 − ****
SFA/Helia
nthinin mixtures
(% SFAs)6 90 7 20 69 44 61 0.67 + **** 1 % drained of liquid initially present in foam; 2 ϕ = volume fraction of air initially present in foam; 3 + coalescence observed and – coalescence not observed; 4 more asterisks indicate faster Ostwald ripening; 5 subscripts indicate the temperature of the heat treatment; 6 proportion of SFAs in the protein mixtures Heat treatment improved foam formation and resulted in foams with a higher stability against Ostwald ripening. Foam volume for helianthinin (pH 8) increased by 20 and 70 % when heated at 65 °C and at 100 °C, respectively (Table 1). Foams from heated helianthinin contained smaller bubbles but drained faster than foams made with non-heated helianthinin. Similar improvements were obtained after heating at pH 7 (results not shown). Heating at pH 3 had little or no effect on both foam volume and foam stability (Table 1).
104

Foam properties of sunflower proteins
0
2 0
4 0
6 0
8 0
1 0 0
1 2 0
1 4 0
1 6 0
0 2 0 4 0 6 0 8t im e ( m in )
volu
me
(ml)
0
Figure 1: Foam volume (solid line) and upper and lower foam boundaries (dashed line) of foam formed at 2500 rpm (70s) as a function of time, at pH 7 (I = 20 mM) with 0.5 mg/ml solutions of BSA (♦), helianthinin (■), SFAs (•) and SI (▲).
Foams made with SFAs at various conditions
Foam formation and stability of foams made with SFAs were studied at pH 3, 5, 7 and 8. Changing the pH had only a minor effect on foams made from SFAs. All foams showed coalescence and Ostwald ripening, although the latter was almost obscured by the extremely fast coalescence observed at all tested pH values. Foam volume was somewhat smaller at neutral and basic pH values, but foams made at these conditions showed slower drainage than those made at acidic pH. Fast drainage was observed at all conditions and was the fastest at pH 5, with a loss of approximately 80 % of initial amount of liquid in 60 minutes (Table 1). SFAs solutions resulted, therefore, in coarse and dry foams upon whipping, which in most cases collapsed after 90 minutes of storage. Increasing the ionic strength from 20 to 250 mM generally augmented foam volume. Foam volume, however, decreased faster at high ionic strength at pH 5 and 7. At pH 5, salt addition even resulted in complete collapse of the foam after about 10 minutes.
Foams made with SI at various conditions Foam formation and stability of foams made with SI was studied at pH 3, 7 and 8. Changing the pH had much less effect on SI stabilised foams than on foams made with helianthinin. Maximum foam stability against drainage was obtained at pH 7 and 8. The latter foams were, however, less stable against Ostwald ripening than foams made at pH 3. Increasing the ionic strength resulted in foams with a higher stability against Ostwald ripening but faster drainage, except at pH 3 (Table 1). No coalescence was observed in SI stabilized foams.
105

Chapter 6
Foams made with mixtures of helianthinin and SFAs Clear trends were found in foams made with protein mixtures of helianthinin and SFAs (10, 25, 50, 75, and 90 % SFAs content) at pH 7 (I = 20 mM)(Table 1). Foam volume increased with increasing SFAs content, but the foam volume reduction after 60 minutes and drainage were also more pronounced in foams with a higher SFAs content (Table 1, Figure 2).
time (min)
0 10 20 30 40 50 60 70
foam
vol
ume
(ml)
0
40
50
60
70
Figure 2: Foam volume as a function of time at pH 7 (I = 20 mM) using a whipping speed of 2500 rpm. Protein solutions were prepared with various helianthinin/SFAs mixtures with a final concentration of 0.5 mg/ml, containing 10 ( ), 25 ( ), 50 ( ), 75 (▼) and 90 % (■) SAFs.
Effects of whipping speed on foam formation and stability The results presented above were obtained at a whipping speed of about 2500 rpm. Foam formation and stability were also studied at a whipping speed of 3500 rpm (Table 2). Figure 3 displays foam volume as a function of time for SFAs, helianthinin and heat-treated helianthinin (100 ºC) after whipping at 2500 and 3500 rpm. Increased whipping speed resulted in coagulation of BSA, as could be inferred from the turbidity of the solution upon whipping. At low ionic strength, foam volume of foams made with helianthinin decreased with increasing speed at pH 7 and 8 (Tables 1 and 2, Figure 3). These foams were visibly weaker and more instable against Ostwald ripening than at lower speed. Although at high ionic strength, at pH 7 and 8, increasing whipping speed also resulted in a decrease in foam volume, these foams were rather stable against
106

Foam properties of sunflower proteins
Ostwald ripening and drainage. The latter may be due to the high volume fraction of air (90 %) contained in these foams at 3500 rpm (Table 2). In contrast, foam volume of foams made with helianthinin at pH 3 increased, upon increasing the whipping speed, by 40 % and 150 % at ionic strengths of 20 and 100 mM, respectively (Tables 1 and 2). The effect of heating the helianthinin solutions prior foam formation is also more evident at a higher whipping speed. The foam volume formed increased approximately by 135 and 225 % for the helianthinin samples (pH 8) heated at 65 °C and 100 °C, respectively, as compared to foams formed at 2500 rpm (Tables 1 and 2, Figure 3). Helianthinin heated at pH 3 gave foam volume increases of 80 % (65 °C) and 240 % (100 °C) compared to foams formed at 2500 rpm (Tables 1 and 2). Without heat treatments, the largest changes in foam volume with increasing whipping speed were observed with SFAs, with an average increase of about 230 % in foam volume (Tables 1 and 2, Figure 3). This foam augment, however, resulted in even faster coalescence. Table 2: Characteristics of foams made with sunflower protein preparations at various conditions (3500 rpm, 70s)
Foam
Volume
(ml)
Sample
pH
I
(mM)
(2 min)
ϕ1
(air)
Coalescence2
Ostwald3
Ripenining
8 20 30 0.77 − ***** 8 250 50 0.86 − low 7 20 22 0.80 − ***** 7 250 45 0.90 − low 3 20 77 0.70 − ** 3 100 145 0.78 − **
8100°C4 20 240 0.66 − *
865°C4 20 125 0.70 − **
3100°C4 20 201 0.70 − **
Helianthinin
365°C4 20 98 0.67 − **
8 20 220 0.67 + **** 8 250 225 0.70 + **** 7 20 213 0.69 + **** 7 250 217 0.68 + **** 5 20 210 0.67 + **** 5 250 220 0.65 + **** 3 20 215 0.68 + ****
SFAs
3 250 210 0.70 + **** 10 7 20 33 0.82 − **** 25 7 20 62 0.73 − **** 50 7 20 117 0.73 − **** 75 7 20 165 0.71 − ****
SFA/Helianthinin mixtures
(% SFAs)5
90 7 20 195 0.70 + **** 1 φ = volume fraction of air initially present in foam; 2 + coalescence observed and – coalescence not observed; 3 more asterisks indicate faster Ostwald ripening, “low” indicates that the destabilization is barely noticeable; 4 subscripts indicate the temperature of the heat treatment; 5 proportion of SFAs in the protein mixtures.
107

Chapter 6
Generally, the increase in foam volume involved the formation of much smaller bubbles for all protein solutions, but also resulted in faster drainage. Foam volume decreased with increasing whipping speed for 10 % SFAs mixtures, but increased by 25, 90, 160 and 190 % for protein mixtures containing 25, 50, 75 and 90 % SFAs, respectively (Tables 1 and 2). Figure 4 displays the gel permeation chromatogram of a protein solution containing approximately 25 % SFAs and 75 % helianthinin at pH 7 before (original solution) and after (drained liquid) foam formation at 2500 rpm and 3500 rpm. At higher whipping speeds, the volume of foam formed increased about 25 % for the latter protein mixture (Tables 1 and 2). This increase in foam volume resulted in a higher amount of protein incorporated in the foam (30 %; Figure 4). It can be observed that all proteins were capable of adsorbing at the interface, as all peak areas are smaller after foam formation. The helianthinin monomer, however, seemed to be more readily adsorbed than the other proteins, as it appears to be absent from the drained liquid (Figure 4). At the lower whipping speed, the helianthinin monomer adsorbed most readily at the interface (100 %), followed by SFAs (30 %) and finally the 7S and 11S forms of helianthinin (7 %). The 7S form of helianthinin, however, seemed to adsorb in higher quantities (60 %) than the 11S form (12 %) at high whipping speed (Figure 4). It can also be observed that most of the protein remained in solution and only a minor part (about 20 % at 2500 rpm) is incorporated in the foam.
0
50
100
150
200
250
0 20 40 60time (min)
foam
vol
ume
(ml)
Figure 3: Foam volume as a function of time at pH 8 (I = 20 mM) using two whipping speeds: 2500 rpm is displayed as a solid line and 3500 rpm is displayed as a dashed line. Protein solutions were prepared with SFAs ( ), helianthinin (×) and helianthinin after heat treatment at 100 °C (■ ).
108

Foam properties of sunflower proteins
elution volume
abso
rban
ce
11S
7S
monomerSFAs
Figure 4: Gel permeation chromatography of a protein solution containing about 25 % SFAs and 75 %
helianthinin at pH 7 (I = 20 mM), before foam formation (thick line), after foam formation at 2500 rpm
(thin line) and after foam formation at 3500 rpm (grey line). The absorbance is monitored at 214 nm.
Discussion Foam properties of SFAs In SFAs stabilised foams, destabilization is primarily the result of coalescence. Coalescence also brings about drainage of liquid from the foam (Halling, 1981). SFAs were, however, able to form high foam volumes. Foam formation requires from a protein the ability to quickly adsorb and lower the surface tension in order to facilitate bubble break-up, and the ability to form γ-gradients to stabilise newly formed bubbles against immediate coalescence. Hence, one of the most important factors for foam formation is the adsorption rate (Martin et al., 2002). However, the adsorption of proteins to the interface is not necessarily irreversible, and the loss of net energy upon adsorption for many proteins is not sufficient to maintain the protein adsorbed (German and Phillips, 1991). SFAs seem to adsorb fast, possibly due to their small size, but presumably unfold only slightly at the interface as can be expected from their high conformational stability and compact structure (Chapter 4). The fast adsorption to the interface seems to be confirmed by the increased foam volume at higher whipping speed, since at higher whipping speed the time available to adsorb is diminished. The coalescence observed in foams made with SFAs could have possibly been induced by the presence of impurities. However, since SFAs were obtained by gel permeation chromatography, and the protein solutions were filtered before use, this cause is highly improbable. So far, we do not have a plausible explanation for the coalescence observed
109

Chapter 6
in SFAs stabilized foams. These results are, however, in agreement with those reported by Guéguen and co-workers (1996) and Popineau and co-workers (1998) who also observed rapid degradation and little stability in foams made with SFAs. Foam properties of helianthinin Helianthinin produced low foam volumes at alkaline and neutral pH. This is probably due to its large size and closely packed globular conformation, which would cause it to adsorb slowly at the interface compared to the time scales involved in foam formation. The decrease of foam volume at higher whipping speeds confirms this assumption. Once helianthinin is adsorbed it will, due to its relatively large size, presumably not desorb easily. Protein stabilized foams are often most stable against Ostwald ripening at their isoelectric pH (Halling, 1981; Kinsella, 1981; German and Phillips, 1991). Since the isoelectric point of helianthinin is about 4-5.5 (Chapter 3), it is observed that the further the pH from the isoelectric point of helianthinin, the lower is the stability of helianthinin foams against Ostwald ripening. However, possible structural changes due to exposure to low pH values must also be taken into account. Effects of heat and acid denaturation Helianthinin dissociates at pH 3 into its monomeric form, which decreases its molecular size and results in a more flexible, unfolded protein (Chapter 3). Proteins typically form and stabilize foams best under conditions at which the molecules are flexible and less compact (Kinsella, 1981; German and Phillips, 1991; Kinsella, 1993). Dissociation probably also leads to increased surface hydrophobicity that favours protein adsorption (Wagner and Guéguen, 1995). Hence, the helianthinin subunits formed at pH 3 may efficiently adsorb much faster than their multimeric counterparts. Moreover, the unfolded helianthinin is likely to form strong inter-molecular interactions at the interface thus preventing desorption, and hence, also stabilises the foam against Ostwald ripening. These results are in line with the findings of Wagner and Guéguen (1995 and 1999) and Martin (2003) for soy glycinin. The molecular structure of the acid unfolded helianthinin at pH 7 resembles that at pH 3 (Chapter 3), thereby, it explains the similar properties of foams formed at the referred conditions. Similar degrees of unfolding and dissociation of helianthinin are produced by heat and low pH (Chapter 3). Both treatments resulted in foams with a high stability against Ostwald ripening. The relatively small increase in foam volume and stability against Ostwald ripening after the mild heat treatment (65 °C), as compared to heat treatment at higher temperature (100 °C), is probably due to the lower extent of unfolding and protein dissociation at this lower temperature (Chapter 3). Conformational changes and molecular size have been reported to be important for soy glycinin and whey proteins (Zhu and Damodaran, 1994; Wagner and Guéguen, 1999; Martin, 2003) regarding foam formation and stability.
110

Foam properties of sunflower proteins
Effects of the ionic strength Ionic strength significantly affected the foam properties of helianthinin (Table 1). Helianthinin is negatively charged at pH 7 and 8. Addition of salt at these pH values will thus reduce charge repulsion, possibly allowing the protein to adsorb more easily, resulting in a faster lowering of the surface tension, i.e. higher foam volume, and also a higher stability against Ostwald ripening (Table 1;Yu and Damodaran, 1991; van Koningsveld et al., 2002). Similar results were found in foams made with BSA with increasing ionic strength (results not shown; Germick et al., 1994). Increasing the ionic strength generally resulted in an increase in foam volume and in drainage rate (Table 1), which has also been observed by other authors (Germick et al., 1994; van Koningsveld et al., 2002). Higher drainage rates are generally correlated to a higher amount of liquid in the foam. Mixtures of SFAs and helianthinin The mixing experiments revealed the absence of synergetic or antagonistic effects on foam properties contrasting previous studies on mixtures of proteins differing in their intrinsic properties (molecular size, pI, conformational stability, etc.) (German and Phillips, 1991; Matringe et al., 1999; Aryana et al., 2002; Sorgentini and Wagner, 2002). The reconstitution experiments rather showed an additive effect of helianthinin and SFAS, i.e. higher volumes of foam with decreased stability when increasing the proportion of SFAs in the protein mixtures. The properties of SI stabilised foams at pH 7 were quite in agreement with those of the reconstituted protein mixtures. The percentage of SFAs in the soluble fraction of SI at pH 7 (I = 20 mM) was estimated to be approximately 25-30 %, which is consistent with the properties observed for foams made with mixtures having similar composition (Table 1). Coalescence was only observed in mixtures containing as much as 90 % SFAs. Coalescence, therefore, was effectively prevented provided that a small amount of helianthinin was present in the mixture. Sunflower proteins clearly differ in their ability to stabilize foams. The ability to stabilise foams that has been reported for sunflower products (Huffman et al., 1975; Canella, 1978; Rossi and Germondari, 1982; Raymond et al., 1985; Pawar et al., 2001) must be mainly due to the presence of helianthinin and not SFAs, as it is evident from our studies using protein mixtures. However, Booma and Prakash (1990) reported that the foam properties of sunflower meal were better than those of helianthinin. In contrast, Canella and co-workers (1985) reported higher foam expansion (pH 2-10) and stability (pH 2-6) for foams made with SFAs than for foams made with sunflower meal. This difference, however, may reflect the contribution of other constituents (fibers, carbohydrates, etc.), differences in the integrity and composition of the protein used and the method used to make the foam. Furthermore, the latter authors tested foam properties with the total protein, i.e. the soluble as well as the insoluble fractions.
111

Chapter 6
Although insoluble protein is accounted in the total concentration its contribution to protein functionality is usually very low. It can be concluded that the higher molecular flexibility and smaller molecular size of helianthinin, caused by heat treatment or low pH, resulted in improved foam properties. In addition, it was found that when sunflower proteins are used as foaming agent the protein is not efficiently used and only a minor part of the available proteins is adsorbed to the interface. Literature cited Anisimova I.N., Fido R.J., Tatham A.S. and Shewry P.R. Genotypic variation and polymorphism of 2S
albumins of sunflower. Euphytica 1995, 83, 15-23. Aryana K.J., Haque Z.Z. and Gerard P.D. Influence of whey protein concentrate on the functionality of
egg white and bovine serum albumin. Int. J. Food Sci. Tech. 2002, 37, 643-652. Booma K. and Prakash V. Functional properties of the flour and the major protein fraction from sesame
seed, sunflower seed and safflower seed. Acta Alimentaria 1990, 19(2), 163-176. Caessens P.W.J.R., Gruppen H., Visser S., Van Aken G.A. and Voragen A.G.J. Plasmin hydrolysis of β−
casein: foaming and emulsifying properties of the fractionated hydrolysate. J. Agric. Food Chem. 1997, 45, 2935-2941.
Canella M. Whipping properties of sunflower protein dispersions. Food Sci. Technol-Leb. 1978, 11, 259-263.
Canella M., Castriotta G., Bernardi A. and Boni R. Functional properties of individual sunflower albumin and globulin. Lebensm.-Wiss. Technol.-Food Sci. Technol. 1985, 18, 288-292.
Canella M., Castriotta G. and Sodini G. Functional properties of sunflower products after extraction of phenolic pigments by acid butanol. Riv. Ital. Sostanze Grasse 1977, 54, 73-76.
Dickinson E. Foams. In An introduction to food colloids; Dickinson E., eds; Oxford Univerity Press: Oxford, 1992; 123-139.
German J.B. and Phillips L. Protein interactions in foams. In Protein functionality in food systems; Hettiarachy N. S. and Ziegler G. R., eds; IFT Basic Symposium Series: Chicago, 1991; 181-208.
Germick R.J., Rehill A.S. and Narsimhan G. Experimental investigation of static drainage of protein stabilized foams-comparison with model. J. Food Eng. 1994, 23, 555-578.
Guéguen J., Popineau Y., Anisimova I.N., Fido R.J., Shewry P.R. and Tatham A.S. Functionality of the 2S albumin seed storage proteins from sunflower (Helianthus annuus L.). J. Agric. Food Chem. 1996, 44, 1184-1189.
Halling P.J. Protein-stabilized foams and emulsions. CRC Crit. Rev. Food Sci. Nutr. 1981, 15, 155-203. Huffman V.L., Lee C.K. and Burns E.E. Selected functional properties of sunflower meal (Helianthus
annuus). J. Food Sci. 1975, 40, 70-74. Kabirullah M. and Wills R.B.H. Foaming properties of sunflower seed protein. J. Food Sci. Techn. 1988,
25, 16-19. Kinsella J.E. Functional properties in foods: A survey. CRC Crit. Rev. Food Sci. Nutr. 1976, 7, 219-280. Kinsella J.E. Functional properties of proteins: Possible relationships between structure and function in
foams. Food Chem. 1981, 7, 273-288.
112

Foam properties of sunflower proteins
Kinsella J.E. 1993. Factors affecting protein films and foams: beta lactoglobulin. Protein and fat globule modifications by heat treatment, homogenization and other technological means for high quality dairy products. Munich (Germany): International Dairy Federation special issue no 9303, 67-72.
Kortt A.A. and Caldwell J.B. Low molecular weight albumins from sunflower seed: Identification of a methionine-rich albumin. Phytochemistry 1990, 29, 2805-2810.
Lucassen J. In Anionic surfactants; Lucassen-Reijnders E. H., eds; Marcel Dekker: New York, 1981; 217. Martin A.H. Mechanical and conformational aspects of protein layers on water. Ph.D Thesis. Wageningen
University, Wageningen, The Netherlands. 2003. Martin A.H., Grolle K., Bos M.A., Cohen Stuart M.A. and van Vliet T. Network forming properties of
various proteins adsorbed at the air/water interface in relation to foam stability. J. Colloid Interface Sci. 2002, 254, 175-183.
Matringe E., Phan Tan Luu R. and Lorient D. Functional properties of milk-egg mixtures. J. Food Sci. 1999, 64, 787-791.
Pawar V.D., Patil J.N., Sakhale B.K. and Agarkar B.S. Studies on selected functional properties of defatted sunflower meal and its high protein products. J. Food Sci. Techn. 2001, 38, 47-51.
Plietz P., Damaschun G., Muller J.J. and Schwenke K.D. The structure of 11-S globulins from sunflower and rape seed. A small-angle X-ray scattering study. Eur. J. Biochem. 1983, 130, 315-20.
Popineau Y., Tatham A.S., Shewry P.R., Marion D. and Guéguen J. 2S sunflower albumins : functional properties of native and modified proteins. In Plant Proteins from European Crops. Food and non-food applications; Guéguen J. and Popineau Y., eds; INRA Editions: Nantes (France), 1998; 131-135.
Raymond J., Rakariyatham N. and Azanza J.L. Functional properties of a new protein isolate from sunflower oil cake. Food Sci. Technol-Leb. 1985, 18, 256-263.
Raymond J., Robin Jean M. and Azanza Jean L. 11 S seed storage proteins from Helianthus species (Compositae): Biochemical, size and charge heterogeneity. Plant Syst. Evol. 1995, 198, 195-208.
Rossi M. and Germondari I. Production of a food-grade protein meal from defatted sunflower. II. Functional properties evaluation. Lebensm.-Wiss. Technol.-Food Sci. Technol. 1982, 15, 313-316.
Sorgentini D.A. and Wagner J.R. Comparative study of foaming properties of whey and isolate soybean proteins. Food Res. Int. 2002, 35, 721-729.
van Koningsveld G.A., Walstra P., Gruppen H., Wijngaards G., van Boekel M.A. and Voragen A.G. Formation and stability of foam made with various potato protein preparations. J. Agric. Food Chem. 2002, 50(26), 7651-9.
Wagner J.R. and Guéguen J. Effects of dissociation, deamidation, and reducing treatment on structural and surface active properties of soy glycinin. J. Agric. Food Chem. 1995, 43 (8), 1993-2000.
Wagner J.R. and Guéguen J. Surface functional properties of native, acid-treated and reduced soy glycinin. 1. Foaming properties. J. Agric. Food Chem. 1999, 47, 2173-2180.
Walstra P. and Smulders P.A.E. Making emulsions and foams: An overview. In Food colloids: Proteins, lipids and polysaccharides; Dickinson E. and Bergenståhl B., eds; The Royal Society of Chemistry: Cambridge, 1997; 367-381.
Yu M.-A. and Damodaran S. Kinetics of destabilization of soy protein foams. J. Agric. Food Chem. 1991, 39, 1563-1567.
Zhu H. and Damodaran S. Heat-induced conformational changes in whey protein isolate and its relation to foaming properties. J. Agric. Food Chem. 1994, 42, 846-855.
113


Chapter 7
General Discussion

Chapter 7
Several studies have been previously performed on sunflower protein functionality (Table 3, Chapter 1). However, much is still unknown about the relationships between molecular structure and functional properties of sunflower proteins. To effectively use proteins in a wide range of emulsified or/and foamed food products, a fundamental understanding of the mechanisms underlying their functionality is required. To unravel these structure-function relationships, the proteins must first be isolated in such a way that denaturation is prevented (Chapter 2). Protein recovery from sunflower The numerous publications on sunflower protein recovery (Smith and Johnsen, 1948; O'Connor, 1971; Hagenmaier, 1974; Nuzzolo et al., 1980; Lawhon et al., 1982; Normandin et al., 1984; Regitano d'Arce et al., 1994; etc.) clearly indicate the difficulties encountered during recovery of a high quality protein from sunflower. The main reasons for these difficulties is protein denaturation during oil production and the presence of high amounts of phenolic compounds. Phenolic compounds and protein extraction
In sunflower the most important phenolic compounds are CGA (an ester of caffeic acid and quinic acid) and to a lesser extent caffeic acid (CA). As mentioned in Chapter 1, the interactions between phenolic compounds and proteins may be reversible or irreversible (i.e. non-covalent or covalent, respectively). Protein-phenolic compounds interactions
Decreased protein solubility due to covalent interactions between phenolic compounds and proteins has been reported (Kroll et al., 2000; Rawel et al., 2002b). For instance, covalent interaction with CGA reduced the solubility of soy glycinin (Kroll et al., 2001; Rawel et al., 2002a), the molecular structure of which largely resembles that of helianthinin. Non-covalent interactions of both CA and quinic acid (QA) (constituents of CGA) with helianthinin have also been reported (Suryaprakash et al., 2000). Several authors claimed that in sunflower products, CGA appears mainly in the form of complexes or bound to proteins. The binding to proteins has been reported to occur either preferentially with LMW proteins (Sabir et al., 1973; Sabir et al., 1974; Kabirullah and Wills, 1983; Prasad, 1990; Venktesh and Prakash, 1993b), or HMW protein (Sastry and Rao, 1990) or non-preferentially (Rahma and Rao, 1979; Rahma and Rao, 1981a). The non-covalent binding of CGA to proteins may even result in a decreased protein solubility (Neucere et al., 1978). A recent publication (Prigent et al., 2003), however, reported the absence of precipitation of globular proteins in the presence of CGA by non-covalent interactions, even at high CGA/protein ratios. In agreement with the last authors, this thesis shows (Chapter 2) that CGA was mainly present as free CGA, not being associated to any protein fraction. However, despite this
116
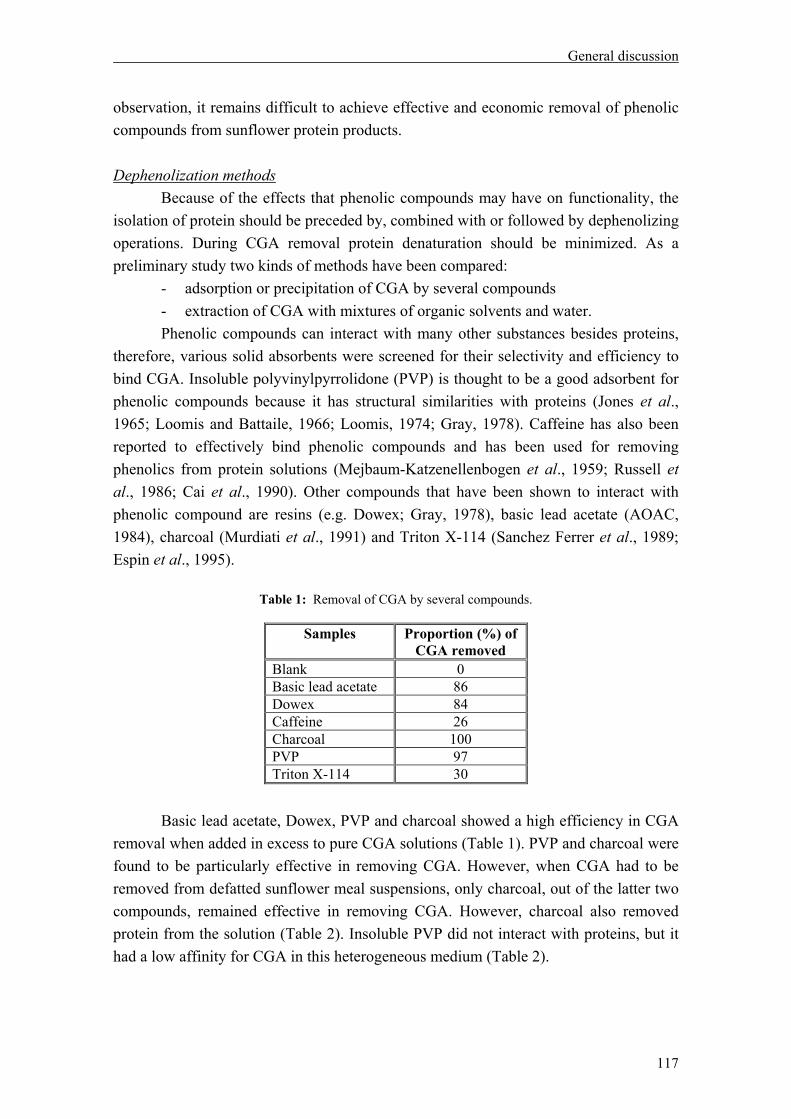
General discussion
observation, it remains difficult to achieve effective and economic removal of phenolic compounds from sunflower protein products. Dephenolization methods
Because of the effects that phenolic compounds may have on functionality, the isolation of protein should be preceded by, combined with or followed by dephenolizing operations. During CGA removal protein denaturation should be minimized. As a preliminary study two kinds of methods have been compared:
- adsorption or precipitation of CGA by several compounds - extraction of CGA with mixtures of organic solvents and water.
Phenolic compounds can interact with many other substances besides proteins, therefore, various solid absorbents were screened for their selectivity and efficiency to bind CGA. Insoluble polyvinylpyrrolidone (PVP) is thought to be a good adsorbent for phenolic compounds because it has structural similarities with proteins (Jones et al., 1965; Loomis and Battaile, 1966; Loomis, 1974; Gray, 1978). Caffeine has also been reported to effectively bind phenolic compounds and has been used for removing phenolics from protein solutions (Mejbaum-Katzenellenbogen et al., 1959; Russell et al., 1986; Cai et al., 1990). Other compounds that have been shown to interact with phenolic compound are resins (e.g. Dowex; Gray, 1978), basic lead acetate (AOAC, 1984), charcoal (Murdiati et al., 1991) and Triton X-114 (Sanchez Ferrer et al., 1989; Espin et al., 1995).
Table 1: Removal of CGA by several compounds.
Samples Proportion (%) of CGA removed
Blank 0 Basic lead acetate 86 Dowex 84 Caffeine 26 Charcoal 100 PVP 97 Triton X-114 30
Basic lead acetate, Dowex, PVP and charcoal showed a high efficiency in CGA
removal when added in excess to pure CGA solutions (Table 1). PVP and charcoal were found to be particularly effective in removing CGA. However, when CGA had to be removed from defatted sunflower meal suspensions, only charcoal, out of the latter two compounds, remained effective in removing CGA. However, charcoal also removed protein from the solution (Table 2). Insoluble PVP did not interact with proteins, but it had a low affinity for CGA in this heterogeneous medium (Table 2).
117

Chapter 7
Table 2: Protein losses and CGA removal from a 1 % protein suspension of defatted sunflower meal (pH 7.0).
Charcoal PVP Methanol 80 % Protein Losses (%) 40 0 4 CGA Removed (%) 99 30 99
The capacity to extract phenolic compounds was also tested for the pure form or
aqueous mixtures of several organic solvents (ethanol, methanol and 2-propanol). Aqueous 80 % (v/v) methanol proved to be the best extractant, based on its CGA extraction efficiency, the gentleness with respect to protein denaturation and recovery (Chapter 2).
Summarizing, although various of the screened methods (PVP, charcoal) could be optimized to obtain high quality sunflower protein, the high protein recovery (Table 2) and absence of protein denaturation made extraction with aqueous methanol the method of choice for dephenolization.
0
10
20
30
40
50
60
70
80
90
100
2 4 6 8 10pH
extra
ctab
ility
(%)
Figure 1: Protein extractability of the defatted meal in water (▲) and in 1 M NaCl (■) as a function of pH (1 % protein, w/v).
Protein extraction
Protein extractability at pH 7.0 and 10.0 was not affected by dephenolization with aqueous methanol 80 % (v/v) (Chapter 2). During dephenolization with aqueous methanol 80 % (v/v), protein losses are only about 4 %. Figure 1 shows the protein extractability (in water and in 1M NaCl solution) of the defatted meal as a function of pH. These results show that protein extractability is enhanced by increasing pH and the use of salt, especially at lower pH values. However, to avoid the use of salt we selected
118

General discussion
extraction at slightly alkaline pH, a procedure also common in industrial soy protein processing. After the complete process to obtain the sunflower isolate (Chapter 2), 60 % of the protein is recovered, which is similar to yields previously reported (O'Connor, 1971; Hagenmaier, 1974; Nuzzolo et al., 1980; Lawhon et al., 1982; Normandin et al., 1984). Structure and solubility of helianthinin Quaternary structure model of helianthinin At the conditions mostly used for protein isolation (moderate alkaline pH values), helianthinin is mainly present in the 11S form. In literature it is, therefore, common to refer to the 11S structure of helianthinin as the helianthinin molecule. However, depending on pH, ionic strength, temperature and protein concentration, helianthinin may also occur in the 15-18S, 7S or 3S form. This definition of helianthinin as the 11S form is, thus, arbitrary. Because the nomenclature based on sedimentation coefficients is still being used throughout the literature, we have conformed to this terminology for uniformity reasons. It should be kept in mind that the helianthinin subunit (3S) is actually the helianthinin molecule. The 7S form is the trimer, 11S the hexamer and the 15-18S forms are likely aggregates of 11S and 7S forms of helianthinin. Dissociation of the 11S as well as 7S forms of helianthinin at acidic conditions has been reported (Schwenke et al., 1975a; Schwenke et al., 1975b; Sripad and Rao, 1987; Sastry and Rao, 1990), but no data on changes in the mild acid, neutral and moderate alkaline pH range are available. This thesis shows that the quaternary structure of helianthinin is modulated by both ionic strength and pH. Dissociation of the 11S form into the 7S form gradually increased with increasing pH from 5.8 to 9.0 at both low (30 mM) and high (250 mM) ionic strength. A schematic model for the quaternary structure of helianthinin at various conditions is given in Figure 2. However, the physico-chemical basis for the coexistence of 11S and 7S forms of helianthinin has not been established so far. Besides the effect of pH and ionic strength on the dissociation, also time was observed to be an important factor, as at fixed conditions (pH 7.0, 30 mM) about 50 % of the 11S form dissociated into the 7S form after 5 days of storage (no results shown). Although, no association of 7S into 11S was observed, the extremely low rate of the process leaves open the possibility of an equilibrium, instead of an irreversible process. Schwenke et al. (1979) suggested an 11S/7S equilibrium associated with a partially irreversible dissociation of the 11S form into the 7S form of helianthinin. Consequently, from a thermodynamic point of view, the dissociation of 11S into 7S under non-denaturing conditions may be a reversible process. The increased amount of non-structured protein, as observed with far-UV CD (Chapter 3), and the loss of tertiary structure, as observed with near-UV CD, indicate that a conformational transition is associated with the dissociation of 11S into 7S. Also,
119

Chapter 7
the difference in denaturation temperature between the isolated 7S and 11S forms indicates that both forms are built from structurally different subunits. This is strengthened by the presence of two populations of monomeric forms of helianthinin with denaturation temperatures of approximately 65 °C and 90 °C.
Aggregate (15-18S)
Trimer (7S)
Hexamer (11S)
Monomer (3S)
Basic polypeptides
Acidic polypeptides
Reducing AgentsProtein Concentration
Ionic Strength
pH(6 to 9)
Protein Concentration
Protein Concen
tration
Heat (650C)pH<3
Heat (900C)pH<3
S SA B
B
A
Figure 2: Schematic model for the quaternary structure of helianthinin at various conditions.
It has been reported that in solutions of low ionic strength (I < 300 mM), the 11S form of helianthinin dissociates into the 7S form (pH 7.0-8.0), and at pH > 9.0, it dissociates further into the 3S form (Schwenke et al., 1974; Schwenke et al., 1975a). This thesis shows, however, that both forms of helianthinin (11S and 7S) are present at pH 7.0 in a broad ionic strength range (30-1250 mM; Chapter 3), although a higher ionic strength contributes to the stabilization of the 11S form. It was also found that the formation of high molecular weight aggregates (15-18S) of helianthinin is favoured at high protein concentrations, and becomes the major fraction at alkaline pH values (pH 9.0, I = 20 mM; Chapter 3). This thesis confirms the dissociation of the 7S and 11S forms into monomers under more drastic conditions, such and low pH (pH 3.0) (Schwenke et al., 1975a; Schwenke et al., 1975b; Sripad and Rao, 1987). It should be mentioned that small amounts of the monomeric form of helianthinin were also present under non-denaturing conditions (Chapter 3). Furthermore, it is shown that heat treatments also result in dissociation of 11 S (90 ºC) and 7S (65 ºC) into the monomeric form of helianthinin. Ultimately, the monomers can be split into their basic and acid polypeptides under reducing conditions (Figure 2).
120

General discussion
Structure of helianthinin at high temperature and low pH Changes in helianthinin structure at acidic conditions (ambient temperatures)
resemble the changes as a result of heat treatment (Chapter 3). However, the effect of heating is more severe. In contrast to the situation after heating at 110 °C (in which refolding never exceeds 10 %), partial refolding of α-helical structures (from 25 to 48 %) at neutral and mild alkaline pH values occurs when the protein is heated up to 65 °C. In all the cases at neutral and mild alkaline pH values, heating involved an increase of the β-sheet content. The formation of β-sheet upon heating has been related to protein aggregation. This aggregation was hardly noticeable in far-UV CD due to the low concentration of the samples, but was clear in DSC experiments (pH 7.0) as a abrupt exothermic transition. It has been observed that at high protein concentration (80 mg/ml) and high ionic strength (I = 200 mM; pH 7.0) the DSC thermogram of sunflower isolate (Chapter 2) and that of purified helianthinin (result not shown) showed a single endothermic transition at approximately 100 °C. However, at much lower protein concentrations (1-4 mg/ ml) and lower ionic strength (I = 10 mM), two endothermic transitions were observed for the thermal unfolding of both helianthinin (Chapter 3) and sunflower isolate (result not shown). These results indicate that high protein concentrations may stabilize the 11S form of helianthinin compared to the 7S form. Furthermore, high ionic strength is known to shift the 11S/7S equilibrium to the 11S form ((Schwenke et al., 1974; Schwenke et al., 1975a); Chapter 3). Lowering the protein concentration or the ionic strength probably results in a shift in the equilibrium between the two conformational states of the helianthinin subunits: one state with a denaturation temperature of 90 °C and a second state with a denaturation temperature of 65 °C. The transition of the subunits to the second state probably results in the partial dissociation of the hexameric form into a trimeric form, which completely consists of subunits with a denaturation temperature of 65 °C. It is expected that helianthinin may suffer partial deamidation during heat denaturation. For example, significant deamidation levels (10 %) are reached after heating (90 °C) for 30 minutes an acid solution of a sunflower protein isolate (Claughton and Pearce, 1989). For helianthinin, as for many other globular proteins, such as sunflower albumins or soy glycinin, the denaturation temperatures are that high (Danilenko et al., 1987; Marcone, 1999; Lakemond et al., 2000a); Chapters 3 and 4), that denaturation always comes along with deamidation. Therefore, in this thesis, deamidation was considered to be part of the denaturation process and has not been studied separately. Relation between quaternary structure and solubility As stated in Chapter 1, protein solubility depends on the free energy of the protein in solution relative to its free energy when interacting with other molecules than the solvent (Creighton, 1996). In this thesis, solubility is defined as the amount of
121
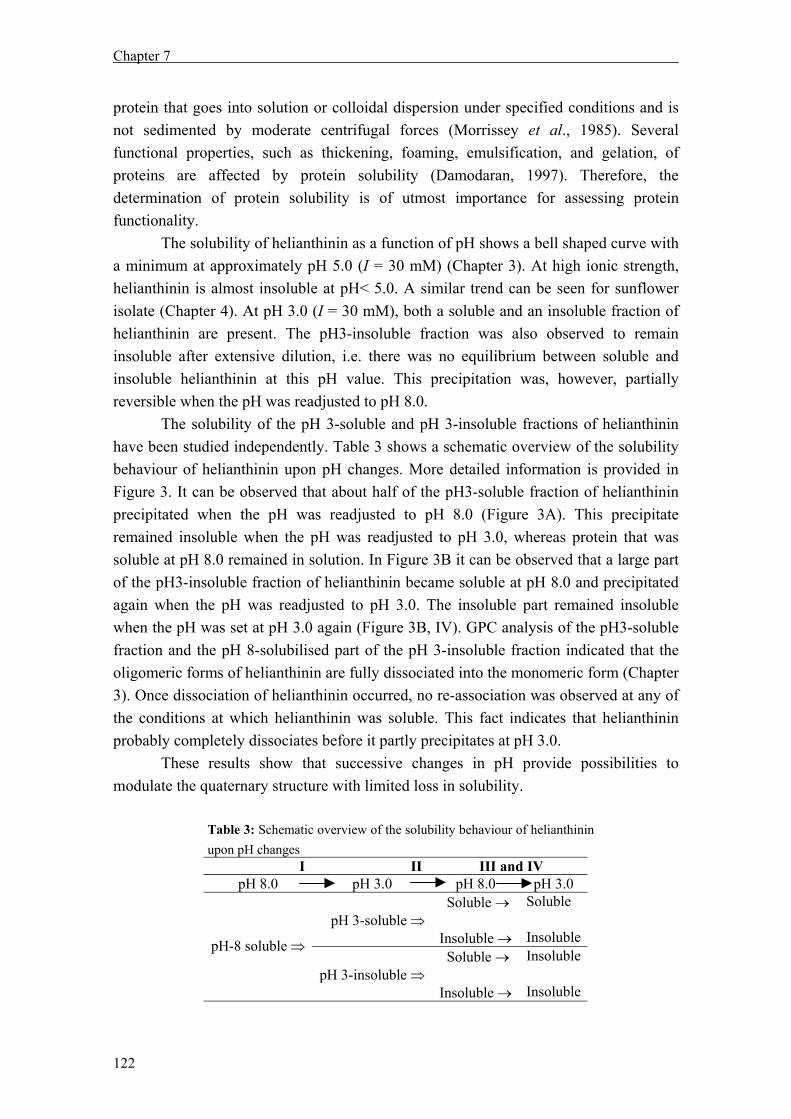
Chapter 7
protein that goes into solution or colloidal dispersion under specified conditions and is not sedimented by moderate centrifugal forces (Morrissey et al., 1985). Several functional properties, such as thickening, foaming, emulsification, and gelation, of proteins are affected by protein solubility (Damodaran, 1997). Therefore, the determination of protein solubility is of utmost importance for assessing protein functionality. The solubility of helianthinin as a function of pH shows a bell shaped curve with a minimum at approximately pH 5.0 (I = 30 mM) (Chapter 3). At high ionic strength, helianthinin is almost insoluble at pH< 5.0. A similar trend can be seen for sunflower isolate (Chapter 4). At pH 3.0 (I = 30 mM), both a soluble and an insoluble fraction of helianthinin are present. The pH3-insoluble fraction was also observed to remain insoluble after extensive dilution, i.e. there was no equilibrium between soluble and insoluble helianthinin at this pH value. This precipitation was, however, partially reversible when the pH was readjusted to pH 8.0.
The solubility of the pH 3-soluble and pH 3-insoluble fractions of helianthinin have been studied independently. Table 3 shows a schematic overview of the solubility behaviour of helianthinin upon pH changes. More detailed information is provided in Figure 3. It can be observed that about half of the pH3-soluble fraction of helianthinin precipitated when the pH was readjusted to pH 8.0 (Figure 3A). This precipitate remained insoluble when the pH was readjusted to pH 3.0, whereas protein that was soluble at pH 8.0 remained in solution. In Figure 3B it can be observed that a large part of the pH3-insoluble fraction of helianthinin became soluble at pH 8.0 and precipitated again when the pH was readjusted to pH 3.0. The insoluble part remained insoluble when the pH was set at pH 3.0 again (Figure 3B, IV). GPC analysis of the pH3-soluble fraction and the pH 8-solubilised part of the pH 3-insoluble fraction indicated that the oligomeric forms of helianthinin are fully dissociated into the monomeric form (Chapter 3). Once dissociation of helianthinin occurred, no re-association was observed at any of the conditions at which helianthinin was soluble. This fact indicates that helianthinin probably completely dissociates before it partly precipitates at pH 3.0.
These results show that successive changes in pH provide possibilities to modulate the quaternary structure with limited loss in solubility.
Table 3: Schematic overview of the solubility behaviour of helianthinin upon pH changes
I II III and IV pH 8.0 pH 3.0 pH 8.0 pH 3.0
Soluble → Soluble pH 3-soluble ⇒
Insoluble → Insoluble
pH-8 soluble ⇒ Soluble → Insoluble
pH 3-insoluble ⇒ Insoluble → Insoluble
122

General discussion
pH3 4 5 6 7 8
solu
bilit
y (%
)
0
20
40
60
80
100 I
II
IV
III
B
pH
3 4 5 6 7 8
solu
bilit
y (%
)
0
20
40
60
80
100 I
II
III
IV
A
Figure 3: pH-Dependent solubility profiles of the soluble (A) and insoluble (B) part of helianthinin at pH
3.0 (I = 30mm). The roman numbers (I,•; II, ■; III, ▲; IV,♦) indicate the consecutive curves for the
solubility of several helianthinin fractions as displayed in Table 3. Solubility was defined as (amount of
dissolved protein at a pH measured/ amount of dissolved protein at pH 8.5) x 100.
Effect of calcium on sunflower solubility It has been described that Ca2+ induces precipitation of soybean proteins (Yuan et al., 2002). Calcium has been generally reported to have no specific effect on sunflower proteins (Gheyasuddin et al., 1970; Mattil, 1971; Schwenke et al., 1977). Gel permeation chromatography (results not shown), however, revealed that at pH 8.0 helianthinin (15S, 11S and 7S forms) was selectively precipitated by the addition of Ca2+ (30 and 50 mM), while SFAs remained in solution. In a further publication of Schwenke and co-workers (1978), a decrease in the solubility of helianthinin has been
123

Chapter 7
reported to occur at low calcium concentrations (10 to 150 mM) over a large pH range (4.5 to 10.0). Probably, some of the carboxylic groups on the helianthinin subunits are oriented in such a way that they favor the establishment of calcium bridges between them, causing aggregation and precipitation of helianthinin. This hypothesis is in agreement with the absence of calcium-induced precipitation at acidic pH where most of the carboxylic groups are protonated. Although, some authors reported no specific effect of calcium on protein solubility, our experiments confirm the latest conclusions of Schwenke and co-workers (1978). Effect of heat and low pH on foam and emulsion properties In foam and emulsions, the soluble proteins govern the functionality of a protein preparation. The solubility as function of pH for helianthinin and SFAs is rather different (Chapters 3 and 4) and as a consequence their respective maximum concentration in protein solutions depends on pH and ionic strength. Thus, when studying the functionality of sunflower isolate, conditions such as pH and ionic strength determine the composition of the soluble protein fraction. Information on the properties of individual proteins or protein fractions is lacking in many publications, leading to incomplete information about the contribution of each protein fraction to the overall functionality. Furthermore, most of the research to test emulsion and foam properties has been performed with the total protein, i.e. the soluble as well as the insoluble fraction (Huffman et al., 1975; Canella, 1978; Rahma and Rao, 1981b; Rossi and Germondari, 1982; Rossi et al., 1985; Kabirullah and Wills, 1988; Booma and Prakash, 1990; Venktesh and Prakash, 1993a; Pawar et al., 2001); etc). Although insoluble protein is accounted for in the total concentration, its contribution to protein functionality is usually very low (Kinsella, 1979; Halling, 1981). Therefore, in this thesis, functionality tests were performed with purified proteins and in particular with the soluble fraction. Chapter 3 shows that helianthinin unfolds to varying extents when heated or subjected to low pH. Both heat and pH treatments were shown to improve, to different degrees, foam and emulsion properties as compared to the properties of untreated helianthinin (Chapters 5 and 6). SFAs are more difficult to unfold. Positive effects of low pH values on the stability of emulsions made with SFAs against aggregation and coalescence, must, therefore, be mainly ascribed to other causes than protein unfolding. The positive effects of protein unfolding are usually counteracted by protein losses due to precipitation. These losses, however, can be minimized by resolubilisation of part of the precipitated protein at pH 8.0 (Figure 3) or heating at low ionic strength. Unfolding of proteins to various extents has been reported to improve protein functionality in several cases (Schwenke et al., 1981; Schwenke, 1988; German and Phillips, 1991; Nir et al., 1994; Wagner and Guéguen, 1995; Wagner and Guéguen, 1999a; Wagner and Guéguen, 1999b; Van Koningsveld, 2001; Martin, 2003).
124

General discussion
Comparison of helianthinin with other 11S globulins
The 10-12S protein fraction is also the major fraction in other oilseeds such as groundnut, sesame, sunflower, safflower, poppy seed, and linseed (Prakash and Rao, 1986). Marcone and co-workers (1998b) characterized 21 seed globulins derived from both monocotyledoneous and dicotyledoneous plants and pointed out the narrow molecular weight range (300-370 kDa) of these multi-subunit proteins. The 11S globulins were classified as hetero-oligomers being composed of various subunits with molecular weight ranges of 20-27 and 30-39 kDa in non-equimolar ratios. These subunits correspond to the basic and acidic polypeptides, respectively. In spite of the large diversity in polypeptides and amino acid sequences of the 11S globulins from different species, various seed proteins may share regions that are conserved in sequence and/or structure (Marcone, 1999; Mandal and Mandal, 2000). Similarities have been found in quaternary (Derbyshire et al., 1976; Prakash and Rao, 1986; Marcone et al., 1998b; Marcone, 1999) and secondary structure (Prakash and Rao, 1986; Marcone et al., 1998a; Marcone et al., 1998b; Marcone, 1999). Substantial differences were, however, observed in the tertiary structure of seed globulins (Marcone et al., 1998a; Marcone, 1999). A more detailed comparison between helianthinin and soy glycinin will be given because of the extended use of the latter protein in foods. Lakemond (2001) claimed that the quaternary model proposed by Plietz et al. (Plietz et al., 1983) for sunflower and rapeseed 11S globulins was also more suitable for soy glycinin than the widely used model of Badley et al. (1975). Further structural similarities between helianthinin (Chapter 3) and soy glycinin have been found during this research. The near-UV CD spectrum of helianthinin at neutral pH resembles that of soy glycinin. Both show a positive ellipticity between 260 and 300 nm with a maximum at 285 and a resolved shoulder at 292 nm. Since CD spectra, especially the near-UV, can be seen as a fingerprint of a protein (Pain, 1996), this result may indicate a similar tertiary folding of these two seed storage proteins. The far-UV CD spectra of both proteins at neutral pH are also very similar (Chapter 3; Lakemond et al., 2000b). They exhibit a negative extreme at 208-210 nm and a zero crossing around 200 nm. The secondary folding of both proteins was estimated to mainly consist of α-helical structures, in contrast to other authors that have reported glycinin to contain mainly β-sheet (Jacks et al., 1973; Prakash and Rao, 1986; Marcone, 1999). Furthermore, the solubility as a function of pH is very similar, although helianthinin seems less soluble below pH 4.0. Industrial applications of sunflower proteins Several studies have been performed with defatted flours, protein concentrates and isolates produced from sunflower (Table 3, Chapter 1). Sunflower protein products have often been compared with commercial soy protein isolates and concentrates with
125

Chapter 7
regard to their functional properties, because the extensive research performed on soy protein functionality is a good base for comparison. These investigations show a great variety of results in the functional properties of sunflower proteins. Therefore, they do not permit general statements on the suitability of sunflower proteins for specific applications. In addition, when working with protein isolates, the protein composition of the soluble fraction is significantly affected by pH and ionic strength. The variety of results is likely due to the variety of methods used to obtain the sunflower protein products, which results in products that differ in protein content and protein composition, content of non-protein compounds (e.g. phenolic compounds), or degree of protein denaturation. The functional properties of sunflower proteins are also affected by the sunflower variety and cultivar used. In this context, Guéguen et al. (1996) reported significant differences in the properties of emulsions made from SFAs of four different sunflower cultivars. The degree of protein denaturation seems to be one of the main determining parameters regarding protein functionality (Arrese et al., 1991). Generally, sunflower flours, obtained as by-products from the sunflower oil industry, have functional properties that are less favourable than those of soy proteins. These functional properties include, first of all, protein solubility in the neutral and acidic pH range and, for an important part, also emulsion and foam properties (Gassmann, 1983). The reason for the lower functionality of sunflower proteins, however, seems to lie more in the high temperatures reached during oil extraction, which results in extensive denaturation, than in the inherent properties of the proteins themselves. Therefore, it seems clear that the behaviour of proteins used in foods depends largely on their processing history, which will have a direct effect on the physico-chemical, and thus the functional performance of the proteins. A great variety of possibilities to influence protein structure are available of which those arising from heating or low pH are of special industrial significance. Acid modification of sunflower has been reported, for example, to increase water-binding capacity, to decrease protein solubility (Schwenke et al., 1981), and to improve foam expansion and stability (Claughton and Pearce, 1989) as was also found in our research. An example of the effect of processing is given in Figure 7 (Chapter 3), where the heating time (65 ºC, up to 60 minutes) of pure helianthinin was varied. Denaturation of the 7S form of helianthinin increases upon increasing heating time, whereas the 11S form of helianthinin remained in its native state. Thus, for industrial purposes it is also possible to denature the different forms of helianthinin to different extents to modify the functional properties.
126
General discussion
Literature cited AOAC Coffee and tea. In Official methods of analysis; Association of Official Analytical Chemists:
Washington DC, 1984; 271. Arrese E.L., Sorgentini D.A., Wagner J.R. and Anon M.C. Electrophoretic, solubility, and functional
properties of commercial soy protein isolates. J. Agric. Food Chem. 1991, 1029-1032. Badley R.A., Atkinson D., Hauser H., Oldani D., Green J.P. and Stubbs J.M. The structure, physical and
chemical properties of the soybean protein glycinin. Biochim. Biophys. Acta 1975, 412, 214-228. Booma K. and Prakash V. Functional properties of the flour and the major protein fraction from sesame
seed, sunflower seed and safflower seed. Acta Alimentaria 1990, 19(2), 163-176. Cai Y., Gaffney S.H., Lilley T.H., Mangolato D., Martin R., Spencer C.M. and Haslam E. Polyphenol
Interactions. Part 4. Model Studies with Caffeine and Cyclodextrins. J. Chem. Soc., Perkin Trans 1990, 2, 2197-2209.
Canella M. Whipping properties of sunflower protein dispersions. Food Sci. Technol-Leb. 1978, 11, 259-263.
Claughton S.M. and Pearce R.J. Preparation and properties of acid-modified sunflower protein isolate. J. Food Sci. 1989, 54, 357-361.
Creighton T.E. Proteins: Structures and molecular properties, W.H. Freeman, New York, 1996. Damodaran S. Food proteins: an overview. In Food Proteins and Their Applications; Damodaran S. and
Paraf A., eds; Marcel Dekker, INC.: Madison, Wiscosin, 1997; 1-24. Danilenko A.N., Bikbov T.M., Grinberg N.V., Leont'eva A.L., Burova T.V., Surikov V.V., Borisov Y.A.
and Tolstoguzov V.B. Effect of pH on the thermal stability of 11S-globulin of Glycine Max seeds as indicated by differential scanning microcalorimetry. Biophysics 1987, 32, 434-439.
Derbyshire E., Wright D.J. and Boulter D. Legumin and vicilin, storage proteins of legume seeds. Phytochemistry 1976, 15, 3-24.
Espin J.C., Morales M., Varon R., Tudela J. and Garcia Canovas F. Monophenolase activity of polyphenol oxidase from Verdedoncella apple. J. Agric. Food Chem. 1995, 43, 2807-2812.
Gassmann B. Preparation and application of vegetable proteins, especially proteins from sunflower seed, for human consumption. An approach. Nahrung 1983, 27, 351-369.
German J.B. and Phillips L. Protein interactions in foams. In Protein functionality in food systems; Hettiarachy N. S. and Ziegler G. R., eds; IFT Basic Symposium Series: Chicago, 1991; 181-208.
Gheyasuddin S., Cater C.M. and Mattil K.F. Effect of several variables on the extractability of sunflower seed proteins. J. Food Sci. 1970, 35, 453-56.
Gray J.C. Absorption of polyphenols by polyvinylpyrrolidone and polystyrene resins. Phytochemistry 1978, 17, 495-497.
Guéguen J., Popineau Y., Anisimova I.N., Fido R.J., Shewry P.R. and Tatham A.S. Functionality of the 2S albumin seed storage proteins from sunflower (Helianthus annuus L.). J. Agric. Food Chem. 1996, 44, 1184-1189.
Hagenmaier R.D. Aqueous processing of full-fat sunflower seeds: yields of oil and protein. J. Am. Oil Chem. Soc. 1974, 51, 470-471.
Halling P.J. Protein-stabilized foams and emulsions. CRC Crit. Rev. Food Sci. Nutr. 1981, 15, 155-203. Huffman V.L., Lee C.K. and Burns E.E. Selected functional properties of sunflower meal (Helianthus
annuus). J. Food Sci. 1975, 40, 70-74. Jacks T.J., Barker R.H. and Weigang O.E. Conformations of oilseed storage proteins (globulins)
determined by circular dichroism. Int. J. Pept. Protein Res. 1973, 5, 289-91.
127

Chapter 7
Jones J.D., Hulme A.C. and Wooltorton L.S.C. The use of polyvinylpyrrolidone in the isolation of enzymes from apple fruits. Phytochemistry 1965, 4, 659-676.
Kabirullah M. and Wills R.B.H. Characterization of sunflower protein. J. Agric. Food Chem. 1983, 31, 953-956.
Kabirullah M. and Wills R.B.H. Foaming properties of sunflower seed protein. J. Food Sci. Techn. 1988, 25, 16-19.
Kinsella J.E. Functional properties of soy proteins. J. Am. Oil Chem. Soc. 1979, 56, 242-258. Kroll J., Rawel H.M., Rohn S. and Czajka D. Interactions of glycinin with plant phenols: Influence on
chemical properties and proteolytic degradation of the proteins. Nahrung 2001, 45, 388-389. Kroll J., Rawel H.M. and Seidelmann N. Physicochemical properties and susceptibility to proteolytic
digestion of myoglobin-phenol derivatives. J. Agric. Food Chem. 2000, 48, 1580-1587. Lakemond C.M.M. Heat denaturation of soy glycinin: structural characteristics in relation to aggregation
and gel formation. Ph.D Thesis. Wageningen University, Wageningen (The Netherlands). 2001. Lakemond C.M.M., de Jongh H.H.J., Hessing M., Gruppen H. and Voragen A.G.J. Heat denaturation of
soy glycinin: influence of pH and ionic strength on molecular structure. J. Agric. Food Chem. 2000a, 48, 1991-1995.
Lakemond C.M.M., de Jongh H.H.J., Hessing M., Gruppen H. and Voragen A.G.J. Soy glycinin: influence of pH and ionic strength on solubility and molecular structure at ambient temperatures. J. Agric. Food Chem. 2000b, 48, 1985-1990.
Lawhon J.T., Glass R.W., Manak L.J. and Lusas E.W. White-colored protein isolate from sunflower: processes and products. Food Tech. 1982, 36, 86-87.
Loomis W.D. Overcoming problems of phenolics and quinones in the isolation of plant enzymes and organelles. Methods Enzymol. 1974, 31, 528-544.
Loomis W.D. and Battaile J. Plant phenolic compounds and the isolation of plant enzymes. Phytochemistry 1966, 5, 423-438.
Mandal S. and Mandal R.K. Seed storage proteins and approaches for improvement of their nutritional quality by genetic engineering. Curr. Sci. 2000, 79 (5), 576-589.
Marcone M.F. Biochemical and biophysical properties of plant storage proteins: a current understanding with emphasis on 11S seed globulins. Food Res. Int. 1999, 32, 79-92.
Marcone M.F., Kakuda Y. and Yada R.Y. Salt-soluble seed globulins of dicotyledonous and monocotyledonous plants. II. Structural characterization. Food Chem. 1998a, 63 (2), 265-274.
Marcone M.F., Kakuda Y. and Yada R.Y. Salt-soluble seed globulins of various dicotyledonous and monocotyledonous plants. I. Isolation/purification and characterization. Food Chem. 1998b, 62 (1), 27-47.
Martin A.H. Mechanical and conformational aspects of protein layers on water. Ph.D Thesis. Wageningen University, Wageningen, The Netherlands. 2003.
Mattil K.F. The functional requirements of proteins for foods. J. Am. Oil Chem. Soc. 1971, 48, 477-480. Mejbaum-Katzenellenbogen W., Dobryszycka W., Boguslawska-Jaworska J. and Morawiecka B.
Regeneration of Protein from Insoluble Protein-Tannin Compound. Nature 1959, 184, 1799-1800.
Morrissey P.A., Mulvihill D.M. and O'Neill E.M. Functional properties of muscle proteins, Elsevier Applied Science Publishers, Ltd, Barking, England, 1985.
Murdiati T.B., McSweeney C.S. and Lowry J.B. Complexing of toxic hydrolysable tannins of yellow-wood (Terminalia oblongata) and harendong (Clidemia hirta) with reactive substances: an approach to preventing toxicity. J. Appl. Toxicol. 1991, 11, 333-338.
128

General discussion
Neucere N.J., Jacks T.J. and Sumrell G. Interactions of globular protein (arachin from peanuts) with simple polyphenols. J. Agric. Food Chem. 1978, 26, 214-216.
Nir I., Feldman Y., Aserin A. and Garti N. Surface Properties and Emulsification Behavior of Denatured Soy Proteins. J. Food Sci. 1994, 59, 606-610.
Normandin F.C., Ducastaing A., Prevot A. and Raymond J. Preparation of protein isolates from sunflower cakes. Re. Fr. Corps Gras 1984, 7-8, 293-299.
Nuzzolo C., Vignola R. and Groggia A. Method for preparing a proteinic isolate from sunflowerseed meal using aluminum salts. United States Patent (4,212,799), 1980.
O'Connor D.E. Preparing light-coloured protein isolate from sunflower meal by alkali extraction under an inert gas blanket followed by membrane ultrafiltration. United States Patent (3,622,556), 1971.
Pain R. Determining the CD spectrum of a protein. In Current protocols in protein science; Coligan J. E., Dunn B. M., Ploegh H. L., Speicher D. W. and Wingfield P. T., eds; John Wiley & sons: New York, 1996; 7.6.1-7.6.23.
Pawar V.D., Patil J.N., Sakhale B.K. and Agarkar B.S. Studies on selected functional properties of defatted sunflower meal and its high protein products. J. Food Sci. Techn. 2001, 38, 47-51.
Plietz P., Damaschun G., Muller J.J. and Schwenke K.D. The structure of 11-S globulins from sunflower and rape seed. A small-angle X-ray scattering study. Eur. J. Biochem. 1983, 130, 315-20.
Prakash V. and Rao M.S.N. Physicochemical properties of oilseed proteins. CRC Crit. Rev. Biochem. 1986, 20, 265-363.
Prasad D.T. Proteins of the phenolic extracted sunflower meal: I. Simple method for removal of polyphenolic components and characteristics of salt soluble proteins. Lebensm.-Wiss. Technol.-Food Sci. Technol. 1990, 23, 229-235.
Prigent S.V.E., Gruppen H., Visser A.J.W.G., Van Koningsveld G.A., de Jongh G.A.H. and Voragen A.G.J. Effects of non-covalent interactions with 5-O-Caffeoylquinic acid (chlorogenic acid) on the heat denaturation and solubility of globular proteins. J. Agric. Food Chem. 2003, 51, 5088-5095.
Rahma E.H. and Rao M.S.N. Characterization of sunflower proteins. J. Food Sci. 1979, 579-582. Rahma E.H. and Rao M.S.N. Isolation and characterization of the major protein fraction of sunflower
seeds. J. Agric. Food Chem. 1981a, 29, 518-521. Rahma E.H. and Rao M.S.N. Removal of polyphenols from sunflower meal by various solvents: effects
on functional properties. J. Food Sci. 1981b, 46, 1521-1522. Rawel H.M., Czajka D., Rohn S. and Kroll J. Interactions of different phenolic acids and flavonoids with
soy proteins. Int. J. Biol. Macromol. 2002a, 30, 137-150. Rawel H.M., Rohn S., Kruse H.P. and Kroll J. Structural changes induced in bovine serum albumin by
covalent attachment of chlorogenic acid. Food Chem. 2002b, 78, 443-455. Regitano d'Arce M.A., Gutierrez E.M. and Lima U.d.A. Sunflower seed protein concentrates and isolates
obtention from ethanol oil extraction meals (technical note). Arch. Latinoam. Nutr. 1994, 44, 33-5.
Rossi M. and Germondari I. Production of a food-grade protein meal from defatted sunflower. II. Functional properties evaluation. Lebensm.-Wiss. Technol.-Food Sci. Technol. 1982, 15, 313-316.
Rossi M., Pagliarini E. and Peri C. Emulsifying and foaming properties of sunflower protein derivatives. Lebensm.-Wiss. Technol.-Food Sci. Technol. 1985, 18, 293-299.
Russell M., Lilley T.H., Bailey N.A., Falshaw C.P., Haslam E., Magnolato D. and Begley M.J. Polyphenol-Caffeine complexation. J. Chem. Soc., Chem. Commun. 1986, 105-106.
129

Chapter 7
130
Sabir M.A., Sosulski F.W. and Finlayson A.J. Chlorogenic acid-protein interactions in sunflower. J. Agric. Food Chem. 1974, 22, 575-578.
Sabir M.A., Sosulski F.W. and MacKenzie S.L. Gel chromatography of sunflower proteins. J. Agric. Food Chem. 1973, 21, 988-993.
Sanchez Ferrer A., Bru R. and Garcia Carmona F. Novel procedure for extraction of a latent-grape polyphenoloxidase using temperature-induced phase separation in Triton X-114. Plant Physiol. 1989, 91, 1481-1487.
Sastry M.C.S. and Rao M.S.N. Binding of chlorogenic acid by the isolated polyphenol-free 11S protein of sunflower (Helianthus annuus) seed. J. Agric. Food Chem. 1990, 38, 2103-2110.
Schwenke K.D. Improving of functional properties of oilseed and legume proteins by structural changes. Acta Alimentaria Polonica 1988, 14, 15-23.
Schwenke K.D., Prahl L., Rauschal E., Gwiazda S., Dabrowski K. and Rutkowski A. Functional properties of plant proteins. II. Selected physico-chemical properties of native and denatured isolates from faba beans, soybeans, and sunflower seed. Nahrung 1981, 25, 59-69.
Schwenke K.D., Robowsky K.D. and Augustat D. On seed proteins. VIII. The effects of electrolyte content and pH (hydrogen-ion concentration) value on the solubility of globulins from sunflower (Helianthus annuus L.) anfield bean (Vicia faba L.) seeds. Nahrung 1978, 22, 425-437.
Schwenke K.D., Schultz M. and Linow K.J. Isolierung und Charakterisierung des 11-S-Globulins aus Sonnenblumensamen (Helianthus annuus L.). Nahrung 1975a, 19, 817-822.
Schwenke K.D., Schultz M. and Linow K.J. Ueber Samenproteine. 5. Dissoziationsverhalten des 11-S-Globulins aus Sonnenblumensamen. Nahrung 1975b, 19, 425-432.
Schwenke K.D., Schultz M., Linow K.J., Uhlig J. and Franzke C. Ueber Samenproteine. 4. Isolierung der Globulin-Hauptkomponente aus Sonnenblumensamen. Nahrung 1974, 18, 709-719.
Schwenke K.D., Sologub L.P., Braudo E.E. and Tolstoguzov W.B. Ueber Samenproteine. 9. Einfluß von Neutralsalzen auf die Löslichkeit des 11-S-Globulins aus Sonnenblumensamen. Nahrung 1977, 21, 491-503.
Smith A.K. and Johnsen V.L. Sunflower seed protein. Cereal Chem. 1948, 25, 339-406. Sripad G. and Rao M.S.N. Effect of acid pH on the 11S protein of sunflower seed. J. Agric. Food Chem.
1987, 35, 668-672. Suryaprakash P., Kumar Ramesh P. and Prakash V. Thermodynamics of interaction of caffeic acid and
quinic acid with multisubunit proteins. Int. J. Biol. Macromol. 2000, 27, 219-228. Van Koningsveld G.A. Physico-chemical and functional properties of potato proteins. Ph.D Thesis.
Wageningen University, Wageningen,The Netherlands. 2001. Venktesh A. and Prakash V. Functional properties of the total proteins of sunflower (Helianthus annuus
L.) seed: effect of physical and chemical treatments. J. Agric. Food Chem. 1993a, 41, 18-23. Venktesh A. and Prakash V. Low molecular weight proteins from sunflower (Helianthus annuus L.) seed:
effect of acidic butanol treatment on the physicochemical properties. J. Agric. Food Chem. 1993b, 41, 193-198.
Wagner J.R. and Guéguen J. Effects of dissociation, deamidation, and reducing treatment on structural and surface active properties of soy glycinin. J. Agric. Food Chem. 1995, 43 (8), 1993-2000.
Wagner J.R. and Guéguen J. Surface functional properties of native, acid-treated and reduced soy glycinin. 1. Foaming properties. J. Agric. Food Chem. 1999a, 47, 2173-2180.
Wagner J.R. and Guéguen J. Surface functional properties of native, acid-treated and reduced soy glycinin. 2. Emulsifying properties. J. Agric. Food Chem. 1999b, 47, 2181-2187.
Yuan Y.J., Velev O.D., Chen K., Campbell B.E., Kaler E.W. and Lenhoff A.M. Effect of pH and Ca2+-induced associations of soybean proteins. J. Agric. Food Chem. 2002, 50, 4953-4958.

Summary/samenvatting/resumen

Summary
Summary
Sunflower proteins have been reported to possess good emulsion and foam properties, and poor gelling properties. However, most of the studies did not provide any information on the structure of the proteins under the conditions used, and the functionality tests were performed with protein products of which the extent of denaturation was marginally or not studied. Therefore, only limited information is available on the functional properties of the individual protein fractions and on the relation between protein structure and functionality.
The numerous publications on sunflower protein isolation clearly indicate the difficulties that occur during recovery of a high quality protein from sunflower. The extractability of the proteins from sunflower meal (the product remaining after oil extraction) depends mainly on the procedures used during oil processing. Due to this processing, the proteins may be denatured to a large extent, resulting in a meal with high proportion of insoluble proteins. Therefore, the main outlet of sunflower proteins is in animal feed. Another reason that hampers the application of sunflower proteins as a food ingredient is the presence of relatively high amounts of phenolic compounds, especially chlorogenic acid (CGA). The interaction with phenolic compounds can affect sunflower protein in several ways, such as reducing protein digestibility and functionality, prolonging or shortening its storage life and stability, and altering its organoleptic properties. Furthermore, the presence of CGA results in a dark colour of sunflower protein products. Therefore, besides excluding protein denaturation, also other criteria should be used for evaluating the protein isolation process: protein recovery and content of phenolic compounds, which should be minimal.
In this context, in Chapter 2, a method is described for obtaining a sunflower protein isolate (SI) that complies with these criteria. During the isolating procedure, the extent of CGA removal and protein denaturation was monitored. Phenolic compounds were removed by aqueous methanol 80 % (v/v) extraction, prior to protein extraction at alkaline pH and diafiltration. Both differential scanning calorimetry and solubility tests clearly indicated that no denaturation of the proteins had occurred. The resulting protein products were biochemically characterised and the presence of protein-CGA complexes was investigated. In contrast to what has been previously reported, CGA was found to elute as free CGA, not being covalently associated to any protein fraction. Sunflower proteins of the studied variety were found to be composed of two main protein fractions: 2S albumins (SFAs) and helianthinin. The procedure developed resulted in a protein recovery of about 60 %. The isolate had a protein content of about 98 %.
Subsequently, the constituting protein fractions were biochemically, and structurally characterized under conditions (pH, ionic strength, temperature) relevant to food processing (Chapters 3 and 4).
Chapter 3 presents a detailed study on the influence of pH and ionic strength on the structure and solubility of helianthinin. Furthermore, its thermo-stability was
132
Summary
investigated. The solubility of helianthinin as a function of pH shows a bell shaped curve with a minimum at approximately pH 5 (I = 30 mM). At high ionic strength (I = 250 mM) helianthinin is almost insoluble at pH< 5. The results presented in Chapter 3 also show that the quaternary structure of helianthinin is modulated by the conditions used. Depending on pH, ionic strength, temperature and protein concentration, helianthinin may occur in the 15-18S (high molecular weight aggregate), 11S (hexamer), 7S (trimer) or 2-3S (monomer) form. Dissociation of the 11 S form into the 7S form gradually increases with increasing pH from 5.8 to 9. High ionic strength (I = 250 mM) stabilizes the 11S form of helianthinin at pH values above pH 7. Further dissociation of helianthinin into the monomeric form (2-3S) occurs at both low pH and high temperatures. The 11S and 7S form of helianthinin differ in their secondary (higher amount of random coil for 7S) and tertiary structure (lower intensity of the near-UV CD spectra for 7S) and in thermal stability (lower denaturation temperature for 7S). DSC measurements at pH 3 indicated that helianthinin was denatured at this pH value, in accordance with the indications obtained from the solubility studies. The DSC-profiles of helianthinin at pH 8.5 showed two endothermic transitions at temperatures of about 65 °C and 90 °C, for the trimeric and hexameric form of helianthinin, respectively. Furthermore, the DSC-profiles of the monomeric form of helianthinin also showed two endothermic transitions with similar denaturation temperatures, pointing to the existence of two populations of monomers. The results described in this Chapter lead to the hypothesis that helianthinin can adopt two different conformational states: one state with a denaturation temperature of 65 °C and a second state with a denaturation temperature of 90 °C. Chapter 4 presents a study of the influence of pH and ionic strength on the structure and solubility of SFAs. The effect of temperature on the structure of SFAs was also studied. Furthermore, the solubility of the sunflower isolate was studied and discussed in terms of its main protein components. The native structure of SFAs revealed to be stable against pH changes in the range of 3 to 9 and against heat treatment (up to 100 °C). The solubility of SFAs was only marginally affected by pH and ionic strength. The solubility of the sunflower isolate as a function of pH seems to be dominated by that of helianthinin, independently of the ionic strength.
Next, functionality tests were performed under conditions similar to the ones used in the studies described in Chapters 3 and 4. In Chapter 5 the emulsion properties of the SI as well as those of helianthinin, SFAs and combinations thereof were studied at various pH values and ionic strengths, and after heat treatment. The emulsions were characterized with respect to average droplet size, surface excess, and the occurrence of coalescence and/or droplet aggregation. Sunflower proteins were shown to form stable emulsions, with the exception of SFAs at alkaline and neutral pH values. Droplet aggregation occurred in emulsions made with SI, helianthinin and SFAs. However, coalescence appeared to be low except for SFAs at near neutral pH. Droplet aggregation and subsequent coalescence of emulsions made with SFAs could be prevented at pH 3.
133

Summary
Reconstitution experiments (pH 7) showed that an increase in SFAs content results in impairment of the emulsion properties. Calcium was found to cause droplet aggregation of emulsions made with helianthinin at neutral and alkaline pH values. Heat and acid treatments resulted in improvement of emulsion properties. This is in accordance with other studies that have shown that treatments resulting in an increase in conformational flexibility of proteins lead to an improvement of emulsion properties. The latter is observed provided that these treatments do not lead to extensive protein aggregation and precipitation. In Chapter 6 the foam properties of SI as well as those of helianthinin, SFAs and combinations thereof were studied at various pH values and ionic strengths, and after heat treatment. These tests showed that less foam could be formed with helianthinin than with SFAs, but foam prepared with helianthinin was more stable against Ostwald ripening and drainage than foam prepared with SFAs. Foams made with SFAs suffered from extensive coalescence and a high extent of drainage. At pH 8 and 3 the foam properties of helianthinin were better than at pH 7. In contrast, the foam properties of SFAs and SI were much less affected by pH. An increase in ionic strength resulted in improvement of the foam properties of helianthinin, especially at pH 7 and pH 8. This increase had only minor effects on those of SI and SFAs. The formation and stability of foams made from reconstituted mixtures of both proteins and from SI showed the deteriorating effect of SFAs on foam stability and drainage. However, foam volume increased with increasing amounts of SFAs. Foam stability against Ostwald ripening increased after acid and heat treatment of helianthinin. Partial unfolding of sunflower proteins, probably resulting in increased structural flexibility, improved protein performance at the air/water interface. Furthermore, it was observed that the protein available is used inefficiently, and that typically only about 20 % of the protein present is incorporated in the foam. Chapter 7 discusses some of the results described in this thesis in a larger and general perspective. Furthermore, some additional results are described in order to gain new knowledge on sunflower proteins. In this context, the dephenolization methods used in this study are compared based on their effectiveness to remove CGA, protein recovery and the gentleness with respect to protein denaturation. Next, the similarities between helianthinin and soy glycinin regarding protein structure are highlighted, and a model for the quaternary structure of helianthinin at various conditions is proposed. Furthermore, the solubility behaviour of helianthinin and its quaternary structure after successive changes in pH is presented showing the possibility to modulate the quaternary structure with limited loss in solubility. Once dissociation of helianthinin into its monomeric form occurred, no re-association is observed at any of the conditions at which helianthinin is soluble. Helianthinin solubility at pH 8 is drastically decreased in the presence of low (30-50 mM) concentrations of calcium, whereas SFAs remained in solution.
134

Samenvatting
Samenvatting
Volgens de literatuur bezitten zonnebloemeiwitten goede emulsie- en schuimeigenschappen en slechte geleringseigenschappen. Echter, de meeste studies geven geen informatie over de structurele staat van deze eiwittenpreparatie, onder de gegeven condities. De functionaliteittesten worden vaak uitgevoerd met eiwitten waarvan de mate van denaturatie niet of nauwelijks bestudeerd is. Daarom is er slechts beperkte informatie beschikbaar over de functionele eigenschappen van de individuele ongedenatureerde eiwitfracties en over de relatie tussen eiwit structuur en functionaliteit.
De vele publicaties over de isolatie van zonnebloem eiwit, maken duidelijk dat het moeilijk is een hoge kwaliteit zonnebloemeiwit te verkrijgen. . Het succes van de extractie van de zonnebloemmeel (SFM) eiwitten is voornamelijk afhankelijk van de gebruikte procedures tijdens de olie productie. Tijdens industriële processing denatureert een groot deel van de eiwitten, wat resulteert in een SFM met een hoog gehalte aan onoplosbare eiwitten. Daarom worden zonnebloem-eiwitten het meest wordt toegepast in diervoeding. Een andere reden die de toepassing van zonnebloem-eiwitten als voedsel ingrediënt beperkt, is de aanwezigheid van relatief hoge hoeveelheden fenolische verbindingen, met name chlorogeen zuur (CGA). De interactie met fenolische verbindingen kan op verschillende manieren invloed hebben op de zonnebloem-eiwitten, zoals een verminderde verteerbaarheid en functionaliteit, verlaagde stabiliteit tijdens opslag en verandering van de organoleptische eigenschappen. Verder geeft de aanwezigheid van CGA een donkere kleur aan de zonnebloemeiwit-producten. Daarom is tijdens de isolatieprocedure, naast het voorkomen denaturatie van eiwit, ook de eiwitopbrengst en het gehalte aan fenolische verbindingen van belang.
In dit kader, wordt in hoofdstuk 2 een methode beschreven voor het verkrijgen van een zonnebloemeiwit isolaat dat voldoet aan deze criteria. Tijdens de isolatie- procedure is de hoeveelheid verwijderd CGA en de eiwit denaturatie gevolgd. Voordat het eiwit onder basische omstandigheden werd geextrateerd, zijn de fenolische verbindingen verwijderd met behulp van extractie met methanol (80%)(v/v) in water. Differential Scanning Calorimetry (DSC) en oplosbaarheidtesten gaven duidelijk aan dat er geen denaturatie van eiwitten had plaatsgevonden. De verkregen eiwit producten zijn vervolgens biochemisch gekarakteriseerd en op de aanwezigheid van eiwit-CGA complexen onderzocht. In tegenstelling tot eerdere publicaties, bevindt het CGA zich in de vrije vorm, niet covalent gebonden aan een eiwit fractie. De eiwitten van het in dit onderzoek onderzochte zonnebloem ras bestaan uit twee eiwit fracties: 2S albumines (SFAs) en helianthinine. De ontwikkelde eiwit isolatie procedure resulteerde in een opbrengst van ongeveer 60%van het aanwezige eiwit en een isolaat met een eiwit gehalte van ongeveer 98%.
135

Samenvatting
Vervolgens, zijn de individuele eiwit fracties biochemisch en structureel gekarakteriseerd onder verschillende omstandigheden (pH, ion-sterkte, temperatuur) die relevant zijn bij de voedselproductie (hoofdstuk 3 en 4). Hoofdstuk 3 geeft een gedetailleerde studie weer naar de invloed van de pH en ion sterkte op de structuur en oplosbaarheid van heliantinine. Verder is de temperatuur stabiliteit van eiwit onderzocht. De oplosbaarheid van heliantinine als een functie van de pH, laat een klokvormige curve zien met een minimum bij ongeveer pH 5 (I = 30mM). Bij hoge ion sterkte (I = 250mM) is helianthinine bij pH < 5 bijna onoplosbaar. De resultaten die gepresenteerd worden in hoofdstuk 3 laten ook zien dat de quaternaire structuur van heliantinine verandert onder de gebuikte omstandigheden. Afhankelijk van pH, ion sterkte, temperatuur en eiwit concentratie, komt heliathinine voor in de 15-18 S-vorm (hoog molecuul gewicht aggregaat), de 11S-vorm (hexameer), de 7S-vorm (trimeer) of de 2-3S-vorm (monomeer). Dissociatie van de 11S-vorm naar de 7S-vorm neemt gradueel toe met toenemende pH van 5.8 naar 9. Waarden van pH boven pH 7 en hoge ion sterkte (I = 250mM) stabiliseren de 11S vorm van helianthinine. Dissociatie van helianthinine verder dan 7S-vorm; naar de monomere vorm (2-3S), vindt plaats bij lage pH of hoge temperatuur. De 11S- en 7S-vorm van helianthinine verschillen in hun secundaire structuur (7S heeft een hoger gehalte aan niet gestructureerde eiwitketens), tertiaire structuur en in thermische stabiliteit (7S heeft een lagere denaturatie temperatuur). DSC metingen laten zien dat helianthinine bij pH 3 zich in een gedenatureerde en gedissocieerde vorm bevindt, wat in overeenstemming is met de oplosbaarheids studies. De DSC-profielen van helianthinine bij pH 8.5 vertonen twee endothermische pieken bij temperaturen van ongeveer 65°C en 90°C, welke de denaturatie van respectievelijk de trimere en de hexamere vorm van helianthinine aangeven. Verder vertoonden de DSC-profielen van de monomere vorm van helianthinine ook twee endotherme transities met identieke denaturatie temperaturen, wat duidt op het bestaan van twee populaties van monomeren. De resultaten beschreven in dit hoofdstuk leiden tot de hypothese dat helianthinine twee verschillende conformaties kan aannemen: één vorm met een denaturatie temperatuur van 65 °C en één met een denaturatie temperatuur van 90 °C. Hoofdstuk 4 laat een studie zien naar de invloed van de pH en ion sterkte op de structuur en oplosbaarheid van SFAs. Ook is de invloed van de temperatuur op de structuur van SFAs bestudeerd. Verder is de oplosbaarheid van het zonnebloem isolaat bekeken en worden de resultaten hiervan bediscussieerd aan de hand van haar belangrijkste eiwit componenten. De natieve structuur van SFAs blijkt als functie van de pH stabiel te zijn bij pH veranderingen tussen pH 3 en 9 en gedurende hitte behandeling (tot 100 °C). De oplosbaarheid van SFAs wordt slechts marginaal beïnvloed door de pH en ion sterkte en de oplosbaarheid van het zonnebloem isolaat als een functie van de pH blijkt gedomineerd te worden door helianthinine.
Vervolgens zijn er functionaliteittesten uitgevoerd onder dezelfde condities als die gebruikt zijn bij de studies beschreven in hoofdstuk 3 en 4. In hoofdstuk 5 worden
136

Samenvatting
de emulsie eigenschappen van het zonnebloem isolaat, alsmede van gezuiverd helianthinine en SFAs en combinaties hiervan bestudeerd. Ook werd de invloed van hitte behandeling en verschillende pH’s en ion sterkten bekeken. De emulsies werden gekarakteriseerd wat betreft gemiddelde druppel grootte, eiwit belading, en het voorkomen van druppel aggregatie en/of coalescentie. Zonnebloemeiwitten blijken stabiele emulsies te vormen, met uitzondering van SFAs bij alkalische en neutrale pH. Druppel aggregatie vindt plaats in emulsies gemaakt van SI, helianthinine en SFAs.
Deze druppelaggregatie blijkt echter niet te leiden tot coalescentie behalve voor emulsies gemaakt met SFAs bij neutrale pH. Druppel-aggregatie, gevolgd door coalescentie, van emulsies gemaakt van SFAs kon worden voorkomen bij pH 3. Reconstitutie experimenten (pH 7) laten zien dat een toename in SFAs gehalte, verslechtering van de emulsie eigenschappen tot gevolg heeft. Calcium blijk druppel-aggregatie te veroorzaken van emulsies gemaakt met helianthinine bij neutrale en alkalische pH. Hitte en zuur behandelingen hebben een verbetering van de emulsie eigenschappen tot gevolg. Dit is in overeenstemming met andere studies, die aangetoond hebben dat behandelingen, die een toename van de conformationele flexibiliteit van eiwitten tot gevolg hebben, leiden tot een verbetering van de emulsie eigenschappen, op voorwaarde dat deze eigenschappen niet leiden tot versterkte eiwit aggregatie en precipitatie. In hoofdstuk 6 zijn de schuimeigenschappen van SI als ook van helianthinine, SFAs en combinaties hiervan beschreven bij verschillende pH’s en ion sterkten of nadat ze een hitte behandeling ondergaan hebben. Deze testen tonen aan dat er minder schuim gevormd wordt met helianthinine dan met SFAs. Schuim gemaakt met helianthinine is echter stabieler tegen Ostwald vergroving en drainage dan schuim gemaakt met SFAs. Schuim gemaakt van SFAs vertoont coalescentie en een hoge mate van drainage. Bij pH 8 en pH 3 zijn de schuimeigenschappen van helianthinine beter dan bij pH 7. Daarentegen zijn de schuimeigenschappen van SFAs en SI minder afhankelijk van de pH. Een toename in ion sterkte resulteert in een verbetering van de schuimeigenschappen van helianthinine, met name bij pH 7 en pH 8. Deze toename heeft slechts kleine effecten op de schuimeigenschappen van SI en SFAs.
De vorming en stabiliteit van de schuimen die gemaakt zijn van gereconstitueerde mengsels van beide eiwitten en van SI, laten het vernietigende effect van SFAs op de schuim stabiliteit en drainage zien. De gevormde hoeveelheid schuim neemt echter wel toe met toenemende hoeveelheid SFAs. De stabiliteit tegen Ostwald vergroving neemt toe na hitte en zuur- behandeling van heliantinine. Gedeeltelijke ontvouwing van zonnebloem eiwitten, waarschijnlijk resulterend in een toename van de structurele flexibiliteit, verbetert het functioneren van de eiwitten aan het lucht/water oppervlak.
Hoofdstuk 7 bediscussieert de resultaten die beschreven zijn in de voorafgaande hoofdstukken in een breder en algemener perspectief. Verder worden er additionele resultaten beschreven om een beter beeld van de eigenschappen van zonnebloem
137
Samenvatting
eiwitten te verkrijgen. In deze context worden de in dit proefschrift gebruikte defenolisatie methoden vergeleken op basis van (1) de effectiviteit in het verwijderen van CGA, (2) het vermijden van eiwit denaturatie en (3) eiwit opbrengst. Vervolgens worden de overeenkomsten in eiwitstructuur tussen heliantinine en soja glycinine belicht, en wordt een model voor de quaternaire structuur van heliantinine aangedragen. Verder wordt het oplosbaarheidgedrag van heliantinine en haar quaternaire structuur, na veranderingen in pH, gepresenteerd, wat laat zien dat de quaternaire structuur van helianthinine gemodificeerd kan worden met slechts beperkt verlies in oplosbaarheid. Wanneer dissociatie van heliantinine naar de monomere vorm heeft plaatsgevonden, wordt er, geen re-associatie waargenomen. Ook wordt de oplosbaarheid van heliantinine bij pH 8 in de aanwezigheid van lage (30-50 mM) concentraties calcium drastisch verminderd, terwijl SFA in oplossing blijft.
138

Resumen
Resumen
Las semillas de girasol se utilizan en la industria alimentaria como materia prima para la obtención aceite. Uno de los productos secundarios del proceso de extracción de aceite es la harina de girasol, la cual tiene un alto contenido proteico (40-50%) y por lo tanto constituye una atractiva fuente de proteínas. Además, las proteínas de girasol no contienen factores antinutritivos, como los inhibidores de proteasas, y la composición en aminoácidos esenciales cumple con el patrón de la Organización de las Naciones Unidas para la Agricultura y la Alimentación (FAO, siglas en inglés) con la excepción de lisina.
El gran número de publicaciones sobre el aislamiento de proteínas de girasol indica claramente las dificultades que presenta la obtención de una proteína de girasol de alta calidad. La extractabilidad de las proteínas de la harina de girasol depende principalmente de los procesos que han sido utilizados durante la extracción del aceite. Durante el proceso de extracción del aceite, las proteínas se pueden desnaturalizar, dando como resultado una harina de girasol con una proporción muy alta de proteínas insolubles. Esto trae como consecuencia que el principal uso de la harina de girasol sea como pienso para animales, si bien se han descrito otros usos, de menor importancia, en el enriquecimiento de alimentos (especialmente carne y derivados de la leche, bollería y productos que contienen pasta). Otra de las razones que dificulta el uso de las proteínas de girasol como ingrediente alimentario es la presencia de compuestos fenólicos, sobre todo de ácido clorogénico (CGA, iniciales en inglés). La interacción con los compuestos fenólicos puede afectar aspectos como la digestibilidad de la proteína y su funcionalidad, modificando la vida útil del producto y su estabilidad o incluso alterar sus propiedades organolépticas. Además, la presencia del ácido clorogénico produce un color oscuro (verde-marrón) en los productos que contienen proteínas del girasol. Por lo tanto, la eliminación de los compuestos fenólicos es una de los principales aspectos que condicionan la producción de derivados de proteínas de girasol. Por esta razón, además de evitar la desnaturalización de la proteína, otros dos criterios deben tenerse en cuenta a la hora de evaluar el proceso de extracción de la proteína: el rendimiento final y la minimización del contenido en compuestos fenólicos.
En el Capítulo 2 de esta tesis doctoral se describe un método para obtener un aislado de proteínas del girasol (SI, siglas en inglés) que cumple los criterios citados. Durante el aislamiento de la proteína, se monitorizó la cantidad de ácido clorogénico eliminado y la desnaturalización de la proteína. Los compuestos fenólicos fueron eliminados mediante extracción con metanol 80 % (v/v) antes de extraer la proteína a pH básico y posterior diafiltración. Mediante calorimetría diferencial de barrido (DSC, siglas en inglés) y el estudio de la solubilidad se determinó la ausencia de desnaturalización de la proteína durante este proceso. Los productos resultantes fueron caracterizados bioquímicamente y la presencia de compuestos proteína-CGA fue investigada. En contraste con lo que ha sido publicado previamente, CGA eluyó
139

Resumen
(cromatografía de exclusión) sin estar asociado con ninguna fracción de proteína. Las proteínas del girasol de la variedad estudiada resultaron estar compuestas por dos fracciones principales: 2S albúminas (SFAs, siglas en inglés) y heliantinina. El procedimiento descrito resultó en un rendimiento proteico del 60% con un contenido en proteína del 98%.
Una vez que los criterios arriba establecidos para el proceso de aislamiento fueron cumplimentados, las proteínas que constituyen el SI fueron caracterizadas (individualmente) bioquímica y estructuralmente bajo condiciones (pH, fuerza iónica, temperatura) relevantes en el tratamiento de alimentos. El Capítulo 3 presenta un estudio de la influencia del pH y la fuerza iónica en la estructura y solubilidad de la heliantinina. Además, su estabilidad térmica fue también estudiada. La solubilidad de heliantinina en función del pH muestra una curva con forma de campana con un mínimo aproximadamente a pH 5 (I = 30 mM). A una mayor fuerza iónica (I = 250 mM) la heliantinina resulto casi insoluble a pH < 5.
Los resultados presentados en el Capítulo 3 también muestran que la estructura cuaternaria de heliantinina esta modulada por varias condiciones. Dependiendo del pH, fuerza iónica, temperatura y concentración de proteína, heliantinina se puede encontrar en la forma 15-18S (agregado de alto peso molecular), forma 11S (hexámero), forma 7S (trímero) o forma 2-3S (monómero). La disociación de la forma 11S en la forma 7S incrementa gradualmente con el aumento del pH de 5.8 a 9. Una alta fuerza iónica (I = 250 mM) estabiliza la forma 11S de heliantinina a valores de pH mayores que 7. A pH ácido (pH < 3.5) y a altas temperaturas la heliantinina se disocia a su forma monomérica (2-3S). Las formas 11S y 7S de heliantinina difieren en su estructura secundaria y terciaria, y en su estabilidad térmica. Mediante DSC a pH 3 se determinó que heliantinina se encontraba desnaturalizada a este pH, en concordancia con las indicaciones obtenidas en los estudios de solubilidad. Los perfiles de DSC de heliantinina a pH 8.5 mostraron dos transiciones endotérmicas a temperaturas de 65 y 90 °C para la forma trimérica y hexamérica de heliantinina, respectivamente. Por otra parte, los perfiles de DSC de la forma monomérica también muestran dos transiciones endotérmicas a similares temperaturas de desnaturalización, sugiriendo la existencia de dos poblaciones de monómeros. Los resultados descritos en este capítulo llevan a la conclusión de que heliantinina puede adoptar dos estados conformacionales diferentes: un primer estado con una temperatura de desnaturalización de 65 °C y un segundo estado con una temperatura de desnaturalización de 90 °C. El Capítulo 4 presenta un estudio de la influencia del pH y la fuerza iónica en la estructura y solubilidad de SFAs. El efecto de la temperatura en la estructura de SFAs también fue objeto de estudio. Por otro lado, la solubilidad de SI se estudió en términos de sus principales componentes proteicos. La estructura nativa de SFAs resultó ser muy estable a cambios de pH en el rango de 3 a 9 y a cambios de temperatura (<100 °C). La solubilidad de SFAs apenas se vio afectada por el pH y la fuerza iónica. La solubilidad
140

Resumen
de SI en función del pH esta dominada por la heliantinina, con independencia de la fuerza iónica.
A continuación, se realizaron pruebas de funcionalidad bajo condiciones similares a las utilizadas en los estudios descritos en los Capítulos 3 y 4. De este modo, los resultados pueden ser interpretados en relación con el conocimiento obtenido de las propiedades estructurales de las las proteínas de girasol purificadas. Según anteriores publicaciones las proteínas de girasol tienen buenas propiedades en la formación de emulsiones y espumas, pero forman geles con poca consistencia. La mayoría de los estudios realizados hasta la fecha aportan poca o ninguna información concerniente a la estructura de las proteínas bajo las condiciones utilizadas, y las pruebas de funcionalidad se realizan con productos de proteínas de los cuales el grado de desnaturalización no es conocido. Por lo tanto, se dispone de poca información sobre las propiedades funcionales de cada proteína individualmente y sobre la relación entre la estructura y funcionalidad de las mismas. En el Capítulo 5 las propiedades emulsificantes de SI, tanto como de heliantinina, SFAs y combinaciones de las mismas fueron estudiadas a diferentes fuerzas iónicas y valores de pH, así como después de tratamiento térmico. Las emulsiones se caracterizaron con respecto al tamaño medio de partícula (gota de aceite), concentración de proteína adsorbida (Γ) y la presencia de coalescencia y/o agregación de partículas. Las proteínas de girasol formaron emulsiones estables, a excepción de SFAs a pH neutro y alcalino. La agregación de partículas se puso de manifiesto en emulsiones preparadas con SI, heliantinina y SFAs; sin embargo, la coalescencia fue baja, excepto en SFAs a pH neutro y alcalino. La agregación de partículas y subsiguiente coalescencia en emulsiones preparadas con SFAs pudo ser prevenida a pH 3. Los experimentos de reconstitución (pH 7) mostraron que un aumento en el contenido en SFAs resulta en un empeoramiento de las propiedades emulsificantes. También se describe cómo la presencia de iones calcio causa agregación de partículas en emulsiones estabilizadas con heliantinina a pH neutro y alcalino. Tratamientos con calor o en medio ácido, mejoraron las propiedades de las emulsiones. Estos resultados están de acuerdo con otros estudios en los que se muestra que tratamientos que implican un incremento en la flexibilidad conformacional de las proteínas producen una mejora de las propiedades emulsificantes, siempre que estos tratamientos no impliquen una extensiva agregación y precipitación de las proteínas. En el Capítulo 6 se estudia la formación y estabilización de espumas preparadas con SI, heliantinina, SFAs y combinaciones de las mismas a diferentes valores de pH, fuerza iónica, y después de tratamiento térmico. Estos experimentos mostraron que se forma menos espuma a partir heliantinina que de SFAs, pero que la primera es más estable frente a la maduración de Ostwald y al drenaje que la segunda. Las espumas preparadas con SFAs experimentaron coalescencia y un elevado grado de drenaje. A pHs 8 y 3 las propiedades de la espuma de heliantinina fueron mejores que a pH 7. Por el contrario, las propiedades de la espuma de SFAs y SI se vieron menos afectadas por
141

Resumen
el pH. Un incremento en fuerza iónica resultó en una mejora de las propiedades de la espuma de heliantinina, sobretodo a pH alcalino y neutro. Este incremento fue mínimo en las espumas preparadas con SI y SFAs.
La formación y estabilidad de las espumas hechas a partir de mezclas reconstituidas de ambas proteínas y de SI mostraron el efecto negativo de SFAs en la estabilidad de la espuma y su drenaje. Sin embargo, el volumen de la espuma aumentó con mayores cantidades de SFAs. En el caso de heliantinina, la estabilidad de la espuma frente a la maduración de Ostwald aumentó tras tratamiento térmico y a pH acido. El desplegamiento parcial de la estructura de las proteínas probablemente resulta en un aumento de la flexibilidad estructural, mejorando la actuación de la proteína en la interfase aire/agua. Además, se observó que la proteína disponible se utiliza ineficientemente, ya que sólo un 20% se incorpora a la espuma. En el Capítulo 7 se tratan algunos de los resultados descritos en esta tesis, de una manera más amplia y general. Por otro lado, se describen algunos resultados adicionales para complementar lo expuesto en otros capítulos. A este respecto, los métodos de defenolización utilizados en este estudio se comparan sobre la base de su efectividad para eliminar CGA, la ausencia de desnaturalización y el rendimiento proteico. A continuación, se comparan las similitudes entre heliantinina y glicinina de soja con respecto a la estructura de la proteína y se propone un modelo para la estructura cuaternaria de la heliantinina. Además, se estudia la solubilidad de heliantinina y su estructura cuaternaria tras sucesivos cambios de pH. En este sentido se encontró que una vez que la heliantinina se disocia a su forma monomérica, no se observa reasociación bajo ninguna de las condiciones en las cuales heliantinina es soluble. También se describe como la solubilidad de heliantinina a pH 8 disminuye drásticamente en presencia de bajas concentraciones de calcio (30-50 mM), mientras que la solubilidad de SFAs no se ve afectada. Para poder usar proteínas de una manera efectiva en un amplio rango de productos alimentarios (emulsiones y/o espumas), es fundamental entender los mecanismos bioquímicos y físicos que contribuyen a su funcionalidad. La investigación descrita en esta tesis aporta conocimiento sobre la relación entre proteínas del girasol, su estructura y sus propiedades funcionales en función de factores extrínsecos como pH, fuerza iónica y temperatura. La flexibilidad y el tamaño molecular parecen ser factores determinantes de las propiedades emulsificantes y espumantes de las proteínas del girasol.
142

Acknowledgements
Acknowledgements
Finally, after more than four years, this dissertation comes to an end and I will have time to enjoy other aspects of life. During the past years I have worked at two different places, the ATO and the Laboratory of Food Chemistry, having the opportunity to meet many interesting people. Without them, it would never have been possible to complete this thesis. Thanks to all of you for your help, support, advice and encouragement.
I would like to thank my (co-) promotors Fons Voragen and Harry Gruppen for giving me the opportunity to join to the Laboratory of Food Chemistry and for their patience, kindness and valuable suggestions. Harry, your remarks and comments were always the fine tuning of my work. I owe special thanks to my supervisor Gerrit van Koningsveld always available and willing to help and discuss any point of the research. I do appreciate all our friendly arguments and your encouragement. Thank you very much for your good guidance and exploited patience.
I am deeply grateful to my ATO supervisors, Johan Vereijken and Karin Merk. Johan, thanks for your indispensable help in writing the project proposal for the Marie Curie Grant. Without you this thesis would not be here. Despite your full agenda, you always found time to give me a hand. I am really grateful to you for that. Karin, thanks for making me feel at home from the beginning. You led my first steps and taught me how to organise in an efficiently “Dutch” way. Your constructive criticisms about my work, often difficult to deal with, and your kindness and clever suggestions were priceless to finish this thesis.
During the time at ATO, I have worked with, and share lab or office with a large number of people, impossible to name here, to whom I am very grateful. I am thankful to Cristina and Wim (family Mulder) for their friendship and support. Many thanks to Brigit, Nicole, Dinie, Jaap and Louise for their help in the lab. Thanks to all those friends I was lucky to meet during my stay at ATO. Thank you very much Andrea, Diego and Susana (Domino partners), Matteo, Carlota, Pierre, Maarten, Ana García, Ana López, Asun, Sonia, Tanouja, Patrick, Claudia, Francesc, Michael, Antonio, Marit, Isabel, Erick, Martijn, Harry, José, Ana Levin, Miguel, Leyre…and all the others…
To all my colleagues of the Laboratory of Food Chemistry who kindly integrated me as another colleague and helped with everything I needed. I can not forget the nice time that I have spent with all of you: Bas, Karin, Francesca, Lynn, Chen, Nathalie, Rene, Wil, Julia, Sandra, Catriona, Marianne, Margaret, Jolan, Jolanda, Jan B, Jan C, Florence, Kerensa, Toos, Hauke, Bram, Renate, Peter I, Peter Z, Rene, Joris, Jean-Paul, Harmen, Henk, Stéphanie G, Marcel, and many more… Thanks to all my office colleagues and in particular to Laurice and Stéphanie Prigent for their valuable aid, friendship, patience and availability to help me at any time. Many thanks go also to the technicians and junior scientists for all their precious help, especially Ben van den Broek. Bedank, Annemarie and Karin, voor de vertaling.
143

Acknowledgements
Gracias Diego y Juan Maté por ayudarme con la traducción. I very much appreciate the practical help from the people of the Food Physics
and Physical Chemistry & Colloid Sciences labs and in particular to Anton Korteweg, Franklin Zoet, Harry Baptist and Katja Grolle.
I am thankful also to Willem van Nieuwenhuyzen for his kindness and interesting information regarding the oil extraction process.
I can not forget my friends in Spain. They still keep wondering what I am really doing in Holland. Thanks for your patience to listen to my boring and redundant stories. Thanks to Manolo (Telmo), Eva, Javi, Marta, Nuria, Juan, Tonin, Luis Mariano, Javi Bocos, Javi primo, Sandra, Belén, Rodrigo, Rocío, Carlos, Alfonso, Roberto, Nati, Ángela, María José, Albertito, Natalie, Arantxa y alguno que otro del que me acordaré luego.
My deepest gratitude is for my girlfriend, Laura, for your patient, support, love and even technical support with graphs, translation and formatting. You have been always close to me to keep my spirit high in difficult moments (hard task!) and waiting for me after the evenings and weekends of work with the most beautiful smile.
And the last but not the least, I would like to thank my family, specially my parents, my sister Raquel and my brother Pablo. My last words are for my grandparents: Narcisa (although she can not read them anymore), Obdulia and Mariano. Abuelitos, por fin he acabado de estudiar! Ya veis lo que me ha costado escribir este pequeño librito…un abrazo. Sergio
144

Curriculum Vitae
Curriculum Vitae
Sergio González Pérez was born on March 25th 1971 in Santander (Cantabria, Spain). In 1993 he completed the first cycle of the “Licenciatura” in Chemistry at the University of Valladolid and afterwards he followed the second cycle of the degree in Food Sciences. In June 1995 he graduated, obtaining his “Licenciatura” by the University of Burgos. He continued his education at the Faculty of Agricultural and Applied Biological Sciences, Gent University (Belgium), where in 1996 he obtained the degree of Master in Food Science and Technology. During his Master’s thesis he studied the effects of high pressure on whey proteins and on lipolysis of cheese-curd. Subsequently he moved to Wageningen (The Netherlands), funded by COMETT grant, and he was involved in a project dealing with the quality of frozen food products at the former Agrotechnological Research Institute (ATO), now Agrotechnology and Food Innovations B.V. In 1998, back to Spain, he worked at Pajariel (meat company, Leon), at the Technological Meat Institute (Salamanca) and at the Automation, Robotic, Information and Production Technologies Centre (CARTIF, Valladolid). In 1999 he started his PhD thesis at ATO sponsored by a Marie Curie Fellowship. This research was continued at the Laboratory of Food Chemistry of Wageningen University from January 2002 until August 2003, and the results obtained are described in this thesis.
From October 2003 Sergio works as a post-doc at the Department of Bio-Organic Chemistry, University of Utrecht (The Netherlands).
145


The research described in this thesis was performed at the Laboratory of Food
Chemistry, and at the former Agrotechnological Research Institute (ATO), now Agrotechnology and Food Innovations B.V., of Wageningen University and Research Centre, The Netherlands; and was financially supported by the European Community (FAIR-CT 98-5030) and the laboratories mentioned above.
The study was part of the research programme of the Graduate School VLAG (Food Technology, Agrobiotechnology, Nutrition and Health Sciences).