Embed Size (px)
Citation preview
THE PHYSICO-CHEMICAL PROPERTIES OF
SUPRAMOLECULAR SYSTEMS INVOLVING
PHARMACEUTICALS AND ANIONS
By Maan Abdulrazzaq Suwiad Al-Nuaim
A Thesis is Submitted for the Degree of Doctor of Philosophy
Thermochemistry Laboratory
Department of Chemistry
Faculty of Engineering and Physical Sciences
University of Surrey, United Kingdom
January, 2016
© Maan Abdulrazzq Suwaid Al-Nuaim

Abstract
iii
Abstract
Currently, the discharge of pollutants to the environment is considered one of the biggest problems
challenging chemists and environmental scientists. These pollutants come from different sources and
might be carcinogenic, toxic or radioactive compounds which can cause serious health hazards to
humans, animals and plants. Intensive thermodynamic studies by Danil de Namor and co-workers in
the Thermochemistry Laboratory indicated that functionalisation of calix[4]pyrroles, cyclodextrines
and calix[n]arenes ( n=4,6 ) leads to the production of selective macrocyclic receptors for the removal
of anions, toxic heavy metals and other pollutants from water. The objective of this thesis is to
design, synthesise and characterise macrocyclic receptors with suitable functional groups for the
selective removal of drugs and anions from water. The drugs selected for this study are diclofenac,
sodium diclofenac, clofibric acid, carbamazepine, aspirin and ibuprofen. This selection is based on the
fact that these drugs are extensively used and as a result these contaminate sewage, surface and ground
water. Supramolecular chemistry is one of the most important areas of chemistry which offers many
advantages due to the efficient, fast and economical way for removing pollutants from water. In this
thesis a large number of macrocycles based on calix[4]arene, calix[4]pyrrole resorc[4]arene and
pyrogalol[4]arene have been synthesised and characterised by 1H NMR and microanalysis. From these
receptors those based on cyclodextrin and calix[4]arene derivatives have been selected for sodium
diclofenac while for drugs containing carboxylic acids in their structure, a partially substituted
calix[4]arene amine was selected for further investigations involving these drugs. These interactions
were assessed in solution by several techniques such as 1H NMR titration, UV-Visible, conductivity,
isothermal titration calorimetry. In the solid state, thermogravimetry and differential scanning
calorimetry were explored. The extraction of these pharmaceuticals by some of these macrocycles
under different conditions is reported. The importance of fundamental studies in searching for
applications is demonstrated where the selectivity of the calix[4]arene amine for these drugs is shown
in the extraction process. Modified silica with amino functional groups is explored for extracting
aspirin from water. Preliminary research on the efficiency of pyrogallol[4]arene and resorcine[4]arene
to work as molecular containers for selected drugs were tested by 1H NMR Two novel calix[4]pyrroles
were investigated for complexation with halides and phosphates showing their selectivity for
phosphates relative to halides. Final conclusions are given as well as suggestions for further work
particularly with the new oligomeric material which has been characterised by various techniques
which are FTIR, XRD, SEM, BET analysis

Acknowledgement
Acknowledgements
I am greatly indebted to my supervisor Professor Angela F. Danil de Namor for her supervision,
guidance, dedication and patience in the writing of the present thesis and for her kind husband Dr.
Melhem Namor for his encouragement.
I would like to thank my co-supervisor Prof. J. Varcoe for his help and support, Prof. B. Howlin
for his help in the chemical modelling and interesting interpretations.
I would also like to thank Prof. I. Cunningham for his great advice given by me during the research
period.
I wish to thank all academic staff in the Chemistry Department at the University of Surrey for their
help and encouragement.
Also, I wish to say special thank you to all my colleagues in the Thermochemistry Laboratory,
Oliver, Abdel, Weam, Adnan, Adhwa, Nawal and Rachida for their help and for sharing their
scientific knowledge.
Also, I would like to thank the technical staff in the Chemistry Department at the University of
Surrey, Judith, V. Dokova, Dave, Graham, Dan, Deryck, Nikki and Qinmin.
Also, I should to thank my colleagues in the College of Pharmacy in Basra University/ Iraq.
I would like to thank the Ministry of Higher Education & Scientific Research in Iraq for the
financial support for this research through the College of Pharmacy in the University of Basra.
Finally, I have to say thank you for all the members of the Iraqi Cultural Attachee in London
specially Prof. Mousa Al-Mousawi and Dr. Fadwaa Al-Saffar for their help and support

Dedication
Dedication
To My Father& Mother with love

Table of Contents
Table of Contents……………………………………………………………...Page
1. Chapter I Introduction………………………………………………………………………1
1.1 Supramolecular Chemistry…………………. ……………………………………...................2
1.2 Pharmaceuticals, phosphate and halides in the environment…………………………………...3
1.2.1 Occurrence of pharmaceuticals in the aquatic environment………………………………3
1.2.2 Phosphate and halides in aquatic environment………………………………….………..5
1.3 Classification of macrocyclic receptors…………………………..…………………...……….6
1.3.1 Naturally occuring macrocycles……………...……………………..................................6
1.3.2 Synthetic macrocyclic receptors (crown ethers, cryptands, spherands and pillarenes)…..8
1.4 Calix[4]arenes………………………………………..…………………………………........15
1.4.1 Properties and conformations of calix[4]arene………………..…………………...........17
1.4.2 Lower Rim functionalisation of Calix[4]arenes……………………………………........20
1.4.3 Upper rim functionallisation of calix[4]arene…………………………………………...25
1.4.4 Applications of Calixarenes and derivatives…………………………………………….29
1.5 Calix[4]pyrrole…………………………………………………………..…………......…….30
1.5.1 Calix[4]pyrrole conformations……………………..……………..……………….........31
1.5.2 Functionalisation of calix[4]pyrrole…………………………………………………….32
1.5.2.1 Functionalisation of C-rim (β-position)….……………….………………………..32
1.5.2.2 Functionalisation of N-rim………………………………………….……………..34
1.5.2.3 Functionalisation of meso position……………………………….………………..34
1.5.3 Application of calix[4]pyrrole………...…………………………….……………..........39

Table of Contents
1.6 Resorcin[4]arene……………………………………………………….…………………….40
1.7 Pyrogallol[4]arene…………………………………………..………….……………..……...45
1.8 The use of silica based compounds for extraction purposes......................................................48
1.8.1 Click chemistry………………………………………………………………………….51
1.9 BET theory…………………………………………………………………………………...53
1.10 Aims of the thesis………………………………………………………...………………….53
2. Chapter two: Experimental Part…………………………………………………………….60
2.1 List of abbreviation…………………………………………………………………………...61
2.2 Chemicals…………………………………………………………………………………….63
2.2.1 Solvents used in this work……………………………………………………………….63
2.2.2 Deuterated solvents used for the 1H NMR…………………………………………........64
2.2.3 Pharmaceuticals……………………………………………………………………........64
2.2.4 Analytical reagents……………………………………………………………...............65
2.2.5 Purification of solvents………………………………………….....................................66
2.2.6 Instruments used………………………………………………………………………...67
2.3 Solubility measurements……………………………………………………………………..68
2.3.1 Solubility of selected pharmaceuticals in different organic solvents at 298.15 K………..68
2.3.2 Calibration curve for the determination of the solubility of pharmaceuticals………........69
2.3.3 Solubility of selected pharmaceuticals…………………………………………………..69
2.4 Determination of partition coefficients of selected drugs in water-1-octanol solvent system...69
2.5 Synthesis of receptors………………………………………………………………………...70

Table of Contents
2.5.1 Synthesis and characterization of heptakis-(6-chloro-6-deoxy)--cyclodextrin…...........70
2.5.2 Synthesis of heptakis-(2, 3, 6-tri-O-benzoyl)--cyclodextrin…………………………...71
2.5.3 Synthesis of 5, 11, 17, 23-tert-butyl-25, 26, 27, 28-(oxy-ethylethanoate)calix[4]arene....71
2.5.4 Synthesis of 5, 11, 17, 23-tetra-p-tert-butyl-25, 27-bis(2-cyanomethoxy)-26, 28-
dihydrocalix[4]arene CA-(CN)2 ……………….……………………………………………..73
2.5.5 Synthesis of 5, 11, 17, 23-tetra-p-tert-butyl-25, 27-bis(2-cyanomethoxy)-26, 28-
dihydrocalix[4]arene CA-(NH2)2………………………………………………......................73
2.5.6 Synthesis of 25, 26, 27, 28-tetrahydroxycalix[4]arene………………………………….74
2.5.7 Synthesis and characterisation of 5- tert-butyl-3-azidomethyl-2-hydroxybenzaldehyde.75
2.5.8 Synthesis and characterisation of 5-tert-butyl-2-hydroxybenzaldehyde………………...75
2.5.9 Synthesis and characterisation of 5-tert-butyl-3-chloromethyl-2-hydroxybenzaldehyde.76
2.5.10 Synthesis of 5-tert-butyl-3-azidomethyl-2-hydroxybenzaldehyde……………….........76
2.5.11 Synthesis and characterisation of 25, 27-dihydroxy-26, 28-dioxypropargyl-tert-
butylcalix[4]arene………………………………………………………….............................76
2.5.12 Synthesis and Characterization of azido calix[4]arene ………………………………...77
2.5.13 Preparation of 2-azidoacetamide……………………………………............................78
2.5.14 Synthesis of 25, 26, 27, 28-(diethylamino) ethoxy calix[4]arene……………................79
2.5.15 Synthesis of meso-tetramethyl-tetrakis-(4-hydroxyphenyl ethyl)calix[4]pyrrole……..80
2.5.16 Synthesis of meso-tetramethyl-tetrakis-(4-ethylacetatophenoxyethyl)calix[4]pyrrole
TTECP…………………………………………………………………………………..........81
2.5.17 Polymerisation of meso-tetramethyl-tetrakis-[2-(4- hydroxyphenyl)ethyl] calix

Table of Contents
ix
[4]pyrrole (CPPOL)…………………………………………………………….....................82
2.5.18 Synthesis of 2, 8, 14, 20-tetra-pentyl-resoc[4]arene(4,6, 10, 12, 16, 18, 22-
octahydroxyl, 2, 8, 14, 20-tetrapentylcalix[4]arene…………..….............................................82
2.5.19 Esterfication of C-pentyl resorcin[4]arene……………………………………………..83
2.5.20 Synthesis of C-pentylpyrogallol[4]arene…………………………………....................85
2.5.21 Synthesis of C-decylpyrogallol[4]arene………………………………………….........86
2.5.22 Synthesis of C-4-aminophenyl pyrogallol[4]arene……………………………….........87
2.6 Solubility measurements of the receptor……………………………………………………...87
2.7 1H NMR measurements…………………………………………………………………........88
2.8 Conductometric measurements…………………………………………………………........88
2.8.1 Detrmination of the conductivity cell constant…………………………………….........89
2.8.2 Conductometric titrations at 298.15 K…………………………………………………..90
2.9 Nano Isothermal Titration Calorimeter ITC…………………………………………………..90
2.9.1 Calorimetric measurements...…………………………………………………………...91
2.9.2 Calibration of the Nanocalorimeter………………………………………......................91
2.10 Determination of the stability constant and the composition of host-guest complex by UV-
Vis, 1H NMR and calorimetric titrations………………………………………………................92
2.11 General procedure for the determination of optimum amount of the receptor for the uptake
of targeted adsorbate from aqueous solution at 298.15 K…………………………......................94
2.11.1 Effect of the amount of material on the extraction of pharmaceuticals…………………94

Table of Contents
2.11.2 Effect of pH on the extraction………………………………………………………….95
2.11.3 Kinetics of removal of pharmaceuticals by macrocycles and Sil-NH2……………........95
2.12 Thermal Properties measurements TGA and DSC…………………………..........................95
3. Chapter III ………………………………………………………………………………...99
3.1 Solubility of drugs in different solvents……………………………………………………..100
3.1.1 Solubility of sodium diclofenac in different solvents…..................................................100
3.1.2 Solubility of carbamazepine (CBZ) in different solvents…………………………........103
3.2 Determination of the partition coefficient for diclofenac, clofibric acid and carbamazepine in
the water-1-octanol solvent system…………………………………………………………….104
3.3 Complex formation of sodium diclofenac NaDF and per-benzoylated--cyclodextrine……106
3.3.1 1H NMR complexation studies………………………………………………………...106
3.3.2 Photophysical properties of the host-guest complex…………………………..……….107
3.4 Conductometric measurements……………………………………………………………..110
3.4.1 Determination of the conductivity cell constant………………………………………..110
3.4.2 Conductometric measurements of sodium diclofenac with p-tert-butylcalix[4]arene
tetraester in acetonitrile at 298.15 K……………………………..………………..................110
3.5 Complexation studies of sodium diclofenac with per-benzoylated-β-cyclodextrin in 1-octanol
using Nano-Isothermal titration calorimetry Nano-ITC………………………………...............111
3.5.1 Calibration of the Nano-Isothermal Titration Calorimeter Nano-ITC……………........111
3.6 Determination of the thermodynamic parameters of complexation of sodium diclofenac with
Table of Contents
xi
heptakis-( 2, 3 , 6-tri-O-benzoyl)-ß-cyclodextrin in 1-Octanol at 298.15 K……..........................115
3.7 Complexation studies of sodium diclofenac and 5, 11, 17, 27-tert-butyl-25, 26, 27, 28-(oxy
ethylethanoate)calix[4]arene CAE…………………………………….......................................117
3.7.1 1H NMR complexation studies ………………………………………………………...117
3.7.2 Conductometric measurements of sodium diclofenac with 5, 11, 17, 27-tert-butyl-25,
26, 27, 28-(oxy-ethylacetate)calix[4]arene (CAE) in acetonitrile at 298.15 K……………...119
3.7.3 Investigation of the complexation between diclofenac sodium and 5, 11, 17, 27- tert-butyl
-25, 26, 27, 28-(oxy-ethylacetato)calix[4]arene by thermogravimetric analysis TGA&DSC.120
3.8 Removal of sodium diclofenac from water by using calix[4]arene tetraester from water……125
3.8.1 Determination of the optimum amount of calix[4]arene tetraester for the uptake of
sodium diclofenac from aqueous solution at 298 K……………………………………........125
3.8.2 Determination of the capacity of calix[4]arene tetraester to uptake NaDF from aqueous
solution at 298.15 K……………………………………………………………………........126
3.8.3 Determination of the effect of pH solution on the uptake of calix[4]arene ester to
uptake sodium diclofenac NaDF from aqueous solution at 298 K…......................................128
3.9 Complexation studies of CA-(NH2)2 and pharmaceuticals……………………………….....129
3.9.1 1H NMR complexation studies of diclofenac, clofibric acid, aspirin and ibuprofen with
the 5, 11, 17, 23-tetra-tert-butyl-25, 27-bis-(aminoethoxy)-26, 28-dihydroxycalix[4]arene in
CD3CN at 298 K……………………………………..............................................................129
3.9.2 Investigation of the complexation of the pharmaceuticals with CA-(NH2)2 in acetonitrile
by conductance measurements……………………………………………………………...134

Table of Contents
xii
3.9.2.1 Conductometric measurements for the pure receptor CA-(NH2)2 in acetonitrile at
298.15 K……………………………………………….....................................................134
3.9.2.2 Conductometric titration studies of diclofenac and CA-(NH2)2 in acetonitrile
at 298.15 K………………………………………………………………………………135
3.9.2.3 Conductometric titration studies of clofibric acid with CA-(NH2)2 in MeCN
at 298.15 K……………………………………………………………………………...136
3.9.2.4 Conductometric titration of aspirin with CA-(NH2)2 in acetonitrile at 298.15 K...137
3.10 Photophysical properties of the drug bindings……………………………………………..138
3.10.1 UV- Vis titration of diclofenac with calix[4]arene amine in acetonitrile at 298 K…….138
3.10.2 UV-Vis titration of clofibric acid with calix[4]arene amine in MeCN at 298 K………140
3.10.3 UV-Vis titration of aspirin with calix[4]arene amine in acetonitrile at 298 K…...........142
3.11 Thermodynamic parameters of complexation of pharmaceuticals with CA-(NH2)2 receptor
in acetonitrile at 298.15 K……………………………………………………………………….143
3.12 Investigation of the interaction between diclofenac, clofibric acid and aspirin with CA-(NH2)2
by using thermogravimetric analysis TGA and differential scanning calorimetry DSC………...150
3.13 Extraction of clofibric acid and diclofenac from water by CA-(NH2)2……………………..152
3.13.1 The effect of mass on the extraction of clofibric acid from water……………….........152
3.13.2 The effect of pH of the aqueous solution on the extraction of clofibric acid from water
by CA-(NH2)2 at 298.15 K……..…………………………………………………………….154
3.13.3 Calculation of the capacity of the CA-(NH2)2 receptor to extract clofibric acid………154
3.14 Extraction of aspirin from water by CA-(NH2)2……………………………………………155
Table of Contents
xiii
3.15 Aspirin removal by 3-aminopropyl functionalized silica………………………..…………156
3.15.1 Dose effect………………………………………………………………………........157
3.15.2 Effect of pH of the aqueous solution on the removal of aspirin by Sil-NH2 …………..158
3.15.3 Kinetic of removal………………………………………………………………........159
3.15.4 Determination of the capacity of Sil-NH2 for the removal of aspirin from water at
298 K………………………………………………………………………………………...159
3.16 Complexation of C-decylpyrogallol[4]arene with carbamazepine.......................................161
3.16.1 Investigation of the complexation of PG11 and CBZ by thermal analysis……………161
4. Chapter IV…………………………………………………………………………………..166
4.1 Meso-tetramethyl-tetrakis-[2-(4-hydroxyphenyl)ethyl]calix[4]pyrrole TTHCP and meso-
tetramethyl-tetrakis-[2-(4-ethylacetatophenoxy)ethyl]calix[4]pyrrole TTCP…………………167
4.1.1 Characterization of meso-tetramethyl-tetrakis-[2-(4-hydroxyphenyl) ethyl]
calix[4]pyrrole……………………………………………………………………………….168
4.1.2 Solubility of TTHCP in various solvents at 298.15 K…………………………….........168
4.1.3 Complexation of TTHCP with anions, 1H NMR studies……………………………….170
4.2 Conductometric titrations of anion salts with TTHCP in acetonitrile at 298.15 K…………...172
4.2.1 Conductance measurements of meso-tetramethyl-tetrakis-[2-(4-hydroxyphenyl) ethyl
with TTHCP in acetonitrile at 298.15 K…………………………………………………….172
4.2.2 Conductance measurements for the complexation of dihydrogen phosphate
Bu4NH2PO4 with TTHCP in acetonitrile at 298.15 K………………………………………173
4.3 Thermodynamic parameters for the complexation of TTHCP with fluoride and phosphate
Table of Contents
xiv
anions (tetra-n-butylammonium counter ion) in acetonitrile at 298.15 K……………………….174
4.4 Polymerisation of meso-tetramethyl-tetrakis-[2-(hydroxyphenyl)ethyl]calix[4]pyrrole……178
4.5 Characterisation of Novel meso-tetramethyl-tetrakis- meso-tetramethyl-tetrakis-(4-
ethylacetatophenoxlethyl) calix[4]pyrrole TTECP……………………………………………..180
4.5.1 Solubility measurements of meso-tetramethyl-tetrakis-(4-ethylacetatophenoxyethyl)
calix[4] pyrrole (TTECP)…………………………………………………………………..181
4.6 1H NMR complexation studies……………………………………………………...............182
4.7 Conductance measurements for the complexation of meso-tetramethyl-tetrakis-(4-
Ethylacetatophenoxlethyl) calix[4]pyrrole TTECP with the halides and phosphate anion
(tetra-n-butylammonium counter-ion)……………………………………………………….....183
4.7.1 Conductance measurements of TTECP and Bu4NF in acetonitrile at 298.15 K………..183
4.7.2 Conductometric titrations of chloride (Bu4N+ as counter-ion) with TTECP in
acetonitrile at 298 K……………………………………………………………………........184
4.7.3 Conductometric titration of tetra-n-butylammonium bromide (Bu4NBr) with TTECP
in acetonitrile at 298.15……………………………………………………………………...185
4.7.4 Conductometric titration of tetra-n-butylammonium phosphate (Bu4NH2PO4) with
TTEC in acetonitrile at 298.15 K…………………………………………………................185
4.7.5 Thermodynamic parameters of complexation of meso-tetramethyl-tetrakis-[4-ethylace
-tatophenoxyethyl) calix[4]pyrrole TTECP with fluoride, bromide and phosphate anions
(tetra-n-butylammonium as counter-ion) in acetonitrile at 298.15 K………………………..186
5. Final conclusions…………………………………………………………………………….193

Table of Contents
xv
6. Suggestions for Further work………………………………………………………………197
7. Referencess………………………………………………………………………………….198
8. Appendix…………………………………………………………………………………….214
List of Figures
List of Figures…………………………………………………………………………..…page
Chapter one
Fig. 1.1 Dynamic elements of the host-guest complexation process……………………………….2
Fig. 1.2 Schematic representation of ………………………………………………………………4
Fig. 1.3 (a) Molecular structure of -cyclodextrin (b) -CD in a “Cone” shape…………………...7
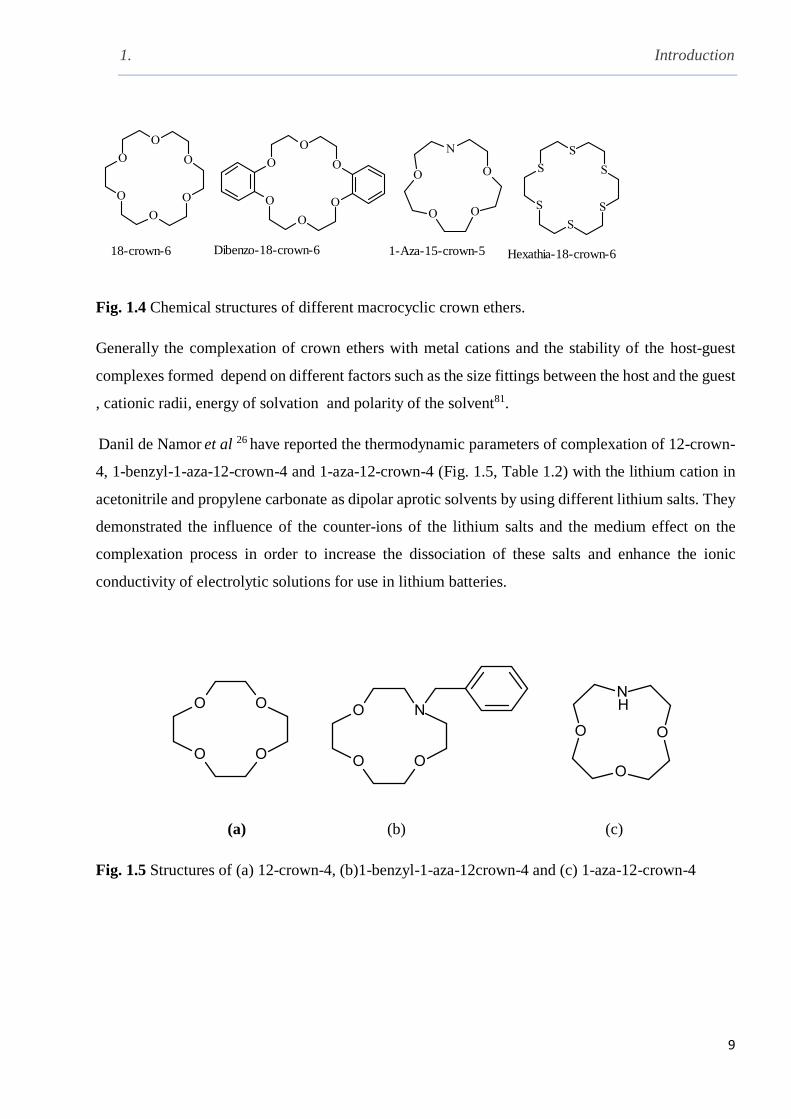
Fig. 1.4 Chemical structures of different macrocyclic crown ethers……………………………….9
Fig. 1.5 Structure of (a) 12-crown-4 (b) 1-benzyl1-aza-12-crown-4 and 1-aza-12-crown-4………9
Fig. 1.6 Complexation reaction of guanidinium ion by 27-crown-9……………………………...11
Fig. 1.7 The structure of the receptor synthesised by Müllen and co-workers………....................13
Fig. 1.8 Chemical structure of the tri-aza-cryptand receptor containing a fluorophore……….…..14
Fig. 1.9 Chemical structure of the spherands……………………………………………………..14
Fig. 1.10 Images of (a) Greek Calyx Crater and (b) molecular modelling of p-tert-butyl calix[4]-
aren showing the similarity between the Greek vase and the caix[4]arene………………………..16
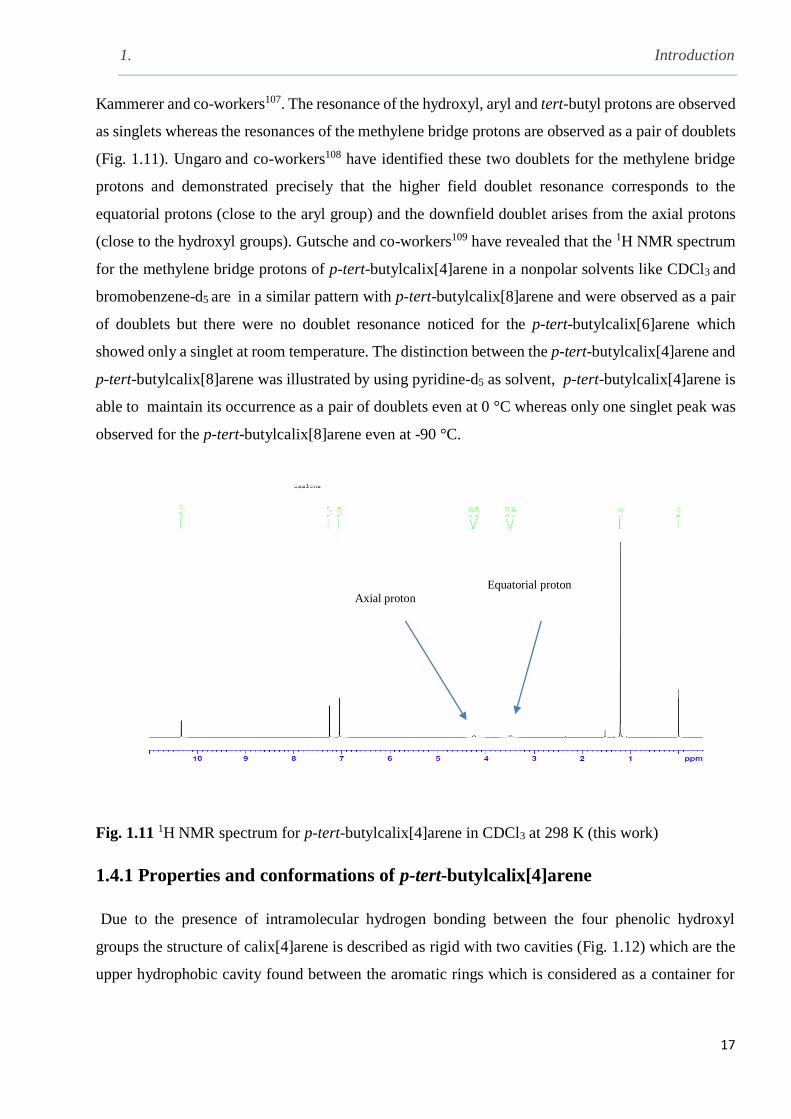
Fig. 1.11 1H NMR spectrum for p-tert-butylcalix[4]arene in CDCl3 at 298 K (this work)………..17
Fig. 1.12 The upper and lower rim of p-tert-butyl calix[4]arene……………………………….....18
Fig. 1.13 Possible conformations of p-tert-butylcalix[4]arene…………………………………...19
Fig. 1.14 Patterns of signals expected in the (a) 1H NMR and (b) 13C NMR spectra of the four
conformational isomers of calix[4]arene………………………………………………………....20
Fig. 1.15 Lower rim functionalised p-tert-butylcalix[4]arene with ester and ketone groups…….21
Fig. 1.16 Chemical structure of 5, 11, 17, 23-tetra-tert-butyl-25, 26, 27, 28-tetrakis (N, N-diethyl
aminocarbonyl) methoxy calix[4]arene ……………………………………………………….…23

List of Figures
Fig. 1. 17 Chemical structure of p-tert-butylcalix[4]arene functionalised with phosphine oxide...23
Fig. 1.18 Chemical structure of receptors used for the complexation of lanthanides cations …….24
Fig. 1.19 Chemical structure of (a) bis-calix[4]arene and (b) methyl viologen …………………..24
Fig. 1.120 Functionalisation of the upper rim of calix[4]arene by urea and the formation of
dimeric structure when an appropriate guest is present ………………………………..................25
Fig. 1.21 Chemical structure of sulfonated calix[4]arene ………………………………………..26
Fig. 1.22 “Bis-Sulfonated” calix[4]arene as a molecular capsule………………………………...26
Fig. 1.23 Chemical structure of p-phosphonic acid calix[4]arene ………………………………..27
Fig. 1.24 Lower and upper rim functionalized calix[4]arene …………………………………….27
Fig. 1.25 Chemical structure of amphiphilic calix[4]arene and the aggregation to form vesicle …28
Fig. 1.26 The chemical structure of double cavity p-tert-butylcalix[4]arene …………………….28
Fig. 1.27 Immobilizing calix[4]arene derivative on the gold nanoparticle surface ………………29
Fig. 1.28 Four different conformations adopted by calix[4]pyrrole ……………………………...31
Fig. 1.29 Conformational changes of calix[4]pyrrole to a “cone” conformation up on anion
complexation (A=F, Cl, Br) ………………………………………………………...................31
Fig. 1.30 Different active positions for functionalization of calix[4]pyrrole …………………….32
Fig. 1. 31 Different products with different substituents at β-position on the pyrrole ring of the
calix[4]pyrrole …………………………………………………………………………………...33
Fig. 1.32 Functionalisation of meso-octamethylcalix[4]pyrrole through the N-rim ……………..34
Fig. 1.33 Chemical structure of the synthesised receptor containing acetoxy group at meso……..34

List of Figures
Fig. 1.34 Structure of meso-tetramethyl[N-(phenoxyethyl)-N-phenylurea]calix[4]pyrrole……...35
Fig. 1.35 Chemical structure of the calix[4]pyrrole functionalised by sulphur …………………..36
Fig. 1.36 Functionalised meso position of calix[4]pyrrole ……………………………………….36
Fig. 1.37 Calix[4]pyrrole as ion transporter across the membrane ……………………………….38
Fig. 1.38 Formation supramolecular polymer during the addition of excess amount of caesium…39
Fig. 1.39 General structure of resorcin[4]arene showing (a) the numbering of substituent and (b)
hexameric aggregation in solution ……………………………………………………………….41
Fig. 1.40 Possible conformations can adopted by resorcin[4]aren cyclic tetramer ………………42
Fig. 1.41 Structure of 4, 6, 10, 12, 16, 18, 22, 24-diethyl thiophosphate calix[4]resorcarene …….43
Fig. 1.42 Showing bridging the hydroxyl groups of the resocin[4]arene by different groups ……44
Fig. 1.43 2, 8, 14, 20-tetraalkyl-5, 11, 17, 23-tetrahydroxyresorc[4]arene showing the numbering
of substituent positions …………………………………………………………………………..46
Fig. 1.44 Chemical structures of xanthan and C-alkyl pyrogallol[4]arene ……………………….47
Fig. 1.45 Molecular modelling of carceplex ……………………………………………………..47
Fig. 1.46 Chemical structure of 5, 11, 17, 23-tetrakis-[(diethylamine)ethoxy]calix[4]arene and its
immobilisation …………………………………………………………………………………...50
Fig. 1.47 The chemical structure of (a) the receptor used for the complexation and (b) 1-naphthyl
methylcarbamate…………………………………………………………………………………50
Fig. 1.48 The chemical structures of synthesised receptors………………………………………58
Fig. 1.49 The chemical structures of synthesised receptor………………………………………..59
Chapter III………………………………………………………………………………………99

List of Figures
Fig. 3.1 1H NMR spectrum for the complex resulted from the complexation of sodium diclofenac
and per-benzoylated--cyclodextrin in DMSO-d6 at 298 K…………………………………….107
Fig. 3.2 UV-Vis spectra for the titration of sodium diclofenac solution in 1-octanol…………....108
Fig. 3.3 Plot of [Bz--CD] [NaDF]/ A-A] against the concentration of the receptor …………..109
Fig. 3.4 A plot of molar conductance of sodium diclofenac in 1-butanol against the ligand/ drug
concentration ratio at 298.15 K………………………………………………………………….111
Fig. 3.5 Isothermal titration calorimetry for the complexation of 18-crown-6 (1× 10⁻³ mol dm-3)
with BaCl2 (1.5 × 10⁻² mol dm-3). The curve shows the change in enthalpy after each injection as
a result of complexation………………………………………………………………………...114
Fig. 3.6 Isothermal titration calorimetry for the complexation of sodium diclofenac and Bz--CD
in 1-octanol at 298.15 K. Top: the heat evolved after each addition of sodium diclofenac to the
receptor solution and bottom plotted against the molar ratio……………………………………116
Fig. 3.7 1H NMR spectrum for the complexation of p-tert-butylcalix[4]arene tetraeseter with
NaDF in CD3CN at 298 K. The lower spectrum for the receptor and the upper for the Complex..118
Fig. 3.8 A plot of molar conductance against the receptor/ drug concentration ratio for the system
involving p-tert-butylcalix[4]arene tetraester and sodium diclofenac in MeCN at 298 K………119
Fig. 3.9 TGA Thermogram for pure sodium diclofenac………………………………………...121
Fig. 3.10 TGA Thermogram analysis curve as it is obtained for p-tert-butylcalix[4]arene ester122
Fig. 3.11 TGA Thermogram for the complex formed between NaDF and the CAE receptor…...122
Fig. 3.12 TGA curves for the sodium diclofenac NaDF, CAE and the complex formed………...123
Fig. 3.13 DSC Thermogram of the sodium diclofenac………………………………………….123

List of Figures
Fig. 3.14 DSC Thermogram for CAE receptor………………………………………………….124
Fig. 3.15 DSC analysis for the complex formed between NaDF and CAE……………………...124
Fig. 3.16 The effect of mass on the uptake of NaDF from aqueous solution by CAE at 298 K…..126
Fig. 3.17 Uptake isotherm for sodium diclofenac from aqueous solution by CAE at 298.15 K…127
Fig. 3.18 The effect of pH on the on the diclofenac sodium uptake by 5, 11, 17, 27- tert-butyl-
25, 26, 27, 28-(oxy-ethylacetato) calix[4]arene (CAE)…………………………………………129
Fig. 3.19 Chemical structure of the receptor and diclofenac, clofibric acid, aspirin …………….130
Fig. 3.20 The chemical shift changes for the 5,11,17,23 tetra-tert-butyl, 25, 27-bis[aminoethoxy],
26, 28- dihydroxycalix[4]arene upon addition of diclofenac against the [drug]/ [receptor]
concentration ratios in CD3CN at 298 K………………………………………………………...133
Fig. 3.21 Chemical shift changes for the 5, 11, 17, 23 tetra-tert-butyl, 25, 27-bis[aminoethoxy],
26, 28-dihydroxycalix[4]arene upon addition of clofibric acid against the [drug]/ [receptor]
concentration ratios at 298 K……………………………………………………………………133
Fig. 3.22 Conductivity curve of the pure receptor in order to test it if it is undergoing to ionisation
or not in acetonitrile at 298.15 K………………………………………………………………...134
Fig. 3.23 Change in molar conductance resulting from the addition of receptor against the
[receptor]/ [drug] concentration ratio in acetonitrile at 298.15 K……………………………....136
Fig. 3.24 Change in molar conductance resulting from addition of the receptor against the
[receptor]/ [clofibric acid] concentration ratio in acetonitrile at 298.15 K……………………..137
Fig. 3.25 Conductance changes of aspirin solution in dry acetonitrile as a result from the gradual
addition of calix[4]arene amine against the [receptor]/ [drug] concentration ratios at 298.15 K...138
List of Figures
Fig. 3.26 UV- Vis titration of diclofenac in acetonitrile showing the increase in the absorbance
bands intensity resulting from the addition of CA(NH2)2 at 298 K……………………………...139
Fig. 3.27 Plot of the absorbance of the diclofenac against the [receptor]/ [diclofenac] concentration
ratios in acetonitrile at 298 K……………………………………………………………………140
Fig. 3.28 UV-Vis titration spectrum of clofibric acid in acetonitrile (3.35×10⁴) showing the
increase in the absorbance bands resulting from the gradual addition of increasing concentration
of CA-(NH2)2 solution in acetonitrile at 298 K…………………………………………………141
Fig. 3.29 Plot of the absorbance of clofibric acid in acetonitrile against [receptor]/ [drug]
concentration ratios at 298 K……………………………………………………………………141
Fig. 3.30 UV-Vis spectra of aspirin solution in acetonitrile (2.99×10⁴) resulting from gradual
addition of CA(NH2)2 solution in acetonitrile at 298 K………………………………………….142
Fig. 3.31 Variation in absorbance values of aspirin resulting from addition of increasing
concentration of the receptor at 298 K…………………………………………………………..143
Fig. 3.32 Top is the base line editor; bottom is the titration curve resulted from the injection of the
aspirin in acetonitrile into the cell containing 1mM of the receptor at 298.15 K………………...146
Fig. 3.33 Top is the base line; bottom is the titration curve for the interaction of clofibric acid with
calix[4]amine in acetonitrile at 298.15 K………………………………………………………..147
Fig. 3.34 Top is the base line, bottom is the titration curve for the interaction of diclofenac with
calix[4]amine in acetonitrile at 298.15 K………………………………………………………..148
Fig. 3.35 Molecular modelling of the interaction of diclofenac with calix[4]aren amine………..149
Fig. 3.36 Molecular modelling of the interaction of clofibric acid and calix[4]arene amine…….149
List of Figures
Fig. 3.37 Molecular modelling of the interaction of aspirin and calix[4]arene (CA-NH2)2……...150
Fig. 3.38 TGA thermograms for diclofenac (DF), CA-(NH2)2 and the complex………………...151
Fig. 3.39 TGA thermogram for the complexation process between CA-(NH2)2 and the receptor.151
Fig. 3.40 TGA thermogram for the complexation of aspirin with CA-(NH2)2…………………..152
Fig. 3.41 The effect of receptor dose on the uptake of clofibric acid from aqueous solution ……153
Fig. 3.42 The effec of pH on the extraction of clofibric acid by CA-(NH2)2 at 298 K……………154
Fig. 3.43 The capacity of the calix[4]arene amine towards clofibric acid……………………….155
Fig. 3.44 Extraction of aspirin from water by CA-(NH2)2 at 298 K……………………………...156
Fig. 3.45 Effect of the mass of Sil-NH2 on the uptake of aspirin from aqueous solution at 298 K158
Fig. 3.46 Effect of pH of the aqueous solution on the extraction of aspirin from water by Sil-
NH2…………………………………………………………………………………..................159
Fig. 3.47 Capacity of Sil-NH2 to uptake aspirin from aqueous solution at 298 K………………..160
Fig. 3.48 TGA thermogram of C-decylpyrrogallol[4]arene receptor…………………………...162
Fig. 3.49 TGA thermogram for the complex formed between C-decylpyrogallol[4] and CBZ…163
Fig. 3.50 TGA thermogram for the complex of C-decylpyrogallol[4]arene and CBZ…………..163
Fig. 3.51 DSC thermogram of for the carbamazepine showing structural phase transition……...164
Fig. 3.52 DSC thermogram for C-decylpyrogallol[4]arene……………………………………..164
Fig. 3.53 DSC thermogram to the complex between C-decylpyrogallol[4]arene and CBZ……..165
Chapter IV……………………………………………………………………………………..166
Fig. 4.1 Chemical structure of novel calix[4]pyrrole derivatives (a) meso-tetramethyl-tetrakis-
[2(4-hydroxyphenyl) ethyl]calix[4]pyrrole TTHCP and meso-tetramethyl-tetrakis-[2-(4
List of Figures
ethylacetato-phenoxy) ethyl] calix[4]pyrrole TTECP…………………………………………..167
Fig. 4.2 1H NMR spectrum for meso-tetramethyl-tetrakis-(4-hydroxyphenyl ethyl) calix[4]pyrrole
TTHCP in DMSO-d6……………………………………………………………………………168
Fig. 4.3 1H NMR spectrum of TTHCP and its fluoride complex (Bu4N+ as counter ion in DMSO-
d6 at 298 K………………………………………………………………………………………170
Fig. 4.4 1H NMR spectrum for the complex formed between meso-tetramethyl-tetrakis-(4-hydroxy
phenyl ethyl) calix[4]pyrrole TTHCP and tetra-n-butylammonium phosphate (Bu4NH2PO4) at 298
K in DMSO-d6…………………………………………………………………………………..171
Fig. 4.5 Conductometric titrations of TTHCP against Bu4NH2PO4 in acetonitrile at 298.15 K…173
Fig. 4.6 Conductivity titration between TTHCP and tetrabutylammonium phosphate Bu4NH2PO4
in acetonitrile at 298.15 K, [TTHCP] = 9.99×10⁻⁴, [Bu4NH2PO4] = 9.4 × 10⁻⁵ mol dm-3………...174
Fig. 4.7 Isothermal titration calorimetry for the complexation of TTHCP with fluoride (tetra-n-
butylammonium counter ion) in acetonitrile at 298.15 K……………………………………….175
Fig. 4.8 Isothermal titration calorimetry for the complexation of phosphate (tetra-n-
butyl-ammonium counter in acetonitrile at 298.15 K…………………………………………...176
Fig. 4.9 SEM analysis for the polymer showing the porosity in the structure in different region..178
Fig. 4.10 Shows the X-ray diffractogram of the polymer. It is characteristic of an amorphous
compound with little or, no crystal structure…………………………………………………….179
Fig. 4.11 EDS spectrum of the polymer formed………………………………………………...179
Fig. 4.12 1H NMR spectrum of meso-tetramethyl-tetrakis-[4-(oxy-ethylethanoato)-phenyl]ethyl
calix[4]pyrrole TTHCP in DMSO-d6 at 298 K………………………………………………….180

List of Figures
Fig. 4.13 Conductometric titrations of fluoride (Bu4N+ as counter-ion) with TTECP in acetonitrile
at 298.15 K……………………………………………………………………………………...183
Fig. 4.14 Conductometric titration curve of TTECP [9 × 10⁻⁴ mol dm-3] against tetra-n-butylammo-
nium chloride Bu4NCl in [1.09 104 mol dm-3] in acetonitrile at 298.15 K…………………….184
Fig. 4.15 Conductometric titration of tetra-n-butylammonium bromide (Bu4NBr) with TTECP in
acetonitrile at 298.15 K…………………………………………………………………………185
Fig. 4.16 Molar conductance of Bu4NH2PO4 against the [TTECP]/ [H2PO4] concentration ratios
in acetonitrile at 298.15…………………………………………………………………………186
Fig. 4.17 Nano-isothermal titration calorimetry of the interaction of fluoride (Bu4NF as counter ion
and CP-tetraester in acetonitrile at 298.15 K……………………………………………………188
Fig. 4.18 Nano-isothermal titration calorimetry of the Interaction of CP-tetraester with Bu4NCl
in acetonitrile at 298.15 K……………………………………………………………………….189
Fig. 4.19 Nano isothermal titration calorimetry for the interaction of the calix[4]pyrrole ester CP-
tetraester and Bu4NB in acetonitrile at 298.15 K, top, is the baseline editor, and bottom is the
titration curve…………………………………………………………………………………...190
Fig.4.20 Nano isothermal titration calorimetry for the complexation of Bu4NPO4 with TTECP in
acetonitrile at 298.15 K…………………………………………………………………………191

List of Scheme
xxv
List of Scheme………………………………………………………………....Page
Scheme 1.1 Synthetic pathway of cryptand 222...............................................................................8
Scheme 1.2 Synthetic pathway of pillar[5]arene receptor………………………………...….......10
Scheme 1.3 Synthesis of p-tert-butylcalix[4]arene……………………………………………....16
Scheme 1.4 De-alkylation and upper rim functionalization of p-tert-butylcalix[4]arene………...25
Scheme 1.5 Synthesis of meso-octamethylcalix[4]pyrrole………………………………………30
Scheme 1.6 Complexation of ions in different sites of calix[4]pyrrole…………………………...38
Scheme 1.7 Synthesis pathway of resorcin[4]arene……………………………………………...40
Scheme 1.8 Synthetic rout for the cavitands……………...………………………………………43
Scheme 1.9 Synthesis of the carcerands and the encapsulation of guest to form carceplex………44
Scheme 1.10 Synthesis of hemicarcerand and showing the formation of hemicarceplex and the
possibility of the guest to leave the cavity…………………………………...................................45
Scheme 1.11 Synthesis of pyrogallol[4]arene macrocycle……………………………………….45
Scheme 1.12 Polymerisation of Silicic acid……………………………………………………...48
Scheme 1.13 Modification of silica by (a) organic functional group, (b) inorganic groups………49
Scheme 1.14 Using of Silica as solid support for functionalised p-tert-butylcalix[4]arene………51
Scheme 1.15 Uncatalysed and catalysed azide-alkyne cycloaddition reaction…………………..52
Scheme 1.16 Proposed mechanism for catalysed azide-alkyne cycloaddition reaction…………..52
Scheme 1.17 Main strategy for this research……...……………………………………………..55
Chapter two……………………………………………………………………………………..61

List of Scheme
xxvi
Scheme 2.1 Synthesis of heptakis-(6-chloro-6deoxy)-β-cyclodextrin…………………………...70
Scheme 2.2 Synthesis of heptakis-( 2, 3 , 6-tri-O-benzoyl)-ß-cyclodextrin………………............71
Scheme 2.3 Synthesis of 5, 11, 17, 27-tert-butyl-25, 26, 27, 28-(ethylacetoxy)calix[4]arene …...72
Scheme 2.4 Synthesis of 5, 11, 17, 23 tetra- tert -butyl, 25, 27 bis[2-cyanomethox] methoxy, 26,
28- dihydroxycalix[4]arene………………....................................................................................73
Scheme 2.5 Synthesis of 5, 11, 17, 23 tetra-tert-butyl, 25, 27-bis[aminoethoxy],26, 28
dihydroxycalix[4]arene…………………………………………………………………………..74
Scheme 2.6 Synthesis 25, 26, 27, 28-tetrahydroxycalix[4]arene..………………………………..74
Scheme 2.7 Synthesis and characterization of 5-tert-butyl-3-azidomethyl-2-hydrox-
benzaldehyde …………………………………………………………………………………….75
Scheme 2.8 Preparation of 25, 27-dihydroxy-26, 28-(dioxypropargyl)tert-butylcalix[4]arene.…77
Scheme 2.9 preparation of 4-tert-butyl-azidocalix[4]arene………………………………………78
Scheme 2.10 Preparation of 2-azidoacetamide……………………………………………..........78
Scheme 2.11 Synthesis of 25, 26, 27, 28-(diethylamino)ethoxy calix[4]arene…………………...79
Scheme 2.12 Synthesis of meso-tetramethyl-tetrakis-(4-hydroxyphenylethyl)calix[4]pyrrole….80
Scheme 2.13 Synthesis of meso-tetramethyl-tetrakis-(4-ethylacetato-oxyphenylethyl) calix[4]pyrrole….81
Scheme 2.14 Synthesise of calix[4]pyrole polymer…………..………………………………….82
Scheme 2.15 Synthesis of C-pentyl-resorcin[4]arene……………………………………………83
Scheme 2.16 Synthesis of C-pentylresorci[4]arene ester…………………………………...........84
Scheme 2.17 Synthesis of C-pentylpyrogallol[4]arene…………………………………………..85
Scheme 2.18 Synthesis of C-decylpyrogallol[4]arene PG11…………………………………….86

List of Scheme
xxvii
Scheme 2.19 Synthesis of C-4-aminophenyl pyrogallol arene…………………………………...87
Scheme 3.1 The standard reaction between BaCl2 and 18-crown-6 ether in aqueous media……112
Scheme 3.2 The oxidation of the sodium diclofenac causes cyclisation to sodium diclofenac….121

List of Tables
xxviii
List of Tables……………………………………………………………………………...Page
Table 1.1 Physicochemical properties of , , -cyclodextrine…………………………………...7
Table 1.2 Stability constants expressed as log Ks and derived standard Gibbs energies (∆cG)
enthalpies (∆cH), and entropies (∆cS) of complexation of crown ethers (12-crown-4 (12-C-4)
and 1-Benzyl-1-aza-12-crown-4 (1-BA-12-C4) and lithium (using salts containing different
anions)in MeCN and in propylene carbonate at 298.15 K………………………………………..10
Table 1.3 Thermodynamic parameters of complexation of amino acids with 18-crown-6 in
methanol at 298.15………………………………………………………………….....................12
Table 1.4 Thermodynamic parameters for the complexation of (a) p-tert-butylcalix[4]arene
tetraester and (b) p-tert-butylcalix[4]arene ketone with bivalent cations in acetonitrile using
different techniques obtained by Danil de Namor and co-workers……………………………….22
Table 1.5 Thermodynamic parameters and stoichiometric ratios for the complexation of calix[4]
-pyrrole and functionalized calix[4]pyrrole at meso position with anions synthesized by Danil de
Namor and co-workers…………………………………………………………………………...37
Table 1.6 The chemical structure of pharmaceuticals with commercial and IUPAC names……..56
Chapter two……………………………………………………………………………………..60
Table 2.1 Different conditions used during TGA analysis……………………………………….97
Table 2.2 The conditions applied for DSC analysis……………………………………………...98
Chapter III……………………………………………................................................................99
Table 3.1 Solubility and standard Gibbs energies of solution of sodium diclofenac in different
solvent at 298.15 K………………………………………………………...................................101

List of Tables
xxix
Table 3.2 Solubility of carbamazepine CBZ in different solvents at 298.15 K and derived standard
Gibbs energies of solution and from water……………………………………………………...103
Table 3.3 Partition coefficients of drugs in the water-1-octanol system at 298.15 K…………..105
Table 3.4 Chemical shift changes for the NH proton of sodium diclofenac resulting from complex-
ation with per-benzoylated-B-cyclodextrin in DMSO-d6 at 298 K……………………………...107
Table 3.5 Molar conductance of an aqueous solution of potassium chloride KCl at 298.15 K for
the calculation of the cell constant, ……………………………………………………………110
Table 3.6 Thermodynamic parameters of complexation of barium with 18-crown-6 measured by
Nano-ITC in aqueous medium at 298.15 K……………………………………………………..113
Table 3.7 Thermodynamic parameters of complexation of the cyclodextrin derivative with sodium
diclofenac at 298.15 K in 1-octanol……………………………………………………………..115
Table 3.8 Chemical shift changes for the receptor protons as a result from the addition of sodium
diclofenac in CD3CN at 298 K…………………………………………………………………..118
Table 3.9 Effect of the amount of calix[4]arene tetraester on the extraction of sodium diclofenac
from aqueous solution at 298 K…………………………………………………………………125
Table 3.10 Illustrate the initial equilibrium and removed concentration of NaDF by CAE…….126
Table 3.11 Effect of pH on the extraction of sodium diclofenac at 298 K……………………..128
Table 3.12 1H NMR complexation study to check the affinity of the receptor to complex with the
Pharmaceuticals in CD3CN at 298 K……………………………………………………………132
Table 3.13 Thermodynamic parameters of the binding between the drugs and calix[4]arene

List of Tables
xxx
aminereceptor in acetonitrile at 298 K…………………………………………………………..145
Table 3.14 Drug concentration before and after the extraction, adsorbent used and extraction
Percentages……………………………………………………………………………………..153
Table 3.15 Initial and equilibrium concentration of aspirin before and after the extraction and the
percentages of extraction by CA-(NH2)2………………………………………………………..155
Table 3.16 Percentage of extraction of aspirin as a function of the dose of Sil-NH2 at 298 K… 157
Table 3.17 Initial, equilibrium and the capacity of silica to remove aspirin from water at 298 K160
Chapter IV……………………………………………………………………………………..166
Table 4.1 Solubility data and derived standard Gibbs energies of solution of TTHCP in different
solvents at 298.15 K. Transfer Gibbs energies from acetonitrile to other solvents is (∆tG°MeCNs2)
at 298.15 K……………………………………………………………………………………...169
Table 4.2 1H NMR chemical shifts () and chemical shift changes () of CPD protons upon
addition of fluoride, phosphate and bromide as tetra-n-butylammonium salts in DMSO-d6......171
Table 4.3The thermodynamic parameters for the interaction of meso-tetramethyl-tetrakis-(4-
hydroxyphenyl ethyl)calix[4]pyrrole TTHCP and phosphate, fluorid, chloride, as
tetrabutylammonium counter ion in acetonitrile at 298.15 K……………………………………177

1. Introduction
1
Chapter I
Introduction
1. Introduction
2
1.1 Supramolecular chemistry
Supramolecular Chemistry1,2 is a branch of chemistry which was made up from early ideas resulting
from the contributions on receptors by Ehrlich and Silverstin3, the coordination chemistry introduced
by Werner4 and the lock-key mechanism suggested by Fischer5. Great interest has been focused on
Supramolecular Chemistry since three scientists; Pederson6,7, Lehn8,9 and Cram10,11 were awarded
the Nobel Prize in Chemistry in 1987 for their work on crown ethers, cryptands and spherands
respectively. Supramolecular Chemistry is concerned with the reversible interactions between the
receptor molecule (host) bearing multiple recognition sites consisting of holes and cavities in their
structures for binding ions, radicals or neutral species (guests) leading to molecular aggregates with
supermolecular structures12-14. These aggregation processes are attributed to the combination of non-
covalent forces which are ion-dipole, ion-ion, dipole-dipole, cation-π, anion-π, van der Waals, π-π
interactions, and hydrogen bonding15-18. The perfect encapsulation of the guest in the cavity leads to
excellent complexation with high stability constant values. Thus the re-organization of the
conformation of the receptor molecule commonly leads to maximum strength of complexation19.
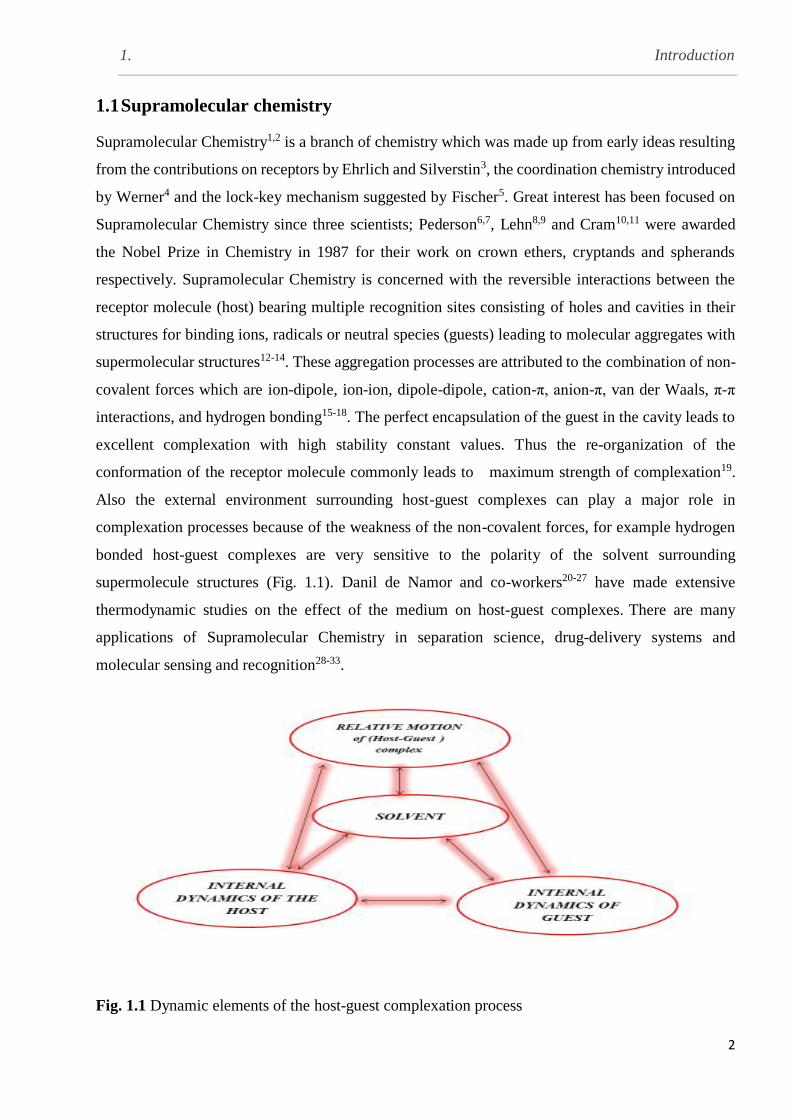
Also the external environment surrounding host-guest complexes can play a major role in
complexation processes because of the weakness of the non-covalent forces, for example hydrogen
bonded host-guest complexes are very sensitive to the polarity of the solvent surrounding
supermolecule structures (Fig. 1.1). Danil de Namor and co-workers20-27 have made extensive
thermodynamic studies on the effect of the medium on host-guest complexes. There are many
applications of Supramolecular Chemistry in separation science, drug-delivery systems and
molecular sensing and recognition28-33.
Fig. 1.1 Dynamic elements of the host-guest complexation process

1. Introduction
3
1.2 Pharmaceuticals, phosphate and halides in the environment
1.2.1 Occurrence of pharmaceuticals in the aquatic environment
In the last few years, contamination of water by a variety of pharmaceuticals has been gaining serious
concern by environmental scientists34-36. There are many sources for the pharmaceuticals to enter the
aquatic environment. These are as follows: (i) the use of various pharmaceuticals for treatment of
human and animals which are excreted as unchanged compounds or as metabolites entering the
aquatic environment as a result of inadequate treatment of wastewater in sewage treatment plants
(STPs); (ii) the discarding of unused pharmaceuticals via toilet; (iii) the discharge of residuals of
drugs manufacturers37-39. As a consequence of globally different regulations applied of drugs
marketing and manufacturing, different concentrations levels in different countries have been
diagnosed for many types of drugs in the analysed water samples and this come from that these
samples were collected from different regions in different countries. Some of these samples were
taken from the sewage treatment plants or from the water streams which are located near the effluents
of the hospitals or near the drug manufactories which have the higher risk to the environment.40
Up to date, few studies concerning the removal of these pollutants from water have been carried out.
Currently a number of techniques are used to treat wastewater such as powdered activated carbon,
ozonation, ultraviolet photolysis, zeolites, and reverse osmosis. However, powdered activated carbon
is not effective to remove many organic pollutants at low concentration level and also cannot be
recycled when the saturated point is reached. Oxidation by ozone is effective to remove most
pharmaceuticals from water but the toxicity of ozone and by-products resulting from this process has
implications on human health and the environment. Ultraviolet photolysis is not effective to remove
most pharmaceuticals from water. Zeolites also show low efficiency to remove organic pollutants.
Reverse osmosis is effective to remove most pharmaceuticals from water but this technology is
economically undesirable41-43.
As in oxidation by ozone, less promising experimental work has been reported by Jiang and co-
workers44-46 using ferrate (VI) as oxidizing agent for the removal of ciprofloxacin, ibuprofen,
sulfamethoxazole, diclofenac, carbamazepine and benzafibrate from water. The authors have
revealed that ferrate (VI) effectively degrades ciprofloxacine, diclofenac and carbamazepine, but it
is not effective to remove ibuprofen and benzafibrate. The limitations of this process were the doses
of ferrate (VI) required to complete the oxidation process, the large number of pharmaceuticals that
can resist the oxidation by ferrate (VI) and the undesirable oxidation products formed which can
1. Introduction
4
cause high impact on the environment. For example, more than half a dozen of oxidation products
were identified from the oxidation of ciprofloxacin by ferrate (VI) FeO42-.
Molecularly imprinted techniques47 were also used in the production of molecularly imprinted
polymers, MIPs, which are used for the removal of pharmaceuticals from water. MIPs are activated
synthetic polymers obtained from the introduction of a number of specific functional groups into a
polymer matrix which can enhance the specificity towards a template. These MIPs have gained much
interest due to their usage in many applications involving solid phase extraction, sensing, drug
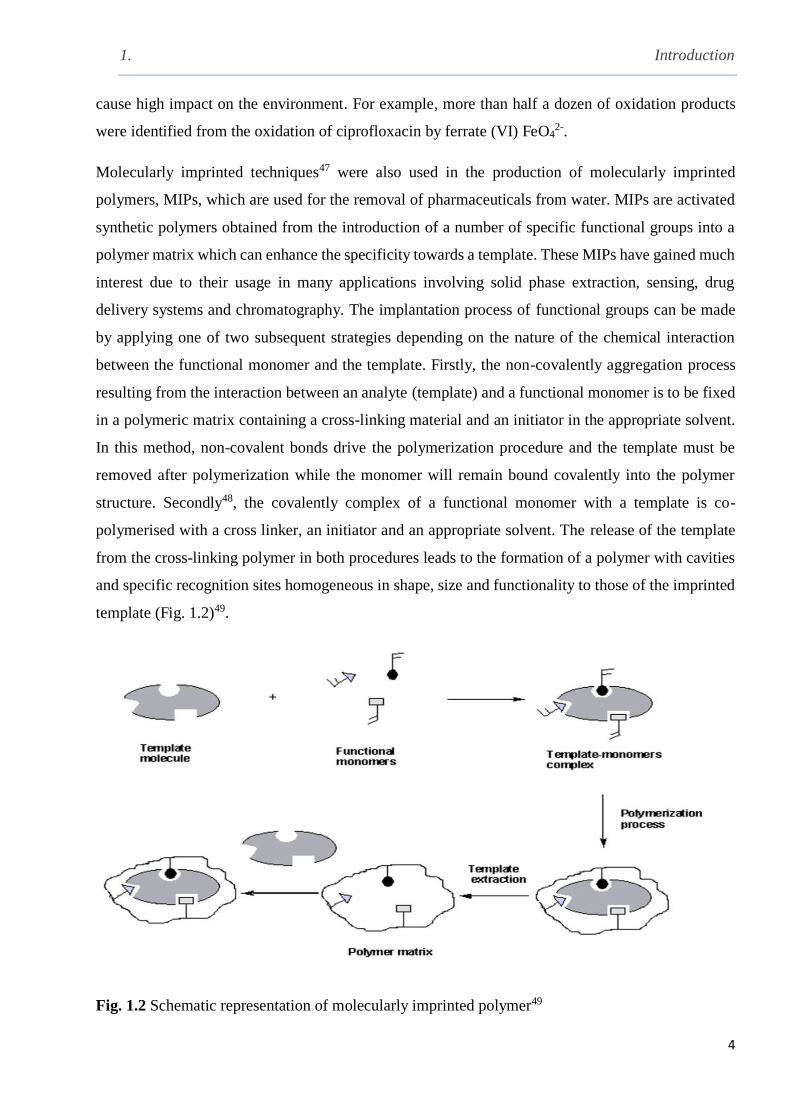
delivery systems and chromatography. The implantation process of functional groups can be made
by applying one of two subsequent strategies depending on the nature of the chemical interaction
between the functional monomer and the template. Firstly, the non-covalently aggregation process
resulting from the interaction between an analyte (template) and a functional monomer is to be fixed
in a polymeric matrix containing a cross-linking material and an initiator in the appropriate solvent.
In this method, non-covalent bonds drive the polymerization procedure and the template must be
removed after polymerization while the monomer will remain bound covalently into the polymer
structure. Secondly48, the covalently complex of a functional monomer with a template is co-
polymerised with a cross linker, an initiator and an appropriate solvent. The release of the template
from the cross-linking polymer in both procedures leads to the formation of a polymer with cavities
and specific recognition sites homogeneous in shape, size and functionality to those of the imprinted
template (Fig. 1.2)49.
Fig. 1.2 Schematic representation of molecularly imprinted polymer49

1. Introduction
5
Geissen et al 50 have demonstrated that the MIP synthesised by polymerisation of 2-vinylpyridine
monomer, ethylene glycol dimethacrylate as cross linker and azo-bis-isobutyronitrile as initiator in
the presence of diclofenac as template in toluene removes selectively diclofenac from water in the 3-
8 pH range
It has been emphasized that the use of a number of templates in the polymerization process can lead
to produce molecularly imprinted polymers with multiple active sites with different and effective
reactivity for the simultaneous removal of a number of materials without any reduction in their
efficiency.
C. Dai et al 51 have reported the use of the precipitation polymerisation process for the synthesis of
multi-templates MIP using ketoprofen, naproxen, clofibric acid, diclofenac and ibuprofen as
templates and demonstrated that these polymers are able to remove acidic pharmaceuticals effectively
in the 3-7 pH range and the removal process was found to be kinetically fast. Many drawbacks still remain in the removal of drugs by MIPs including the incarceration of targeted
materials in cavities which can make the long term clean-up process unrealistic or even economically
disappointing due to the large quantity of organic solvents utilised. Also, the use of an excess amount
of the monomer in the polymerisation process can lead to the presence of non-selective sites in the
polymeric matrix and can increase the density of monoliths which can also decrease the selective
interaction between the MIP and the targeted material. In addition to these drawbacks, the synthesis
of MIPs is considered to be rather tedious52,53.
Therefore, there is serious concern about the need to find an effective and economical method to
remove these organic pollutants from water. Supramolecular Chemistry can therefore be a suitable
strategy to overcome this problem. The reversible complexation of macrocylic receptors with
different types of anions, cations and neutral species via cooperative interactions through non-
covalent bonds may be a fast and an economical way for the removal of these pollutants from water
due to the possibility of recycling the host.
1.2.2 Phosphate and halides in the environment
The phosphate anion is a fundamental constituent in all living systems and plays crucial role in the
production of energy required to drive the biological reactions. It is also presents in fertilizers, product
metabolism, and traditional detergents. The presence of phosphates in a high concentration levels in
the environment leads to growing algae and can cause negative impact on the environment whereas
the variation of the concentration levels of phosphate in living cell reflects the biological activity and
1. Introduction
6
healthiness of these systems. For example, it is difficult to control phosphate levels in blood for
patients with kidney failure54. Another issue of considerable environmental concern is that related to
the presence of fluorides in water. Long-term exposure to high concentration levels of fluoride leads
to a number of health problems such as skeletal fluorosis, which is a health disorder related to the
building up of fluoride in the bones. This disease can cause joint stiffness and pain, and may result
in weak bones or fractures in older adults. Over the years, many studies have looked at the possible
link between fluoride and cancer. Most of the concern about cancer seems to be around osteosarcoma.
One theory on how fluoridation might affect the risk of the osteosarcoma is based on the fact that
fluoride is localised on the bones and can lead to cancer55-57. Probing and trapping these anions by
artificial supramolecular receptors is still challenging and therefore, it will be one of the main targets
in this project.
1.3 Classification of Macrocyclic receptors
Macrocyclic receptors can be divided into two classes; naturally occurring and synthetic
macrocycles58
1.3.1 Naturally occurring macrocycles
Some of the macrocycles can be considered as naturally occurring receptors. Representative
examples are valinomycin, chlorophyll, nigericin and cyclodextrin (CDs). Cyclodextrins (CDs) are
biosynthetic cyclic oligosaccharides first obtained by Villers through the enzymatic degradation of
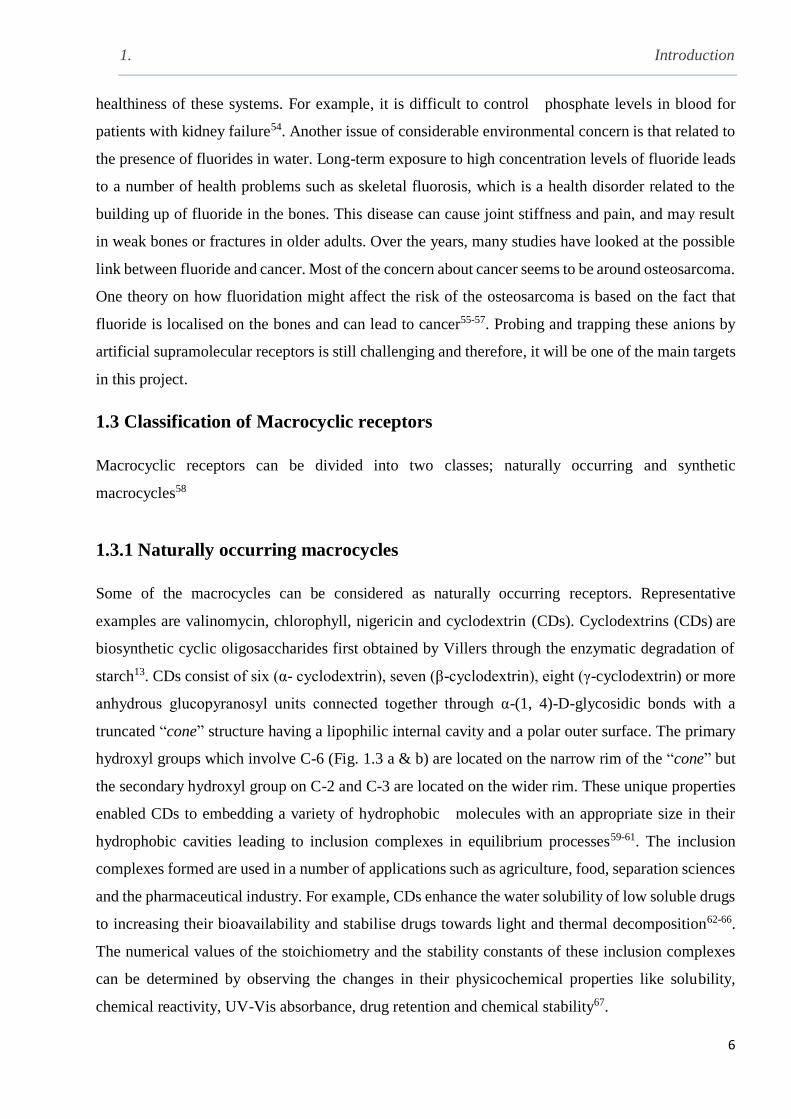
starch13. CDs consist of six (α- cyclodextrin), seven (β-cyclodextrin), eight (γ-cyclodextrin) or more
anhydrous glucopyranosyl units connected together through α-(1, 4)-D-glycosidic bonds with a
truncated “cone” structure having a lipophilic internal cavity and a polar outer surface. The primary
hydroxyl groups which involve C-6 (Fig. 1.3 a & b) are located on the narrow rim of the “cone” but
the secondary hydroxyl group on C-2 and C-3 are located on the wider rim. These unique properties
enabled CDs to embedding a variety of hydrophobic molecules with an appropriate size in their
hydrophobic cavities leading to inclusion complexes in equilibrium processes59-61. The inclusion
complexes formed are used in a number of applications such as agriculture, food, separation sciences
and the pharmaceutical industry. For example, CDs enhance the water solubility of low soluble drugs
to increasing their bioavailability and stabilise drugs towards light and thermal decomposition62-66.
The numerical values of the stoichiometry and the stability constants of these inclusion complexes
can be determined by observing the changes in their physicochemical properties like solubility,
chemical reactivity, UV-Vis absorbance, drug retention and chemical stability67.

1. Introduction
7
Fig. 1.3 (a) Molecular structure of β- cyclodextrin (b) β-CD in a “cone” conformation59
The difference of the number of glucose units and the size of cavities between the isolated CDs leads
to differences in their chemical and physical properties (Table 1.1)68. There are a large number of
cyclodextrin derivatives due to the possibility of introducing functional groups through the hydroxyl
groups (18-OH in α-CD, 21-OH in β-CD and 24-OH in γ-CD) with different reactivities which can
be modified by different methods. Substitution on the CDs rims can give a high degree of binding
properties towards many lipophilic guest compounds69-72.
Danil de Namor and coworkers73,74 have carried out a series of thermodynamic studies for
cyclodextrins as hosts with different guests. CDs with different functional groups have shown to have
a strong effect on the receptor properties75-78.
Table 1.1 Physicochemical properties of , and -cyclodextrins68
Physico-chemical Properties -Cyclodextrin -Cyclodextrin -Cyclodextrin
Number of glucopyranose units 6 7 8
Molecular weight (g mol-1) 972 1135 1297
Solubility in water at 25 C (%, w/v) 14.5 1.85 23.2
Outer diameter (Å) 14.6 15.4 17.5
Cavity diameter (Å) 4.7–5.3 6.0–6.5 7.5–8.3
Height of torus (Å) 7.9 7.9 7.9
Cavity volume (Å3) 174 262 427

1. Introduction
8
1.3.2 Synthetic macrocyclic receptors (crown ethers, cryptands, spherands,
calixarenes, calixpyroles and pillarenes)
Due to the importance of the field of Supramolecular Chemistry, a huge number of synthetic
macrocycles has been synthesised such as crown ethers, cryptands, spherands, p-tert-
butylcalix[n]arene(n=4, 5, 6, 8), calix[n]pyrroles and pillarenes1,2,29.
Pederson4,5 in the early seventies reported the first synthesis of the macrocyclic known as Dibenzo-
18-crown-6 consisting of oxyethylene repeating units (-O-CH2CH2) containing a hole in its structure,
large enough, to interact with alkali and alkaline-earth metal cations to form host- guest complexes
driven by ion-dipole interactions between the cation and the negative charge of the oxygen donor
atoms of the receptor. He concluded that dibenzo macrocyclic crown ethers are good complexing
agents for these metal cations, particularly those contining five to ten oxygen atoms, thus a strong
binding affinity of dibenzo crown-5 towards the sodium cation was observed. The enhancement of
the interaction behaviour of these macrocycles towards targeted guests can be achieved by controling
the size of the macrocyclic hole or by introducing other donor atoms like sulphur or nitrogen to
generate crown ethers which have affinity to interact strongly and selectively with the targeted guest
(Fig. 1.4).
Pederson et al 79 reported the synthesis of crown thio-ethers and demonstrated that the binding affinity
of these receptors was raised towards the silver cation but decreased towards the potassium cation
which means that the introduction of a soft donor atom such as sulphur makes them selective for soft
metal cations such as silver.
Thermodynamic studies by Izzat et al 80 related to thio-crown ethers revealed that complexation
processes between thio-crown ethers with silver and mercury cations are enthalpicaly driven. This
means that the energy required to drive the complexation process are provided as a heat (exothermic)
from the interaction of the reactants leading to produce the most favourable stable state of the targeted
complex. Also, significant contribution by the sulfur moiety in the complexation process was
detected.
1. Introduction
9
1-Aza-15-crown-5 Hexathia-18-crown-618-crown-6 Dibenzo-18-crown-6
Fig. 1.4 Chemical structures of different macrocyclic crown ethers.
Generally the complexation of crown ethers with metal cations and the stability of the host-guest
complexes formed depend on different factors such as the size fittings between the host and the guest
, cationic radii, energy of solvation and polarity of the solvent81.
Danil de Namor et al 26 have reported the thermodynamic parameters of complexation of 12-crown-
4, 1-benzyl-1-aza-12-crown-4 and 1-aza-12-crown-4 (Fig. 1.5, Table 1.2) with the lithium cation in
acetonitrile and propylene carbonate as dipolar aprotic solvents by using different lithium salts. They
demonstrated the influence of the counter-ions of the lithium salts and the medium effect on the
complexation process in order to increase the dissociation of these salts and enhance the ionic
conductivity of electrolytic solutions for use in lithium batteries.
(a) (b) (c)
Fig. 1.5 Structures of (a) 12-crown-4, (b)1-benzyl-1-aza-12crown-4 and (c) 1-aza-12-crown-4

1. Introduction
10
Table 1.2 Stability constants expressed as log Ks and derived standerd Gibbs energies (∆cG),
enthalpies (∆cH), and entropies (∆cS) of complexation of crown ethers (12-crown-4 (12-C-4) and
1-Benzyl-1-aza-12-crown-4 (1-BA-12-C4)) and lithium (using salts containing different anions) in
acetonitrile (MeCN) and in propylene carbonate at 298.15 K
In MeCN
Electrolyte Receptor log Ks cG/kJ mol-1 cH/kJ mol-1 cS/Jmol-1K-1
Li+AsF6 12-C-4 3.23 18.4 22.78 14.7
Li+BF4 12-C-4 3.46 19.8 21.66 6.20
Li+CF3SO3 12-C-4 3.52 20.1 21.35 4.60
Li+ClO4 12-C-4 3.31 18.9 21.87 10.0
Li+AsF6 1-A-12-C4 4.23 24.2 18.84 18.0
Li+BF4 1-A-12-C4 4.24 24.2 19.91 14.4
Li+CF3SO3 1-A-12-C4 4.23 24.2 18.69 18.5
Li+AsF6 1-BA-12-C4 4.25 24.3 27.14 9.50
Li+BF4 1-BA-12-C4 4.30 24.6 27.54 9.90
Li+CF3SO3 1-BA-12-C4 4.31 24.6 27.44 9.30
Li+ClO4 1-BA-12-C4 4.31 24.6 28.50 13.1
Propylene
Carbonate
Li+AsF6 12-C4 2.81 16.0 15.9 5.70
Li+BF4 12-C4 2.79 15.9 17.71 6.10
Li+CF3SO3 12-C4 2.84 16.2 17.05 2.80
Li+ClO4 12-C4 2.81 21.0 15.29 2.40
Li+AsF6 1A-12-C4 3.67 21.1 14.78 20.9
Li+BF4 1A-12-C4 3.69 22.1 14.63 21.7
Li+CF3SO3 1A-12-C4 3.87 23.3 15.08 23.5
Li+AsF6 1-BA-12-C4 4.08 25.1 24.59 4.30
Li+BF4 1-BA-12-C4 4.39 25.1 24.98 0.40
Li+CF3SO3 1-BA-12-C4 4.59 26.2 24.70 5.00
Li+ClO4 1-BA-12-C4 4.32 24.7 23.30 4.70
1. Introduction
11
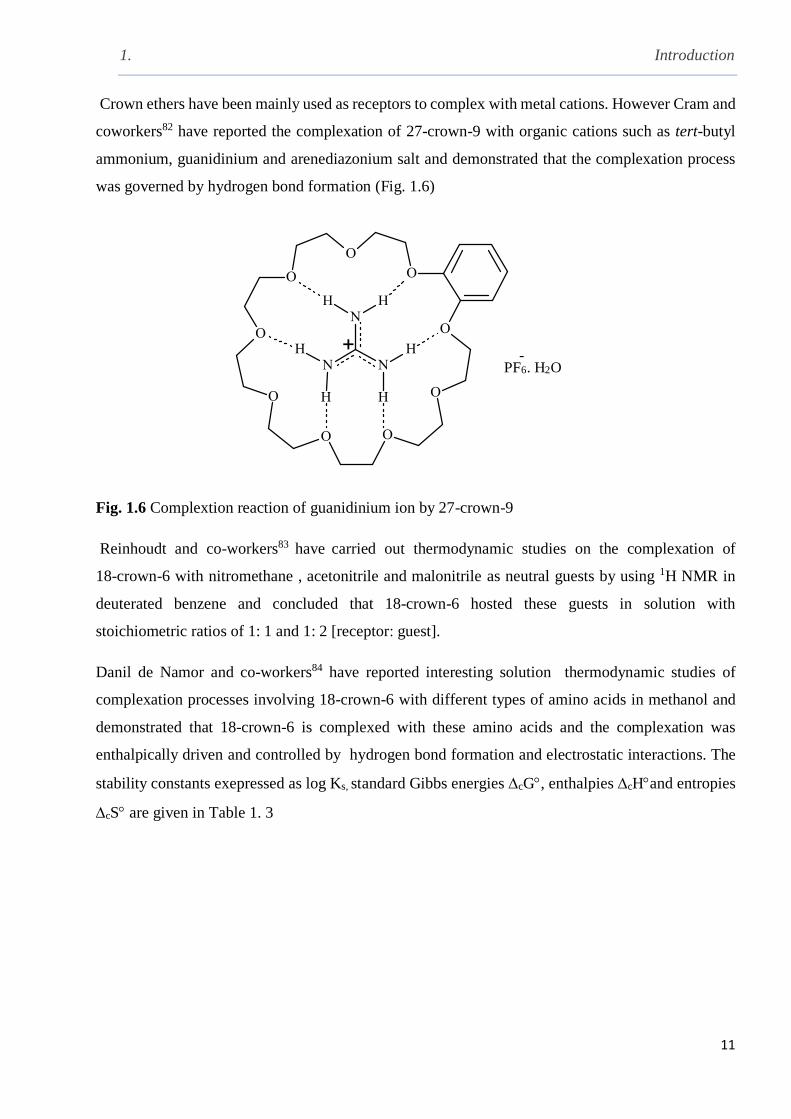
Crown ethers have been mainly used as receptors to complex with metal cations. However Cram and
coworkers82 have reported the complexation of 27-crown-9 with organic cations such as tert-butyl
ammonium, guanidinium and arenediazonium salt and demonstrated that the complexation process
was governed by hydrogen bond formation (Fig. 1.6)
PF6. H2O-
Fig. 1.6 Complextion reaction of guanidinium ion by 27-crown-9
Reinhoudt and co-workers83 have carried out thermodynamic studies on the complexation of
18-crown-6 with nitromethane , acetonitrile and malonitrile as neutral guests by using 1H NMR in
deuterated benzene and concluded that 18-crown-6 hosted these guests in solution with
stoichiometric ratios of 1: 1 and 1: 2 [receptor: guest].
Danil de Namor and co-workers84 have reported interesting solution thermodynamic studies of
complexation processes involving 18-crown-6 with different types of amino acids in methanol and
demonstrated that 18-crown-6 is complexed with these amino acids and the complexation was
enthalpically driven and controlled by hydrogen bond formation and electrostatic interactions. The
stability constants exepressed as log Ks, standard Gibbs energies cG, enthalpies cHand entropies
cS are given in Table 1. 3

1. Introduction
12
Table 1. 3 Thermodynamic parameters of complexation of amino acids with 18-crown-6 in methanol
at 298.15 K
Amino acid Log Ks cG/ kJ mol-1 cH/ kJ mol-1 cS/ J mol-1K
DL-Alanine 3.59 20.49 45.94 85.4
DL-Arginine 3.42 19.52 40.11 69.1
DL-Asparagine 3.14 17.92 40.24 74.9
DL-Aspartic acid 2.99 17.07 38.55 72.0
DL-Cysteine 3.28 18.72 30.67 40.1
DL-Glutamic acid 3.34 19.07 35.78 56.0
Glycine 3.98 22.72 53.83 104.3
DL-Histidine 3.03 17.29 39.26 73.7
DL-Isoleucine 3.17 18.10 36.42 61.4
DL-Leucine 3.35 19.12 42.47 78.7
DL-Methionine 3.66 20.89 37.85 56.9
DL-Phenylalanine 3.15 17.98 39.38 71.7
DL-Proline 2.6 15.07 11.38 12.4
DL-Serotonin 3.37 19.24 38.80 65.6
DL-Thyronine 3.02 17.24 35.36 60.8
DL-Tryptophan 3.06 17.74 41.36 81.0
DL-Tyrosine 2.93 16.72 45.39 96.0
DL-Valine 3.19 18.72 34.49 54.6
Recently various crown ethers with different functional groups have been synthesised to enhance the
complexation properties of these macrocyclic receptors85-87. Müllen and co-workers85 have
synthesised benzo-21-crown-7 including dibenzocoronene tetracarboxdiimide chromophore (Fig.
1.7) and the receptor has shown selectivity towards lead and potassium cations in acetonitrile.

1. Introduction
13
2+ 2+
R=C11H23
C11H23
Fig. 1.7 The structure of the receptor synthesised by Müllen and coworkers75.
J-M. Lehn8,9 and co-workers have reported the first synthesis of macrocyclic receptors known as
“cryptands” described as more rigid and selective for alkali metal cations than crown ethers. These
receptors contain a three dimensional cavity with mixed donor atoms such as oxygen and nitrogen
in their molecular structure (Scheme 1.1). The authors concluded that the direction of the nitrogen
atom to the interior of the cavity may facilitate the complexation with cations. Also complexation
with anions occurs when these macrocycles receptors are protonated88. The supermolecular structure
of the complex resulting from the interaction between cryptand with the metal cation described
initially by Lehn as “cryptate” but the term was extended to include all the cationic or anionic species
imprisoned in the cage- like structure of this receptor
Cryptand 222
LiAlH4
Scheme 1.1 Synthetic pathway of cryptands 222
Danil de Namor and co-workers22,89 have extensively reported thermodynamic studies of the
complexation of cryptand 222 with silver and alkali metal cations in a variety of solvents. These
authors concluded that the cations are fully desolvated after complexation by showing a linear
relationship between the complexation of cryptand 222 and univalent cations in dipolar aprotic
1. Introduction
14
solvents and the solvation of these cations in these solvents in terms of Gibbs energies, enthalpies
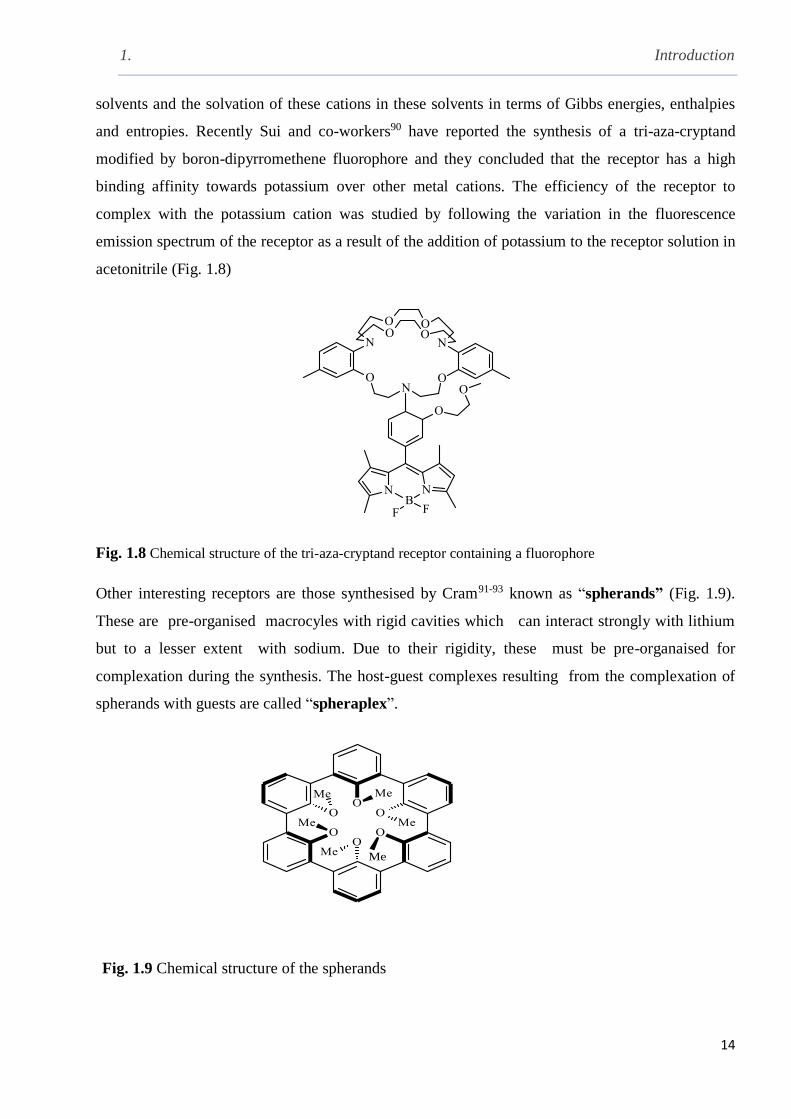
and entropies. Recently Sui and co-workers90 have reported the synthesis of a tri-aza-cryptand
modified by boron-dipyrromethene fluorophore and they concluded that the receptor has a high
binding affinity towards potassium over other metal cations. The efficiency of the receptor to
complex with the potassium cation was studied by following the variation in the fluorescence
emission spectrum of the receptor as a result of the addition of potassium to the receptor solution in
acetonitrile (Fig. 1.8)
Fig. 1.8 Chemical structure of the tri-aza-cryptand receptor containing a fluorophore
Other interesting receptors are those synthesised by Cram91-93 known as “spherands” (Fig. 1.9).
These are pre-organised macrocyles with rigid cavities which can interact strongly with lithium
but to a lesser extent with sodium. Due to their rigidity, these must be pre-organaised for
complexation during the synthesis. The host-guest complexes resulting from the complexation of
spherands with guests are called “spheraplex”.
Me
Fig. 1.9 Chemical structure of the spherands
1. Introduction
15
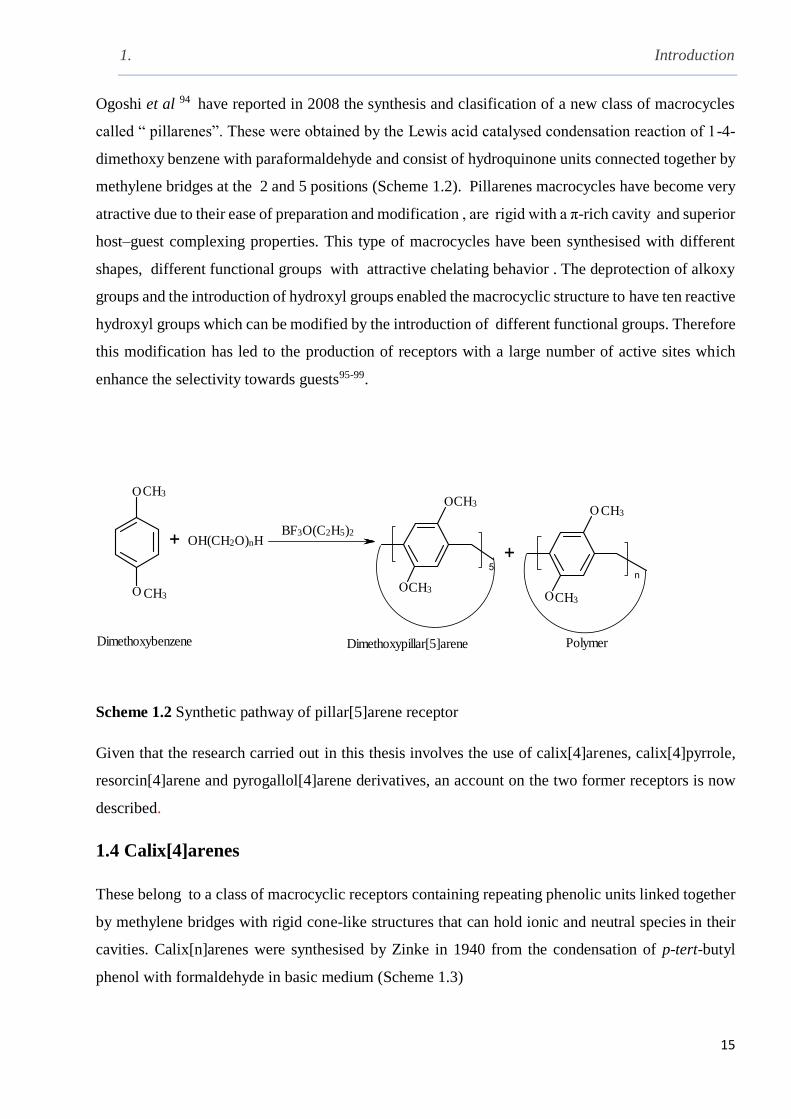
Ogoshi et al 94 have reported in 2008 the synthesis and clasification of a new class of macrocycles
called “ pillarenes”. These were obtained by the Lewis acid catalysed condensation reaction of 1-4-
dimethoxy benzene with paraformaldehyde and consist of hydroquinone units connected together by
methylene bridges at the 2 and 5 positions (Scheme 1.2). Pillarenes macrocycles have become very
atractive due to their ease of preparation and modification , are rigid with a π-rich cavity and superior
host–guest complexing properties. This type of macrocycles have been synthesised with different
shapes, different functional groups with attractive chelating behavior . The deprotection of alkoxy
groups and the introduction of hydroxyl groups enabled the macrocyclic structure to have ten reactive
hydroxyl groups which can be modified by the introduction of different functional groups. Therefore
this modification has led to the production of receptors with a large number of active sites which
enhance the selectivity towards guests95-99.
CH3
Dimethoxypillar[5]areneDimethoxybenzene Polymer
CH3
BF3O(C2H5)2
CH3
CH3CH3
CH3
OH(CH2O)nH
Scheme 1.2 Synthetic pathway of pillar[5]arene receptor
Given that the research carried out in this thesis involves the use of calix[4]arenes, calix[4]pyrrole,
resorcin[4]arene and pyrogallol[4]arene derivatives, an account on the two former receptors is now
described.
1.4 Calix[4]arenes
These belong to a class of macrocyclic receptors containing repeating phenolic units linked together
by methylene bridges with rigid cone-like structures that can hold ionic and neutral species in their
cavities. Calix[n]arenes were synthesised by Zinke in 1940 from the condensation of p-tert-butyl
phenol with formaldehyde in basic medium (Scheme 1.3)

1. Introduction
16
HCOH/ NaOH
Heat, 80 °C
n = 4, 6, 8
p-tert-butyl phenol p-tert-butyl calix[n]arene (n=4, 6, 8)
Scheme 1.3 Synthesis of p-tert-butylcalix[4]arene.
The term calix[n]arene was given by Gutsche in 1987 to macrocyclic compounds which have a cup
body structure similar to the Greek vase known as calyx crater (Fig. 1.10); calix means cup-like
structure, crater is applicable due to the cavity arising from the connectivity between phenyl (arene)
rings included in the structure and n between two brackets indicates the number of phenol groups in
the macrocyclic structure100-106.
(a) (b)
Fig. 1.10 Images of (a) Greek Calyx Crater and (b) molecular modelling of p-tert-butyl calix[4]arene
showing the similarity between the Greek vase and the calix[4]arene.
The 1H NMR technique has been used to characterise and to recognise p-tert-butylcalix[4]arene from
p-tert-butylcalix[6]arene and p-tert-butylcalix[8]arene. For p-tert-butylcalix[4]arene, there were five
different resonances in the 1H NMR spectrum at room temperature as noticed for the first time by
1. Introduction
17
Kammerer and co-workers107. The resonance of the hydroxyl, aryl and tert-butyl protons are observed
as singlets whereas the resonances of the methylene bridge protons are observed as a pair of doublets
(Fig. 1.11). Ungaro and co-workers108 have identified these two doublets for the methylene bridge
protons and demonstrated precisely that the higher field doublet resonance corresponds to the
equatorial protons (close to the aryl group) and the downfield doublet arises from the axial protons
(close to the hydroxyl groups). Gutsche and co-workers109 have revealed that the 1H NMR spectrum
for the methylene bridge protons of p-tert-butylcalix[4]arene in a nonpolar solvents like CDCl3 and
bromobenzene-d5 are in a similar pattern with p-tert-butylcalix[8]arene and were observed as a pair
of doublets but there were no doublet resonance noticed for the p-tert-butylcalix[6]arene which
showed only a singlet at room temperature. The distinction between the p-tert-butylcalix[4]arene and
p-tert-butylcalix[8]arene was illustrated by using pyridine-d5 as solvent, p-tert-butylcalix[4]arene is
able to maintain its occurrence as a pair of doublets even at 0 °C whereas only one singlet peak was
observed for the p-tert-butylcalix[8]arene even at -90 °C.
Fig. 1.11 1H NMR spectrum for p-tert-butylcalix[4]arene in CDCl3 at 298 K (this work)
1.4.1 Properties and conformations of p-tert-butylcalix[4]arene
Due to the presence of intramolecular hydrogen bonding between the four phenolic hydroxyl
groups the structure of calix[4]arene is described as rigid with two cavities (Fig. 1.12) which are the
upper hydrophobic cavity found between the aromatic rings which is considered as a container for
Axial proton Equatorial proton
proton

1. Introduction
18
electron deficient species and the lower hydrophilic cavity or semi-cavity which is formed through
the substitution of the phenolic hydrogens by different functional groups 109,110.
Wide rim
Narrow rim
Upper rim
Lower rimnarrow rim
wide rim
Fig. 1.12 The upper and lower rim of p-tert-butylcalix[4]arene
Due to the presence of four separated phenol rings by methylene bridges, these rings are flexible to
rotate via the methylene bridges leading the calix[4]arene to adopt four different conformations
recognised first by Cornforth111 and later coined by Gutsche as cone, partial cone, 1,2-alternate and
1,3-alternate conformations resulting from different orientations of the phenolic rings in the space .
In a “cone” conformation all phenol rings are oriented in one direction (up or down) (Fig. 1.13(a))
and this is considered the more favourable conformation due to the formation of intramolecular
hydrogen bonds between the hydroxyl groups. In a partial ‘cone’ conformation, three of the phenol
rings are oriented in the same direction (up or down) except one ring which is oriented in the opposite
direction (Fig. 1.13 (b)), The 1,2-alternate conformation contains two adjacent phenolic rings
oriented in the same direction while the others are oriented in the opposite direction (Fig. 1.13 (c)).
The 1, 3-alternate conformation involves phenol neighbouring rings in the opposite direction up or
down (Fig. 1.13 (d)). The parent p-tert-butylcalix[4]arene adopts a “cone” conformation in solution
and in the solid state and the inter-conversion between these conformers can take place because of
the possibility for the phenolic groups to rotate via the methylene bridges105.

1. Introduction
19
a b
dc
Fig. 1.13 Possible conformations of p- tert-butylcalix[4]arene: (a) Cone ,(b) Partial cone,(c) 1,2-
alternate ,(d)1,3-alternate.
1H and 13C NMR spectra are used to distinguish between these sterioisomers especially 1H and 13C
NMR patterns for the bridging methylene groups which are different for three out of four
conformations. In a “cone” conformation the methylene bridge protons appear as a pair of doublets.
The 1, 2-alternate conformation and the “partial cone” have similar patterns and appear as a pair of
doublets and one singlet, it can be recognised in the aromatic part of the spectrum whereas a 1, 3-
alternate conformation appears as one singlet110. The 13C NMR spectrum for the bridge methylene
carbon have been used by De Mendoza and co-workers112 to identify the possible conformations
adopted by p-tert-butylcalix[4]arene and they demonstrated that the resonance near δ = 31 ppm is
related to the bridge methylene carbon when the connected phenyl groups are in the “syn” direction
(both phenyl groups up or both phenyl groups down ) and near δ = 37 ppm when they are in opposite
orientation (Fig. 1.14)
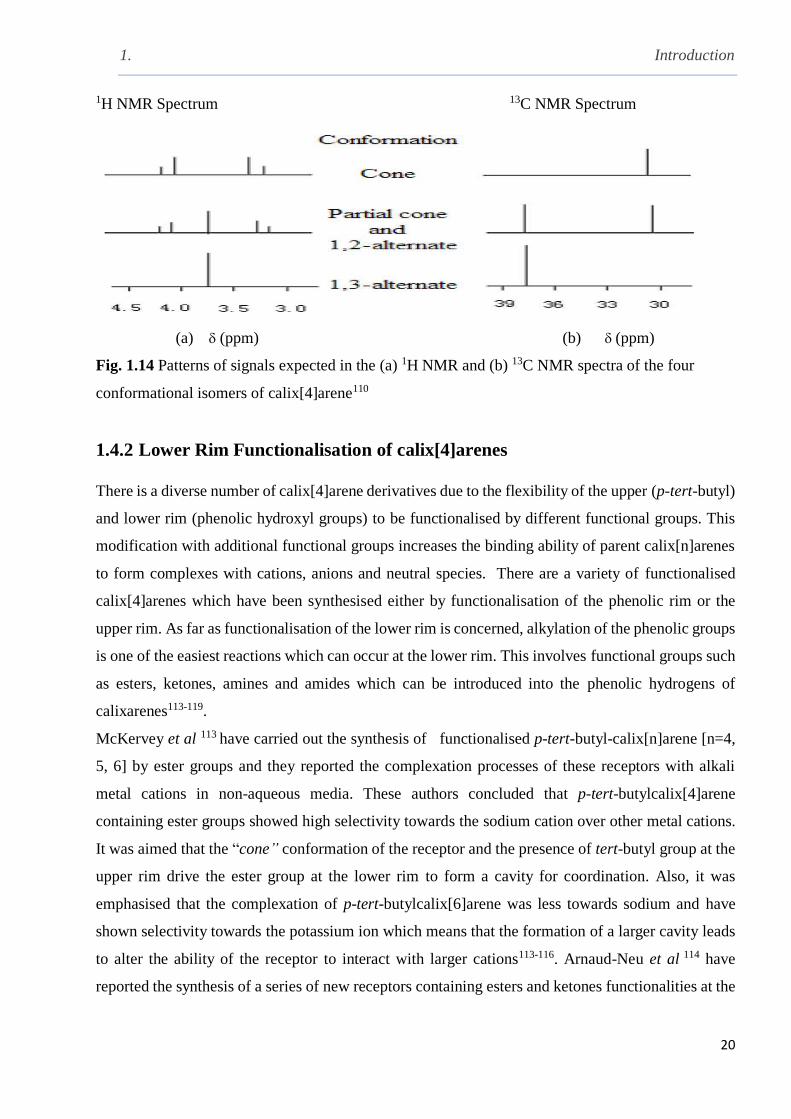
1. Introduction
20
1H NMR Spectrum 13C NMR Spectrum
(a) (ppm) (b) (ppm)
Fig. 1.14 Patterns of signals expected in the (a) 1H NMR and (b) 13C NMR spectra of the four
conformational isomers of calix[4]arene110
1.4.2 Lower Rim Functionalisation of calix[4]arenes
There is a diverse number of calix[4]arene derivatives due to the flexibility of the upper (p-tert-butyl)
and lower rim (phenolic hydroxyl groups) to be functionalised by different functional groups. This
modification with additional functional groups increases the binding ability of parent calix[n]arenes
to form complexes with cations, anions and neutral species. There are a variety of functionalised
calix[4]arenes which have been synthesised either by functionalisation of the phenolic rim or the
upper rim. As far as functionalisation of the lower rim is concerned, alkylation of the phenolic groups
is one of the easiest reactions which can occur at the lower rim. This involves functional groups such
as esters, ketones, amines and amides which can be introduced into the phenolic hydrogens of
calixarenes113-119.
McKervey et al 113 have carried out the synthesis of functionalised p-tert-butyl-calix[n]arene [n=4,
5, 6] by ester groups and they reported the complexation processes of these receptors with alkali
metal cations in non-aqueous media. These authors concluded that p-tert-butylcalix[4]arene
containing ester groups showed high selectivity towards the sodium cation over other metal cations.
It was aimed that the “cone” conformation of the receptor and the presence of tert-butyl group at the
upper rim drive the ester group at the lower rim to form a cavity for coordination. Also, it was
emphasised that the complexation of p-tert-butylcalix[6]arene was less towards sodium and have
shown selectivity towards the potassium ion which means that the formation of a larger cavity leads
to alter the ability of the receptor to interact with larger cations113-116. Arnaud-Neu et al 114 have
reported the synthesis of a series of new receptors containing esters and ketones functionalities at the
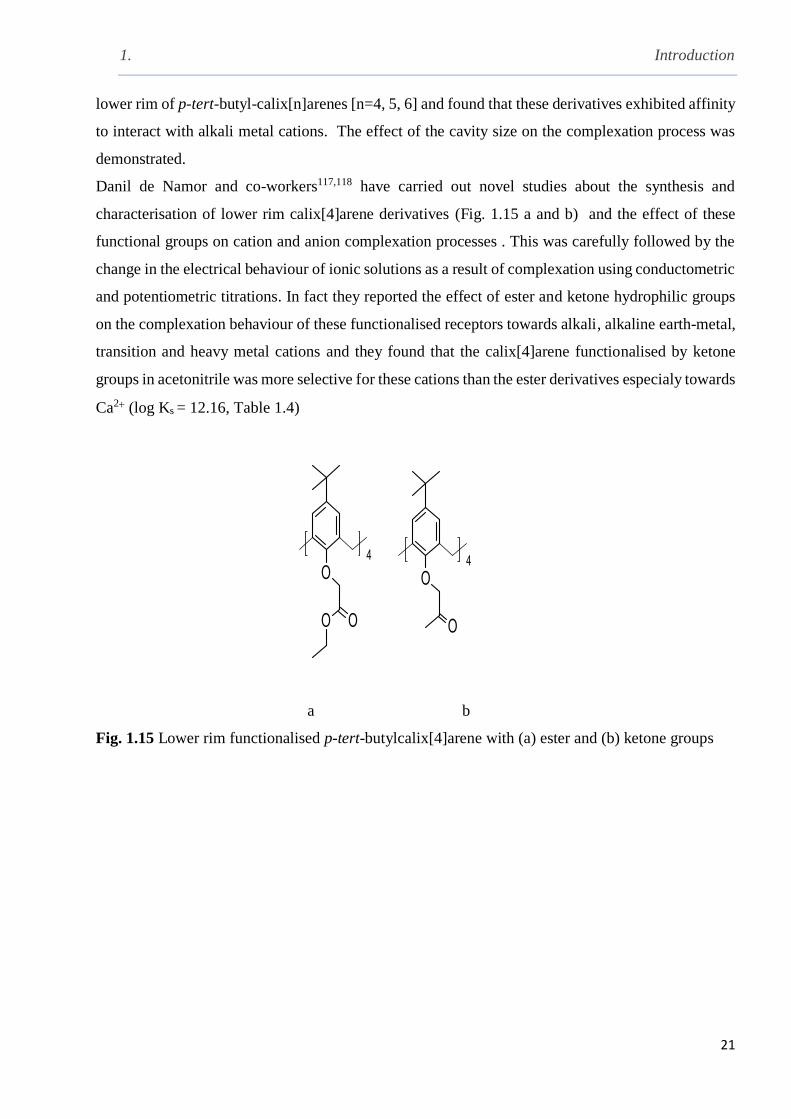
1. Introduction
21
lower rim of p-tert-butyl-calix[n]arenes [n=4, 5, 6] and found that these derivatives exhibited affinity
to interact with alkali metal cations. The effect of the cavity size on the complexation process was
demonstrated.
Danil de Namor and co-workers117,118 have carried out novel studies about the synthesis and
characterisation of lower rim calix[4]arene derivatives (Fig. 1.15 a and b) and the effect of these
functional groups on cation and anion complexation processes . This was carefully followed by the
change in the electrical behaviour of ionic solutions as a result of complexation using conductometric
and potentiometric titrations. In fact they reported the effect of ester and ketone hydrophilic groups
on the complexation behaviour of these functionalised receptors towards alkali, alkaline earth-metal,
transition and heavy metal cations and they found that the calix[4]arene functionalised by ketone
groups in acetonitrile was more selective for these cations than the ester derivatives especialy towards
Ca2 (log Ks = 12.16, Table 1.4)
a b
Fig. 1.15 Lower rim functionalised p-tert-butylcalix[4]arene with (a) ester and (b) ketone groups
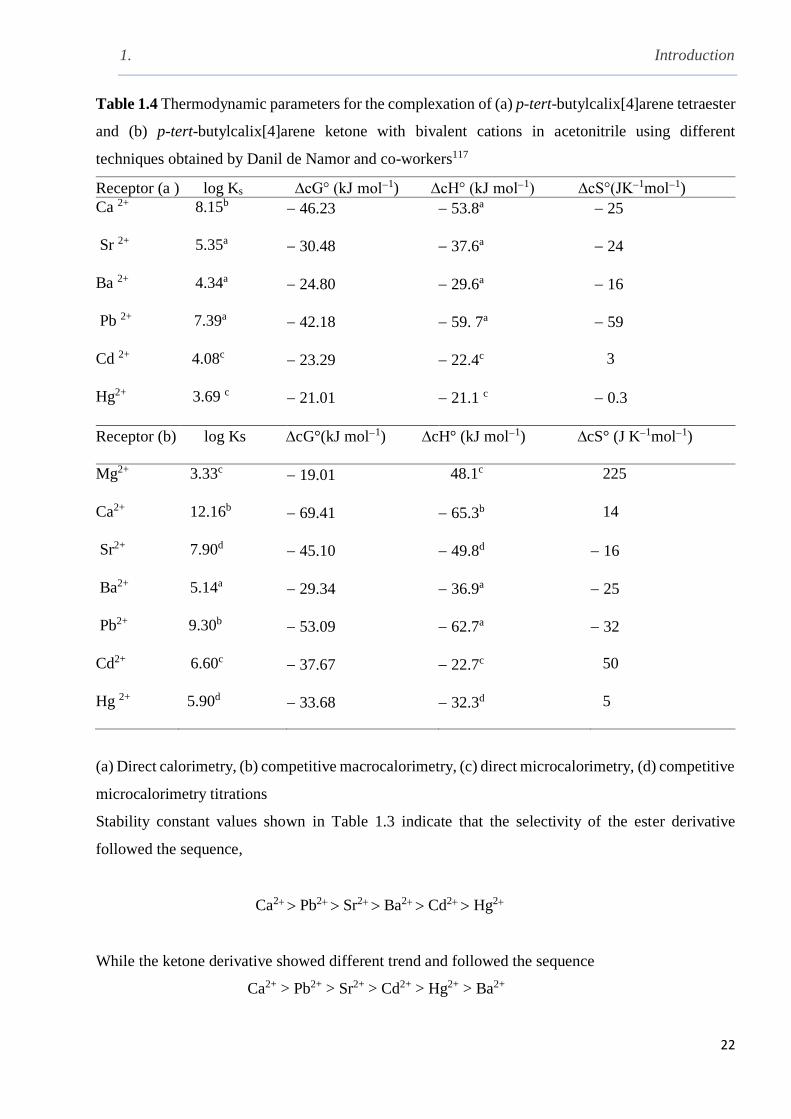
1. Introduction
22
Table 1.4 Thermodynamic parameters for the complexation of (a) p-tert-butylcalix[4]arene tetraester
and (b) p-tert-butylcalix[4]arene ketone with bivalent cations in acetonitrile using different
techniques obtained by Danil de Namor and co-workers117
Receptor (a ) log Ks ∆cG° (kJ mol1) ∆cH° (kJ mol1) ∆cS°(JK1mol1)
Ca 2+ 8.15b 46.23 53.8a 25
Sr 2+
5.35a
30.48
37.6a
24
Ba 2+
4.34a
24.80
29.6a
16
Pb 2+
7.39a
42.18
59. 7a
59
Cd 2+
4.08c
23.29
22.4c
3
Hg2+
3.69 c
21.01
21.1 c
0.3
Receptor (b) log Ks ∆cG°(kJ mol1) ∆cH° (kJ mol1) ∆cS° (J K1mol1)
Mg2+
3.33c
19.01
48.1c
225
Ca2+ 12.16b
69.41
65.3b
14
Sr2+ 7.90d
45.10
49.8d
16
Ba2+
5.14a
29.34
36.9a
25
Pb2+
9.30b
53.09
62.7a
32
Cd2+
6.60c
37.67
22.7c
50
Hg 2+ 5.90d 33.68 32.3d 5
(a) Direct calorimetry, (b) competitive macrocalorimetry, (c) direct microcalorimetry, (d) competitive
microcalorimetry titrations
Stability constant values shown in Table 1.3 indicate that the selectivity of the ester derivative
followed the sequence,
Ca2 Pb2 Sr2 Ba2 Cd2 Hg2
While the ketone derivative showed different trend and followed the sequence
Ca2+ > Pb2+ > Sr2+ > Cd2+ > Hg2+ > Ba2+

1. Introduction
23
Considerable enhancement in the binding affinity towards alkali-metal cations were noticed when
tetra-diethylamide functionalities were introduced in the lower rim of p-tert-butylcalix[4]arene (Fig.
1.16 ) and have exhibited strong affinity to complex with alkali metal cations especially with sodium
and potassium cations. The X-ray crystal structure indicated that the cation is properly accommodated
in the polar cavity while a “cone” conformation is adopted by the receptor. Also, the receptor has
affinity to complex with alkaline-earth metal cations and the highest affinity was found for calcium
over other alkaline-earth metal cations. The addition of the amide functionality leads to increasing
the basicity of the receptor and has made it more basic than ester and ketone derivatives119.
Fig. 1.16 Chemical structure of 5, 11, 17, 23-tetra-tert-butyl-25, 26, 27, 28-tetrakis(N, N-
diethylaminocarbonyl) methoxy calix[4]arene
The functionalisation of the calix[4]arene with phosphine oxide at the lower rim (Fig. 1.17) has led
to increase the affinity of the receptor to bind with lanthanide metal cations and this modification was
used to remove radioactive elements such as europium, Eu (III), thorium, Th (IV), plutonium, Pu
(IV) and americium, Am (IV) from nuclear waste120
Fig. 1.17 Chemical structure of p-tert-calix[4]aren functionalised with phosphine oxide
Calixarine derivatives containing mixed functionalities like amide-bipyridine or amide phenantroline
(Fig. 1.18) have also shown affinity to interact with lanthanide cations119.

1. Introduction
24
CH3H3C
Fig. 1.18 Chemical structure of receptors used for the complexation of lanthanides cations
It has been demonstrated that bis-calix[4]arene (Fig. 1.19 a) has affinity to bind with methyl viologen
(N-N-dimetyl-4,4-bipyridinium dichloride) (Fig. 1.19 b) which is commonly utilised as a herbicide
and it is well known for its negative impact to human health and the environment. The complexation
process revealed that the herbicide is completely incarcerated in the -rich rectangular cavity and the
complexation process is promoted by cation- interaction between the positive charge of the hosted
herbicide with the -system zoomed by two parallel anthracenes and the calix[4]arene skeleton. The
receptor has the ability to act as a fluorescent chemosensor to this toxic material due to the presence
of anthryl group in the receptor skeleton121.
CH3H3C - -Cl Cl
(a) (b)
Fig. 1.19 Chemical structure of (a) bis-calix4]arene and (b) methyl viologen
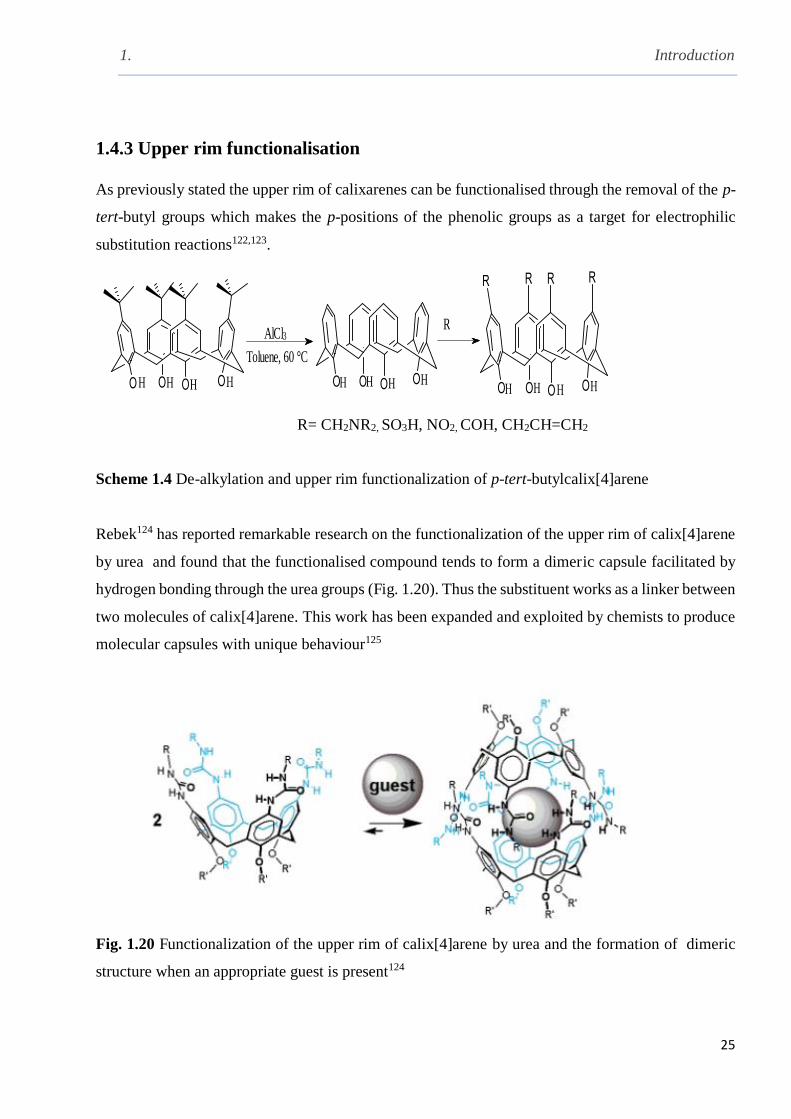
1. Introduction
25
1.4.3 Upper rim functionalisation
As previously stated the upper rim of calixarenes can be functionalised through the removal of the p-
tert-butyl groups which makes the p-positions of the phenolic groups as a target for electrophilic
substitution reactions122,123.
AlCl3
Toluene, 60 °C
R
R= CH2NR2, SO3H, NO2, COH, CH2CH=CH2
Scheme 1.4 De-alkylation and upper rim functionalization of p-tert-butylcalix[4]arene
Rebek124 has reported remarkable research on the functionalization of the upper rim of calix[4]arene
by urea and found that the functionalised compound tends to form a dimeric capsule facilitated by
hydrogen bonding through the urea groups (Fig. 1.20). Thus the substituent works as a linker between
two molecules of calix[4]arene. This work has been expanded and exploited by chemists to produce
molecular capsules with unique behaviour125
Fig. 1.20 Functionalization of the upper rim of calix[4]arene by urea and the formation of dimeric
structure when an appropriate guest is present124
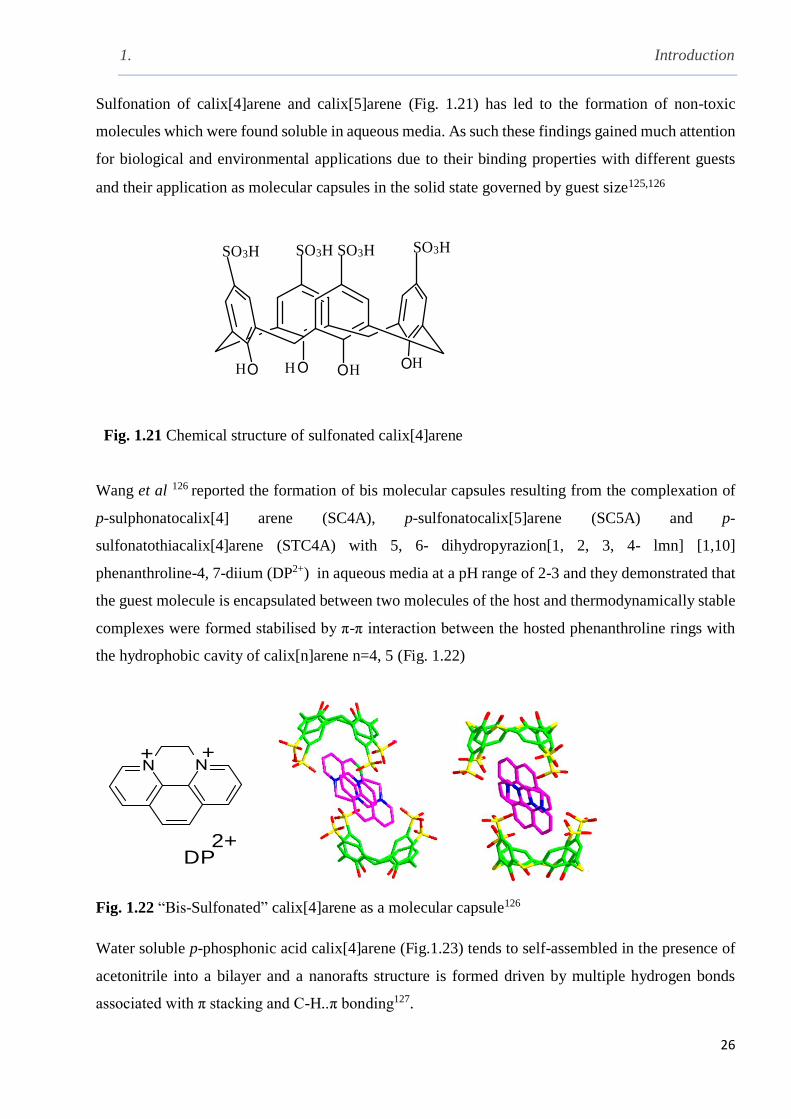
1. Introduction
26
Sulfonation of calix[4]arene and calix[5]arene (Fig. 1.21) has led to the formation of non-toxic
molecules which were found soluble in aqueous media. As such these findings gained much attention
for biological and environmental applications due to their binding properties with different guests
and their application as molecular capsules in the solid state governed by guest size125,126
SO3H SO3H SO3H SO3H
Fig. 1.21 Chemical structure of sulfonated calix[4]arene
Wang et al 126 reported the formation of bis molecular capsules resulting from the complexation of
p-sulphonatocalix[4] arene (SC4A), p-sulfonatocalix[5]arene (SC5A) and p-
sulfonatothiacalix[4]arene (STC4A) with 5, 6- dihydropyrazion[1, 2, 3, 4- lmn] [1,10]
phenanthroline-4, 7-diium (DP2+) in aqueous media at a pH range of 2-3 and they demonstrated that
the guest molecule is encapsulated between two molecules of the host and thermodynamically stable
complexes were formed stabilised by π-π interaction between the hosted phenanthroline rings with
the hydrophobic cavity of calix[n]arene n=4, 5 (Fig. 1.22)
+ +
2+DP
Fig. 1.22 “Bis-Sulfonated” calix[4]arene as a molecular capsule126
Water soluble p-phosphonic acid calix[4]arene (Fig.1.23) tends to self-assembled in the presence of
acetonitrile into a bilayer and a nanorafts structure is formed driven by multiple hydrogen bonds
associated with π stacking and C-H..π bonding127.
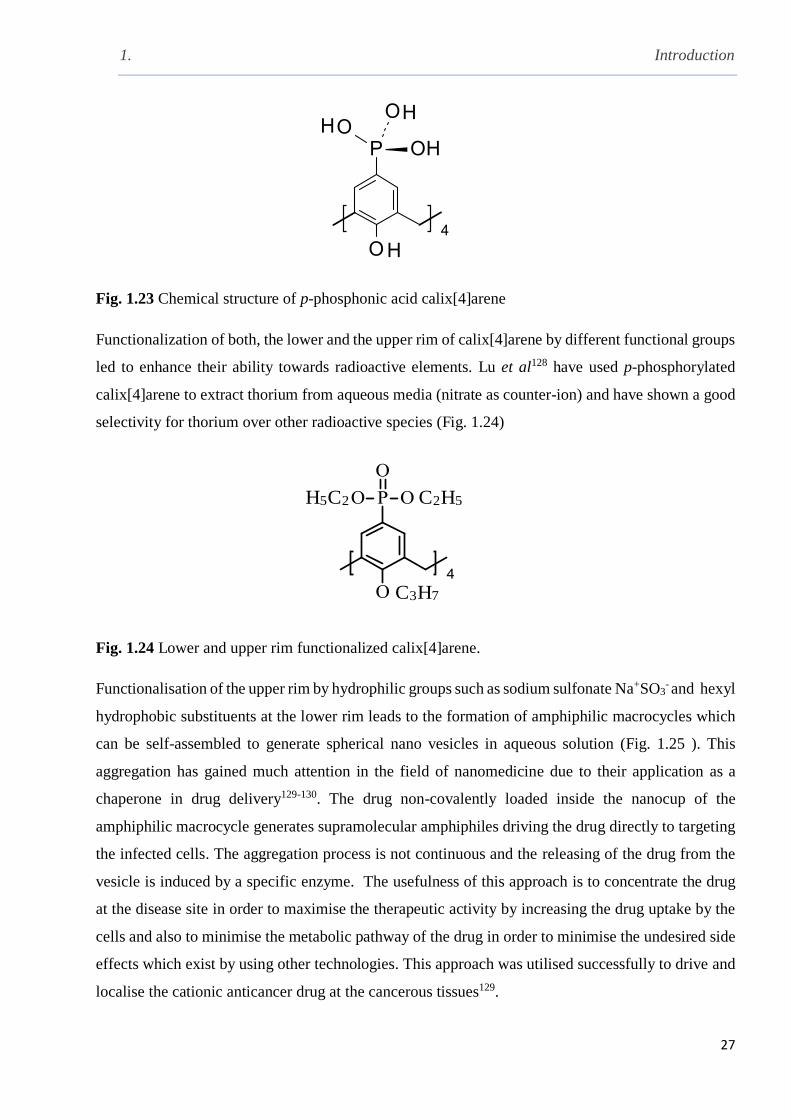
1. Introduction
27
Fig. 1.23 Chemical structure of p-phosphonic acid calix[4]arene
Functionalization of both, the lower and the upper rim of calix[4]arene by different functional groups
led to enhance their ability towards radioactive elements. Lu et al128 have used p-phosphorylated
calix[4]arene to extract thorium from aqueous media (nitrate as counter-ion) and have shown a good
selectivity for thorium over other radioactive species (Fig. 1.24)
H5C2 C2H5
C3H7
Fig. 1.24 Lower and upper rim functionalized calix[4]arene.
Functionalisation of the upper rim by hydrophilic groups such as sodium sulfonate Na+SO3- and hexyl
hydrophobic substituents at the lower rim leads to the formation of amphiphilic macrocycles which
can be self-assembled to generate spherical nano vesicles in aqueous solution (Fig. 1.25 ). This
aggregation has gained much attention in the field of nanomedicine due to their application as a
chaperone in drug delivery129-130. The drug non-covalently loaded inside the nanocup of the
amphiphilic macrocycle generates supramolecular amphiphiles driving the drug directly to targeting
the infected cells. The aggregation process is not continuous and the releasing of the drug from the
vesicle is induced by a specific enzyme. The usefulness of this approach is to concentrate the drug
at the disease site in order to maximise the therapeutic activity by increasing the drug uptake by the
cells and also to minimise the metabolic pathway of the drug in order to minimise the undesired side
effects which exist by using other technologies. This approach was utilised successfully to drive and
localise the cationic anticancer drug at the cancerous tissues129.

1. Introduction
28
Fig. 1.25 Chemical structure of amphiphilic calix[4]arene and the aggregation to form vesicle129
Gutsche et al 131 have reported the interaction of p-tert-butylcalix[4]arene and p-tetra-
allylcalix[4]arene with tert-butyl amine in acetonitrile and they concluded that the complexation
process is promoted by a proton transfer reaction from the p-tert-butylcalix[4]aren to the amino
compound. They suggested that the complexation process occurred in two steps, the first step includes
the proton transfer to form ions and the second step includes the association of these ions to form a
host- guest complex (eq.1.1)
eq.1.1
HNR3ArO-ArOH + R3N
K1 K2Ar R3
-
Gutsche and See132 demonstrated that the double-cavity calix[4]arene (Fig. 1.26) has a weak affinity
to complex with neutral guests such as phenols, aldehydes, carboxylic acids, pyridines, imidazoles
and aliphatic amines and they reported stability constants in the order of 5 to 55.
(CH2)4
(CH2)4
Fig. 1.26 The chemical structure of a double cavity p-tert-butylcalix[4]arene

1. Introduction
29
Immobilisation of a functionalised calix[4]arene containing di-substituted dithiocarbamate (Fig.
1.27) on the surface of gold nanoparticles surface led to enhance the colorimetric and quantitative
responseof the receptor towards the cobalt (II) metal cation over other metal cations. The anchoring
process has led to produce a rigid macrocycle compared with the non-immobilized calix[4[arene
moiety that has affinity to interact strongly with cobalt (II). The advantage of this process is to induce
changes in the physico-chemical properties of the gold nanoparticles which could lead to increase
this sensitivity. The changes include red shift in the SPR (surface plasmon resonance) absorption
band as a result of complexation with Co2+ compared with the free form of the receptor133.
Au
Fig. 1.27 Immobilizing calix[4]arene derivative on the surface of gold nanoparticles
1.4.4 Applications of calixarenes and derivatives
The potential industrial applications of calixarenes have been discussed by Perrin and co-workers134
Applications included i) the recovery of high concentrations of caesium from nuclear waste using a
calixarene derivative ii) the selective transport of cations using calixarenes, iii) the removal of
lanthanides, iv) their use as antioxidants for polymers, iv) separation of organic molecules making
use of the hydrophobic cavity of these receptors v) Extracting agents mainly for cations, vi )
environmental control and vi) the production of the electronic devices such as calixarene based ion
selective electrodes. In addition, new materials have been produced in which calixarenes were
anchored to silica through the upper rim, prior removal of the p-tert butyl groups so the complexing
properties of the functionalised lower rim for cations are not disturbed as a result of this modification.
Since then this area of applied research has expanded significantly to an extent that the role of
calixarenes in Nanosciences has been the subject of a book (Calixarenes in the Nanoworld) 135
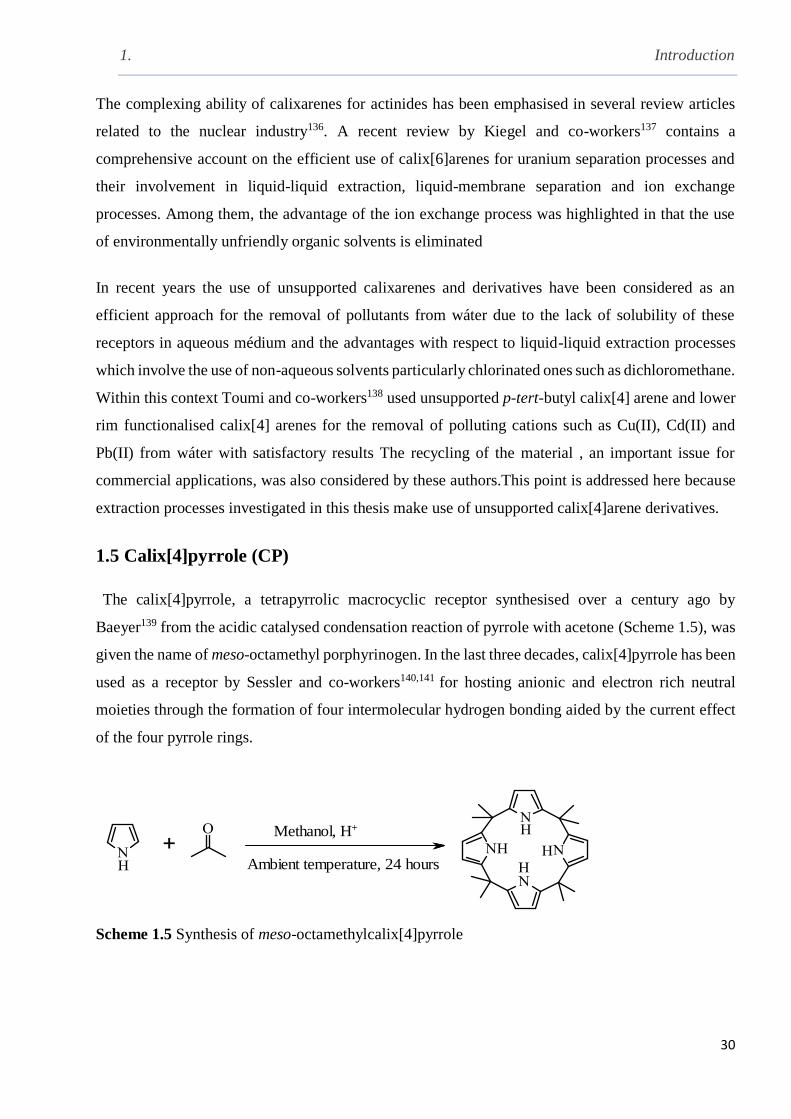
1. Introduction
30
The complexing ability of calixarenes for actinides has been emphasised in several review articles
related to the nuclear industry136. A recent review by Kiegel and co-workers137 contains a
comprehensive account on the efficient use of calix[6]arenes for uranium separation processes and
their involvement in liquid-liquid extraction, liquid-membrane separation and ion exchange
processes. Among them, the advantage of the ion exchange process was highlighted in that the use
of environmentally unfriendly organic solvents is eliminated
In recent years the use of unsupported calixarenes and derivatives have been considered as an
efficient approach for the removal of pollutants from wáter due to the lack of solubility of these
receptors in aqueous médium and the advantages with respect to liquid-liquid extraction processes
which involve the use of non-aqueous solvents particularly chlorinated ones such as dichloromethane.
Within this context Toumi and co-workers138 used unsupported p-tert-butyl calix[4] arene and lower
rim functionalised calix[4] arenes for the removal of polluting cations such as Cu(II), Cd(II) and
Pb(II) from wáter with satisfactory results The recycling of the material , an important issue for
commercial applications, was also considered by these authors.This point is addressed here because
extraction processes investigated in this thesis make use of unsupported calix[4]arene derivatives.
1.5 Calix[4]pyrrole (CP)
The calix[4]pyrrole, a tetrapyrrolic macrocyclic receptor synthesised over a century ago by
Baeyer139 from the acidic catalysed condensation reaction of pyrrole with acetone (Scheme 1.5), was
given the name of meso-octamethyl porphyrinogen. In the last three decades, calix[4]pyrrole has been
used as a receptor by Sessler and co-workers140,141 for hosting anionic and electron rich neutral
moieties through the formation of four intermolecular hydrogen bonding aided by the current effect
of the four pyrrole rings.
Methanol, H+
Ambient temperature, 24 hours
Scheme 1.5 Synthesis of meso-octamethylcalix[4]pyrrole
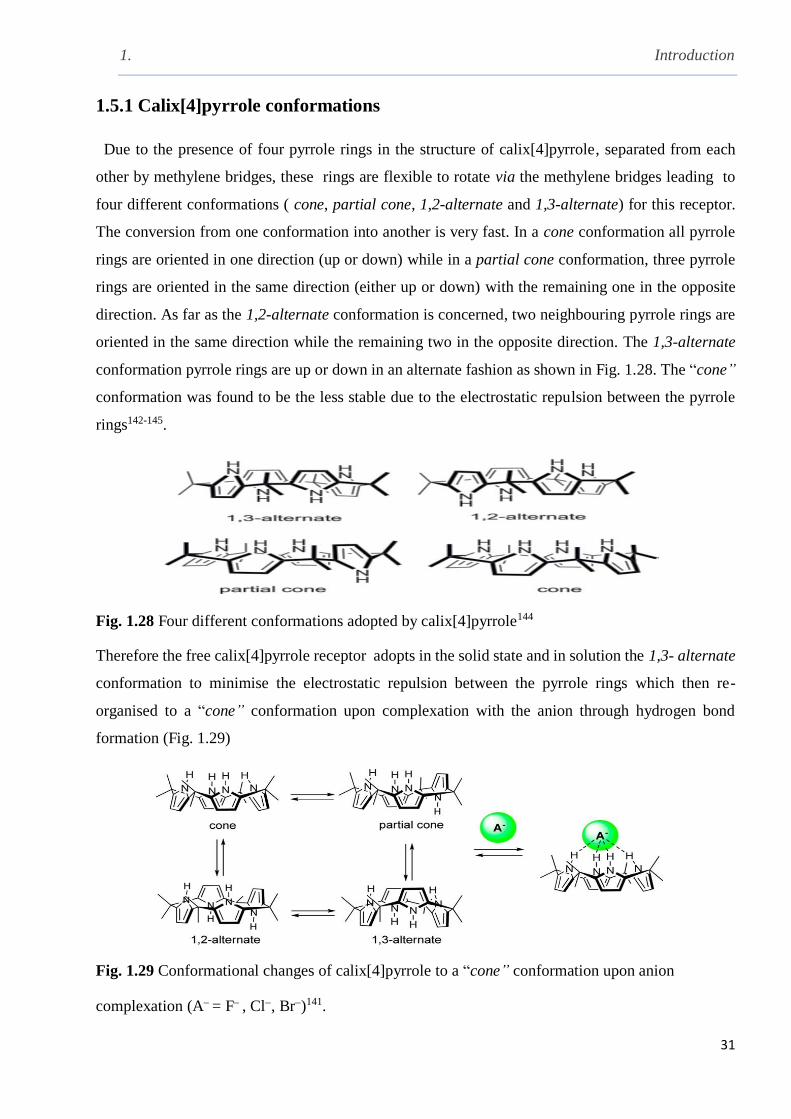
1. Introduction
31
1.5.1 Calix[4]pyrrole conformations
Due to the presence of four pyrrole rings in the structure of calix[4]pyrrole, separated from each
other by methylene bridges, these rings are flexible to rotate via the methylene bridges leading to
four different conformations ( cone, partial cone, 1,2-alternate and 1,3-alternate) for this receptor.
The conversion from one conformation into another is very fast. In a cone conformation all pyrrole
rings are oriented in one direction (up or down) while in a partial cone conformation, three pyrrole
rings are oriented in the same direction (either up or down) with the remaining one in the opposite
direction. As far as the 1,2-alternate conformation is concerned, two neighbouring pyrrole rings are
oriented in the same direction while the remaining two in the opposite direction. The 1,3-alternate
conformation pyrrole rings are up or down in an alternate fashion as shown in Fig. 1.28. The “cone”
conformation was found to be the less stable due to the electrostatic repulsion between the pyrrole
rings142-145.
Fig. 1.28 Four different conformations adopted by calix[4]pyrrole144
Therefore the free calix[4]pyrrole receptor adopts in the solid state and in solution the 1,3- alternate
conformation to minimise the electrostatic repulsion between the pyrrole rings which then re-
organised to a “cone” conformation upon complexation with the anion through hydrogen bond
formation (Fig. 1.29)
Fig. 1.29 Conformational changes of calix[4]pyrrole to a “cone” conformation upon anion
complexation (A = F , Cl, Br)141.
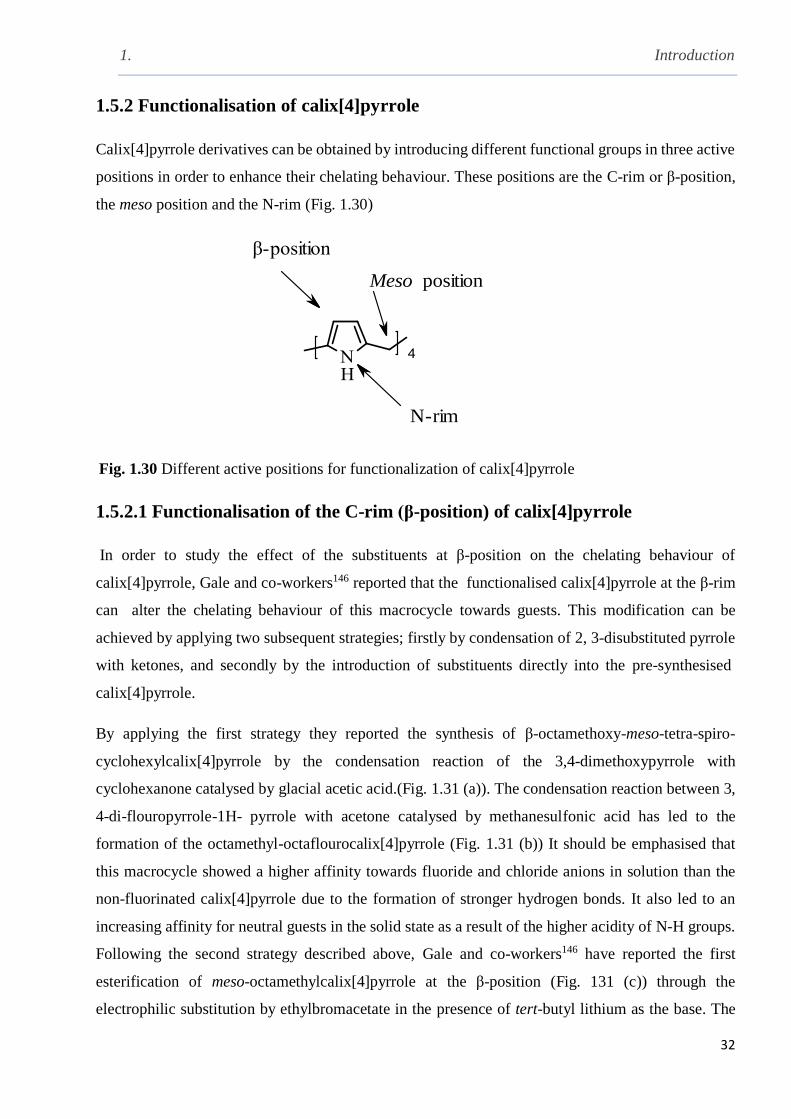
1. Introduction
32
1.5.2 Functionalisation of calix[4]pyrrole
Calix[4]pyrrole derivatives can be obtained by introducing different functional groups in three active
positions in order to enhance their chelating behaviour. These positions are the C-rim or β-position,
the meso position and the N-rim (Fig. 1.30)
Meso position
β-position
N-rim
Fig. 1.30 Different active positions for functionalization of calix[4]pyrrole
1.5.2.1 Functionalisation of the C-rim (β-position) of calix[4]pyrrole
In order to study the effect of the substituents at β-position on the chelating behaviour of
calix[4]pyrrole, Gale and co-workers146 reported that the functionalised calix[4]pyrrole at the β-rim
can alter the chelating behaviour of this macrocycle towards guests. This modification can be
achieved by applying two subsequent strategies; firstly by condensation of 2, 3-disubstituted pyrrole
with ketones, and secondly by the introduction of substituents directly into the pre-synthesised
calix[4]pyrrole.
By applying the first strategy they reported the synthesis of β-octamethoxy-meso-tetra-spiro-
cyclohexylcalix[4]pyrrole by the condensation reaction of the 3,4-dimethoxypyrrole with
cyclohexanone catalysed by glacial acetic acid.(Fig. 1.31 (a)). The condensation reaction between 3,
4-di-flouropyrrole-1H- pyrrole with acetone catalysed by methanesulfonic acid has led to the
formation of the octamethyl-octaflourocalix[4]pyrrole (Fig. 1.31 (b)) It should be emphasised that
this macrocycle showed a higher affinity towards fluoride and chloride anions in solution than the
non-fluorinated calix[4]pyrrole due to the formation of stronger hydrogen bonds. It also led to an
increasing affinity for neutral guests in the solid state as a result of the higher acidity of N-H groups.
Following the second strategy described above, Gale and co-workers146 have reported the first
esterification of meso-octamethylcalix[4]pyrrole at the β-position (Fig. 131 (c)) through the
electrophilic substitution by ethylbromacetate in the presence of tert-butyl lithium as the base. The
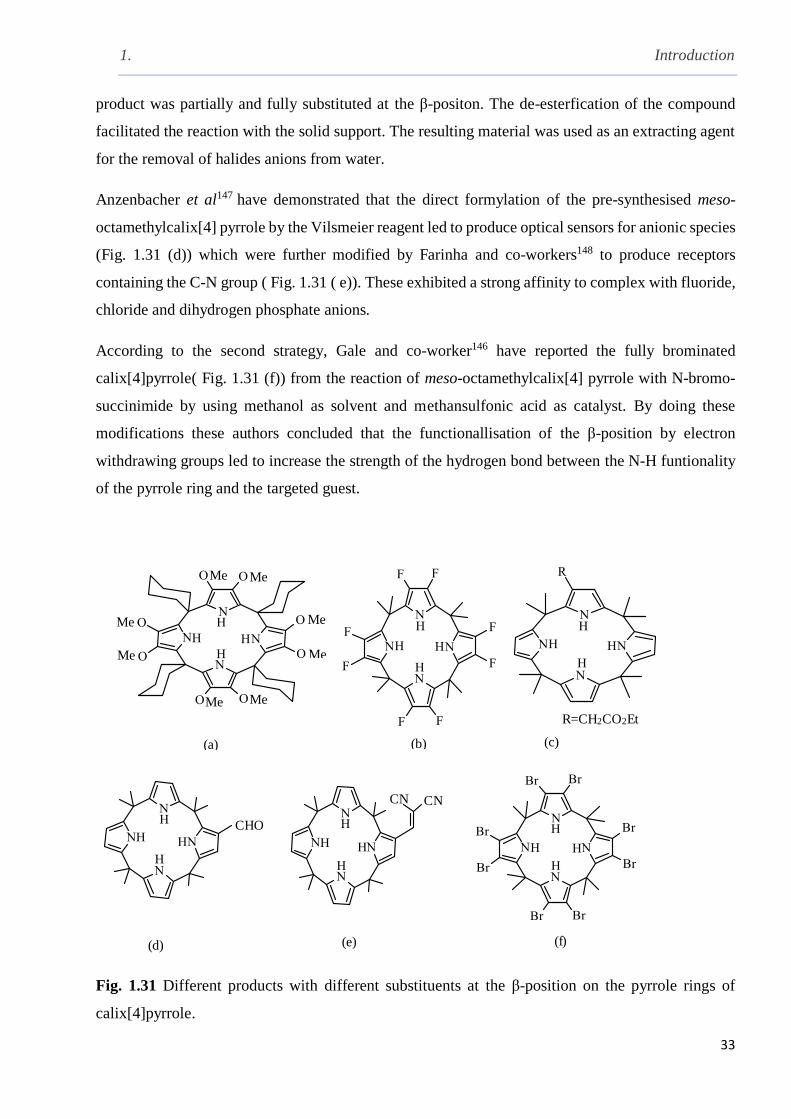
1. Introduction
33
product was partially and fully substituted at the β-positon. The de-esterfication of the compound
facilitated the reaction with the solid support. The resulting material was used as an extracting agent
for the removal of halides anions from water.
Anzenbacher et al147 have demonstrated that the direct formylation of the pre-synthesised meso-
octamethylcalix[4] pyrrole by the Vilsmeier reagent led to produce optical sensors for anionic species
(Fig. 1.31 (d)) which were further modified by Farinha and co-workers148 to produce receptors
containing the C-N group ( Fig. 1.31 ( e)). These exhibited a strong affinity to complex with fluoride,
chloride and dihydrogen phosphate anions.
According to the second strategy, Gale and co-worker146 have reported the fully brominated
calix[4]pyrrole( Fig. 1.31 (f)) from the reaction of meso-octamethylcalix[4] pyrrole with N-bromo-
succinimide by using methanol as solvent and methansulfonic acid as catalyst. By doing these
modifications these authors concluded that the functionallisation of the β-position by electron
withdrawing groups led to increase the strength of the hydrogen bond between the N-H funtionality
of the pyrrole ring and the targeted guest.
(f)
R=CH2CO2Et
(d) (e)
(a) (b) (c)
CHO
Me
CN CN
Me
Me
Me
Me
Me
MeMe
Fig. 1.31 Different products with different substituents at the β-position on the pyrrole rings of
calix[4]pyrrole.
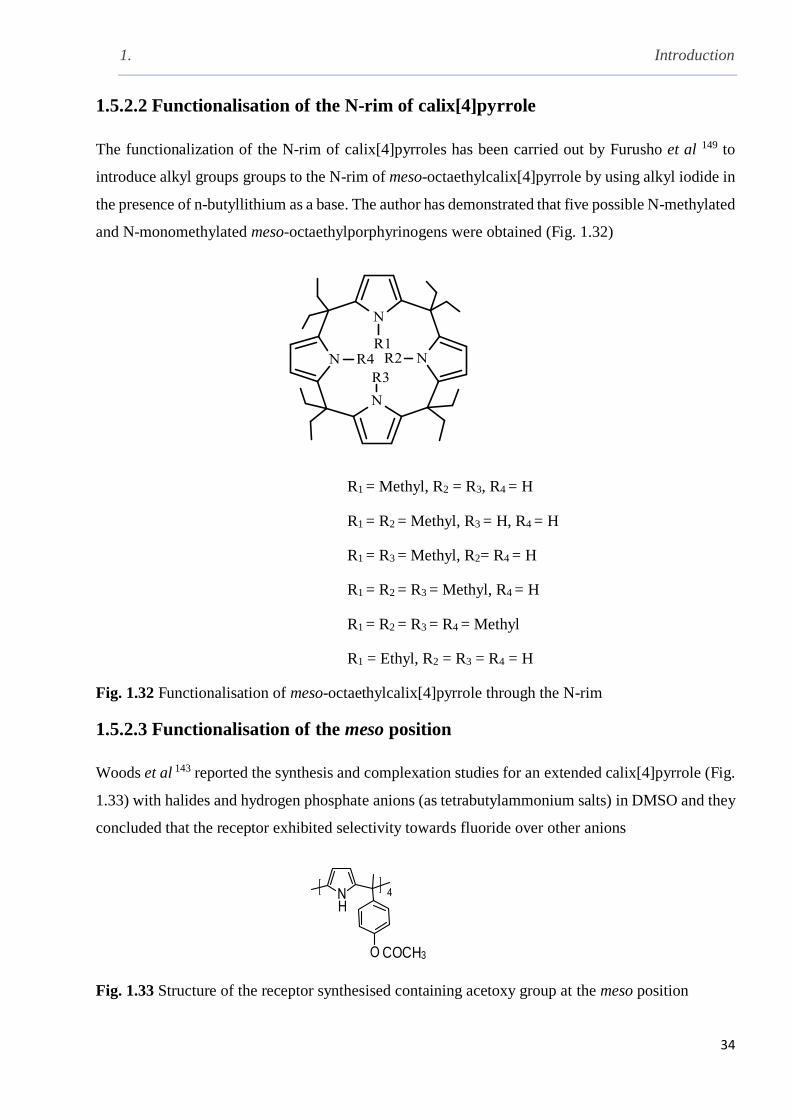
1. Introduction
34
1.5.2.2 Functionalisation of the N-rim of calix[4]pyrrole
The functionalization of the N-rim of calix[4]pyrroles has been carried out by Furusho et al 149 to
introduce alkyl groups groups to the N-rim of meso-octaethylcalix[4]pyrrole by using alkyl iodide in
the presence of n-butyllithium as a base. The author has demonstrated that five possible N-methylated
and N-monomethylated meso-octaethylporphyrinogens were obtained (Fig. 1.32)
R1 = Methyl, R2 = R3, R4 = H
R1 = R2 = Methyl, R3 = H, R4 = H
R1 = R3 = Methyl, R2= R4 = H
R1 = R2 = R3 = Methyl, R4 = H
R1 = R2 = R3 = R4 = Methyl
R1 = Ethyl, R2 = R3 = R4 = H
Fig. 1.32 Functionalisation of meso-octaethylcalix[4]pyrrole through the N-rim
1.5.2.3 Functionalisation of the meso position
Woods et al 143 reported the synthesis and complexation studies for an extended calix[4]pyrrole (Fig.
1.33) with halides and hydrogen phosphate anions (as tetrabutylammonium salts) in DMSO and they
concluded that the receptor exhibited selectivity towards fluoride over other anions
COCH3
Fig. 1.33 Structure of the receptor synthesised containing acetoxy group at the meso position
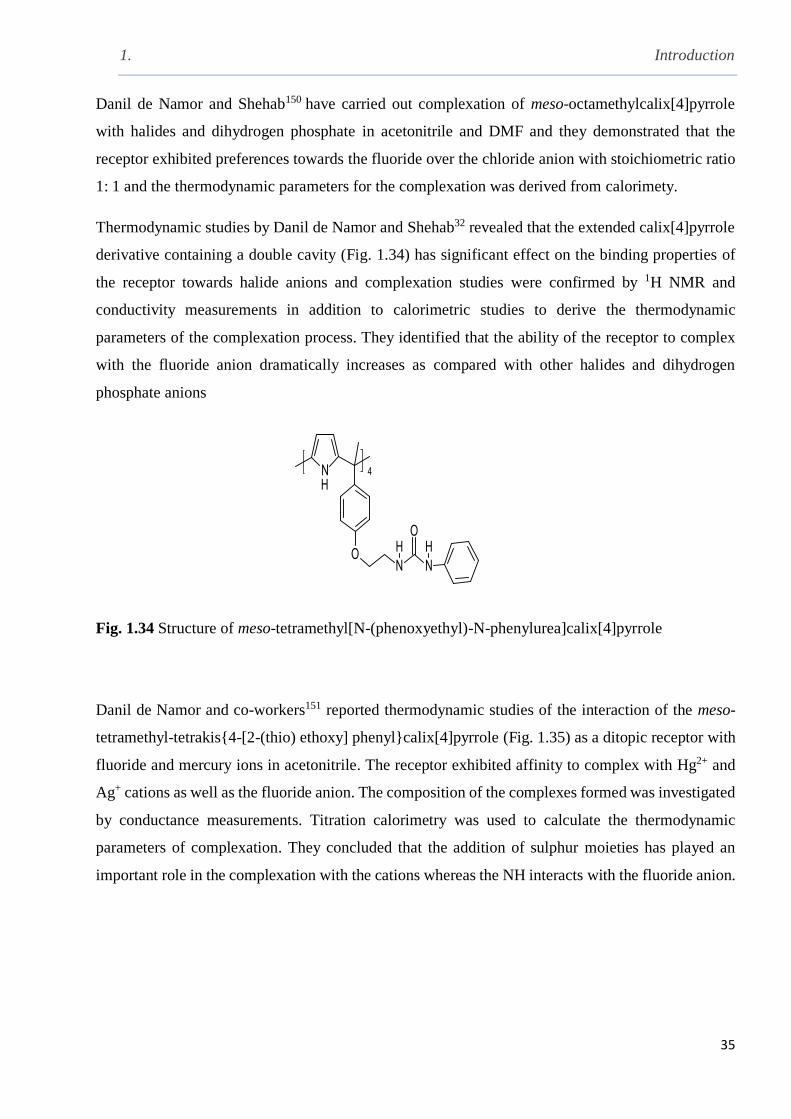
1. Introduction
35
Danil de Namor and Shehab150 have carried out complexation of meso-octamethylcalix[4]pyrrole
with halides and dihydrogen phosphate in acetonitrile and DMF and they demonstrated that the
receptor exhibited preferences towards the fluoride over the chloride anion with stoichiometric ratio
1: 1 and the thermodynamic parameters for the complexation was derived from calorimety.
Thermodynamic studies by Danil de Namor and Shehab32 revealed that the extended calix[4]pyrrole
derivative containing a double cavity (Fig. 1.34) has significant effect on the binding properties of
the receptor towards halide anions and complexation studies were confirmed by 1H NMR and
conductivity measurements in addition to calorimetric studies to derive the thermodynamic
parameters of the complexation process. They identified that the ability of the receptor to complex
with the fluoride anion dramatically increases as compared with other halides and dihydrogen
phosphate anions
Fig. 1.34 Structure of meso-tetramethyl[N-(phenoxyethyl)-N-phenylurea]calix[4]pyrrole
Danil de Namor and co-workers151 reported thermodynamic studies of the interaction of the meso-
tetramethyl-tetrakis{4-[2-(thio) ethoxy] phenyl}calix[4]pyrrole (Fig. 1.35) as a ditopic receptor with
fluoride and mercury ions in acetonitrile. The receptor exhibited affinity to complex with Hg2+ and
Ag+ cations as well as the fluoride anion. The composition of the complexes formed was investigated
by conductance measurements. Titration calorimetry was used to calculate the thermodynamic
parameters of complexation. They concluded that the addition of sulphur moieties has played an
important role in the complexation with the cations whereas the NH interacts with the fluoride anion.
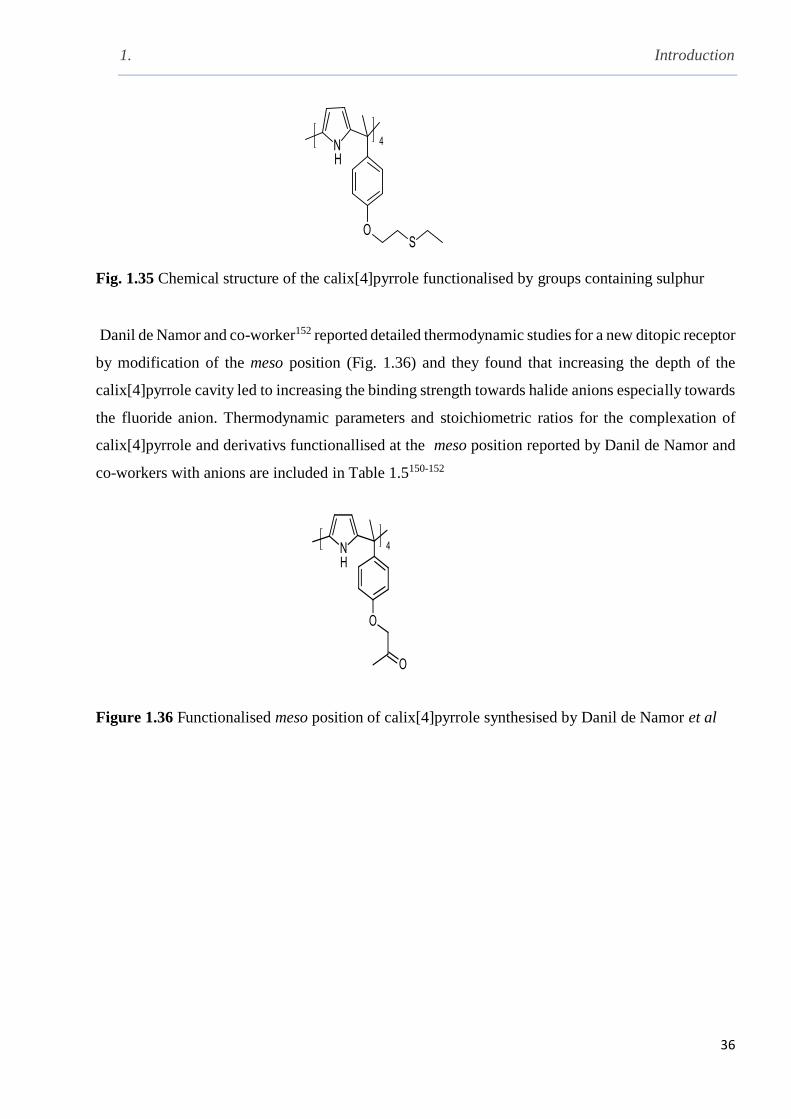
1. Introduction
36
Fig. 1.35 Chemical structure of the calix[4]pyrrole functionalised by groups containing sulphur
Danil de Namor and co-worker152 reported detailed thermodynamic studies for a new ditopic receptor
by modification of the meso position (Fig. 1.36) and they found that increasing the depth of the
calix[4]pyrrole cavity led to increasing the binding strength towards halide anions especially towards
the fluoride anion. Thermodynamic parameters and stoichiometric ratios for the complexation of
calix[4]pyrrole and derivativs functionallised at the meso position reported by Danil de Namor and
co-workers with anions are included in Table 1.5150-152
Figure 1.36 Functionalised meso position of calix[4]pyrrole synthesised by Danil de Namor et al

1. Introduction
37
Table 1.5 Thermodynamic parameters and stoichiometric ratios for the complexation of
calix[4]pyrrole and functionalised calix[4]pyrrole at the meso position with anions synthesised by
Danil de Namor and co-workers150-152.
Receptor Anion L: X log Ks ∆cG
kJ mol-1 ∆cH
kJ mol-
1
∆cS
J mol-1K-
1
F− 1: 1 6.21 -35.4 -43.5 -27
Cl− 1: 1 4.70 -26.8 -44.7 -60
Br− 1: 1 3.65 -20.8 -30.7 -33
I- 1: 1 1.55 -8.8 -4.0 15
H2PO4− 1: 1 5.00 -28.5 -48.1 -66
F− 1: 1 5.44 -31.1 -32.4 -5
Cl− 1: 1 3.82 -21.8 -20.5 5
Br− 1: 1 3.20 -18.2 -15.4 9
H2PO4− 1: 1 4.82 -27.5 -32.1 -15
F− 1: 1 3.08 -17.6 -97.1 -267
Cl− 1: 1 2.36 -13.5 -55.9 -142
Br− 1: 1 1.61 -9.2 -58.6 -166
H2PO4− 1: 1 4.80 -27.4 20.2 25
1:2 4.66 -15.2 -29.9 -50
R
R=CH2CH2NHCONHC6H5
F−
1: 1
1:2
5.00
4.72
-28.5
-27
-31.4
-61.5
-10
-116
Cl− 1: 1 2.43 -13.9 -86.4 -244
H2PO4-
1: 1
1:2
4.8
4.66
-27.4
-27.4
-61.5
-29.9
-116
-50
RR= -CH2COCH3
F−
1: 1
1:2
4.3
2.8
-24.6
-15.7
-21.1
-6.4
12
32
H2PO4− 1: 1 4.11 -23.4 -22.74 03
R
R=CH2CH2NHCONHC6H5
F− 1: 1 5.00 -28.7 -20.2 29
Cl− 1: 1 3.3 -18.7 -3.1 52
Br− 1: 1 2.2 -12.7 -1.8 36
F− 1: 2 5.25 -29.9 -31.5 -05
Cl− 1: 1 4.15 -23.7 -51.7 -95
Br− 1: 1 3.46 -19.7 -34.6 -49
H2PO4−
1: 1
1:2
4
3.7
-22.7
-21.2
-43.7
-17.8
-70
11
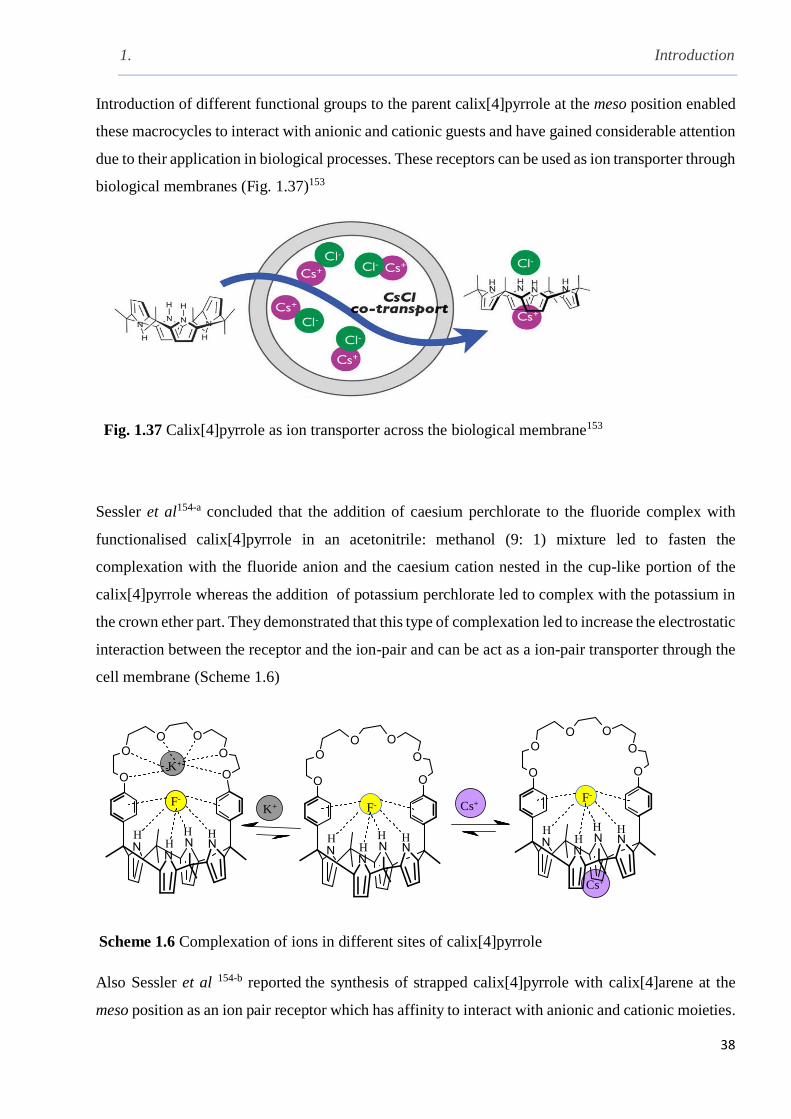
1. Introduction
38
Introduction of different functional groups to the parent calix[4]pyrrole at the meso position enabled
these macrocycles to interact with anionic and cationic guests and have gained considerable attention
due to their application in biological processes. These receptors can be used as ion transporter through
biological membranes (Fig. 1.37)153
Fig. 1.37 Calix[4]pyrrole as ion transporter across the biological membrane153
Sessler et al154-a concluded that the addition of caesium perchlorate to the fluoride complex with
functionalised calix[4]pyrrole in an acetonitrile: methanol (9: 1) mixture led to fasten the
complexation with the fluoride anion and the caesium cation nested in the cup-like portion of the
calix[4]pyrrole whereas the addition of potassium perchlorate led to complex with the potassium in
the crown ether part. They demonstrated that this type of complexation led to increase the electrostatic
interaction between the receptor and the ion-pair and can be act as a ion-pair transporter through the
cell membrane (Scheme 1.6)
K+
F-F-
F-
K+ Cs+
Cs+
Scheme 1.6 Complexation of ions in different sites of calix[4]pyrrole
Also Sessler et al 154-b reported the synthesis of strapped calix[4]pyrrole with calix[4]arene at the
meso position as an ion pair receptor which has affinity to interact with anionic and cationic moieties.
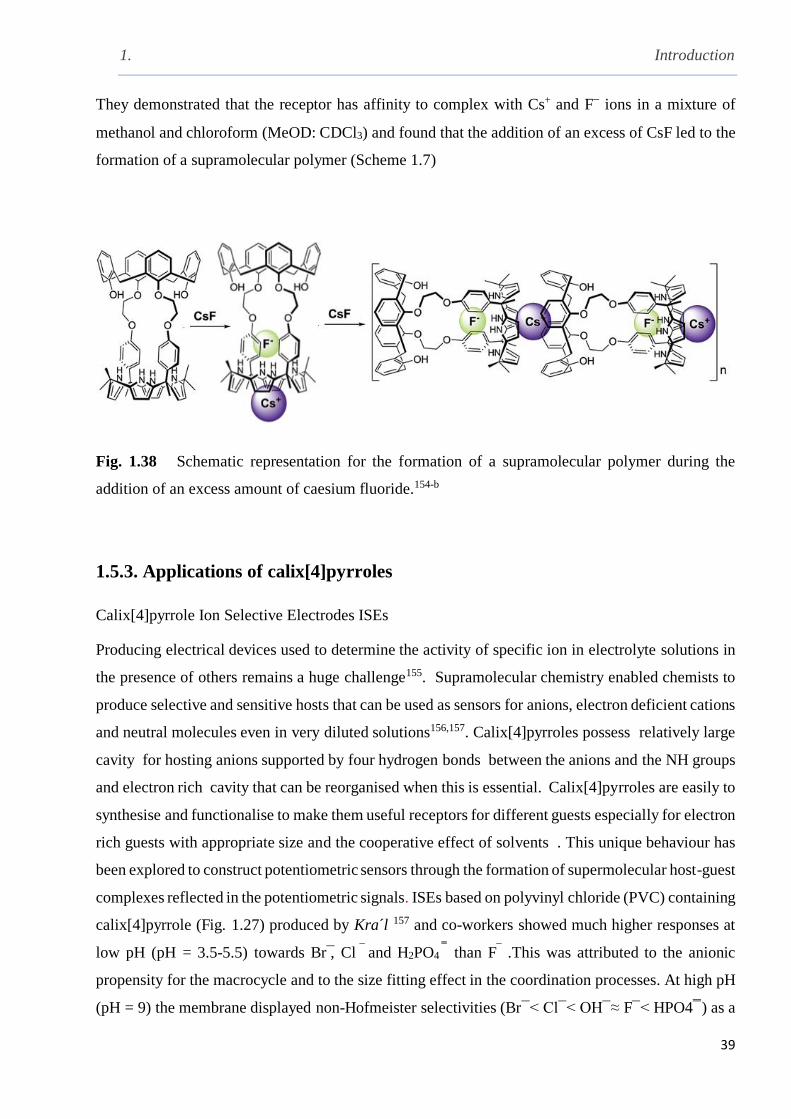
1. Introduction
39
They demonstrated that the receptor has affinity to complex with Cs+ and F— ions in a mixture of
methanol and chloroform (MeOD: CDCl3) and found that the addition of an excess of CsF led to the
formation of a supramolecular polymer (Scheme 1.7)
Fig. 1.38 Schematic representation for the formation of a supramolecular polymer during the
addition of an excess amount of caesium fluoride.154-b
1.5.3. Applications of calix[4]pyrroles
Calix[4]pyrrole Ion Selective Electrodes ISEs
Producing electrical devices used to determine the activity of specific ion in electrolyte solutions in
the presence of others remains a huge challenge155. Supramolecular chemistry enabled chemists to
produce selective and sensitive hosts that can be used as sensors for anions, electron deficient cations
and neutral molecules even in very diluted solutions156,157. Calix[4]pyrroles possess relatively large
cavity for hosting anions supported by four hydrogen bonds between the anions and the NH groups
and electron rich cavity that can be reorganised when this is essential. Calix[4]pyrroles are easily to
synthesise and functionalise to make them useful receptors for different guests especially for electron
rich guests with appropriate size and the cooperative effect of solvents . This unique behaviour has
been explored to construct potentiometric sensors through the formation of supermolecular host-guest
complexes reflected in the potentiometric signals. ISEs based on polyvinyl chloride (PVC) containing
calix[4]pyrrole (Fig. 1.27) produced by Kra´l 157 and co-workers showed much higher responses at
low pH (pH = 3.5-5.5) towards Br ̅, Cl ̅ and H2PO4 ̅̅̅ than F ̅ .This was attributed to the anionic
propensity for the macrocycle and to the size fitting effect in the coordination processes. At high pH
(pH = 9) the membrane displayed non-Hofmeister selectivities (Br ̅ ˂ Cl ̅ ˂ OH ̅ ≈ F ̅ ˂ HPO4 ̿) as a
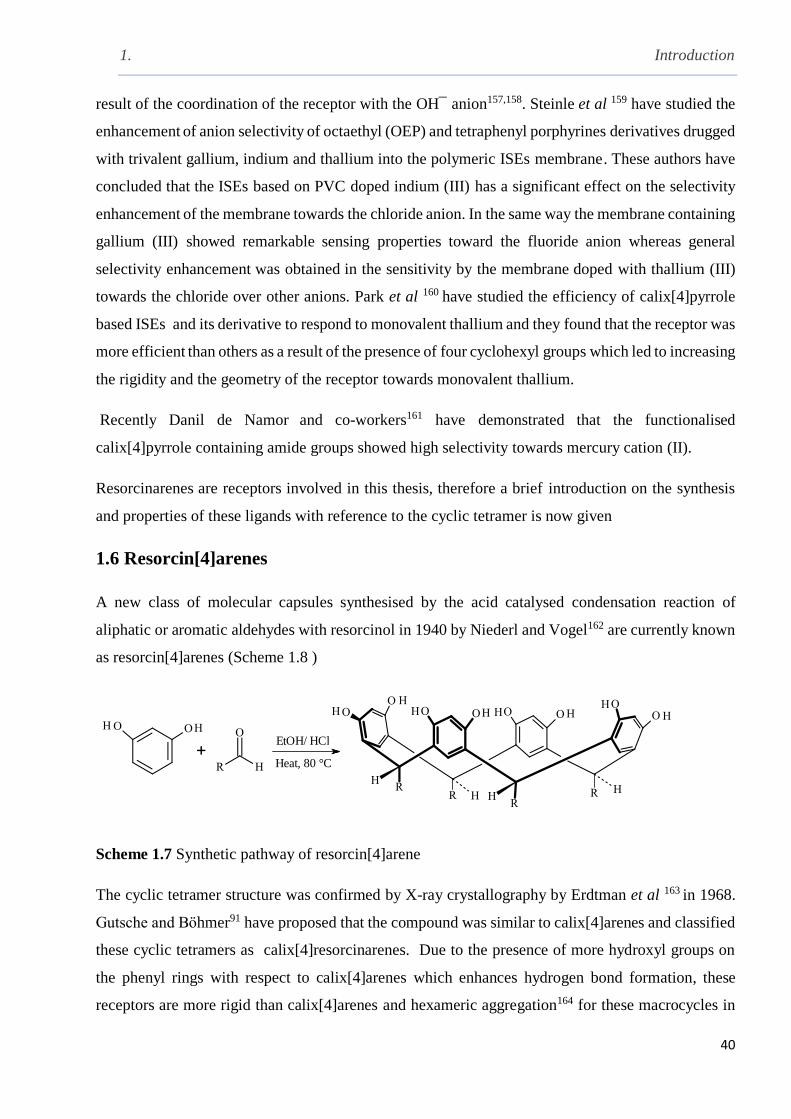
1. Introduction
40
result of the coordination of the receptor with the OH ̅ anion157,158. Steinle et al 159 have studied the
enhancement of anion selectivity of octaethyl (OEP) and tetraphenyl porphyrines derivatives drugged
with trivalent gallium, indium and thallium into the polymeric ISEs membrane. These authors have
concluded that the ISEs based on PVC doped indium (III) has a significant effect on the selectivity
enhancement of the membrane towards the chloride anion. In the same way the membrane containing
gallium (III) showed remarkable sensing properties toward the fluoride anion whereas general
selectivity enhancement was obtained in the sensitivity by the membrane doped with thallium (III)
towards the chloride over other anions. Park et al 160 have studied the efficiency of calix[4]pyrrole
based ISEs and its derivative to respond to monovalent thallium and they found that the receptor was
more efficient than others as a result of the presence of four cyclohexyl groups which led to increasing
the rigidity and the geometry of the receptor towards monovalent thallium.
Recently Danil de Namor and co-workers161 have demonstrated that the functionalised
calix[4]pyrrole containing amide groups showed high selectivity towards mercury cation (II).
Resorcinarenes are receptors involved in this thesis, therefore a brief introduction on the synthesis
and properties of these ligands with reference to the cyclic tetramer is now given
1.6 Resorcin[4]arenes
A new class of molecular capsules synthesised by the acid catalysed condensation reaction of
aliphatic or aromatic aldehydes with resorcinol in 1940 by Niederl and Vogel162 are currently known
as resorcin[4]arenes (Scheme 1.8 )
Heat, 80 °C
EtOH/ HCl
Scheme 1.7 Synthetic pathway of resorcin[4]arene
The cyclic tetramer structure was confirmed by X-ray crystallography by Erdtman et al 163 in 1968.
Gutsche and Bӧhmer91 have proposed that the compound was similar to calix[4]arenes and classified
these cyclic tetramers as calix[4]resorcinarenes. Due to the presence of more hydroxyl groups on
the phenyl rings with respect to calix[4]arenes which enhances hydrogen bond formation, these
receptors are more rigid than calix[4]arenes and hexameric aggregation164 for these macrocycles in
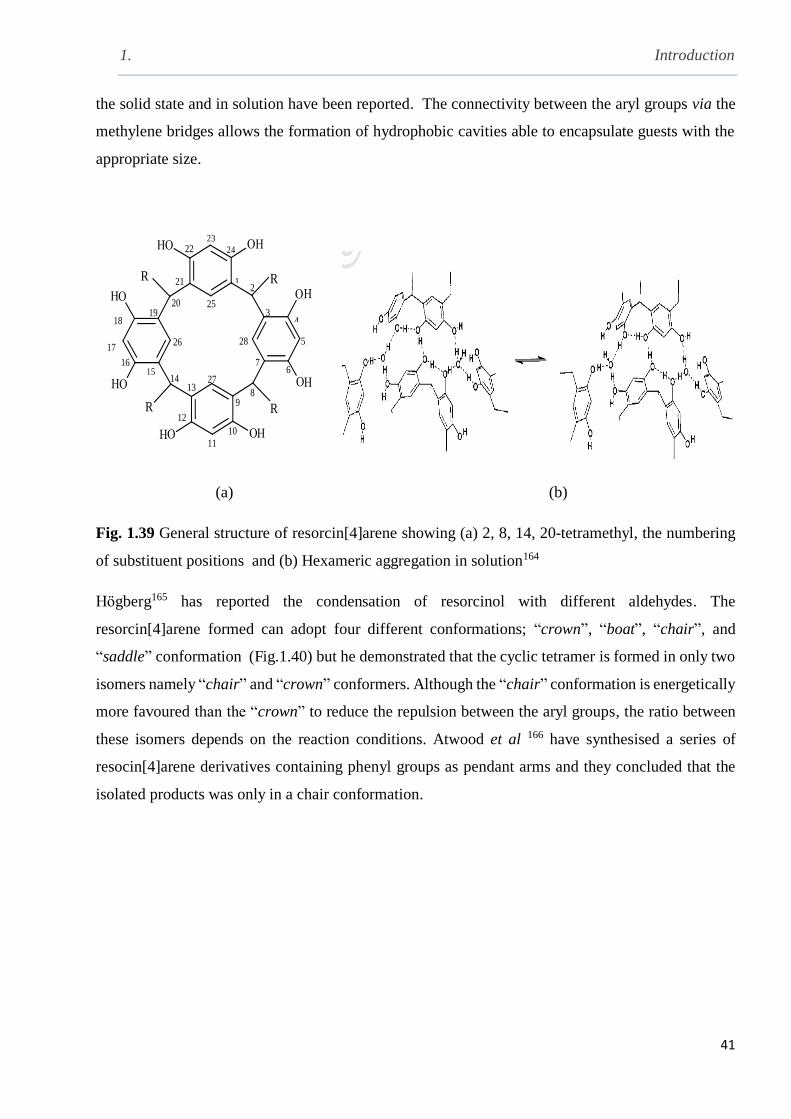
1. Introduction
41
the solid state and in solution have been reported. The connectivity between the aryl groups via the
methylene bridges allows the formation of hydrophobic cavities able to encapsulate guests with the
appropriate size.
12
4
6
89
11
1314
15
17
20
21
23
24
25
26 28
16
319
12
18
27
10
7
5
22
R
R R
R
(a) (b)
Fig. 1.39 General structure of resorcin[4]arene showing (a) 2, 8, 14, 20-tetramethyl, the numbering
of substituent positions and (b) Hexameric aggregation in solution164
Hӧgberg165 has reported the condensation of resorcinol with different aldehydes. The
resorcin[4]arene formed can adopt four different conformations; “crown”, “boat”, “chair”, and
“saddle” conformation (Fig.1.40) but he demonstrated that the cyclic tetramer is formed in only two
isomers namely “chair” and “crown” conformers. Although the “chair” conformation is energetically
more favoured than the “crown” to reduce the repulsion between the aryl groups, the ratio between
these isomers depends on the reaction conditions. Atwood et al 166 have synthesised a series of
resocin[4]arene derivatives containing phenyl groups as pendant arms and they concluded that the
isolated products was only in a chair conformation.

1. Introduction
42
Crown Chair
Boat Saddle
Fig. 1.40 Possible conformations can adopted by the resorcin[4]arene cyclic tetramer.
Atwood and co-workers167 in their pioneering work on C-methyl resorcin[4]arene in wetted
chloroform proved that the compound tends to form an hexameric capsule in the solid state aided
by eight water molecules. Rebek and Shivanyuk168 reported that the resorcin[4]arene containing
dodecyl pendant arms in moisturized chloroform tends to form a stable hexameric capsule driven by
the appropriate guest. Modification of these molecular capsules through the hydroxyl groups prevents
self-aggregation and leads to enhance their electrostatic attraction towards the guests. Steric factors
as well as the size of the guests play a crucial rule in the formation of molecular capsules. Danil de
Namor and co-workers have synthesised and characterised a resorcine[4]arene derivative containing
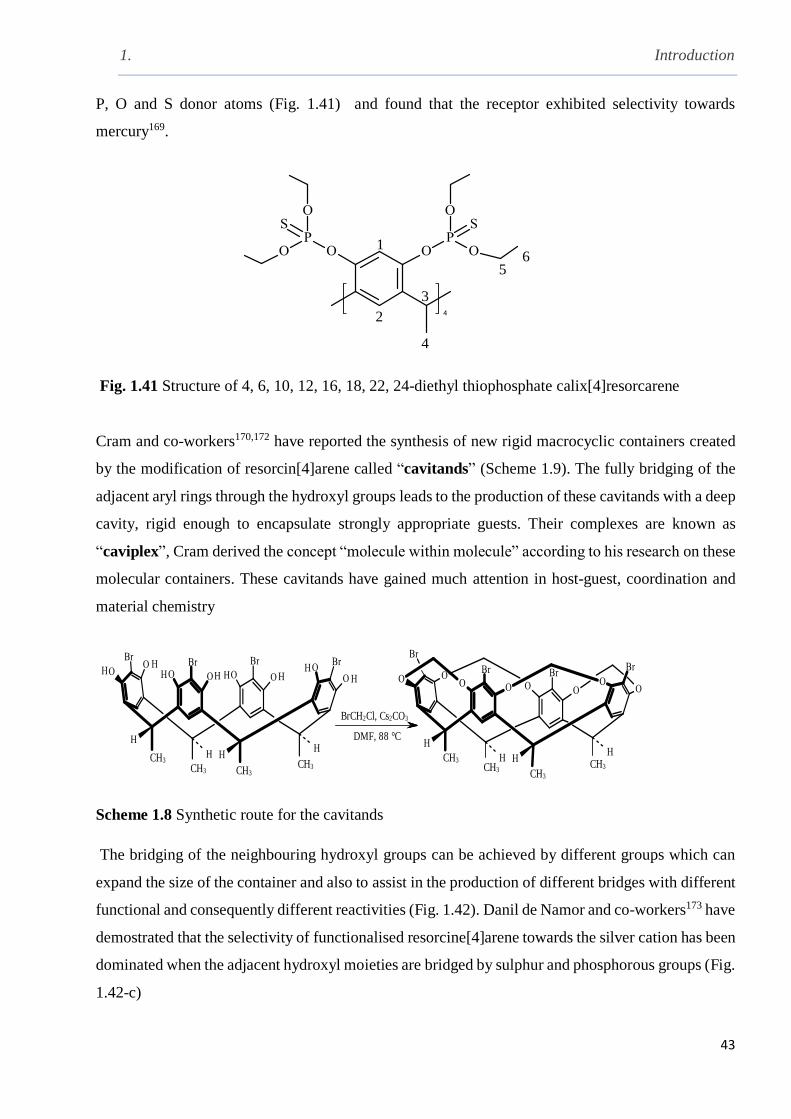
1. Introduction
43
P, O and S donor atoms (Fig. 1.41) and found that the receptor exhibited selectivity towards
mercury169.
1
2
3
4
56
Fig. 1.41 Structure of 4, 6, 10, 12, 16, 18, 22, 24-diethyl thiophosphate calix[4]resorcarene
Cram and co-workers170,172 have reported the synthesis of new rigid macrocyclic containers created
by the modification of resorcin[4]arene called “cavitands” (Scheme 1.9). The fully bridging of the
adjacent aryl rings through the hydroxyl groups leads to the production of these cavitands with a deep
cavity, rigid enough to encapsulate strongly appropriate guests. Their complexes are known as
“caviplex”, Cram derived the concept “molecule within molecule” according to his research on these
molecular containers. These cavitands have gained much attention in host-guest, coordination and
material chemistry
CH3
CH3
BrCH2Cl, Cs2CO3
DMF, 88 °C
CH3
CH3 CH3CH3CH3
CH3
Scheme 1.8 Synthetic route for the cavitands The bridging of the neighbouring hydroxyl groups can be achieved by different groups which can
expand the size of the container and also to assist in the production of different bridges with different
functional and consequently different reactivities (Fig. 1.42). Danil de Namor and co-workers173 have
demostrated that the selectivity of functionalised resorcine[4]arene towards the silver cation has been
dominated when the adjacent hydroxyl moieties are bridged by sulphur and phosphorous groups (Fig.
1.42-c)
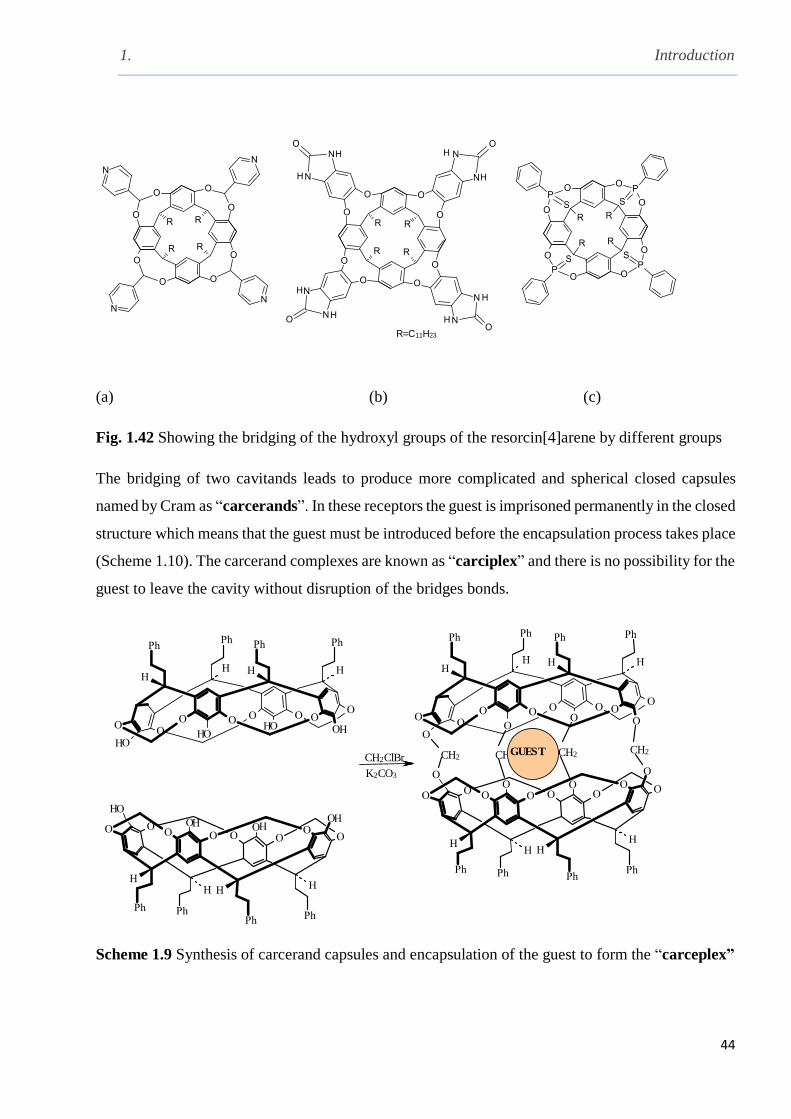
1. Introduction
44
R=C11H23
(a) (b) (c)
Fig. 1.42 Showing the bridging of the hydroxyl groups of the resorcin[4]arene by different groups
The bridging of two cavitands leads to produce more complicated and spherical closed capsules
named by Cram as “carcerands”. In these receptors the guest is imprisoned permanently in the closed
structure which means that the guest must be introduced before the encapsulation process takes place
(Scheme 1.10). The carcerand complexes are known as “carciplex” and there is no possibility for the
guest to leave the cavity without disruption of the bridges bonds.
CH2CH2 CH2CH2GUEST
CH2ClBr
K2CO3
Scheme 1.9 Synthesis of carcerand capsules and encapsulation of the guest to form the “carceplex”

1. Introduction
45
The partially bridging of the hydroxyl groups of cavitands has led to produce “hemicarcerands” in
which the guest can leave the cavity without any disruption to the host bonds (Scheme 1.11)171
BrCH2Cl CH2CH2 CH2GUEST
K2CO3
Scheme 1.10 Synthesis of an hemicarcerand and showing the formation of hemicarceplex and the
possibility of the guest to leave the cavity.
Given that in this thesis preliminary studies were carried out with pyrogallol[4]arenes, a brief
introduction on these macrocycles is now reported
1.7 Pyrogallol[4]arenes
These macrocyclic tetramers were first synthesised in 1990 from the condensation reaction between
pyrogallol and an aldehyde in acidic conditions (Scheme 1.12)
Heat, 80 °C
EtOH, H+
Scheme 1.11 Synthesis of the pyrogallol[4]arene macrocycle
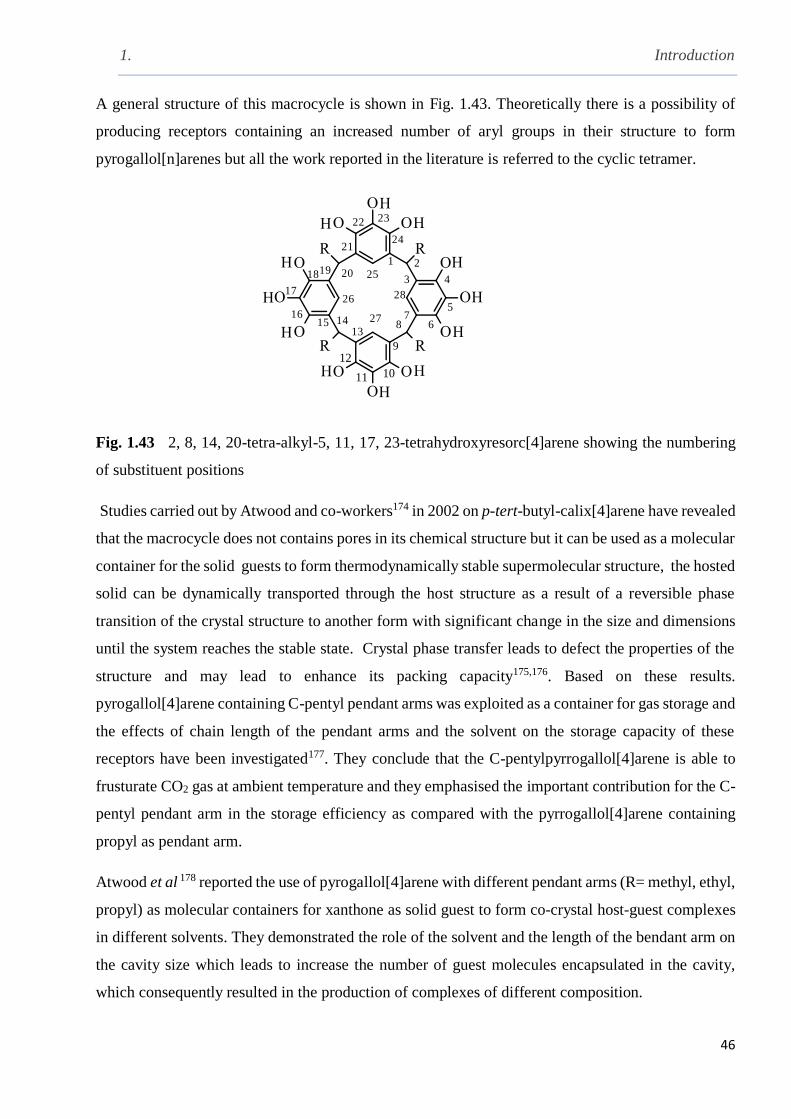
1. Introduction
46
A general structure of this macrocycle is shown in Fig. 1.43. Theoretically there is a possibility of
producing receptors containing an increased number of aryl groups in their structure to form
pyrogallol[n]arenes but all the work reported in the literature is referred to the cyclic tetramer.
1 2
4
68
9
11
131415
17
20
21
23
24
25
26 28
16
319
12
18
27
10
7
22
5
Fig. 1.43 2, 8, 14, 20-tetra-alkyl-5, 11, 17, 23-tetrahydroxyresorc[4]arene showing the numbering
of substituent positions
Studies carried out by Atwood and co-workers174 in 2002 on p-tert-butyl-calix[4]arene have revealed
that the macrocycle does not contains pores in its chemical structure but it can be used as a molecular
container for the solid guests to form thermodynamically stable supermolecular structure, the hosted
solid can be dynamically transported through the host structure as a result of a reversible phase
transition of the crystal structure to another form with significant change in the size and dimensions
until the system reaches the stable state. Crystal phase transfer leads to defect the properties of the
structure and may lead to enhance its packing capacity175,176. Based on these results.
pyrogallol[4]arene containing C-pentyl pendant arms was exploited as a container for gas storage and
the effects of chain length of the pendant arms and the solvent on the storage capacity of these
receptors have been investigated177. They conclude that the C-pentylpyrrogallol[4]arene is able to
frusturate CO2 gas at ambient temperature and they emphasised the important contribution for the C-
pentyl pendant arm in the storage efficiency as compared with the pyrrogallol[4]arene containing
propyl as pendant arm.
Atwood et al 178 reported the use of pyrogallol[4]arene with different pendant arms (R= methyl, ethyl,
propyl) as molecular containers for xanthone as solid guest to form co-crystal host-guest complexes
in different solvents. They demonstrated the role of the solvent and the length of the bendant arm on
the cavity size which leads to increase the number of guest molecules encapsulated in the cavity,
which consequently resulted in the production of complexes of different composition.
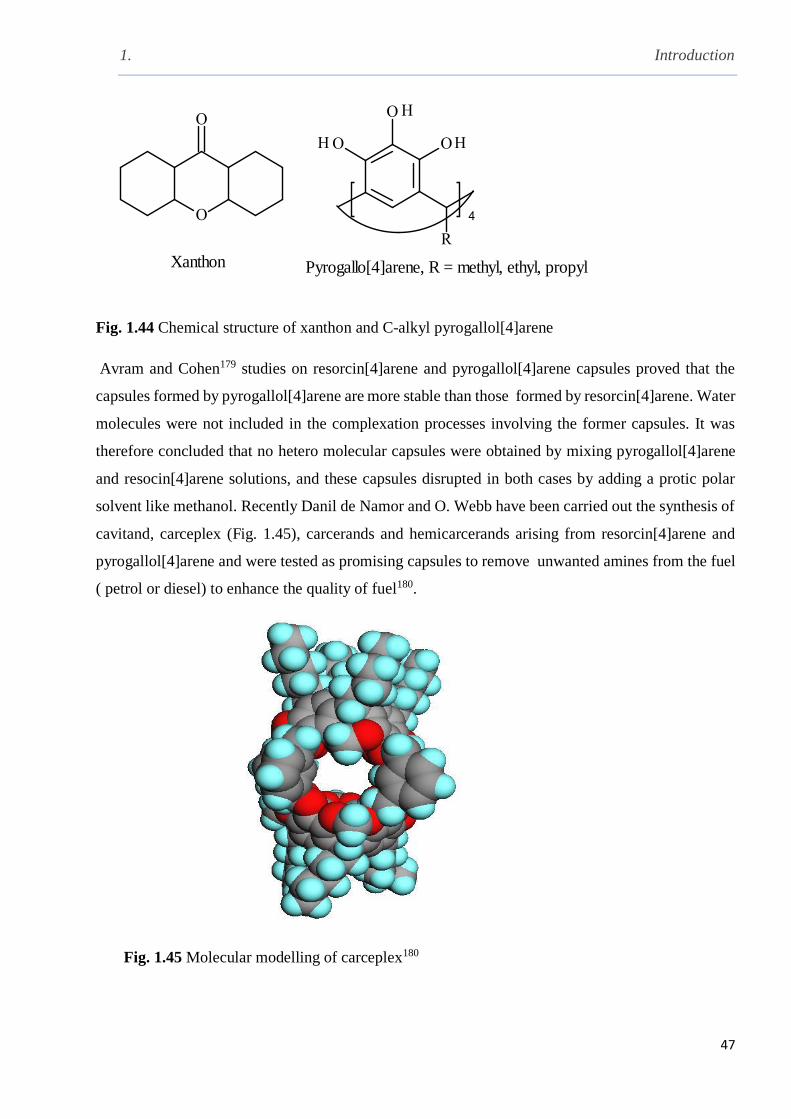
1. Introduction
47
Xanthon Pyrogallo[4]arene, R = methyl, ethyl, propyl
Fig. 1.44 Chemical structure of xanthon and C-alkyl pyrogallol[4]arene
Avram and Cohen179 studies on resorcin[4]arene and pyrogallol[4]arene capsules proved that the
capsules formed by pyrogallol[4]arene are more stable than those formed by resorcin[4]arene. Water
molecules were not included in the complexation processes involving the former capsules. It was
therefore concluded that no hetero molecular capsules were obtained by mixing pyrogallol[4]arene
and resocin[4]arene solutions, and these capsules disrupted in both cases by adding a protic polar
solvent like methanol. Recently Danil de Namor and O. Webb have been carried out the synthesis of
cavitand, carceplex (Fig. 1.45), carcerands and hemicarcerands arising from resorcin[4]arene and
pyrogallol[4]arene and were tested as promising capsules to remove unwanted amines from the fuel
( petrol or diesel) to enhance the quality of fuel180.
Fig. 1.45 Molecular modelling of carceplex180
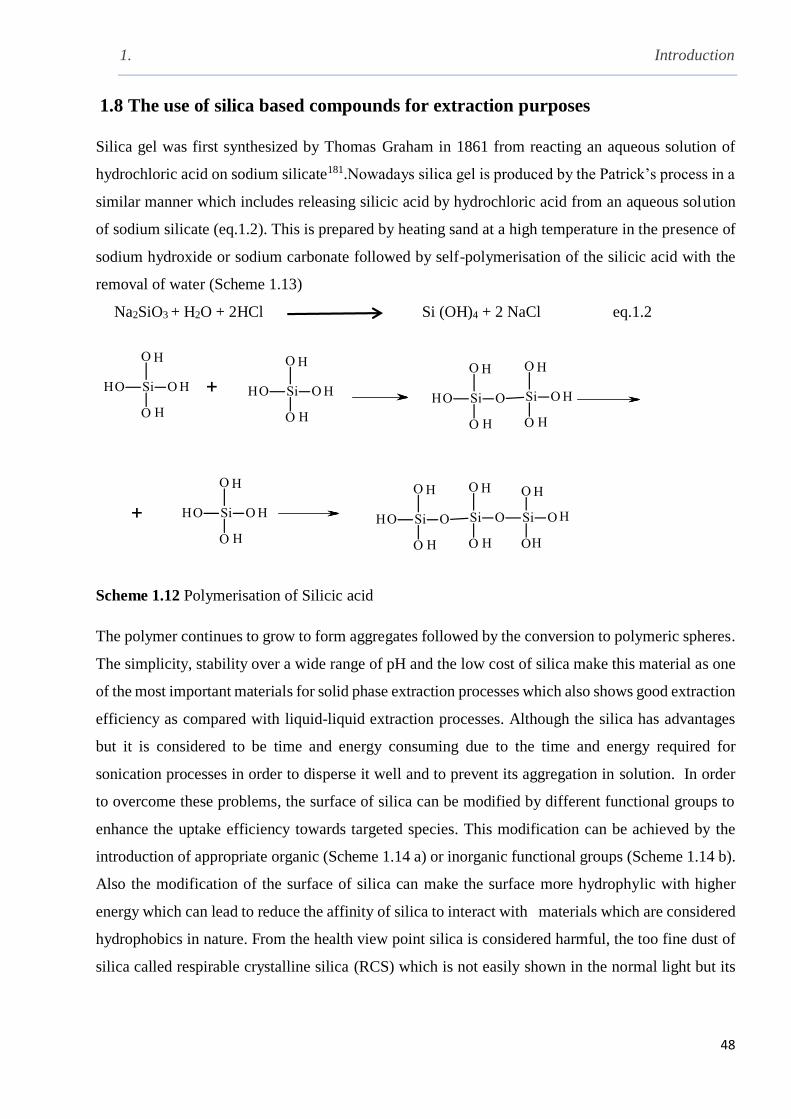
1. Introduction
48
1.8 The use of silica based compounds for extraction purposes
Silica gel was first synthesized by Thomas Graham in 1861 from reacting an aqueous solution of
hydrochloric acid on sodium silicate181.Nowadays silica gel is produced by the Patrick’s process in a
similar manner which includes releasing silicic acid by hydrochloric acid from an aqueous solution
of sodium silicate (eq.1.2). This is prepared by heating sand at a high temperature in the presence of
sodium hydroxide or sodium carbonate followed by self-polymerisation of the silicic acid with the
removal of water (Scheme 1.13)
Na2SiO3 + H2O + 2HCl Si (OH)4 + 2 NaCl eq.1.2
Scheme 1.12 Polymerisation of Silicic acid
The polymer continues to grow to form aggregates followed by the conversion to polymeric spheres.
The simplicity, stability over a wide range of pH and the low cost of silica make this material as one
of the most important materials for solid phase extraction processes which also shows good extraction
efficiency as compared with liquid-liquid extraction processes. Although the silica has advantages
but it is considered to be time and energy consuming due to the time and energy required for
sonication processes in order to disperse it well and to prevent its aggregation in solution. In order
to overcome these problems, the surface of silica can be modified by different functional groups to
enhance the uptake efficiency towards targeted species. This modification can be achieved by the
introduction of appropriate organic (Scheme 1.14 a) or inorganic functional groups (Scheme 1.14 b).
Also the modification of the surface of silica can make the surface more hydrophylic with higher
energy which can lead to reduce the affinity of silica to interact with materials which are considered
hydrophobics in nature. From the health view point silica is considered harmful, the too fine dust of
silica called respirable crystalline silica (RCS) which is not easily shown in the normal light but its
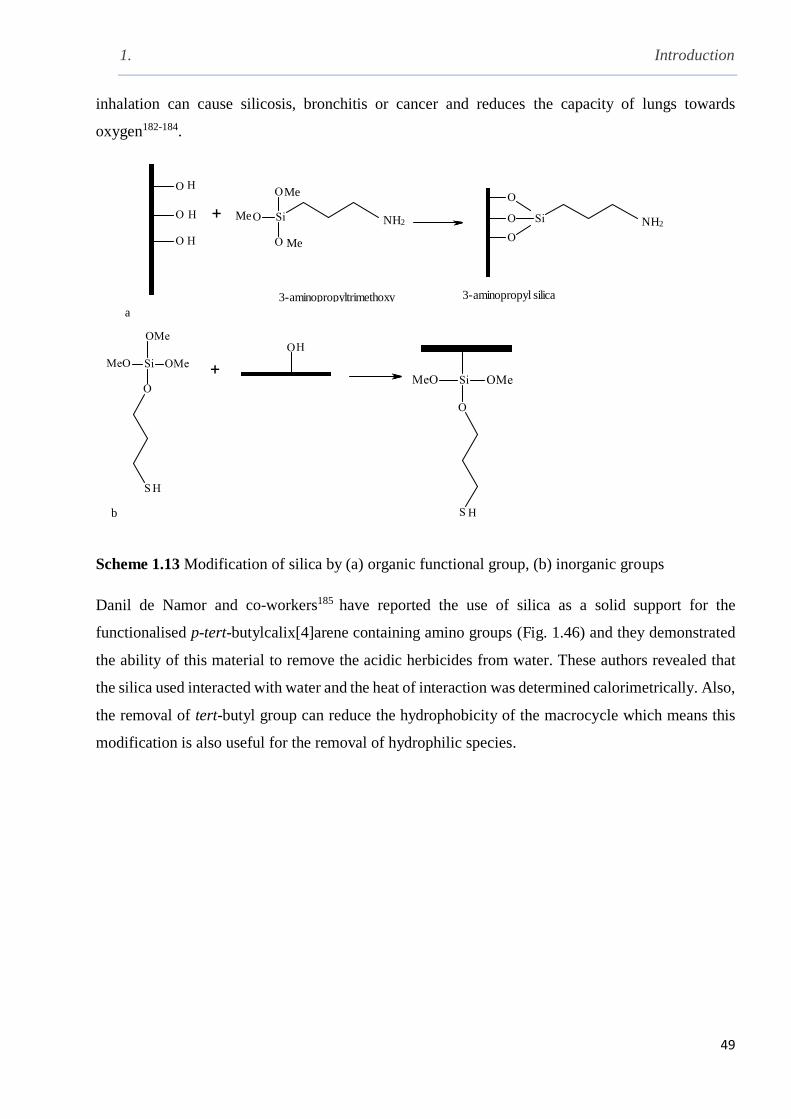
1. Introduction
49
inhalation can cause silicosis, bronchitis or cancer and reduces the capacity of lungs towards
oxygen182-184.
NH2 NH2Me
Me
Me
3-aminopropyltrimethoxy 3-aminopropyl silica
a
b
Scheme 1.13 Modification of silica by (a) organic functional group, (b) inorganic groups
Danil de Namor and co-workers185 have reported the use of silica as a solid support for the
functionalised p-tert-butylcalix[4]arene containing amino groups (Fig. 1.46) and they demonstrated
the ability of this material to remove the acidic herbicides from water. These authors revealed that
the silica used interacted with water and the heat of interaction was determined calorimetrically. Also,
the removal of tert-butyl group can reduce the hydrophobicity of the macrocycle which means this
modification is also useful for the removal of hydrophilic species.
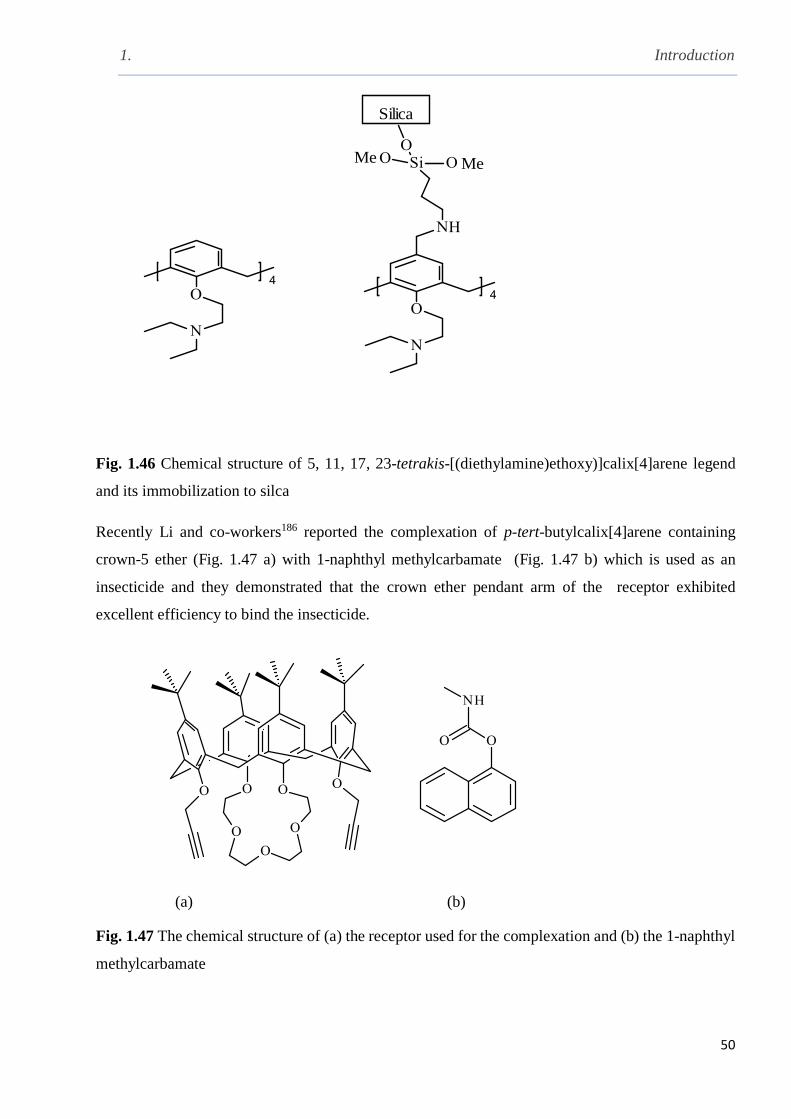
1. Introduction
50
Silica
MeMe
Fig. 1.46 Chemical structure of 5, 11, 17, 23-tetrakis-[(diethylamine)ethoxy)]calix[4]arene legend
and its immobilization to silca
Recently Li and co-workers186 reported the complexation of p-tert-butylcalix[4]arene containing
crown-5 ether (Fig. 1.47 a) with 1-naphthyl methylcarbamate (Fig. 1.47 b) which is used as an
insecticide and they demonstrated that the crown ether pendant arm of the receptor exhibited
excellent efficiency to bind the insecticide.
(a) (b)
Fig. 1.47 The chemical structure of (a) the receptor used for the complexation and (b) the 1-naphthyl
methylcarbamate
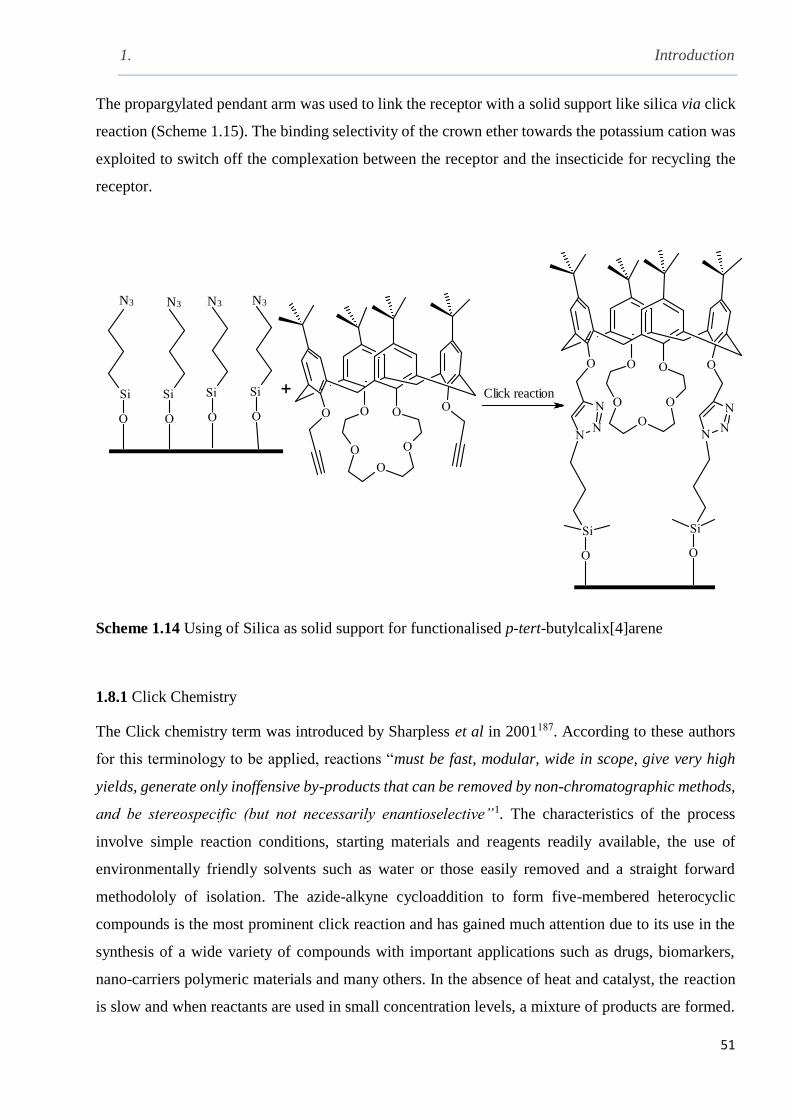
1. Introduction
51
The propargylated pendant arm was used to link the receptor with a solid support like silica via click
reaction (Scheme 1.15). The binding selectivity of the crown ether towards the potassium cation was
exploited to switch off the complexation between the receptor and the insecticide for recycling the
receptor.
N3
Click reaction
N3N3 N3
Scheme 1.14 Using of Silica as solid support for functionalised p-tert-butylcalix[4]arene
1.8.1 Click Chemistry
The Click chemistry term was introduced by Sharpless et al in 2001187. According to these authors
for this terminology to be applied, reactions “must be fast, modular, wide in scope, give very high
yields, generate only inoffensive by-products that can be removed by non-chromatographic methods,
and be stereospecific (but not necessarily enantioselective”1. The characteristics of the process
involve simple reaction conditions, starting materials and reagents readily available, the use of
environmentally friendly solvents such as water or those easily removed and a straight forward
methodololy of isolation. The azide-alkyne cycloaddition to form five-membered heterocyclic
compounds is the most prominent click reaction and has gained much attention due to its use in the
synthesis of a wide variety of compounds with important applications such as drugs, biomarkers,
nano-carriers polymeric materials and many others. In the absence of heat and catalyst, the reaction
is slow and when reactants are used in small concentration levels, a mixture of products are formed.
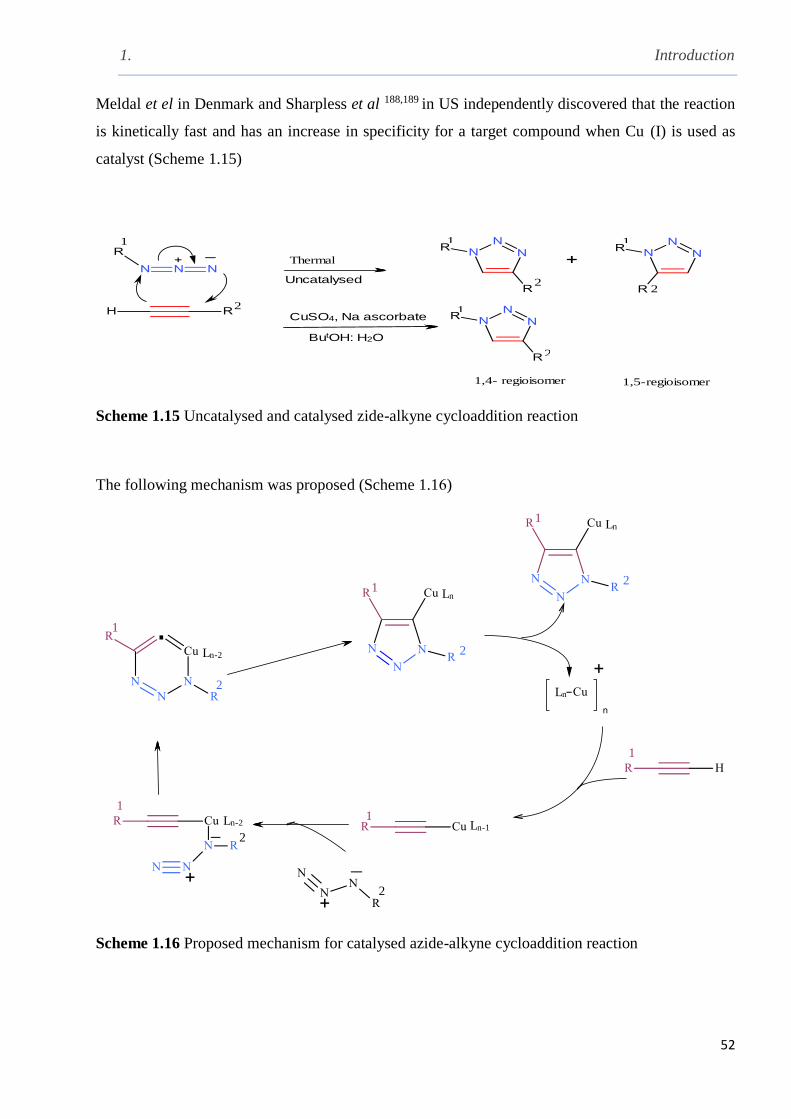
1. Introduction
52
Meldal et el in Denmark and Sharpless et al 188,189 in US independently discovered that the reaction
is kinetically fast and has an increase in specificity for a target compound when Cu (I) is used as
catalyst (Scheme 1.15)
Uncatalysed
CuSO4, Na ascorbate
ButOH: H2O
1
2
Thermal
1,4- regioisomer 1,5-regioisomer
2
22
1
1
1
Scheme 1.15 Uncatalysed and catalysed zide-alkyne cycloaddition reaction
The following mechanism was proposed (Scheme 1.16)
1
2
.
1Ln
2
Ln
1
Ln-1Ln-2
2
2
Ln-2
1
1Ln
1
2
Scheme 1.16 Proposed mechanism for catalysed azide-alkyne cycloaddition reaction
1. Introduction
53
1.9 BET Theory
BET is the abbreviation of three names of three scientists; Brunauer, Emmett and Teller (BET),
BET theory was suggested by the above scientists to describe the ability of porous materials to
adsorb gases such as nitrogen gas by specific surface area and this ability can be expressed by the
following BET equation (eq.1.3)
1/ (W ((P/P ◦) −1)= 1/WmC +( C −1) /Wm C {P/ P ◦)} eq.1.3
In this equation, W is the weight of gas adsorbed, P/P◦ is the relative pressure in torr unit applied on
the solid sample, Wm is the weight of the solid as a monolayer and C is the BET constant. Plotting
the relation of 1/ [W (P / P◦) -1] against P/P
◦ gives a straight line for most solids, using nitrogen as
adsorbent. The porosity of the material under study can be predicted from the plot190,191
1.10 Aims of the Thesis
This thesis is concerned with the design, synthesis and characterisation of a number of macrocyclic
receptors (host) with the ability to bind biologically active species (guest). In addition, a
functionalised silica will be tested for the same purpose. Pharmaceuticals are targeted in this thesis
due to lack of thermodynamic studies concerning the interaction of macrocyclic receptors with
pharmaceuticals. Supramolecular hosts are selected due to their selective behaviour for a particular
guest, provided suitable functionalities are incorporated in their structure. The pharmaceuticals
selected are diclofenac, sodium diclofenac (NaDF), chlofibric acid, ibuprofen, aspirin and
carbamazepine (CBZ) due to their common usage (Table 1.6). Diclofenac belongs to the group of
non-steroidal anti-inflammatory drugs (NSAIDs) used in human medical care to treat painful
conditions such as arthritis, sprains and strains, gout, migraine, dental and pain after surgical
operations. It is a pain-killer which also reduces inflammation. Ibuprofen (also belongs to NSAIDs)
is used as an analgesic and antipyretic. Aspirin (NSAIDs) is used as an analgesic, antipyretic, anti-
inflammatory and anti-coagulant, carbamazepine is an anti-epileptically drug used worldwide.
Clorofibric acid is used as a lipid regulator in blood to lower the risk of atherosclerosis192,193.
The design and synthesis of macrocyclic receptors able to interact with the selected drugs requires
information about the guest such as its solubility in water and common organic solvents as well as
knowledge of the partition coefficients for these drugs in water-membrane-like solvent systems.
Receptors to be synthesised and characterised are cyclodextrins (heptakis-(6-chloro-6-deoxy)-β–
cyclodextrin and heptakis-( 2, 3 , 6-tri-O-benzoyl)-ß-cyclodextrin) and synthetic macrocycles such
1. Introduction
54
as calix[4]arenes (5, 11, 17, 23- tert-butyl-25, 26, 27, 28-(O-ethylethanoate)calix[4]arene, 5, 11, 17,
23- tetra-tert-butyl, 25, 27-bis (2-cyanomethoxy)-26, 28-dihydroxycalix[4]arene , 25, 27-dihydroxy-
26-28-(dioxypropargyl) tert-butylcalix[4]arene , 4-tert-butyl-azidocalix[4]arene,25, 26, 27, 28-
(diethylamino) ethoxycalix[4]arene), calix[4]pyrroles (meso-tetramethyl-tetrakis-(4-hydroxyphenyl
ethyl) calix[4]pyrrole, meso-tetramethyl-tetrakis-(4-ethylacetatophenoxyethyl) calix[4]pyrrole ),
resorc[4]arene (C-pentyl-resorcin[4]arene ,C-pentylresorci[4]arene ester) and pyrogallol[4]arene (C-
decyl pyrogallol[4]arene and C-4-aminophenyl pyrogallol[4]arene) Fig. 1.48 and Fig. 49. This is to
be followed by 1H NMR studies to obtain information whether or not interaction between receptor
and drug takes place and if so the identification of the active sites of the receptor. From all receptors
synthesised, the ones selected for further studies involving drugs (aspirin, clofibric acid, diclofenac,
sodium diclofenac, ibuprofen and carbamazepine) were the calix[4]arene ester, (5, 11, 17, 27- tert-
butyl-25, 26, 27, 28-(ethylacetatoethoxy)calix[4]arene) CAE, the per-benzoylated cyclodextrin
(BzBCD), the partially functionalised calix[4]arene amine derivative (5, 11, 17, 23 tetra-p-tert-butyl,
25, 27- bis[aminoethoxy], 26, 28 dihydroxycalix[4]arene) (CA-(NH2)2), C-decylpyrogallol[4]arene
(PG11), calix[4]pyrrole derivatives which are meso-tetramethyl-tetrakis-(4-hydroxyphenyl
ethyl)calix[4]pyrrole (TTHCP) and meso-tetramethyl-tetrakis-(4-ethylacetatophenoxyethyl)
calix[4]pyrrole (TTECP) . The 3 –aminopropyl functionalised silica gel was used for the removal of
aspirin from water. When ionic species are present or occur as a result of complexation, conductivity
measurements will be performed to establish the composition of the complex and obtain qualitative
information on the strength of host-guest binding and also the stoichiometry of the complexation. UV
measurements will be explored to further corroborate the composition of the complex. Whenever
possible the complexation process will be thermodynamically characterised to obtain the stability
constant (log Ks) and the standard Gibbs energy ΔcG°, enthalpy ΔcH° and entropy ΔcS° associated
with this process. Aminopropyl silica will be also tested to remove the selected drugs from water.
Following previous work on calix[4]ester derivatives and their complexation with metal cations in a
variety of solvents, calix[4]pyrrole esters will be for the first time synthesised and characterised and
their binding properties will be investigated. The aim of this part of the work is to assess the effect of
i) the calix structure on the selective complexation of cations and ii) the ester functionality on the
recognition of anions by calix[4]pyrrole. The strategy of this research is shown in Scheme 1.18
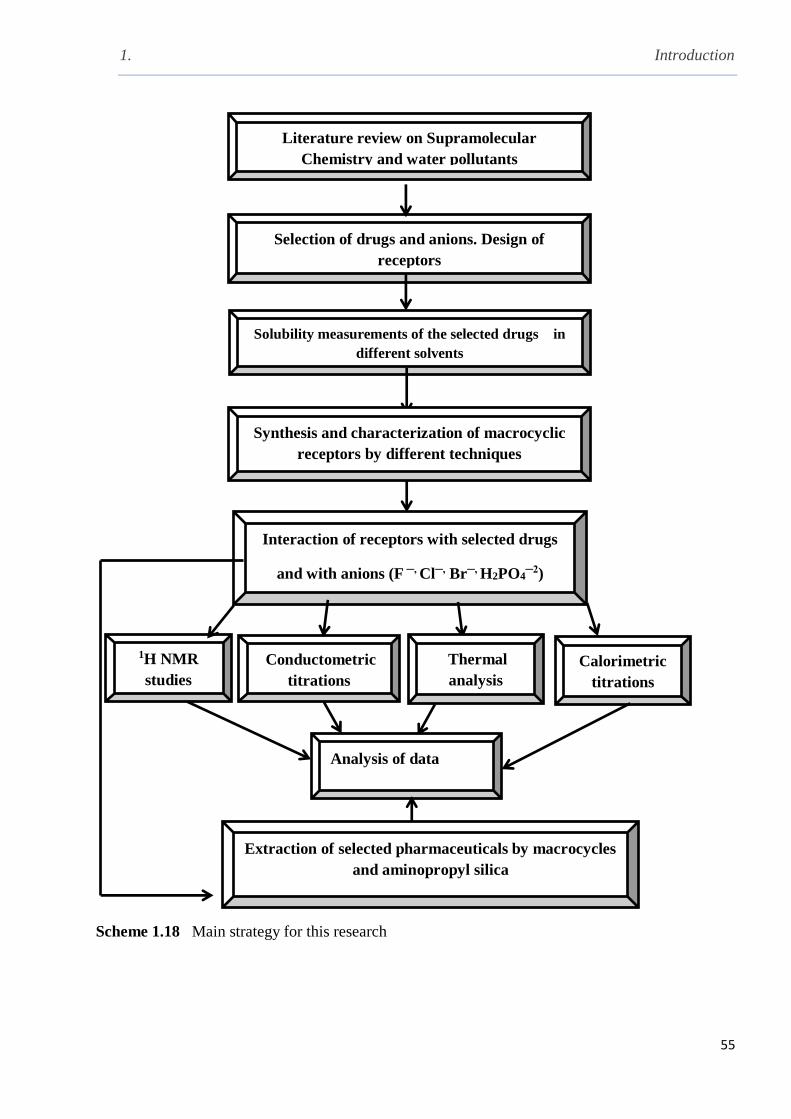
1. Introduction
55
Scheme 1.18 Main strategy for this research
Selection of drugs and anions. Design of
receptors
Solubility measurements of the selected drugs in
different solvents
Interaction of receptors with selected drugs
and with anions (F ─, Cl─, Br─, H2PO4─2)
Calorimetric
titrations
Conductometric
titrations
1H NMR
studies
Synthesis and characterization of macrocyclic
receptors by different techniques
Literature review on Supramolecular
Chemistry and water pollutants
Analysis of data
Extraction of selected pharmaceuticals by macrocycles
and aminopropyl silica
Thermal
analysis
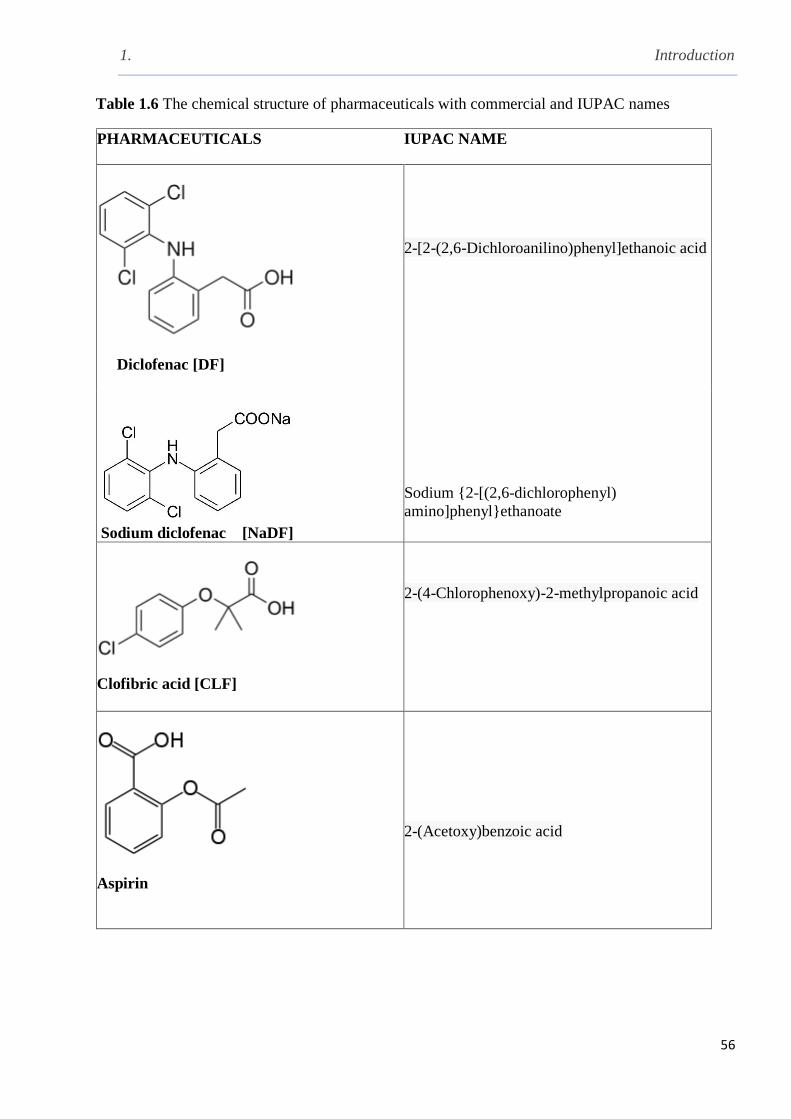
1. Introduction
56
Table 1.6 The chemical structure of pharmaceuticals with commercial and IUPAC names
PHARMACEUTICALS
IUPAC NAME
Diclofenac [DF]
2-[2-(2,6-Dichloroanilino)phenyl]ethanoic acid
Sodium diclofenac [NaDF]
Sodium {2-[(2,6-dichlorophenyl)
amino]phenyl}ethanoate
Clofibric acid [CLF]
2-(4-Chlorophenoxy)-2-methylpropanoic acid
Aspirin
2-(Acetoxy)benzoic acid
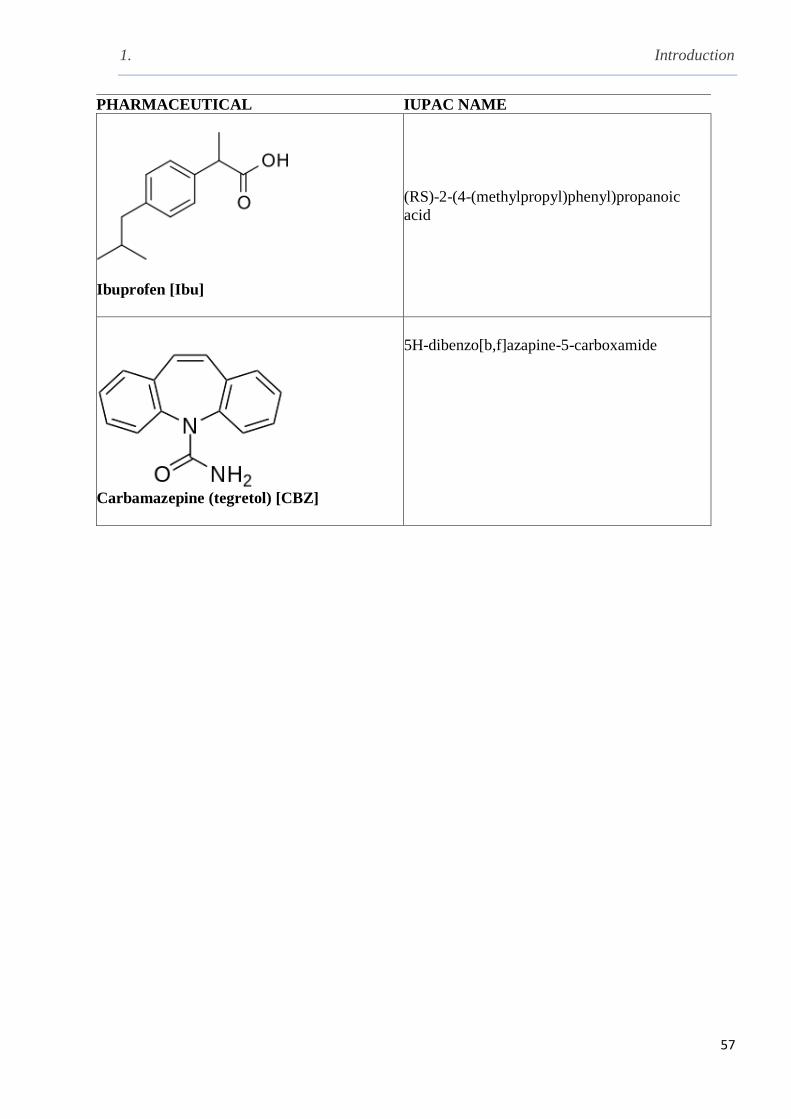
1. Introduction
57
PHARMACEUTICAL IUPAC NAME
Ibuprofen [Ibu]
(RS)-2-(4-(methylpropyl)phenyl)propanoic
acid
Carbamazepine (tegretol) [CBZ]
5H-dibenzo[b,f]azapine-5-carboxamide
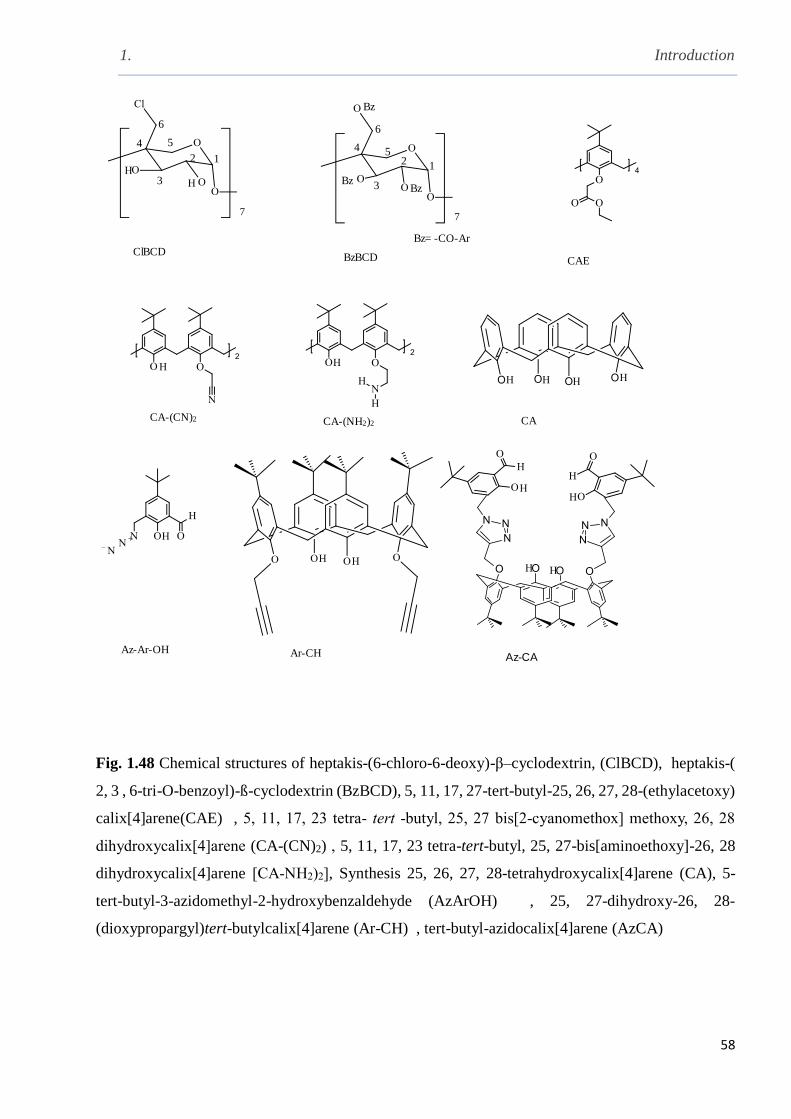
1. Introduction
58
ClBCDBzBCD CAE
CA-(CN)2 CA-(NH2)2 CA
Az-Ar-OH Ar-CH Az-CA
1
Bz
2
BzBz3
Bz= -CO-Ar
4
6
5
6
7
54
3
12
7
Fig. 1.48 Chemical structures of heptakis-(6-chloro-6-deoxy)-β–cyclodextrin, (ClBCD), heptakis-(
2, 3 , 6-tri-O-benzoyl)-ß-cyclodextrin (BzBCD), 5, 11, 17, 27-tert-butyl-25, 26, 27, 28-(ethylacetoxy)
calix[4]arene(CAE) , 5, 11, 17, 23 tetra- tert -butyl, 25, 27 bis[2-cyanomethox] methoxy, 26, 28
dihydroxycalix[4]arene (CA-(CN)2) , 5, 11, 17, 23 tetra-tert-butyl, 25, 27-bis[aminoethoxy]-26, 28
dihydroxycalix[4]arene [CA-NH2)2], Synthesis 25, 26, 27, 28-tetrahydroxycalix[4]arene (CA), 5-
tert-butyl-3-azidomethyl-2-hydroxybenzaldehyde (AzArOH) , 25, 27-dihydroxy-26, 28-
(dioxypropargyl)tert-butylcalix[4]arene (Ar-CH) , tert-butyl-azidocalix[4]arene (AzCA)

1. Introduction
59
PGAN
CA(Et2N)4 TTHCP TTECP
CPPOL RC6 PG6
RC6-ES PG11
44
Fig. 1.49 Chemical structures of 25, 26, 27, 28-(diethylamino) ethoxy calix[4]arene [CA(Et2N)4],
meso-tetramethyl-tetrakis-(4-hydroxyphenylethyl) calix[4]pyrrole (TTHCP), meso-tetramethyl-
tetrakis-(4-ethylacetato-oxyphenylethyl) calix[4]pyrrole (TTECP), calix[4]pyrrole polymer
(CPPOL), 2, 8, 14, 20-tetra-pentyl-1-resoc[4]arene (RC6), 4, 6, 10, 12, 16, 18, 22-octahydroxyl,
(PG6)], [4, 6, 10, 12, 16, 18, 22, 24-octa-oxy-ethylacetato-2, 8, 14, 20-tetrapentylresorcin[4]arene
(RC6-Es) ,2, 8, 14, 20-tetraphenylpyrogallol[4]arene, 4, 5, 6, 10,11, 12, 16, 17, 18, 22, 23, 24-
dodecahydroxyl-2, 8, 14, 20-tetrapentylcalix[4]arene (PG6), C-decyl pyrogallol[4]arene (PG11)

2. Experimental Part
60
Chapter II
Experimental Part
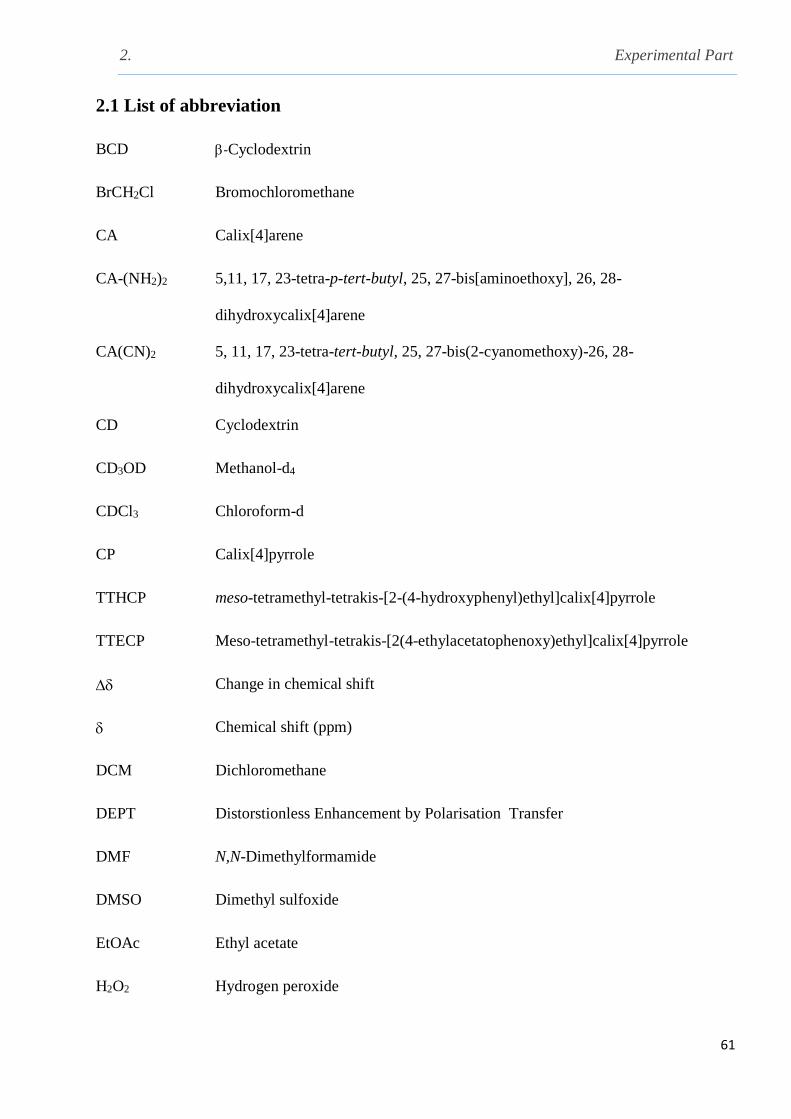
2. Experimental Part
61
2.1 List of abbreviation
BCD -Cyclodextrin
BrCH2Cl Bromochloromethane
CA Calix[4]arene
CA-(NH2)2 5,11, 17, 23-tetra-p-tert-butyl, 25, 27-bis[aminoethoxy], 26, 28-
dihydroxycalix[4]arene
CA(CN)2 5, 11, 17, 23-tetra-tert-butyl, 25, 27-bis(2-cyanomethoxy)-26, 28-
dihydroxycalix[4]arene
CD Cyclodextrin
CD3OD Methanol-d4
CDCl3 Chloroform-d
CP Calix[4]pyrrole
TTHCP meso-tetramethyl-tetrakis-[2-(4-hydroxyphenyl)ethyl]calix[4]pyrrole
TTECP Meso-tetramethyl-tetrakis-[2(4-ethylacetatophenoxy)ethyl]calix[4]pyrrole
Change in chemical shift
Chemical shift (ppm)
DCM Dichloromethane
DEPT Distorstionless Enhancement by Polarisation Transfer
DMF N,N-Dimethylformamide
DMSO Dimethyl sulfoxide
EtOAc Ethyl acetate
H2O2 Hydrogen peroxide
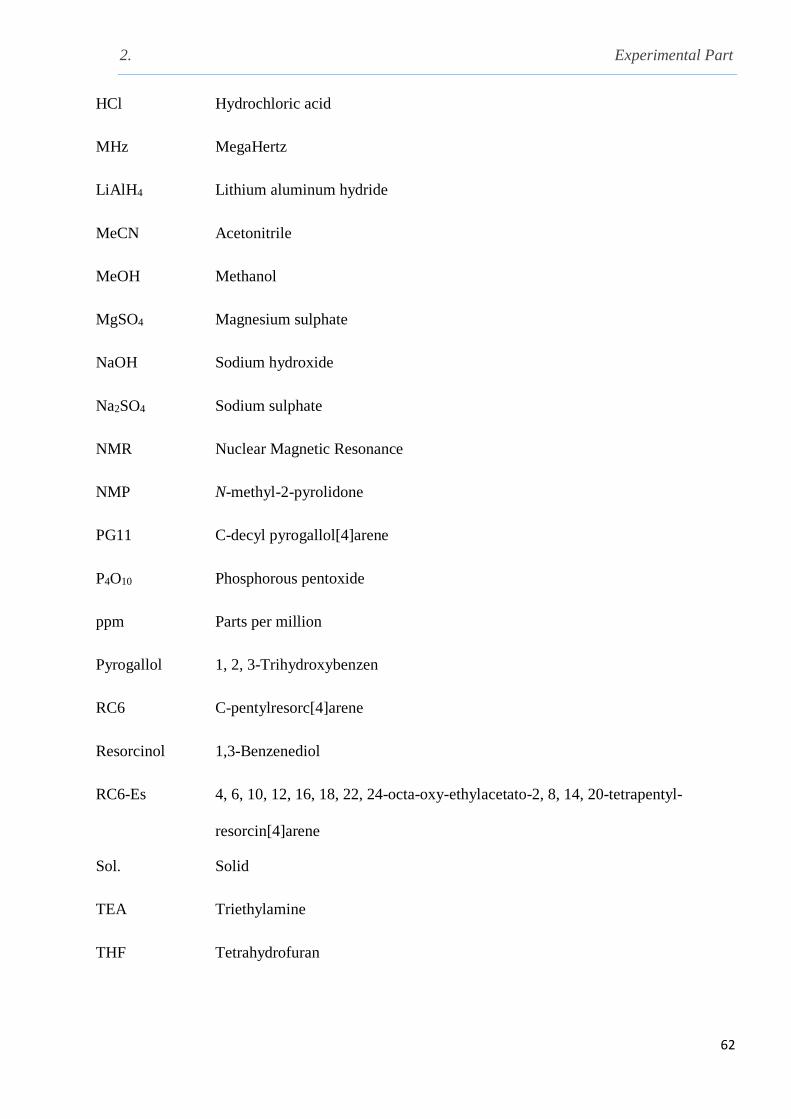
2. Experimental Part
62
HCl Hydrochloric acid
MHz MegaHertz
LiAlH4 Lithium aluminum hydride
MeCN Acetonitrile
MeOH Methanol
MgSO4 Magnesium sulphate
NaOH Sodium hydroxide
Na2SO4 Sodium sulphate
NMR Nuclear Magnetic Resonance
NMP N-methyl-2-pyrolidone
PG11 C-decyl pyrogallol[4]arene
P4O10 Phosphorous pentoxide
ppm Parts per million
Pyrogallol 1, 2, 3-Trihydroxybenzen
RC6 C-pentylresorc[4]arene
Resorcinol 1,3-Benzenediol
RC6-Es 4, 6, 10, 12, 16, 18, 22, 24-octa-oxy-ethylacetato-2, 8, 14, 20-tetrapentyl-
resorcin[4]arene
Sol. Solid
TEA Triethylamine
THF Tetrahydrofuran
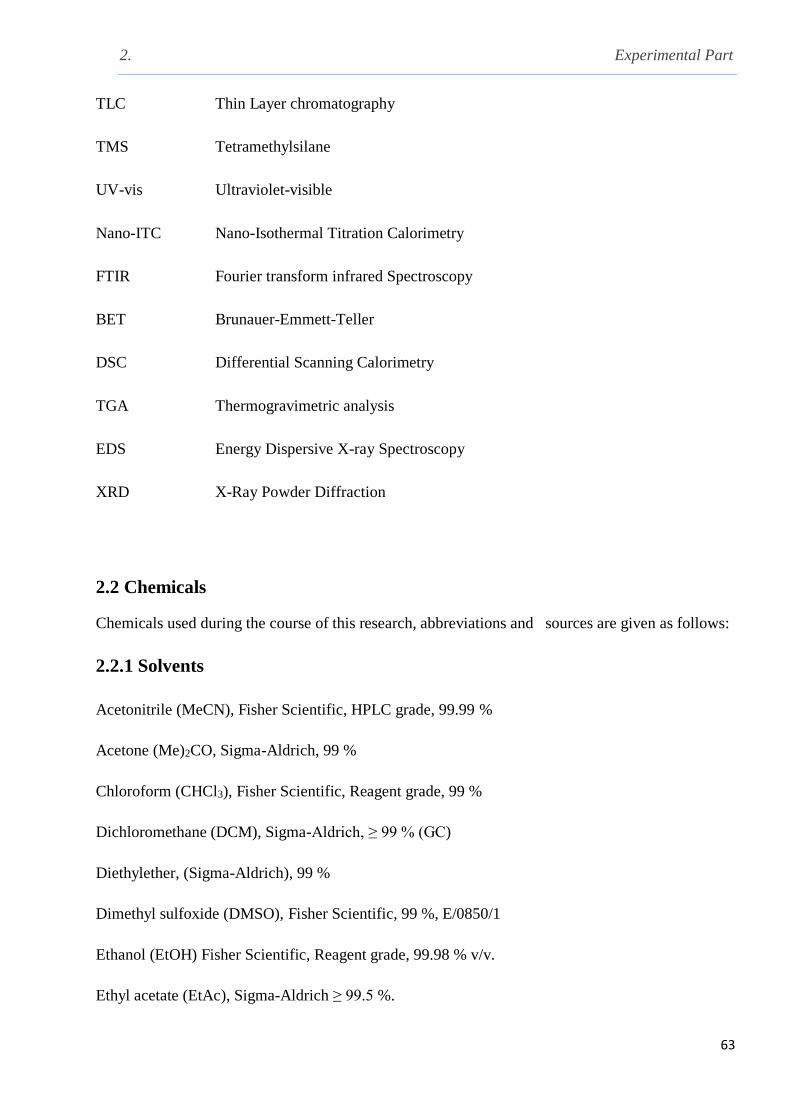
2. Experimental Part
63
TLC Thin Layer chromatography
TMS Tetramethylsilane
UV-vis Ultraviolet-visible
Nano-ITC Nano-Isothermal Titration Calorimetry
FTIR Fourier transform infrared Spectroscopy
BET Brunauer-Emmett-Teller
DSC Differential Scanning Calorimetry
TGA Thermogravimetric analysis
EDS Energy Dispersive X-ray Spectroscopy
XRD X-Ray Powder Diffraction
2.2 Chemicals
Chemicals used during the course of this research, abbreviations and sources are given as follows:
2.2.1 Solvents
Acetonitrile (MeCN), Fisher Scientific, HPLC grade, 99.99 %
Acetone (Me)2CO, Sigma-Aldrich, 99 %
Chloroform (CHCl3), Fisher Scientific, Reagent grade, 99 %
Dichloromethane (DCM), Sigma-Aldrich, ≥ 99 % (GC)
Diethylether, (Sigma-Aldrich), 99 %
Dimethyl sulfoxide (DMSO), Fisher Scientific, 99 %, E/0850/1
Ethanol (EtOH) Fisher Scientific, Reagent grade, 99.98 % v/v.
Ethyl acetate (EtAc), Sigma-Aldrich ≥ 99.5 %.

2. Experimental Part
64
Hexanal, Sigma-Aldrich, 98 %
Hydrochloric acid, Fisher Scientific, 35-38 %, H/1150/PB17
Hexane (Hex), Fisher Scientific, Laboratory reagent grade, 95 %
Methanol (MeOH), Sigma-Aldrich, HPLC grade, 99.7 %.
N, N- Dimethylformamide (DMF), Sigma- Aldrich, anhydrous 99.8 %, 22705-6
1-Octanol, Acros organics, 99 %
Pyrogallol, Sigma-Aldrich, ≥ 99 %
Resorcinol, Sigma-Aldrich, 99 %
Silica 60 A, Fisher Scientific, 40-63 μm, S/0698/53
3-Aminopropyl- functionalised silica gel, 40-63 m
Sulfuric acid, Sigma-Aldrich, 95-98 %
Tetrahydrofuran, (THF) Scientific, HPLC grade, 99.99
1-Methyl-2-pyrolidone (NMP), Acros organics, 97 %
2.2.2 Deuterated solvents used in 1H NMR experiments
Deuterated acetonitrile, CD3CN, Cambridge Isotope Laboratories, Inc, (D, 99.8 %).
Deuterated chloroform, CDCl3, Cambridge Isotope Laboratories, Inc, (D, 99.8 %) + 0.05 % v/v
TMS.
Deuterated methanol, CD3OD, Cambridge Isotope Laboratories, Inc, (D, 99.8 %).
Deuterated dimethyl sulfoxide, (CD3)2SO, Cambridge Isotope Laboratories, Inc (D, 99.9 %)
2.2.3 Pharmaceuticals
1. Sodium diclofenac, Sodium {2-[(2,6-dichlorophenyl)amino]phenyl}ethanoate C14H10Cl2NNaO2
2. Clofibric acid, 2-(4-Chlorophenoxy)-2-methylpropanoic acid C10H11ClO3, 97 %, Aldrich
3. Carbamazepine, 5H-Dibenz[b, f]azepine-5-carboxamide, C15 H12 N2O, Sigma-Aldrich
2. Experimental Part
65
4. Aspirin (Acetylsalicylic acid), Sigma-Aldrich
5. Ibuprofen (RS)-2-(4-(2-methyl propyl) phenyl) propanoic acid; C13 H18O2, ≥ 98 % Sigma-
Aldrich.
2.2.4 Analytical Reagents
Reagents used in the synthesis (without further purification).
β-Cyclodextrin, Sigma-Aldrich, ≥ 97 %
P-tert-butyl calix[4]arene, C44H56O4 ≥ 97 % HPLC, Sigma- Aldrich
18-Crown-6, 18-C-6, C12H24O6, Fluka, 99 %.
Pyrrole reagent grade, Sigma-Aldrich, 98 %
4-[4-hydroxyphenyl]-2-butanone C10H12O2, Sigma-Aldrich ≥ 98 %)
Magnesium sulphate anhydrous MgSO4, Fisher Scientific
Potassium carbonate anhydrous, K2CO3, Fisher Scientific, 99.99 %
Sodium hydride, NaH, Sigma-Aldrich, 95 %
Sodium azide, NaN3, Sigma-Aldrich, ≥ 99.99 %
Lithium aluminium hydride, LiAlH4, Sigma-Aldrich, 95 %
Acetic acid, CH3COOH, Fisher Scientific, glacial analytical reagent grade 99.7 %.
Bromoacetonitrile, BrCH2CN, Aldrich, 97 %.
Phenol, C6H5OH, Sigma-Aldrich, 99 %
Ethyl bromoacetate, BrCH2COOC2H5, Sigma-Aldrich, 98 %
4-tert-Butylphenol, (CH3)3CC6H4OH Fluka, ≥ 97 %
Triethylamine, (C2H5)3N Sigma-Aldrich, ≥ 99.5 %
Tin (IV) chloride SnCl4, Sigma- Aldrich, 98 %
(2-Diethylamino) ethylchloride hydrochloride, (C2H5)2N(CH2)2Cl·HCl, Aldrich-Sigma.
2. Experimental Part
66
(+)-Sodium L-ascorbate, C6H7NaO6, Sigma-Aldrich 98 %
Lead (II) perchlorate trihydrate, Pb (ClO4)2·3H2O, Aldrich –Sigma.
Lithium perchlorate, LiClO4, Aldrich –Sigma.
Mercury (II) perchlorate hydrate, Hg (ClO4)2· xH2O, Aldrich –Sigma, 99.99 %
Methanesulfonyl chloride, CH3CO2Cl, Sigma-Aldrich, 99.7 %
Potassium chloride, KCl, Fisher Scientific, 99%
Sodium chloride, NaCl, Fisher Scientific 99 %
pH buffer tablets from Fisher Scientific
Magnesium (II) perchlorate hexahydrate, Mg (ClO4)2·6H2O, Aldrich –Sigma.
Sodium perchlorate monohydrate, NaClO4, Sigma-Aldrich
Strontium (II) perchlorate, Sr (ClO4)2, Sigma-Aldrich
Zinc (II) perchlorate hexahydrate, Zn (ClO4)2, 6H2O, Aldrich –Sigma.
2.2.5 Purification of Solvents [194]
1. Acetonitrile, MeCN, was refluxed under a nitrogen atmosphere and distilled over calcium hydride.
The middle fraction of the distilled solvent was collected
2. Tetrahydrofuran, THF, was stored over a sodium metal wire for 24 hours. Then it was distilled
under nitrogen, using benzophenone as an indicator
3. Toluene was treated with anhydrous calcium chloride, filtered and then placed over metallic
sodium in a round-bottomed flask fitted with a reflux condenser protected by a drying tube containing
calcium chloride. Then it was refluxed for two hours. The middle fraction of the distilled solvent was
collected and used.
4. N, N-Dimethylformamide, DMF, was dried using molecular sieves for 24 hours and then it was
refluxed under reduced pressure. Only the middle fraction of the purified solvent was collected.
2. Experimental Part
67
2.2.6 Instruments used
1. 1H-NMR spectra were taken on a Bruker AC-500 NMR spectrometer.
2. 1H NMR spectra Bruker AC-300 MHz
3. UV-visible spectrophotometry measurements were taken on a Cecil CE7200 spectrophotometer.
4. Conductance measurements were carried out by Wyne Keer LCR Meter 4300
5. The isothermal Titration Calorimeter ITC type TA Nano-calorimeter
6. Differential scanning calorimeter DSC, Instrument DSC Q1000 V9.9 Build 303
7. Thermogravimetric analysis, Instrument TGA Q 500, V6.7 Build 203
8. FTIR Spectrometer type Agilent technologies, Cary 600 series
9. Scanning electron microscope, SEM analysis, Mechanical Engineering Sciences, FEPS
10. AB 15 pH meter Fisher Scientific (AB 15 pH Meter Fisher Scientific)
11. BET analysis by Gemini model V2.00
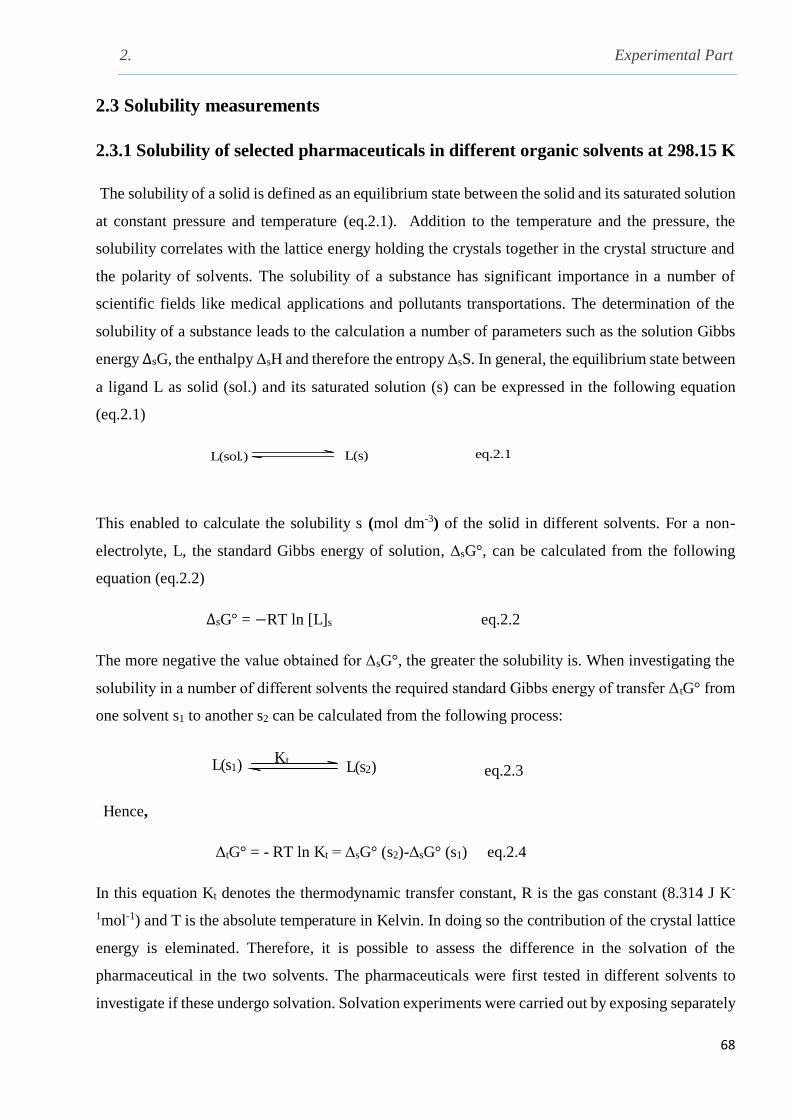
2. Experimental Part
68
2.3 Solubility measurements
2.3.1 Solubility of selected pharmaceuticals in different organic solvents at 298.15 K
The solubility of a solid is defined as an equilibrium state between the solid and its saturated solution
at constant pressure and temperature (eq.2.1). Addition to the temperature and the pressure, the
solubility correlates with the lattice energy holding the crystals together in the crystal structure and
the polarity of solvents. The solubility of a substance has significant importance in a number of
scientific fields like medical applications and pollutants transportations. The determination of the
solubility of a substance leads to the calculation a number of parameters such as the solution Gibbs
energy ΔsG, the enthalpy ΔsH and therefore the entropy ΔsS. In general, the equilibrium state between
a ligand L as solid (sol.) and its saturated solution (s) can be expressed in the following equation
(eq.2.1)
eq.2.1L(sol.) L(s)
This enabled to calculate the solubility s (mol dm-3) of the solid in different solvents. For a non-
electrolyte, L, the standard Gibbs energy of solution, ΔsG°, can be calculated from the following
equation (eq.2.2)
ΔsG° = −RT ln [L]s eq.2.2
The more negative the value obtained for ΔsG°, the greater the solubility is. When investigating the
solubility in a number of different solvents the required standard Gibbs energy of transfer ΔtG° from
one solvent s1 to another s2 can be calculated from the following process:
KtL(s1) L(s2) eq.2.3
Hence,
ΔtG° = - RT ln Kt = ΔsG° (s2)-ΔsG° (s1) eq.2.4
In this equation Kt denotes the thermodynamic transfer constant, R is the gas constant (8.314 J K-
1mol-1) and T is the absolute temperature in Kelvin. In doing so the contribution of the crystal lattice
energy is eleminated. Therefore, it is possible to assess the difference in the solvation of the
pharmaceutical in the two solvents. The pharmaceuticals were first tested in different solvents to
investigate if these undergo solvation. Solvation experiments were carried out by exposing separately
2. Experimental Part
69
pre-weighed crucibles containing the pharmaceutical to a saturated environment of different solvents
in desiccators for several days. The crucibles were then weighed to check the uptake of solvent by
the solid. From solubility data, ΔsG◦ were calculated for the samples when the compound was not
altered by solvation195-197.The solvents investigated for the possibility to obtain solubility data were
water, methanol, ethanol, acetonitrile, dichloromethane, chloroform, 1-octanol, dimethylsulphoxide
and N, N-dimethylformamide.
The analytical technique used to determine the concentration of the drug in the saturated solution was
UV spectrophotometry
2.3.2 Calibration curve for the analysis of pharmaceuticals
Stock solutions were made by dissolving a known amount of each pharmaceutical in the appropriate
solvent, different volumes were taken and diluted in volumetric flasks (10 ml). Samples were
measured using spectrophotometric measurements in the ultraviolet region. Calibration curves were
obtained when absobances, A, were plotted against molar concentration (mol dm-3). The linear
relationship (higher R values) obtained were used to determine the unknown concentration of the
pharmaceutical in the saturated solution198
2.3.3 Solubility of selected pharmaceuticals
Saturated solutions of targeted pharmaceutical (sodium diclofenac, aspirin, and clofibric acid) in
different solvents were mixed for one minute on a whirlimixer, sealed and left to equilibrate overnight
in a water bath at 298.15 K. The solutions were filtered through a 0.22 Millipore and a known volume
of each solution (2 ml) was transferred to an UV cell and diluted volumetrically with the respective
solvent to obtain absorbance values in the linear range of the calibration curve for each system. All
the experimental results are an average of at least three independent measurements. From the
absorbance values, the concentration of the drug in the saturated solution was obtained by the use of
the Beer’s-Lambert law198,199.
2.4 Determination of partition coefficients of selected drugs in the water-1-octanol
solvent system
The partition coefficient (KP) is calculated from the ratio of concentration of a solute in two partially
or completely immiscible phases at equilibrium. This parameter is essential in many applications
such as distribution of drugs between two immiscible layers and it is used to know the distribution of
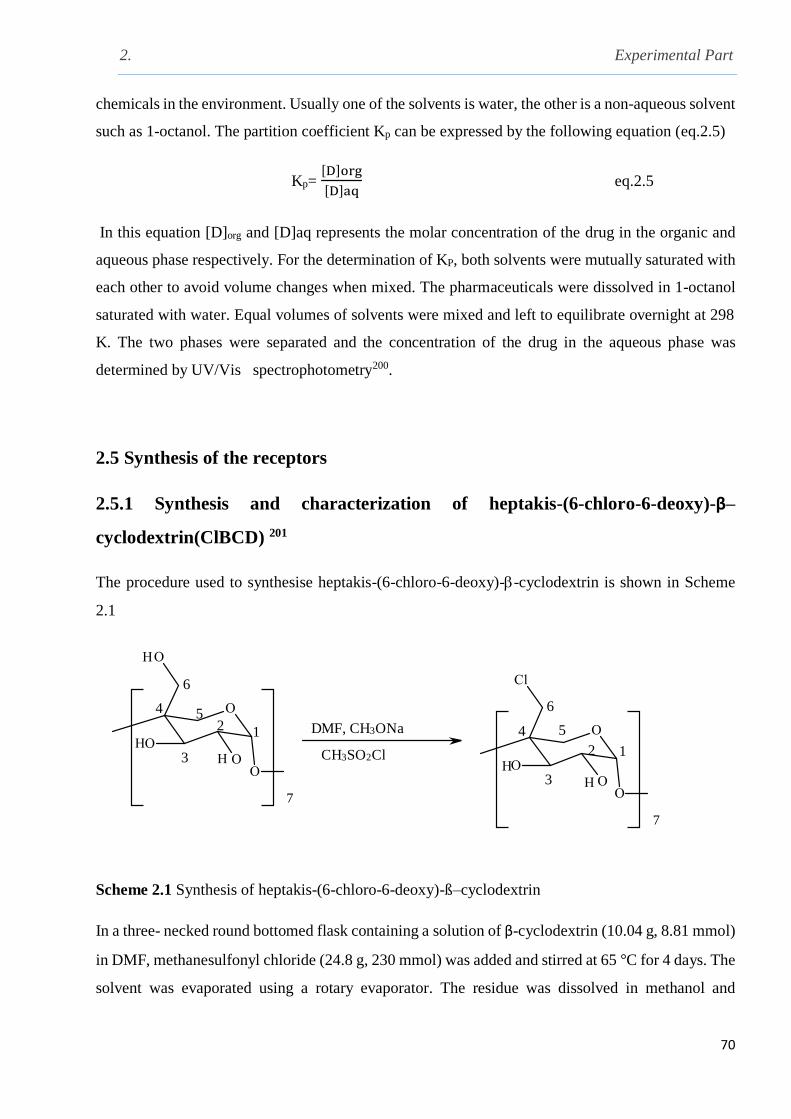
2. Experimental Part
70
chemicals in the environment. Usually one of the solvents is water, the other is a non-aqueous solvent
such as 1-octanol. The partition coefficient Kp can be expressed by the following equation (eq.2.5)
Kp= [D]org
[D]aq eq.2.5
In this equation [D]org and [D]aq represents the molar concentration of the drug in the organic and
aqueous phase respectively. For the determination of KP, both solvents were mutually saturated with
each other to avoid volume changes when mixed. The pharmaceuticals were dissolved in 1-octanol
saturated with water. Equal volumes of solvents were mixed and left to equilibrate overnight at 298
K. The two phases were separated and the concentration of the drug in the aqueous phase was
determined by UV/Vis spectrophotometry200.
2.5 Synthesis of the receptors
2.5.1 Synthesis and characterization of heptakis-(6-chloro-6-deoxy)-β–
cyclodextrin(ClBCD) 201
The procedure used to synthesise heptakis-(6-chloro-6-deoxy)--cyclodextrin is shown in Scheme
2.1
CH3SO2Cl 12
3
4 5
6
6
54
3
12
7
7
DMF, CH3ONa
Scheme 2.1 Synthesis of heptakis-(6-chloro-6-deoxy)-ß–cyclodextrin
In a three- necked round bottomed flask containing a solution of β-cyclodextrin (10.04 g, 8.81 mmol)
in DMF, methanesulfonyl chloride (24.8 g, 230 mmol) was added and stirred at 65 °C for 4 days. The
solvent was evaporated using a rotary evaporator. The residue was dissolved in methanol and

2. Experimental Part
71
neutralized with sodium methoxide (3 M). The product was precipitated in ice water, the white solid
obtained was filtered out and washed with cold methanol and dried under vacuum at 55 °C. 1H NMR
(500 MHz, d6-DMSO), δ in ppm, 5.96 (d, 1 H, 2-OH), 5.82 (s, 1 H, 3-OH), 4.94 (d, 1 H, 1-H), 4.13
– 3.89 (m, 2 H, 5-H, 3-H), 3.84 – 3.75 (m, 2 H, 4-H, 2-H), 3.61 (t, 1 H, 6a-H), 3.35 (s, 2 H, 6b-H).,
13C NMR (DMSO-d6), δ in ppm, 102.04 (1-C), 83.57 (4-C), 72.43 (3-C), 71.96 (2-C), 71.17 (5-C),
44.95 (6-C). Appendix (Figs. 1-B & 2-B)
2.5.2 Synthesis of heptakis-( 2, 3 , 6-tri-o-benzoyl)-ß-cyclodextrin (BzBCD)201
The compound was synthesised according to Scheme 2.2
Bz
BzBz
Bz= -CO-Ar
66
4 days
5
DMF, 65 °C
54
4
33
11 2
2
77
Scheme 2.2 Synthesis of heptakis-( 2, 3 , 6-tri-o-benzoyl)-ß-cyclodextrin
The synthesis of the perbenzoylated cyclodextrin was accomplished as described by Guillo et al 198 .
To a solution of β-cyclodextrin (5 g, 4.4 mmol) dissolved in DMF , benzoyl chloride (3.2 g, 0.45
mmol) was added and stirred at 65 °C for 4 days. The solvent was evaporated using a rotary
evaporator, the residue was dissolved in methanol and neutralized with sodium methoxide (3 M) .The
product was precipitated from ice water , filtered out and washed with methanol . The product was
vacuum-dried at 55 °C and was obtained as a white solid. 1H NMR (d6-DMSO), δ in ppm, 4.42 (H4,
7 H), 4.9 (H5 and H6, 14 H), 5.13 (H2,7 H), 5.56 (H6, 7 H), 5.75 (H1, 7 H), 5.85 (H3, 7 H),
(Apendex,Fig. 3-B) Elemental analysis was carried out at the University of Surrey, calculated %, C;
67.5, H; 4.79, N; 0.0. Found %, C; 67.68, H; 4.53, N; 0.0.
2.5.3 Synthesis of 5, 11, 17, 27- tert-butyl-25, 26, 27, 28-(oxy-ethylethanoate)
calix[4]arene (CAE)202
A new modified procedure has been carried out in the Thermochemistry Laboratory to synthesise the

2. Experimental Part
72
compound according to the following Scheme
THF/ DMF
NaH / 60 °
C
(CAE)
Scheme 2.3 Synthesis of 5, 11, 17, 27-tert-butyl-25, 26, 27, 28-(ethylacetoxy) calix[4]arene (CAE)
In a 500 ml three-neck round bottom flask and under a nitrogen gas atmosphere, p-tert-butyl-
calix[4]arene (5 g, 7.72 mmol) was dissolved in a mixture of freshly distilled THF and dry DMF (60:
40, v/v), then sodium hydride (0.36 g, 0.016 mmol) was added carefully to the reaction mixture and
stirred for 30 minutes. This was followed by the dropwise addition of ethyl bromoacetate (5.14 g,
3.78 mmol) to the reaction solution. The mixture was heated in an oil bath at 60 C and followed by
thin layer chromatography using a mixture of DCM: MeOH (7: 3 v/v) as the developing solvent
mixture. After completion, the reaction was stopped and cooled down to room temperature, the
resultant solution was filtered and the solvent evaporated using a rotary evaporator. A brown viscous
product was obtained, dissolved in 100 ml dichloromethane and transferred to a separation fennel,
washed with distilled water and then with brine. The organic layer was separated and dried over
anhydrous magnesium sulphate, the mixture was filtered and the solvent evaporated under reduced
pressure. A viscous colourless liquid was obtained. The crude product was dissolved in methanol and
sonicated to break the oil. A white powder was obtained and filtered. Further purification was carried
out by dissolving the product using a MeOH: DCM (15: 1) mixture which was refrigerated. Large
needle-like crystals were obtained. Yield 5.5 g, 71.6 %, 1H NMR (500 MHz in CDCl3), δ in ppm,
6.77 (s, 8 H, Ar-H), 4.85 (d, 4 H, C-Haxial), 4.8 (s, 8 H, O-CH2-CO), 4.2 (q, 8 H, O-CH2CH3), 3.19
(d, 4 H, C-Hequatorial), 1.28 (t, 12 H, CH3), 1.05 (s, 36 H, CH3), (Fig. 4-B- Appendix)
13C NMR (500 MHz in CDCl3), δ in ppm, 14.22, 31.6, 33.38, 60.30, 71.34, 125.35, 133.46, 145.15,
152.59, 170.54
Microanalysis (C60H80O12, M. Wt, 993.27) was carried out at the University of Surrey calculated %
:, C; 72.58, H; 8.06, N 0.0. Found %: C, 72.35, H; 8.12, N; 0.0
Melting point: 155 C, TGA and DSC analysis were carried out at the University of Surrey
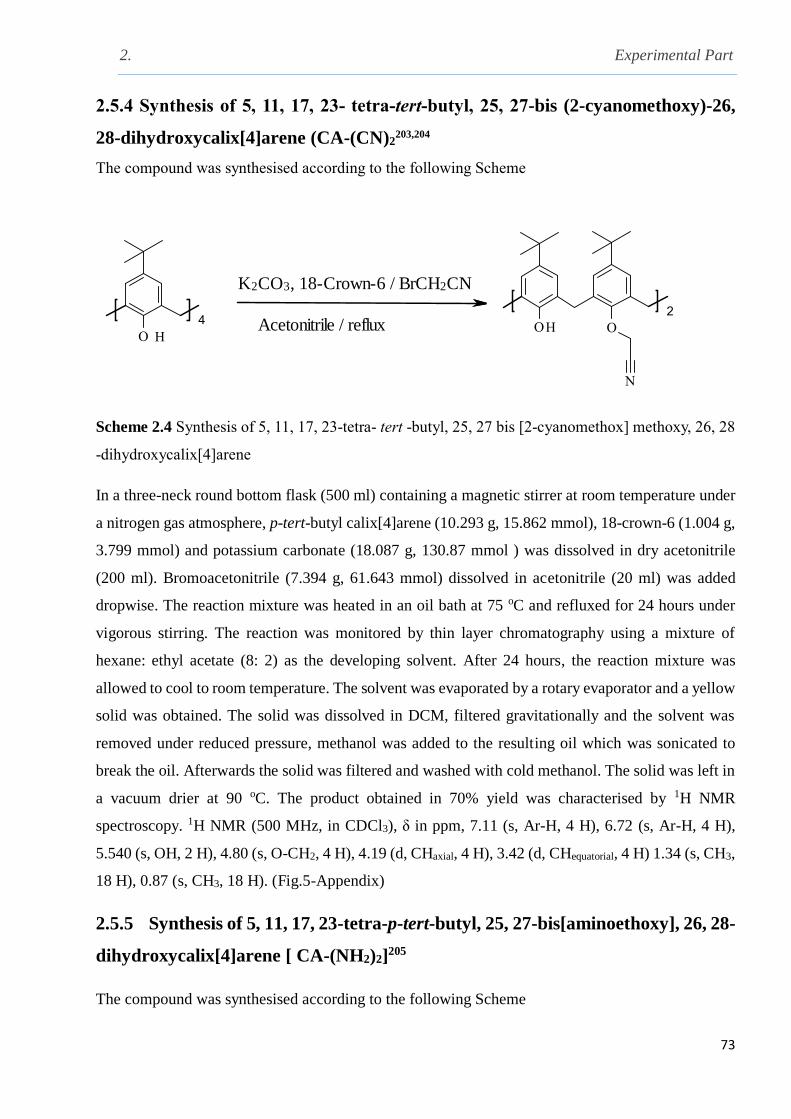
2. Experimental Part
73
2.5.4 Synthesis of 5, 11, 17, 23- tetra-tert-butyl, 25, 27-bis (2-cyanomethoxy)-26,
28-dihydroxycalix[4]arene (CA-(CN)2203,204
The compound was synthesised according to the following Scheme
K2CO3, 18-Crown-6 / BrCH2CN
Acetonitrile / reflux
Scheme 2.4 Synthesis of 5, 11, 17, 23-tetra- tert -butyl, 25, 27 bis [2-cyanomethox] methoxy, 26, 28
-dihydroxycalix[4]arene
In a three-neck round bottom flask (500 ml) containing a magnetic stirrer at room temperature under
a nitrogen gas atmosphere, p-tert-butyl calix[4]arene (10.293 g, 15.862 mmol), 18-crown-6 (1.004 g,
3.799 mmol) and potassium carbonate (18.087 g, 130.87 mmol ) was dissolved in dry acetonitrile
(200 ml). Bromoacetonitrile (7.394 g, 61.643 mmol) dissolved in acetonitrile (20 ml) was added
dropwise. The reaction mixture was heated in an oil bath at 75 oC and refluxed for 24 hours under
vigorous stirring. The reaction was monitored by thin layer chromatography using a mixture of
hexane: ethyl acetate (8: 2) as the developing solvent. After 24 hours, the reaction mixture was
allowed to cool to room temperature. The solvent was evaporated by a rotary evaporator and a yellow
solid was obtained. The solid was dissolved in DCM, filtered gravitationally and the solvent was
removed under reduced pressure, methanol was added to the resulting oil which was sonicated to
break the oil. Afterwards the solid was filtered and washed with cold methanol. The solid was left in
a vacuum drier at 90 oC. The product obtained in 70% yield was characterised by 1H NMR
spectroscopy. 1H NMR (500 MHz, in CDCl3), δ in ppm, 7.11 (s, Ar-H, 4 H), 6.72 (s, Ar-H, 4 H),
5.540 (s, OH, 2 H), 4.80 (s, O-CH2, 4 H), 4.19 (d, CHaxial, 4 H), 3.42 (d, CHequatorial, 4 H) 1.34 (s, CH3,
18 H), 0.87 (s, CH3, 18 H). (Fig.5-Appendix)
2.5.5 Synthesis of 5, 11, 17, 23-tetra-p-tert-butyl, 25, 27-bis[aminoethoxy], 26, 28-
dihydroxycalix[4]arene [ CA-(NH2)2]205
The compound was synthesised according to the following Scheme
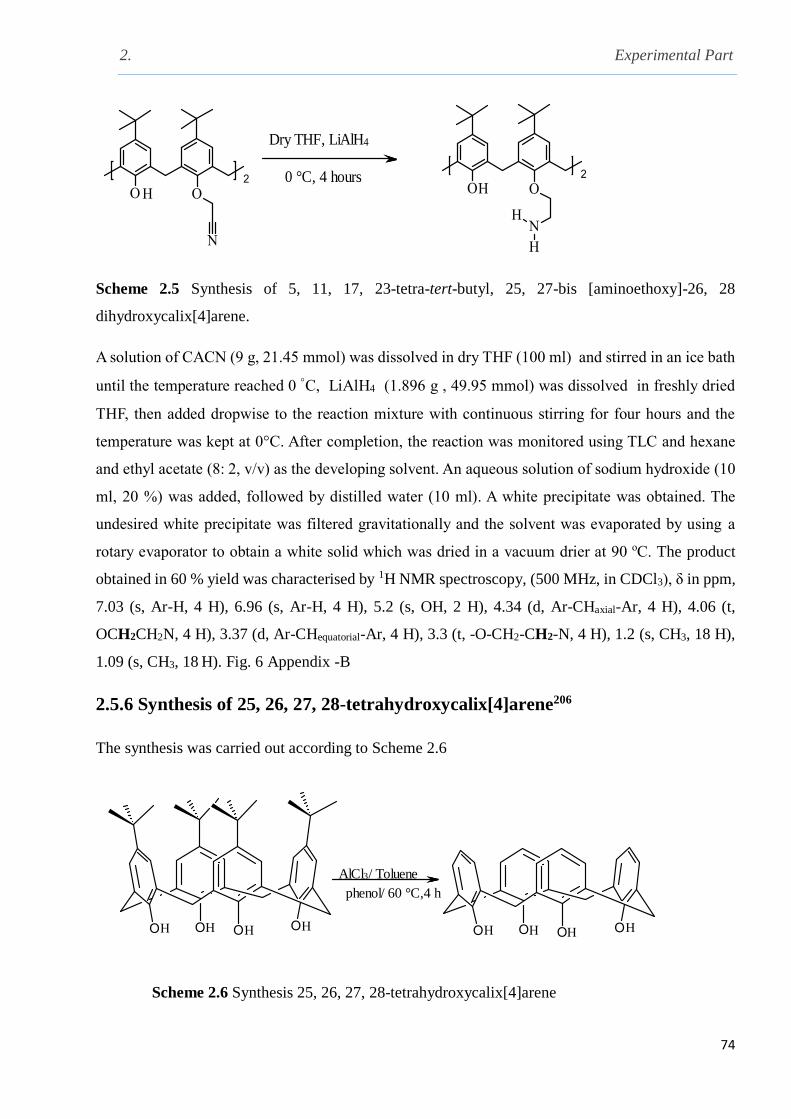
2. Experimental Part
74
Dry THF, LiAlH4
0 °C, 4 hours
Scheme 2.5 Synthesis of 5, 11, 17, 23-tetra-tert-butyl, 25, 27-bis [aminoethoxy]-26, 28
dihydroxycalix[4]arene.
A solution of CACN (9 g, 21.45 mmol) was dissolved in dry THF (100 ml) and stirred in an ice bath
until the temperature reached 0 C, LiAlH4 (1.896 g , 49.95 mmol) was dissolved in freshly dried
THF, then added dropwise to the reaction mixture with continuous stirring for four hours and the
temperature was kept at 0°C. After completion, the reaction was monitored using TLC and hexane
and ethyl acetate (8: 2, v/v) as the developing solvent. An aqueous solution of sodium hydroxide (10
ml, 20 %) was added, followed by distilled water (10 ml). A white precipitate was obtained. The
undesired white precipitate was filtered gravitationally and the solvent was evaporated by using a
rotary evaporator to obtain a white solid which was dried in a vacuum drier at 90 oC. The product
obtained in 60 % yield was characterised by 1H NMR spectroscopy, (500 MHz, in CDCl3), δ in ppm,
7.03 (s, Ar-H, 4 H), 6.96 (s, Ar-H, 4 H), 5.2 (s, OH, 2 H), 4.34 (d, Ar-CHaxial-Ar, 4 H), 4.06 (t,
OCH2CH2N, 4 H), 3.37 (d, Ar-CHequatorial-Ar, 4 H), 3.3 (t, -O-CH2-CH2-N, 4 H), 1.2 (s, CH3, 18 H),
1.09 (s, CH3, 18 H). Fig. 6 Appendix -B
2.5.6 Synthesis of 25, 26, 27, 28-tetrahydroxycalix[4]arene206
The synthesis was carried out according to Scheme 2.6
AlCl3/ Toluene
phenol/ 60 °C,4 h
Scheme 2.6 Synthesis 25, 26, 27, 28-tetrahydroxycalix[4]arene

2. Experimental Part
75
In a three-neck round bottom flask, a mixture of 4-tert-butylcalix[4]arene (5.13 g,7.7 mmol) and
phenol ( 4.35 g, 46.2 mmol) were dissolved in dry toluene (100 ml), stirred for 30 minutes at room
temperature under a nitrogen gas atmosphere. Aluminium chloride (6.09 g) was added and the
reaction mixture was stirred at 60° C for 6 h. The reaction was monitored by TLC using a hexane:
ethyl acetate (8: 2) mixture as the developing solvent mixture. After completion of the reaction the
mixture was cooled to room temperature, hydrochloric acid (100 ml, 0.2 M) was added dropwise and
stirred for 30 minutes until the white precipitate disappeared. The reaction mixture was then
transferred to a separating funnel. The upper organic layer was collected and the solvent was rotary
evaporated. Then methanol (50 ml) was added to the concentrated mixture to obtain a white
precipitate which was then recrystallized from methanol and dried over a vacuum oven. (3.02 g, 90
%). The compound was characterised by 1H NMR spectroscopy in CDCl3, δ in ppm, 10.18 (s, OH, 4
H), 7.05 (d, Ar-H, 8 H), 6.7 (t, Ar-H, 4 H), 4.25 (d, CHaxial, 4 H), 3.46 (d, CHequatorial, 4 H) (Fig. 7
Appendix B)
2.5.7 Synthesis and characterization of 5-tert-butyl-3-azidomethyl-2-
hydroxybenzaldehyde (AzAr)
The preparation of this receptor was carried out in three steps according to the following Scheme
Ambient temperature, 48 hours
SnCl4 / Paraformaldehyde
Toluen, 100 °C, 8 hours
Formaldehyde, HClNaN3
24 hours
Scheme 2.7 Synthesis and characterization of 5-tert-butyl-3-azidomethyl-2-hydroxybenzaldehyde
2.5.8 Synthesis and Characterization of 5-tert-butyl-2-hydroxybenzaldehyde207
The SnCl4 (1.07 g, 4.1 mmol) was added to a magnetically stirred solution containing p-tert-butyl-
phenol (6.01 g, 40 mmol) in dry toluene. Tri-n-butylamine was added dropwise to the reaction
mixture with continuous stirring for 20 minutes. To the reaction mixture, paraformaldehyde (2.43g,
81 mmol) was added and the mixture was refluxed for 8 hours. After cooling the reaction mixture to
room temperature, the solution was transferred into a separating funnel and then extracted with

2. Experimental Part
76
diethyl ether (2 × 50 ml). The combined organic layer was washed with saturated brine and then dried
over anhydrous sodium sulphate. The product formed was purified by a silica gel column
chromatography using a hexane: chloroform (1: 1) mixture as eluent. Yield (4.5 g, 63 %), a yellow
liquid was obtained upon evaporation of the solvents, 1H NMR (500 MHz in CDCl3), δ in ppm, 1.27
(s, 9 H), 6.76 (s, 1 H), 7.57 (d, 1 H), 7.50 (dd, 1 H), 9.89 (s, 1 H, aldehyde), 10.80 (s, 1 H, OH). Fig.
8-B Appendix
2.5.9 Synthesis and characterization of 5-tert-butyl-3-chloromethyl-2-
hydroxybenzaldehyde 208
A concentrated hydrochloric acid (12 M, 125 ml) was added to a mixture of 5-tert-butyl-2-
hydroxybenzaldehyde (5.0 g, 28 mmol) and formaldehyde (25 ml, 35 %) in methanol and the solution
was stirred for 2 days at room temperature. Water was added to the mixture, the product was extracted
into dichloromethane (3 × 40 ml), and the organic layer was dried over anhydrous sodium sulphate.
The dichloromethane was then evaporated under reduced pressure to afford the pure product as a
yellow liquid. Yield (5.2 g, 82 %). 1H NMR (500 MHz in CDCl3), in ppm, 1.34 (s, 9 H), 4.70 (s, 2
H), 7.52 (d, 1 H), 7.67 (d, 2 H), 9.90 (s, 1 H), 11.28 (s, 1 H). Fig. 9B-Appendix
2.5.10 Synthesis of 5-tert-butyl-3-azidomethyl-2-hydroxybenzaldehyde 208
The 5-tert-butyl-3-chloromethyl-2-hydroxybenzaldehyde (2.65 g, 11.89 mmol) was added to a
solution of sodium azide (1.519 g, 23.37 mmol) in dimethylformamide (30 ml) under stirring for 12
hours. A mixture of water and ethyl acetate (100 ml, 50 %, v/ v) was added to the reaction mixture.
The organic layer was separated and washed with water and brine. A yellow liquid was obtained upon
evaporation of the organic solvent. Yield 89 %.
1H NMR (500 MHz, CDCl3), in ppm, 11.28 (broad s, 1 H), 9.9 (s, 1 H), 7.57 (dd, 1 H), 7.52 (s, 1
H), 4.45 (s, 2 H), 1.28 (s, 9 H). Fig. 10-B Appendix
2.5.11 Synthesis and characterization of 25, 27-dihydroxy-26-28-(dioxypropargyl)
tert-butylcalix[4]arene (ArCH)208
The synthesis of the compound was carried out according to the following Scheme
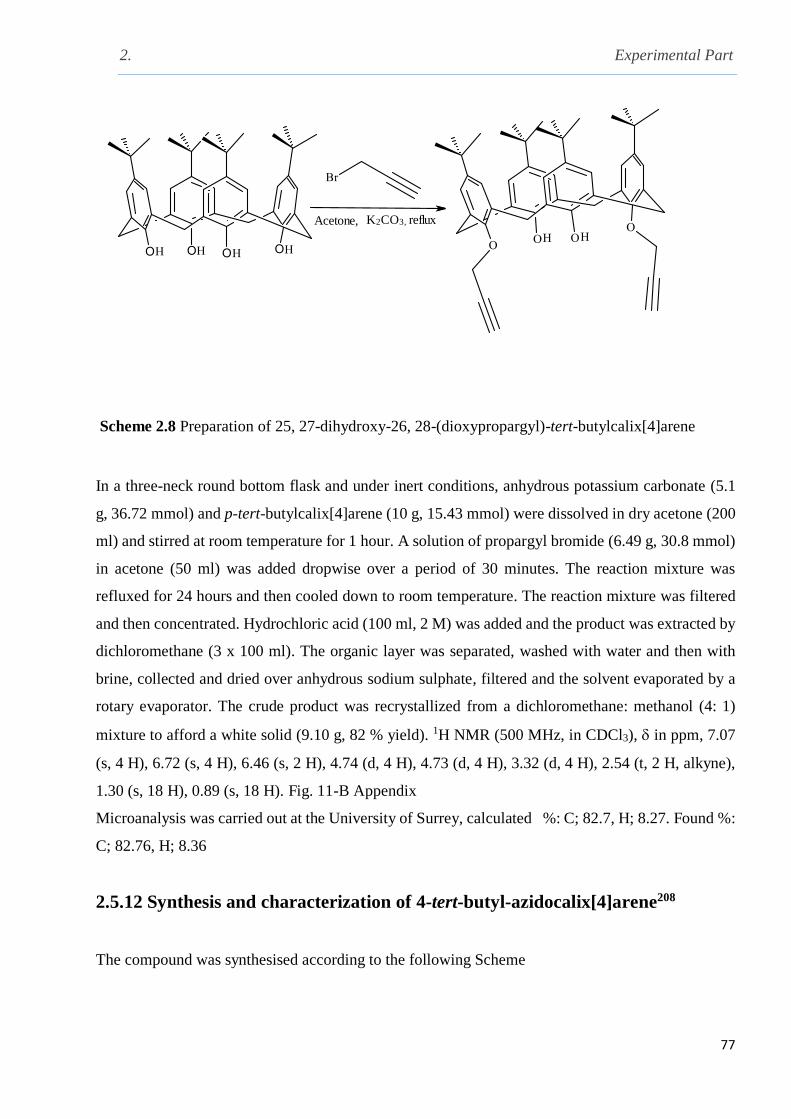
2. Experimental Part
77
Acetone, K2CO3, reflux
Scheme 2.8 Preparation of 25, 27-dihydroxy-26, 28-(dioxypropargyl)-tert-butylcalix[4]arene
In a three-neck round bottom flask and under inert conditions, anhydrous potassium carbonate (5.1
g, 36.72 mmol) and p-tert-butylcalix[4]arene (10 g, 15.43 mmol) were dissolved in dry acetone (200
ml) and stirred at room temperature for 1 hour. A solution of propargyl bromide (6.49 g, 30.8 mmol)
in acetone (50 ml) was added dropwise over a period of 30 minutes. The reaction mixture was
refluxed for 24 hours and then cooled down to room temperature. The reaction mixture was filtered
and then concentrated. Hydrochloric acid (100 ml, 2 M) was added and the product was extracted by
dichloromethane (3 x 100 ml). The organic layer was separated, washed with water and then with
brine, collected and dried over anhydrous sodium sulphate, filtered and the solvent evaporated by a
rotary evaporator. The crude product was recrystallized from a dichloromethane: methanol (4: 1)
mixture to afford a white solid (9.10 g, 82 % yield). 1H NMR (500 MHz, in CDCl3), in ppm, 7.07
(s, 4 H), 6.72 (s, 4 H), 6.46 (s, 2 H), 4.74 (d, 4 H), 4.73 (d, 4 H), 3.32 (d, 4 H), 2.54 (t, 2 H, alkyne),
1.30 (s, 18 H), 0.89 (s, 18 H). Fig. 11-B Appendix
Microanalysis was carried out at the University of Surrey, calculated %: C; 82.7, H; 8.27. Found %:
C; 82.76, H; 8.36
2.5.12 Synthesis and characterization of 4-tert-butyl-azidocalix[4]arene208
The compound was synthesised according to the following Scheme
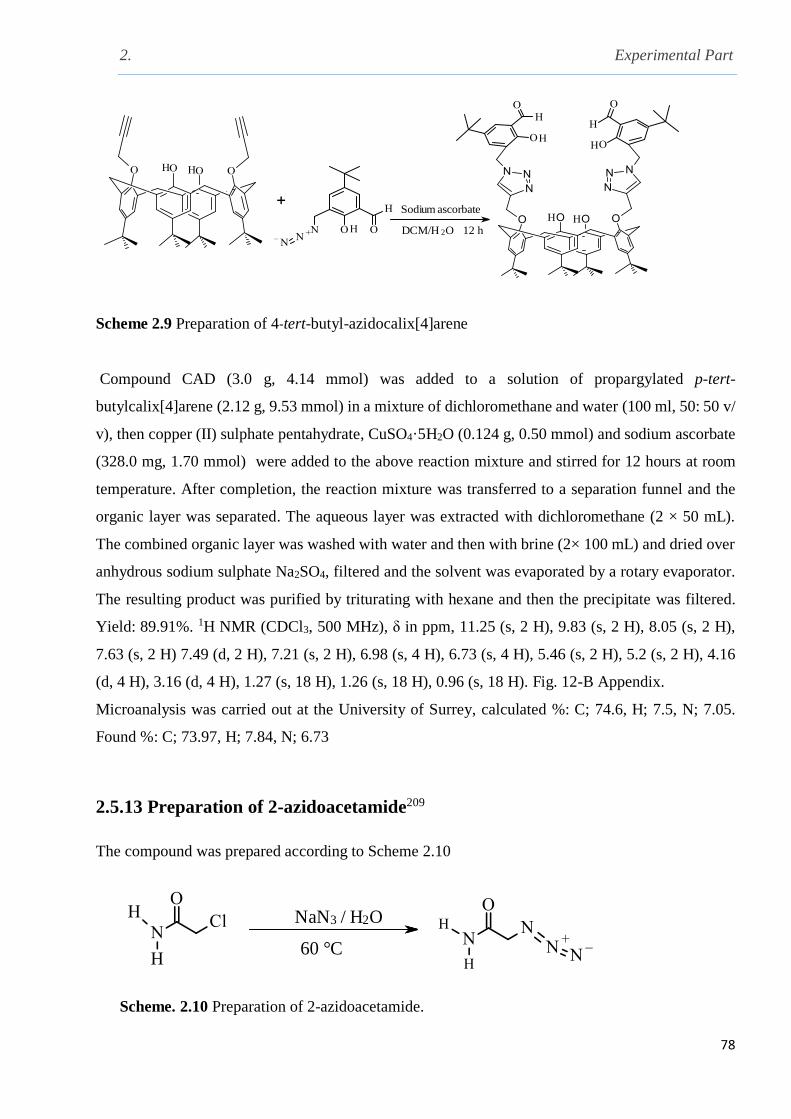
2. Experimental Part
78
Sodium ascorbate
DCM/H 2O 12 h
Scheme 2.9 Preparation of 4-tert-butyl-azidocalix[4]arene
Compound CAD (3.0 g, 4.14 mmol) was added to a solution of propargylated p-tert-
butylcalix[4]arene (2.12 g, 9.53 mmol) in a mixture of dichloromethane and water (100 ml, 50: 50 v/
v), then copper (II) sulphate pentahydrate, CuSO4·5H2O (0.124 g, 0.50 mmol) and sodium ascorbate
(328.0 mg, 1.70 mmol) were added to the above reaction mixture and stirred for 12 hours at room
temperature. After completion, the reaction mixture was transferred to a separation funnel and the
organic layer was separated. The aqueous layer was extracted with dichloromethane (2 × 50 mL).
The combined organic layer was washed with water and then with brine (2× 100 mL) and dried over
anhydrous sodium sulphate Na2SO4, filtered and the solvent was evaporated by a rotary evaporator.
The resulting product was purified by triturating with hexane and then the precipitate was filtered.
Yield: 89.91%. 1H NMR (CDCl3, 500 MHz), δ in ppm, 11.25 (s, 2 H), 9.83 (s, 2 H), 8.05 (s, 2 H),
7.63 (s, 2 H) 7.49 (d, 2 H), 7.21 (s, 2 H), 6.98 (s, 4 H), 6.73 (s, 4 H), 5.46 (s, 2 H), 5.2 (s, 2 H), 4.16
(d, 4 H), 3.16 (d, 4 H), 1.27 (s, 18 H), 1.26 (s, 18 H), 0.96 (s, 18 H). Fig. 12-B Appendix.
Microanalysis was carried out at the University of Surrey, calculated %: C; 74.6, H; 7.5, N; 7.05.
Found %: C; 73.97, H; 7.84, N; 6.73
2.5.13 Preparation of 2-azidoacetamide209
The compound was prepared according to Scheme 2.10
60 °C
NaN3 / H2O
Scheme. 2.10 Preparation of 2-azidoacetamide.

2. Experimental Part
79
In a three-neck round bottom flask, an aqueous solution of sodium azide (4 g, 61.5 mmol) was added
slowly to 2-chloroacetamide (5 g, 126.5 mmol) in 100 ml of water. The reaction mixture was refluxed
in an oil bath for 17 h at 60°C. The reaction mixture was allowed to cool. It was then concentrated
and extracted by ethylacetate. The solvent was evaporated and the white solid product was
recrystallized from diethyl ether to afford white crystals of 2-azidoacetamide. The yield was 87 %,
mp: 57-58 °C, 1H NMR (500 MHz, in CDCl3), 3.9 (CH2), 5.5-6.3 (d, NH2). Fig. 13-B Appendix
IR max (cm-1) 3371 and 3183 (N-H) Str., 2980-2910 (C-H) str., 2105 (N3) str., 1622 and 1411 (C=O)
str.
2.5.14 Synthesis of 25, 26, 27, 28-(diethylamino) ethoxycalix[4]arene CA-(NH2)4210
The synthesis of 25, 26, 27, 28-(diethylamino)ethoxy calix[4]arene was carried out according to the
following Scheme
HCl
MeCN / NaH, refluxe 6 hours
Scheme 2.11 Synthesis of 25, 26, 27, 28-(diethylamino)ethoxy calix[4]arene
A solution of 25, 26, 27, 28-tetrahydroxycalix[4]arene (2.52 g, 5.52 mmol) and sodium hydride (2.12
g, 88.36 mmol) was prepared in a THF: DMF (80: 20) solvent mixture (150 ml) under a nitrogen
atmosphere. The mixture was stirred at 25 C for 30 minutes.Then 2-diethylamino ethylchloride
hydrochloride (6.09 g, 35.4 mmol) was added over a period of 30 minutes .The mixture was stirred
for 6 hours at 80 C. The progress of the reaction was monitored by TLC using a DCM: MeOH (9:
1) mixture. Following the completion of the reaction, the mixture was allowed to cool down to room
temperature and the solvent was evaporated in a rotary evaporator. The resulting crude mixture was
extracted into DCM (100 ml) and washed with water (100 ml). The organic phase was separated and
dried over magnesium sulphate and then filtrated. The filtrate was evaporated by a rotary evaporator
to a brown solid residue. The solid product was sonicated and then was recrystallised from methanol.
White crystals were obtained (1.01 g, 40 % yield).
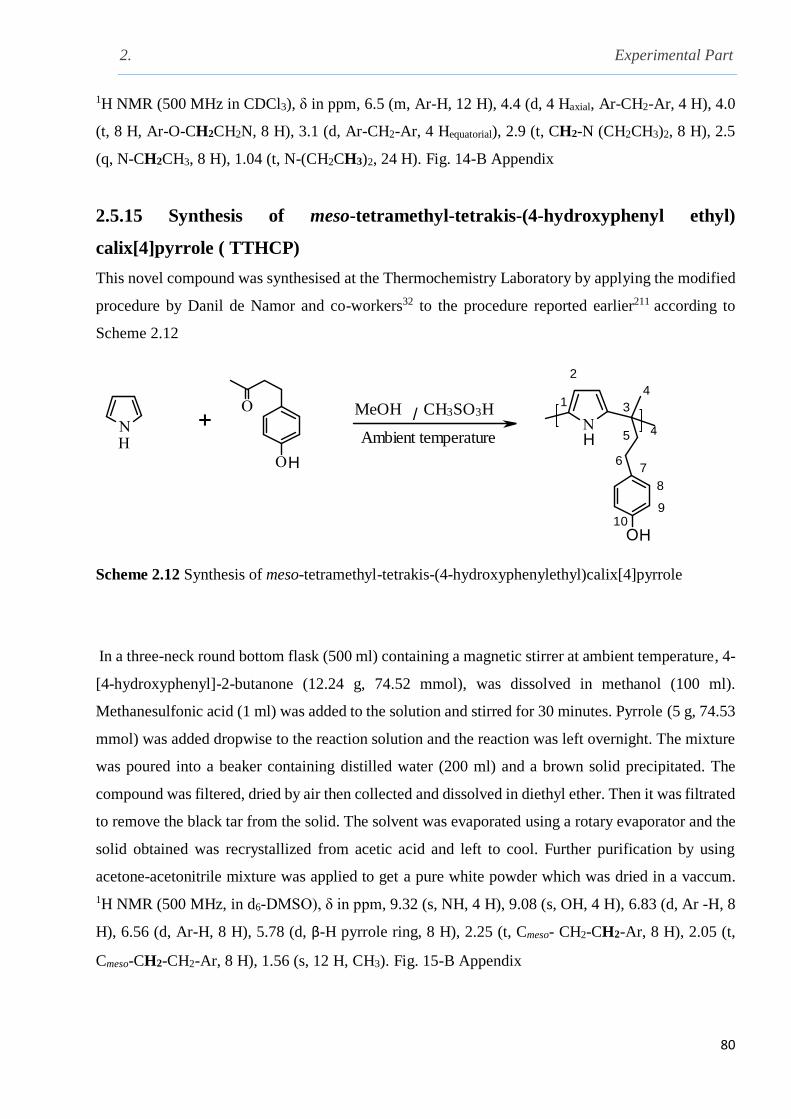
2. Experimental Part
80
1H NMR (500 MHz in CDCl3), δ in ppm, 6.5 (m, Ar-H, 12 H), 4.4 (d, 4 Haxial, Ar-CH2-Ar, 4 H), 4.0
(t, 8 H, Ar-O-CH2CH2N, 8 H), 3.1 (d, Ar-CH2-Ar, 4 Hequatorial), 2.9 (t, CH2-N (CH2CH3)2, 8 H), 2.5
(q, N-CH2CH3, 8 H), 1.04 (t, N-(CH2CH3)2, 24 H). Fig. 14-B Appendix
2.5.15 Synthesis of meso-tetramethyl-tetrakis-(4-hydroxyphenyl ethyl)
calix[4]pyrrole ( TTHCP)
This novel compound was synthesised at the Thermochemistry Laboratory by applying the modified
procedure by Danil de Namor and co-workers32 to the procedure reported earlier211 according to
Scheme 2.12
/
Ambient temperature
1
2
3
4
5
67
8
910
CH3SO3H MeOH
Scheme 2.12 Synthesis of meso-tetramethyl-tetrakis-(4-hydroxyphenylethyl)calix[4]pyrrole
In a three-neck round bottom flask (500 ml) containing a magnetic stirrer at ambient temperature, 4-
[4-hydroxyphenyl]-2-butanone (12.24 g, 74.52 mmol), was dissolved in methanol (100 ml).
Methanesulfonic acid (1 ml) was added to the solution and stirred for 30 minutes. Pyrrole (5 g, 74.53
mmol) was added dropwise to the reaction solution and the reaction was left overnight. The mixture
was poured into a beaker containing distilled water (200 ml) and a brown solid precipitated. The
compound was filtered, dried by air then collected and dissolved in diethyl ether. Then it was filtrated
to remove the black tar from the solid. The solvent was evaporated using a rotary evaporator and the
solid obtained was recrystallized from acetic acid and left to cool. Further purification by using
acetone-acetonitrile mixture was applied to get a pure white powder which was dried in a vaccum.
1H NMR (500 MHz, in d6-DMSO), δ in ppm, 9.32 (s, NH, 4 H), 9.08 (s, OH, 4 H), 6.83 (d, Ar -H, 8
H), 6.56 (d, Ar-H, 8 H), 5.78 (d, β-H pyrrole ring, 8 H), 2.25 (t, Cmeso- CH2-CH2-Ar, 8 H), 2.05 (t,
Cmeso-CH2-CH2-Ar, 8 H), 1.56 (s, 12 H, CH3). Fig. 15-B Appendix

2. Experimental Part
81
13C NMR (500 MHz, in d6-DMSO), in ppm, 155.7 (C10), 137.8 (C9), 132.9 (C8), 129.4 (C7),
115.5(C1), 103.39 (C2), 44.03 (C6), 39.8 (C5), 30.5 (C4), 25.41 (C3). Fig. 16 B Appendix
2.5.16 Synthesis of meso-tetramethyl-tetrakis-(4-ethylacetatophenoxyethyl)
calix[4]pyrrole (TTECP)202
This super extended compound was synthesised for the first time in the Thermochemistry Laboratory
by applying a new modified procedure according to Scheme 2.13
THF/ DMF,
60 °C
Scheme 2.13 Synthesis of meso-tetramethyl-tetrakis-(4-ethylacetato-oxyphenylethyl) calix[4]pyrrole
In a three-neck round bottom flask (250 ml) containing a magnetic stirrer at ambient temperature and
under a N2 atmosphere, meso-tetramethyl-tetakis-(4-hydroxyphenylethyl)calix[4]pyrrole ( 2 g, 1.67
mmol ), was dissolved and stirred in a mixture of freshly distilled THF and dry DMF (THF: DMF
60: 40, v/ v). Then sodium hydride (0.056 g, 2.24 mmol), was added carefully followed by dropwise
addition of ethylbromo acetate (0.28 g, 1.67 mmol). The reaction mixture was heated in an oil bath
at 60 °C under vigorous stirring. The reaction was monitored by thin layer chromatography using a
DCM: MeOH (9: 1) mixture as the developing solvent. After the reaction was completed, the mixture
was allowed to cool down to ambient temperature. The solvent was evaporated by a rotary evaporator
and a colourless viscous liquid product was obtained, dissolved and extracted by DCM. It was then
washed with distilled water and then with brine. The organic layer was collected and dried over
anhydrous magnesium sulphate, filtered and the solvent evaporated using a rotary evaporator. A
white powder was obtained, collected and recrystallised from methanol. The white powder obtained
was filtered and dried, 1H NMR (500 MHz, in CDCl3), δ in ppm, 7.03 (s, NH, 4 H), 6.91 (d, Ar-Hmeta,
8 H), 6.69 (d, Ar-Hortho, 8 H), 5.95 (d, C-H, 8 H pyrrole rings), 4.54 (s, O-CH2-CO, 8 H), 4.25 (q, O-
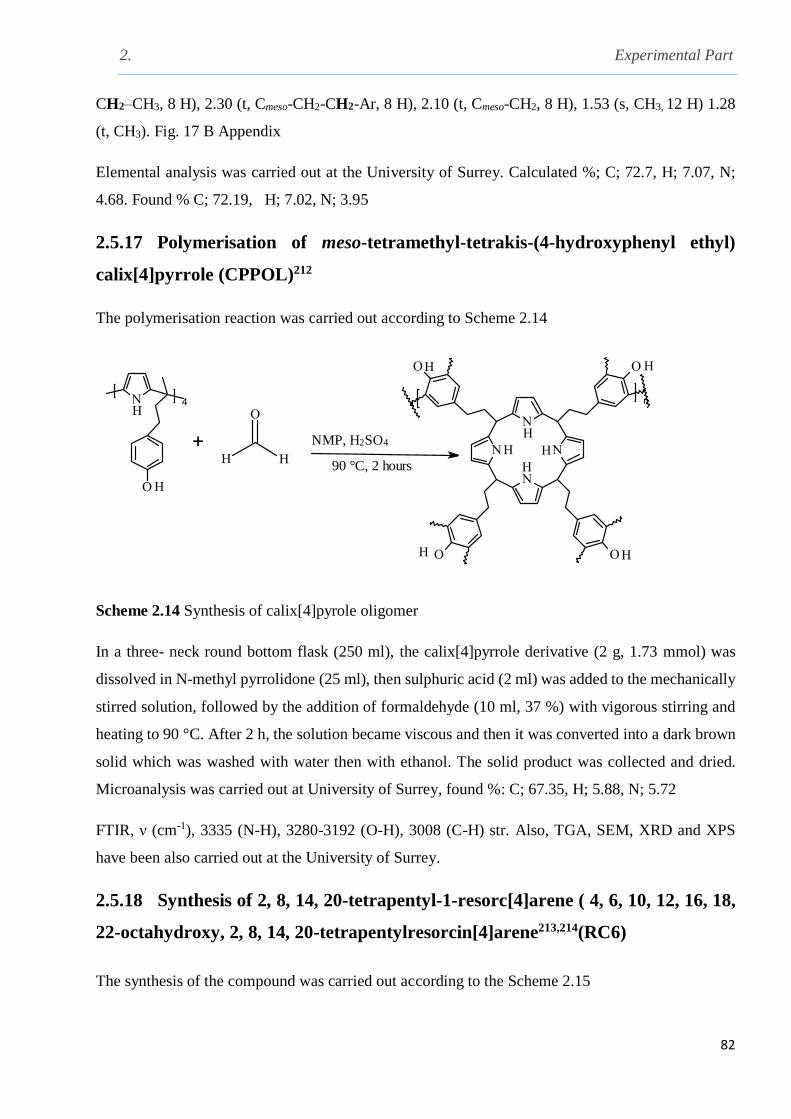
2. Experimental Part
82
CH2–CH3, 8 H), 2.30 (t, Cmeso-CH2-CH2-Ar, 8 H), 2.10 (t, Cmeso-CH2, 8 H), 1.53 (s, CH3, 12 H) 1.28
(t, CH3). Fig. 17 B Appendix
Elemental analysis was carried out at the University of Surrey. Calculated %; C; 72.7, H; 7.07, N;
4.68. Found % C; 72.19, H; 7.02, N; 3.95
2.5.17 Polymerisation of meso-tetramethyl-tetrakis-(4-hydroxyphenyl ethyl)
calix[4]pyrrole (CPPOL)212
The polymerisation reaction was carried out according to Scheme 2.14
NMP, H2SO4
90 °C, 2 hours
Scheme 2.14 Synthesis of calix[4]pyrole oligomer
In a three- neck round bottom flask (250 ml), the calix[4]pyrrole derivative (2 g, 1.73 mmol) was
dissolved in N-methyl pyrrolidone (25 ml), then sulphuric acid (2 ml) was added to the mechanically
stirred solution, followed by the addition of formaldehyde (10 ml, 37 %) with vigorous stirring and
heating to 90 °C. After 2 h, the solution became viscous and then it was converted into a dark brown
solid which was washed with water then with ethanol. The solid product was collected and dried.
Microanalysis was carried out at University of Surrey, found %: C; 67.35, H; 5.88, N; 5.72
FTIR, ν (cm-1), 3335 (N-H), 3280-3192 (O-H), 3008 (C-H) str. Also, TGA, SEM, XRD and XPS
have been also carried out at the University of Surrey.
2.5.18 Synthesis of 2, 8, 14, 20-tetrapentyl-1-resorc[4]arene ( 4, 6, 10, 12, 16, 18,
22-octahydroxy, 2, 8, 14, 20-tetrapentylresorcin[4]arene213,214(RC6)
The synthesis of the compound was carried out according to the Scheme 2.15

2. Experimental Part
83
R=C5H11
reflux, 80 °C
Resorcinol
EtOH, HCl
Hexanal
Scheme 2.15 Synthesis of C-pentyl-resorcin[4]arene
In a three-neck round bottom flask fitted to a reflux condenser, a solution of resorcinol (11 g, 99.8
mmol) in ethanol (100 ml), was stirred and cooled to 0 °C in an ice bath, hydrochloric acid (12 M, 2
ml) was added to the stirring solution which was followed by the careful addition of hexanal (12.1
ml, 99.9 mmol) maintaining the temperature at 0 °C. The reaction vessel was then removed from the
ice bath under continuous stirring (one hour) and transferred to an oil bath heated to 80 °C for 16
hours. The reaction mixture was removed, allowed to cool down to ambient temperature and then
refrigerated. The product was filtered and washed by an ice cold mixture of ethanol and water (1:1,
v/v) to yield a yellow orange solid which was dried in vaccuo at 80 °C. 1H NMR (500 MHz, in
CD3CN), δ in ppm, 7.59 (s, Ar-OH, 4 H), 7.27 (s, Ar-H, 4 H), 6.21 (Ar-H, 8 H), 4.16 (t, CHbridge, 4
H), 2.26-2.22 (m, CHCH2CH2, 8 H), 1.34-1.22 (m, CH2CH2CH2, 24 H), 0.890 (t, CH3, 12 H). Fig.
18-B Appendix
2.5.19 Synthesis of 4, 6, 10, 12, 16, 18, 22, 24-octa-oxy-ethylacetato-2, 8, 14, 20-
tetrapentylresorcin[4]arene RC6-Es
The synthesis of the compound was carried out according to the Scheme 2.16
NaH, 60 °C
THF/ DMF,
44
Scheme 2.16 Synthesis of C-pentylresorcin[4]arene ester
2. Experimental Part
84
In a 500 ml three-neck round bottom flask and under a nitrogen gas atmosphere, C-
pentylresorcin[4]arene (5 g, 6.5 mmol) was dissolved in a mixture of freshly distilled THF and dry
DMF (60: 40, v/ v), then sodium hydride (0.16 g, 6.6 mmol) was added carefully to the reaction
mixture and stirred for 30 minutes. This was followed by the dropwise addition of ethyl bromoacetate
(1.09 g, 6.5 mmol) to the reaction solution. The mixture was heated in an oil bath at 60 °C. The
reaction was followed by TLC using a DCM: MeOH (7: 3) mixture as the developing solvent system.
After completion, the reaction was stopped and cooled down to ambient temperature. The resulting
solution was filtered and the solvent evaporated using a rotary evaporator. A brown viscous product
was obtained, dissolved in 100 ml dichloromethane and transferred to a separation funnel. Then it
was washed with distilled water and brine, the organic layer was separated and dried over anhydrous
magnesium sulphate. The mixture was filtered and the solvent was evaporated under reduced
pressure. A viscous colourless liquid was obtained. The crude product was dissolved in methanol and
sonicated to break the oil. Light yellow crystals were obtained, filtered, collected and then dried.
Yield 3 g, 60 %,1H NMR (500 MHz, in CDCl3), δ in ppm, 6.64 (s, Ar-H, 4 H), 6.23 (s, Ar-H, 4 H),
4.61 (t, C-Hbridge, 4 H) ,4.3 (s (O-CH2CO,8 H), 1.86 (8 H, q (CHCH2CH2), 1.6-1.3 (m,
CHCH2CH2CH2CH3, 24 H), 0.87 (s, CH3, 12 H). Fig. 19 B Appendix
13C NMR (500 MHz, CDCl3, δ in ppm), 14.14 (CH3), 22.66 (CH2), 27.67 (CH2), 32.09 (CH2), 34.47
(CH2), 35.79 (CH3), 51.92 (Cbridge), 60.97 (CO-OCH2CH3), 66.8 (OCH2CO, 100.17 (Ph-C), 117.88,
128.54 (Ph-CH), 126.55 (Ph-CH), 154.9 (C-OH), 170.14 (C=O)
C80H112O24
Microanalysis was carried out at the University of Surrey. Calculated %: C; 65.9, H; 7.69, N; 0.0
Found %: C; 64.12, H; 7.34, N; 0.0
2.5.20 Synthesis of 2, 8, 14, 20-tetradecyl-5, 11, 17, 23-
tetrahydroxyresorc[4]arene ( 4, 5, 6, 10, 11, 12, 16, 17, 18, 22, 23, 24-
dodecahydroxyl-2, 8, 14, 20-tetrapentylresorcin[4]arene215 (PG6)
The compound was synthesised following the same procedure used by Gerkensmeier and co-workers
215 according to the following Scheme

2. Experimental Part
85
C-pentyl pyrogallol[4]arene
4
Pyrogallol
HCl , 80 0C
Hexanal
Scheme 2.17 Synthesis of C-pentylpyrogallol[4]arene
A pre-dried three-neck round bottom flask (500 ml) containing a magnetic stirrer and fitted to a
condenser and dropping funnel was placed in an ice bath under an inert atmosphere. Pyrogallol (7.84
g, 62.2 mmol), was dissolved in ethanol (100 ml). Hydrochloric acid (12 M, 2 ml) solution in ethanol
(20 ml) was added dropwise to the stirring solution maintaining the temperature at 0 °C. This was
followed by the dropwise addition of hexanal (9.6 ml, 62.2 mmol) mixed with ethanol (25 ml). The
reaction mixture was removed from the ice bath and heated in an oil bath at 80 °C under vigorous
stirring for 16 hours. After the reaction was completed, the mixture was allowed to cool to ambient
temperature. The mixture was poured into ice-water to obtain light purple solid which was filtered
and washed by ice cold ethanol. The purple solid collected and dried en vacuum at 80 °C. Pure white
compound was obtained.
1H NMR (500 MHz, in CDCl3), δ in ppm, 8.77 (s, Ar-OHmeta, 4 H), 7.46 (s, Ar-OHpara, 4 H), 6.88 (s,
Ar-OHmeta, 4 H), 6.84 (s, Ar-H, 4 H), 4.38 (t, CHbridge, 4 H), 2.25-2.18 (m, CH-CH2-CH2, 8 H), 1.42-
1.34 (m, CH2-CH2-CH2-CH2-CH3, 24 H), 0.9 (t, CH3,12 H), Fig. 20-B Appendix
13C NMR (500 MHz, in CDCl3), δ in ppm, 138.49 (ArC-OHmeta, 4 C), 137.34 (ArC-OHmeta, 4 C),
131.37 (ArC-OHpara, 4 C), 125.39 (ArCortho, 4 C), 124.07 (ArCortho, 4 C), 113.76 (ArC, 4 C), 34.1
(CH, 4 C), 33.17 (CH-CH2-CH2, 4 C), 31.96 (CH-CH2-CH2 ,4 C), 29.96 (CH-CH2-CH2, 4 C), 27.988
(CH2-CH2-CH3, 4 C), 22.72 (CH2-CH2-CH3, 4 C), 14.11 (CH3, 4 C)
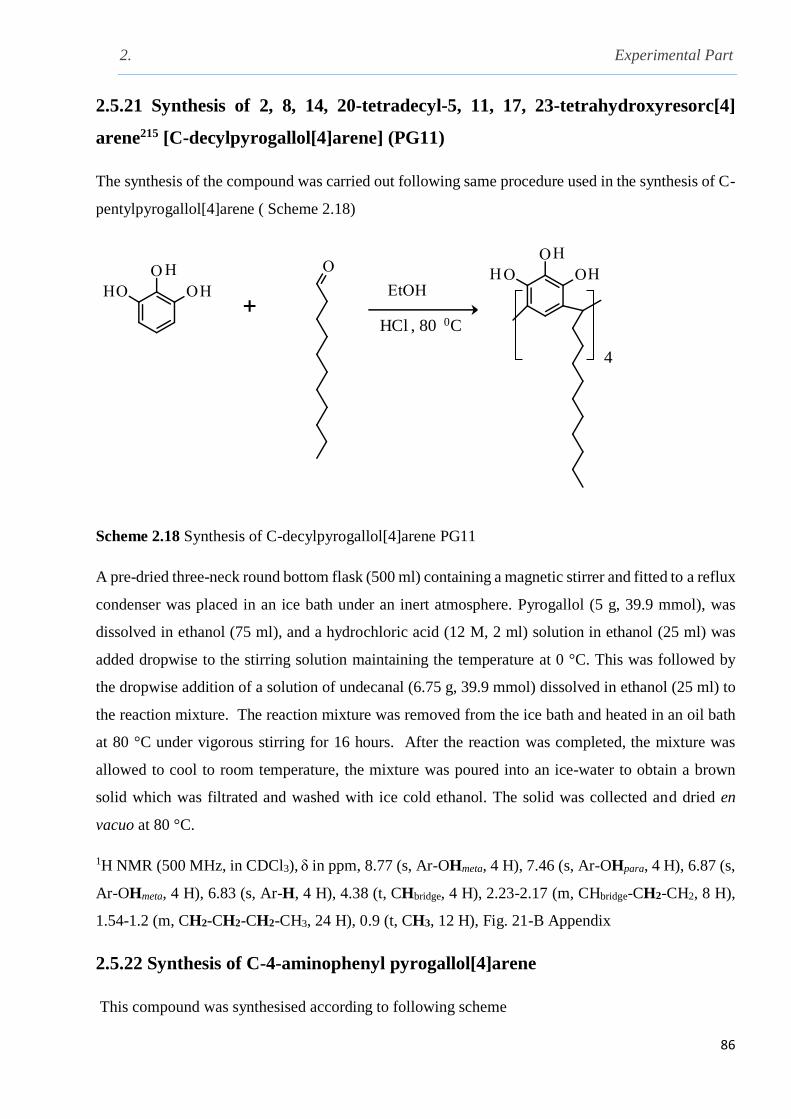
2. Experimental Part
86
2.5.21 Synthesis of 2, 8, 14, 20-tetradecyl-5, 11, 17, 23-tetrahydroxyresorc[4]
arene215 [C-decylpyrogallol[4]arene] (PG11)
The synthesis of the compound was carried out following same procedure used in the synthesis of C-
pentylpyrogallol[4]arene ( Scheme 2.18)
4
HCl , 80 0C
Scheme 2.18 Synthesis of C-decylpyrogallol[4]arene PG11
A pre-dried three-neck round bottom flask (500 ml) containing a magnetic stirrer and fitted to a reflux
condenser was placed in an ice bath under an inert atmosphere. Pyrogallol (5 g, 39.9 mmol), was
dissolved in ethanol (75 ml), and a hydrochloric acid (12 M, 2 ml) solution in ethanol (25 ml) was
added dropwise to the stirring solution maintaining the temperature at 0 °C. This was followed by
the dropwise addition of a solution of undecanal (6.75 g, 39.9 mmol) dissolved in ethanol (25 ml) to
the reaction mixture. The reaction mixture was removed from the ice bath and heated in an oil bath
at 80 °C under vigorous stirring for 16 hours. After the reaction was completed, the mixture was
allowed to cool to room temperature, the mixture was poured into an ice-water to obtain a brown
solid which was filtrated and washed with ice cold ethanol. The solid was collected and dried en
vacuo at 80 °C.
1H NMR (500 MHz, in CDCl3), δ in ppm, 8.77 (s, Ar-OHmeta, 4 H), 7.46 (s, Ar-OHpara, 4 H), 6.87 (s,
Ar-OHmeta, 4 H), 6.83 (s, Ar-H, 4 H), 4.38 (t, CHbridge, 4 H), 2.23-2.17 (m, CHbridge-CH2-CH2, 8 H),
1.54-1.2 (m, CH2-CH2-CH2-CH3, 24 H), 0.9 (t, CH3, 12 H), Fig. 21-B Appendix
2.5.22 Synthesis of C-4-aminophenyl pyrogallol[4]arene
This compound was synthesised according to following scheme

2. Experimental Part
87
Ethanol/ HCl
80 °C, 24 hours
Scheme 2.19 Synthesis of C-4-aminophenyl pyrogallol arene
In a 500 ml three neck round bottom flask containing a magnetic stirrer fitted with a reflux condenser,
pyrogallol (4.66 g, 36.95 mmol) was dissolved in ethanol (50 ml), hydrochloric acid (2 ml, 12 M)
mixed with ethanol (10 ml) were added dropwise under continuous stirring. Then p- amino-
acetophenone (5 g, 36.99 mmol) was dissolved in ethanol (50 ml) and was added to the reaction
mixture dropwise. Then the reaction mixture was heated in an oil bath at 60 °C. After 20 minutes the
colour of the solution was changed to deep purple colour. The mixture was left overnight, then
removed from the oil bath, cooled down to ambient temperature and then it was neutralised by an
aqueous solution of sodium bicarbonate solution (10 %) and refrigerated, the obtained precipitate
was collected by filtration and dried under vacuum. Microanalysis were carried out at the University
of Surrey. Calculated %: C; 69.00, H; 5.30, N; 5.76. Found %: C; 68.35, H; 5.79, N; 6.97
2.6 Solubility measurements of receptors
Saturated solutions of each receptor were prepared in different solvents and kept in a water bath at
298.15 K for 24 hours to attain equilibrium between the solid and its saturated solution which were
filtered by using Millipore filters 0.22 µm and a known volume of the solution was placed into a pre-
weighed porcelain crucible, dried and the weight of the residual solid was gravimetrically determined.
Solvation experiments were carried out by exposing separately pre-weighed crucibles containing the
solid in a saturated environment of the appropriate solvent in a desiccator for several days. The
crucibles were then weighed to check the uptake of solvent by the solid. From solubility data, ΔsG°
were calculated for the samples that were not altered by solvation.
2.7 1H NMR measurements
1H NMR measurements were carried out at 298 K using a Bruker AC-500 MHz. The investigations
were carried out by dissolving each compound (30 mg) in the appropriate deuterated solvents (0.5
2. Experimental Part
88
ml) in 5 mm NMR tubes using TMS as the internal reference. 1H NMR titrations were carried out to
determine the complexation between the receptor and the targeted guest by adding increasing
amounts of known concentrations of guest solutions to the NMR tube containing a known
concentration of the receptor. Chemical shift changes of the receptor after each addition were
recorded. Subtracting the chemical shift for the free receptor r from the chemical shifts of the
complex, c, the chemical shift changes, ∆, was calculated from the following equation (eq.2.6)
∆ c r eq. 2.6
2.8 Conductometric measurements
Conductance measurements are very supportive tool to monitor the complexation process between
the receptor and the targeted species by testing the variation of the electrical behaviour of the guest
solution in the conductivity cell caused by the gradual addition of the host solution and to identify
the stoichiometry of the interaction at 298.15 K. A brief introduction on conductance measurements
is given. Conductance measurements follows Ohm’s law in which the current I (amperes) in a
conductor is directly proportional to the applied electric force E (volts) and inversely proportional
to the resistance R (ohm’s) of the conductor (eq.2.7)216
I = E / R eq.2.7
The resistance of an homogenous sample material, Ɩ, and cross sectional area, A, is given by eq.2.8
R = ρ Ɩ /A eq.2.8
In this equation, ρ; is a characteristic property of the material and is known as resistivity and it is
measured in Ω cm.
ρ = R A / Ɩ eq.2.9
The reciprocal of the resistivity is the conductivity, κ, is given as S.cm-1 where S is the notation used
for the reciprocal of the resistivity ρ (Seimens or Ω-1). Therefore eq.2.9 can be written in terms of

2. Experimental Part
89
= I Ɩ / R A eq.2.10
The conductivity of the solution under study was obtained by using the pre-determined value of the
cell constant (θ = Ɩ /A) and the measured value of the resistance R of the same sample as shown in
eq.2.11
= I θ / R eq.2.11
In this equation, the cell constant units are cm-1. The molar conductance, m, of an electrolyte is
given by eq.2.12
m =1000 / c eq.2.12
In eq.2.12 c, is the concentration of the solution in mol dm-3 and the units of m are given in S.cm2
mol-1.
2.8.1 Determination of the conductivity cell constant
The conductivity cell constant, , was determined according to the method described by Jones and
Bradshaw217 by adding stepwise additions of a solution of potassium chloride in deionised water (0.1
mol dm-3) to the conductivity cell containing deionised water (25 ml) at 298.15 K. Conductivity
values were recorded after each addition. The molar conductance, m (S cm2
mol-1
) was calculated
from the equation derived by Lind, Zwolenik and Fuoss218
m = 149.93 – 96.65 c1/2
+ 58.74 c log c + 198.4 c eq.2.13
In eq.2.13, c, denotes to molar concentration (mol dm-3) of potassium chloride solution. The cell
constant, θ (cm-1) was calculated from the following equation
θ = m c / κ ×1000 eq.2.14
2.8.2 Conductometric titrations at 298.15 K

2. Experimental Part
90
Conductometric titrations involved the gradual addition of the receptor solution in acetonitrile to the
conductivity cell containing the targeted guest in the same solvent at 298.15K. To achieve these
measurements, the conductometric cell connected to a thermostated water bath was loaded with the
guest solution in the appropriate solvent (25 ml). Then the electrodes were immersed into the solution
cell under continuous stirring during the course of the titration. Accurate aliquots of the receptor were
gradually added to the guest solution in the same solvent, the resistance was recorded after each
addition once equilibrium was attained. Molar conductance Λm (S cm2 mol -1) were plotted against
the [receptor/ guest] concentration ratio. The stoichiometry of the complexation was identified by the
graphical tangent method (intercept between the two lines prior and after the end point of the
reaction).
2.9 Nano Isothermal Titration Calorimeter Nano-ITC
Isothermal titration calorimetry is a highly sensitive technique designed to determine rapidly and
accurately the thermodynamic parameters associated with the complexation process between the host
and the guest in solution (stability constant and enthalpy of a reaction). From these parameters, the
Gibbs energy and the entropy of complexation can be calculated by applying the following equations
ΔcG° = ─ RT ln Ks 2.15
ΔcG° = ΔcH°─TΔcS° 2.16
In eqs. 2.15 and 2.16, ∆cG °, R, T, Ks, ∆cH° and ∆cS° denote the standard Gibbs energy, the gas
constant, the temperature (Kelvin), the stability constant, the standard enthalpy and entropy of
complexation respectively
The Nano Isothermal Titration Calorimeter consists of the main features:
1. A burette stirring system.
2. A syringe (100 µl)
3. A reference cell (1 cm3
each)
4. Thermoelectric devices.

2. Experimental Part
91
The Nano ITC is connected to a personal computer that included the software delivered from the
manufacturer with the information needed for the operation of the instrument and to analyse the data
obtained to display the thermodynamic parameters for every single reaction taking place219, 220.
2.9.1 Calorimetric measurements
The Nano- ITC measurements were carried out in degassed acetonitrile at 298.15 K. The host solution
(1×10⁻³ mol dm-3) was used in a 950 l cell volume. Solutions of each guest (2×10⁻² mol dm-3) were
added by an injection syringe programmed to inject 5 or 10 µl successively into the host solution in
the same solvent with a 3 to 5 minutes’ interval between each injection. The instrument was delivered
with a program from the manufacturer to control the operation. The heat of dilution was determined
from the titration curve after the receptor concentration was totally consumed. The obtained values
were modelled using an independent nonlinear regression analysis. The fitting was done using a
software
2.9.2 Calibration of the Nanocalorimeter
Calibration experiments were carried out to check the accuracy of the ITC. The complexation reaction
between barium chloride with 18-crown-6 in aqueous medium at 298.15 K suggested by Briggner
and Wadsӧ221,222 as a standard reaction was performed to calibrate the calorimeter. The calibration
experiment was carried out by setting the instrument to inject automatically 5 µl from the injection
syringe containing the aqueous solution of barium chloride (1.5 × 10⁻² mol dm-3) every five minutes
to the reference cell which was loaded with 18-crown-6 solution (1 × 10⁻³ mol dm-3) in deionised
water. After completion of the reaction, the data were analysed by the software delivered with the
instrument from the Manufacturer. From the titration information, the stability constant Ks and the
enthalpy change ΔH were obtained. From these parameters, the Gibbs energy and entropy were
calculated by applying equations 2.15 and 2.16 respectively
2.10 Determination of the stability constant and the composition of host-guest
complexes by UV-Vis, 1H NMR and calorimetric titrations

2. Experimental Part
92
UV-Vis, 1H NMR and calorimetry are the most commonly used analytical techniques for the
determination of the stoichiometry and the stability constant of the host-guest complex for complexes
of moderate or low stability. Titration measurements are performed by the addition of increasing
concentration of one of the component (host or guest) to a fixed concentration of the other67. The
reversible complexation process between the host and the guest in a solvent (s) is described according
to the following equation (eq.2.17)
𝐻 (𝑠) + 𝐺(𝑠) ⇌ 𝐻. 𝐺( 𝑠) eq. 2.17
Where 𝐻, 𝐺 and 𝐻. 𝐺, are the notations used to indicate the host, the guest and the complex
respectively. Therefore, the stability constant , 𝐾𝑠, can be expressed as follows
𝐾𝑠 =𝑎𝐻.𝐺
𝑎𝐻𝑎𝐺 eq. 2.18
In eq.2.18, 𝑎𝐻.𝐺 , 𝑎𝐻 and 𝑎𝐺 denote the activity of the complex, host and guest respectively. On
the assumption that the activity coefficients of reactants and product are equal to 1 (at low
concentrations), the stability constant can be expressed by eq.2.19 in terms of molar concentrations,
𝐾𝑠 =[𝐻. 𝐺]
[𝐻] [𝐺] eq. 2.19
The concentration of the host and the guest at equilibrium can be calculated from eq.2.20 and eq.2.21
[𝐻] = [𝐻]° − [𝐻. 𝐺] eq. 2.20
[𝐺] = [𝐺]° − [𝐻. 𝐺] eq. 2.21
In eqs.2.20 and 2.21, [𝐻]° , [𝐻], [𝐺], [𝐺], [𝐻. 𝐺]°, are the initial and final molar concentration of the
host, the guest and the complex respectively. By replacing eqs. 2.20 and 2.21 in eq.2.19, it follows
that
𝐾𝑠 =[𝐻. 𝐺]
[𝐻]°[𝐺]° − [𝐻. 𝐺][𝐺]° − [𝐻. 𝐺][𝐻]° + [𝐻. 𝐺]2 eq. 2.22
Rearrangement of eq.2.22 leads to eq.2.23
𝐾𝑠([𝐻]°[𝐺]° − [𝐻. 𝐺][𝐺]° − [𝐻. 𝐺][𝐻]° + [𝐻. 𝐺]2) = [𝐻. 𝐺] eq. 2.23
𝐾𝑠[𝐻. 𝐺]2 − (𝐾𝑠[𝐺]° − 𝐾𝑠[𝐻]° + 1)[𝐻. 𝐺] + 𝐾𝑠[𝐻]°[𝐺]° = 0 eq. 2.24
2. Experimental Part
93
Eq.2.24 can be solved as follows
[𝐻. 𝐺] =1
2([𝐺]° + [𝐻]° +
1
𝐾𝑠) − √([𝐺]° + [𝐻]° +
1
𝐾𝑠)2 + 4[𝐻]°[𝐺]° eq. 2.25
Or
[𝐻. 𝐺] =[𝐻]°𝐾𝑠[𝐺]
1 + 𝐾𝑠[𝐺] eq. 2.26
In eq.2.26, the concentration of the complex [[H.G] is expressed as a function of 𝐾𝑠 , which is the
only unknown and can be determined by UV-Vis, 1H NMR and calorimetric titrations.
In the UV-Vis spectrum, the complex has a particular absorption band,
𝐴 = 휀𝐻.𝐺[𝐻. 𝐺] eq. 2.27
Taking into account eq.2.25, it follows that
𝐴 = 𝑓(휀𝐻.𝐺 , 𝐾𝑠) eq. 2.28
In the UV-Vis the change in the absorption band, ∆𝐴𝑜𝑏𝑠, during the titration is given by
∆𝐴𝑜𝑏𝑠 = 휀∆[𝐻.𝐺]([𝐻. 𝐺]) eq. 2.29
In 1H NMR, the chemical shift changes, ∆𝛿, during the titration is
∆𝛿 = 𝛿∆𝐻𝐺 [𝐻. 𝐺]
[𝐻]° eq. 2.30
In the calorimetric titration, the change in the heat of complexation, 𝑄, is given by eq.2.31
𝑄 = ∆𝐻𝐻.𝐺𝑉([𝐻. 𝐺]) eq. 2.31
In eq. 2.31, ∆𝐻𝐻.𝐺, is the change in enthalpy of the reaction and 𝑉 , is the volume of the guest added
after each addition to the cell containing the host
Determination of stability constant based on absorbance, 𝑨
𝐴 = 𝐴𝐻.𝐺 + 𝐴𝐻 + 𝐴𝐺 eq. 2.32
Assuming [𝐺]° ≫ [𝐻]° , thus, 𝐴𝐺 > 𝐴𝐻, it follows that

2. Experimental Part
94
𝐴 = 𝐴𝐻𝐺 + 𝐴𝐺 eq. 2.33
∆𝐴 = 𝐴 − 𝐴° eq. 2.34
∆𝐴 = 휀𝐻.𝐺[𝐻. 𝐺]𝑏 + 휀𝐺[𝐺]𝑏 + 휀𝐺°[𝐺]°𝑏 eq. 2.35
∆𝐴 = ∆휀[𝐻. 𝐺]𝑏 with ∆휀 = 휀𝐻.𝐺 − 휀𝐺 eq. 2.36
∆𝐴 = 𝑏∆ℰ[𝐻]°𝐾𝑠[𝐺]°
1 + 𝐾𝑠[𝐺]° eq. 2.37
And finally
1
∆𝐴=
1
𝑏∆휀[𝐺]°[𝐻]°𝐾𝑠+
1
𝑏∆휀[𝐻]° eq. 2.38
2.11 General procedure for the determination of optimum amount of the receptor
for the uptake of targeted guest from aqueous solution at 298.15 K
Extraction experiments were carried out in an attempt to assess the efficiency of calix[4]arene
derivatives and 3-aminopropyl functoinalised silica (Sil-NH2) to remove pharmaceuticals from
water.The optimal conditions were determined by taking into account the effect of the amount of
receptor and the pH of the solutions, The capacity of the receptor ( or silica) defined as the maximum
amount of the drug (mmol) per gram of material was determined
2.11.1 Effect of the amount of material on the extraction of pharmaceticals
In order to calculate the optimal amount of the receptor to be used in the extraction experiment,
different amounts of the receptor (0.01, 0.02, ...,0.1 g) were added to a fixed concentration of the
targeted guest in water, the mixtures were mixed well by whirlimixer and left overnight in a water
bath at 298 K. Eeach solution was filtered and analysed by UV-Vis measurements. The percentage
of extraction was calculated according to eq.2.39
% 𝐸 =Ci−Ce
Ci× 100 eq.2.39
2. Experimental Part
95
In this equation, % 𝐸, is the extraction percentage of the targeted guest, ci and ce is the initial and
final concentration of the guest (pollutants) before and after extraction respectively in mol dm-3.
The capacity q of Sil─NH2 was calculated from the eq.2.40
q =(𝐶𝑖−𝐶𝑒)𝑉
𝑚 eq.2.40
where ci and ce are the initial and final concentration of aspirin before and after extraction respectively
in mol dm-3, 𝑚 is the mass of the material used for the removal of the pollutants, 𝑉 is the volume of
the solution in dm3and q is the capacity of the material used to remove the pollutants.
2.11.2 Effect of pH on the extraction
The effect of pH values on extraction of aspirin by 3-aminopropyl functionalised silica was tested
by the addition of 0.08 g of Sil-NH2 in the aspirin solutions (10 ml) containing 5.59 × 10⁻³ mol dm-3
of aspirin with different pH values. The mixtures were mixed on whirlimixer and left for six hours
in a water bath at 298 K. The mixtures then flitered and analysed by UV-Vis spectroscopy. The
percentage of extraction, % E, and the capacity, q, were calculated using eq.2.39 and 2.40
2.11.3 Kinetics of removal of pharmaceuticals by macrocycles and Si-NH2
In order to assess the effect of the time required on the removal processes, a series of solutions with
the same concentration prepared, fixed mass of receptor were added, mixed and filtrated after
different contact times from 10 minutes to 18 h at 298 K by filter (Millipore 0.22), the UV-Vis
measurements were used to determine the final concentration for each solution
2.12 Thermal Properties measurements TGA, DSC
These measurements include the thermogravimetric analysis, TGA and the Diffrential Scanning
Calorimetry DSC. TGA and DSC are powerful and accurte thermoanalytical techniques used
successfully in the investigation of the host-guest complexes by following the variation in the
physicochemical properties of the materials in the solid state as a result of fixed rate increase of
heating and cooling under an inert or potent atmosphere at constant pressure. The investigation of the
complexation process can be determined by the comparisim of the TGA and DSC thermograms for
the host, guest and the complex. Getting different TGA thermograms indicating that the complexation
of the host with guest has significant effect on their thermal stabilities while the obtaining of different
thermodynamic parameters from the DSC thermograms such as shifting the value of melting
enthalpies of the complex compared with its components to another temperature or vanishing during

2. Experimental Part
96
the temperature scale of the sample cracking indicate that the complexation process was achieved
successfully which means that the complexation process has led to an effect on their physicochemical
properties223-225. TGA measurements were carried out to obtain information required in the next DSC
measurements. In the TGA measurements, the solid sample was weighed accurately then placed in a
platinum pan, the pan was inserted into the furnace, and the furnace was sealed. The sample was then
heated from ambient temperature to a maximum temperature of 600 or 800 °C processed to 20 °C/
min temperature rise. Between each analyses, the furnace was cooled by nitrogen gas to make sure
that the instrument had reached ambient temperature. The sample mass was taken by using a
microbalance. The onset temperature of weight loss and first derivative plot were obtained through
the TA Universal Analysis, a software program delivered by the manufacturer of the instrument.
Differential Dcanning Calorimetric DSC tecqniqu is a thermal analysis used to study the change in
the physical properties of the materials as a result of an increase or decrease of temperature at a
constant rate with time in a fixed presure. In the DSC runs, the solid sample was weighed, placed into
an aluminium pan and an empty pan was used as a reference. To start the measurements, the
instrument was cooled to – 25 °C using liquid nitrogen and then the empty reference pan was heated
electrically at a rate of 10 °C/ min and the heat transferred to the sample pan was recorded. The
conditions used for these measurements are shown in Table 2.2. Melting points were calculated.
Table 2.1 Different conditions used during TGA analysis.
Sample name
Weight
used mg
Temperature
range
Ramped
Temperatur
N2 Gas flow
Sodium diclofenac NaDF
2.397 RT-800 °C 20 °C/ min 60 cm3/ min
Carbamazepine CBZ
4.314 RT-600 °C 20 °C/ min 60 cm3/min
CAE 2.832 RT-800 °C 20 °C/ min 60 cm3/ min

2. Experimental Part
97
C10-pyrogallol[4] arene PG11
2.352 RT-800 °C 20 °C/ min 60 cm3/ min
PG11+ CBZ
2.878 RT-600 °C 20 °C/ min 60 cm3/ min
PG11+ aspirin
2.592 RT-600 °C 20 °C/ min 60 cm3/ min
PG 11+ Diclofenac
3.909 RT-600 °C 20 °C/ min 60 cm3/ min
PG11+ clofibric acid
3.157 RT-800 °C 20 °C/ min 60 cm3/ min
Calixamine
2.704 RT-800 °C 20 °C/ min 60 cm3/ min
Calixamin+aspirin
4.446 RT-800 °C 20 °C/ min 60 cm3/ min
Calix-(NH2)2+diclofenac
3.7910 RT-800 °C 20 °C/ min 60 cm3/ min
Aspirin
5.802 RT-800 °C 20 °C/ min 60 cm3/ min
Diclofenac
2.337 RT-800 °C 20°C/ min 60 cm3/ min
Clofibric acid
4.525 RT-800 °C 20 °C/ min 60 cm3/ min
Table 2.2 The conditions applied for DSC analysis
Sample name
Weight
used
mg
Temperature range
°C
Ramped
Temperature
N2 Gas flow
Sodium diclofenac 3.7 25-250 °C 10 °C/ min 50 cm3/ min
Carbamazepine CBZ 4.7 25-200 °C 10 °C/ min 50 cm3/ min
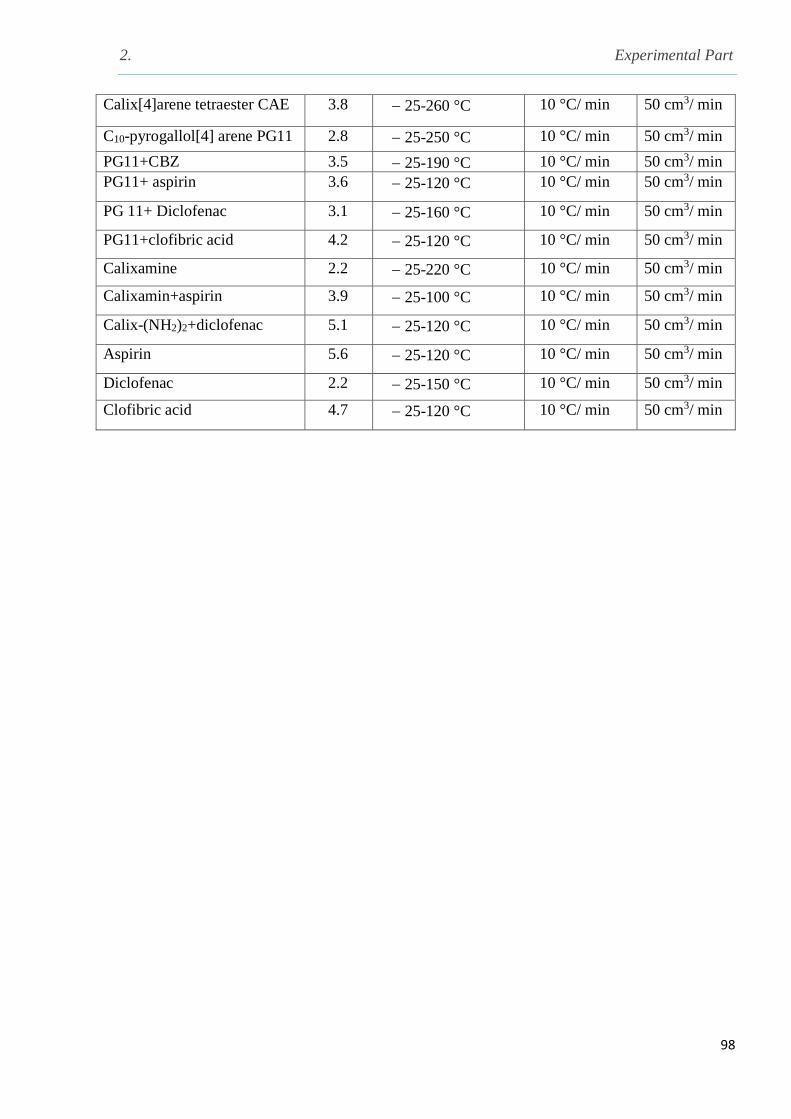
2. Experimental Part
98
Calix[4]arene tetraester CAE 3.8 25-260 °C 10 °C/ min 50 cm3/ min
C10-pyrogallol[4] arene PG11 2.8 25-250 °C 10 °C/ min 50 cm3/ min
PG11+CBZ 3.5 25-190 °C 10 °C/ min 50 cm3/ min
PG11+ aspirin 3.6 25-120 °C 10 °C/ min 50 cm3/ min
PG 11+ Diclofenac 3.1 25-160 °C 10 °C/ min 50 cm3/ min
PG11+clofibric acid 4.2 25-120 °C 10 °C/ min 50 cm3/ min
Calixamine 2.2 25-220 °C 10 °C/ min 50 cm3/ min
Calixamin+aspirin 3.9 25-100 °C 10 °C/ min 50 cm3/ min
Calix-(NH2)2+diclofenac 5.1 25-120 °C 10 °C/ min 50 cm3/ min
Aspirin 5.6 25-120 °C 10 °C/ min 50 cm3/ min
Diclofenac 2.2 25-150 °C 10 °C/ min 50 cm3/ min
Clofibric acid 4.7 25-120 °C 10 °C/ min 50 cm3/ min

3. Results & Discussions
99
Chapter III
Results &
Discussion
3. Results & Discussion
100
3.1 Solubility of drugs in different solvents
Under the IUPAC-NIST Solubility Data Seies, Acree226 proceeded with a critical evaluation on the
solubility of non-steroidal anti-inflammatory drugs in pure organic solvents as well as in organic
solvent mixtures. Drugs included within the context of this work were diclofenac, ibuprofen, sodium
diclofenac and salicylic acid. In order to familiarise with the experimental work related to solubility
measurements of drugs in different solvents, two drugs were selected, sodium diclofenac and
carbamazepine and the results are now discussed
3.1.1 Solubility of sodium diclofenac in different solvents
Solvation and solubility measurements were carried out as described in Section 2.1 and results in
water, methanol (MeOH), ethanol (EtOH), acetonitrile (MeCN), tetrahydrofurane (THF), 1-octanol
(1-Oct), dimethyl sulfoxide (DMSO), N, N-dimethylformamide (DMF), ethyl acetate (EtAc), 1-
butanol (BuOH) and hexane (Hex) are displayed in Table 3.1. For comparison purposes also included
are the literature recommended values reported by Acree226. The derivation of standard solution
Gibbs energy, ΔGs◦ requires that the composition of the solid in equilibrium with the saturated
solution should be the same. Therefore, solvation was tested in the various solvents. Sodium
diclofenac NaDF, is expected to be fully dissociated in water as shown in eq.3.1
. NaDF (sol.) Na+ (H2O) + DF- (H2O) eq. 3.1
Therefore, the thermodynamic solubility product, Ksp can be represented as shown in eq. 3.2
Ksp= [Na+] [DF-] γ±2 eq. 3.2
In eq.3.2 values between brackets denote molar concentrations and γ± is the mean molar activity
coefficient which can be calculated according to the limited Debye-Hückel equation (eq.3.3)
log ± = 0.509 z z √𝐼 eq.3.3
In equation 3.3, z , z , are the net charge for the cationic and anionic moieties respectively and I is
the ionic strength which is defined in eq.3.4
3. Results & Discussion
101
I = 1
2 cz2 eq. 3.4
In eq.3.4, c, is the concentration of the solution in mol dm-3 units
The calculated ionic strength for sodium diclofenac solution in distilled water in this work is
I = 0.069 mol dm-3
This value is not in agreement with the value reported earlier227 (I = 0.16 mol dm-3) Therefore, the
mean molar activity
± 0.735 Ksp = 2.57 × 10⁻³
The data are referred to the standared state (1 mol dm-3) for ions and therefore the units are cancelled
Thus the ΔGs◦ is given by eq.3.5
ΔGs◦ = RT ln Ksp eq. 3.5
In eq. 3.5, R is the gas constant and T is the absolute temperature in Kelvin. The data are referred to
the standard state of 1 mol dm-3 for the solid and for the saturated solution.
In solvents of moderate dielectric constant such as MeOH, EtOH, BuOH, MeCN ions and ion-pairs
will be present in the saturated solution. In order to calculate the ΔGs◦ for the dissociated salt it is
necessary to have knowledge of the ion-pair association constant, Ks. These values are not available
in the literature for this particular drug. Therefore, the ΔGs◦ is not reported in Table 3.1. In solvents
of low dielectric constant such as 1-Oct, THF and Hex, ion pairs will be predominantly in the
saturated solution. Therefore, the ΔGs◦ is referred to the process in eq.3.6
NaDF (sol.) → NaDF (s) eq.3.6
In this case, the ΔGs◦ can be obtaind directly from eq.2.2. Therefore, the Gibbs energies of transfer,
ΔtG ° from water to low permittivity solvents reported in Table 3.1 are referred to the following
process
Na+ (H2O) + DF- (H2O) → NaDF (s) eq.3.7

3. Results & Discussion
102
Table 3.1 Solubility and standard Gibbs energies of solution of sodium diclofenac in different
solvents at 298.15 K.
Solvent Ksp ΔGs◦/ kJ mol-1 ΔGt
◦ (H2O→S2) kJ mol-1
H2O
(6.69 0.04) ×10 -2
14.78 ± 0.2
0.00
MeOH
(5 ± 0.01) ×10 -1
------------
----------
EtOH
(3 ± 0.02) ×10-2
------------
----------
MeCN
(1.52 ± 0.01) ×10-3
------------
----------
THF
(7.53 ± 0.01) ×10-3
20.56 ± 0.1
5.78
DMF
(2.25 ± 0.01) ×10-2
9.41 ± 0.1
-5.37
DMSO
(2.91 ± 0.05) ×10-2
8.76 0.3
-6.02
EtAc
(5.1 ± 0.03) ×10-3
8.14 0.2
-6.64
1-BuOH
(4.3 ± 0.04) ×10- 4
-----------
---------
It is clear from Table 3.1 that in protic solvents (able to enter hydrogen bond formation) the solubility
of NaDF follows the sequence
MeOH > H2O > EtOH > 1-Oct
For other solvents, the following pattern was found
DMSO > DMF > MeCN > THF > BuOH194.
Water will be used as the main solvent for sodium diclofenac as it is the primary focus of this study
to remove this pharmaceutical from water. Unlike sodium diclofenac, carbamazepine CBZ is a non-
electrolyte and therefore the standard solution Gibbs energy can be directly calculated from the
solubility of the drug in the appropriate solvent provided the solvation phenomenon is not observed
when the solid is exposed to a saturated atmosphere of the solvent. The results obtained are now
presented and discussed

3. Results & Discussion
103
3.1.2 Solubility of carbamazepine (CBZ) in different solvents
Solubility data for the CBZ drug in different solvents at 298.15 K are shown in Table 3.2. From the
solubility value, both the Gibbs energy of solution and then the transfer Gibbs energy tG of the
drug from one solvent to another using water as reference solvent were calculated
Table 3.2 Solubility of carbamazepine CBZ in different solvents at 298.15 K and derived standard
Gibbs energies of solution and transfer from water
Solvent
Solubility/ mol dm-3
ΔsG°/ kJ mol-1
ΔtG° (kJ mol-1) H2Os2(H2O)
Water
(7.66 ± 0.04) ×10-4
17.78 ± 0.2
0.00
MeCN
(4.25 ± 0.04) ×10-3
13.39 ± 0.2
- 4.48
DCM
(1.8 ± 0.03) ×10-2
9.96 ± 0.2
- 3.37
DMSO
(1.66 ± 0.03) ×10-2
10.13 ± 0.2
- 7.65
Hex
(5.0 ± 0.06) ×10-1
1.71 ± 0.3
- 15.96
MeOH
(4.4 ± 0.04) ×10-1
2.03 ± 0.2
- 15.64
EtOH
(1.6 ± 0.05) ×10-1
4.54 ± 0.3
- 13.13
DMF
(3.7 ± 0.02) ×10-2
8.17 ± 0.1
- 9.61
From the above data it can be seen that CBZ is least soluble in water and is most soluble in hexane
than in any other solvent. The structure of CBZ itself has a hydrophobic region due to the aromatic
groups but the amide moiety confers to it a certain degree of hydrophilic character and therefore even
though its hydrophobic presence seems to be reflected in the low solubility observed in water and the
highest solubility found in hexane. It seems that protophilic dipolar aprotic solvents such as DMF
and DMSO containing basic oxygen atoms are able to interact through hydrogen bond formation with

3. Results & Discussion
104
the amide fuctional groups of the drug given that the solubility of the drug in these solvents is higher
than that in water.
Again the carbonyl oxygen of the amide functional group in CBZ can interact with the alcohols
through hydrogen bond formation. It is important to emphasise that water is the most strongly
‘structured’ solvent (tri-dimentional nature of molecules associated) while this is not the case for
protic solvents such as the alcohols (chains). Therefore, the latter are more likely to interact with the
drug than water and the results shown in Table 3.2 corroborate this statement. As a result of the low
solubility of CBZ in water, this drug is more favourably transferred to non-aqueous media as reflected
in the negative transfer Gibbs energies. In an attempt to obtain experience on the determination of
partition coefficients of drugs and its relationship with solubility as described below, four drugs were
selected and these are diclofenac, clofibric acid carbamazepine, aspirin nd sodium diclofenac228-231.
3.2 Determination of partition coefficients for diclofenac, clofibric acid,
carbamazepine, aspirin and NaDF in the water-1-octanol solvent system
The relationship between solubility of a drug and its partition coefficient, Kp, is described as follows;
the solubility of a non-electrolyte, D, as described by eq.3.8 is an equilibrium between the solid and
its saturated solution in a given solvent, s1
D (sol.) → D (s1) eq.3.9
The equilibrium constant, K (s1) = [D] (s1) given that the activity of the solid is by convention =1
For solvent s2, the process is described as follows,
D (sol.) → D (s 2) eq.3.10
Therefore, K (s2) = [D] (s2). The ratio between these equilibrium constants is the transfer equilibrium
constant, Kt as defined by eq.3.9
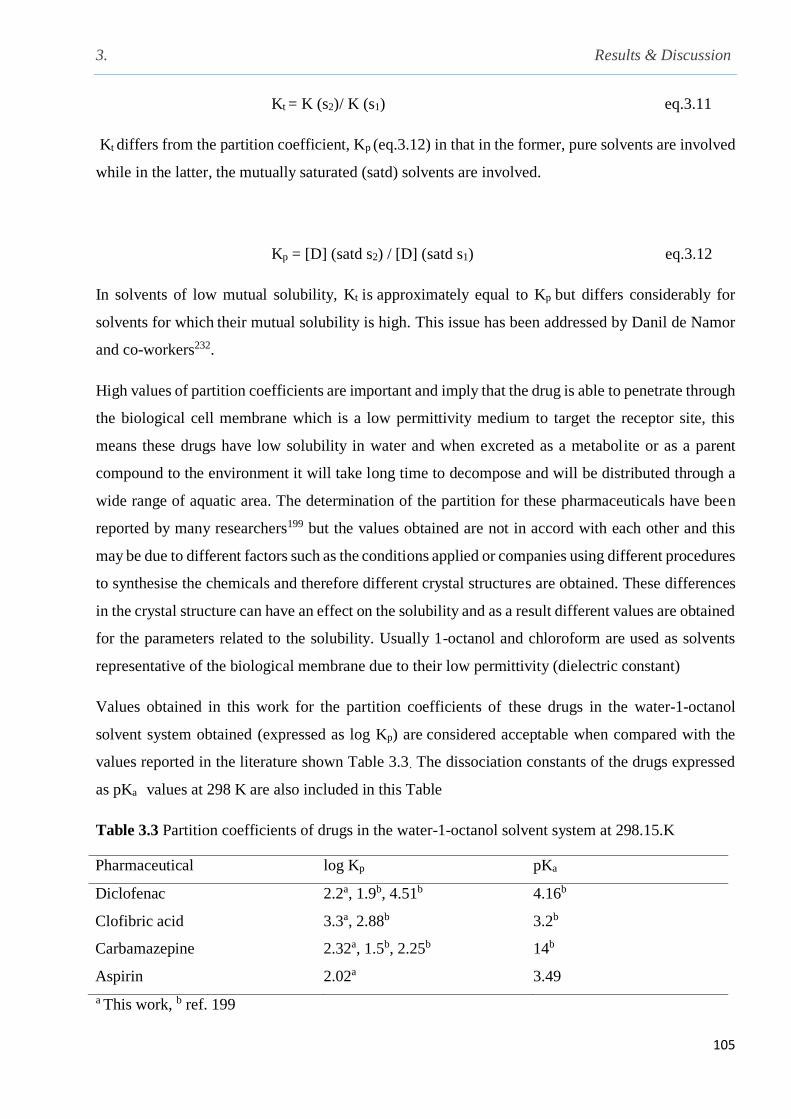
3. Results & Discussion
105
Kt = K (s2)/ K (s1) eq.3.11
Kt differs from the partition coefficient, Kp (eq.3.12) in that in the former, pure solvents are involved
while in the latter, the mutually saturated (satd) solvents are involved.
Kp = [D] (satd s2) / [D] (satd s1) eq.3.12
In solvents of low mutual solubility, Kt is approximately equal to Kp but differs considerably for
solvents for which their mutual solubility is high. This issue has been addressed by Danil de Namor
and co-workers232.
High values of partition coefficients are important and imply that the drug is able to penetrate through
the biological cell membrane which is a low permittivity medium to target the receptor site, this
means these drugs have low solubility in water and when excreted as a metabolite or as a parent
compound to the environment it will take long time to decompose and will be distributed through a
wide range of aquatic area. The determination of the partition for these pharmaceuticals have been
reported by many researchers199 but the values obtained are not in accord with each other and this
may be due to different factors such as the conditions applied or companies using different procedures
to synthesise the chemicals and therefore different crystal structures are obtained. These differences
in the crystal structure can have an effect on the solubility and as a result different values are obtained
for the parameters related to the solubility. Usually 1-octanol and chloroform are used as solvents
representative of the biological membrane due to their low permittivity (dielectric constant)
Values obtained in this work for the partition coefficients of these drugs in the water-1-octanol
solvent system obtained (expressed as log Kp) are considered acceptable when compared with the
values reported in the literature shown Table 3.3. The dissociation constants of the drugs expressed
as pKa values at 298 K are also included in this Table
Table 3.3 Partition coefficients of drugs in the water-1-octanol solvent system at 298.15.K
Pharmaceutical log Kp pKa
Diclofenac 2.2a, 1.9b, 4.51b 4.16b
Clofibric acid 3.3a, 2.88b 3.2b
Carbamazepine 2.32a, 1.5b, 2.25b 14b
Aspirin 2.02a 3.49
a This work, b ref. 199

3. Results & Discussion
106
It can be seen that within the experimental error not much differences are found in the partition of
these drugs from water saturated with 1-octanol to 1-octanol saturated with water.
Having gained experience on solubility measurements and derived thermodynamic parameters as
well in the determination of partition coefficients, among all the macrocycles synthesised and
characterised, only few were selected for complexation with drugs. These are the functionalised
cyclodextrin, Bz-β-CD and the calix[4]arene ester, CAE for sodim diclofenac. For drugs containing
carboxylic acids in their structures, such as clofibric acid, diclofenac, aspirin and ibuprofene, the
calix[4]arene amine derivative CA-(NH2)2 was the receptor selected for further studies. Preliminary
studies in the solid state were carried out with a pyrogallol derivative, PG11 and carbamazepine. The
reason for this selection of receptors is explained through the text
3.3 Complex formation of sodium diclofenac NaDF with the per-benzoylated-β-
cyclodextrin receptor (BzBCD)
There are a number of possible interactions between NaDF and the functionalised cyclodextrin. It is
clear from the chemical structure of the perbenzoylated-β-cyclodextrin. The later contains ester
groups which are known to interact with the sodium cation through ion-dipole interactions113,114. On
the other hand, the NH functionality of the drug can interact with the oxygen atom of the receptor via
hydrogen bond formation. Another possibility is that the hydrophobic region of the receptor can
interact with the hydrophobic region of the drug. Different techniques were used to investigate
whether or not sodium diclofenac interacts with the per-benzoylatec-β-cyclodextrin and if so, to
identify possible sites of interaction.
3.3.1 1H NMR complexation studies
The 1H NMR spectrum of the sodium diclofenac with the perbenzoylated cyclodextrin in DMSO-d6
at 298 K (Fig. 3.1) shows significant changes in the chemical shifts for the sodium diclofenac protons
especially for the N-H proton and a downfield shift (∆ = 0.5 ppm) was observed (Table 3.4) which
may indicate that there is interaction between this proton and the oxygen atom of the receptor. In
addition to strong - interaction between the aromatic systems of the sodium diclofenac and the
benzoyl groups of the receptor which could be attributed to the formation of host-guest complex
through the inclusion of the sodium diclofenac in the receptor cavity233,234
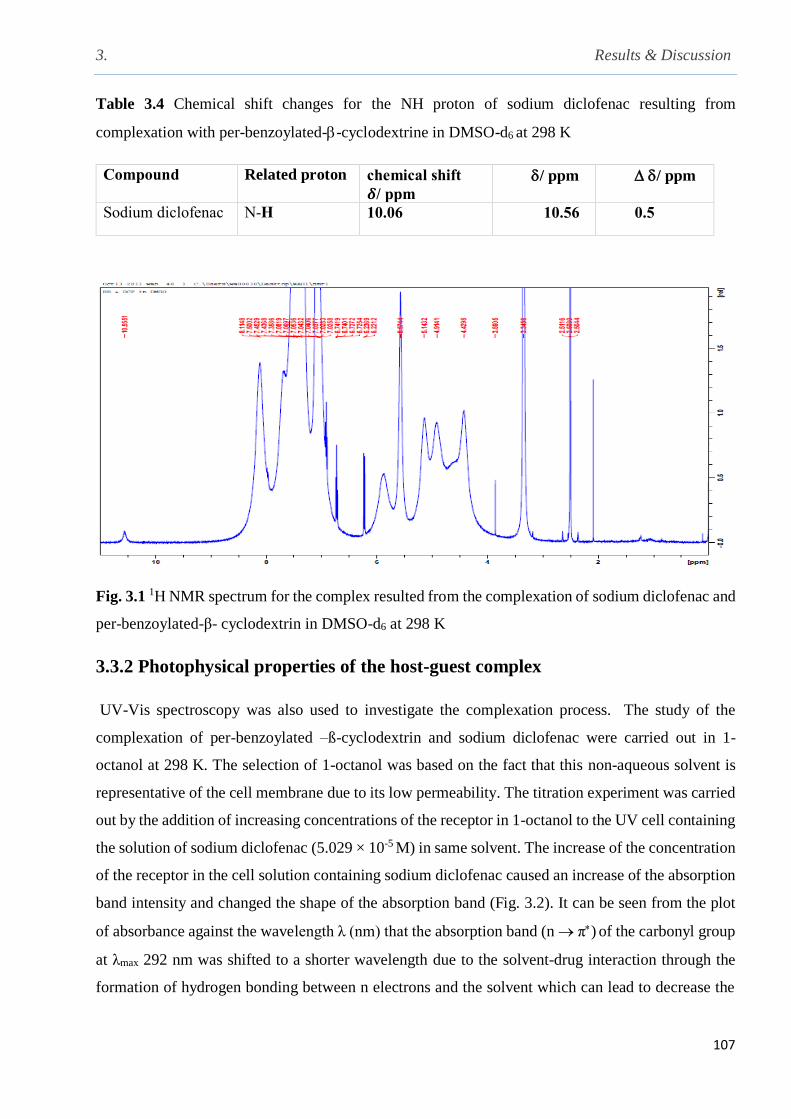
3. Results & Discussion
107
Table 3.4 Chemical shift changes for the NH proton of sodium diclofenac resulting from
complexation with per-benzoylated--cyclodextrine in DMSO-d6 at 298 K
Compound Related proton chemical shift 𝜹/ ppm
/ ppm / ppm
Sodium diclofenac N-H 10.06 10.56 0.5
Fig. 3.1 1H NMR spectrum for the complex resulted from the complexation of sodium diclofenac and
per-benzoylated-β- cyclodextrin in DMSO-d6 at 298 K
3.3.2 Photophysical properties of the host-guest complex
UV-Vis spectroscopy was also used to investigate the complexation process. The study of the
complexation of per-benzoylated –ß-cyclodextrin and sodium diclofenac were carried out in 1-
octanol at 298 K. The selection of 1-octanol was based on the fact that this non-aqueous solvent is
representative of the cell membrane due to its low permeability. The titration experiment was carried
out by the addition of increasing concentrations of the receptor in 1-octanol to the UV cell containing
the solution of sodium diclofenac (5.029 × 10⁻⁵ M) in same solvent. The increase of the concentration
of the receptor in the cell solution containing sodium diclofenac caused an increase of the absorption
band intensity and changed the shape of the absorption band (Fig. 3.2). It can be seen from the plot
of absorbance against the wavelength λ (nm) that the absorption band (n π) of the carbonyl group
at λmax 292 nm was shifted to a shorter wavelength due to the solvent-drug interaction through the
formation of hydrogen bonding between n electrons and the solvent which can lead to decrease the

3. Results & Discussion
108
energy of the n state without any effect on π orbitals. This means that the energy required for the
transition increased and the wavelength will moved shorter while the intensity of the peaks increased
(hyperchromic effect) in spite of the decrease in the absorbance of the pharmaceutical which may
attributed to the effect of the receptor to lowering the aggregation and promote the dissociation of
NaDF to form the complex with the receptor235-237. The red shifting of π transition is attributed
to the conjucation process for systyms of the aromatic rings. These are indications that there is
possible interaction between the receptor and sodium diclofenac. Given that glucose is one of the
components of the β-cyclodextrin derivative, this compound was added to the drug solution. The
intensity of the peaks was not affected by this addition.
Fig. 3.2 UV-Vis spectrum for the titration of sodium diclofenac solution in 1-octanol (bottom scan
,5.029×10-5 mol dm-3) as a result from the addition of different concentrations (3.08×10⁻⁵, 4.6×10⁻⁵,
6.17×10⁻⁵, 7.7×10⁻⁵, 9.2×10⁻⁵ and 1.08×10⁻⁴ mol dm-3) of perbenzoylated β-cyclodextrin receptor,
Assuming that the complexation reaction between sodium diclofenac NaDF and the receptor L
occurred in 1: 1 stoichiometric ratio, thus the complexation can be expressed by equation eq.3.13
NaDF (1-oct) + BzBCD (1-oct) ⇌ NaDFBzBCD (1-oct) eq.3.13
In equation 3.13 [NaDF], [BzBCD] and [NaDFBzBCD] denote the molar concentration of sodium
diclofenac, the per-benzoylated-β- cyclodextrin receptor and the complex respectively. Therefore,
0
0.5
1
1.5
2
2.5
3
230 250 270 290 310 330 350
Ab
sorb
an
ce
Wavelength nm
NaDF scan
Increasing the receptor concentration
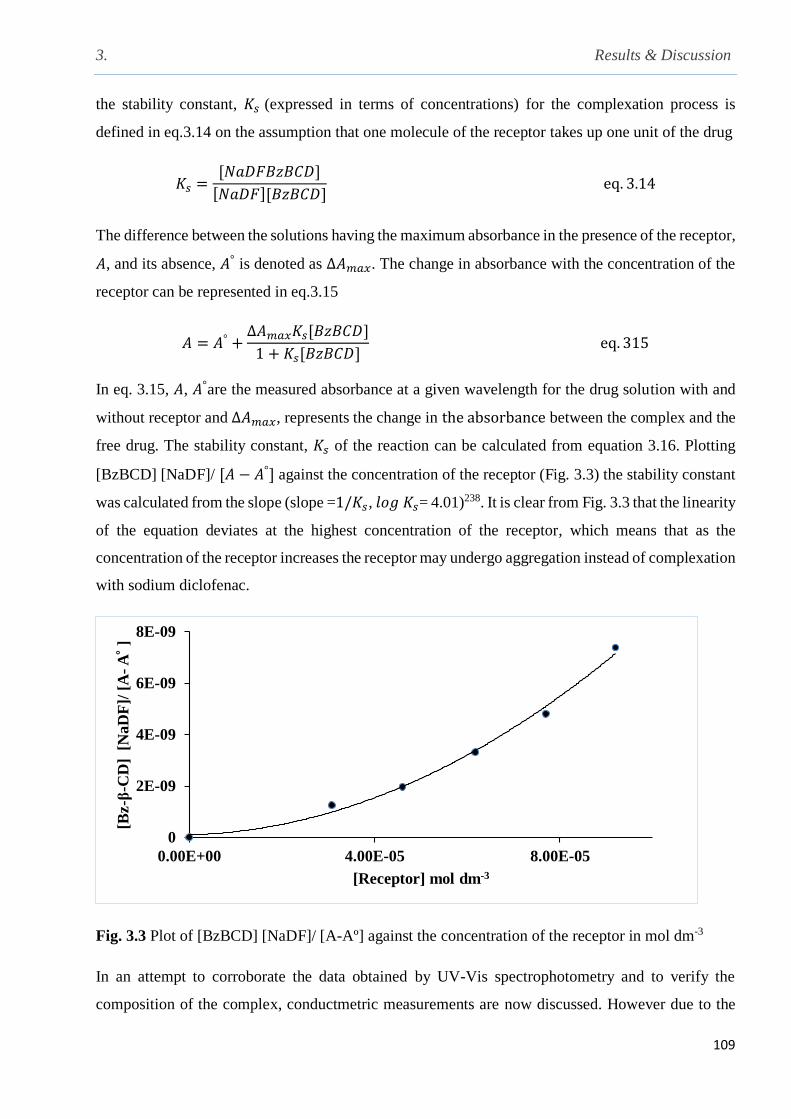
3. Results & Discussion
109
the stability constant, 𝐾𝑠 (expressed in terms of concentrations) for the complexation process is
defined in eq.3.14 on the assumption that one molecule of the receptor takes up one unit of the drug
𝐾𝑠 =[𝑁𝑎𝐷𝐹𝐵𝑧𝐵𝐶𝐷]
[𝑁𝑎𝐷𝐹][𝐵𝑧𝐵𝐶𝐷] eq. 3.14
The difference between the solutions having the maximum absorbance in the presence of the receptor,
𝐴, and its absence, 𝐴° is denoted as ∆𝐴𝑚𝑎𝑥. The change in absorbance with the concentration of the
receptor can be represented in eq.3.15
𝐴 = 𝐴° +∆𝐴𝑚𝑎𝑥𝐾𝑠[𝐵𝑧𝐵𝐶𝐷]
1 + 𝐾𝑠[𝐵𝑧𝐵𝐶𝐷] eq. 315
In eq. 3.15, 𝐴, 𝐴°are the measured absorbance at a given wavelength for the drug solution with and
without receptor and ∆𝐴𝑚𝑎𝑥, represents the change in the absorbance between the complex and the
free drug. The stability constant, 𝐾𝑠 of the reaction can be calculated from equation 3.16. Plotting
[BzBCD] [NaDF]/ [𝐴 − 𝐴°] against the concentration of the receptor (Fig. 3.3) the stability constant
was calculated from the slope (slope =1/𝐾𝑠, 𝑙𝑜𝑔 𝐾𝑠= 4.01)238. It is clear from Fig. 3.3 that the linearity
of the equation deviates at the highest concentration of the receptor, which means that as the
concentration of the receptor increases the receptor may undergo aggregation instead of complexation
with sodium diclofenac.
Fig. 3.3 Plot of [BzBCD] [NaDF]/ [A-Aº] against the concentration of the receptor in mol dm-3
In an attempt to corroborate the data obtained by UV-Vis spectrophotometry and to verify the
composition of the complex, conductmetric measurements are now discussed. However due to the
0
2E-09
4E-09
6E-09
8E-09
0.00E+00 4.00E-05 8.00E-05
[Bz-β
-CD
] [
NaD
F]/
[A
-A
]
[Receptor] mol dm-3
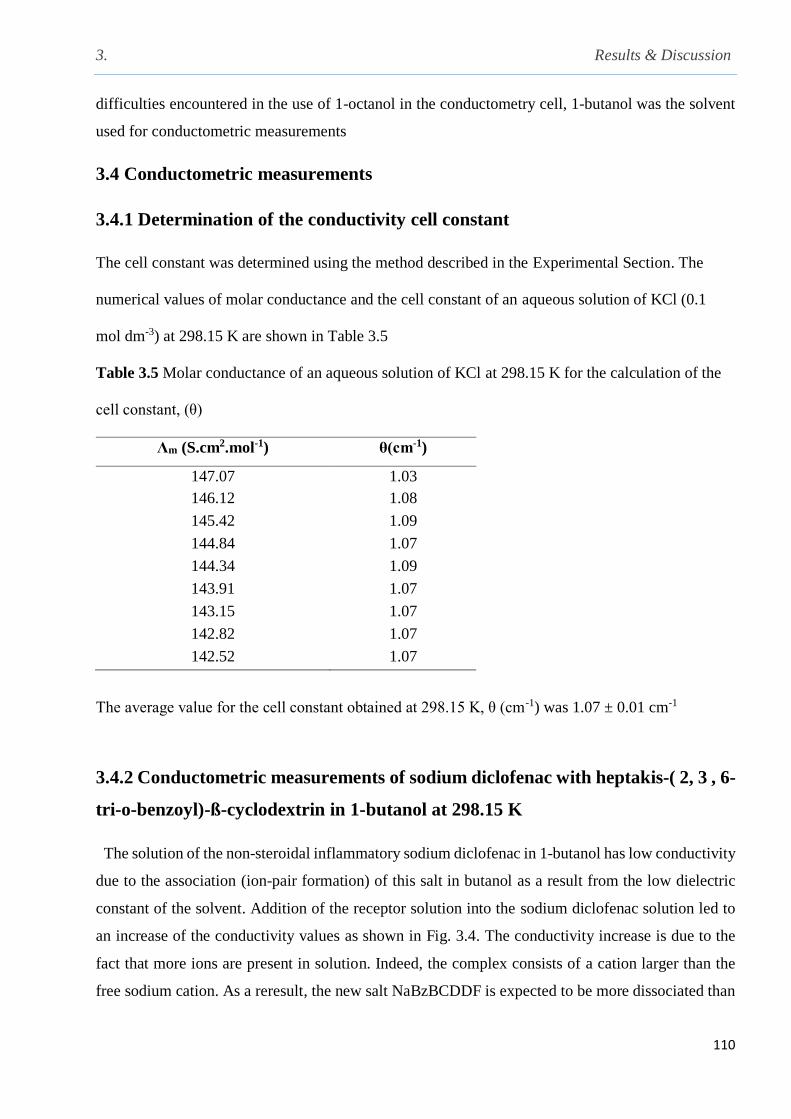
3. Results & Discussion
110
difficulties encountered in the use of 1-octanol in the conductometry cell, 1-butanol was the solvent
used for conductometric measurements
3.4 Conductometric measurements
3.4.1 Determination of the conductivity cell constant
The cell constant was determined using the method described in the Experimental Section. The
numerical values of molar conductance and the cell constant of an aqueous solution of KCl (0.1
mol dm-3) at 298.15 K are shown in Table 3.5
Table 3.5 Molar conductance of an aqueous solution of KCl at 298.15 K for the calculation of the
cell constant, (θ)
Λm (S.cm2.mol-1) θ(cm-1)
147.07 1.03
146.12 1.08
145.42 1.09
144.84 1.07
144.34 1.09
143.91 1.07
143.15 1.07
142.82 1.07
142.52 1.07
The average value for the cell constant obtained at 298.15 K, θ (cm-1) was 1.07 ± 0.01 cm-1
3.4.2 Conductometric measurements of sodium diclofenac with heptakis-( 2, 3 , 6-
tri-o-benzoyl)-ß-cyclodextrin in 1-butanol at 298.15 K
The solution of the non-steroidal inflammatory sodium diclofenac in 1-butanol has low conductivity
due to the association (ion-pair formation) of this salt in butanol as a result from the low dielectric
constant of the solvent. Addition of the receptor solution into the sodium diclofenac solution led to
an increase of the conductivity values as shown in Fig. 3.4. The conductivity increase is due to the
fact that more ions are present in solution. Indeed, the complex consists of a cation larger than the
free sodium cation. As a reresult, the new salt NaBzBCDDF is expected to be more dissociated than

3. Results & Discussion
111
NaDF. After the ligand/ drug concentration ratio reaches a value of 0.5, an excess of the receptor
shifts the equilibrium to the right leading to a further increase in conductance. In conclusion, a 2: 1
complex is the most probably formed between NaDF and heptakis-( 2, 3 , 6-tri-o-benzoyl)-ß-
cyclodextrin in this solvent.
Fig. 3.4 A plot of molar conductance of sodium diclofenac in 1-butanol against the [ligand]/ [drug]
concentration at 298.15 K, [NaDF] = 1.25×10⁻⁴ mol dm-3 (the experiment was carried out once).
3.5 Complexation studies of sodium diclofenac with heptakis-( 2, 3 , 6-tri-O-
benzoyl)-ß-cyclodextrin in 1-octanol using Nano-Isothermal titration calorimetry
(Nano-ITC)
Before proceeding with the determination of thermodynamic data of complexation, the ITC
calorimeter was calibrated and therefore in the following section, the calibration of the instrument is
discussed
3.5.1 Calibration of the Nano-Isothermal Titration calorimetrt (Nano-ITC)
A standard titration experiment between 18-Crown-6 and barium chloride in de-ionised water at
298.15 K was carried out to determine the reliability of the instrument. An aqueous solution of 18-
crown-6 ether (1×10⁻³ mol dm-3) was loaded in the reference cell and a solution of barium chloride in
de-ionised water (1.5 × 10⁻² mol dm-3) injected automatically to the sample cell. A typical baseline
7.00
9.00
11.00
0.00 0.50 1.00 1.50 2.00
m
s cm
2m
ol-1
[BZBCD]/ ][NADF] mol dm-3
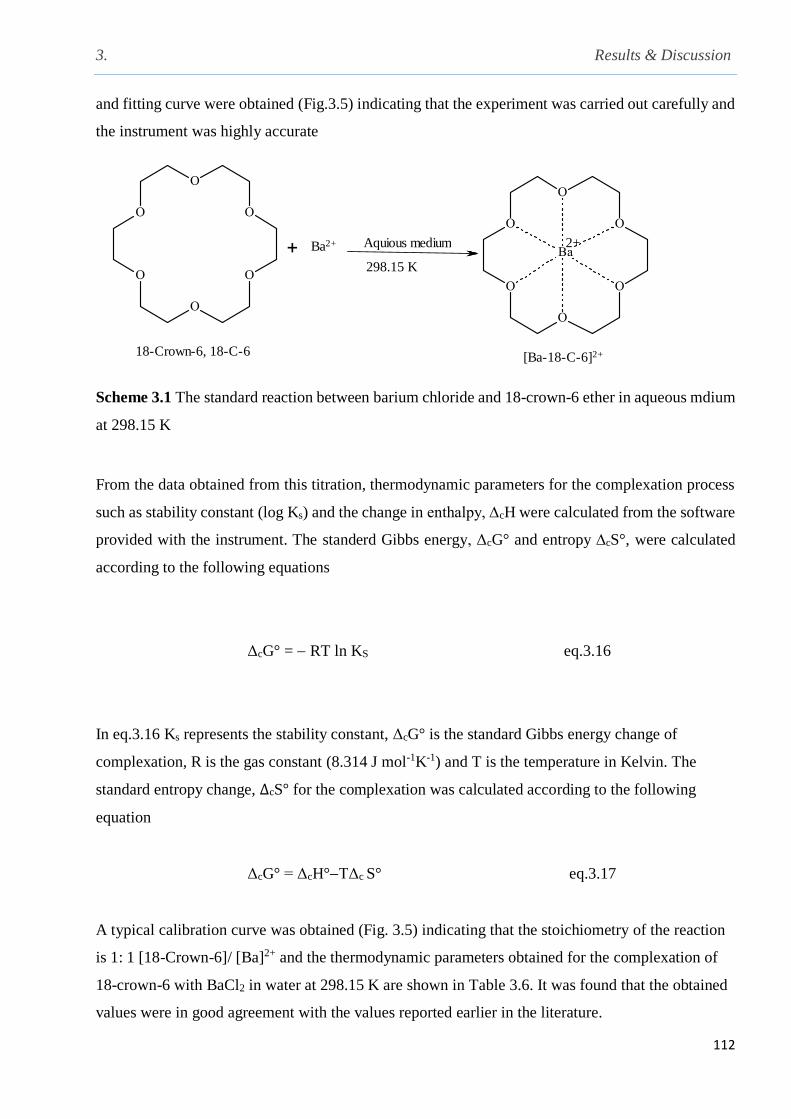
3. Results & Discussion
112
and fitting curve were obtained (Fig.3.5) indicating that the experiment was carried out carefully and
the instrument was highly accurate
Ba2+
[Ba-18-C-6]2+
2+
298.15 K
18-Crown-6, 18-C-6
Aquious medium
Scheme 3.1 The standard reaction between barium chloride and 18-crown-6 ether in aqueous mdium
at 298.15 K
From the data obtained from this titration, thermodynamic parameters for the complexation process
such as stability constant (log Ks) and the change in enthalpy, ∆cH were calculated from the software
provided with the instrument. The standerd Gibbs energy, ΔcG° and entropy ∆cS°, were calculated
according to the following equations
ΔcG° = RT ln KS eq.3.16
In eq.3.16 Ks represents the stability constant, ΔcG° is the standard Gibbs energy change of
complexation, R is the gas constant (8.314 J mol-1K-1) and T is the temperature in Kelvin. The
standard entropy change, ΔcS° for the complexation was calculated according to the following
equation
ΔcG° = ΔcH°TΔc S° eq.3.17
A typical calibration curve was obtained (Fig. 3.5) indicating that the stoichiometry of the reaction
is 1: 1 [18-Crown-6]/ [Ba]2+ and the thermodynamic parameters obtained for the complexation of
18-crown-6 with BaCl2 in water at 298.15 K are shown in Table 3.6. It was found that the obtained
values were in good agreement with the values reported earlier in the literature.

3. Results & Discussion
113
Table 3.6 Thermodynamic parameters of complexation of barium with 18-crown-6 measured by
ITC in aqueous medium at 298.15 K.
Log Ks
∆cG◦/ kJ mol-1 ∆cH
◦/ kJ mol-1 ∆cS◦/ J K mol-1 Reference
3.60 ± 0.06
- 20.8 ± 0.3
- 29 ± 2
- 27
This work
3.45 – 3.87
- 21.9
- 29 33
- 33
Ref. 219

3. Results & Discussion
114
Fig. 3.5 Isothermal titration calorimetry for the complexation of 18-crown-6 (1× 10⁻³ mol dm-3)
with BaCl2 (1.5 × 10⁻² mol dm-3). The curve shows the change in enthalpy after each injection as a
result of complexation.
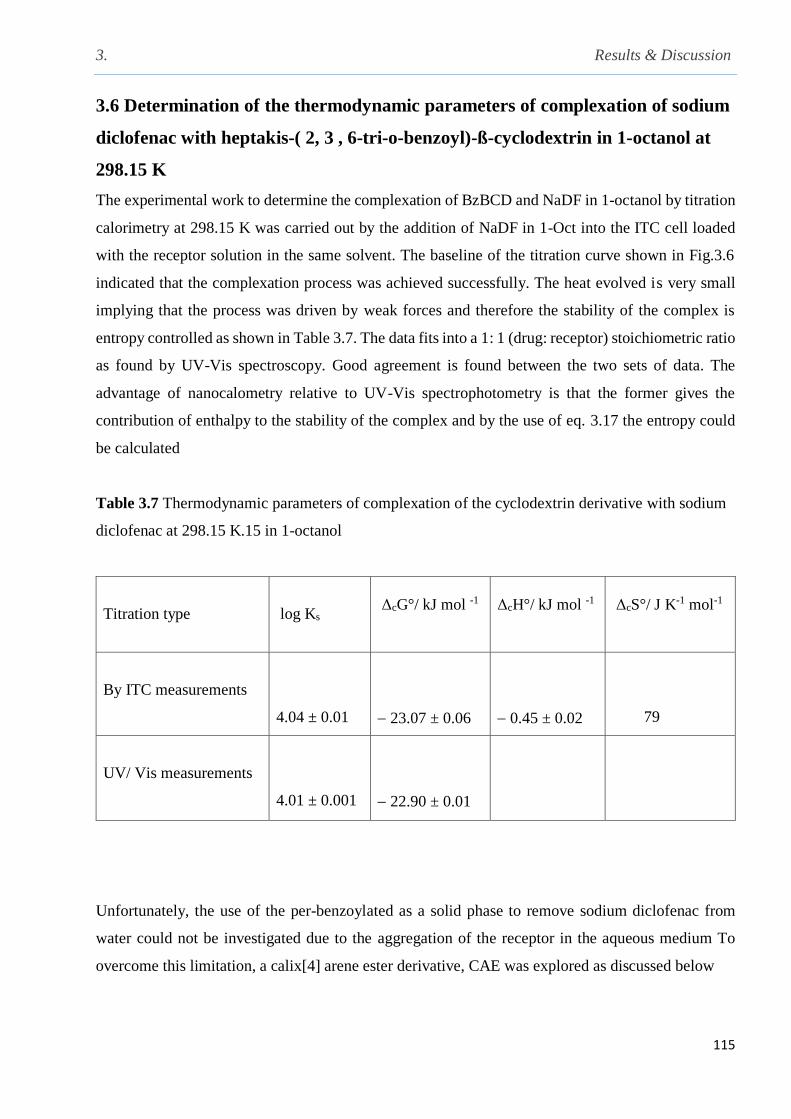
3. Results & Discussion
115
3.6 Determination of the thermodynamic parameters of complexation of sodium
diclofenac with heptakis-( 2, 3 , 6-tri-o-benzoyl)-ß-cyclodextrin in 1-octanol at
298.15 K
The experimental work to determine the complexation of BzBCD and NaDF in 1-octanol by titration
calorimetry at 298.15 K was carried out by the addition of NaDF in 1-Oct into the ITC cell loaded
with the receptor solution in the same solvent. The baseline of the titration curve shown in Fig.3.6
indicated that the complexation process was achieved successfully. The heat evolved is very small
implying that the process was driven by weak forces and therefore the stability of the complex is
entropy controlled as shown in Table 3.7. The data fits into a 1: 1 (drug: receptor) stoichiometric ratio
as found by UV-Vis spectroscopy. Good agreement is found between the two sets of data. The
advantage of nanocalometry relative to UV-Vis spectrophotometry is that the former gives the
contribution of enthalpy to the stability of the complex and by the use of eq. 3.17 the entropy could
be calculated
Table 3.7 Thermodynamic parameters of complexation of the cyclodextrin derivative with sodium
diclofenac at 298.15 K.15 in 1-octanol
Titration type
log Ks
ΔcG°/ kJ mol -1
ΔcH°/ kJ mol -1
ΔcS°/ J K-1 mol-1
By ITC measurements
4.04 ± 0.01
23.07 ± 0.06
0.45 ± 0.02
79
UV/ Vis measurements
4.01 ± 0.001
22.90 ± 0.01
Unfortunately, the use of the per-benzoylated as a solid phase to remove sodium diclofenac from
water could not be investigated due to the aggregation of the receptor in the aqueous medium To
overcome this limitation, a calix[4] arene ester derivative, CAE was explored as discussed below

3. Results & Discussion
116
Fig. 3.6 Isothermal titration calorimetry for the complexation of sodium diclofenac [Guest] and
perbenzoylated-- cyclodextrin in 1-octanol at 298.15 K. Top: the heat evolved after each addition
of sodium diclofenac to the receptor sloution and bottom plotted against the molar ratio.
[NaDF] = 1×10⁻³ mol dm-3
Are
a dat
a
J
Molar ratio [Sodium diclofenac]/ [receptor]
[NaDF]/[receptor]
3. Results & Discussion
117
3.7 Complexation studies of sodium diclofenac and 5, 11, 17, 27- tert-butyl-25, 26,
27, 28-(oxy-ethylethanoate)calix[4]arene (CAE)
3.7.1 1H NMR complexation studies
The esterification of p-tert-butyl calix[4]arene has been carried out in one step and the compound
was obtained in a high degree of purity which is very important for complexation studies. The
modified procedure used here differs from those previously reported. In the procedures used earlier
the authors239 introduced ethyl bromoacetate in several portions in order to give time for the activation
of the phenolic hydroxyl group. Other workers did not give a detailed account of the procedure114
and used a base like sodium bicarbonate which appears to be time consuming (5 days)212. It was
concluded in the literature that there is a probability that the ester group could be reduced to alcohol
in the presence of a base, but the anhydrous solvent used prevents the reduction to alcohol which
means that the use of the hydrated solvent can facilitate the reduction to alcohol due to the protonation
of the carbonyl groups which can deviate the reaction towards the alcohol product. Also controlling
the pH of the reaction (pH = 7) was a suitable way to direct the reaction to produce the targeted
receptor. The 1H NMR spectrum confirmed the structure of the compound in addition to the
microanalysis (see Experimental Part). The obtained receptor adopts a distorted cone conformation
as it is clear from the difference in the chemical shift value ∆ =1.47 ppm between the axial and
equatorial protons117. Initially, the complexation studies were carried out using 1H NMR studies in
deuterated acetonitrile. The spectrum for the complex (Fig.3.7) showed that the receptor complexed
with the drug and significant changes in the chemical shift for the axial and equatorial protons of the
methylene bridge protons of the receptor were observed (Table 3.8). The low solubility of the sodium
diclofenac in acetonitrile retarded the progress with the titration experiment as to determine the
thermodynamic parameters associated with this process by isothermal titration calorimetry. Another
complexation study has been carried out to investigate the complexation process using DMSO-d6 as
a dipolar aprotic solvent but the spectrum obtained shows that the receptor interacted strongly with
this solvent and this interaction prevent the 1H NMR titration experiment. However, the binding
affinity of the receptor to complex with the sodium cation (picrate or perchlorate counter ion) have
been reported with details by McKervey et al 113and Danil de Namor et al 240and have demonstrated
that the cation was nested perfectly in the lower rim polar semi-cavity with the cooperation of the
acetonitrile solvent occupying the hydrophobic cavity of the receptor. Here the affinity of the solid
receptor to complex with the sodium cation was exploited for the removal of the sodium diclofenac

3. Results & Discussion
118
from water after proceeding with the fundamental studies to determine the composition of the
complex. In doing so conductance measurements were carried out prior to these measurements.
Table 3.8 Chemical shift changes for the receptor protons as a result from the addition of sodium
diclofenac in CD3CN at 298 K
Proton Ar-H C-HAxial OCH2CO O-CH2CH3 HEquatorial O-CH2-CH3 C-CH3
6.77
4.85
4.8
4.2
3.38
3.28
1.05
0.0
Vanished
-0.05
0.1
0.04
0
0
Fig. 3.7 1H NMR spectra for the complexation of p-tert-butylcalix[4]arene tetraeseter (3×10⁻² mol
dm-3) with sodium diclofenac in CD3CN at 298 K. The lower spectrum for the free receptor and the
upper for the complex with sodium diclofenac (1×10⁻³ mol dm-3)
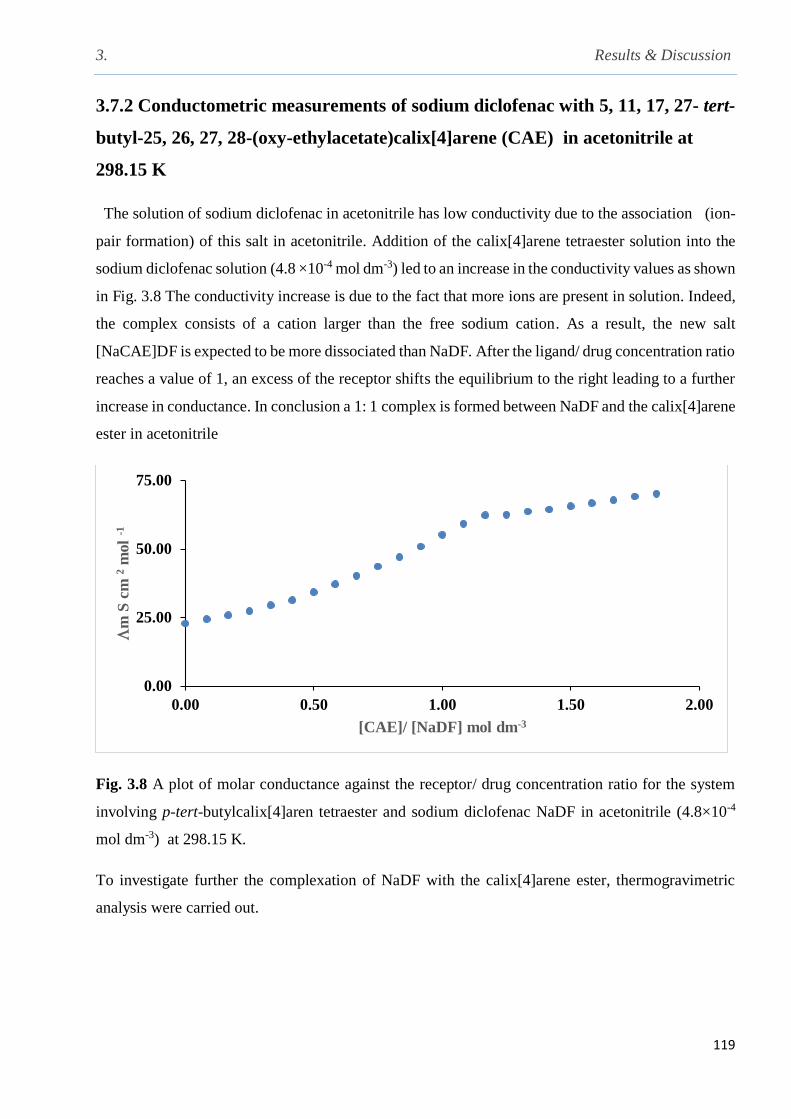
3. Results & Discussion
119
3.7.2 Conductometric measurements of sodium diclofenac with 5, 11, 17, 27- tert-
butyl-25, 26, 27, 28-(oxy-ethylacetate)calix[4]arene (CAE) in acetonitrile at
298.15 K
The solution of sodium diclofenac in acetonitrile has low conductivity due to the association (ion-
pair formation) of this salt in acetonitrile. Addition of the calix[4]arene tetraester solution into the
sodium diclofenac solution (4.8 ×10⁻⁴ mol dm-3) led to an increase in the conductivity values as shown
in Fig. 3.8 The conductivity increase is due to the fact that more ions are present in solution. Indeed,
the complex consists of a cation larger than the free sodium cation. As a result, the new salt
[NaCAE]DF is expected to be more dissociated than NaDF. After the ligand/ drug concentration ratio
reaches a value of 1, an excess of the receptor shifts the equilibrium to the right leading to a further
increase in conductance. In conclusion a 1: 1 complex is formed between NaDF and the calix[4]arene
ester in acetonitrile
Fig. 3.8 A plot of molar conductance against the receptor/ drug concentration ratio for the system
involving p-tert-butylcalix[4]aren tetraester and sodium diclofenac NaDF in acetonitrile (4.8×10⁻⁴
mol dm-3) at 298.15 K.
To investigate further the complexation of NaDF with the calix[4]arene ester, thermogravimetric
analysis were carried out.
0.00
25.00
50.00
75.00
0.00 0.50 1.00 1.50 2.00
m
S c
m 2
mol
-1
[CAE]/ [NaDF] mol dm-3
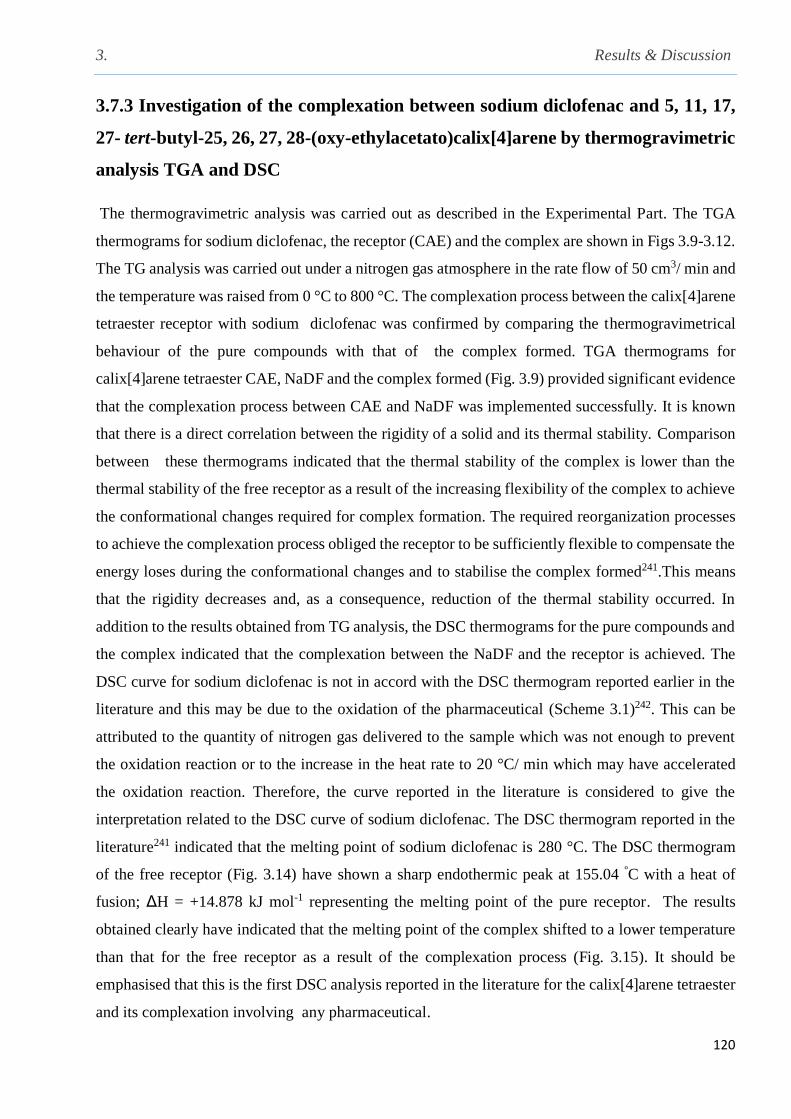
3. Results & Discussion
120
3.7.3 Investigation of the complexation between sodium diclofenac and 5, 11, 17,
27- tert-butyl-25, 26, 27, 28-(oxy-ethylacetato)calix[4]arene by thermogravimetric
analysis TGA and DSC
The thermogravimetric analysis was carried out as described in the Experimental Part. The TGA
thermograms for sodium diclofenac, the receptor (CAE) and the complex are shown in Figs 3.9-3.12.
The TG analysis was carried out under a nitrogen gas atmosphere in the rate flow of 50 cm3/ min and
the temperature was raised from 0 °C to 800 °C. The complexation process between the calix[4]arene
tetraester receptor with sodium diclofenac was confirmed by comparing the thermogravimetrical
behaviour of the pure compounds with that of the complex formed. TGA thermograms for
calix[4]arene tetraester CAE, NaDF and the complex formed (Fig. 3.9) provided significant evidence
that the complexation process between CAE and NaDF was implemented successfully. It is known
that there is a direct correlation between the rigidity of a solid and its thermal stability. Comparison
between these thermograms indicated that the thermal stability of the complex is lower than the
thermal stability of the free receptor as a result of the increasing flexibility of the complex to achieve
the conformational changes required for complex formation. The required reorganization processes
to achieve the complexation process obliged the receptor to be sufficiently flexible to compensate the
energy loses during the conformational changes and to stabilise the complex formed241.This means
that the rigidity decreases and, as a consequence, reduction of the thermal stability occurred. In
addition to the results obtained from TG analysis, the DSC thermograms for the pure compounds and
the complex indicated that the complexation between the NaDF and the receptor is achieved. The
DSC curve for sodium diclofenac is not in accord with the DSC thermogram reported earlier in the
literature and this may be due to the oxidation of the pharmaceutical (Scheme 3.1)242. This can be
attributed to the quantity of nitrogen gas delivered to the sample which was not enough to prevent
the oxidation reaction or to the increase in the heat rate to 20 °C/ min which may have accelerated
the oxidation reaction. Therefore, the curve reported in the literature is considered to give the
interpretation related to the DSC curve of sodium diclofenac. The DSC thermogram reported in the
literature241 indicated that the melting point of sodium diclofenac is 280 °C. The DSC thermogram
of the free receptor (Fig. 3.14) have shown a sharp endothermic peak at 155.04 ºC with a heat of
fusion; ΔH = +14.878 kJ mol-1 representing the melting point of the pure receptor. The results
obtained clearly have indicated that the melting point of the complex shifted to a lower temperature
than that for the free receptor as a result of the complexation process (Fig. 3.15). It should be
emphasised that this is the first DSC analysis reported in the literature for the calix[4]arene tetraester
and its complexation involving any pharmaceutical.
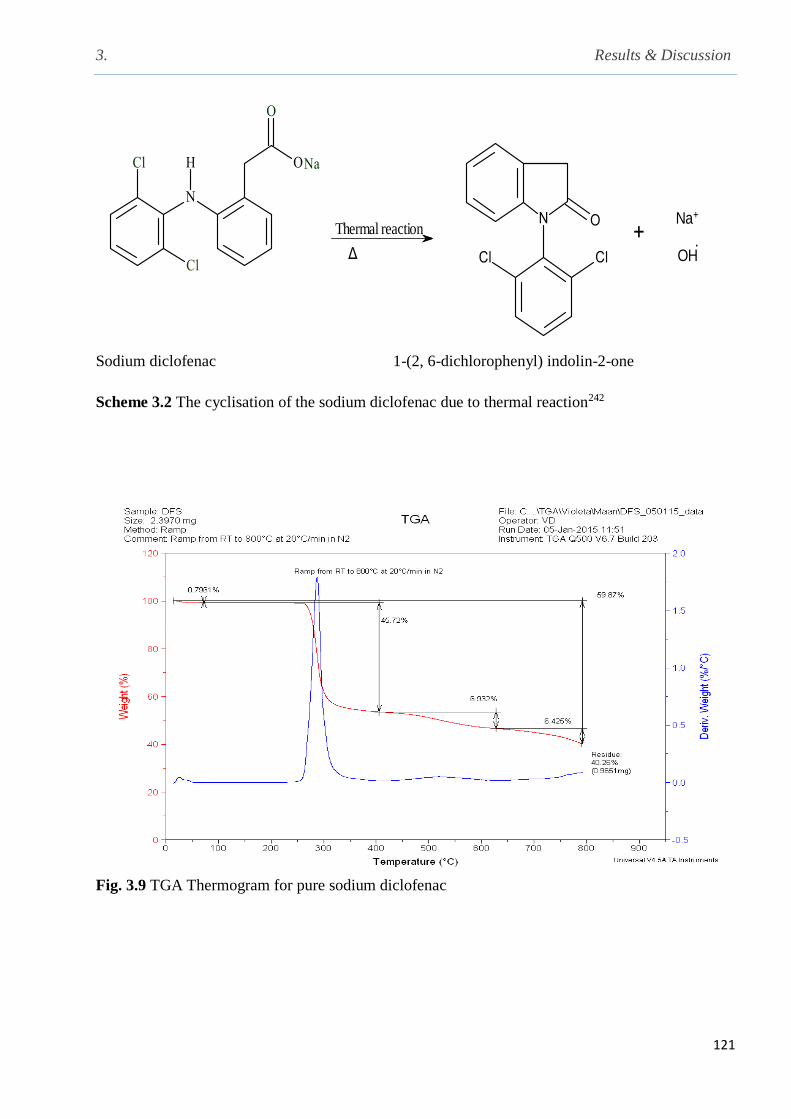
3. Results & Discussion
121
Thermal reaction
Δ
Na+
OH.
Sodium diclofenac 1-(2, 6-dichlorophenyl) indolin-2-one
Scheme 3.2 The cyclisation of the sodium diclofenac due to thermal reaction242
Fig. 3.9 TGA Thermogram for pure sodium diclofenac
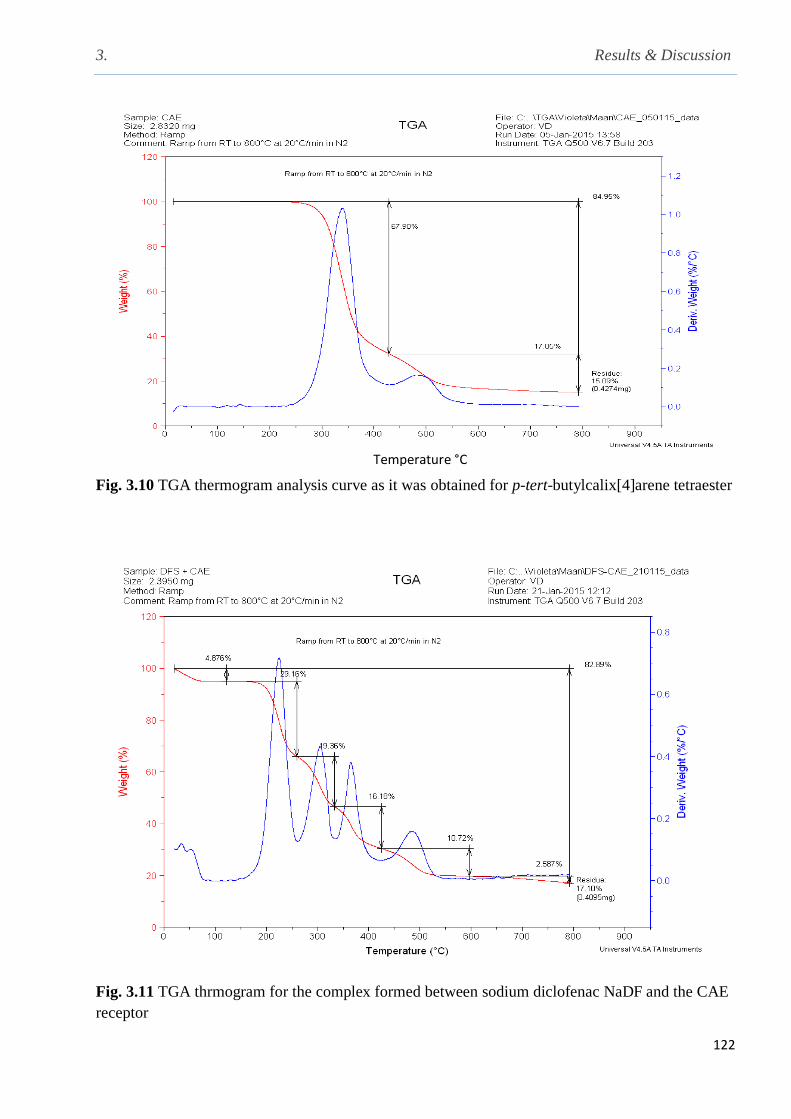
3. Results & Discussion
122
Fig. 3.10 TGA thermogram analysis curve as it was obtained for p-tert-butylcalix[4]arene tetraester
Fig. 3.11 TGA thrmogram for the complex formed between sodium diclofenac NaDF and the CAE
receptor
Temperature °C

3. Results & Discussion
123
Fig. 3.12 TGA curves for the sodium diclofenac NaDF, calix[4]arene tetraester (CAE) and the
complex formed.
Fig. 3.13 DSC thermogram of the sodium diclofenac
0
1
2
3
0 280 560
Weig
ht
%
T °C
Complex
NaDF

3. Results & Discussion
124
Fig. 3.14 DSC thermogram for the CAE receptor
Fig. 3.15 DSC analysis for the complex formed between sodium diclofenac and calix[4]arene
tetraester.
Having obtained some information regarding the complexation process in solution (conductance
measurements) and in the solid state (thermal analysis) the ability of calix[4]arene tetraester to
remove the drug from water was investigated.

3. Results & Discussion
125
3.8 Removal of sodium diclofenac from water by using calix[4]arene tetraester
from water.
Extraction experiments were carried out under several experimental conditions as shown below
3.8.1 Determination of the optimum amount of calix[4]arene tetraester for the
uptake of sodium diclofenac from aqueous solution at 298 K
In order to determine the optimum mass of the calix[4]arene tetraester for the removal of sodium
diclofenac from water , batch experiments were carried out . Different weights of the calix[4]arene
tetraester was added to a fixed concentration of aqueous solution of sodium diclofenac (2×10⁻⁴ mol
dm-3, 10 ml). The mixtures were mixed for 10 minutes on a whirlimixer, sealed and left in a water
bath at 298 K. The mixtures were filtered and the concentration of the drug at equilibrium was
determined using a UV-Vis spectrophotometer at λmax = 272 nm. Table 3.9 indicates that the
percentage of NaDF removed from aqueous solution by the receptor increases with increasing the
mass of the material, and then the material reaches saturation as shown in Fig. 3.16.
This is expected as the weight of the receptor increases, the amount of sites available for interaction
with the sodium cation increases
Table 3.9 Effect of the amount of calix[4]arene tetraester on the extraction of sodium diclofenac from
aqueous solution (10 ml) at 298 K
[conc.]initial
mol dm-3 (10 ml)
Receptor added
(solid in mole)
[Conc]equilibrium
mol dm-3
[Conc.]removed
mol dm-3
% E
2⨯10 -4
1.01⨯10 -5 7.93⨯10 -5 1.21⨯10 -4 60.35
2⨯10 -4
2.01⨯10 -5 7.63⨯10 -5 1.24⨯10 -4 61.85
2⨯10 -4
3.02⨯10 -5 7.03⨯10 -5 1.30⨯10 -4 64.85
2⨯10 -4
4.03⨯10 -5 7.03⨯10 -5 1.30⨯10 -4 64.85
2⨯10 -4
5.03⨯10 -5 7.1⨯10 -5 1.29⨯10 -4 64.50
2⨯10 -4
6.04⨯10 -5 7.1⨯10 -5 1.29⨯10 -4 64.50
The % E was calculated using the eq.2.39 and the concentration of the NaDF at equilibrium was
calculated using UV-vis measurements (see Fig. 1-A Appendix)
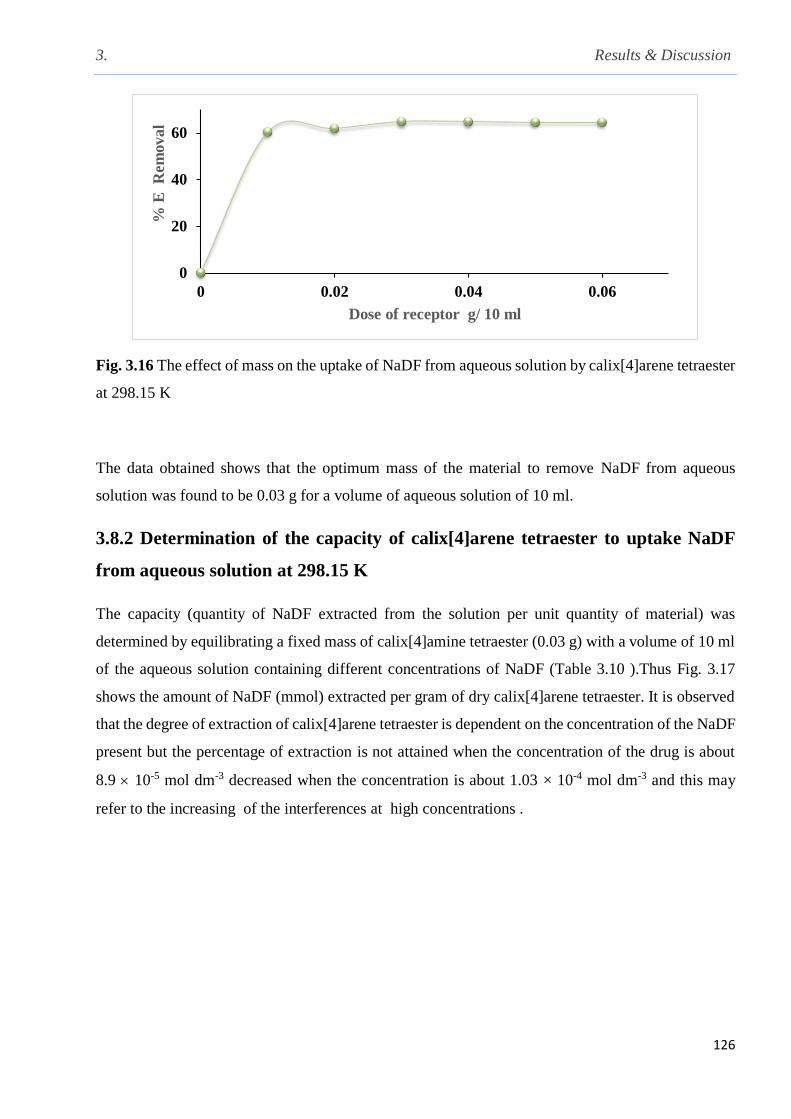
3. Results & Discussion
126
Fig. 3.16 The effect of mass on the uptake of NaDF from aqueous solution by calix[4]arene tetraester
at 298.15 K
The data obtained shows that the optimum mass of the material to remove NaDF from aqueous
solution was found to be 0.03 g for a volume of aqueous solution of 10 ml.
3.8.2 Determination of the capacity of calix[4]arene tetraester to uptake NaDF
from aqueous solution at 298.15 K
The capacity (quantity of NaDF extracted from the solution per unit quantity of material) was
determined by equilibrating a fixed mass of calix[4]amine tetraester (0.03 g) with a volume of 10 ml
of the aqueous solution containing different concentrations of NaDF (Table 3.10 ).Thus Fig. 3.17
shows the amount of NaDF (mmol) extracted per gram of dry calix[4]arene tetraester. It is observed
that the degree of extraction of calix[4]arene tetraester is dependent on the concentration of the NaDF
present but the percentage of extraction is not attained when the concentration of the drug is about
8.9 10-5 mol dm-3 decreased when the concentration is about 1.03 × 10⁻⁴ mol dm-3 and this may
refer to the increasing of the interferences at high concentrations .
0
20
40
60
0 0.02 0.04 0.06
% E
R
em
oval
Dose of receptor g/ 10 ml
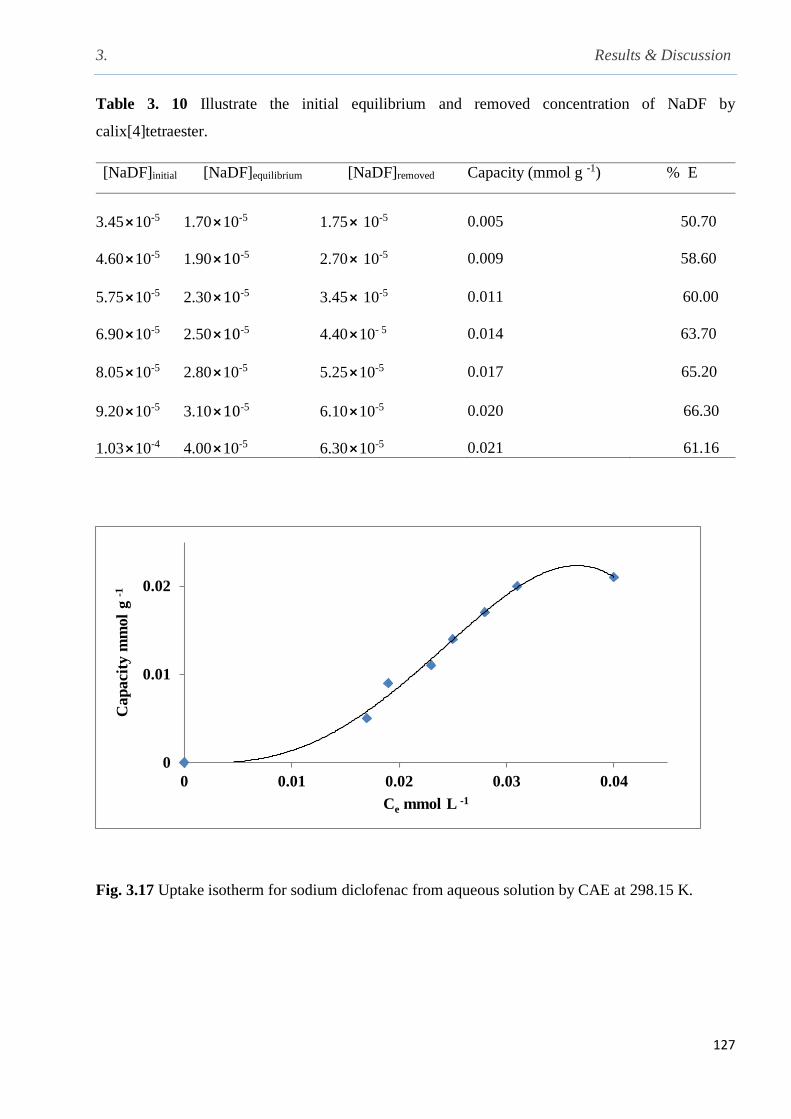
3. Results & Discussion
127
Table 3. 10 Illustrate the initial equilibrium and removed concentration of NaDF by
calix[4]tetraester.
[NaDF]initial [NaDF]equilibrium [NaDF]removed Capacity (mmol g -1) % E
3.45⨯10-5
1.70⨯10-5
1.75⨯ 10-5
0.005
50.70
4.60⨯10-5
1.90⨯10-5
2.70⨯ 10-5
0.009
58.60
5.75⨯10-5
2.30⨯10-5
3.45⨯ 10-5
0.011
60.00
6.90⨯10-5
2.50⨯10-5
4.40⨯10- 5
0.014
63.70
8.05⨯10-5
2.80⨯10-5
5.25⨯10-5
0.017
65.20
9.20⨯10-5
3.10⨯10-5
6.10⨯10-5
0.020
66.30
1.03⨯10-4
4.00⨯10-5
6.30⨯10-5
0.021
61.16
Fig. 3.17 Uptake isotherm for sodium diclofenac from aqueous solution by CAE at 298.15 K.
0
0.01
0.02
0 0.01 0.02 0.03 0.04
Cap
acit
y m
mol
g -1
Ce mmol L -1
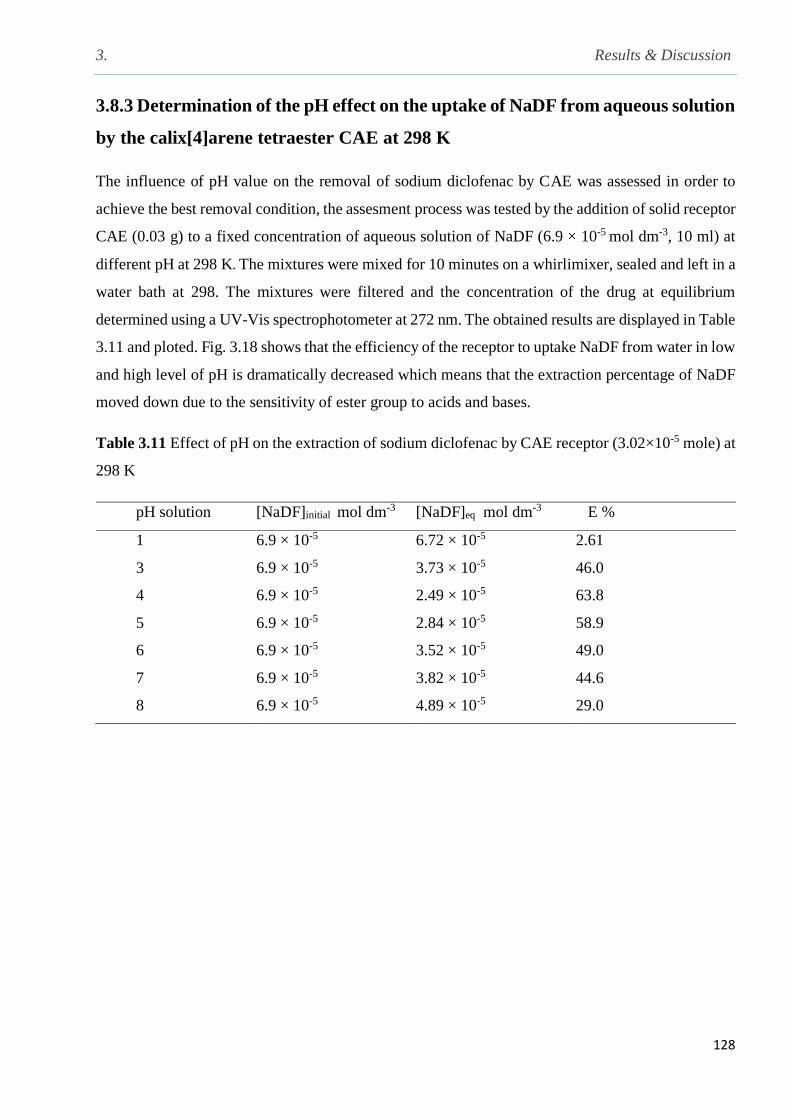
3. Results & Discussion
128
3.8.3 Determination of the pH effect on the uptake of NaDF from aqueous solution
by the calix[4]arene tetraester CAE at 298 K
The influence of pH value on the removal of sodium diclofenac by CAE was assessed in order to
achieve the best removal condition, the assesment process was tested by the addition of solid receptor
CAE (0.03 g) to a fixed concentration of aqueous solution of NaDF (6.9 × 10⁻⁵ mol dm-3, 10 ml) at
different pH at 298 K. The mixtures were mixed for 10 minutes on a whirlimixer, sealed and left in a
water bath at 298. The mixtures were filtered and the concentration of the drug at equilibrium
determined using a UV-Vis spectrophotometer at 272 nm. The obtained results are displayed in Table
3.11 and ploted. Fig. 3.18 shows that the efficiency of the receptor to uptake NaDF from water in low
and high level of pH is dramatically decreased which means that the extraction percentage of NaDF
moved down due to the sensitivity of ester group to acids and bases.
Table 3.11 Effect of pH on the extraction of sodium diclofenac by CAE receptor (3.02×10⁻⁵ mole) at
298 K
pH solution [NaDF]initial mol dm-3 [NaDF]eq mol dm-3 E %
1 6.9 × 10⁻⁵ 6.72 × 10⁻⁵ 2.61
3 6.9 × 10⁻⁵ 3.73 × 10⁻⁵ 46.0
4 6.9 × 10⁻⁵ 2.49 × 10⁻⁵ 63.8
5 6.9 × 10⁻⁵ 2.84 × 10⁻⁵ 58.9
6 6.9 × 10⁻⁵ 3.52 × 10⁻⁵ 49.0
7 6.9 × 10⁻⁵ 3.82 × 10⁻⁵ 44.6
8 6.9 × 10⁻⁵ 4.89 × 10⁻⁵ 29.0

3. Results & Discussion
129
Fig. 3.18 The effect of pH on the on the sodium diclofenac uptake (6.9×10⁻⁵ mol dm-3, 10 ml) by 5,
11, 17, 27- tert-butyl-25, 26, 27, 28-(oxy-ethylacetato)calix[4]arene (CAE, 3.02×10⁻⁵ mole)
The results obtained for the removal of NaDF from water by the calix[4]aren ester were encouraging.
It was thought that it was of interest to explore the complxing ability of a calix[4]arene amine based
receptor containing amino functional groups for currently used
3.9 Complexation studies of CA-(NH2)2 and pharmaceuticals
3.9.1 1H NMR complexation studies of diclofenac, clofibric acid, aspirin and
ibuprofen with the 5, 11, 17, 23-tetra-tert-butyl, 25, 27-bis[aminoethoxy]26, 28 -
dihydroxycalix[4]arene [(CA(NH2)2] receptor in CD3CN at 298 K
The chemical structure for the receptor and the pharmaceuticals are shown in the Fig.3.19
0
20
40
60
0 2 4 6 8 10
E %
pH

3. Results & Discussion
130
1
2 3 4 5
H2
6
7
1 2
3 4
5
89
Fig. 3.19 Chemical structures of (1) receptor (CA-(NH2)2, (2) diclofenac, (3) clofibric acid (4) aspirin
and (5) ibuprofen
As described in the Experimental Section, 1H NMR titration experiments were carried out to
investigate the active sites of complexation of the receptor with the pharmaceuticals and to obtain
information regarding the stoichiometry of the complexation. As far as the 1H NMR measurements
are concerned, the results in CD3CN at 298 K are listed in Table 3.12 which shows the chemical
shifts of the free receptor, δ, and the chemical shift changes, Δδ, for the receptor upon the addition
of the pharmaceutical. These were calculated from eq.3.17
Δδ(ppm)= δ (complex) – δ (free) eq.3.17
3. Results & Discussion
131
In eq.3.17, Δδ is the chemical shift observed, δ (complex) is the chemical shift for the complex
resulting from the addition of the targeted drug, δ (free) is the chemical shift for the free receptor.
As far as the free receptor is concerned quite clearly the calix[4]arene amino derivative adopts a
quasi perfect ‘cone’ conformation in solution as reflected in the difference observed in the chemical
shifts of the axial and equatorial protons (Δδax-eq = 1.03 ppm)110,117. This conformation is due to the
presence of hydrogen bond formation between the phenolic hydrogens and the ethereal oxygens of
the pendant arms of the receptor. This was previously demonstrated by Danil de Namor and co-
workers185 for an homologous receptor, namely 5,11,17,23-tetrakis-
[(diethylamine)ethoxy)]calix[4]arene [CA(Et2)2] in the solid state (X-ray diffraction studies) and in
solution. In fact the Δδax-eq = 1.02 ppm in CD3CN for this homologous receptor is practically the
same as that for CA(NH2)2. Furthermore acetonitrile was found in the hydrophobic cavity of the
receptor. Also the X-ray structure of 5,11,17,23-tetrakis-[(diethylamine)ethoxy)]calix[4]arene
showed acetonitrile in the hydrophobic cavity of the receptor. Previous studies by Danil de
Namor185,240 in this solvent demonstrated that this process is also observed in solution. In fact this is
also the case for the receptor involved in this work as assessed from the chemical shift changes
observed for the aromatic protons of this receptor in moving from CDCl3 to CD3CN where downfield
chemical shifts of 0.21 and 0.19 ppm are observed. Further conformational changes are also observed
in the bridging methylene protons during the complexation or protonation process The equatorial
protons become less shielded relative to the free receptor particularly for clofibric acid and dicofenac
( -0.21 ppm) while for aspirin this effect is less pronounced (-0.11 ppm) while the equatorial protons
are slightly deshielded relative to the uncomplexed receptor. Hardly any changes for the equatorial
and axial protons are found for ibuprofen and this may attributed to the presence of the isobutyl group
in the chemical structure of this drug which may reduce the possibility of ibuprofen to interact with
the receptor in addition to the ion-pair formation for the drug in acetonitrile. A direct consequence
of that, is a decrease in the shift difference between each pair of doublets of the ArCH2Ar system,
from the free to the complex ligands ( from 1.03 to 0.76 ppm for aspirin and to 0.66 ppm for clofibric
acid and diclofenac) , Significant downfield chemical shift changes are observed for H-7, H-8 and
the NH proton as a result of an interaction between the amino group of the receptor and the proton
of the carboxylic functional group of the drug.The most significant chemical shift changes are found
for the NH proton. In an attempt to explain the differences observed in the Δδ values for the NH
proton for these pharmaceuticals (Table 3.13-Appendix) the pKa values in water are considered199
(pKa, values are 3.0, 3.5, 4.16, 4.38 for clofibric acid, aspirin, diclofenac and ibuprofen respectively)
due to the unavailability of these data in acetonitrile. Although the absolute pKa values of these in
the latter solvent are expected to differ significantly from those in water due to the medium effect,
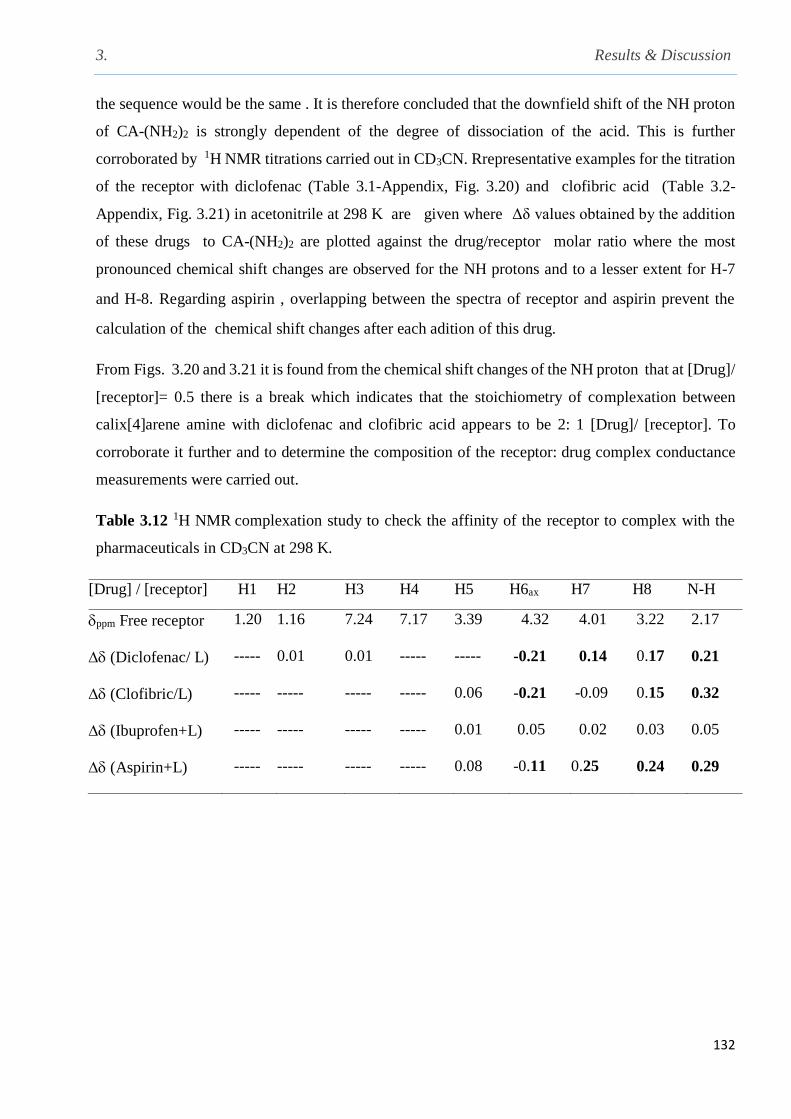
3. Results & Discussion
132
the sequence would be the same . It is therefore concluded that the downfield shift of the NH proton
of CA-(NH2)2 is strongly dependent of the degree of dissociation of the acid. This is further
corroborated by 1H NMR titrations carried out in CD3CN. Rrepresentative examples for the titration
of the receptor with diclofenac (Table 3.1-Appendix, Fig. 3.20) and clofibric acid (Table 3.2-
Appendix, Fig. 3.21) in acetonitrile at 298 K are given where Δδ values obtained by the addition
of these drugs to CA-(NH2)2 are plotted against the drug/receptor molar ratio where the most
pronounced chemical shift changes are observed for the NH protons and to a lesser extent for H-7
and H-8. Regarding aspirin , overlapping between the spectra of receptor and aspirin prevent the
calculation of the chemical shift changes after each adition of this drug.
From Figs. 3.20 and 3.21 it is found from the chemical shift changes of the NH proton that at [Drug]/
[receptor]= 0.5 there is a break which indicates that the stoichiometry of complexation between
calix[4]arene amine with diclofenac and clofibric acid appears to be 2: 1 [Drug]/ [receptor]. To
corroborate it further and to determine the composition of the receptor: drug complex conductance
measurements were carried out.
Table 3.12 1H NMR complexation study to check the affinity of the receptor to complex with the
pharmaceuticals in CD3CN at 298 K.
[Drug] / [receptor] H1 H2 H3 H4 H5 H6ax H7 H8 N-H
ppm Free receptor 1.20 1.16 7.24 7.17 3.39 4.32 4.01 3.22 2.17
(Diclofenac/ L) ----- 0.01 0.01 ----- ----- -0.21 0.14 0.17 0.21
(Clofibric/L) ----- ----- ----- ----- 0.06 -0.21 -0.09 0.15 0.32
(Ibuprofen+L) ----- ----- ----- ----- 0.01 0.05 0.02 0.03 0.05
(Aspirin+L) ----- ----- ----- ----- 0.08 -0.11 0.25 0.24 0.29

3. Results & Discussion
133
Fig. 3.20 The chemical shift changes for the 5,11,17,23 tetra-tert-butyl, 25, 27-bis[aminoethoxy], 26,
28 dihydroxycalix[4]arene upon addition of diclofenac against the [Drug]/ [receptor] ratios in CD3CN
at 298 K. [CA-(NH2)2] = 2 10-3 mol dm-3, [DCF] 4 10-3 mol dm-3 (see Table 3.1-Appendix)
The chemical shift changes for the CA-(NH2)2 protons as a result from the addition of increasing
concentration from clofibric acid are presented in Table 3.2-Appendix. As shown in Fig. 3.21 that
the addition of clofibric acid to the receptor solution led to significant changes in chemical shift
changes
Fig. 3. 21 Chemical shift changes for the 5,11,17,23 tetra-tert-butyl, 25, 27-bis[aminoethoxy], 26, 28
dihydroxycalix[4]arene upon addition of clofibric acid against the [drug]/ [receptor] ratios at 298
K.[CA-(NH2)2] = 2 ×10⁻³ mol dm-3, [CLF] = 4 ×10⁻³ mol dm-3, 0.04 ml for each addition
-0.3
-0.1
0.1
0.3
0.0 0.2 0.5 0.7 1.0 1.2 1.5 1.7 2.0 2.2
∆δ
(pp
m)
[Diclofenac]/ [CA-(NH2)2] mol dm-3
H6
H7
H8
N-H
-0.3
-0.1
0.2
0.4
0.0 0.5 1.0 1.5 2.0
∆δ
(pp
m)
[clofibric acid]/ [CA-(NH2)2] mol dm-3
H6
H7
H8
N-H

3. Results & Discussion
134
Conductometric measurements were carried out with the aim of assessing the stoichiometry of the
drug-receptor interaction
3.9.2 Investigation of the complexation of the pharmaceuticals with CA-(NH2) in
acetonitrile by conductance measurements
3.9.2.1 Conductometric measurments for the pure receptor CA-(NH2)2 in
acetonitrle at 298.15 K
Following the calibration of the instrument to establish the cell constant ( ≈ 1.07 cm-1, Table 3.4)
the conductance of calix[4]arene amine was established in dry acetonitrile at 298.15K. (Fig. 3.22)
shows the conductometric titration plot of the molar conductance m versus the increasing analyte
concentration for calix[4]arene amine. Conductivity values obtained revealed that no significant
change is caused by the addition of the receptor solution to the conductivity cell containing freshly
dried acetonitrile. This indicates that the receptor does not undergo ionization or protonation process
by acetonitrile as the solvent. It should be noted that although in the plot appears that m increases,
the values are extremely low
Fig. 3.22 Conductivity curve of the free receptor in acetonitrile (5.29×10⁻⁴ mol dm-3) titrated into
the cell containing 25 ml of pure acetonitrile at 298.15 K
4.00E-04
6.00E-04
8.00E-04
1.00E-03
1.20E-03
0 0.000005 0.00001 0.000015 0.00002 0.000025
ΛS
cm
2m
ol-1
[Calix[4]arene amine]in MeCN mol dm -3
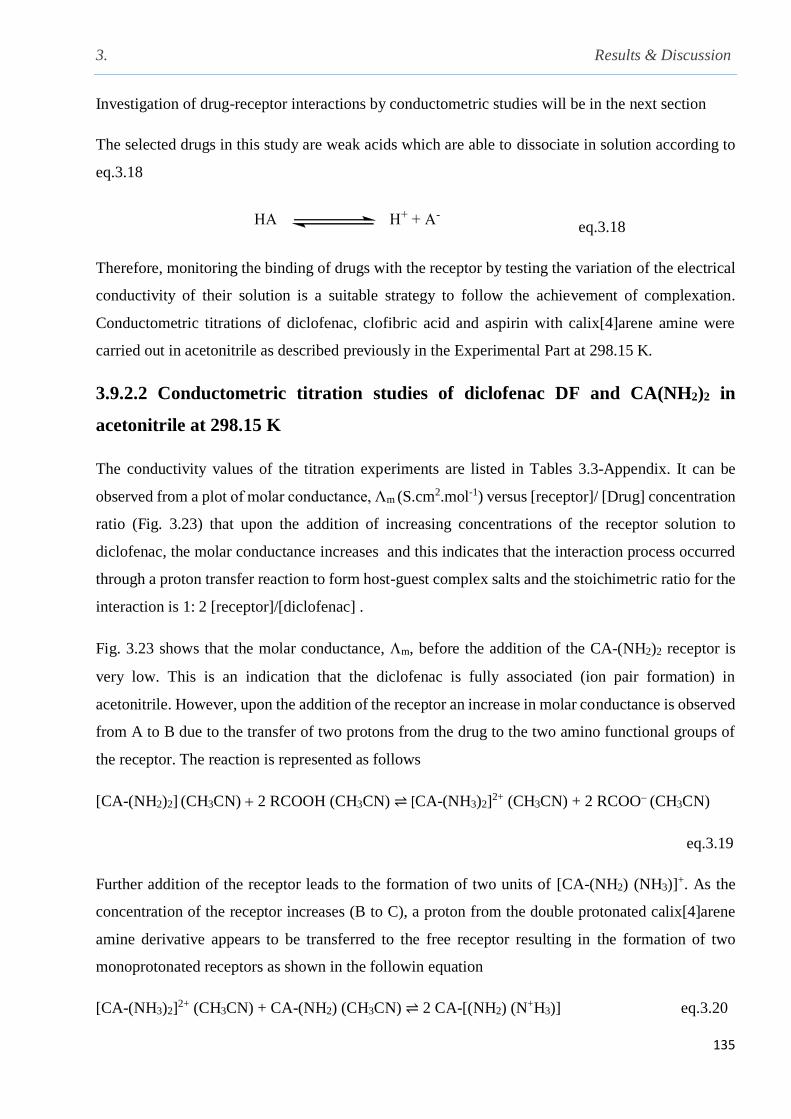
3. Results & Discussion
135
Investigation of drug-receptor interactions by conductometric studies will be in the next section
The selected drugs in this study are weak acids which are able to dissociate in solution according to
eq.3.18
eq.3.18
Therefore, monitoring the binding of drugs with the receptor by testing the variation of the electrical
conductivity of their solution is a suitable strategy to follow the achievement of complexation.
Conductometric titrations of diclofenac, clofibric acid and aspirin with calix[4]arene amine were
carried out in acetonitrile as described previously in the Experimental Part at 298.15 K.
3.9.2.2 Conductometric titration studies of diclofenac DF and CA(NH2)2 in
acetonitrile at 298.15 K
The conductivity values of the titration experiments are listed in Tables 3.3-Appendix. It can be
observed from a plot of molar conductance, Λm (S.cm2.mol-1) versus [receptor]/ [Drug] concentration
ratio (Fig. 3.23) that upon the addition of increasing concentrations of the receptor solution to
diclofenac, the molar conductance increases and this indicates that the interaction process occurred
through a proton transfer reaction to form host-guest complex salts and the stoichimetric ratio for the
interaction is 1: 2 [receptor]/[diclofenac] .
Fig. 3.23 shows that the molar conductance, m, before the addition of the CA-(NH2)2 receptor is
very low. This is an indication that the diclofenac is fully associated (ion pair formation) in
acetonitrile. However, upon the addition of the receptor an increase in molar conductance is observed
from A to B due to the transfer of two protons from the drug to the two amino functional groups of
the receptor. The reaction is represented as follows
[CA-(NH2)2] (CH3CN) 2 RCOOH (CH3CN) ⇌ [CA-(NH3)2]2+ (CH3CN) + 2 RCOO (CH3CN)
eq.3.19
Further addition of the receptor leads to the formation of two units of [CA-(NH2) (NH3)]+. As the
concentration of the receptor increases (B to C), a proton from the double protonated calix[4]arene
amine derivative appears to be transferred to the free receptor resulting in the formation of two
monoprotonated receptors as shown in the followin equation
[CA-(NH3)2]2+ (CH3CN) + CA-(NH2) (CH3CN) ⇌ 2 CA-[(NH2) (N
+H3)] eq.3.20

3. Results & Discussion
136
From C to D the increase in conductance occurs due to the excess of receptor which displaces the
equilibrium to the right
Fig. 3.23 Change in molar conductance resulting from the addition of receptor against the [receptor]/
[drug] concentration ratio in acetonitrile at 298.15 K, [Diclofenac] = 1.6×10⁻³ mol dm-3, see Table
3.3-Appendix
3.9.2.3 Conductometric titration studies of clofibric acid with CA-(NH2)2 in
acetonitrile at 298.15 K
Conductance values for clofibric acid with CA-(NH2)2 in acetonitrile at 298.15 K are listed in Table
3.4-Appendix. It can be observed from the plot of molar conductance, Λm (S.cm2.mol-1) versus
[receptor]/ [clofibric acid] concentration ratio (Fig. 3.24) that upon the addition of increasing
concentrations of the receptor solution to the clofibric acid solution, the conductance values increase
(A to B) indicating the transfer of two protons from the drug to the receptor given that the [receptor]/
[clofibric acid] ratio is 0.5, therefore the composition of the adduct formed is 1: 2. The pattern
followed from B to C and from C to D is similar to that observed for diclofenac and this receptor in
this solvent
0
5
10
15
20
0 0.5 1 1.5 2 2.5
m
S c
m2 m
ol-1
[CA-(NH2)2]/ [diclofenac] mol dm-3
A
B
C
D

3. Results & Discussion
137
Fig. 3.24 Change in molar conductance resulting from addition of the receptor against the [receptor]/
[clofibric acid] concentration ratio in acetonitrile at 298.15 K. The concentration of clofibric acid
solution in MeCN is 1.96×10 -3 mol dm-3, see Table 3.4-Appendix
3.9.2.4 Conductometric titration of aspirin with CA-(NH2)2 in acetonitrile at
298.15 K
The conductance values of the titration experiments are listed in Table 3.5-Appendix. It can be
observed from plots of molar conductance, Λm (S.cm2.mol-1) versus [receptor]/ [aspirin]
concentration ratio (Fig. 3.25) that upon the addition of increasing concentrations of the receptor
solution to the aspirin solution the conductance increases (A to B) and this indicates that the
interaction process occurred through the transfer of one proton from the drug to the receptor to form
host-guest complex salts of genaral formula (CA-NH2-N+H3).(R-CO2
- ) and the stoichimetric ratio
for the interaction is found to be 1: 1 [receptor]/ [aspirine]
0
4
8
12
16
0 0.5 1 1.5 2
m
S c
m2 m
ol-1
[CA-(NH2)2]/ [clofibric acid]
A
B
C
D
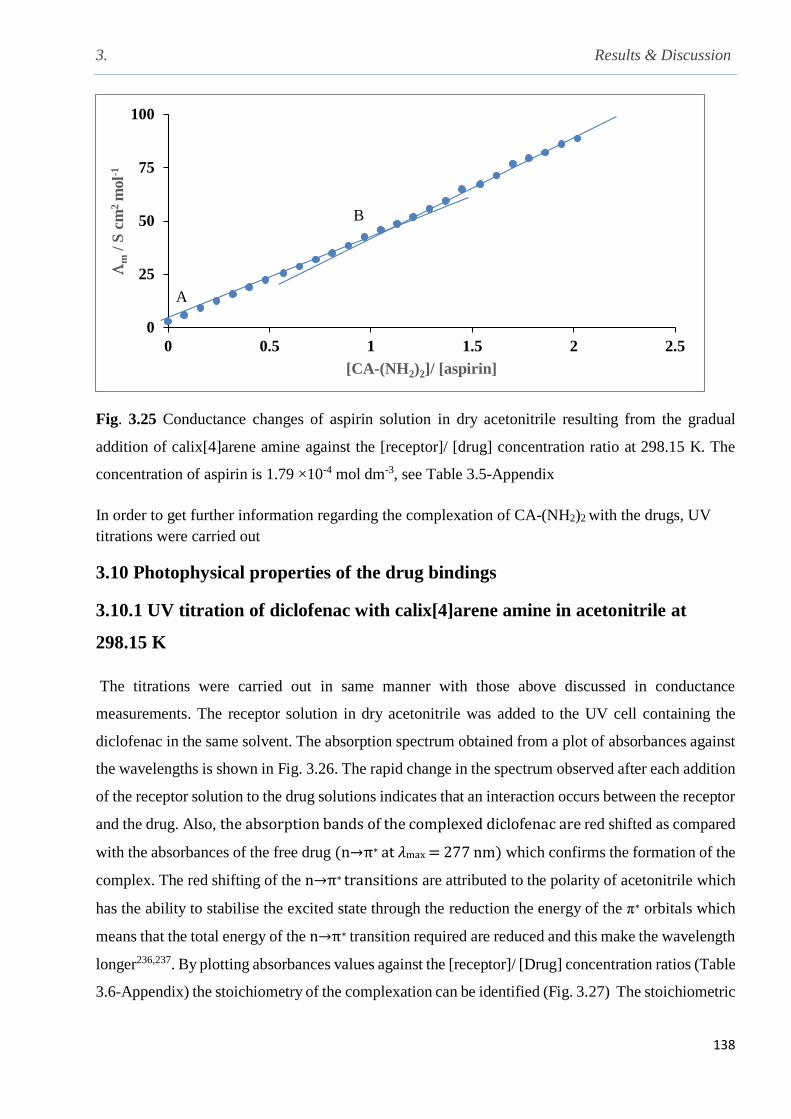
3. Results & Discussion
138
Fig. 3.25 Conductance changes of aspirin solution in dry acetonitrile resulting from the gradual
addition of calix[4]arene amine against the [receptor]/ [drug] concentration ratio at 298.15 K. The
concentration of aspirin is 1.79 ×10⁻⁴ mol dm-3, see Table 3.5-Appendix
In order to get further information regarding the complexation of CA-(NH2)2 with the drugs, UV
titrations were carried out
3.10 Photophysical properties of the drug bindings
3.10.1 UV titration of diclofenac with calix[4]arene amine in acetonitrile at
298.15 K
The titrations were carried out in same manner with those above discussed in conductance
measurements. The receptor solution in dry acetonitrile was added to the UV cell containing the
diclofenac in the same solvent. The absorption spectrum obtained from a plot of absorbances against
the wavelengths is shown in Fig. 3.26. The rapid change in the spectrum observed after each addition
of the receptor solution to the drug solutions indicates that an interaction occurs between the receptor
and the drug. Also, the absorption bands of the complexed diclofenac are red shifted as compared
with the absorbances of the free drug (n→π∗ at 𝜆max = 277 nm) which confirms the formation of the
complex. The red shifting of the n→π∗ transitions are attributed to the polarity of acetonitrile which
has the ability to stabilise the excited state through the reduction the energy of the π∗ orbitals which
means that the total energy of the n→π∗ transition required are reduced and this make the wavelength
longer236,237. By plotting absorbances values against the [receptor]/ [Drug] concentration ratios (Table
3.6-Appendix) the stoichiometry of the complexation can be identified (Fig. 3.27) The stoichiometric
0
25
50
75
100
0 0.5 1 1.5 2 2.5
m
/ S
cm
2 m
ol-1
[CA-(NH2)2]/ [aspirin]
A
B
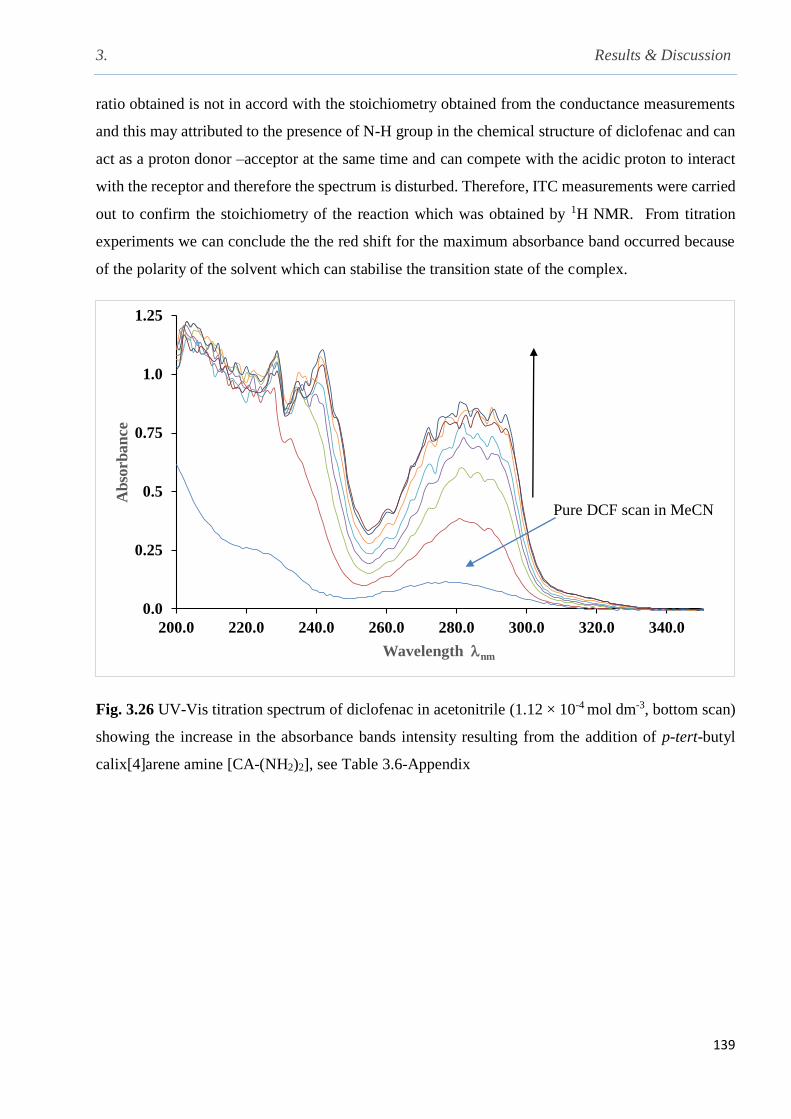
3. Results & Discussion
139
ratio obtained is not in accord with the stoichiometry obtained from the conductance measurements
and this may attributed to the presence of N-H group in the chemical structure of diclofenac and can
act as a proton donor –acceptor at the same time and can compete with the acidic proton to interact
with the receptor and therefore the spectrum is disturbed. Therefore, ITC measurements were carried
out to confirm the stoichiometry of the reaction which was obtained by 1H NMR. From titration
experiments we can conclude the the red shift for the maximum absorbance band occurred because
of the polarity of the solvent which can stabilise the transition state of the complex.
Fig. 3.26 UV-Vis titration spectrum of diclofenac in acetonitrile (1.12 × 10⁻⁴ mol dm-3, bottom scan)
showing the increase in the absorbance bands intensity resulting from the addition of p-tert-butyl
calix[4]arene amine [CA-(NH2)2], see Table 3.6-Appendix
0.0
0.25
0.5
0.75
1.0
1.25
200.0 220.0 240.0 260.0 280.0 300.0 320.0 340.0
Ab
sorb
an
ce
Wavelength nm
Pure DCF scan in MeCN
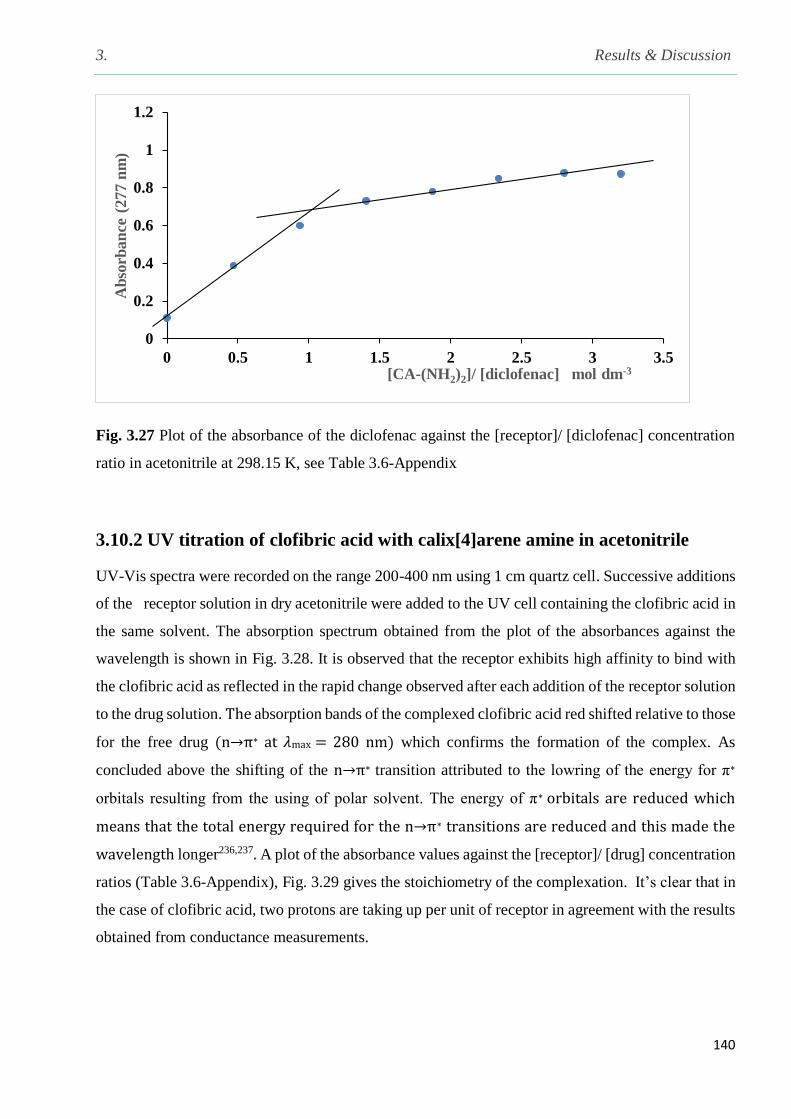
3. Results & Discussion
140
Fig. 3.27 Plot of the absorbance of the diclofenac against the [receptor]/ [diclofenac] concentration
ratio in acetonitrile at 298.15 K, see Table 3.6-Appendix
3.10.2 UV titration of clofibric acid with calix[4]arene amine in acetonitrile
UV-Vis spectra were recorded on the range 200-400 nm using 1 cm quartz cell. Successive additions
of the receptor solution in dry acetonitrile were added to the UV cell containing the clofibric acid in
the same solvent. The absorption spectrum obtained from the plot of the absorbances against the
wavelength is shown in Fig. 3.28. It is observed that the receptor exhibits high affinity to bind with
the clofibric acid as reflected in the rapid change observed after each addition of the receptor solution
to the drug solution. The absorption bands of the complexed clofibric acid red shifted relative to those
for the free drug (n→π∗ at 𝜆max = 280 nm) which confirms the formation of the complex. As
concluded above the shifting of the n→π∗ transition attributed to the lowring of the energy for π∗
orbitals resulting from the using of polar solvent. The energy of π∗ orbitals are reduced which
means that the total energy required for the n→π∗ transitions are reduced and this made the
wavelength longer236,237. A plot of the absorbance values against the [receptor]/ [drug] concentration
ratios (Table 3.6-Appendix), Fig. 3.29 gives the stoichiometry of the complexation. It’s clear that in
the case of clofibric acid, two protons are taking up per unit of receptor in agreement with the results
obtained from conductance measurements.
0
0.2
0.4
0.6
0.8
1
1.2
0 0.5 1 1.5 2 2.5 3 3.5
Ab
sorb
an
ce (
277 n
m)
[CA-(NH2)2]/ [diclofenac] mol dm-3
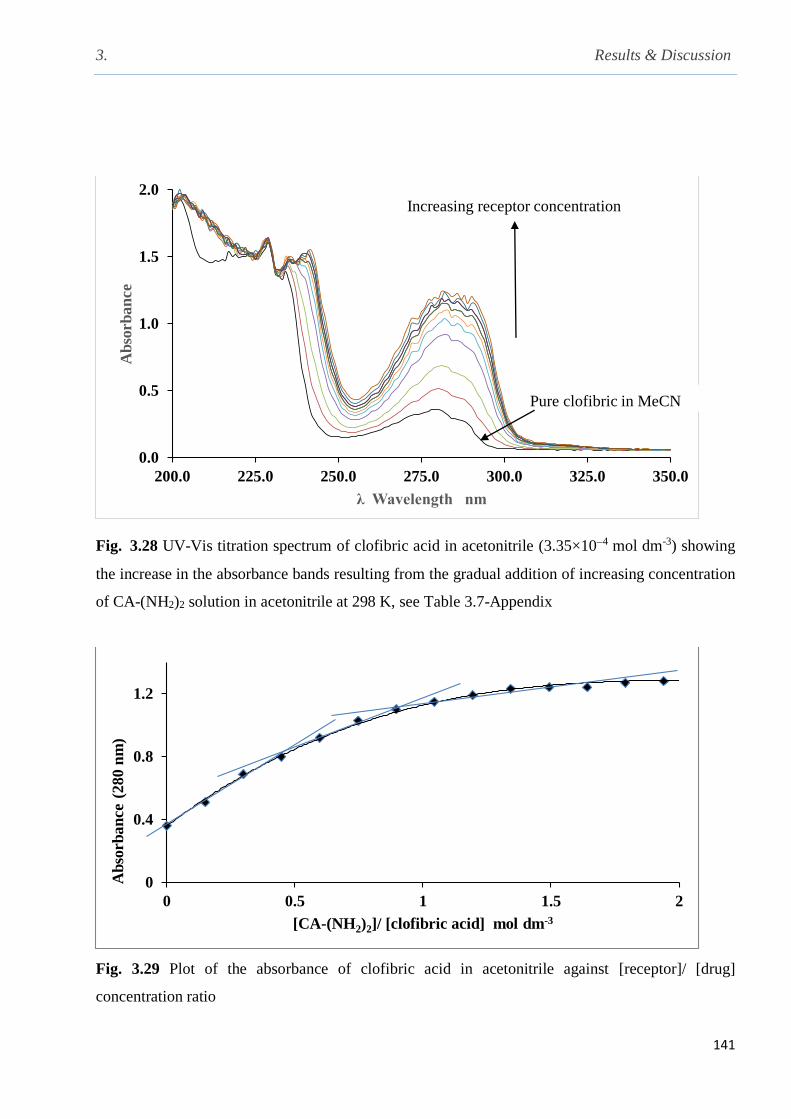
3. Results & Discussion
141
Fig. 3.28 UV-Vis titration spectrum of clofibric acid in acetonitrile (3.35×10⁴ mol dm-3) showing
the increase in the absorbance bands resulting from the gradual addition of increasing concentration
of CA-(NH2)2 solution in acetonitrile at 298 K, see Table 3.7-Appendix
Fig. 3.29 Plot of the absorbance of clofibric acid in acetonitrile against [receptor]/ [drug]
concentration ratio
0.0
0.5
1.0
1.5
2.0
200.0 225.0 250.0 275.0 300.0 325.0 350.0
Ab
sorb
an
ce
λ Wavelength nm
Increasing receptor concentration
Pure clofibric in MeCN
0
0.4
0.8
1.2
0 0.5 1 1.5 2
Ab
sorb
an
ce (
280 n
m)
[CA-(NH2)2]/ [clofibric acid] mol dm-3
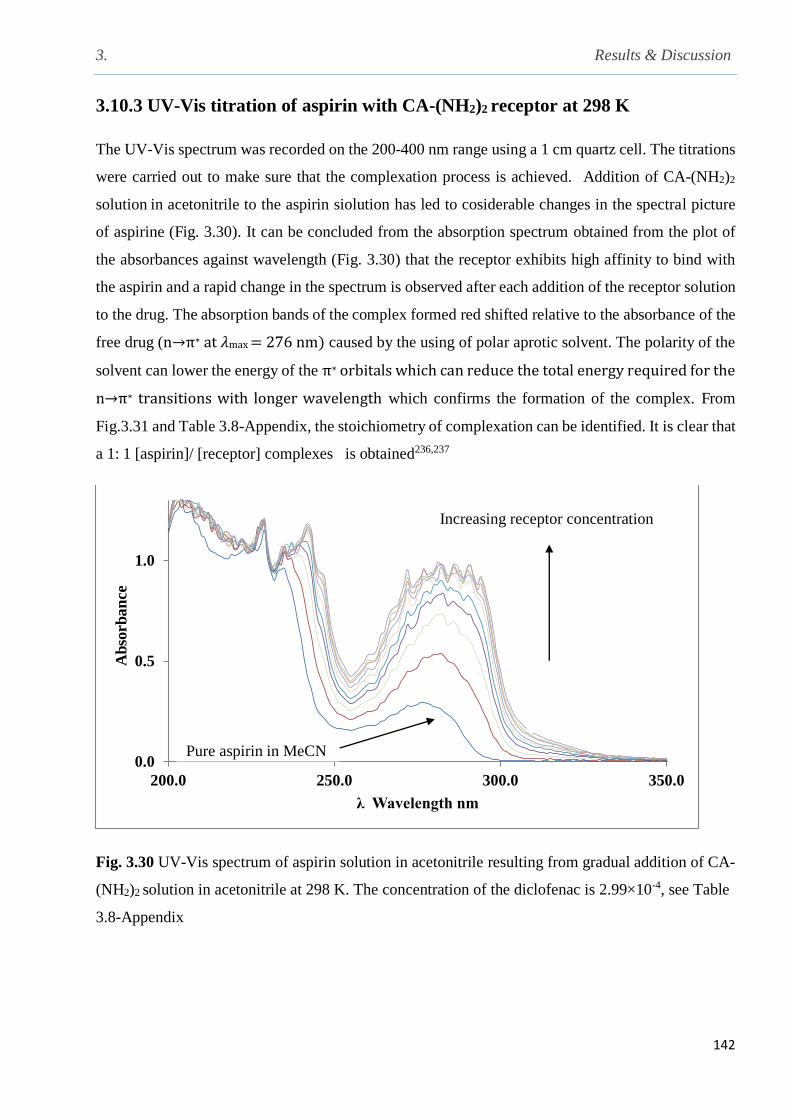
3. Results & Discussion
142
3.10.3 UV-Vis titration of aspirin with CA-(NH2)2 receptor at 298 K
The UV-Vis spectrum was recorded on the 200-400 nm range using a 1 cm quartz cell. The titrations
were carried out to make sure that the complexation process is achieved. Addition of CA-(NH2)2
solution in acetonitrile to the aspirin siolution has led to cosiderable changes in the spectral picture
of aspirine (Fig. 3.30). It can be concluded from the absorption spectrum obtained from the plot of
the absorbances against wavelength (Fig. 3.30) that the receptor exhibits high affinity to bind with
the aspirin and a rapid change in the spectrum is observed after each addition of the receptor solution
to the drug. The absorption bands of the complex formed red shifted relative to the absorbance of the
free drug (n→π∗ at 𝜆max = 276 nm) caused by the using of polar aprotic solvent. The polarity of the
solvent can lower the energy of the π∗ orbitals which can reduce the total energy required for the
n→π∗ transitions with longer wavelength which confirms the formation of the complex. From
Fig.3.31 and Table 3.8-Appendix, the stoichiometry of complexation can be identified. It is clear that
a 1: 1 [aspirin]/ [receptor] complexes is obtained236,237
Fig. 3.30 UV-Vis spectrum of aspirin solution in acetonitrile resulting from gradual addition of CA-
(NH2)2 solution in acetonitrile at 298 K. The concentration of the diclofenac is 2.99×10⁻⁴, see Table
3.8-Appendix
0.0
0.5
1.0
200.0 250.0 300.0 350.0
Ab
sorb
an
ce
λ Wavelength nm
Pure aspirin in MeCN
Increasing receptor concentration
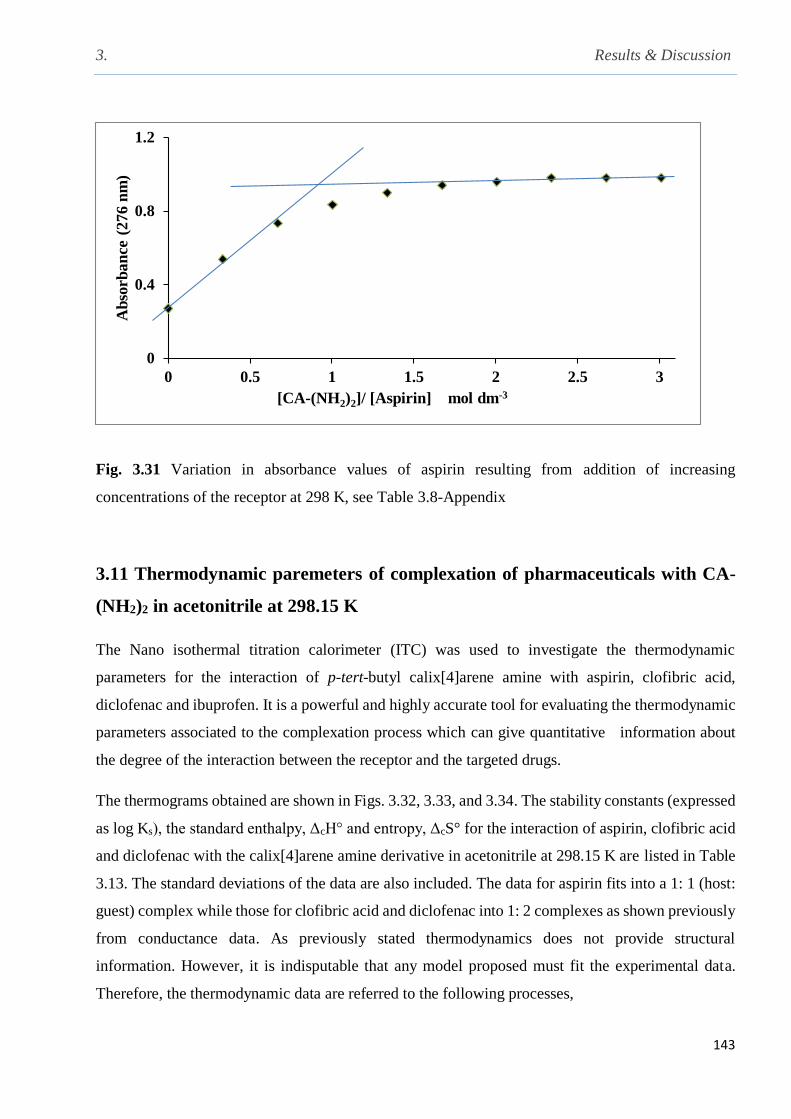
3. Results & Discussion
143
Fig. 3.31 Variation in absorbance values of aspirin resulting from addition of increasing
concentrations of the receptor at 298 K, see Table 3.8-Appendix
3.11 Thermodynamic paremeters of complexation of pharmaceuticals with CA-
(NH2)2 in acetonitrile at 298.15 K
The Nano isothermal titration calorimeter (ITC) was used to investigate the thermodynamic
parameters for the interaction of p-tert-butyl calix[4]arene amine with aspirin, clofibric acid,
diclofenac and ibuprofen. It is a powerful and highly accurate tool for evaluating the thermodynamic
parameters associated to the complexation process which can give quantitative information about
the degree of the interaction between the receptor and the targeted drugs.
The thermograms obtained are shown in Figs. 3.32, 3.33, and 3.34. The stability constants (expressed
as log Ks), the standard enthalpy, ΔcH° and entropy, ΔcS° for the interaction of aspirin, clofibric acid
and diclofenac with the calix[4]arene amine derivative in acetonitrile at 298.15 K are listed in Table
3.13. The standard deviations of the data are also included. The data for aspirin fits into a 1: 1 (host:
guest) complex while those for clofibric acid and diclofenac into 1: 2 complexes as shown previously
from conductance data. As previously stated thermodynamics does not provide structural
information. However, it is indisputable that any model proposed must fit the experimental data.
Therefore, the thermodynamic data are referred to the following processes,
0
0.4
0.8
1.2
0 0.5 1 1.5 2 2.5 3
Ab
sorb
an
ce (
276 n
m)
[CA-(NH2)2]/ [Aspirin] mol dm-3
3. Results & Discussion
144
For 1:1 complexes of aspirin, clofibric acid and diclofenac, eq.3.21 is representative of the process
taking place in solution, in doing so the results obtained from conductance data that these
pharmaceuticals are predominantly as ion pairs in acetonitrile
R COOH (MeCN) + CA-(NH2) 2 (MeCN) → RCOO- (MeCN) + CA-NH2-NH3+ (MeCN)……eq.3.21
For 1: 2 complexes of clofibric acid and diclofenac,
RCOOH (MeCN) + CA-NH2-N+H3 (MeCN) → RCOO- (MeCN) + [CA(NH3)2]
2+ (MeCN)…..eq.3.22
For aspirin the process is enthalpy controlled. The same applies for the 1: 1 complexes of clofibric
acid and diclofenac. However, the formation of 2: 1 complexes is enthalpically unfavoured and
entropically controlled. These results are striking and suggest that a great disorder in the structure of
the receptor occurs to allow the entrance of the second proton. X-ray crystallographic studies of an
analogous receptor CA-[N(Et2)2], with perchloric acid has shown the double protonation of the
receptor as well as the loss of the solvent upon protonation while the hydrogen bond between the
ethereal oxygen and the phenolic oxygen still remains. The conformational change that CA-(NH2)2
undergoes in moving from the free to the protonated ligand as shown by 1 H NMR studies in CD3 CN
indicates a flattened ‘cone’ conformation for the latter relative to the quasi ‘cone’ conformation of
the former and as a result the hydrophobic cavity is able to lose the solvent. This process will lead to
an increase in entropy. Given that energy would be required to remove the solvent from the cavity,
the process would be enthalpically unfavoured. This interpretation is corroborated by the data
reported in Table 3.13. Comparison of the protonation contants of CA-(NH2)2 with clofibric acid and
diclofenac in acetonitrile at 298.15 K relative to those for CA-[N(C2H5)2] and HClO4 in the same
solvent and temperature (log Ks1 = 15.68, log Ks2 = 14.36) demonstrates the effect of the strength of
the acid on the protonation process as well as the basic nature of the amine moieties in the pendant
arms given that the basicity of the tertiary amine in CA-[N(Et2)2] is higher than that of CA-(NH2)2
(primary amine). The thermodynamic data reveal that CA-(NH2)2 is selective for these drugs in the
following sequence
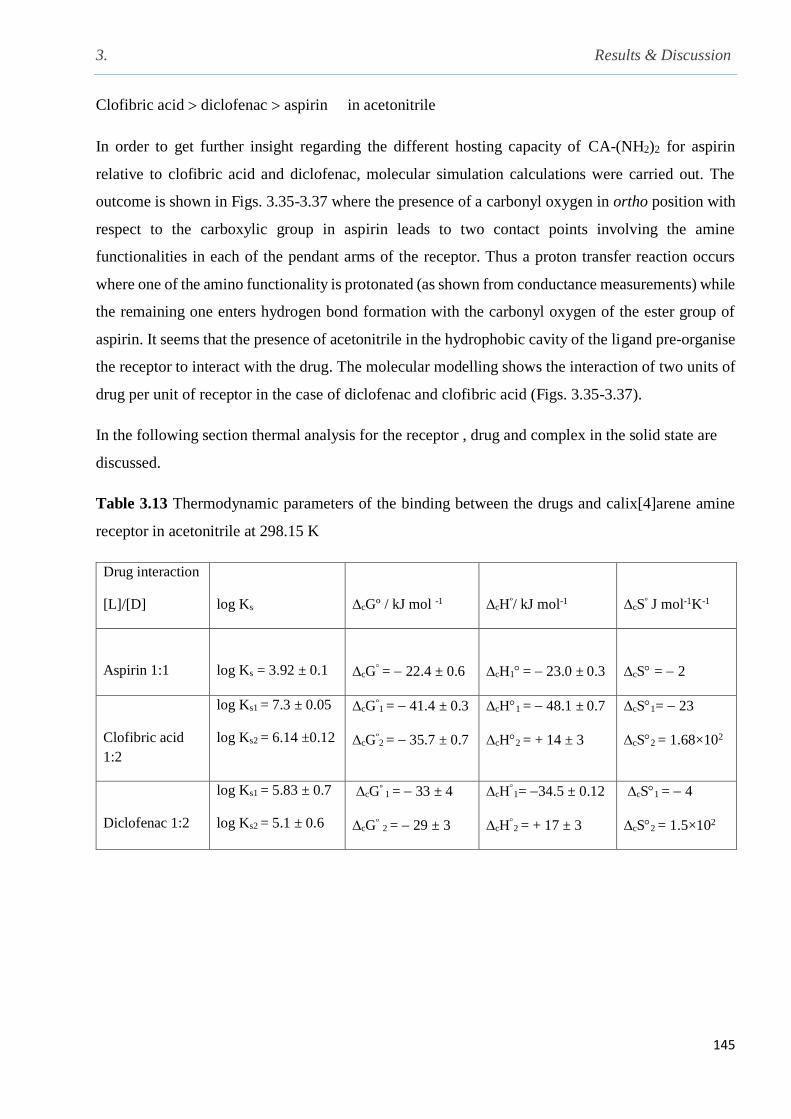
3. Results & Discussion
145
Clofibric acid diclofenac aspirin in acetonitrile
In order to get further insight regarding the different hosting capacity of CA-(NH2)2 for aspirin
relative to clofibric acid and diclofenac, molecular simulation calculations were carried out. The
outcome is shown in Figs. 3.35-3.37 where the presence of a carbonyl oxygen in ortho position with
respect to the carboxylic group in aspirin leads to two contact points involving the amine
functionalities in each of the pendant arms of the receptor. Thus a proton transfer reaction occurs
where one of the amino functionality is protonated (as shown from conductance measurements) while
the remaining one enters hydrogen bond formation with the carbonyl oxygen of the ester group of
aspirin. It seems that the presence of acetonitrile in the hydrophobic cavity of the ligand pre-organise
the receptor to interact with the drug. The molecular modelling shows the interaction of two units of
drug per unit of receptor in the case of diclofenac and clofibric acid (Figs. 3.35-3.37).
In the following section thermal analysis for the receptor , drug and complex in the solid state are
discussed.
Table 3.13 Thermodynamic parameters of the binding between the drugs and calix[4]arene amine
receptor in acetonitrile at 298.15 K
Drug interaction
[L]/[D]
log Ks
∆cGº / kJ mol -1
∆cHº/ kJ mol-1
∆cSº J mol-1K-1
Aspirin 1:1
log Ks = 3.92 ± 0.1
∆cG = 22.4 ± 0.6
∆cH1 = 23.0 ± 0.3
∆cS = 2
Clofibric acid
1:2
log Ks1 = 7.3 ± 0.05
log Ks2 = 6.14 ±0.12
∆cGº1 = 41.4 ± 0.3
∆cGº2 = 35.7 ± 0.7
∆cH1 = 48.1 ± 0.7
∆cH2 = + 14 ± 3
∆cS1= 23
∆cS2 = 1.68×10²
Diclofenac 1:2
log Ks1 = 5.83 ± 0.7
log Ks2 = 5.1 ± 0.6
∆cGº 1 = 33 ± 4
∆cGº 2 = 29 ± 3
∆cH1= 34.5 ± 0.12
∆cH2 = + 17 ± 3
∆cS1 = 4
∆cS2 = 1.5×10²
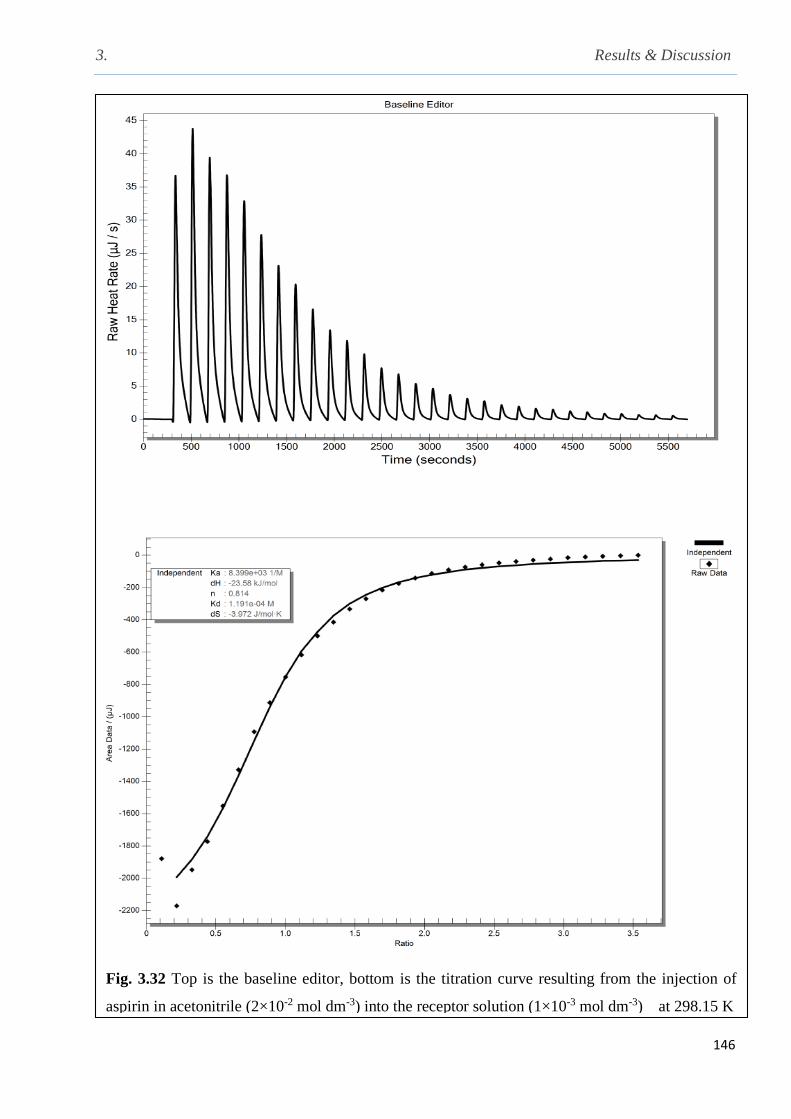
3. Results & Discussion
146
Fig. 3.32 Top is the baseline editor, bottom is the titration curve resulting from the injection of
aspirin in acetonitrile (2×10⁻² mol dm-3) into the receptor solution (1×10⁻³ mol dm-3) at 298.15 K

3. Results & Discussion
147
[Ca-(NH2)2] / [Clofibric acid] mol dm-3
Fig. 3.33 Top is the baseline indicated to the heat evolved after each addition of clofibric acid
solution in acetonitrile (3×10⁻² mol dm-3) to the receptor solution (1×10⁻³ mol dm-3) and bottom is
a plot of the heat against the molar ratio at 298.15 in acetonitrile

3. Results & Discussion
148
[clofibric acid]/ [CA-(NH2)2]
[Diclofenac]/ [CA-(NH2)2]
Fig. 3.34 Top is the baseline indicating the heat evolved per second resulting from addition
of the diclofenac solution in acetonitrile (5×10⁻² mol dm-3) to the macrocyclic receptor
solution (1×10⁻³ mol dm-3). Bottom Figure is the titration curve for the interaction of
diclofenac with calix[4]amine in acetonitrile at 298.15 K.
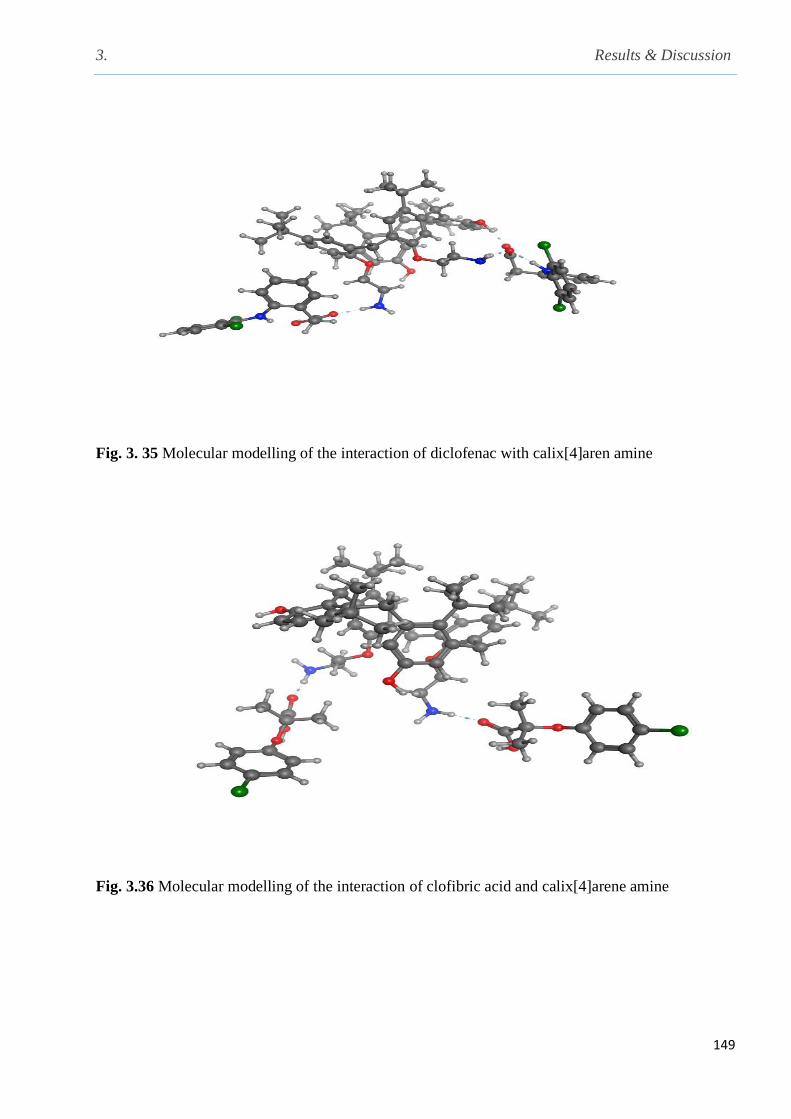
3. Results & Discussion
149
Fig. 3. 35 Molecular modelling of the interaction of diclofenac with calix[4]aren amine
Fig. 3.36 Molecular modelling of the interaction of clofibric acid and calix[4]arene amine

3. Results & Discussion
150
Fig. 3.37 Molecular modelling of the interaction of aspirin and calix[4]arene (CA-NH2)2
3.12 Investigation of the interaction between diclofenac, clofibric acid and aspirin
with CA-(NH2)2 by using thermogravimetric analysis TGA and differential
scanning calorimetry DSC
Further investigations on the interaction process between CA-(NH2)2 and the pharmaceuticals have
been carried out by following the changes in the thermal behaviour of the free drugs, the receptor and
the complexes. The TG thermograms obtained for diclofenac, receptor and the complex formed (Fig.
3.38) have displayed that the TG thermogram for the complex differs from those for the pure
compounds which means that the thermal properties of the complex shifted to a lower temperature
as compared with that for the free receptor as a result from the complexation process indicating that
the complexation process was achieved successfully. Similar results were obtained for the
complexation of the receptor with clofibric acid (Fig. 3.39) and the complexation of the receptor with
aspirin (Fig. 3.40) which means that the thermal properties of the the complex formed in both cases
differ from the TG thermogram of the pure compounds. These results confirm that the pharmaceticals
and the receptor incorporated in the complexation led to differ in their chemical structures.
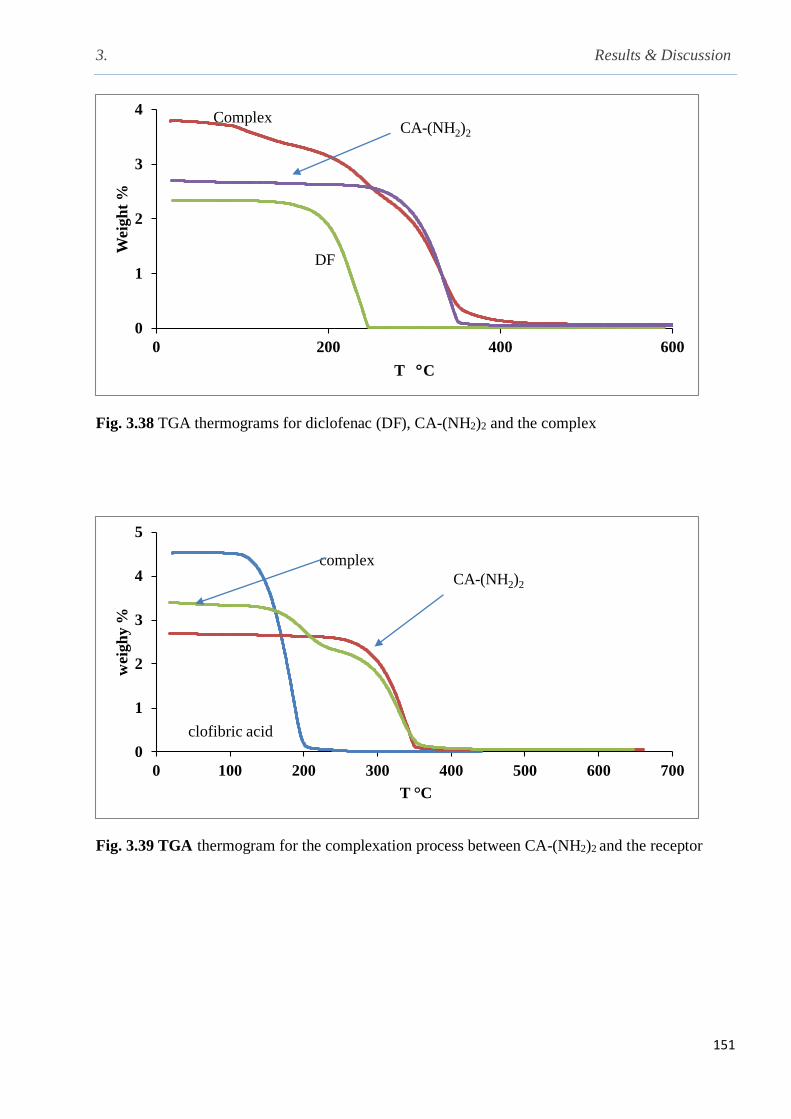
3. Results & Discussion
151
Fig. 3.38 TGA thermograms for diclofenac (DF), CA-(NH2)2 and the complex
Fig. 3.39 TGA thermogram for the complexation process between CA-(NH2)2 and the receptor
0
1
2
3
4
0 200 400 600
Weig
ht
%
T C
Complex
DF
CA-(NH2)2
0
1
2
3
4
5
0 100 200 300 400 500 600 700
weig
hy
%
T °C
CA-(NH2)2
complex
clofibric acid
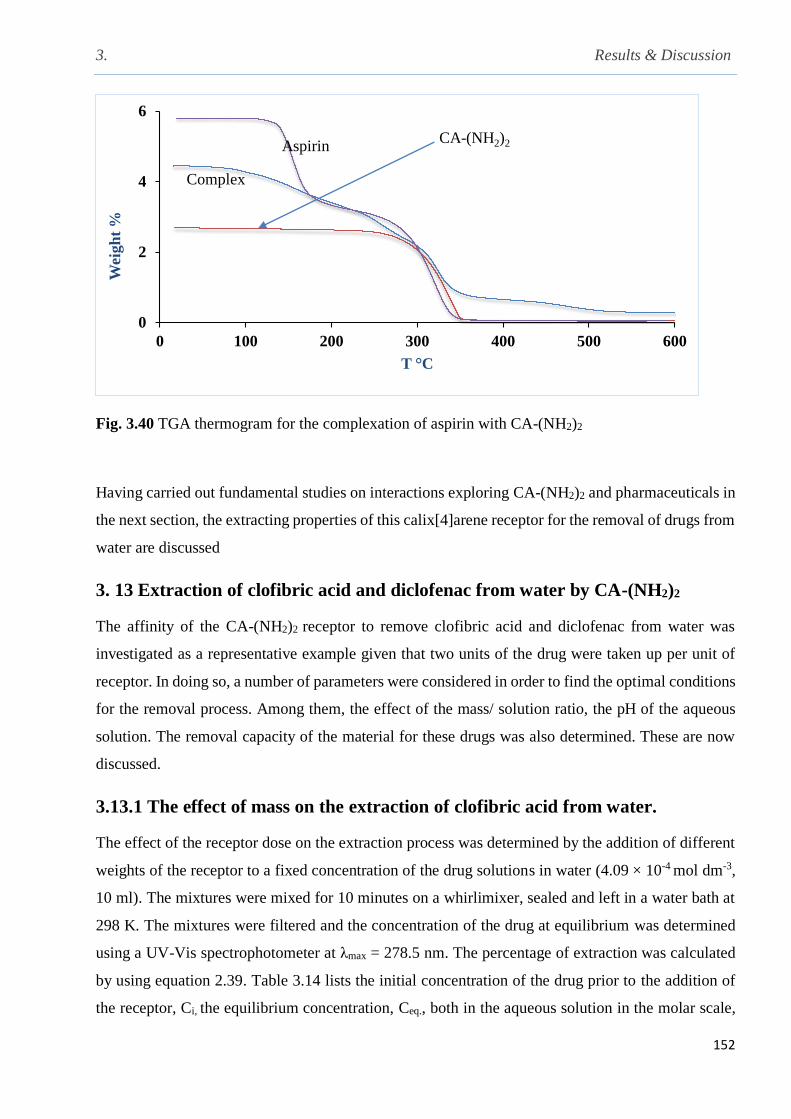
3. Results & Discussion
152
Fig. 3.40 TGA thermogram for the complexation of aspirin with CA-(NH2)2
Having carried out fundamental studies on interactions exploring CA-(NH2)2 and pharmaceuticals in
the next section, the extracting properties of this calix[4]arene receptor for the removal of drugs from
water are discussed
3. 13 Extraction of clofibric acid and diclofenac from water by CA-(NH2)2
The affinity of the CA-(NH2)2 receptor to remove clofibric acid and diclofenac from water was
investigated as a representative example given that two units of the drug were taken up per unit of
receptor. In doing so, a number of parameters were considered in order to find the optimal conditions
for the removal process. Among them, the effect of the mass/ solution ratio, the pH of the aqueous
solution. The removal capacity of the material for these drugs was also determined. These are now
discussed.
3.13.1 The effect of mass on the extraction of clofibric acid from water.
The effect of the receptor dose on the extraction process was determined by the addition of different
weights of the receptor to a fixed concentration of the drug solutions in water (4.09 × 10⁻⁴ mol dm-3,
10 ml). The mixtures were mixed for 10 minutes on a whirlimixer, sealed and left in a water bath at
298 K. The mixtures were filtered and the concentration of the drug at equilibrium was determined
using a UV-Vis spectrophotometer at λmax = 278.5 nm. The percentage of extraction was calculated
by using equation 2.39. Table 3.14 lists the initial concentration of the drug prior to the addition of
the receptor, Ci, the equilibrium concentration, Ceq., both in the aqueous solution in the molar scale,
0
2
4
6
0 100 200 300 400 500 600
Weig
ht
%
T °C
Aspirin
Complex
CA-(NH2)2
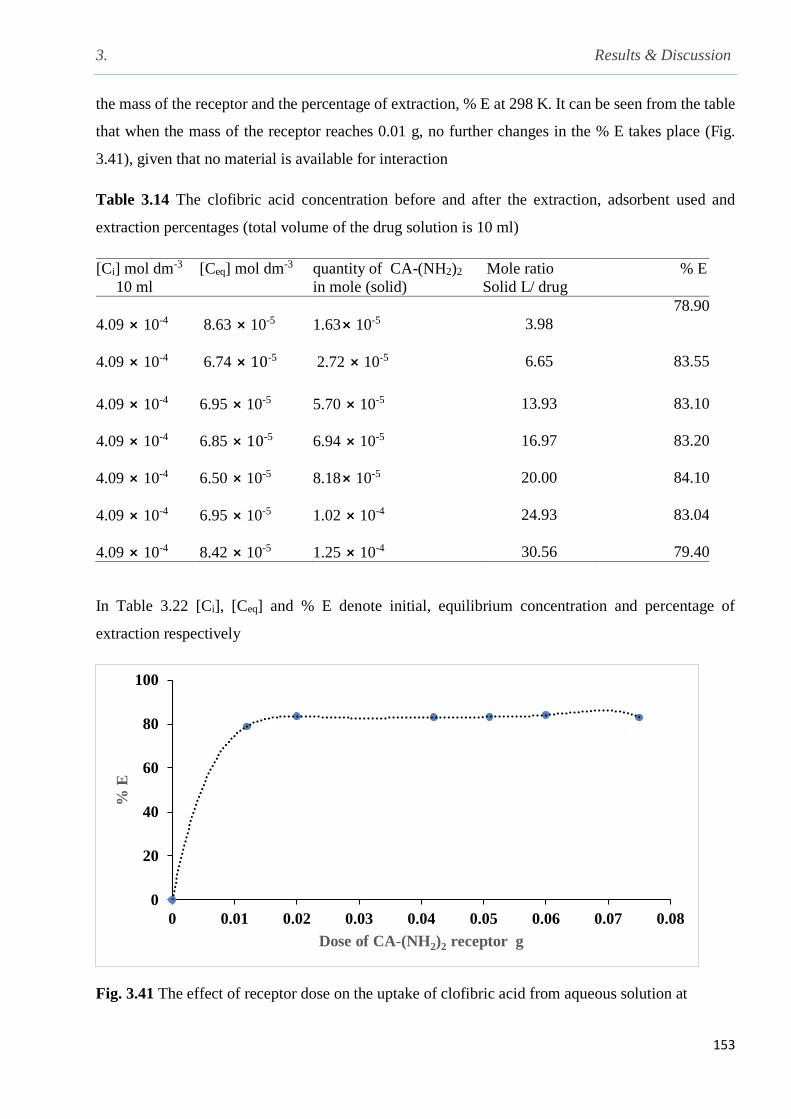
3. Results & Discussion
153
the mass of the receptor and the percentage of extraction, % E at 298 K. It can be seen from the table
that when the mass of the receptor reaches 0.01 g, no further changes in the % E takes place (Fig.
3.41), given that no material is available for interaction
Table 3.14 The clofibric acid concentration before and after the extraction, adsorbent used and
extraction percentages (total volume of the drug solution is 10 ml)
[Ci] mol dm-3
10 ml
[Ceq] mol dm-3 quantity of CA-(NH2)2
in mole (solid)
Mole ratio
Solid L/ drug
% E
4.09 ⨯ 10-4
8.63 ⨯ 10-5
1.63⨯ 10-5
3.98
78.90
4.09 ⨯ 10-4
6.74 ⨯ 10-5
2.72 ⨯ 10-5
6.65
83.55
4.09 ⨯ 10-4
6.95 ⨯ 10-5
5.70 ⨯ 10-5
13.93
83.10
4.09 ⨯ 10-4
6.85 ⨯ 10-5
6.94 ⨯ 10-5
16.97
83.20
4.09 ⨯ 10-4
6.50 ⨯ 10-5
8.18⨯ 10-5
20.00
84.10
4.09 ⨯ 10-4
6.95 ⨯ 10-5
1.02 ⨯ 10-4
24.93
83.04
4.09 ⨯ 10-4
8.42 ⨯ 10-5
1.25 ⨯ 10-4
30.56
79.40
In Table 3.22 [Ci], [Ceq] and % E denote initial, equilibrium concentration and percentage of
extraction respectively
Fig. 3.41 The effect of receptor dose on the uptake of clofibric acid from aqueous solution at
0
20
40
60
80
100
0 0.01 0.02 0.03 0.04 0.05 0.06 0.07 0.08
% E
Dose of CA-(NH2)2 receptor g

3. Results & Discussion
154
298.15 K.
3.13.2 The effect of pH of the aqueous solution on the extraction of clofibric acid
from water by CA-(NH2)2 at 298 K
The controlling pH of solutions were carried by using buffer tablets from Fisher Scientific.The effect
of pH on the extraction of clofibric acid from water by (CA-NH2)2 is shown in Fig. 3.42. The results
show that at low pH , the % E of the drug by the receptor is very low due to the protonation of the
receptor, as the pH increases the % E increases consistently once the amino functional group of the
receptor is fully free to interact with the proton of the carboxilic group of the drug. Therefore the pH
in the alkaline range will increase the activity of the lone pair of electrons on the nitrogen to interact
with acidic proton of the pharmaceutical
Fig. 3.42 The effect of pH on the extraction of clofibric acid (4.09×10⁻⁴ mol dm-3, 10 ml) by using
CA-(NH2)2
3.13.3 Calculation of the capacity of the CA-(NH2)2 receptor to extract clofibric
acid
The experiment was carried out by adding 0.01 g of the receptor to different concentrations(9×10⁻⁵,
1.39×10⁻⁴, 1.95×10⁻⁴, 2.45 × 10⁻⁴, 3.6×10⁻⁴, 4.4×10⁻⁴ mol dm-3, 10 ml) of the clofibric acid in aquious
medium. The capacity of the receptor was calculated according to eq.2.40 and the obtained values
were plotted against the concentration at equilibrium state (Fig. 3.43)
0
40
80
0 2 4 6 8 10
% E
pH
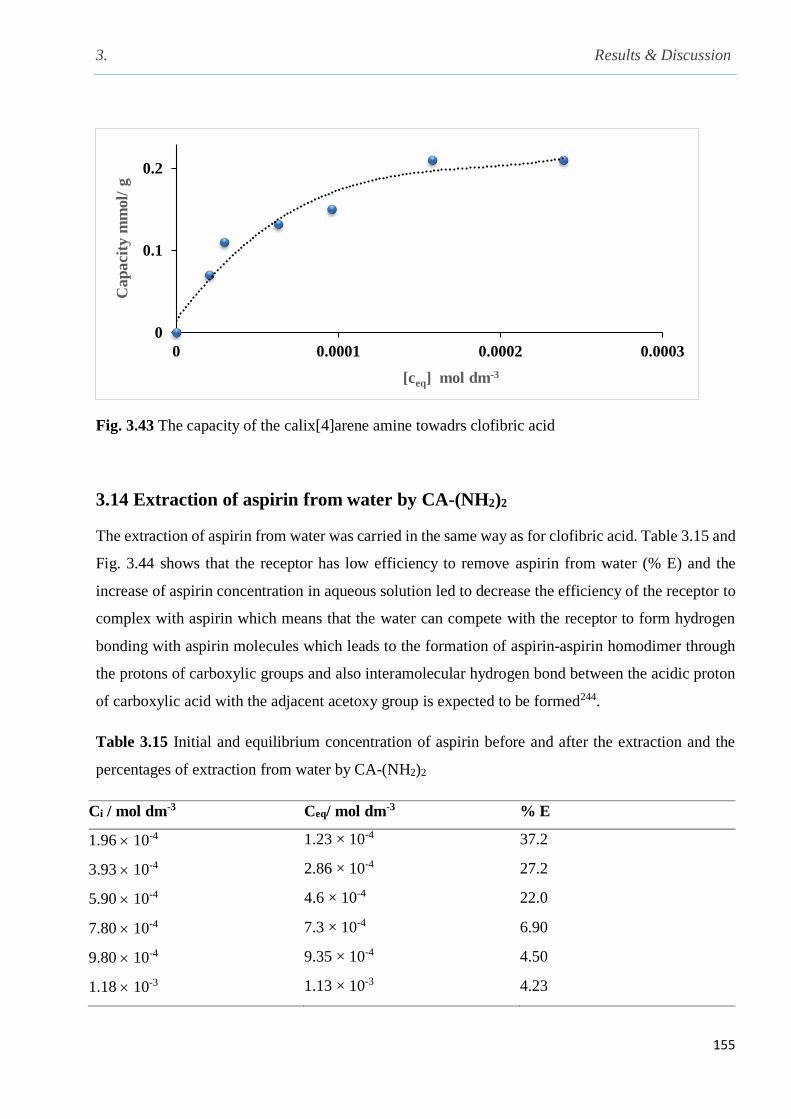
3. Results & Discussion
155
Fig. 3.43 The capacity of the calix[4]arene amine towadrs clofibric acid
3.14 Extraction of aspirin from water by CA-(NH2)2
The extraction of aspirin from water was carried in the same way as for clofibric acid. Table 3.15 and
Fig. 3.44 shows that the receptor has low efficiency to remove aspirin from water (% E) and the
increase of aspirin concentration in aqueous solution led to decrease the efficiency of the receptor to
complex with aspirin which means that the water can compete with the receptor to form hydrogen
bonding with aspirin molecules which leads to the formation of aspirin-aspirin homodimer through
the protons of carboxylic groups and also interamolecular hydrogen bond between the acidic proton
of carboxylic acid with the adjacent acetoxy group is expected to be formed244.
Table 3.15 Initial and equilibrium concentration of aspirin before and after the extraction and the
percentages of extraction from water by CA-(NH2)2
Ci / mol dm-3 Ceq/ mol dm-3 % E
1.96 10-4 1.23 × 10⁻⁴ 37.2
3.93 10-4 2.86 × 10⁻⁴ 27.2
5.90 10-4 4.6 × 10⁻⁴ 22.0
7.80 10-4 7.3 × 10⁻⁴ 6.90
9.80 10-4 9.35 × 10⁻⁴ 4.50
1.18 10-3 1.13 × 10⁻³ 4.23
0
0.1
0.2
0 0.0001 0.0002 0.0003
Cap
acit
y m
mol/
g
[ceq] mol dm-3
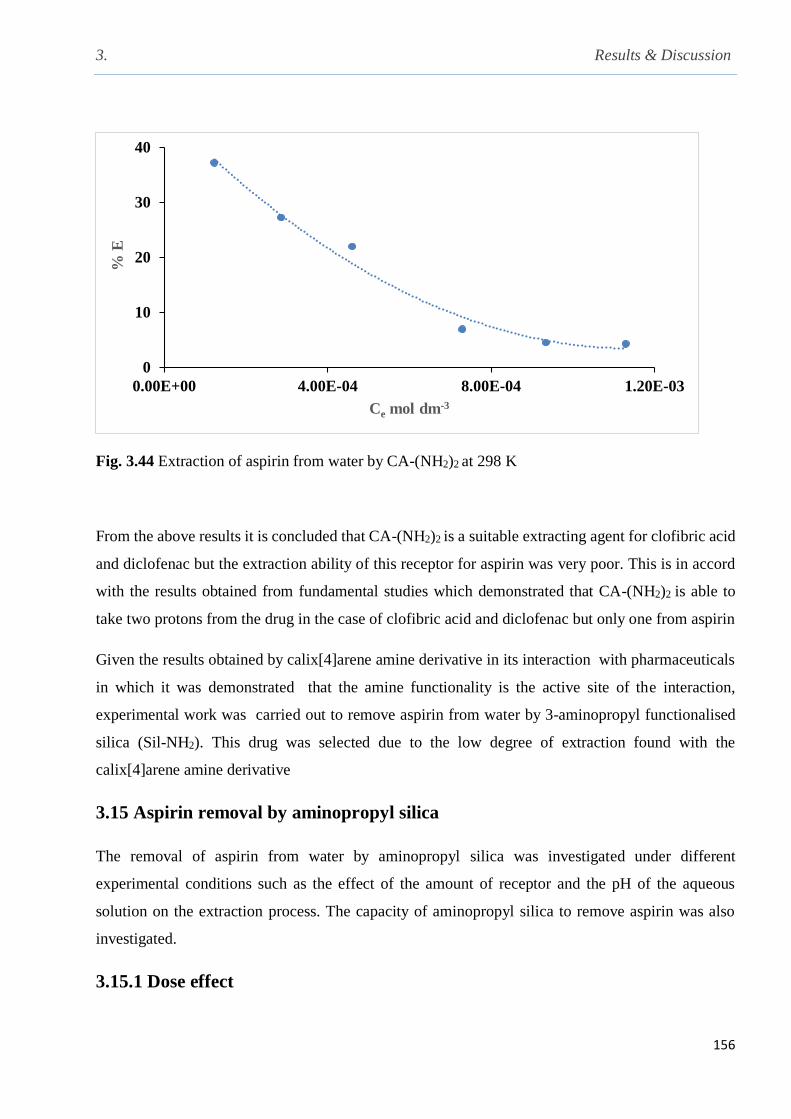
3. Results & Discussion
156
Fig. 3.44 Extraction of aspirin from water by CA-(NH2)2 at 298 K
From the above results it is concluded that CA-(NH2)2 is a suitable extracting agent for clofibric acid
and diclofenac but the extraction ability of this receptor for aspirin was very poor. This is in accord
with the results obtained from fundamental studies which demonstrated that CA-(NH2)2 is able to
take two protons from the drug in the case of clofibric acid and diclofenac but only one from aspirin
Given the results obtained by calix[4]arene amine derivative in its interaction with pharmaceuticals
in which it was demonstrated that the amine functionality is the active site of the interaction,
experimental work was carried out to remove aspirin from water by 3-aminopropyl functionalised
silica (Sil-NH2). This drug was selected due to the low degree of extraction found with the
calix[4]arene amine derivative
3.15 Aspirin removal by aminopropyl silica
The removal of aspirin from water by aminopropyl silica was investigated under different
experimental conditions such as the effect of the amount of receptor and the pH of the aqueous
solution on the extraction process. The capacity of aminopropyl silica to remove aspirin was also
investigated.
3.15.1 Dose effect
0
10
20
30
40
0.00E+00 4.00E-04 8.00E-04 1.20E-03
% E
Ce mol dm-3
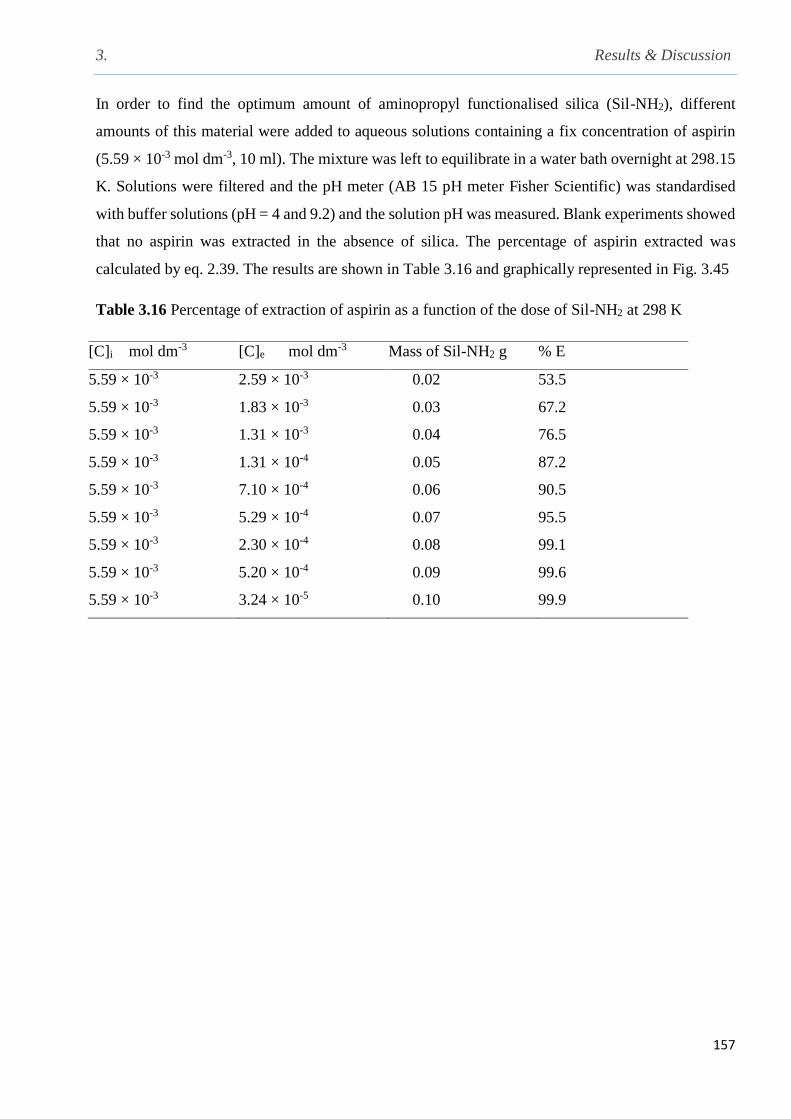
3. Results & Discussion
157
In order to find the optimum amount of aminopropyl functionalised silica (Sil-NH2), different
amounts of this material were added to aqueous solutions containing a fix concentration of aspirin
(5.59 × 10⁻³ mol dm-3, 10 ml). The mixture was left to equilibrate in a water bath overnight at 298.15
K. Solutions were filtered and the pH meter (AB 15 pH meter Fisher Scientific) was standardised
with buffer solutions (pH = 4 and 9.2) and the solution pH was measured. Blank experiments showed
that no aspirin was extracted in the absence of silica. The percentage of aspirin extracted was
calculated by eq. 2.39. The results are shown in Table 3.16 and graphically represented in Fig. 3.45
Table 3.16 Percentage of extraction of aspirin as a function of the dose of Sil-NH2 at 298 K
[C]i mol dm-3 [C]e mol dm-3 Mass of Sil-NH2 g % E
5.59 × 10⁻³ 2.59 × 10⁻³ 0.02 53.5
5.59 × 10⁻³ 1.83 × 10⁻³ 0.03 67.2
5.59 × 10⁻³ 1.31 × 10⁻³ 0.04 76.5
5.59 × 10⁻³ 1.31 × 10⁻⁴ 0.05 87.2
5.59 × 10⁻³ 7.10 × 10⁻⁴ 0.06 90.5
5.59 × 10⁻³ 5.29 × 10⁻⁴ 0.07 95.5
5.59 × 10⁻³ 2.30 × 10⁻⁴ 0.08 99.1
5.59 × 10⁻³ 5.20 × 10⁻⁴ 0.09 99.6
5.59 × 10⁻³ 3.24 × 10⁻⁵ 0.10 99.9

3. Results & Discussion
158
Fig. 3.45 The effect of the mass of Sil─NH2 on the uptake of aspirin from aqueous solution
(5.59×10⁻³ mol dm-3, 10 ml) at 298 K.
The results show that as the amount of silica increases the % E extraction increases as the sites of
interaction (amino active sites) in the material increase until saturation occurs. It is concluded that
between 0.08 to 0.10 g are the optimum mass to be used for almost complete removal of aspirin from
water
3.15.2 Effect of pH of the aqueous solution on the removal of aspirin by Sil-NH2
at 298 K
Fig. 3.46 (plot of % E vs the pH of the aqueous solution of aspirin) shows that no extraction of aspirin
occurs at low pH given that the amino group is protonated therefore unable to remove the drug from
water. As the pH increases the % E increases substantially and at pH ≈ 4 almost 100% of aspirin is
removed from water due to the change of the acidic pharmaceutical to the ionic form which can be
interacted with the amino group. In other words the acidic materials with low pKa value will leads to
rise the number of ions in solution and as a result the percentage of extraction will increased.
0
25
50
75
100
0 0.02 0.04 0.06 0.08 0.1
%
E
Mass of Sil-NH2 g
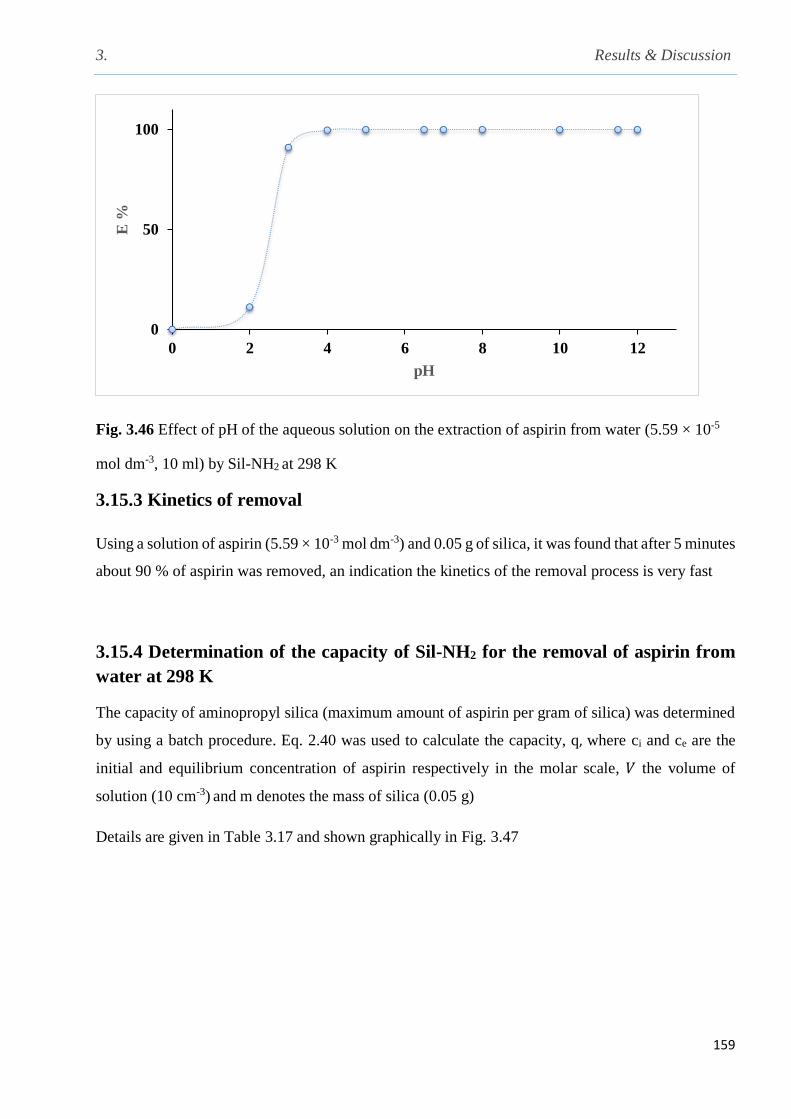
3. Results & Discussion
159
Fig. 3.46 Effect of pH of the aqueous solution on the extraction of aspirin from water (5.59 × 10⁻⁵
mol dm-3, 10 ml) by Sil-NH2 at 298 K
3.15.3 Kinetics of removal
Using a solution of aspirin (5.59 × 10⁻³ mol dm-3) and 0.05 g of silica, it was found that after 5 minutes
about 90 % of aspirin was removed, an indication the kinetics of the removal process is very fast
3.15.4 Determination of the capacity of Sil-NH2 for the removal of aspirin from
water at 298 K
The capacity of aminopropyl silica (maximum amount of aspirin per gram of silica) was determined
by using a batch procedure. Eq. 2.40 was used to calculate the capacity, q, where ci and ce are the
initial and equilibrium concentration of aspirin respectively in the molar scale, 𝑉 the volume of
solution (10 cm-3) and m denotes the mass of silica (0.05 g)
Details are given in Table 3.17 and shown graphically in Fig. 3.47
0
50
100
0 2 4 6 8 10 12
E %
pH

3. Results & Discussion
160
Table 3.17 Initial, equilibrium concentration and the capacity of silica to remove aspirin from water
[Ci] mol dm-3 [Ceq] mol dm-3
q / mmol g-1
1.12× 10⁻³ 8.59 × 10⁻⁷ 0.23
2.24× 10 -3 3.17×10⁻⁶ 0.43
3.36×10 -3 1.39×10⁻⁴ 0.64
4.48× 10⁻³ 3.98×10⁻⁴ 0.81
5.59× 10⁻³ 7.08×10⁻⁴ 0.97
6.70× 10 -3 9.66×10⁻⁴ 1.14
7.80×10 -3 1.32×10⁻³ 1.29
8.95×10⁻³ 2.58×10⁻³ 1.27
1.00×10 -2 3.66×10⁻³ 1.27
Fig. 3.47 Capacity of Sil-NH2 to uptake aspirine from aqueous solution at 298 K
From Table 3.25, it can be concluded that the capacity, q, of 3-aminopropyl-functionalised silica gel
to remove aspirin from aqueous solution is 1.27 mmol g-1. The results are striking and indicate that
the aminopropyl silica is an efficient material for the removal of aspirin from water to an extent that
its capacity to remove this drug from water is much higher than the capacity of CA-(NH2)2 to remove
clofibric acid from water. Experimental work on the use of aminopropyl silica to remove clofibric
acid, diclofenac is now undergoing in the Thermochemistry Laboratory. Despite that the 3-
aminopropyl functionalised silica is effective to remove aspirin and might be effective to remove
some of acidic pharmaceuticals but the removal process is relying only on the acid-base reactions
0
0.4
0.8
1.2
0.00E+00 1.00E-03 2.00E-03 3.00E-03 4.00E-03
q m
mol
g-1
Ce mol dm-3

3. Results & Discussion
161
which can make the removal process not efficient in real water samples due to the presence of many
of acidic and basic pollutants. Also, most of the manufactured drugs are hydrophobic in order to
interact with the cell membrane which can diminish the use of silica as receptor for these pollutants
due to the hydrophilicity of silica. On the other side, the CA-(NH2)2 has its own special features such
as the high hydrophobicity, can be modified, recycled easier than silica and also can be applied as
drug carrier in drug delivery system due to the presence af amino group which is found in the structure
of the amino acids which are the main component in living systems
Preliminary experiments were carried out to assess the interaction of C-decylpyrogallol[4]arene,
PG11, and carbamazepine, CBZ, and this is discussed in the following section
3.16 Complexation of C-decylpyrogallol[4]arene with carbamazepine
The complexation process has been carried out by 1H NMR in acetonitrile. It’s found that the
macrocyclic receptor has affinity to complex with the carbamazepine and therefore the effect of the
complexation process on the thermal behaviour of the drug will be discussed
3.16.1 Investigation of the complexation of PG11 and CBZ by thermal analysis
Thermal studies TG, DTG and DSC analysis have been carried out to investigate whether or not
PG11 interacts with CBZ and if so, to investigate the effect of complexation on the physico-chemical
properties of the drug. The CBZ was heated from 25 to 200 °C at 10 K/ min to detect the melting
process, followed by cooling down at the same temperature range, in order to observe the drug
crystallization. TGA analysis for the complexation between CBZ and C-decylpyrogallol[4]arene
confirmed that the complexation process was implemented successfully, the comparison between the
TGA thermograms obtained for the pure compounds (Fig. 3.48-3.49) and the complex formed (Fig.
3. 50). Also, the DSC thermograms obtained for the pure compounds and the complex gives strong
support that the complex is formed and this can be interpreted as follows, for the pure CBZ, the
endothermic peak at 169.33 °C with the heat of 7.788 Jg-1 reflects the amorphous character of the
drug and also can give information about the effect of the temperature on the structure. Another peak
existed at 192.38 °C with a heat of fusion 90.75 Jg-1 which indicates the melting point of the drug.
On cooling, an exothermic peak is observed at 170.42°C which indicates the conversion of the melted
material to its solid state but the difference between these two peaks revealed that the phase transition
from stable state to another occurred which means that the heat delivered to the drug induces phase
transitions causing variations in the locations of the molecules to a new location in the molecular
system. The thermogram of the free receptor heated from 25 °C to 250 °C to detect the melting point

3. Results & Discussion
162
of the receptor was followed by cooling at the same temperature in order to investigate the
crystallisation. The thermogram shows a broad peak at 142.65 °C which indicates the melting point
of the host with the heat of fusion -42.23 Jg-1 and the broadening may attribute to the residual of the
solvent used in the crystallization due to the depth of the cavity formed. There is no phase transition
between two phases resulted from the heat delivered to the sample because of the rigidity of the
macrocyclic host resulting from the presence of four benzene rings and the hydrgen bonding between
these rings that can prevent the rotation and traslocation to another state which means that the
compound has ability to work as a molecular store241. Completely different thermogram was obtained
for the complex compared with the free host and guest as shown in Fig. 3. 36. The curve indicated
that conformational changes in the receptor structure occurred which means that the complexation
process led to defects in the molecular structure of the host and the guest and this is essential to
promote the complexation process. This was reflected by the appearance of five signals in the DSC
thermogram, and also the possibility of the macrocycle to be sufficiently flexible to achieve the
complexation process which can lead to promote phase transition in the host structure. There are three
endothermic peaks shifted from their free form. TG and DTG analysis of the pure compounds and
the complex were carried out at the range of ambient temperature to 800 °C with a temperature
increase rate 10°C/minute in a nitrogen gas atmosphere
Fig. 3.48 TGA thermogram for the C-decylpyrogallol[4]arene receptor
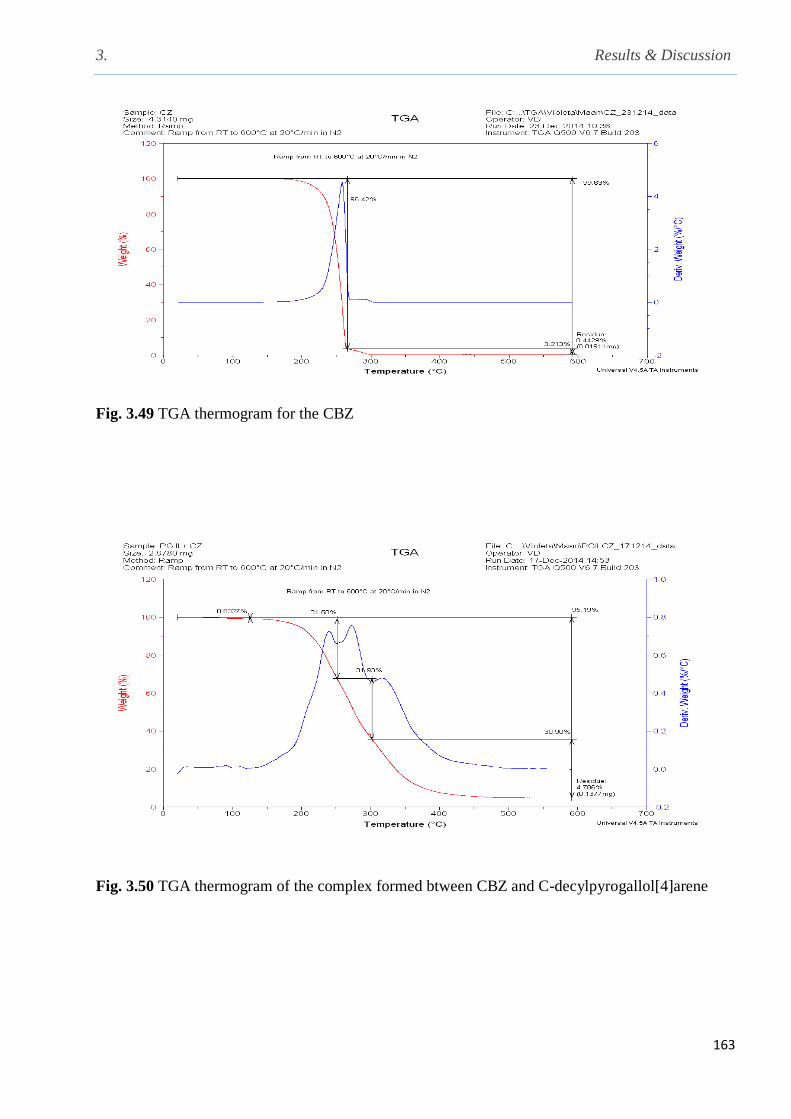
3. Results & Discussion
163
Fig. 3.49 TGA thermogram for the CBZ
Fig. 3.50 TGA thermogram of the complex formed btween CBZ and C-decylpyrogallol[4]arene

3. Results & Discussion
164
Fig. 3.51 DSC thermogram for the carbamazepine showing structural phase transition
Fig. 3.52 DSC thermogram for C-decypyrogallol[4]arene

3. Results & Discussion
165
Fig. 3.53 DSC thermogram for the complex formed between C-decylpyrogallol[4]arene and CBZ

4. Results & Discussion
166
Chapter IV
Results &
Discussion

4. Results & Discussion
167
4.1 Meso-tetramethyl-tetrakis-(4-hydroxyphenyl ethyl)calix[4]pyrrole TTHCP
and meso-tetramethyl-tetrakis-(4-ethylacetatophenoxyethyl) calix[4] pyrrole
TTCP
Here we engineered, synthesised and characterised two novel derivatives based on calix[4]pyrrole.
Both of them are characterised by a deep cavity with multiple functional groups and also multiple
walls and these are first produced using a new procedure. The real progress achieved with this
synthesis is that all of the calix[4]pyrrole derivatives synthesised earlier rely on the addition of phenol
groups to the meso position without a pendant arm211 like these two novel receptors. The addition of
ethylene groups in the pendant arms could have an effect on the flexibility of the receptors to drive
the interaction with different guests which is essential to give freedom for the conformational changes
required in the complexation process. Also the presence of phenol ring inspired the polymerisation.
In addition to these unique behaviour of the new receptors, the addition of ester groups is very
important to increase the solubility of the receptor in different solvents. The receptor containing ester
groups can act as a ditopic ion-pair receptor and may have an application as ion transporter through
the cell membrane due to the low toxicity of calix[4]pyrrole. The chemical structures for these
compounds are shown in Fig. 4.1
TTHCP TTECP
Fig. 4.1 Chemical structure of novel calix[4]pyrrole derivatives (a) meso-tetramethyl-tetrakis-[2(4-
hydroxyphenyl)ethyl]calix[4]pyrrole TTHCP and meso-tetramethyl-tetrakis-[2-(4-ethylacetato-
phenoxy)ethyl] calix[4]pyrrole TTECP
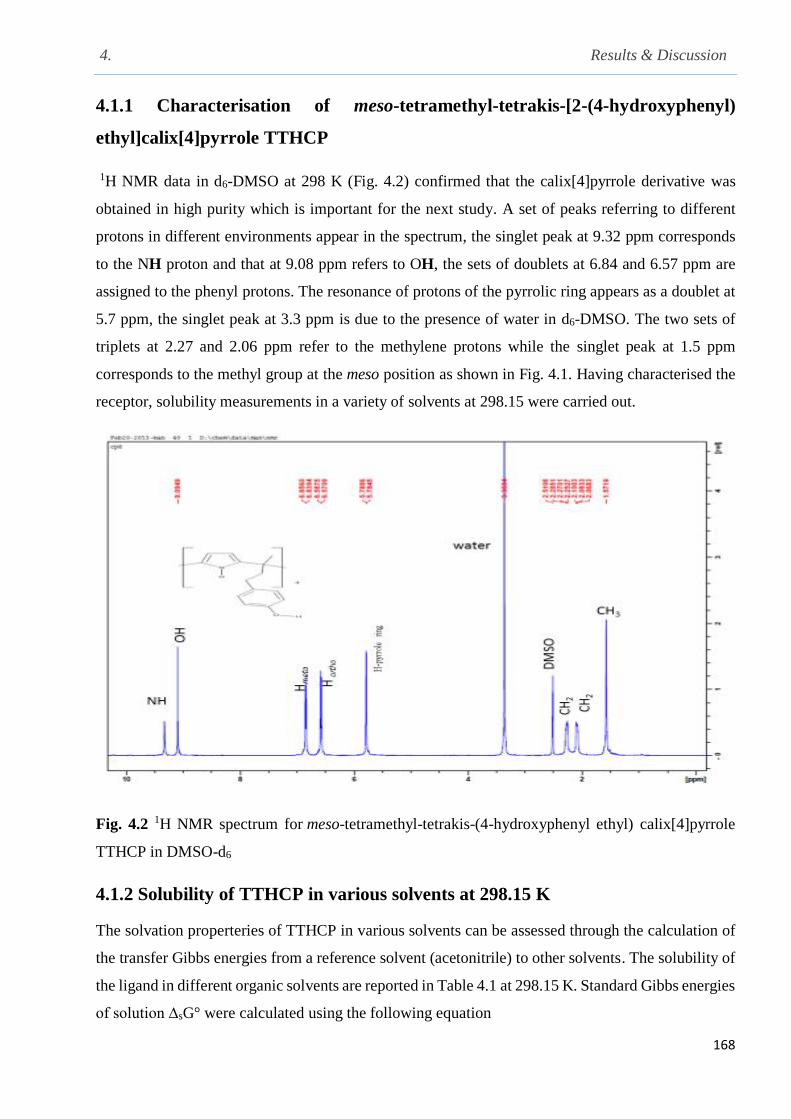
4. Results & Discussion
168
4.1.1 Characterisation of meso-tetramethyl-tetrakis-[2-(4-hydroxyphenyl)
ethyl]calix[4]pyrrole TTHCP
1H NMR data in d6-DMSO at 298 K (Fig. 4.2) confirmed that the calix[4]pyrrole derivative was
obtained in high purity which is important for the next study. A set of peaks referring to different
protons in different environments appear in the spectrum, the singlet peak at 9.32 ppm corresponds
to the NH proton and that at 9.08 ppm refers to OH, the sets of doublets at 6.84 and 6.57 ppm are
assigned to the phenyl protons. The resonance of protons of the pyrrolic ring appears as a doublet at
5.7 ppm, the singlet peak at 3.3 ppm is due to the presence of water in d6-DMSO. The two sets of
triplets at 2.27 and 2.06 ppm refer to the methylene protons while the singlet peak at 1.5 ppm
corresponds to the methyl group at the meso position as shown in Fig. 4.1. Having characterised the
receptor, solubility measurements in a variety of solvents at 298.15 were carried out.
Fig. 4.2 1H NMR spectrum for meso-tetramethyl-tetrakis-(4-hydroxyphenyl ethyl) calix[4]pyrrole
TTHCP in DMSO-d6
4.1.2 Solubility of TTHCP in various solvents at 298.15 K
The solvation properteries of TTHCP in various solvents can be assessed through the calculation of
the transfer Gibbs energies from a reference solvent (acetonitrile) to other solvents. The solubility of
the ligand in different organic solvents are reported in Table 4.1 at 298.15 K. Standard Gibbs energies
of solution ∆sG° were calculated using the following equation

4. Results & Discussion
169
Gº = RT ln Ks eq.4.1
∆tG° (TTHCP) (s1s2) = sG (TTHCP) (s2) sG (TTHCP) (s1) eq.4.2
In equation 4.1, K is the equilibrium constant which is equal to the ligand concentration in the
saturated solution on the assumption that the activity coefficient of a low concentration non-
electrolyte in solution is equal to unity. It is not possible to calculate the Gibbs energy of solution if
the ligand undergoes solvation as previously stated. The standard transfer Gibbs energy, ∆tG° was
calculated using acetonitrile as reference solvent as shown in Table 4.1
Table 4.1 Solubility data and derived standard Gibbs energies of solution of TTHCP in different
solvents at 298.15 K. Transfer Gibbs energies from acetonitrile to other solvents is (∆tG°MeCNs2) at
298.15 K
Solvent Solubility mol dm-3 ∆sG° / kJ mol-1 ∆tG°MeCNs2 / kJ mol1
H2O Not soluble ---------- -----------
MeCN (1.3 ±0.1) × 10-3 16.5 ± 0.6 0.00
MeOH (2.1 ± 0.4) × 10-4 21.0 ± 2 4.5
EtOH (1.8 ± 0.3) × 10-4 21.4 ± 1.7 4.5
DMSO (2.0 ± 0.2) × 10-2 10 ± 1 6.5
DMF (3.4±0.3) × 10-2 8 ± 1.7 8.5
Hexane Not soluble --------- ----------
Chloroform Not soluble --------- ----------
CH2Cl2 Not soluble ---------- ----------
Acetone (14 ±0.1) × 10-3 14.3 ± 0.6 2.2
From the standard transfer Gibbs energy of the receptor from acetonitrile (Table 4.1) it can be shown
that among dipolar aprotic solvents, the receptor is better solvated in DMF, DMSO and acetone that
acetonitrile. It was previously reported by Danil de Namor and Shehab that DMSO and DMF interact
with the -NH- functionality of the pyrrole rings of the macrocycle through their basic oxygen atoms.
As far as the alcohols are concerned, these are poor solvators of the ligand relative to acetonitrile as
reflected in their transfer Gibbs energies (unfavourable)

4. Results & Discussion
170
4.1.3 Complexation of TTHCP with anions, 1H NMR studies
1H NMR experiments reveal that the receptor interacts significantly with the fluoride anion F (Fig.
4.3, Table 4.2) and the dihydrogen phosphate (Fig. 4.4, Table 4.2). In fact, the strong downfield shift
change of the –NH- proton with the fluoride anion is much greater than that for the phosphate anion
in this solvent. The result obtained for the OH proton indicates that interaction may take place with
this proton. It is also shown for the phosphate anion that some interaction with the phenyl proton
occurs.
1H NMR experiments have revealed that the receptor complexed significantly with the fluoride and
H2PO4 anions and there is significant contribution for the phenolic hydroxyl group and through the
pyrrolic NH functional group with the complexation of these anions (Fig. 4.3).
Fig. 4.3 1 H NMR spectrum of TTHCP and its fluoride complex (Bu4N+ as counter ion) in DMSO-d6
at 298 K.
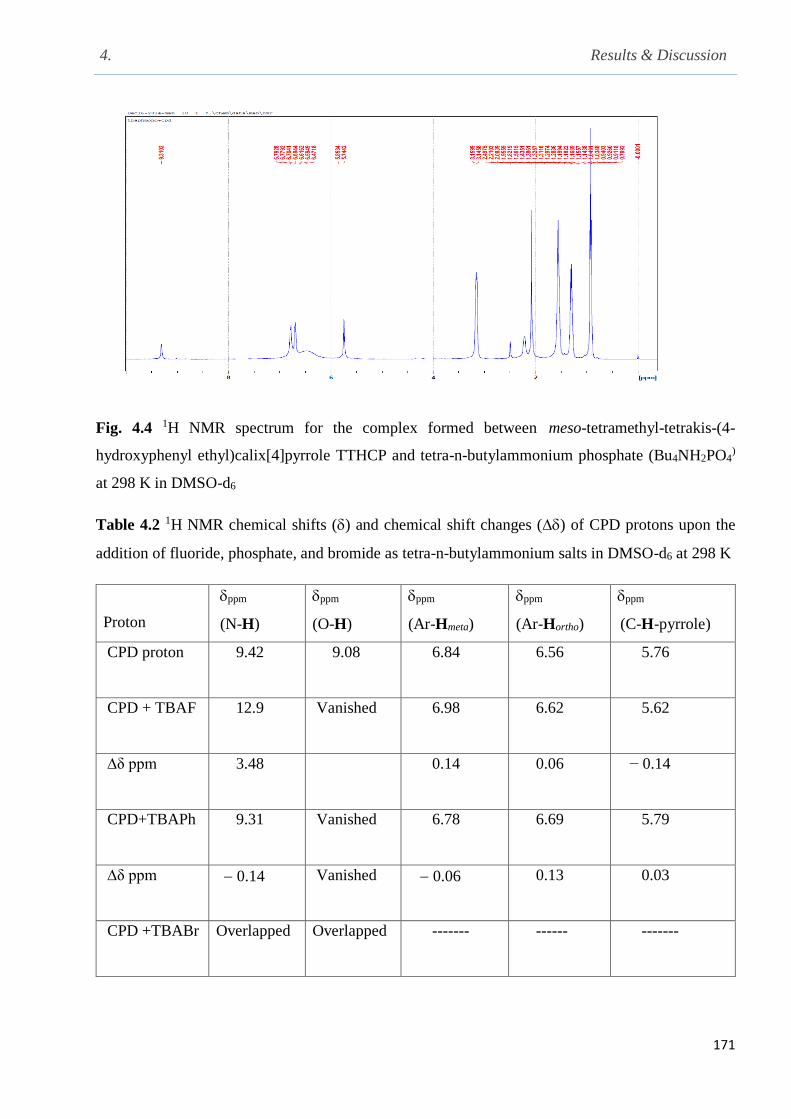
4. Results & Discussion
171
Fig. 4.4 1H NMR spectrum for the complex formed between meso-tetramethyl-tetrakis-(4-
hydroxyphenyl ethyl)calix[4]pyrrole TTHCP and tetra-n-butylammonium phosphate (Bu4NH2PO4)
at 298 K in DMSO-d6
Table 4.2 1H NMR chemical shifts () and chemical shift changes () of CPD protons upon the
addition of fluoride, phosphate, and bromide as tetra-n-butylammonium salts in DMSO-d6 at 298 K
Proton
ppm
(N-H)
ppm
(O-H)
ppm
(Ar-Hmeta)
ppm
(Ar-Hortho)
ppm
(C-H-pyrrole)
CPD proton 9.42 9.08 6.84 6.56 5.76
CPD + TBAF 12.9 Vanished 6.98 6.62 5.62
∆δ ppm 3.48 0.14 0.06 − 0.14
CPD+TBAPh 9.31 Vanished 6.78 6.69 5.79
∆δ ppm 0.14 Vanished 0.06 0.13 0.03
CPD +TBABr Overlapped Overlapped ------- ------ -------

4. Results & Discussion
172
Following 1H NMR studies on the interaction of TTHCP and the anions in DMSO-d6, conductance
measurements were carried out in order to identify the composition of the complex. For comparison
purposes with other calix[4]arene receptors, acetonitrile was used as the solvent for conductance and
thermodynamic studies
4.2 Conductometric titration of anion salts with TTHCP in MeCN at 298.15 K
Given that the 1H NMR studies were confirmed the complexation between TTHCP and anions,
further investigations were carried out by using conductometric measurements and it will be
discussed next
4.2.1 Conductance measurements of meso-tetramethyl-tetrakis-(4-
hydroxyphenyl ethyl)calix[4]pyrrole TTHCP with fluoride (tetra-n-
butylammonium as counter ion) in acetonitrile at 298.15 K
The main goal of the conductance measurements is to corroborate further the interaction between the
calix[4]pyrrole derivative and the fluoride anion and to identify the stoichiometry of the interaction.
As shown in Fig. 4.5 (plot of the molar conductance Λm (S cm2 mol-1) against [receptor]/ [anion]
concentration ratio (Table 4.3-Appendix), the molar conductance decreases significantly upon
addition of the receptor (A to B) until the ratio reaches a value of 0.5, at this point all the fluoride
anions in the solution were consumed indicating the formation of a 1 [receptor]: 2 [F] complex
[TTHCPF2]2 (eq.4.3)
[TTHCP] (MeCN) + 2 F (MeCN) ⇌ [TTHCPF2]2 (MeCN) eq.4.3
The decrease in conductance is attributed to the size of the complex relative to the free anion. Further
addition of the receptor leads to a break in the conductance (B to C) at a [receptor]/ [anion]
concentration ratio of unity which may attributed to the transfer of one fluoride anion to the free
receptor as shown in the following equation
[TTHCPF2]2− (MeCN) + TTHCP (MeCN) ⇌ 2 [TTHCPF] (MeCN) eq.4.4
From C to D the molar conductance does not change significantly
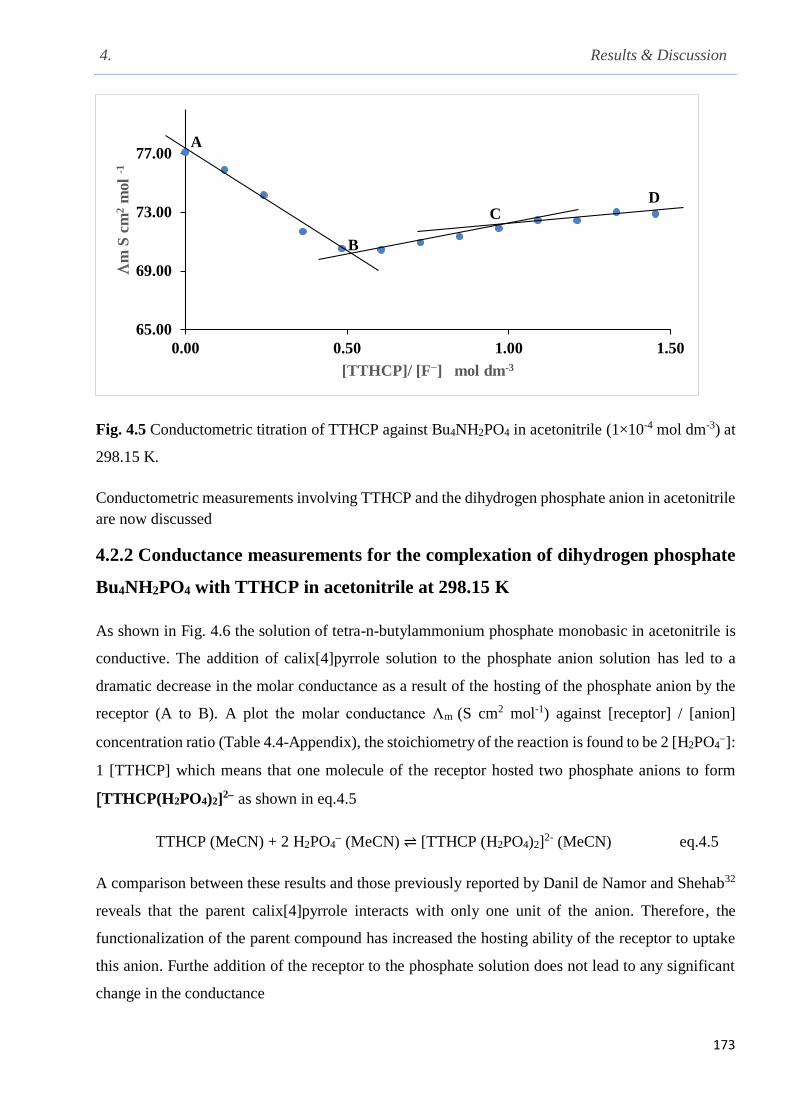
4. Results & Discussion
173
Fig. 4.5 Conductometric titration of TTHCP against Bu4NH2PO4 in acetonitrile (1×10⁻⁴ mol dm-3) at
298.15 K.
Conductometric measurements involving TTHCP and the dihydrogen phosphate anion in acetonitrile
are now discussed
4.2.2 Conductance measurements for the complexation of dihydrogen phosphate
Bu4NH2PO4 with TTHCP in acetonitrile at 298.15 K
As shown in Fig. 4.6 the solution of tetra-n-butylammonium phosphate monobasic in acetonitrile is
conductive. The addition of calix[4]pyrrole solution to the phosphate anion solution has led to a
dramatic decrease in the molar conductance as a result of the hosting of the phosphate anion by the
receptor (A to B). A plot the molar conductance Λm (S cm2 mol-1) against [receptor] / [anion]
concentration ratio (Table 4.4-Appendix), the stoichiometry of the reaction is found to be 2 [H2PO4]:
1 [TTHCP] which means that one molecule of the receptor hosted two phosphate anions to form
[TTHCP(H2PO4)2]2 as shown in eq.4.5
TTHCP (MeCN) + 2 H2PO4 (MeCN) ⇌ [TTHCP (H2PO4)2]
2- (MeCN) eq.4.5
A comparison between these results and those previously reported by Danil de Namor and Shehab32
reveals that the parent calix[4]pyrrole interacts with only one unit of the anion. Therefore, the
functionalization of the parent compound has increased the hosting ability of the receptor to uptake
this anion. Furthe addition of the receptor to the phosphate solution does not lead to any significant
change in the conductance
65.00
69.00
73.00
77.00
0.00 0.50 1.00 1.50
m
S c
m2
mol
-1
[TTHCP]/ [F−] mol dm-3
A
B
CD

4. Results & Discussion
174
Fig. 4.6 Conductivity titration between TTHCP and tetrabutylammonium phosphate (Bu4NH2PO4)
in acetonitrile at 298.15 K, [Bu4NH2PO4] = 9.4×10⁻⁵ mol dm-3.
The following section reports the thermodynamic studies on the complexation of this receptor
TTHCP with the halides and phosphate anions (as tetra-n-butyl ammonium counter ion) by the use
of titration calorimetry
4.3 Thermodynamic parameters for the complexation of TTHCP with fluoride
and phosphate anions (tetra-n-butylammonium counter ion) in acetonitrile at
298.15 K
The isothermal titration calorimetry was used to investigate the thermodynamic parameters of the
complexation proceeses between the macrocyclic receptor with fluoride and phosphate anions (tetra-
n-butylammonium counter ion) in acetonitrile. The Nano-ITC cell was loaded with the receptor
solution in acetonitrile (1 × 10⁻³ mol dm-3) and the injection syringe with the guest solution (fluoride
or phosphate as tetra-n-butylammonium counter ion) in acetonitrile and the instrument was
programmed to inject the guest solution (5.14 l) every three minutes. It seems from the
thermodynamic data in Fig. 4.7 for fluoride and Fig. 4.8 for H2PO4 that the receptor has high affinity
to interact with these anions (phosphate and fluoride) and stable complexes are formed with high
stability constants as shown in Table 4.3 with stoichiometric ratios of 2: 1 guest: host. The high
hosting ability of the receptor for these anions may be attributed to the flexibility of the receptor and
the depth of the cavity.
100
120
140
160
0 0.25 0.5 0.75 1 1.25
Λm
S c
m2
mol
-1
[TTHCP]/ [H2PO4] mol dm-3
A
BC
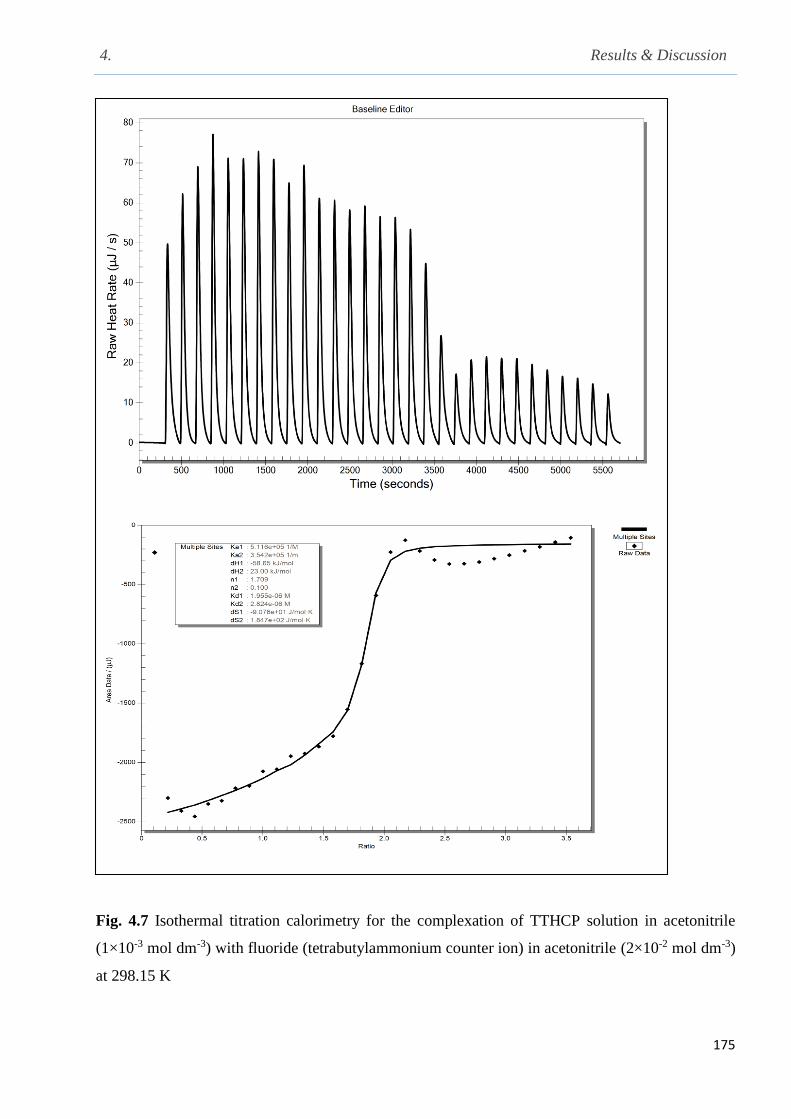
4. Results & Discussion
175
Fig. 4.7 Isothermal titration calorimetry for the complexation of TTHCP solution in acetonitrile
(1×10⁻³ mol dm-3) with fluoride (tetrabutylammonium counter ion) in acetonitrile (2×10⁻² mol dm-3)
at 298.15 K
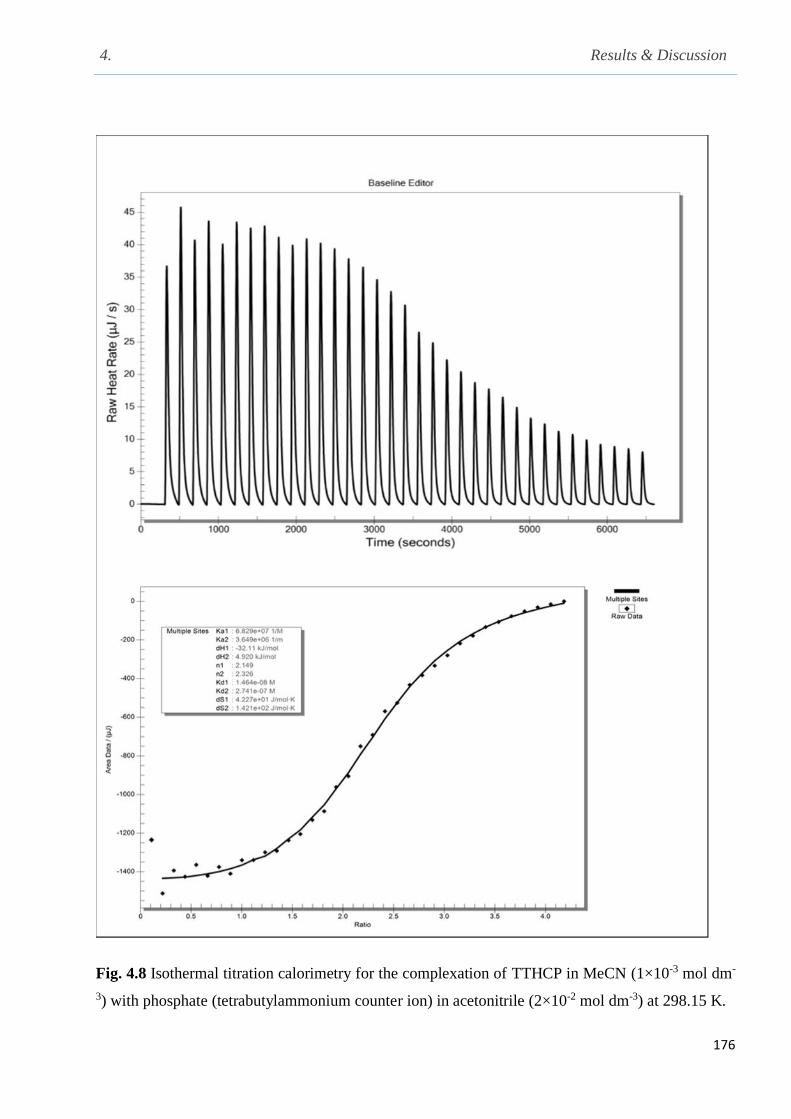
4. Results & Discussion
176
Fig. 4.8 Isothermal titration calorimetry for the complexation of TTHCP in MeCN (1×10⁻³ mol dm-
3) with phosphate (tetrabutylammonium counter ion) in acetonitrile (2×10⁻² mol dm-3) at 298.15 K.
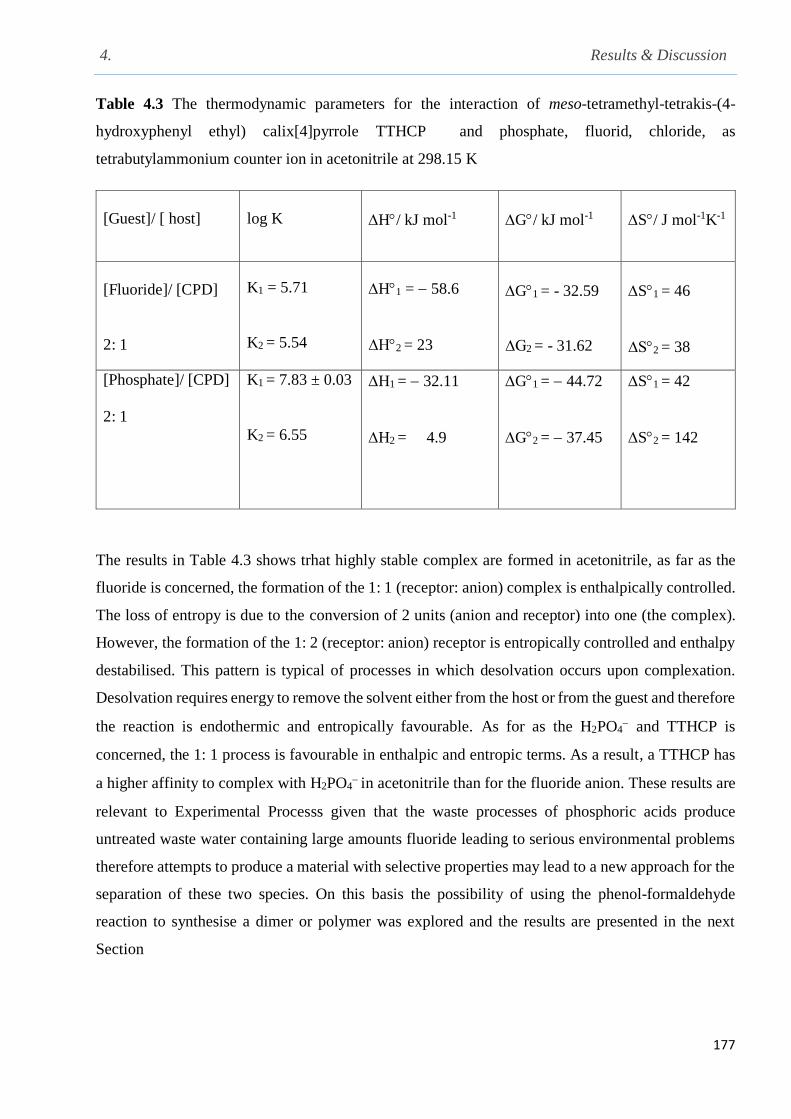
4. Results & Discussion
177
Table 4.3 The thermodynamic parameters for the interaction of meso-tetramethyl-tetrakis-(4-
hydroxyphenyl ethyl) calix[4]pyrrole TTHCP and phosphate, fluorid, chloride, as
tetrabutylammonium counter ion in acetonitrile at 298.15 K
[Guest]/ [ host]
log K
H/ kJ mol-1
G/ kJ mol-1
S/ J mol-1K-1
[Fluoride]/ [CPD]
2: 1
K1 = 5.71
K2 = 5.54
H1 = 58.6
∆H2 = 23
G1 = - 32.59
∆G2 = - 31.62
S1 = 46
∆S2 = 38
[Phosphate]/ [CPD]
2: 1
K1 = 7.83 ± 0.03
K2 = 6.55
H1 = 32.11
H2 = 4.9
G1 = 44.72
G2 = 37.45
S1 = 42
S2 = 142
The results in Table 4.3 shows trhat highly stable complex are formed in acetonitrile, as far as the
fluoride is concerned, the formation of the 1: 1 (receptor: anion) complex is enthalpically controlled.
The loss of entropy is due to the conversion of 2 units (anion and receptor) into one (the complex).
However, the formation of the 1: 2 (receptor: anion) receptor is entropically controlled and enthalpy
destabilised. This pattern is typical of processes in which desolvation occurs upon complexation.
Desolvation requires energy to remove the solvent either from the host or from the guest and therefore
the reaction is endothermic and entropically favourable. As for as the H2PO4 and TTHCP is
concerned, the 1: 1 process is favourable in enthalpic and entropic terms. As a result, a TTHCP has
a higher affinity to complex with H2PO4 in acetonitrile than for the fluoride anion. These results are
relevant to Experimental Processs given that the waste processes of phosphoric acids produce
untreated waste water containing large amounts fluoride leading to serious environmental problems
therefore attempts to produce a material with selective properties may lead to a new approach for the
separation of these two species. On this basis the possibility of using the phenol-formaldehyde
reaction to synthesise a dimer or polymer was explored and the results are presented in the next
Section

4. Results & Discussion
178
4.4 Polymerisation of meso-tetramethyl-tetrakis-(4-hydroxyphenyl ethyl)
calix[4]pyrrole TTECP
The phenol-formaldehyde polymerisation is a well known reaction in Chemistry since over a century
ago. Here the polymerisation of the calix[4]pyrrole derivative containing phenolic hydroxyl groups
was polymerised in acidic media. FTIR and SEM (Fig. 4.9) analysis provide further addition to the
experimental evidence like the change in color, solubility and the viscosity which confirmed the
formation of the polymer. The polymer formed is not soluble in any organic solvent. It has a high
porosity according to the SEM and the BET analysis. The difference between the FTIR spectra for
the monomer and the polymer is a further evidence for the formation of the polymer, disappearance
of the C-H stretching of the hydrogen neighbour to the hydroxyl of the phnolic ring is the remarkable
difference between the two IR spectrums. As shown from XR-ray diffraction analysis (Fig. 4.10)
results obtained also confirmed the porosity of the polymer. EDX and the microanalysis confirmed
that the carbon C, hydrogen H and the nitrogen N, are the main elements in the polymer skeleton. It
is found that the polymer formed contain sulphur Fig. 4.11 in addition to the main elements and this
due to the use of sulphuric acid as a catalyst in the synthesis of the polymer and the presence of the
catalyst as a polutant with the polymer formed is considered an ordinary case due to the porosity of
the polymer. The results obtained from BET analysis confirmed that the obtained polymer is porous
with a surface area = 0.9 0.1 m2 gm and the physico-chemical proterties are shown in Table 4.4
Fig. 4.9 SEM analysis for the polymer formed showing the porosity of the structure in different
regions a, b and c.
a b c

4. Results & Discussion
179
Fig. 4.10 Shows the X-Ray diffractogram of the sample. It is characteristic of an amorphous
compound with little or no crystal structure
Fig. 4.11 EDS spectrum for the polymer formed
0
50
100
150
200
250
5 15 25 35 45 55 65 75 85
cou
nts
/ a
rb
itrary
un
its
2 / degrees
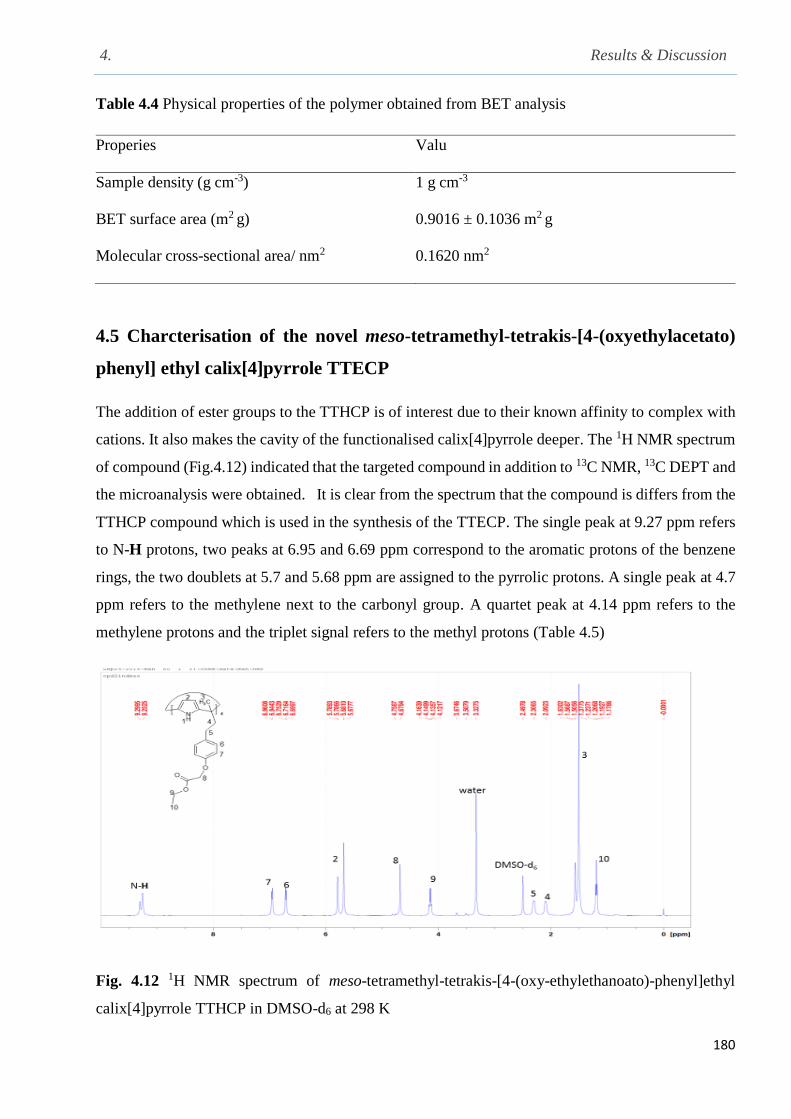
4. Results & Discussion
180
Table 4.4 Physical properties of the polymer obtained from BET analysis
Properies
Valu
Sample density (g cm-3)
1 g cm-3
BET surface area (m2 g) 0.9016 ± 0.1036 m2 g
Molecular cross-sectional area/ nm2 0.1620 nm2
4.5 Charcterisation of the novel meso-tetramethyl-tetrakis-[4-(oxyethylacetato)
phenyl] ethyl calix[4]pyrrole TTECP
The addition of ester groups to the TTHCP is of interest due to their known affinity to complex with
cations. It also makes the cavity of the functionalised calix[4]pyrrole deeper. The 1H NMR spectrum
of compound (Fig.4.12) indicated that the targeted compound in addition to 13C NMR, 13C DEPT and
the microanalysis were obtained. It is clear from the spectrum that the compound is differs from the
TTHCP compound which is used in the synthesis of the TTECP. The single peak at 9.27 ppm refers
to N-H protons, two peaks at 6.95 and 6.69 ppm correspond to the aromatic protons of the benzene
rings, the two doublets at 5.7 and 5.68 ppm are assigned to the pyrrolic protons. A single peak at 4.7
ppm refers to the methylene next to the carbonyl group. A quartet peak at 4.14 ppm refers to the
methylene protons and the triplet signal refers to the methyl protons (Table 4.5)
Fig. 4.12 1H NMR spectrum of meso-tetramethyl-tetrakis-[4-(oxy-ethylethanoato)-phenyl]ethyl
calix[4]pyrrole TTHCP in DMSO-d6 at 298 K
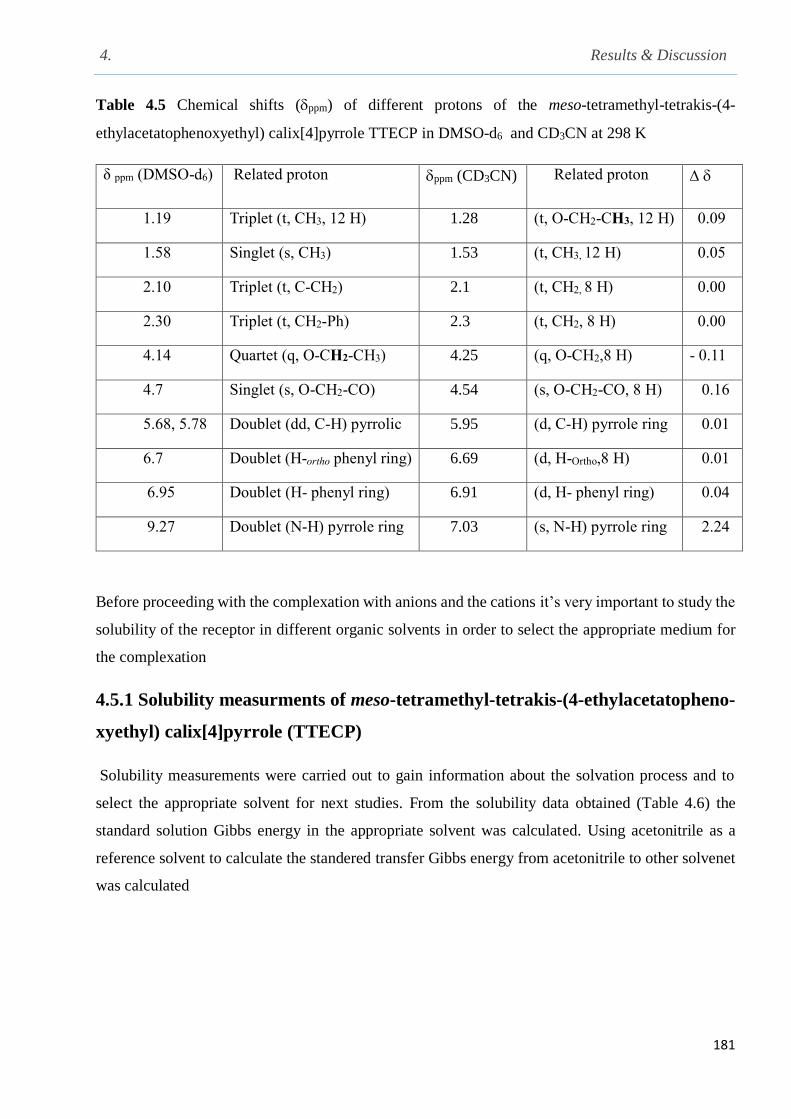
4. Results & Discussion
181
Table 4.5 Chemical shifts (ppm) of different protons of the meso-tetramethyl-tetrakis-(4-
ethylacetatophenoxyethyl) calix[4]pyrrole TTECP in DMSO-d6 and CD3CN at 298 K
δ ppm (DMSO-d6)
Related proton ppm (CD3CN)
Related proton
1.19 Triplet (t, CH3, 12 H) 1.28 (t, O-CH2-CH3, 12 H) 0.09
1.58 Singlet (s, CH3) 1.53 (t, CH3, 12 H) 0.05
2.10 Triplet (t, C-CH2) 2.1 (t, CH2, 8 H) 0.00
2.30 Triplet (t, CH2-Ph) 2.3 (t, CH2, 8 H) 0.00
4.14 Quartet (q, O-CH2-CH3) 4.25 (q, O-CH2,8 H) - 0.11
4.7 Singlet (s, O-CH2-CO) 4.54 (s, O-CH2-CO, 8 H) 0.16
5.68, 5.78 Doublet (dd, C-H) pyrrolic 5.95 (d, C-H) pyrrole ring 0.01
6.7 Doublet (H-ortho phenyl ring) 6.69 (d, H-Ortho,8 H) 0.01
6.95 Doublet (H- phenyl ring) 6.91 (d, H- phenyl ring) 0.04
9.27 Doublet (N-H) pyrrole ring 7.03 (s, N-H) pyrrole ring 2.24
Before proceeding with the complexation with anions and the cations it’s very important to study the
solubility of the receptor in different organic solvents in order to select the appropriate medium for
the complexation
4.5.1 Solubility measurments of meso-tetramethyl-tetrakis-(4-ethylacetatopheno-
xyethyl) calix[4]pyrrole (TTECP)
Solubility measurements were carried out to gain information about the solvation process and to
select the appropriate solvent for next studies. From the solubility data obtained (Table 4.6) the
standard solution Gibbs energy in the appropriate solvent was calculated. Using acetonitrile as a
reference solvent to calculate the standered transfer Gibbs energy from acetonitrile to other solvenet
was calculated

4. Results & Discussion
182
Table 4.6 Solubility data for TTECP in different solvents at 298.15
Solvent Solubility (mol dm-3) ∆sG° (kJ mol-1) ∆tG°s1s2 (kJ mol-1)
H2O Not soluble ------------- -----------
MeCN (1.1 ± 0.1) × 10-2 11.1±0.6 0.00
MeOH (4.5 ± 0.4) × 10-3 13±2 1.90
EtOH (4 ± 0.2) × 10-3 14±1 2.90
DMSO solvation ------------ -----------
DMF solvation ------------ -----------
The results show that TTECP is better solvated in acetonitrile than in alcohols
4.6 1H NMR complexation studies
Chemical shift of the TTECP receptor and chemical shift changes by the addition of anion salts
(BU4N as counter-ion) are shown in Table 4.7. The results shown in this Table reflect the significant
chemical shift change observed by the addition of the fluoride salt to the receptor in a similar manner
to that abserved with the TTHCP receptor indicating that this anion interact with the –NH-protons of
the pyrrole rings. This is again not the case for the H2PO4anion which seems to interact with the
ester groups. A downfield shift is found in the aromatic protons.
Conductance measurements were carried out to identify the composition of the complex and these
are now discussed
Table 4.7 Chemical shifts (ppm) for the free calix[4pyrrole tetraester receptor TTECP and its
chemical shifts changes (ppm) as a result from complexation with the fluoride, phosphate, bromide
(as tetra-n-butylammonium salts counter ion) anions in acetonitrile at 298 K
Related proton ppm (N-H) δppm (Ar-Hmeta) δppm (Ar-Hortho) ppm (C-Hpyrrole)
Receptor proton
9.32 6.84 6.56 5.76
Rceptor + TBAF
∆δ ppm
13.2
3.78
6.7
− 0.14
6.52
− 0.04
5.46
− 0.03
Receptor + TBAPh
∆δ ppm
9.31
0.01
6.78
− 0.06
6.69
0.13
5.79
0.03
Recetor + TBABr
∆δ ppm
d (10.65)
1.33
7.4
0.56
6.74
0.18
5.67
− 0.8
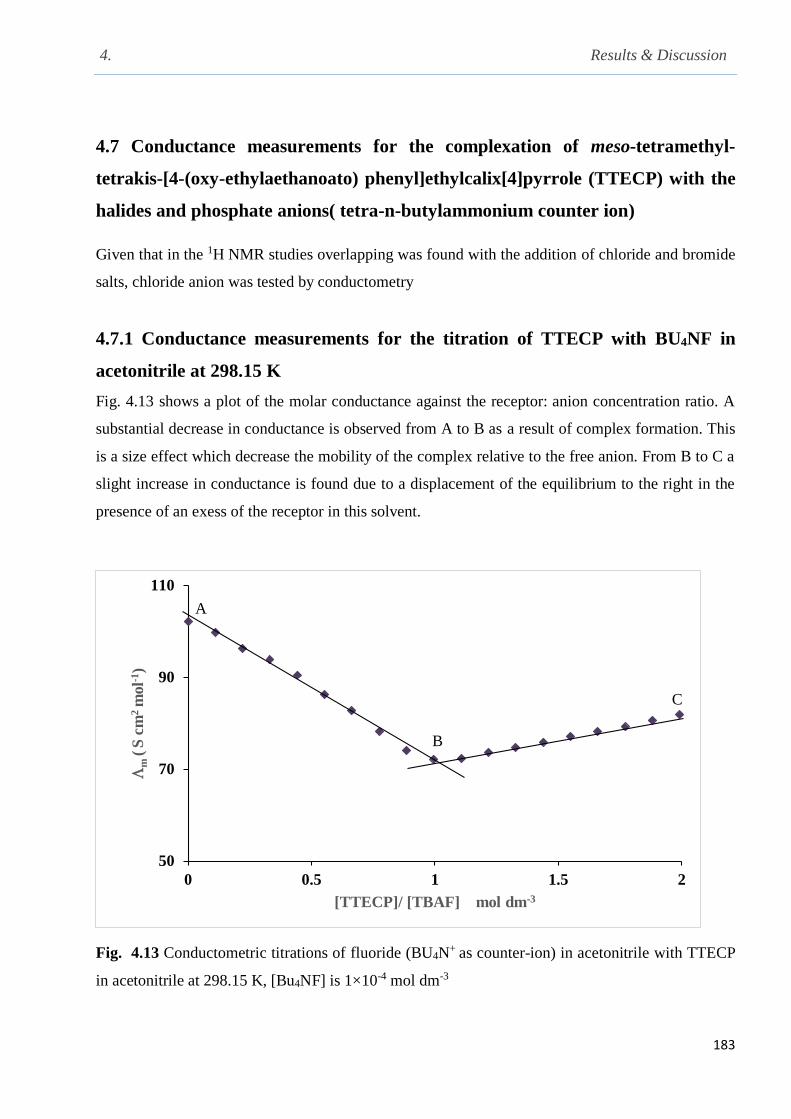
4. Results & Discussion
183
4.7 Conductance measurements for the complexation of meso-tetramethyl-
tetrakis-[4-(oxy-ethylaethanoato) phenyl]ethylcalix[4]pyrrole (TTECP) with the
halides and phosphate anions( tetra-n-butylammonium counter ion)
Given that in the 1H NMR studies overlapping was found with the addition of chloride and bromide
salts, chloride anion was tested by conductometry
4.7.1 Conductance measurements for the titration of TTECP with BU4NF in
acetonitrile at 298.15 K
Fig. 4.13 shows a plot of the molar conductance against the receptor: anion concentration ratio. A
substantial decrease in conductance is observed from A to B as a result of complex formation. This
is a size effect which decrease the mobility of the complex relative to the free anion. From B to C a
slight increase in conductance is found due to a displacement of the equilibrium to the right in the
presence of an exess of the receptor in this solvent.
Fig. 4.13 Conductometric titrations of fluoride (BU4N+ as counter-ion) in acetonitrile with TTECP
in acetonitrile at 298.15 K, [Bu4NF] is 1×10⁻⁴ mol dm-3
50
70
90
110
0 0.5 1 1.5 2
m
(S
cm
2 m
ol-1
)
[TTECP]/ [TBAF] mol dm-3
A
B
C
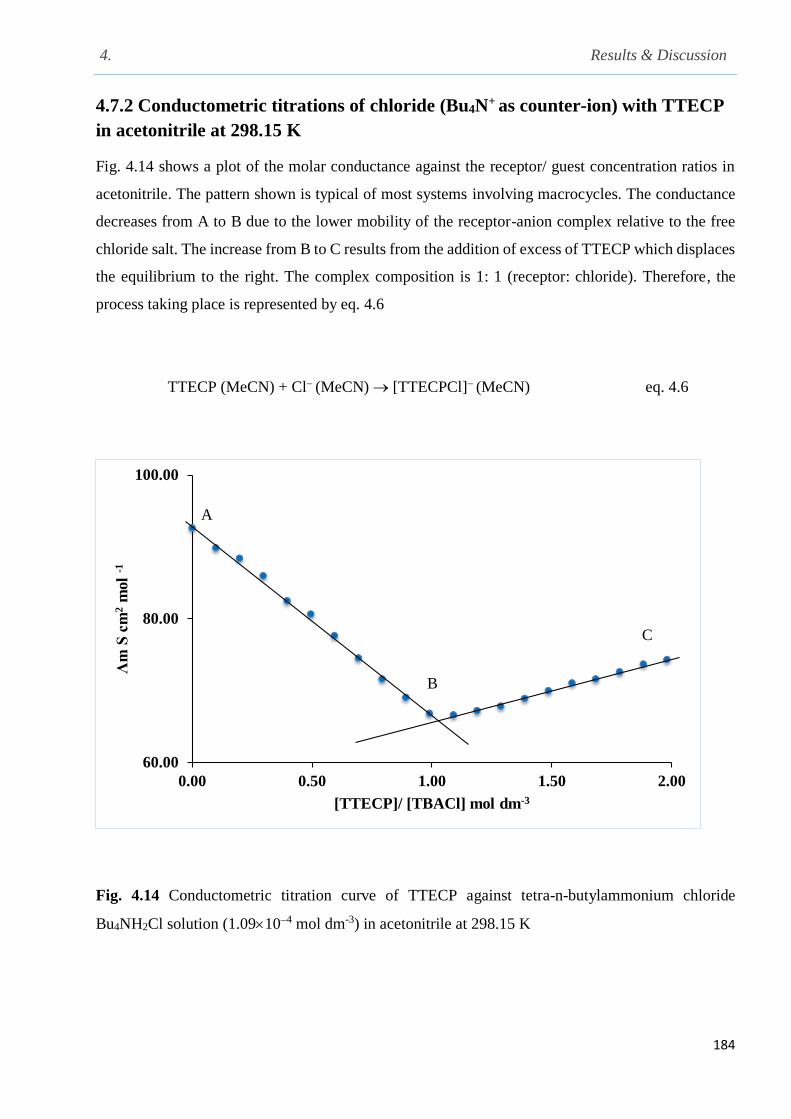
4. Results & Discussion
184
4.7.2 Conductometric titrations of chloride (Bu4N+ as counter-ion) with TTECP
in acetonitrile at 298.15 K
Fig. 4.14 shows a plot of the molar conductance against the receptor/ guest concentration ratios in
acetonitrile. The pattern shown is typical of most systems involving macrocycles. The conductance
decreases from A to B due to the lower mobility of the receptor-anion complex relative to the free
chloride salt. The increase from B to C results from the addition of excess of TTECP which displaces
the equilibrium to the right. The complex composition is 1: 1 (receptor: chloride). Therefore, the
process taking place is represented by eq. 4.6
TTECP (MeCN) + Cl (MeCN) [TTECPCl] (MeCN) eq. 4.6
Fig. 4.14 Conductometric titration curve of TTECP against tetra-n-butylammonium chloride
Bu4NH2Cl solution (1.09104 mol dm-3) in acetonitrile at 298.15 K
60.00
80.00
100.00
0.00 0.50 1.00 1.50 2.00
Λm
S c
m2
mol
-1
[TTECP]/ [TBACl] mol dm-3
A
B
C

4. Results & Discussion
185
4.7.3 Conductometric titration of tetra-n-butylammonium bromide (Bu4NBr)
with TTECP in acetonitrile at 298.15 K
It is clear from plot of changes in conductance values of Bu4NBr as a result from the addition of the
receptor solution TTECP in the same solvent (Fig. 4.15) that there is no significant change in
conductivity values which mean that the free receptor is unable to capture the bromide anions which
means that the coordination of bromide with Bu4N+ is more favourable than with the calix[4]pyrrole
derivative
Fig. 4.15 Conductometric titration of tetra-n-butylammonium bromide (1.48×10⁻⁴ mol dm-3) with
TTECP in acetonitrile at 298.15 K.
4.7.4 Conductometric titration of tetra-n-butylammonium phosphate
(Bu4NH2PO4) with TTECP in acetonitrile at 298.15 K
As shown in Fig.4.16, the sharp break in conductance is found at the [receptor]/ [H2PO4]
concentration ratio of 0.5 which means that two anions are taking up per unit of receptor as shown in
eq.4.7
80
85
90
95
100
105
0 0.2 0.4 0.6 0.8 1
m
S c
m2 m
ol-1
[TTEP]/Bu4NBr] mol dm-3

4. Results & Discussion
186
TTECP (MeCN) + 2 H2PO4 (MeCN) [TTECP (H2PO4)2]
2 (MeCN) eq.4.7
On the basis of the conductometric studies, the hosting ability of TTECP is greater for H2PO4 than
for F and Cl anions
Fig. 4.16 Molar conductance of Bu4NH2PO4 against the [TTECP]/ [H2PO4] in acetonitrile at 298.15
K, [Bu4NH2PO4] is 1×10⁻⁴ mol dm-3
4.7.5 Thermodynamic parameters of complexation of meso-tetramethyl-tetrakis-
[4-(ethylacetatophenoxyethyl)calix[4]pyrrole TTECP with fluoride, bromide and
anions (tetra-n-butylammonium as counter-ion) in acetonitrile at 298.15 K
Further investigations for the complexation of the TTECP with the halides and phosphate anions
(tetra-n-butylammonium salts) were carried out by using isothermal titration calorimetry in
acetonitrile at 298.15 K.
Titration calorimetry was the analytical method used to obtain the stability constant (expressed as log
Ks) and the enthalpy of complexation of TTECP and anions (F, Cl, Br and H2PO4) in acetonitrile
at 298.15 K. For this receptor the isothermal titration calorimeter was used. Thermograms for F, Cl,
Brand H2PO4
and their interaction with TTECP are shown in Figs. 4.17- 4.20 respectively. Stability
constants, standard Gibbs energies, enthalpies and entropies are listed in Table 4.8
85
90
95
0 0.25 0.5 0.75 1
Λm
S c
m2
mol
-1
[TTECP]/ [H2PO4] mol dm-3
A
B
C
4. Results & Discussion
187
As far as fluoride is concerned, the process is enthalpy and entropy favoured but enthalpy controlled.
The strength of complexation of this receptor with chloride is approximately the same. The data
suggest that TTECP is unable to recognise selectivity between these two anions. Again the process
is enthalpy controlled. However, the stability of the bromide complex is lower. The enthalpy and
entropy contribution are typical of most binding processes in that the loss of entropy results from the
combination of two species (host and guest) to give one unit of the complex. The process is enthalpy
controlled.
A different picture emerges with the complexation data involving the H2PO4 anion. Thus the
formation of the 1: 1 complex occurs with a gain in entropy, typical of processes in which strong
desolvation, either of the host or the guest or both takes place. It seems that the entropic and enthalpic
contribution to the stability of the complex is approximately the same. The entrance of a second anion
to the receptor to form the 1: 2 (receptor: anion) causes conformational changes to keep the two
anions as far apart as possible. This aspect and desolvation may be the roots of the high entropic
contribution observed and the endothermic character of the reaction as observed from cH reported
for this anion and this ligand in Table 4.8
In summary, TTECP has a high affinity for phosphate relative to the halides and shows high stability
constant compared with most of calix[4]pyrrole derivatives prepared147,245. In addition, the hosting
ability of this receptor for the H2PO4 is greater than that for the halides. It is therefore concluded that
although this receptor is not able to distinguish between fluoride and chloride, in terms of the
separation process between the former anion and phosphate, it seems to be more suitable than TTHCP
due to the high affinity and high hosting capacity for the phosphate anion. Further experimental data
in wastewater solutions containing both anions would be required to confirm the outcome of this
thermodynamic study given that the kinetics of the process also play an important role in extraction
process
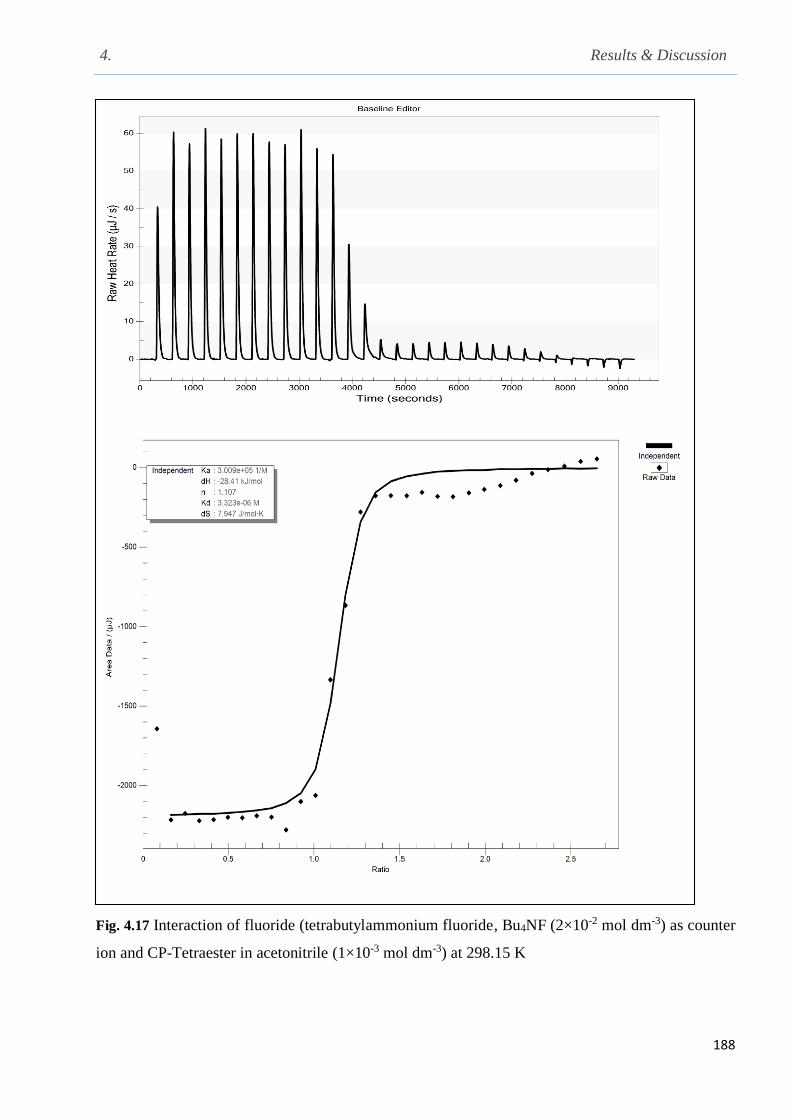
4. Results & Discussion
188
Fig. 4.17 Interaction of fluoride (tetrabutylammonium fluoride, Bu4NF (2×10⁻² mol dm-3) as counter
ion and CP-Tetraester in acetonitrile (1×10⁻³ mol dm-3) at 298.15 K
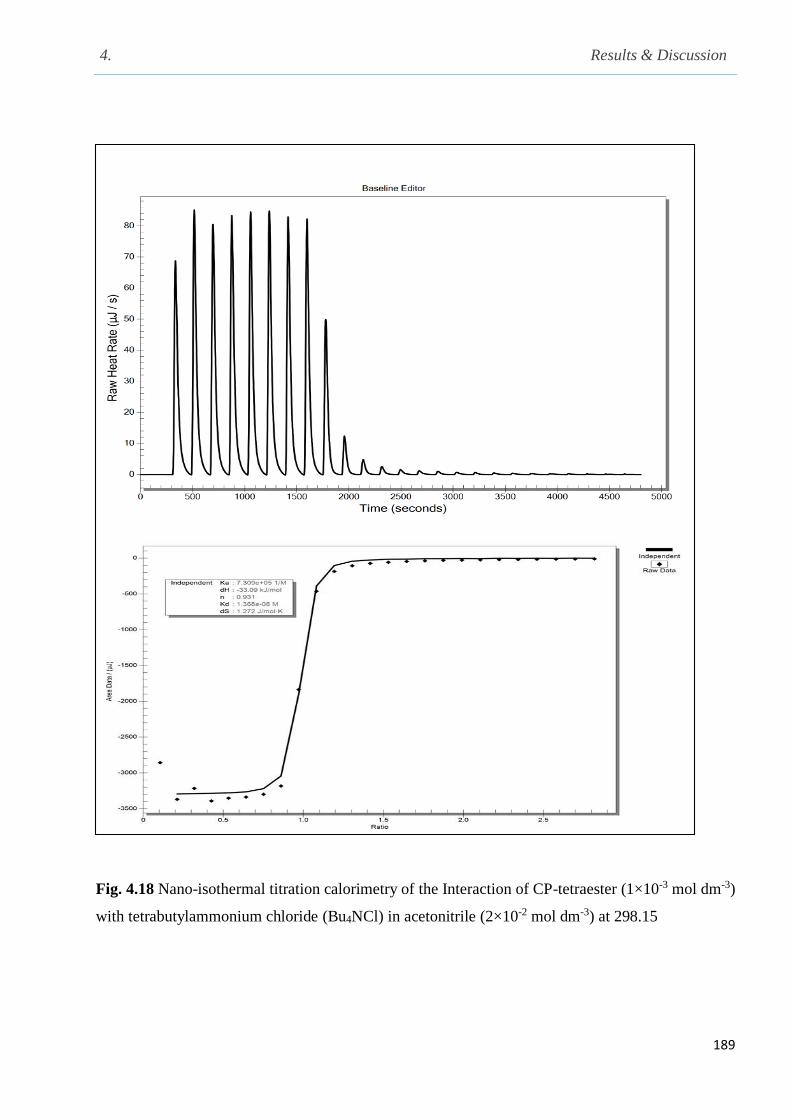
4. Results & Discussion
189
Fig. 4.18 Nano-isothermal titration calorimetry of the Interaction of CP-tetraester (1×10⁻³ mol dm-3)
with tetrabutylammonium chloride (Bu4NCl) in acetonitrile (2×10⁻² mol dm-3) at 298.15
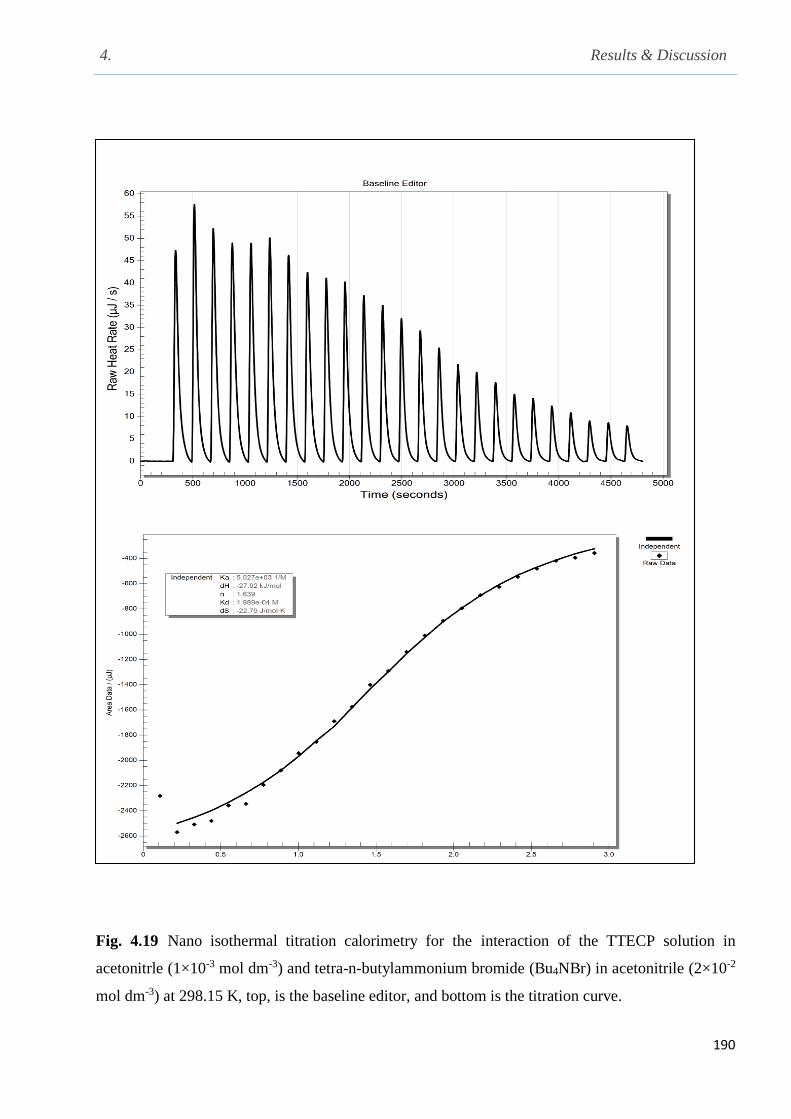
4. Results & Discussion
190
Fig. 4.19 Nano isothermal titration calorimetry for the interaction of the TTECP solution in
acetonitrle (1×10⁻³ mol dm-3) and tetra-n-butylammonium bromide (Bu4NBr) in acetonitrile (2×10⁻²
mol dm-3) at 298.15 K, top, is the baseline editor, and bottom is the titration curve.
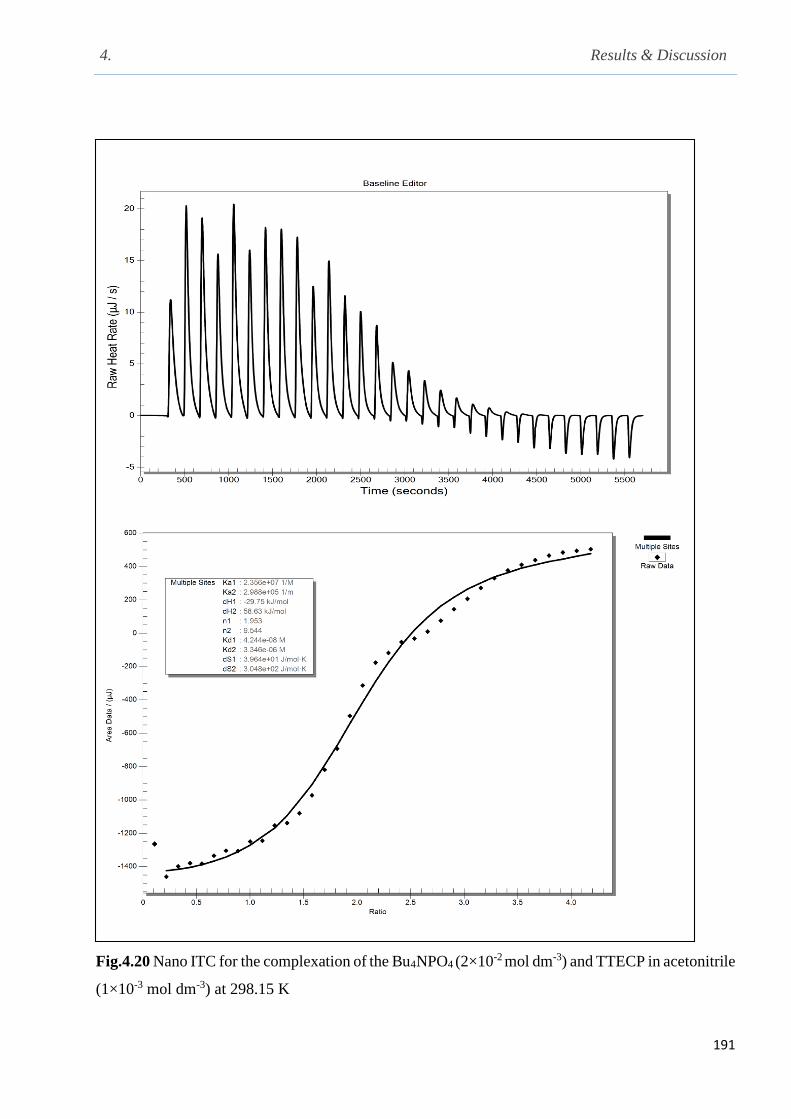
4. Results & Discussion
191
Fig.4.20 Nano ITC for the complexation of the Bu4NPO4 (2×10⁻² mol dm-3) and TTECP in acetonitrile
(1×10⁻³ mol dm-3) at 298.15 K

4. Results & Discussion
192
Table 4.8 The thermodynamic parameters for the interaction of calix[4]pyrrole ester [L] and
phosphate, fluorid, chloride, as tetrabutylammonium counter ion in acetonitrile at 298.15 K
[Anion]/ [L]
log Ks
cHº/ kJ. mol-1
cGº/ kJ mol-1
Sº / J mol-1K-1
[H2PO4]-/ [L]
2: 1
log Ks1
= 7.37 0.03
log Ks2
= 5.47 0.02
cHº1=29.750.05
cHº2 = 58.6 0.1
cGº1 = 42.07 0.2
cGº2 = 31.23 0.1
cSº1 = 3.9×101
cSº2 = 3.1×10²
[F]-/ [L]
1: 1
log Ks
= 5.48 0.02
cHº = 28.4 0.05
cGº = 31.26 0.1
cSº = 8
[Cl]-/ [L]
1: 1
log
Ks = 5.79 ± 0.02
cHº= −33.8 ± 0.06
cGº = −33.09 ± 0.05
∆cSº = 1.99
[Br]-/ [L]
1: 1
log
Ks = 3.6 0.01
∆cHº = 27.90.05
∆cGº = 21.11 0.06
∆cSº = 23
5. Conclusions
193
FINAL CONCLUSIONS
From the above discussion the following conclusions are drawn
A number of macrocycles have been synthesised and characterised by 1H NMR and microanalysis.
These are based on modified naturally occurring receptors such as cyclodextrins (heptakis-(6-chloro-
6-deoxy)-β–cyclodextrin and heptakis-( 2, 3 , 6-tri-O-benzoyl)-ß-cyclodextrin) and synthetic
macrocycles such as calix[4]arenes (5, 11, 17, 23- tert-butyl-25, 26, 27, 28-
(ethylacetatoethoxy)calix[4]arene, 5, 11, 17, 23 tetra-p-tert-butyl, 25, 27- bis[aminoethoxy], 26, 28
dihydroxycalix[4]arene,25, 27-dihydroxy-26-28-(dioxypropargyl) tert-butylcalix[4]arene , 4-tert-
butyl-azidocalix[4]arene,25, 26, 27, 28-(diethylamino) ethoxycalix[4]arene), calix[4]pyrroles (meso-
tetramethyl-tetrakis-(4-hydroxyphenyl ethyl) calix[4]pyrrole, meso-tetramethyl-tetrakis-(4-
ethylacetatophenoxyethyl) calix[4]pyrrole ), resorc[4]arene (C-pentyl-resorcin[4]arene ,C-
pentylresorci[4]arene ester) and pyrogallol[4]arene (C-decyl pyrogallol[4]arene and C-4-
aminophenyl pyrogallol[4]arene).
The solution properties (solubility and derived Gibbs energies of solution) for some drugs (sodium
diclofenac and carbamazepine) have been investigated and the transfer Gibbs energies from a
reference solvent (acetonitrile) to other solvents have been calculated in an attempt to obtain
information regarding the differences in the solvation of these drugs in moving from one solvent to
another. In the derivation of solution Gibbs energies particular attention was paid to the speciation
present in solution. Thus sodium diclofenac was treated as a fully dissociated electrolyte in water and
fully associated in solvents of low permittivity. Carbamazepine was considered to be fully associated
in non-aqueous solvents. Partition coefficients were determined for diclofenac, clorofibric acid and
carbamazepine in the water-1-octanol solvent system at 298.15 K and the results were compared with
literature data. For new receptors such as meso-tetramethyl-tetrakis-(4-hydroxyphenyl ethyl)
calix[4]pyrrole and meso-tetramethyl-tetrakis-(4-ethylacetatophenoxyethyl) calix[4]pyrrole the
solution properties showed that as for other calix[4]pyrrole derivatives these are not water soluble.
From all receptors synthesised, per-benzoylated cyclodextrin and calix[4]arene ester were selected
for interaction with sodium diclofenac. The latter receptor was selected for interaction with sodium

5. Conclusions
194
diclofenac, due to the selectivity of the calix[4]arene ester derivative for the sodium cation. Given
that this is a neutral receptor, cation and anion are taken simultaneously, to keep the neutrality of the
system. Thermal analysis was the approach taken to assess the stability of the receptor, the drugs and
the complex.
P-tert-butylcalix[4]arene amine CA-(NH2)2 was the receptor selected for further studies involving
drugs ( aspirin, clofibric acid, diclofenac, sodium diclofenac and ibuprofen). The 3–aminopropyl
functionalised silica gel was used for the removal of aspirin from water.
Extraction experiments involving a solid phase (the free receptor) and the drug in aqueous medium
were accomplished under different experimental conditions to determine the optimal conditions for
the removal of the drug from water. It was found that the calix[4]arene ester was able to remove 0.2
mmol of the drug from aqueous solution per gram of receptor. As far as the modified cyclodextrin is
concerned, the stability constant of the receptor-drug (sodium diclofenac) interaction was relatively
low and the receptor have showed high hydrophobicity and the aggregation of the compound in the
aqueous media prevent the progress with the extraction process. As far as clofibric acid, diclofenac,
aspirin and ibuprofen are concerned, the presence of carboxylic groups in their structure led to the
choice of the partially functionalised calix[4]arene amine derivative (5, 11, 17, 23 tetra-p-tert-butyl,
25, 27- bis[aminoethoxy], 26, 28 dihydroxycalix[4]arene) as a suitable receptor for these drugs.
Several techniques were used to determine qualitatively and quantitatively the extent of interaction
of these drugs with this receptor. Striking results were obtained. Thus the receptor was able to host
two units of the drug per unit of receptor in the case of clofibric acid and diclofenac, while the
capacity of the receptor was lower for aspirin, only a unit of this drug was taken up per unit of
calix[4]arene amine. The selectivity behaviour of the calix[4]arene amine derivative for the drugs
was demonstrated through the thermodynamics associated with protonation process.
.It is concluded that the receptor is able to recognise selectively these drugs in the following sequence
based on the formation of host 1- complexes
Clofibric acid > Diclofenac > aspirin
Therefore this receptor has an enhanced capacity for clorofibric acd and diclofenac but in addition it
fulfils the concept of selectivity, one of the main features of Supramolecular Chemistry. The
application of this receptor for the removal of some drugs from water was investigated showing that
0.2 mmol of clofibric acid can be removed from water. Given that the removal of aspirin from water
5. Conclusions
195
by the calix[4]arene amine derivative was rather low, the 3 –aminopropyl functionalised silica gel
was used for the removal of aspirin from water.The optimal extraction conditions were determined.
For carbamazepine, the receptor found to interact with this drug was C-decylpyrogallol[4]arene and
significant changes in the phisico-chemical properties was observed.
For the novel calix[4]pyrrole receptor TTHCP affinity to complex with the fluoride and phosphate
(tetrabutylammonium counter ion) and stable complexes were formed and high value for stability
constant with phosphate was determined compared with fluoride.
Also the functionalisation of TTHCP with ester groups led to the production of a new receptor,
TTECP, which shows a higher hosting affinity for the dihydrogen phosphate anion as well as a higher
affinity for this anion relative to fluoride.
In real water samples, the materials need to be tested and some of the steps to be taken are briefly
addressed (i) Sampling: sampling should be representative of the source of water under study. Several
sampling methodologies have been reported in the literature, including frequency of sampling.
Storage of samples needs to be considered and this would depend on the type of the analysis to be
carried out (microbiological or physico-chemical analysis). Within the context of this work, physico-
chemical analysis is the issue to address and it is important to emphasise that this this type of analysis
requires the availability of properly collected and stored samples otherwise the results are not
meaningful. The amount of residual chlorine. pH and the turbidity should be determined immediately
after sampling otherwise changes are found with time, (ii) Physico-chemical analysis: This process
include: (a) Chlorine removal
Treatment with chlorine is the main disinfecting agent employed. Chlorine has low cost, it is efficient
and easy to measure in the laboratory or “in situ”. Samples should be analysed for chlorine by the
recommended methods
(b) pH measurements
Disinfection by chlorine requires a pH lower than 8, otherwise, disinfection is not effective. The pH
can be measured ‘in situ’ with the appropriate electrodes
(c) Turbidity
Visual methods employing extinction are adequate

5. Conclusions
196
d. Analysis of samples
Analysis to test the presence of health pollutants such as heavy metals, fluoride as well as pesticides
and pharmaceuticals should be carried out. For the determination of heavy metals, atomic absorption
and ICP/ MS techniques can be used. Anions can be analysed by ion chromatography. For pesticides
and pharmaceuticals, spectrophotometric techniques can be used. Interfering anions and cations may
be removed. Materials reported in this thesis are to be tested for the removal of drugs from water
under several experimental conditions discussed in this thesis (mass of the receptor, temperature,
concentration of the pharmaceutical, pH, presence of interfering ionic and neutral species)

6. Suggestions for further work
197
Suggestions for further work
Suggestions for further research include
A comprehensive study on calix[4] resorcarene derivatives covering interactions with neutral and
ionic species in solution using NMR technique, electrochemical and thermal techniques. On the basis
of fundamental studies attempts should be made to immobilise these receptors into solid supports and
to proceed with an investigation of their extraction properties with the aim of obtaining easily
recyclable materials for decontamination purposes as well as the use of these receptors for the design
of ion selective electrodes. In this area significant advances have been already made with the use of
calix[4] pyrrole derivatives as recently discussed by Danil de Namor and co-workers
Further research is required on the receptors discussed in this thesis, mainly on the calix[4]pyrrole
derivatives and their interactions with cations particularly for those ligands for which preliminary
work has demonstrated that cation-ligand interactions take place in solution
Expansion of this work by the use of Scanning Electron Microscopy to get insight on the surface
characteristics of materials based on these receptors as well as Energy Dispersive X- ray Analysis to
find the composition of membranes used for the design of ion selective electrodes. There is already
work undergoing in the Thermochemistry Laboratory as well as in other Laboratories linked to
Thermochemistry regarding the use of these techniques.
Testing these compounds under real situations is another issue which needs to be addressed
7. References
198
References
1. J. Steed and J. Atwood, Supramolecular Chemistry, John Wiley & Sons, 2009
2. F. Davis and S. Higson, Macrocycles: Construction, Chemistry and Nanotechnology
Applications, John Wiley & Sons, 2011
3. P. Ehrlich, Studies on Immunity. Wiley: New York, 1906.
4. A. Werner, Chymia, 1967, 12, 221-232.
5. E. Fischer, Ber. Deutsch. Chem. Ges., 1894, 3, 2985-2993
6. C. J. Pedersen, J. Am. Chem. Soc., 1967, 89, 7017–7036.
7. C. J. Pederson, J. Am. Chem. Soc., 1970, 92, 386-391
8. J. M. Lehn, J. Am. Chem. Soc., 1978, 11(2), 49-57
9. J. M. Lehn, Chem. Soc. Rev., 2007, 36, 151–160
10. B. Dietrich, J.M. Lehn, J. Sauvage, Tetrahedron, 1973, 29, 1647-1658
11. D. J. Cram, J. Cram, Container Molecules and their Guests, RSC, Cambridge, 1994
12. D. J. Cram and J. M. Cram, Science, 1974,183, 803-809.
13. J. Szejtli, Chem. Rev., 1998, 98, 1743-1753.
14. Z. Pikramenou, J. Yu., R. Lessard, A. Ponce, P. Wong and D. Nocera, Coord. Chem. Rev.,
1994, 132, 181-194
15. J. M. Lehn, Angew. Chem., Int. Engl., 1988, 27,444-491.
16. P. Garratt, A. lbbett, J. Ladbury, R. O'Brien, M. Hursthouse and K. Abdul Malik,
Tetrahedron, 1998, 54, 949-968
17. Y. Liu, B. Han, Ai-Di Qi and T. Rong, Bioorg. Chem., 1997, 25, 155–162.
18. R. Izatt, K. Pawlak and J. Bradshaw, Chem. Rev., 1991, 91, 1721-2085
7. References
199
19. J. M. Lehn, Supramolecular Chemistry, Concepts and Perspectives, Wiley-VCH:
Weinheim, 1999
20. A. F. Danil de Namor, L. Ghousseini, J. Chem. Soc. Faraday Trans., I, 1984, 80, 2843-2849
21. A. F. Danil de Namor, L. Ghousseini, W. Lee, J. Chem. Soc. Faraday Trans., 1985, 81, 2495-
2502
22. A. F. Danil de Namor, L. Ghousseini, T. Hill, J. Chem. Soc. Faraday Trans., 1986, 82, 349-357
23. A. F. Danil de Namor, J. Chem. Soc. Faraday Trans., 1, 1988, 84, 2441-2444
24. A. F. Danil de Namor, D. Kowalska, J. Phys. Chem., 1997, 101, 1643-1648
25. A. F. Danil de Namor, M. Tanco, M. Salomon, C. Ng, J. Phys. Chem., 1994, 98, 11796-11802
26. A. F. Danil de Namor, C. Ng, M. Tanco, M. Salomon, J. Phys. Chem., 1996, 100, 14485-14491
27. A. F. Danil de Namor, P. Blackett, M. Cabaleiro, J. Al-Rawi, J. Chem. Soc., Faraday Trans.,
1994, 90, 845-847
28. W. Saenger, Angew. Chem., Int. Ed. Ingl., 1982, 19, 344-362
29. L. Tan and Y. Yang, J Incl Phenom Macrocycl Chem., 2015, 81, 13–33
30. S. Gutokturk, E. Calıskan, R. Y. Talman, U. Var, Sci.World. J., 2012, 1, 1-12
31. M. Albelda, J. Frías, E. García, H. Schneider, Chem. Soc. Rev., 2012, 41, 3859-3877
32. A. F. Danil de Namor and M. Shehab; J. Phys. Chem. B, 2005, 109, 17440-17444
33. Q. Guo, H. Qian, and Y. Liu, Eur. J. Org. Chem. 2012, 3962–3971
34. C. Daughton, T. Ternes, Environ. Health Perspect. 1999, 107, 907-938
35. B. Sorenson, S. Nielsen, P. Lanzky, F. Ingerslev, H. Lützhoft, S. Jorgensen, Chemosphere,
1998, 36, 357-393
7. References
200
36. T. Ternes, M. Stumpf, J. Muellr, K. Haberer, M. Servos, R. Wilken, J. Sci. Total Environ.,
1999, 225(1-2), 81-90.
37. T. Heberer, Toxicol. Lett., 2002, 131, 5-17.
38. M. Winkler, J. Lawrence and T. Neu, Wat. Res., 2001, 35, 3197-3205.
39. M. Stump, T. Ternes, R. Wilken, S. Rodrigues, W. Baumann, J. Sci. Total Environ., 1999,
225,135-141
40. J. Fick, R. Lindberg, M. Tysklind, D. Larsson, Regul. Toxicol. Pharm, 2010, 58, 516-523
41. C. Adams, Y. Wang, K. Loftin and M. Meyer, J. Environ. Eng., 2002, 253-260
42. T. Ternes, M. Meienheimer, D. McDowell, F. Sacher, H. Brauch, B. Guide, G. Preuss, U.
Wilme and N. Seibert, Environ. Sci. Technol., 2002, 36, 3855-3863
43. M. Bueno, S. Ulses, M. Hernando, E. Davoli, A. Fernandez- Alba, Water. Res., 2011, 45,
2331-2341.
44. J-Q. Jiang, Z. Zhou, Plos One, 2013, 8(2), e 55729, 1-10
45. Z. Zhou, J-Q. Jiang, J. Pharm.Biomed. Anal., 2014, July 1.
46. Z. Zhou, J-Q Jiang, Chemosphere, 2015,119, S95-S100
47. H. Zhang, Lei Ye and K. Mosbach, J. Mol. Recognit. 2006, 19, 248–259, (b) L. Andersson, R.
Müller, G. Vlatakis, and K. Mosbach, Proc. Natl. Acad. Sci. USA, 1995, 92, 7488-7492
48. J. Liu and G. Wulff, Angew. Chem. Int. Ed., 2004, 43, 1287-1287
49. G. Vasapollo, R. Del Sol, L. Mergola, M. Lazzoi, A. Scardino, S. Scorrano and G. Mele,
Int. J. Mol. Sci., 2011, 12, 5908-5945
50. C. Dai, S. Geissen, Y. Zhang, Y. Zhang, X. Zhou, Environ. Pollut., 2011, 159, 1660-1666
7. References
201
51. C. Dai, J. Zhang, Y. Zhang, X. Zhou, Y. Duan, S. Liu, Chem. Eng. J., 2012, 211-212, 302-309
52. C. Cacho, E. Turiel, A. Esteban, C. Cond and C. Camara, Anal Bioanal Chem., 2003, 376, 491-
496
53. J. Rane, P. Adhikar and R. Bakal, AJPTI, 2015, 3(11), 75-91
54. A. Hargrove, S. Nieto, Tianzhi Zhang, J. Sessler, and E. Anslyn, Chem. Rev., 2011, 111,
6603–6782
55. (a) M. Ludlow1, G. Luxton and T. Mathew, Nephrol Dial Transplant, 2007, 22, 2763–2767
(b) C. Douglass and K. Joshipura, Canc. Causes Cont., 2006, 17, 481–482
56. J. Song, Y. Park, J. Hyun and J. Kim Anticancer Res., 2005, 25, 391-396
57. E. Everett, J Dent Res., 2011, 90(5), 552-560
58. B. Cox, H. Schneider, Coordination and Transport Properties of Macrocyclic Compounds
In Solution, Elesevier, New York, 1992
59. T. Loftsson, M. E. Brewster, J. Pharm. Sci., 1996, 85, 1017-1025
60. R. Breslow, S. Dong, Chem. Rev., 1998, 98, 1997-2011.
61. P. Liu, P. Neuhaus, D. Kondratuk, T. Balaban and H. Anderson, Angew. Chem. Int. Ed., 2014,
53, 7770-7773
62. M. Komiyama and H. Hirai, Polymer J., 1981, 13(2), 171-173
63. P. Fügedi, P. Nanasi, Carbohydr. Res., 1988, 175, 173-179
64. R. Breslow, Pure & Appl. Chem., 1994, 66, 1573-1582
65. A. Ueno, R. Breslow, Tetrahedron Lett., 1982, 23, 3451-3454
66. J. Iwai, N. Ogawa, H. Nagase, T. Endo, T. Loftsson and H. Ueda, J. Pharm. Sci., 2007,
7. References
202
96, 3140-3143.
67. K. Hirose, J. Incl. Phenom. Macrocycl. Chem., 2001, 39, 193–209
68. R. Singh, N. Bharti, J. Madan, S. Hiremath, J. Pharm. Sci. and Technol., 2010, 2, 171-183
69. O. Aslanoff, Y. Bleriot, R. Velty, M. Sollogoub, Org. Biomol. Chem., 2010, 8, 3437-3443
70. P. Shahgaldian and U. Pieles, J. Sensors 2006, 6, 593-615
71. H. Zhou, G. Su, P. Jiao and B. Yan, Chem. Eur. J., 2012, 18, 5501 – 5505
72. K. Kano and Y. Ishida, Angew. Chem. Int. Ed., 2007, 46, 727 –730
73. A. F. Danil de Namor, R. Traboulssi and D. Lewis, J. Am. Chem. Soc., 1990, 112, 8442-8447
74. H. Hammud, A. F. Danil de Namor, A. Falah, N. Yahfoufi, Can. J. Chem. Eng. & Techno.,
2011, 2, 171-175.
75. Y Liu, B. Han, S. Sun, T. Wada and Y. Inoue, J. Org. Chem., 1999, 64, 1487-1493
76. K. Gong. H. Wang, X. Ren, Y. Wanga and J. Chen, J. Green Chem., 2015, 1-7
77. H. Yan, L. Zhu, X. Li, A. Kwok, X. Pan, Y. Zhao, Asian J. Org. Chem., 2012, 1, 314-318
78. Y. García, J. Zelenka, Y. Pabon, A. Iyer, M. Buděšínský, T. Kraus, C. Smith and A. Madder,
J. Org. Biomol. Chem., 2015, 13, 5273-5278
79. C. J. Pederson, J. Org. Chem., 1971, 36, 254-257
80. G. Wu, W. Jiang, J. Lamb, J. Bradshaw and R. Izzat, J. Am. Chem. Soc., 1991, 113, 6538-6541
81. R. Izatt, K. Pawlak, and J. Bradshaw, Chem. Rev., 1991, 91, 1721-2085
82. E. Kyba, R. Helgeson, K. Madan, G. Gokel, T. Tarnowski, S. Moore, and D. Cram, J. Am. Chem.
Soc., 1977, 99(8), 2564-2571
83. J. de Boer, D. Reinhoudt, S. Harkema, G. Hummekt and F. de Jongs, J. Am. Chem. Soc., 1982,

7. References
203
4075-4079
84. A. F. Danil de Namor and M. C. Ritt, J. Chem. Soc. Faraday Trans., 1991, 87, 3232-3239
85. Y. Ma, T. Marszalek, Z. Yuan, R. Stangenberg, W. Pisula, T. Chen and K. Müllen, Chem. Asian
J., 2015, 10, 139-143
86. J. Zolgharnein, G. Shahmoradi, K. Zamani and S. Amani, J Incl. Phenom. Macrocycl. Chem.,
2007, 59, 99-103
87. A. Blake, R. Donamaría, V. Lippolis, J. de-Luzuriaga, E. Manso, M. Monge, and M. Olmos,
J. Inorg. Chem., 2014, 53, 10471-10484.
88. B. Dietrich, M. Hosseini, J. M. Lehn, and R. Sessions, J. Am. Chem. Soc., 1981, 103, 1282-1283
89. A. F. Danil de Namor and L. Ghousseini, J. Chem. Soc. Faraday Trans I, 1985, 81, 781-791
90. B. Sui, X. Yue, M. Tichy, T. Liu, and K. Belfield, Eur. J. Org. Chem., 2015, 1189-1192
91. D. Cram and G. Lein, J. Am. Chem. Soc., 1985, 107(12), 3657-3668
92. R. Helgeson, B. Selle, I. Goldberg, C. Knobler and D. Cram, J. Am. Chem. Soc., 1993, 115,
11506-11511
93. D. J. Cram, J. Moran, E. Maverick, and K. Trueblood, J. Chem.Soc. Chem. Commun., 1983, 12,
645-646
94. T. Ogoshi, S. Kanai, S. Fuginami, T. Yamagishi, Y. Nakamoto, J. Am. Chem. Soc., 2008, 130,
5022-5023
95. T. Ogoshi and T. Yamagishi, Eur. J. Org. Chem. 2013, 2961–2975
96. B. Gomez, V. Francisco, F. Nieto, L. Rio, M. Pastor, M. Paleo and F. Sardina, Chem. Eur J.,
2014, 20, 12123-12132
7. References
204
97. Q. Wang, M. Cheng, Y. Zhao, L. Wu, J. Jiang, L. Wang and Y. Panb, J. Chem. Soc.Chem.
Commun., 2015, 51, 3623-3626
98. R. Milev, A. Pacheco, I. Nierengarten, T. Trinh, M. Holler, R. Deschenaux and J. Nierengarten,
Eur. J. Org. Chem., 2015, 479–485
99. H. Li, Q. Chen, C. Schönbeckab and B. Han, RSC. Adv., 2015, 5, 19041–19047
100. C. D. Gutsche, Calixarenes an Introduction, Monographs in Supramolecular Chemistry, 2nd
Ed., J. Stoddart, Royal Society of Chemistry, London, 2008.
101. Calixarenes. A Versatile Class of Macrocyclic Compounds, Eds. J. Vicens and V. Bohmer,
Kluwer Academic, Dordrecht, 1991
102. Calixarenes 2001, Z. Asfari, V. Bӧhmer, J. Harrowfield and J. Vicens, Kluwer Academic
Publisher Dordrecht, 1994
103. C. D. Gutsche, J .Org. Chem., 1982, 47, 2708-2712
104. A. F. Danil de Namor, R. Cleverly and M. Ormachea, Chem. Rev., 1998, 98, 2495-2525
105. L. Groenen, D. Loon, W. Werboom, S. Harkema, A. Casnati, R. Ungaro, F. Ugozzoli, D.
Reinhoudt, J. Am. Chem. Soc., 1991, 113, 2385-2392
106. K. Iwamoto, K. Araki and S. Shinkai, J. Org. Chem., 1991, 56 ,4955-4962
107. H. Kammerer, G. Happel and F. Caesar, Makromol. Chem., 1972, 162, 179
108. A. Arduini, A. Pochini, S. Reverberi and R. Ungaro, J. Chem. Soc. Chem. Commun., 1984,
981-982
109. C. D. Gutsche and J. Muthukrishnan, J. Org. Chem., 1978, 43, 4905-4906
110. L. Mandolini, R. Ungaro, “Calixarenes in Action”, Imperial College Press, 2000
7. References
205
111. J. Cornforth, P. Heart, G. Nicholas, R. Rees and J. Stock, Brit. J. Pharmacol., 1955, 10, 73-86
112. C. Jaime, J. de Mendoza, P. Prados, P. Nieto, and C. Shched, J. Org. Chem., 1991, 56, 3372-
3376
113. M. McKervey, E. Seward, G. Ferguson, B. Ruhl and S. Harrisc, J. Chem. Soc., Chem. Commun.,
1985, 388-390
114. F. Arnaud-Neu, E. Collins, M. Deasy, G. Ferguson, S. Harries, B. Kaitner, A. Lough, M.
McKervey, E. Marques, J. Am. Chem. Soc., 1989, 3, 8681-8691
115. A. F. Danil de Namor, L. Salazar, M. Llosa Tanco, D. Kowalska, J. Villanueva Salas, R. Schulz,
J. Chem. Soc. Faraday Trans., 1998, 94, 3111-3115
116. A. F. Danil de Namor, F. Sueros-Velarde, M. Cabaleiro, J. Chem. Soc. Faraday Trans., 1996,
92 (10), 1731-1737
117. A F. Danil de Namor, S. Chahine, D. Kowalska, E. Castellano, and O. Piro, J. Am. Chem. Soc.,
2002, 124, 12824-12836
118. A. F. Danil de Namor, M. ZapataOrmachea, O. Jafou and N. Al-Rawi, J. Phys. Chem. B, 1997,
101, 6772-6779
119. A. Casnati; C. Fischer, M. Guardigli, A. Isernia, I. Manet, N. Sabbatini and R. Ungaro, J. Chem.
Soc. Perkin Trans., 2, 1996, 395-399
120. J. Malone, D. Marrs, M. McKervey, P. O'Hagan, N. Thompson, A. Walker, F. Arnaud-Neu,
O. Mauprivez, M. Weill, J. DozoI, H. Rouquettec and N. Simonc, J. Chem. Soc., Chem.
Commun., 1995, 2151-2153
121. C. Tsai, I. Ho, J. Chu, L. Shen, S. Huang and W. Chung, J. Org. Chem., 2012, 77, 2254-2262
7. References
206
122. K. Daze, M. Ma, F. Pineux, and F. Hof, Org. Lett., 2012, 14, 1512-1514
123. J. van Loon, A. Arduini, L. Coppi, W. Verboom, A. Pochini, R. Ungaro, S. Harkema and D.
Reinhoudt, J. Am. Chem. Soc., 1990, 55, 1539-1546
124. J. Rebek, J. Chem. Soc. Chem. Comm., 2000, 637-643
125. M. Brody, C. Schalley, D. Rudkevich, J. Rebek, Angew. Chem. Int. Ed., 1999, 38, 1640-1644
126. K. Wang, E. Yang, X. Zhao, H. Dou and Y. Liu, J. Cryst. Growth & Des., 2014, 14, 4631-4639
127. T. Clark, M. Makha, A. Sobolev, H. Rohrs, J. Atwood and C. Raston, Chem., Eur., J., 2008, 14,
3931-3938
128. Y. Lu, Y. Bi, Y. Bai and W. Liao, J. Chem. Technol. Biotechnol, 2013,88, 1836-1840
129. Y. Wang, D. Guo, Y. Duan, Y. Wang & Yu Liu, Drugs Sci. Rep., 2015, 5: 9019, 1-7
130. D. Guo and Y. Liu, J. Acc. Chem. Res., 2014, 47, 1925−1934
131. C. D. Gutsche, M. Iqbal and I. Alam, J. Am. Chem. Soc., 1987, 107, 4314-4320
132. C. D. Gutsche and K. See, J. Org. Chem., 1992, 57, 4527-4539
133. D. Maity, R. Gupta, R. Gunupuru, D. Srivastava, P. Paul, Sensors and Actuators B, 2014, 191,
757-764
134. R. Perrin, R. Lamartine and M. Perrin, Pure & Appl. Chem., 1993, 65, 1549-1559
135. Calixarenes in the Nanoworld, J Vicens, J Harrowfield, L Baklouti, Dordrecht: Springer 2007
136. B. Mokhtari, K Pourabdoilan, S. Daiali, J. Radianal. and Nucl. Chem., 2011, 287, 921-934
137. K Kiegel, L Steczek, G. Zakrzewska- Trznadel, J. Chem., 2013, ID 76281
138. N. Toumi, F. Kajo, D. Fournier, F. Vocanson, R. Lamartine, I. Dumazet, Mat. Sci & Eng. C,
2008, Issues 5-6, 645-652
7. References
207
139. A. Bayer, A; Ber. Dtsch. Chem. Ges., 1886, 19, 2184-2185
140. W. Allen, P. Gale, C. Brown, V. Lynch and J. Sessler, J. Am. Chem. Soc., 1996, 118, 12471-
12472
141. S. Kim and J. Sessler, Acc. Chem. Res., 2014, 47, 2525−2536
142. Y. Wu, D. Wang, and J. Sessler, J. Org. Chem., 2001, 66, 3739-3746
143. C. Woods, S. Camiolo, M. Light, S. Coles, M. Hursthouse, M. King, P. Gale and J. Essex, J.
Am. Chem. Soc., 2002, 124, 8644-8652
144. I. Saha, J. Lee and C. Lee, Eur. J. Org. Chem., 2015, 3859-3885
145. J. Blas, J. Bes, Marquez, J. Sessler, F. Luque and M. Orozco, Chem. Eur. J., 2007, 13, 1108–
1116
146. P. Gale, J. Sessler, W. Ellen, N. Tvermoes, V. Lynch, J. Chem. Soc.Chem. Commun., 1997,
665-666
147. R. Nishiyabu and P. Anzenbacher, J. Am. Chem. Soc., 2005, 127, 8270-8271
148. A. Farinha, A. Tomé, J. Cavaleiro, Tetrahedron Lett., 2010, 51, 2184-2187
149. Y. Furusho, H. Kawasaki, S. Nakanishi, T. Aida, T. Takata, Tetrahedron Lett., 1998, 39,
3537-3540
150. A. F. Danil de Namor and M. Shehab; J. Phys. Chem. A, 2004, 108, 7324-7330
151. A. F. Danil de Namor, I. Abbas and H. Hammud, J. Phys. Chem. B, 2007, 111, 3098-3105
152. A F. Danil de Namor and R. Khalife, Phys. Chem. Chem. Phys., 2010, 12, 753-760
153. D. Kim and J. Sessler, Chem. Soc. Rev., 2015, 44, 532 - 546
154. I. Park, J. Yoo, B. Kim, S. Adhikari, C-H. Lee, S. Kim, Y. Yeon, V. Lynch, J. Sessler, C.

7. References
208
Hynes, J. Sutton, C. Tong and P. Gale, Chem. Eur. J., 2012, 18, 2514-2523, (b) S. Kim, V.
Lynch, B. Hay, J. Kim and J. Sessler, J. Chem. Sci., 2015, 6, 1404–1413
155. W. More. The Principles of Ion-Selective Electrodes and Membrane Transport (Amsterdam-
Oxford-New York 1981
156. P. Gale, J. Sessler, J. Am. Chem. Soc., 1996, 118, 5140-5141
157. P. Gale, J. Sessler, V. Kral, J. Chem. Soc. Chem. Commun., 1998, 1-8
158. J. Sessler, P. Gale, J. Genge, Chem. Eur. J., 1998, 4 (6), 1095-1099
159. E. Steinle, U. Schaller and M. Meyerhoff, Analytical Sciences, JSAC, 1998, 14(1), 79-84
160. K. Park, S. Jung, S. Lee, and J. Kim, Bull. Korean Chem. Soc., 2000, 21, 909-912
161. A. F. Danil de Namor, A. El-Gamouz, S. AlHarthi, N. Al Hakawati and J. Varcoe, J. Mater.
Chem. A, 2015, 3, 13016–13030
162. J. Niederl, H. Vogel, J. Am. Chem. Soc., 1940, 62, 2512-2514.
163. H. Erdtman, S. Hogberg, S. Abarhamsson, B. Nilsson, Tetrahedron Lett., 1968, 1679-1682
164. L. MacGillivary and J. Atwood, Nature, 1997, 389, 469-472
165. A. Hӧgberg, J. Am. Chem. Soc., 1980, 102, 6046-6050.
166. A. Maerz, H. Thomas, N. Power, C. Deakyne and J. Atwood, Chem. Commun., 2010, 46, 1235–
1237
167. L. McGillivaray and J. Atwood, Nature (London), 1997, 389, 469-472
168. A. Shivanyuk, J. Rebek, J. Chem. Soc. Chem. Commun., 2001, 2424-2425
169. A F. Danil de Namor, W. Aragon, N. Nwogu, A. El Gamouz, O. Piro, and E. Castellano, J.
Phys. Chem. B, 2011, 115, 6922–6934

7. References
209
170. D. J. Cram, S. Karbach, Y. Kim, L. Baczynskyj, G. Kalleymeyn, J. Am. Chem. Soc., 1985, 107,
2575-2576
171. J. Sherman, Tetrahedron, 1995, 51(12), 3395-3422
172. O. Berryman, A. Sather, A. Lled and J. Rebek, Angew. Chem. Int. Ed., 2011, 50, 9400–9403
173. A. F. Danil de Namor, J. Chaaban, O. Piro, E. Castelleno, J. Phys. Chem. B, 2006, 110, 2442-
2450
174. J. Atwood, L. Barbour, A. Jerga, B. Schottel, J. Science, 2002, 298, 1000-1003
175. G. Liu, J. Liu, Yang Liu, and X. Tao, J. Am. Chem. Soc., 2014, 136, 590−593
176. R. Pal, M. Rddy, B. Dinesh, P. Balaram and T. Row, J. Phys. Chem. A, 2014, 118, 9568- 9574
177. H. Kumari, L. Erra, A. Webb, P. Bhatt, C. Barnes, C. Deakyne, J. Adams, L. Barbour and J.
Atwood, J. Am. Chem. Soc., 2013, 135, 16963−16967
178. R. Pfeiffer, D. Fowler and J. Atwood, J. Cryst. Growth Des., 2014, 14(8), 4205-4213
179. L. Avram, Y. Cohen, J. Am. Chem. Soc., 2004, 126, 11556-11563.
180. O. Webb; Ph. D thesis, University of Surrey, 2014
181. R. Scott, Separation Sciences Silica Gel and Bonded Phases (Their production, properties and
use in LC), Wiley-Blackwell, 1993
182. F. Plossi, M. Giera, F. Bracher, J. Chromatographer A, 2006, 1135, 19-26
183. H. Weetall, Covalent Coupling Methods for Inorganic Support Materials, Methods in
Enzymology, 1976, 44, 134-148
184. J. Fan, Y. Qin, C. Ye, P. Peng and C. Wu, J. Hazard. Mater., 2008, 150, 343-350
185. A. F. Danil de Namor, J. Guerra, J. Salas, O. Piro, O. Webb, A. El Gamouz, W. Abou Hamdan,

7. References
210
E. Castellano, RSC Adv., 2015, 5, 33524-33535.
186. L. Luo, X. Zhang, N. Feng, D. Tian, H. Deng & H. Li, Scientific report, 2015, 5, 1-7
187. H. Kolb, M. Finn and K. Sharpless, Angew. Chem. Int. Ed., 2001, 40, 2004-2021
188. I. Jlalia, F. Meganim, J. Herscovici and C. Girard, Molecules 2009, 14, 528-539
189. M. Meldal and C. Tornoe, Chem. Rev., 2008, 108, 2952-3015
190. W. D. Harkins, G. Jura; J. Am. Chem. Soc., 1944, 66 (8), 1366–1373
191. K. Walton and R. Snurr, J. Am. Chem. Soc. 2007, 129, 8552-8556
192. A. Sallmann, “The History of Diclofenac” Am. J. Med., 1986, 80, 29-33.
193. S. C. Sweetman, W. Martindal, The Complete Drug Reference, 35th Edition, 2006.
194. B. Furniss, A. Hannaford, P. Smith, A. Tatchel, Vogel’s-Practical Organic Chemistry, 5th Ed.
195. D. Bax, de Ligny, A. Remijinse, Recl. Trav. Chim. Pays-Bas, 1972, 91, 965
196. C. well, J. Thermochemica Acta., 1988,132, 141-154
197. A. F. Danil de Namor, (Thermodynamics of calixarene-ion interactions), in Calixarene 2001.
Eds. Z. Asfari, V. Bohmer, J. Harrowfield and J. Vacens, Chapter 19, 346-364
198. D. Skoog, F. Holler, Principles of Instrumental Analysis, 5th Ed., 1997, 15-17
199. R. Scheytt, P. Mersman, R. Lindstadt, T. Heberer, Water, Air Soil Poll., 2005, 165, 3-11
200. J. Pawliszyn, “Application of Solid Phase Microextraction”, 1999, 18-19
201. F. Guillo, B. Hamelin, L. Jullien, J. Canceill, J-M. Lehn, L. Robertis, H. Driguez, Bull. Soc
Chim.Fr., 1995, 132, 857-866
202. S. Knoblauch, O. Falana, J. Nam, D. Roundhill, H. Hennig, K. Zeckert, Inorg. Chim. Acta.,
2000, 300, 328–332

7. References
211
203. M. Shehab, Ph.D. Thesis, University of Surrey, Guildford, 2005
204. J. Christensen, R. Izatt and L. Hansen, Rev. Sci. Instrum., 1965, 36, 779-783
205. Y. Liu, H. Wang, L. Wang, Z. Li, H. Zhang and Q. Zhang, Tetrahedron, 2003, 59, 7967-7972
206. R. Ungaro, A. Arduini, A. Pochini, S. Reverberi, J. Chem. Soc. Chem.Commun., 1984, 981-982
207. R. Pathak,V. Hing, M. Mondal and C. Rao, J. Org. Chem., 2011,76,10039-10049.
208. R. Pathak, A.G. Dikundwar, T. Row , J. Chem.Soc.Chem. Commun. 2010, 46, 4345-4347
209. J. Dyke, G. Levita, A. Morris and J. Ogden, J. Phys. Chem. A, 2004, 10 , 5299-5307
210. A. F. Danil de Namor, D. Tanaka, L. Regueira, I. Orellana, J. Chem. Soc. Faraday Trans.,
1992, 88, 1665-1668
211. L. Bonomo, E. Solari, G. Toraman, R. Scopelliti, M. Laatronico and C. Floriani, J. Chem. Soc.
Chem. Commun., 1999, 2413-2414
212. A. Kalidkowski and A. Trochimczuk, J. React. Func. Polym., 2006, 66, 740-744
213. L. Tunstad, J. Tucker, E. Dalcanale, J. Weiser, J. Bryant, J. Sherman, R. Helgeson, C. Knobler,
D. Cram, J. Org. Chem. 1989, 54, 1305–1312.
214. P. Timmerman, W. Verboom, D. Reinhoudt, Tetrahedron, 1996, 52, 2663-2704
215. T. Gerkensmeier, W. Iwanek, C. Agena, R. Fröhlich, S. Kotila, C. Näther, J. Mattay, Eur. J.
Org. Chem., 1999, 2257-2262
216. L. Raff, Principles of Physical Chemistry, 1st Ed., Prentice-Hall International UK Limitid,
London, 2001
217. G. Jones, C. Bradshaw, J. Am. Chem. Soc., 1993, 55, 1780-1800
218. J. Lind, J.J. Zwolenik, R. Fouss, J. Phys. Chem., 1965, 81, 1557-1559
7. References
212
219. K. Jansen, H. Buschman, E. Zliobaite, E. Schollmeyer, Thermochem. Acta, 2002, 385, 177-184
220. Y. Liu and J. M. Sturtevant, Protein Sci., 1995, 4, 2559-2561
221. L. Briggner, I. Wadsӧ, J. Biochem Biophys Methods, 1991, 22, 101-118
222. I. Wadsӧ and R. Goldberg, Pure Appl. Chem., 2001, 73, 1625–1639
223. B. Wunderlich “Thermal Analysis of Polymeric Materials”, 2005, Springer-Verlag Berlin
224. L. Liu and S. Zhu, J Pharm Biomed Anal, 2006, 40, 122-127
225. D. Giron, J. Therm. Anal. Cal., 2002, 68, 335-357
226. W. Acree, J. Phys. Chem. Ref. Data, 2014, 43, 1-276
227. A. Llina`s, J. Burley, K. Box, R. Glen, and J. Goodman, J. Med. Chem., 2007, 50, 979-983
228. L. Zilnik, A. Jazbinsek, A. Hvala, F. Vrecer and A. Klamt, J. Fluid Phase Equilibria, 2007,
261, 140-145
229. S. Habermann, K. Murphy, Prot. Sci., 1996, 5, 1229-1239
230. J. Dearden, Environ. Health Perspect., 1985, 61, 203-228
231. A. Grzesiak, M. Lang, K. Kim, A. Matzger, J. Phar. Sci., 2003, 92, 2260-2271
232. A.F. Danil de Namor, J. Guerra, V. Gracheve, W. Aragon, K. Fernandez and F. Velarde,
New J. Chem., 2005, 29, 1072-1075
233. C. Ventura, I. Giannone, T. Musumeci, R. Pignatello, L. Ragni, C. Landolfi and C. Milanese,
D. Paolino and G. Pugalisi, Eur. J. Med. Chem., 2006, 41, 233-240
234. V. Crupi, R. Ficarra, M. Guardo, D. Majolino, R. Stancanelli, V. Venuti, J. Pharm. Biomed.
Anal., 2007, 44, 110-117
235. E. Valle, Process Biochem., 2004, 39, 1033-1046

7. References
213
236. E. Kosower, J. Am. Chem. Soc., 1958, 80 (13), 3253-3260.
237. C. Reichardt “Solvents and Solvent Effects in Organic Chemistry”, 2003, 3rd Ed. Wiley-VCH
238. A. Vegilia and R. de Rossi, Can. J. Chem., 2000, 78, 233-237.
239. K. No and J. Koo, J. Bull. Korean Chem. Soc., 1994, 15,483- 488.
240. A. F. Danil de Namor, N. Sueros, M. McKervey, G. Barrett, F. Arnaud- Neuc and M.
Weillc, J. Chem. Soc. Chem. Commun., 1991, 1546-1548.
241. M. Vihinin, J. Protein Eng., 1987, 1(6), 477-480.
242. P. Tudija, M. Khan, E. Mestrovic, M. Horvat and P. Golja, Chem. Pharm. Bull., 2001,
49 (10), 1245-1250.
243. M. Meloun, S. Bordovska´ and L. Galla, J Pharm Biomed Anal., 2007, 45, 552-564
244. Z. Yurtsever, B. Erman, E. Yurtsever, Tur. J. Chem., 2012, 36, 383-395
245. J. Yoo, M. Kim, S. Hong, J. Sessler, and C. Lee, J. Org. Chem., 2009, 74, 1065–106

8. Appendix
214
Appendix

8. Appendix
215
List of Appendix…………………………………………………………………………….......Page
Fig. 1- A Calibration curve of sodium diclofenac in water at 298 K……………………………….218
Fig. 2-A Calibration curve of NaDF in methanol at 298 K…………………………………………218
Fig. 3-A Calibration curve of NaDF in acetonitrile at 298 K……………………………………….218
Fig. 4. A Calibration curve of NaDF in DMSO at 298 K…………………………………………..219
Fig. 5-A Calibration curve of NaDF in 1- Butanol at 298 K……………………………………….219
Fig. 6-A Calibration curve of NaDF in ethylacetate at 298 K………………………………………219
Fig. 7-A Calibration curve of sodium diclofenac in DMF at 298 K………………………………..220
Fig. 8-A Calibration curve of sodium diclofenac in THF at 298 K…………………………………220
Fig. 9–A: Calibration curve of carbamazepine in water at 298 K………………………………….220
Fig. 10-A Calibration curve of carbamazepine in DCM at 298 K………………………………….221
Fig. 11-A Calibration curve of carbamazepine in acetonitrile at 298 K……………………………221
Fig. 12-A Calibration curve of CBZ in DMSO at 298 K…………………………………………...221
Fig. 13-A Calibration curve of clofibric acid in water at 298 K…………………………………….222
Fig. 14-A Calibration curve of carbamazepine in water at 298 K………………………………….222
Fig. 15-A Calibration of carbamazepine in DCM at 298 K……………………………………….222
Fig. 15-A Calibration of carbamazepine in DCM at 298 K……………………………………….223
Fig. 17-A Calibration curve of carbamazepine in DMSO at 298 K………………………………..223
Fig. 18-A Calibration curve of carbamazepine in DMF at 298 K………………………………….223
Fig. 1-B: 1H NMR spectrum for monochlorinated -cyclodextrine in DMSO-d6 at 298 K………..224
Fig. 2-B: 13C NMR spectrum for mono chlorinated--cyclodextrine in DMSO-d6 at 298 K……….224
Fig. 3-B: 1H NMR spectrum of per-benzoylated-ß-cyclodextrine in DMSO-d6 at 298 K………….225
Fig. 4-B: 1H NMR spectra for p-tert-buylcalix[4]arene tetraethylethanoate in CDCl3 at 298 K……225

8. Appendix
216
Fig. 5-B: 1H NMR spectrum of 5, 11, 17, 23 tetra- tert -butyl, 25, 27 bis[2-cyanomethox] methoxy-
26, 28 -dihydroxycalix[4]arene at 298 K…………………………………………………………..226
Fig. 6-B 1H NMR spectrum of 5, 11, 17, 23 tetra-tert-butyl, 25, 27-bis[aminoethoxy]-26, 28-
dihydroxycalix[4]arene at 298 K…………………………………………………………………..226
Fig. 7-B 1H NMR spectrum for 25, 26, 27, 28-tetrahydroxycalix[4]arene in CDCl3 at 298 K…….227
Fig. 8-B 1H NMR spectrum of 5-tert-butyl-2-hydroxybenzaldehy………………………………...227
Fig. 9-B 1H NMR spectrum of 5-tert-butyl-3-chloromethyl-hydroxybenzaldehy…………………228
Fig. 10-B 1H NMR spectrum of 5-tert-butyl-3-azidomethyl-2-hydroxybenzaldehy in CDCl3….....228
Fig. 11-B 1NMR spectrum of 25, 27-dihydroxy-26-28-(dioxypropargyl) tert-butylcalix[4]arene
(ArCH) in CDCl3 at 298 K…………………………………………………………………………229
Fig. 12-B 1H NMR spectrum of p-tert-butyl-azidocalix[4]arene in CDCl3 at 298 K……………....229
Fig. 13-B 1 H NMR spectrum of 2-azidoacetamide in CDCl3 at 298 K…………………………….230
Fig. 14-B 1H NMR spectrum of 25, 26, 27, 28-(diethylamino) ethoxy calix[4]arene in CDCl3 at
298 K……………………………………………………………………………………………...230
Fig. 15-B 1H NMR spectrum of TTHCP in DMSO-d6 at 298 K…………………………………....231
Fig. 16-B 13C NMR of TTHCP in DMSO at 298 K………………………………………………...231
Fig. 17-B 1H NMR spectrum of TTECP in DMSO-d6 at 298 K……………………………………232
Fig. 18-B 1H NMR spectrum of calix[4]pyrrole derivative TTECP in CD3CN at 298 K…………..232
Fig. 19-B Appendix H NMR spectrum of C-pentyl-resorcin[4]arene in CDCl3…………………...233
Fig. 20-B 1H NMR spectrum of PG6 in cdCl3 at 298 K…………………………………………….233
Fig. 21-B 1 H NMR spectrum of PG11 in CDCl3 at 298 K………………………………………….234
Table 3.1 1H NMR titration experiment and the chemical shift changes from the addition of
increasing amounts of diclofenac to a fixed concentration of calix[4]arene amine in CD3CN at
298 K………………………………………………………………………………………………235

8. Appendix
217
Table 3.2 Chemical shift changes for the receptor [(CA-(NH2)2] as a result from the addition of
increasing concentrations of clofibric acid in CD3CN at 298 K……………………………………236
Table 3.3 Conductance measurements for the diclofenac………………………………………...237
Table 3.4 Conductivity values for the titration of clofibric acid solution in MeCN (1.96×10 -3 mol
dm-3) with the CA-(NH2)2 receptor in MeCN (1. 59×10-2 mol dm -3) at 298.15 K………………….238
Table 3.5 Conductometric titration of aspirin with CA-(NH2)2 in acetonitrile at 298.15 K………...239
Table 3. 6 Absorbance values change of diclofenac resulting from the addition of increasing
concentration of CA-(NH2)2 in acetonitrile at 298 K……………………………………………….240
Table 3.7 Absorbance values change values of clofibric acid solution in acetonitrile as a result from
the gradual addition of calix[4]arene amine solution in the same solvent………………………….241
Table 3.8 Absorbance values change of aspirin solution in dry acetonitrile as a result from gradual
addition of calix[4]arene amine at 298 K…………………………………………………………..242
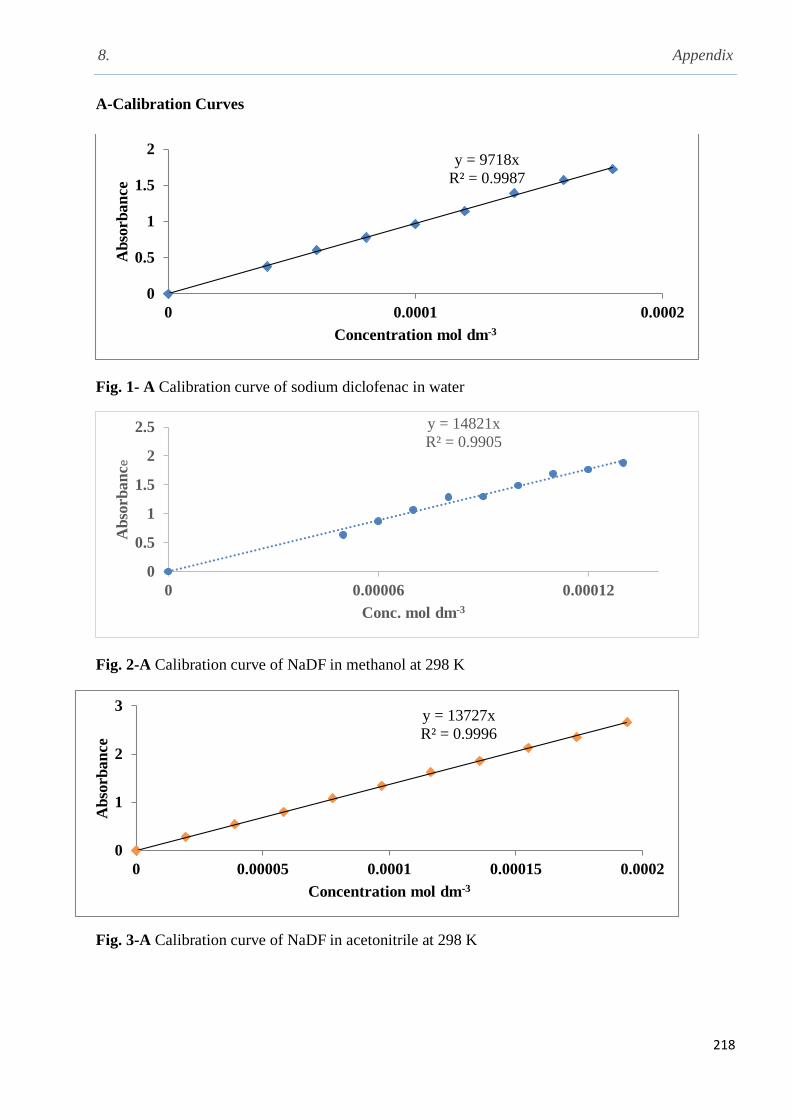
8. Appendix
218
A-Calibration Curves
Fig. 1- A Calibration curve of sodium diclofenac in water
Fig. 2-A Calibration curve of NaDF in methanol at 298 K
Fig. 3-A Calibration curve of NaDF in acetonitrile at 298 K
y = 9718x
R² = 0.9987
0
0.5
1
1.5
2
0 0.0001 0.0002
Ab
sorb
an
ce
Concentration mol dm-3
y = 14821x
R² = 0.9905
0
0.5
1
1.5
2
2.5
0 0.00006 0.00012
Ab
sorb
an
ce
Conc. mol dm-3
y = 13727x
R² = 0.9996
0
1
2
3
0 0.00005 0.0001 0.00015 0.0002
Ab
sorb
an
ce
Concentration mol dm-3
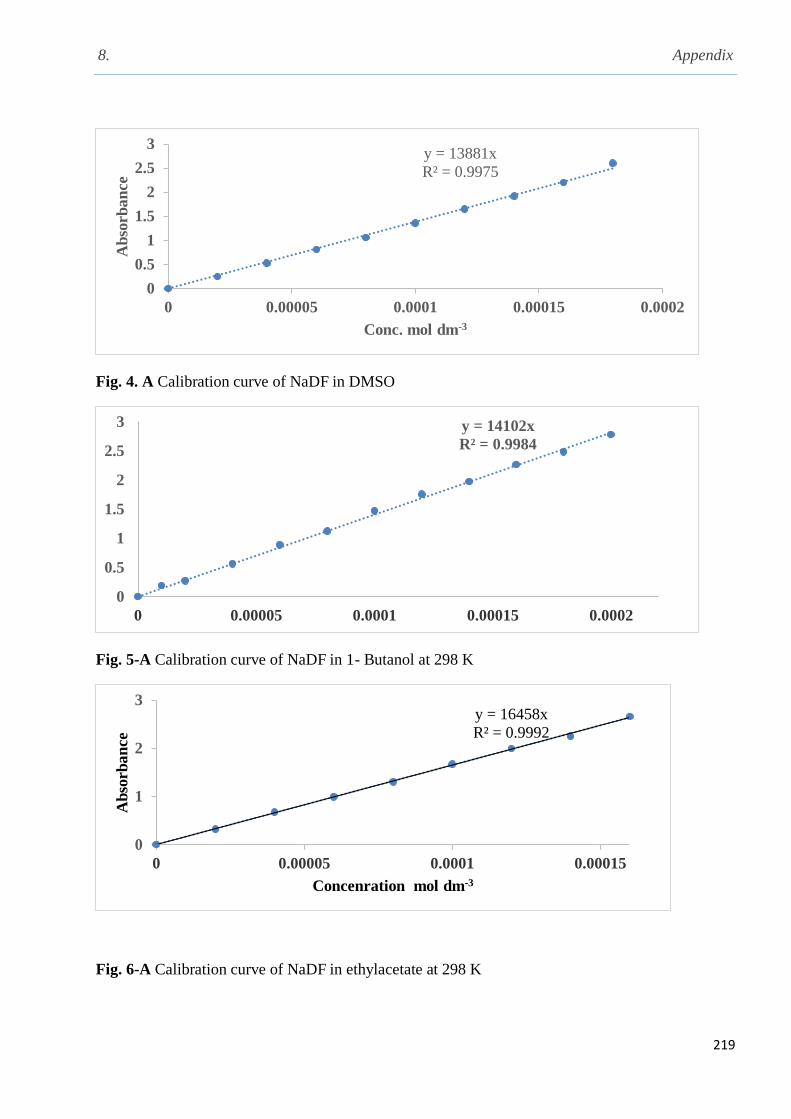
8. Appendix
219
Fig. 4. A Calibration curve of NaDF in DMSO
Fig. 5-A Calibration curve of NaDF in 1- Butanol at 298 K
Fig. 6-A Calibration curve of NaDF in ethylacetate at 298 K
y = 13881x
R² = 0.9975
0
0.5
1
1.5
2
2.5
3
0 0.00005 0.0001 0.00015 0.0002
Ab
sorb
an
ce
Conc. mol dm-3
y = 14102x
R² = 0.9984
0
0.5
1
1.5
2
2.5
3
0 0.00005 0.0001 0.00015 0.0002
y = 16458x
R² = 0.9992
0
1
2
3
0 0.00005 0.0001 0.00015
Ab
sorb
an
ce
Concenration mol dm-3

8. Appendix
220
Fig. 7-A Calibration curve of sodium diclofenac in DMF
Fig. 8-A Calibration curve of sodium diclofenac in THF at 298 K
Fig. 9–A: Calibration curve of carbamazepine in water at 298 K
y = 10935x
R² = 0.9993
0
1
2
3
0 0.00005 0.0001 0.00015 0.0002
Abso
rban
ce
Concentration mol dm-3
y = 15764x
R² = 0.9946
0
0.5
1
1.5
2
0 0.00006 0.00012
Ab
sorb
an
ce
Conc. mol dm-3
y = 13836x
R² = 0.9986
0
0.5
1
1.5
2
2.5
3
0 0.00005 0.0001 0.00015 0.0002
Ab
sorb
an
ce
Concentration mol dm-3
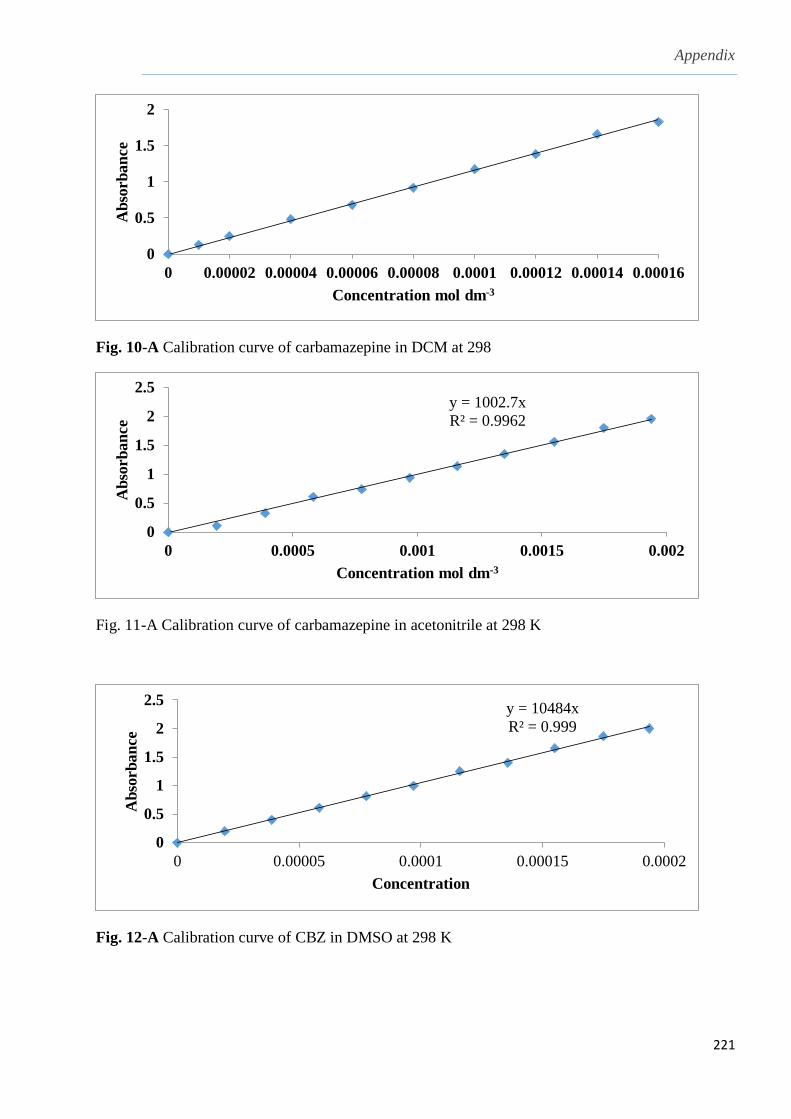
Appendix
221
Fig. 10-A Calibration curve of carbamazepine in DCM at 298
Fig. 11-A Calibration curve of carbamazepine in acetonitrile at 298 K
Fig. 12-A Calibration curve of CBZ in DMSO at 298 K
0
0.5
1
1.5
2
0 0.00002 0.00004 0.00006 0.00008 0.0001 0.00012 0.00014 0.00016
Ab
sorb
an
ce
Concentration mol dm-3
y = 1002.7x
R² = 0.9962
0
0.5
1
1.5
2
2.5
0 0.0005 0.001 0.0015 0.002
Ab
sorb
an
ce
Concentration mol dm-3
y = 10484x
R² = 0.999
0
0.5
1
1.5
2
2.5
0 0.00005 0.0001 0.00015 0.0002
Ab
sorb
an
ce
Concentration
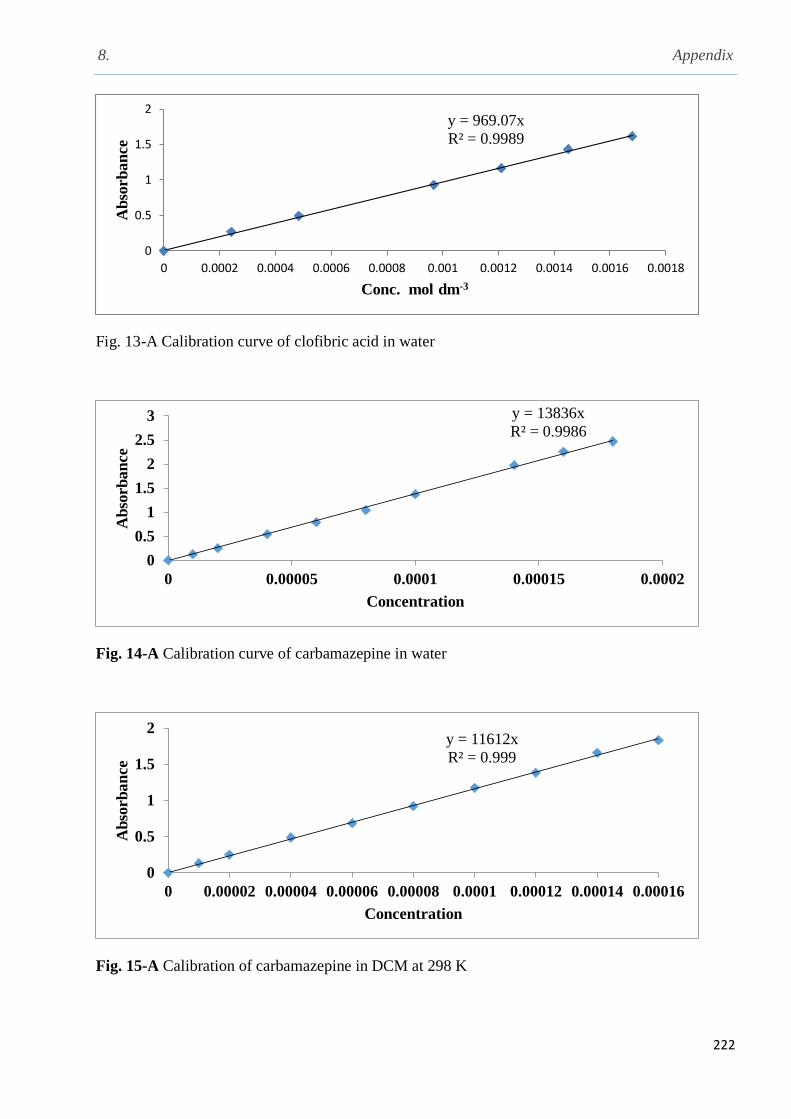
8. Appendix
222
Fig. 13-A Calibration curve of clofibric acid in water
Fig. 14-A Calibration curve of carbamazepine in water
Fig. 15-A Calibration of carbamazepine in DCM at 298 K
y = 969.07x
R² = 0.9989
0
0.5
1
1.5
2
0 0.0002 0.0004 0.0006 0.0008 0.001 0.0012 0.0014 0.0016 0.0018
Ab
sorb
an
ce
Conc. mol dm-3
y = 13836x
R² = 0.9986
0
0.5
1
1.5
2
2.5
3
0 0.00005 0.0001 0.00015 0.0002
Ab
sorb
an
ce
Concentration
y = 11612x
R² = 0.999
0
0.5
1
1.5
2
0 0.00002 0.00004 0.00006 0.00008 0.0001 0.00012 0.00014 0.00016
Ab
sorb
an
ce
Concentration
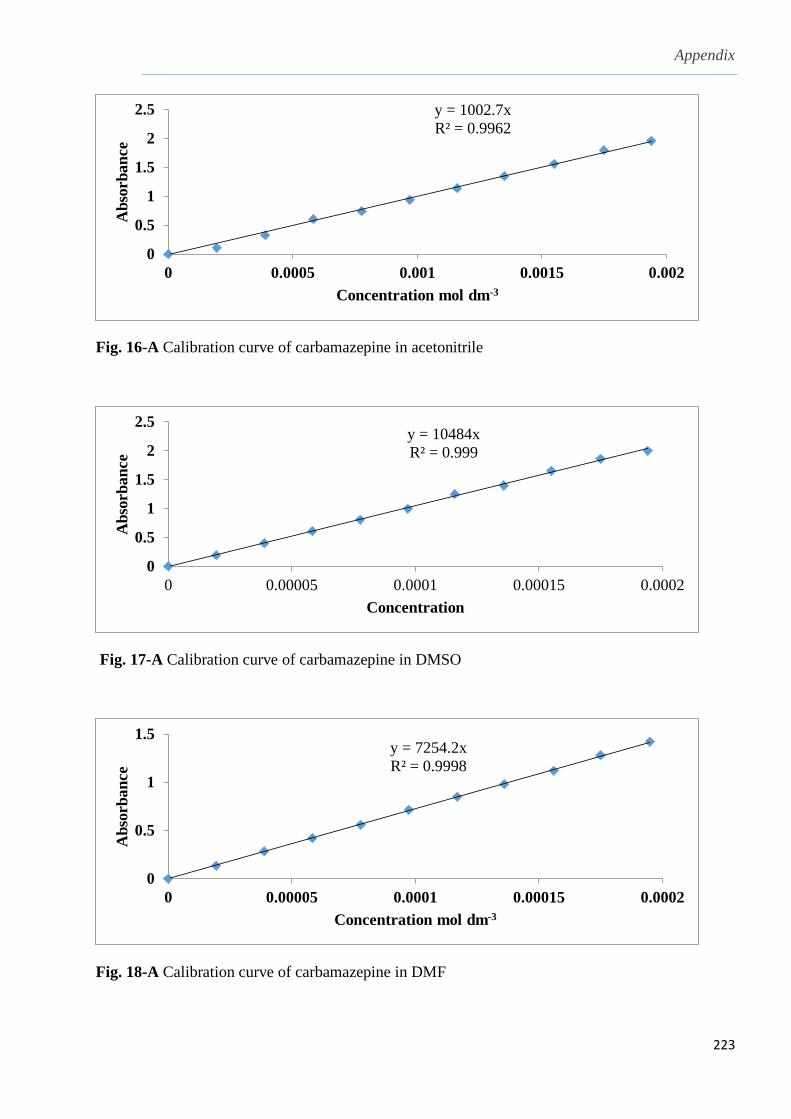
Appendix
223
Fig. 16-A Calibration curve of carbamazepine in acetonitrile
Fig. 17-A Calibration curve of carbamazepine in DMSO
Fig. 18-A Calibration curve of carbamazepine in DMF
y = 1002.7x
R² = 0.9962
0
0.5
1
1.5
2
2.5
0 0.0005 0.001 0.0015 0.002
Ab
sorb
an
ce
Concentration mol dm-3
y = 10484x
R² = 0.999
0
0.5
1
1.5
2
2.5
0 0.00005 0.0001 0.00015 0.0002
Ab
sorb
an
ce
Concentration
y = 7254.2x
R² = 0.9998
0
0.5
1
1.5
0 0.00005 0.0001 0.00015 0.0002
Ab
sorb
an
ce
Concentration mol dm-3

Appendix
224
Appendix-B 1 H NMR Spectrum
Fig. 1-B: 1H NMR spectrum for monochlorinated -cyclodextrine in DMSO-d6
Fig. 2-B: 13C NMR spectrum for mono chlorinated--cyclodextrine in DMSO-d6 at 298 K
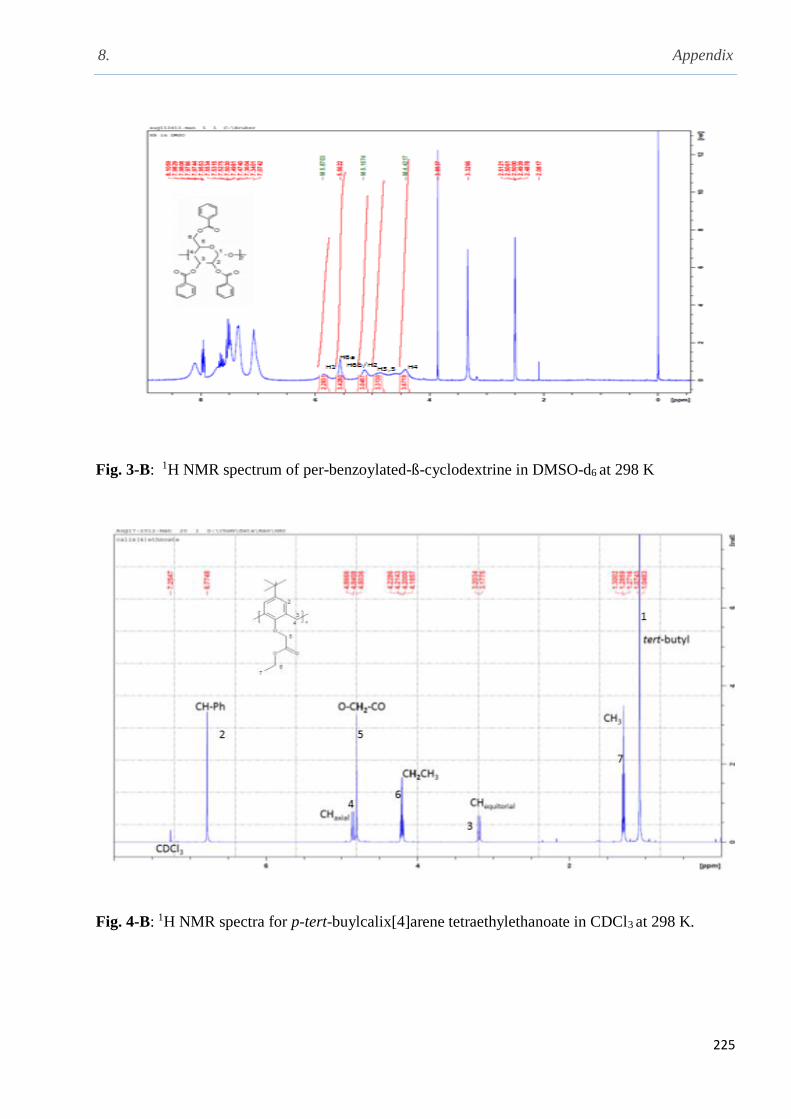
8. Appendix
225
Fig. 3-B: 1H NMR spectrum of per-benzoylated-ß-cyclodextrine in DMSO-d6 at 298 K
Fig. 4-B: 1H NMR spectra for p-tert-buylcalix[4]arene tetraethylethanoate in CDCl3 at 298 K.

8. Appendix
226
Fig. 5-B: 1H NMR spectrum of 5, 11, 17, 23 tetra- tert -butyl, 25, 27 bis (2-cyanomethox) methoxy-
26, 28 -dihydroxycalix[4]arene at 298 K
Fig. 6-B 1H NMR spectrum of 5, 11, 17, 23 tetra-tert-butyl, 25, 27-bis (aminoethoxy)-26, 28
dihydroxycalix[4]arene at 298 K
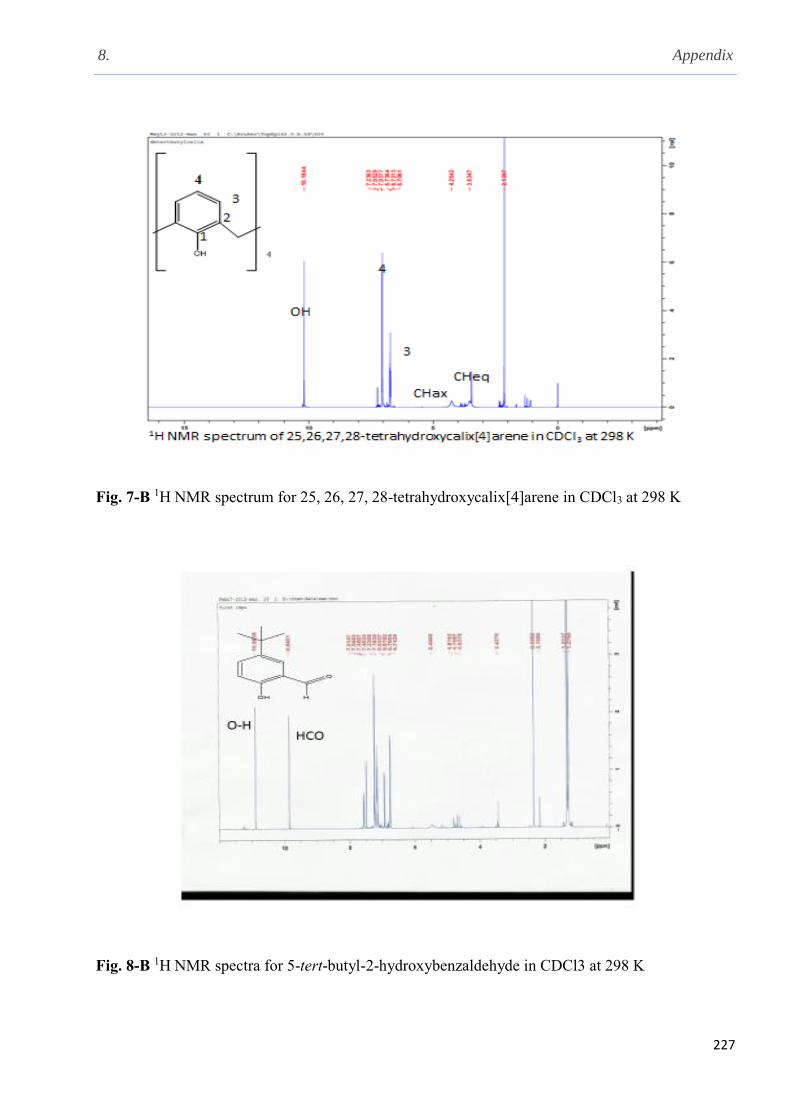
8. Appendix
227
Fig. 7-B 1H NMR spectrum for 25, 26, 27, 28-tetrahydroxycalix[4]arene in CDCl3 at 298 K
Fig. 8-B 1H NMR spectra for 5-tert-butyl-2-hydroxybenzaldehyde in CDCl3 at 298 K
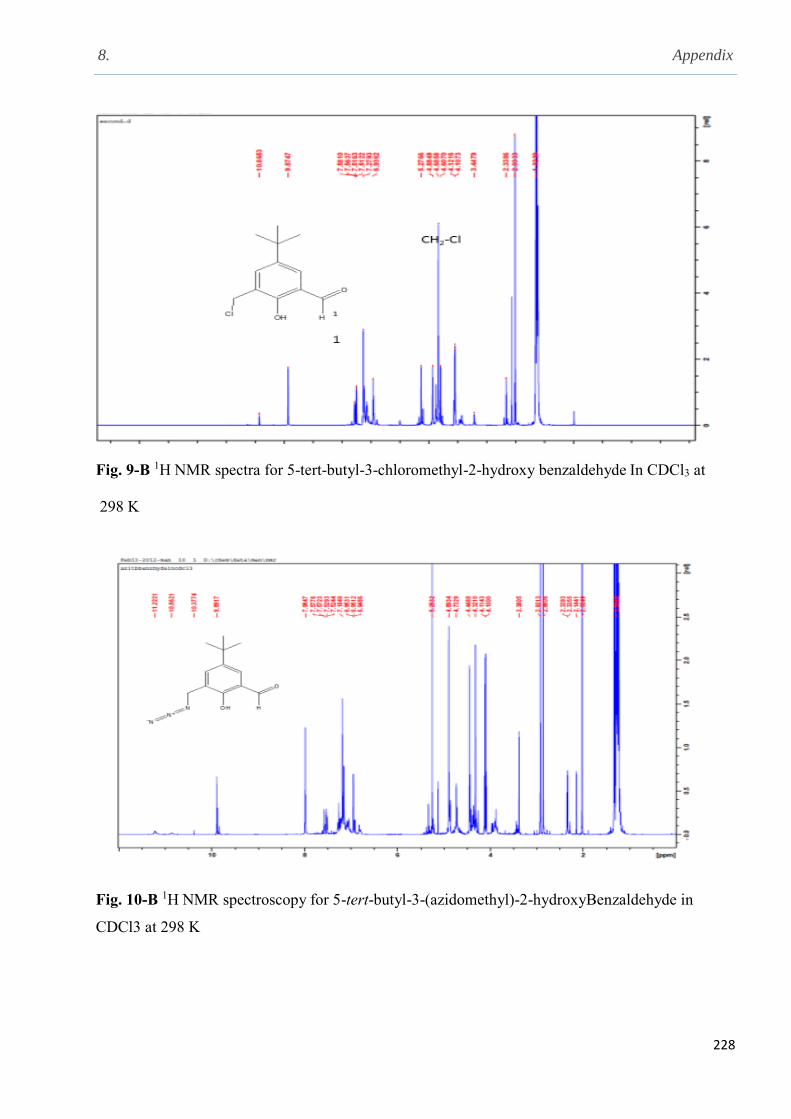
8. Appendix
228
Fig. 9-B 1H NMR spectra for 5-tert-butyl-3-chloromethyl-2-hydroxy benzaldehyde In CDCl3 at
298 K
Fig. 10-B 1H NMR spectroscopy for 5-tert-butyl-3-(azidomethyl)-2-hydroxyBenzaldehyde in
CDCl3 at 298 K

8. Appendix
229
Fig. 11-B 1NMR spectrum of 25, 27-dihydroxy-26-28-(dioxypropargyl) tert-butylcalix[4]arene
(ArCH) in CDCl3 at 298 K
Fig. 12-B 1H NMR spectrum of p-tert-butyl-azidocalix[4]arene in CDCl3 298 K
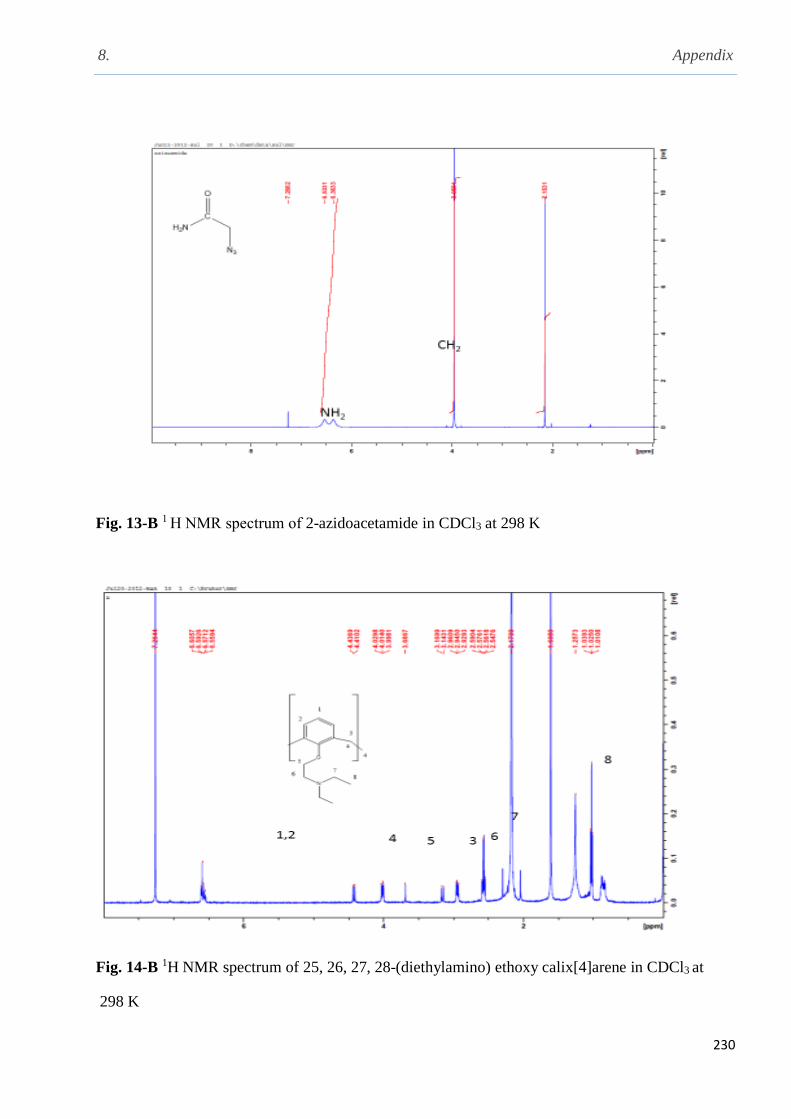
8. Appendix
230
Fig. 13-B 1 H NMR spectrum of 2-azidoacetamide in CDCl3 at 298 K
Fig. 14-B 1H NMR spectrum of 25, 26, 27, 28-(diethylamino) ethoxy calix[4]arene in CDCl3 at
298 K
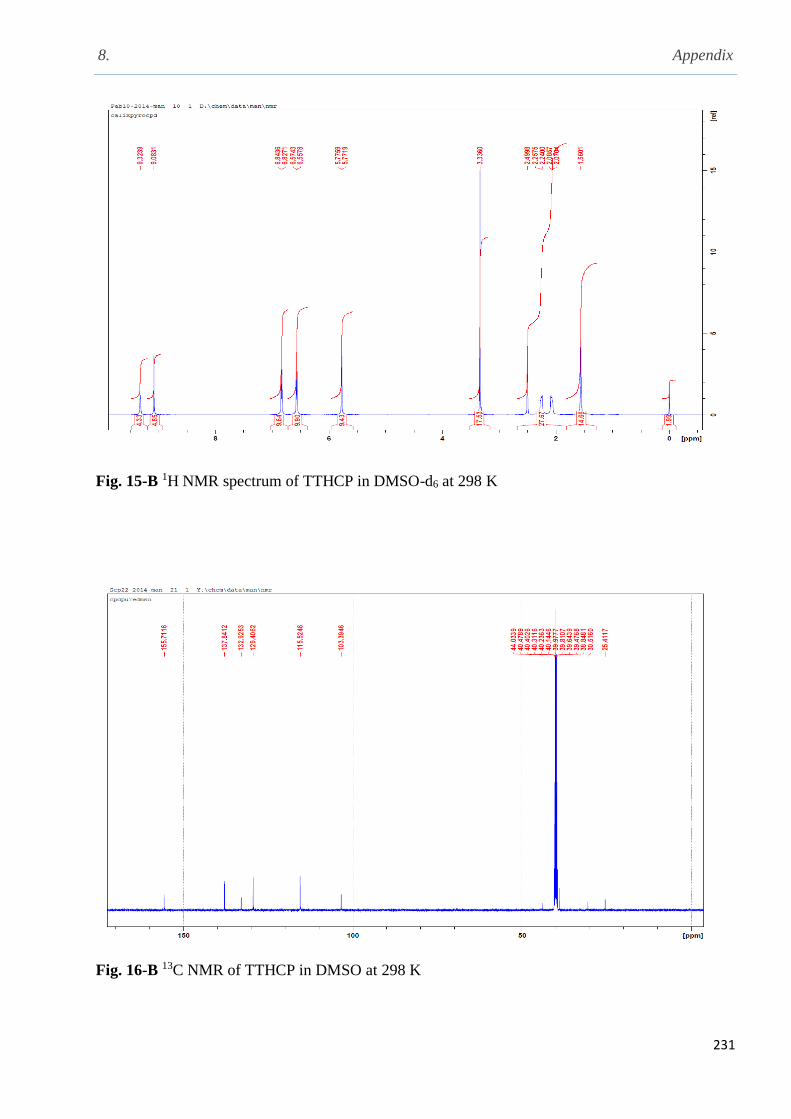
8. Appendix
231
Fig. 15-B 1H NMR spectrum of TTHCP in DMSO-d6 at 298 K
Fig. 16-B 13C NMR of TTHCP in DMSO at 298 K
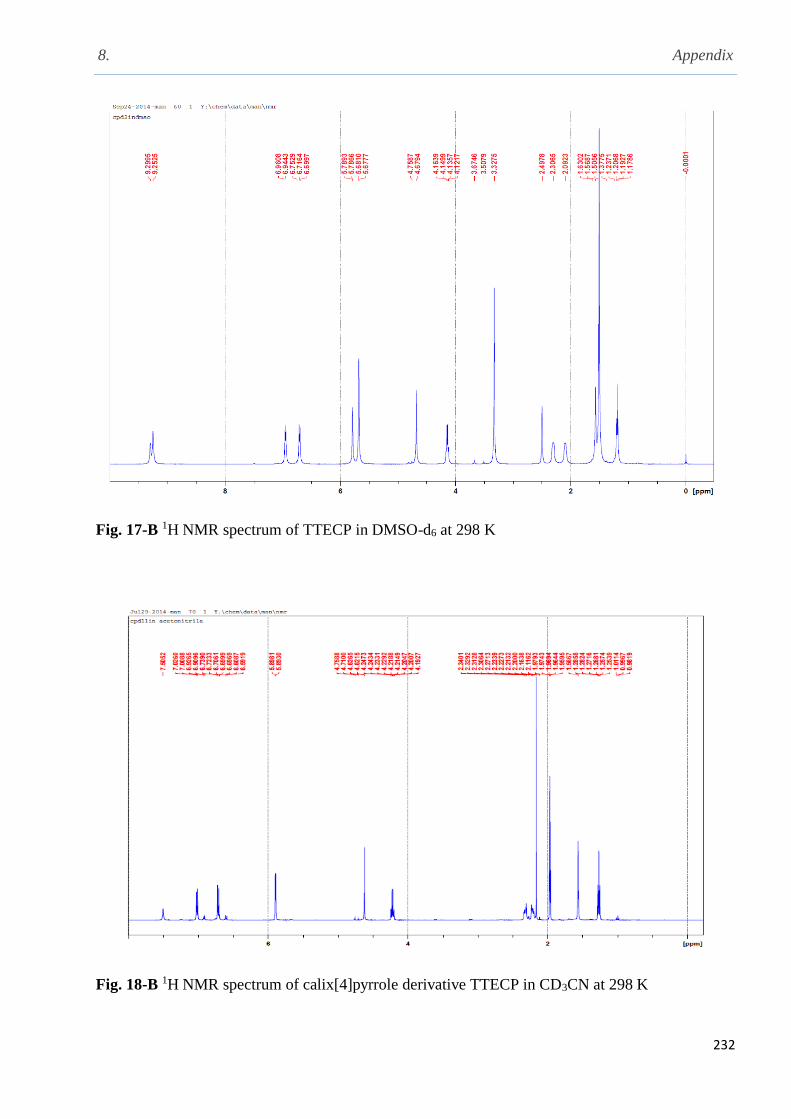
8. Appendix
232
Fig. 17-B 1H NMR spectrum of TTECP in DMSO-d6 at 298 K
Fig. 18-B 1H NMR spectrum of calix[4]pyrrole derivative TTECP in CD3CN at 298 K

8. Appendix
233
Fig. 19-B Appendix H NMR spectrum of C-pentyl-resorcin[4]arene in CDCl3 at 298 K
Fig. 20-B 1H NMR spectrum of PG6 in cdCl3 at 298 K

Appendix
234
Fig. 21-B 1 H NMR spectrum of PG11 in CDCl3 at 298 K

8. Appendix
235
Table 3.1 1H NMR titration experiment and the chemical shift changes from the addition of
increasing amounts of diclofenac to a fixed concentration of calix[4]arene amine in CD3CN at 298
K.
DF/[(CANH2)2] H1 H2 H3 H4 H5 H6 H7 H8 N-H 9
Free L 1.2 1.16 7.24 7.17 3.39 4.32 4.01 3.22 2.17
0.16 0.00 1.16 0.00 0.00 0.00 -0.01 0.01 0 0.14
0.32 0.00 1.16 0.00 0.00 0.00 -0.03 0.02 0.02 0.21
0.48 0.00 -0.01 -0.01 0.00 0.00 -0.05 0.04 0.04 0.24
0.64 0.00 -0.01 -0.01 -0.01 0.01 -0.08 0.06 0.06 0.26
0.8 0.01 -0.01 -0.01 -0.01 0.01 -0.1 0.07 0.07 0.27
0.96 0.01 -0.01 -0.01 -0.02 0.01 -0.12 0.08 0.09 0.27
1.12 0.01 -0.01 -0.01 -0.02 0.01 -0.14 0.09 0.1 0.27
1.28 -0.01 -0.01 -0.01 -0.01 0 -0.15 0.1 0.11 0.27
1.44 -0.01 -0.01 -0.01 -0.01 0.01 -0.16 0.11 0.12 0.26
1.6 -0.01 -0.01 -0.01 0.0 0.01 -0.17 0.12 0.12 0.25
1.76 -0.01 -0.01 -0.01 -0.01 0.01 -0.18 0.13 0.13 0.25
1.92 -0.01 -0.01 -0.01 0.00 0.01 -0.2 0.14 0.14 0.24
2.08 -0.01 -0.01 -0.01 0.00 0.00 -0.21 0.13 0.15 0.23
2.24 -0.01 -0.01 -0.01 0.00 0.01 -0.21 0.14 0.15 0.22
2.56 -0.01 -0.01 -0.01 0.00 0.01 -0.22 0.14 0.17 0.21
In Table 3.13 [CA-(NH2)2] and [DF] are the receptor and diclofenac concentrations in mol dm-3
[CAE] = 2 10-3 mol dm-3, [DF] 4 10-3 mol dm-3, 0.04 cm3 for each addition

8. Appendix
236
Table 3.2 Chemical shift changes for the receptor [(CA-(NH2)2] as a result from the addition of
increasing concentrations of clofibric acid in CD3CN at 298 K
[CLF]/[L] H1 H2 H3 H4 H5 H6 H7 H8 N-H
Free L 1.2 1.16 7.24 7.14 3.37 4.32 4.01 3.21 2.17
0.16 - - - 7.14 0.02 -0.01 0.01 0.01 0.02
0.32 - - - 0.01 0.03 -0.02 0.03 0.03 0.12
0.48 - - - 0.01 0.03 -0.05 0.04 0.05 0.14
0.64 - - - 0.02 0.03 -0.07 0.06 0.06 0.18
0.8 - - - 0.02 0.04 -0.09 0.07 0.07 0.21
0.96 - - - 0.02 0.04 -0.11 0.08 0.09 0.23
1.12 - - - 0.02 0.04 -0.13 0.09 0.1 0.26
1.28 - - - 0.02 0.06 -0.15 0.1 0.12 0.26
1.44 - - - 0.02 0.05 -0.16 0.11 0.13 0.27
1.6 - - - 0.02 0.05 -0.17 0.12 0.13 0.29
1.76 - - - 0.02 0.05 -0.18 0.12 0.14 0.30
1.92 - - - 0.02 0.05 -0.20 0.12 0.14 0.30
2.08 - - - 0.02 0.06 -0.21 0.12 0.15 0.32
2.24 - - - 0.02 0.06 -0.22 0.12 0.16 0.32
In the table 3.14 [CA-NH2)2] and [CLF] are the receptor and clofibric acid concentrations in mol dm-
3 units, [L] = 2 ×10⁻³ mol dm-3, [CLF] = 4 ×10⁻³ mol dm-3, 0.04 ml for each addition
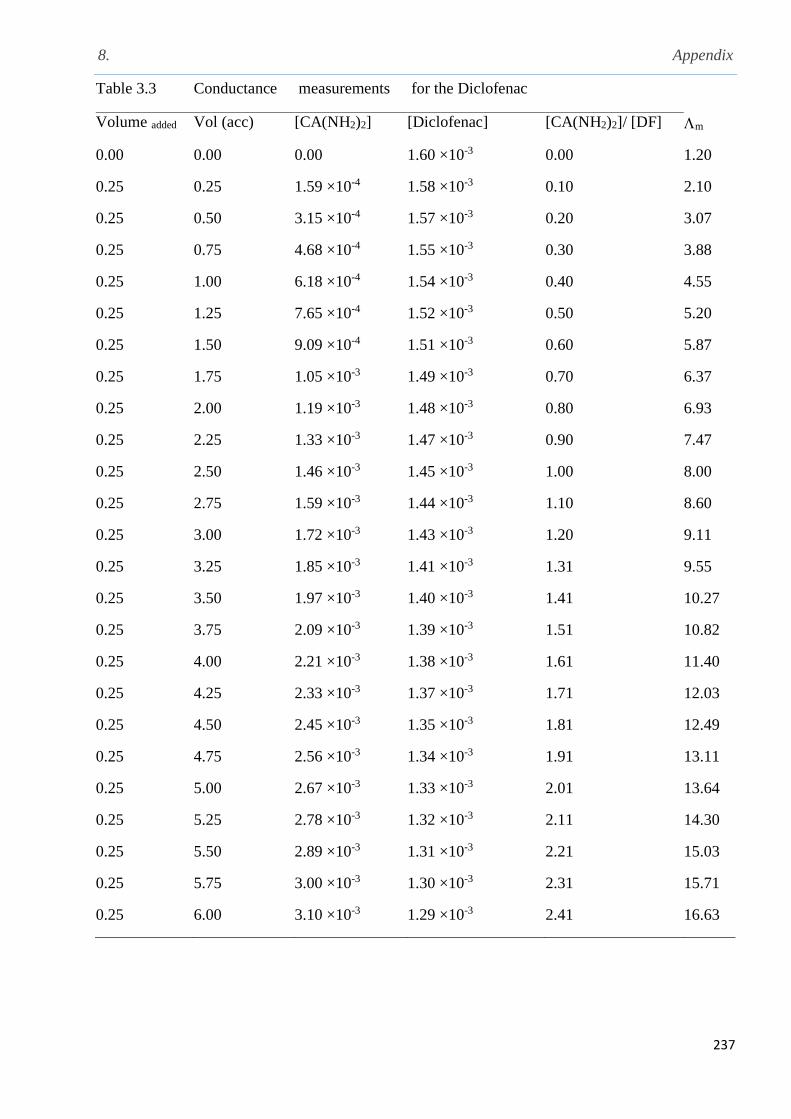
8. Appendix
237
Table 3.3 Conductance measurements for the Diclofenac
Volume added Vol (acc) [CA(NH2)2] [Diclofenac] [CA(NH2)2]/ [DF] m
0.00 0.00 0.00 1.60 ×10⁻³ 0.00 1.20
0.25 0.25 1.59 ×10⁻⁴ 1.58 ×10⁻³ 0.10 2.10
0.25 0.50 3.15 ×10⁻⁴ 1.57 ×10⁻³ 0.20 3.07
0.25 0.75 4.68 ×10⁻⁴ 1.55 ×10⁻³ 0.30 3.88
0.25 1.00 6.18 ×10⁻⁴ 1.54 ×10⁻³ 0.40 4.55
0.25 1.25 7.65 ×10⁻⁴ 1.52 ×10⁻³ 0.50 5.20
0.25 1.50 9.09 ×10⁻⁴ 1.51 ×10⁻³ 0.60 5.87
0.25 1.75 1.05 ×10⁻³ 1.49 ×10⁻³ 0.70 6.37
0.25 2.00 1.19 ×10⁻³ 1.48 ×10⁻³ 0.80 6.93
0.25 2.25 1.33 ×10⁻³ 1.47 ×10⁻³ 0.90 7.47
0.25 2.50 1.46 ×10⁻³ 1.45 ×10⁻³ 1.00 8.00
0.25 2.75 1.59 ×10⁻³ 1.44 ×10⁻³ 1.10 8.60
0.25 3.00 1.72 ×10⁻³ 1.43 ×10⁻³ 1.20 9.11
0.25 3.25 1.85 ×10⁻³ 1.41 ×10⁻³ 1.31 9.55
0.25 3.50 1.97 ×10⁻³ 1.40 ×10⁻³ 1.41 10.27
0.25 3.75 2.09 ×10⁻³ 1.39 ×10⁻³ 1.51 10.82
0.25 4.00 2.21 ×10⁻³ 1.38 ×10⁻³ 1.61 11.40
0.25 4.25 2.33 ×10⁻³ 1.37 ×10⁻³ 1.71 12.03
0.25 4.50 2.45 ×10⁻³ 1.35 ×10⁻³ 1.81 12.49
0.25 4.75 2.56 ×10⁻³ 1.34 ×10⁻³ 1.91 13.11
0.25 5.00 2.67 ×10⁻³ 1.33 ×10⁻³ 2.01 13.64
0.25 5.25 2.78 ×10⁻³ 1.32 ×10⁻³ 2.11 14.30
0.25 5.50 2.89 ×10⁻³ 1.31 ×10⁻³ 2.21 15.03
0.25 5.75 3.00 ×10⁻³ 1.30 ×10⁻³ 2.31 15.71
0.25 6.00 3.10 ×10⁻³ 1.29 ×10⁻³ 2.41 16.63
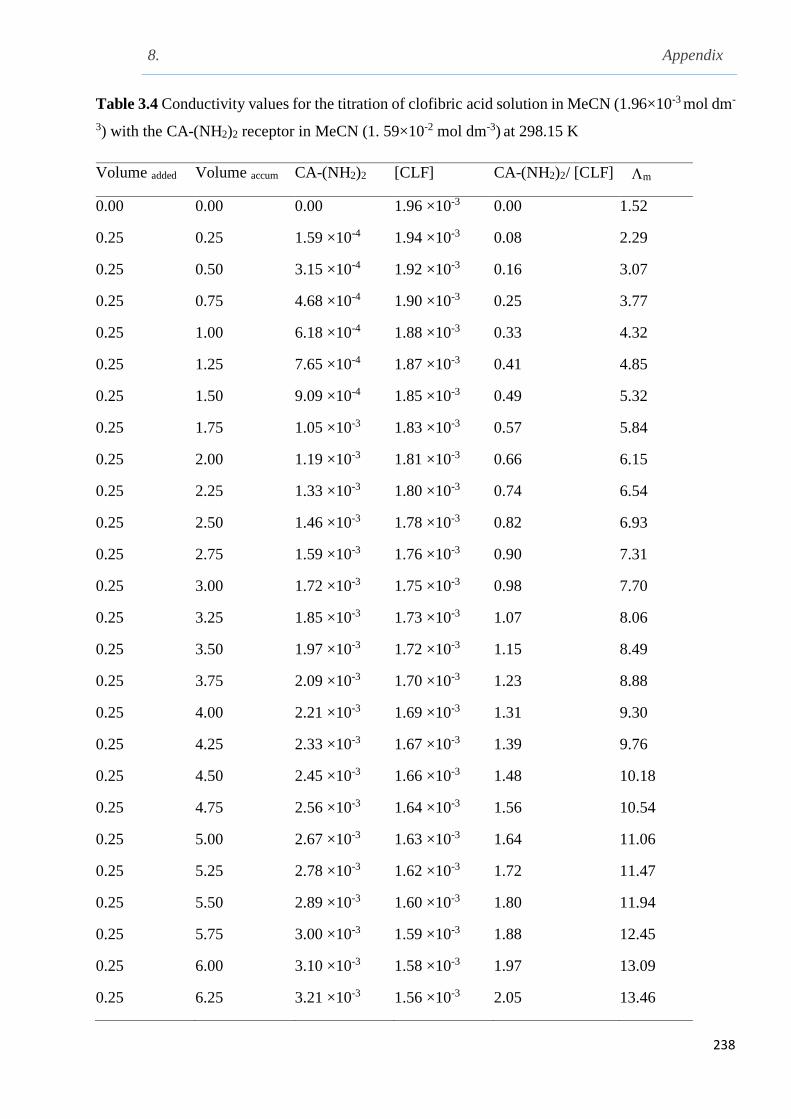
8. Appendix
238
Table 3.4 Conductivity values for the titration of clofibric acid solution in MeCN (1.96×10⁻³ mol dm-
3) with the CA-(NH2)2 receptor in MeCN (1. 59×10-2 mol dm-3) at 298.15 K
Volume added Volume accum CA-(NH2)2 [CLF] CA-(NH2)2/ [CLF] m
0.00 0.00 0.00 1.96 ×10⁻³ 0.00 1.52
0.25 0.25 1.59 ×10⁻⁴ 1.94 ×10⁻³ 0.08 2.29
0.25 0.50 3.15 ×10⁻⁴ 1.92 ×10⁻³ 0.16 3.07
0.25 0.75 4.68 ×10⁻⁴ 1.90 ×10⁻³ 0.25 3.77
0.25 1.00 6.18 ×10⁻⁴ 1.88 ×10⁻³ 0.33 4.32
0.25 1.25 7.65 ×10⁻⁴ 1.87 ×10⁻³ 0.41 4.85
0.25 1.50 9.09 ×10⁻⁴ 1.85 ×10⁻³ 0.49 5.32
0.25 1.75 1.05 ×10⁻³ 1.83 ×10⁻³ 0.57 5.84
0.25 2.00 1.19 ×10⁻³ 1.81 ×10⁻³ 0.66 6.15
0.25 2.25 1.33 ×10⁻³ 1.80 ×10⁻³ 0.74 6.54
0.25 2.50 1.46 ×10⁻³ 1.78 ×10⁻³ 0.82 6.93
0.25 2.75 1.59 ×10⁻³ 1.76 ×10⁻³ 0.90 7.31
0.25 3.00 1.72 ×10⁻³ 1.75 ×10⁻³ 0.98 7.70
0.25 3.25 1.85 ×10⁻³ 1.73 ×10⁻³ 1.07 8.06
0.25 3.50 1.97 ×10⁻³ 1.72 ×10⁻³ 1.15 8.49
0.25 3.75 2.09 ×10⁻³ 1.70 ×10⁻³ 1.23 8.88
0.25 4.00 2.21 ×10⁻³ 1.69 ×10⁻³ 1.31 9.30
0.25 4.25 2.33 ×10⁻³ 1.67 ×10⁻³ 1.39 9.76
0.25 4.50 2.45 ×10⁻³ 1.66 ×10⁻³ 1.48 10.18
0.25 4.75 2.56 ×10⁻³ 1.64 ×10⁻³ 1.56 10.54
0.25 5.00 2.67 ×10⁻³ 1.63 ×10⁻³ 1.64 11.06
0.25 5.25 2.78 ×10⁻³ 1.62 ×10⁻³ 1.72 11.47
0.25 5.50 2.89 ×10⁻³ 1.60 ×10⁻³ 1.80 11.94
0.25 5.75 3.00 ×10⁻³ 1.59 ×10⁻³ 1.88 12.45
0.25 6.00 3.10 ×10⁻³ 1.58 ×10⁻³ 1.97 13.09
0.25 6.25 3.21 ×10⁻³ 1.56 ×10⁻³ 2.05 13.46
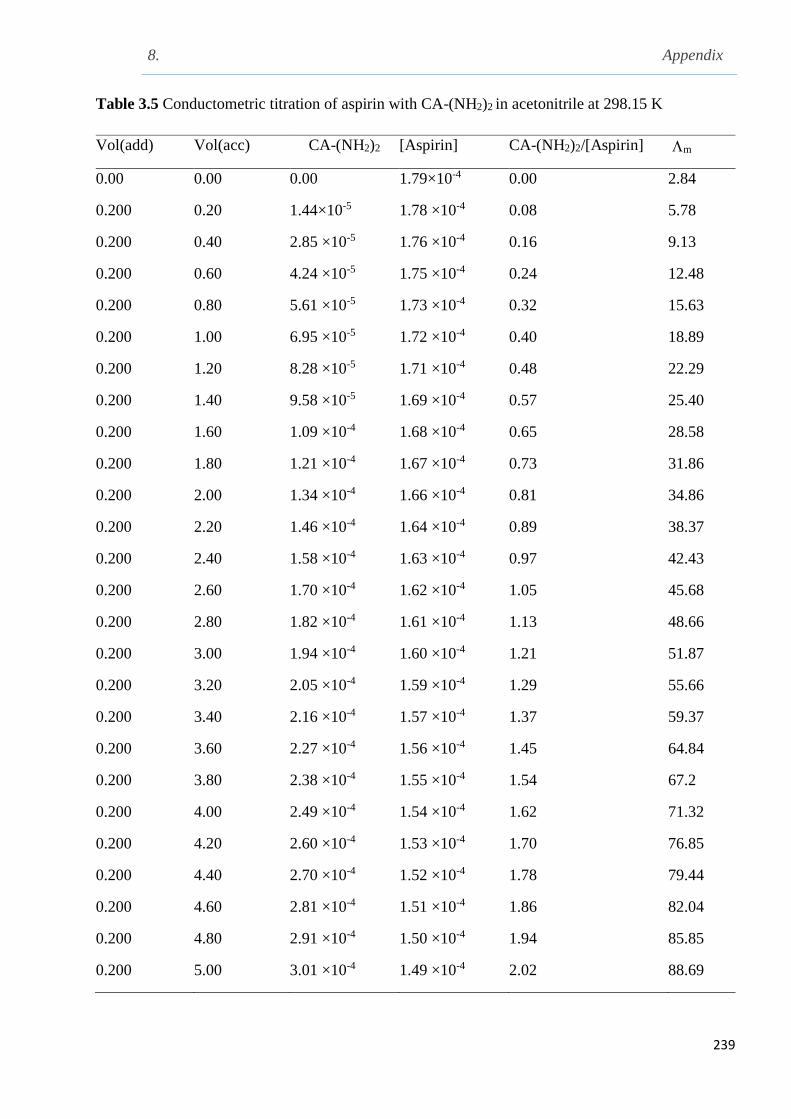
8. Appendix
239
Table 3.5 Conductometric titration of aspirin with CA-(NH2)2 in acetonitrile at 298.15 K
Vol(add) Vol(acc) CA-(NH2)2 [Aspirin] CA-(NH2)2/[Aspirin] m
0.00 0.00 0.00 1.79×10⁻⁴ 0.00 2.84
0.200 0.20 1.44×10⁻⁵ 1.78 ×10⁻⁴ 0.08 5.78
0.200 0.40 2.85 ×10⁻⁵ 1.76 ×10⁻⁴ 0.16 9.13
0.200 0.60 4.24 ×10⁻⁵ 1.75 ×10⁻⁴ 0.24 12.48
0.200 0.80 5.61 ×10⁻⁵ 1.73 ×10⁻⁴ 0.32 15.63
0.200 1.00 6.95 ×10⁻⁵ 1.72 ×10⁻⁴ 0.40 18.89
0.200 1.20 8.28 ×10⁻⁵ 1.71 ×10⁻⁴ 0.48 22.29
0.200 1.40 9.58 ×10⁻⁵ 1.69 ×10⁻⁴ 0.57 25.40
0.200 1.60 1.09 ×10⁻⁴ 1.68 ×10⁻⁴ 0.65 28.58
0.200 1.80 1.21 ×10⁻⁴ 1.67 ×10⁻⁴ 0.73 31.86
0.200 2.00 1.34 ×10⁻⁴ 1.66 ×10⁻⁴ 0.81 34.86
0.200 2.20 1.46 ×10⁻⁴ 1.64 ×10⁻⁴ 0.89 38.37
0.200 2.40 1.58 ×10⁻⁴ 1.63 ×10⁻⁴ 0.97 42.43
0.200 2.60 1.70 ×10⁻⁴ 1.62 ×10⁻⁴ 1.05 45.68
0.200 2.80 1.82 ×10⁻⁴ 1.61 ×10⁻⁴ 1.13 48.66
0.200 3.00 1.94 ×10⁻⁴ 1.60 ×10⁻⁴ 1.21 51.87
0.200 3.20 2.05 ×10⁻⁴ 1.59 ×10⁻⁴ 1.29 55.66
0.200 3.40 2.16 ×10⁻⁴ 1.57 ×10⁻⁴ 1.37 59.37
0.200 3.60 2.27 ×10⁻⁴ 1.56 ×10⁻⁴ 1.45 64.84
0.200 3.80 2.38 ×10⁻⁴ 1.55 ×10⁻⁴ 1.54 67.2
0.200 4.00 2.49 ×10⁻⁴ 1.54 ×10⁻⁴ 1.62 71.32
0.200 4.20 2.60 ×10⁻⁴ 1.53 ×10⁻⁴ 1.70 76.85
0.200 4.40 2.70 ×10⁻⁴ 1.52 ×10⁻⁴ 1.78 79.44
0.200 4.60 2.81 ×10⁻⁴ 1.51 ×10⁻⁴ 1.86 82.04
0.200 4.80 2.91 ×10⁻⁴ 1.50 ×10⁻⁴ 1.94 85.85
0.200 5.00 3.01 ×10⁻⁴ 1.49 ×10⁻⁴ 2.02 88.69
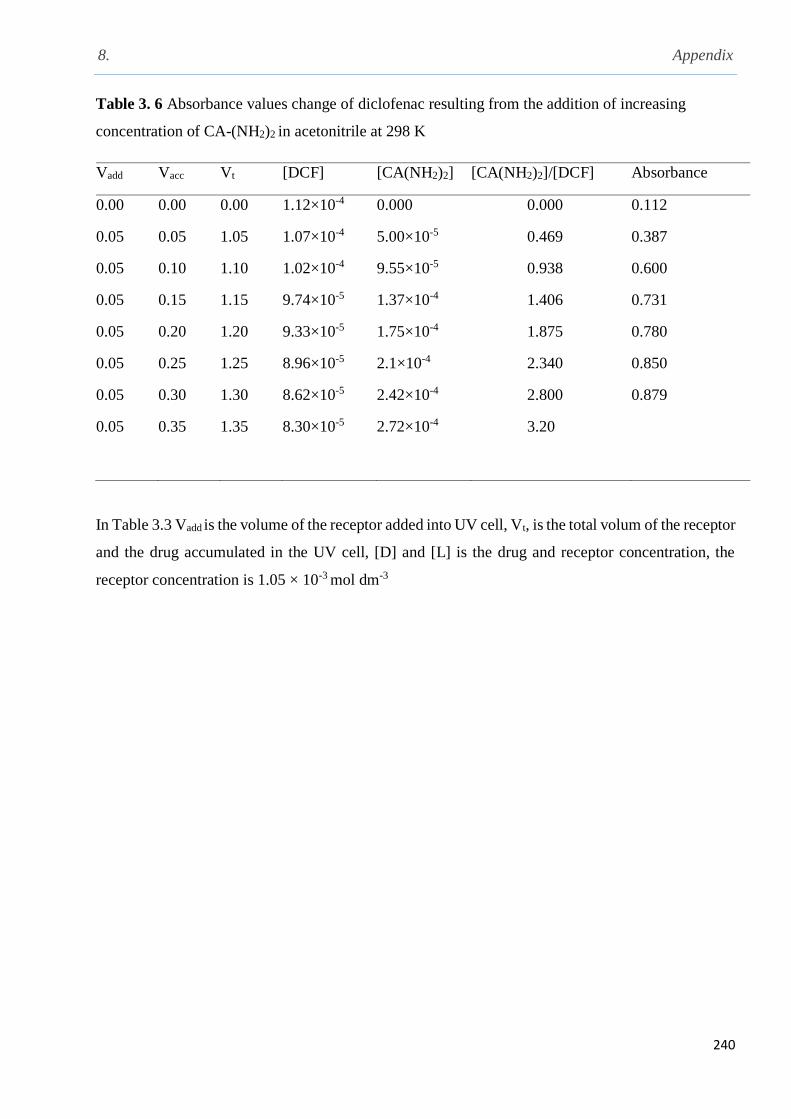
8. Appendix
240
Table 3. 6 Absorbance values change of diclofenac resulting from the addition of increasing
concentration of CA-(NH2)2 in acetonitrile at 298 K
Vadd Vacc Vt [DCF] [CA(NH2)2] [CA(NH2)2]/[DCF] Absorbance
0.00 0.00 0.00 1.12×10⁻⁴ 0.000 0.000 0.112
0.05 0.05 1.05 1.07×10⁻⁴ 5.00×10⁻⁵ 0.469 0.387
0.05 0.10 1.10 1.02×10⁻⁴ 9.55×10⁻⁵ 0.938 0.600
0.05 0.15 1.15 9.74×10⁻⁵ 1.37×10⁻⁴ 1.406 0.731
0.05 0.20 1.20 9.33×10⁻⁵ 1.75×10⁻⁴ 1.875 0.780
0.05 0.25 1.25 8.96×10⁻⁵ 2.1×10⁻⁴ 2.340 0.850
0.05
0.05
0.30
0.35
1.30
1.35
8.62×10⁻⁵
8.30×10⁻⁵
2.42×10⁻⁴
2.72×10⁻⁴
2.800
3.20
0.879
In Table 3.3 Vadd is the volume of the receptor added into UV cell, Vt, is the total volum of the receptor
and the drug accumulated in the UV cell, [D] and [L] is the drug and receptor concentration, the
receptor concentration is 1.05 × 10⁻³ mol dm-3
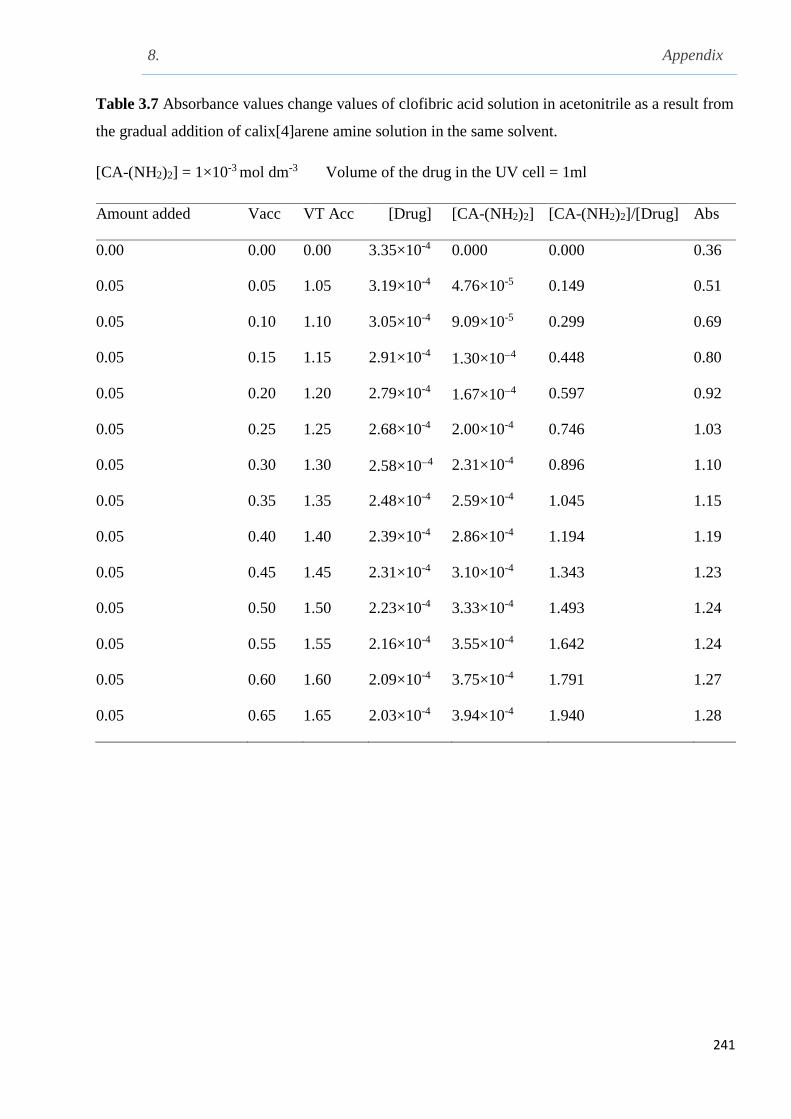
8. Appendix
241
Table 3.7 Absorbance values change values of clofibric acid solution in acetonitrile as a result from
the gradual addition of calix[4]arene amine solution in the same solvent.
[CA-(NH2)2] = 1×10⁻³ mol dm-3 Volume of the drug in the UV cell = 1ml
Amount added Vacc VT Acc [Drug] [CA-(NH2)2] [CA-(NH2)2]/[Drug] Abs
0.00 0.00 0.00 3.35×10⁻⁴ 0.000 0.000 0.36
0.05 0.05 1.05 3.19×10⁻⁴ 4.76×10⁻⁵ 0.149 0.51
0.05 0.10 1.10 3.05×10⁻⁴ 9.09×10⁻⁵ 0.299 0.69
0.05 0.15 1.15 2.91×10⁻⁴ 1.30×10⁴ 0.448 0.80
0.05 0.20 1.20 2.79×10⁻⁴ 1.67×10⁴ 0.597 0.92
0.05 0.25 1.25 2.68×10⁻⁴ 2.00×10⁻⁴ 0.746 1.03
0.05 0.30 1.30 2.58×10⁴ 2.31×10⁻⁴ 0.896 1.10
0.05 0.35 1.35 2.48×10⁻⁴ 2.59×10⁻⁴ 1.045 1.15
0.05 0.40 1.40 2.39×10⁻⁴ 2.86×10⁻⁴ 1.194 1.19
0.05 0.45 1.45 2.31×10⁻⁴ 3.10×10⁻⁴ 1.343 1.23
0.05 0.50 1.50 2.23×10⁻⁴ 3.33×10⁻⁴ 1.493 1.24
0.05 0.55 1.55 2.16×10⁻⁴ 3.55×10⁻⁴ 1.642 1.24
0.05 0.60 1.60 2.09×10⁻⁴ 3.75×10⁻⁴ 1.791 1.27
0.05 0.65 1.65 2.03×10⁻⁴ 3.94×10⁻⁴ 1.940 1.28
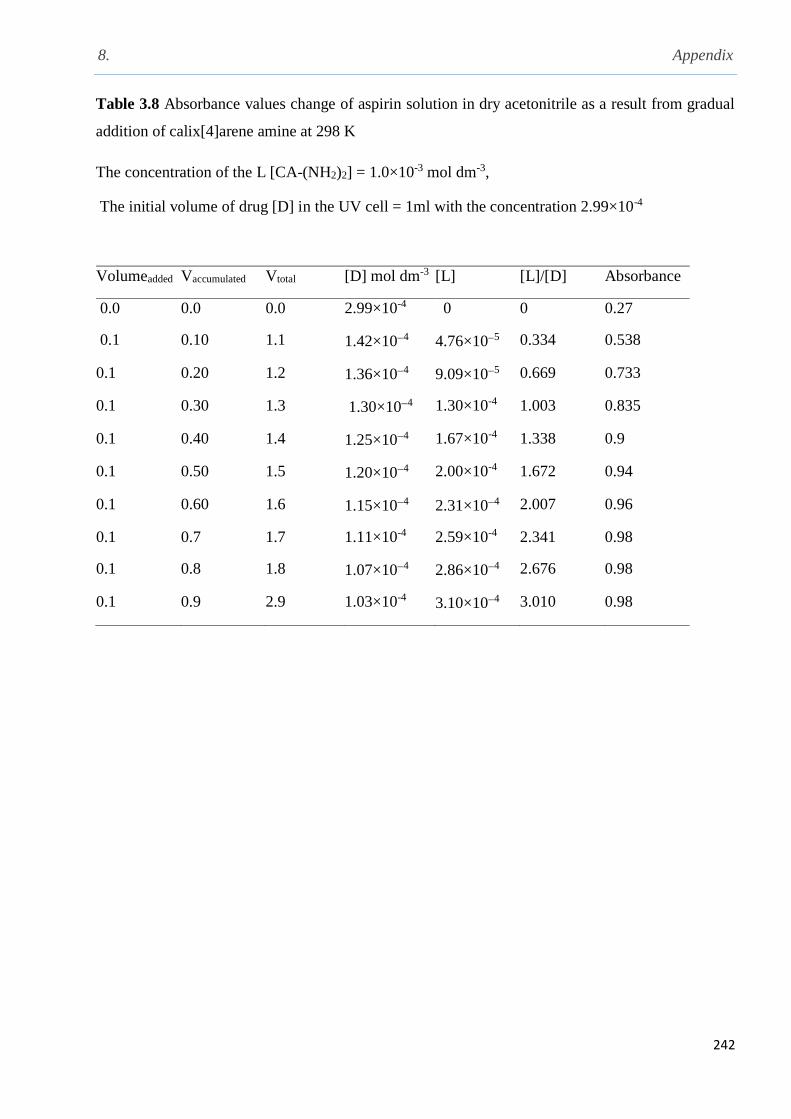
8. Appendix
242
Table 3.8 Absorbance values change of aspirin solution in dry acetonitrile as a result from gradual
addition of calix[4]arene amine at 298 K
The concentration of the L [CA-(NH2)2] = 1.0×10⁻³ mol dm-3,
The initial volume of drug [D] in the UV cell = 1ml with the concentration 2.99×10⁻⁴
Volumeadded Vaccumulated Vtotal [D] mol dm-3 [L] [L]/[D] Absorbance
0.0 0.0 0.0 2.99×10⁻⁴ 0 0 0.27
0.1 0.10 1.1 1.42×10⁴ 4.76×10⁵ 0.334 0.538
0.1 0.20 1.2 1.36×10⁴ 9.09×10⁵ 0.669 0.733
0.1 0.30 1.3 1.30×10⁴ 1.30×10⁻⁴ 1.003 0.835
0.1 0.40 1.4 1.25×10⁴ 1.67×10⁻⁴ 1.338 0.9
0.1 0.50 1.5 1.20×10⁴ 2.00×10⁻⁴ 1.672 0.94
0.1 0.60 1.6 1.15×10⁴ 2.31×10⁴ 2.007 0.96
0.1 0.7 1.7 1.11×10⁻⁴ 2.59×10⁻⁴ 2.341 0.98
0.1 0.8 1.8 1.07×10⁴ 2.86×10⁴ 2.676 0.98
0.1 0.9 2.9 1.03×10⁻⁴ 3.10×10⁴ 3.010 0.98


![7. Supramolecular structures - Acclab h55.it.helsinki.fiknordlun/nanotiede/nanosc7nc.pdf · 7. Supramolecular structures [Poole-Owens 11.5] Supramolecular structures are large molecules](https://img.pdfslide.us/doc/110x75/5f071ded7e708231d41b63bf/7-supramolecular-structures-acclab-h55it-knordlunnanotiedenanosc7ncpdf.jpg)