Embed Size (px)
Citation preview
RESTRAIL SCP1-GA-2011-285153
RESTRAIL-WP5-CIDAUT-D5.2-B2-24102014_public Page 1 of 168 24 October 2014
RESTRAIL
REduction of Suicides and Trespasses on RAILway property
Collaborative project
Evaluation of measures, recommendations and guidelines for further implementation
Deliverable D5.2
Due date of deliverable: 30/09/2014 Actual submission date: 1/11/2014
Project Coordinator: Jacques Colliard International Union of Railways (UIC) [email protected]
RESTRAIL SCP1-GA-2011-285153
RESTRAIL-WP5-CIDAUT-D5.2-B2-24102014_public Page 2 of 168 24 October 2014
Document details: Title Evaluation of measures, recommendations and guidelines for
further implementation. Workpackage WP5 Date 31/10/2014 Author(s) Plaza, J.; Bernard, V.; Burkhardt, J.-M.; Abbott, P.; Elmadagli,
B.; Hedvist, M.; Hoogcarspel, B.; Kallberg, V-P.; Ladwig, K-H.; Lukaschek, K.; Rådbo, H.; Rafaeli, G.; Ryan, B.; Silla, A.; Whalley, S.; and Van der Veer, A.
Responsible Partner Plaza, J. and Burkhardt, J.-M. Document Code RESTRAIL_CIDAUT_ WP5_D5.2_B Version V12 Status Final
Dissemination level:
Project co-funded by the European Commission within the Seventh Framework Programme
Document history: Revision Date Authors Description 1 07/07/2014 Plaza, J. Compilation of all evaluation data and results
2 29/08/2014 Plaza, J. Revision of contents by WP5 partners.
3 20/09/2014 Plaza, J. Inclusion CBA section and missing information
4 14/10/2014 WP5 partners Inclusion comments and missing information
5 24/10/2014 Plaza; J and Burkhardt, J-M
Inclusion final CBA section and conclusion
6 07/10/2014 Plaza, J. Final revision of the document by Consortium
7 01/11/2014 Plaza, J. Inclusion of all final comments/ changes
PU Public
X
PP Restricted to other programme participants (including the Commission Services)
RE Restricted to a group specified by the consortium (including the Commission) Services)
CO Confidential, only for members of the consortium (including the Commission Services)
RESTRAIL SCP1-GA-2011-285153
RESTRAIL-WP5-CIDAUT-D5.2-B2-24102014_public Page 3 of 168 24 October 2014
RESTRAIL Consortium
List of Beneficiaries
No Beneficiary organisation name Beneficiary short name
Country
1 Union Internationale des chemins de fer UIC FR
2 Teknologian Tutkimuskeskus VTT VTT FI
3 Trafikverket - TRV TrV SE
4 Institut français des sciences et technologies des transports, de l'aménagement et des réseaux
IFSTTAR
FR
5 MTRS3 Solutions and Services LTD MTR IL
6 Fundación CIDAUT, Fundación para la investigación y Desarrollo en Transporte y Energia CIDAUT ES
7 Helmholtz Zentrum München Deutsches Forschungszentrum für Gesundheit und Umwelt (GmbH)
HMGU DE
8 Karlstad University KAU SE
9 Fundación de los Ferrocarriles Españoles FFE ES
10 Turkish State Railway Administration TCDD TK
11 Deutsche Bahn AG DB DE
12 Instytut Kolejnictwa IK PL
13 ProRail B.V PR NL
14 Nice Systems Ltd NICE IL
15 Ansaldo STS ASTS IT
16 University of Nottingham UNOTT UK
17 INFRABEL INFRABEL BE
RESTRAIL SCP1-GA-2011-285153
RESTRAIL-WP5-CIDAUT-D5.2-B2-24102014_public Page 4 of 168 24 October 2014
Table of contents
1. EXECUTIVE SUMMARY ....................................................................... 13
2. INTRODUCTION ................................................................................... 15
2.1 Purpose of the document ....................................................................................................15 2.2 Definitions and acronyms....................................................................................................16
3. CBA AND CEA ANALYSIS IN THE RESTRAIL FRAMEWORK ........... 18
3.1 Introduction and definitions ................................................................................................18 3.2 Collected data for costs, effectiveness and benefits assessment ...................................19 3.2.1 COST DATA ...........................................................................................................................19 3.2.2 EFFECTIVENESS AND BENEFITS DATA .....................................................................................20 3.2.3 ESTIMATE OF A VALUE FOR CALCULATING THE IMPACT .............................................................21 3.3 Choosing between CBA and CEA .......................................................................................22 3.4 Reference costs and values to be used ..............................................................................23 3.4.1 VALUES OF PREVENTIVE CAUSALITY .......................................................................................23 3.4.2 VALUES OF TIME FOR ESTIMATING COST OF DELAYS ................................................................23 3.4.3 OTHER REFERENCE VALUE TO BE DEFINED .............................................................................24
4. EVALUATION OF THE MEASURES: SAFETY IMPACT ON RAILWAY CONTEXT ................................................................................................... 26
4.1 Warning signs and posters- CIDAUT ..................................................................................26 4.1.1 OVERVIEW OF THE PILOTED MEASURE ....................................................................................26 4.1.2 METHODOLOGY TO EVALUATE THE PILOTED MEASURE .............................................................26 4.1.3 REPORTED COSTS FOR MEASURE ..........................................................................................29 4.1.4 EVALUATION RESULTS ...........................................................................................................29 4.1.4 APPLICABILITY OF RESULTS TO DIFFERENT CIRCUMSTANCES ....................................................37 4.1.5 DISCUSSION .........................................................................................................................38 4.2 Railway safety education programme-FFE ........................................................................39 4.2.1 OVERVIEW OF THE PILOTED MEASURE ....................................................................................39 3.2.2 METHODOLOGY TO EVALUATE THE PILOTED MEASURES ............................................................39 4.2.2 EVALUATION RESULTS ...........................................................................................................41 4.2.3 REPORTED COSTS FOR MEASURE ..........................................................................................49 4.2.4 EVALUATION RESULTS: PUPIL WORKSHOP ..............................................................................50 4.2.5 APPLICABILITY OF RESULTS TO DIFFERENT CIRCUMSTANCES ....................................................64 4.2.6 DISCUSSION .........................................................................................................................66 4.3 Education at schools for 8–11 year old children-VTT ........................................................68 4.3.1 OVERVIEW OF THE MEASURE .................................................................................................68 4.3.2 METHODOLOGY TO EVALUATE THE EFFECT .............................................................................68 4.3.3 REPORTED COSTS FOR MEASURE ..........................................................................................69 4.3.4 EVALUATION RESULTS ...........................................................................................................69 4.3.5 DISCUSSION AND CONCLUSIONS ............................................................................................73
RESTRAIL SCP1-GA-2011-285153
RESTRAIL-WP5-CIDAUT-D5.2-B2-24102014_public Page 5 of 168 24 October 2014
4.3.6 APPLICABILITY OF RESULTS TO DIFFERENT CIRCUMSTANCES ....................................................74 4.4 Video enforcement and sound warning-VTT ......................................................................75 4.4.1 OVERVIEW OF THE PILOTED MEASURE ....................................................................................75 4.4.2 METHODOLOGY TO EVALUATE THE PILOTED MEASURE .............................................................75 4.4.3 REPORTED COSTS FOR MEASURE ..........................................................................................76 4.4.4 EVALUATION RESULTS ...........................................................................................................77 4.4.5 DISCUSSION AND CONCLUSIONS ............................................................................................80 4.5 A combination of measures at Ayden Station-TCDD .........................................................82 4.5.1 OVERVIEW OF THE PILOTED MEASURE ....................................................................................82 4.5.2 METHODOLOGY TO EVALUATE THE PILOTED MEASURES ...........................................................82 4.5.3 REPORTED COSTS FOR MEASURE ..........................................................................................85 4.5.4 EVALUATION RESULTS ...........................................................................................................85 4.5.5 APPLICABILITY OF RESULTS TO DIFFERENT CIRCUMSTANCES ....................................................87 4.5.6 DISCUSSION .........................................................................................................................87 4.6 Mid-platform fencing-U.NOT ................................................................................................88 4.6.1 OVERVIEW OF THE PILOTED MEASURE ....................................................................................88 4.6.2 METHODOLOGY TO EVALUATE THE PILOTED MEASURE .............................................................88 4.6.3 REPORTED COSTS FOR MEASURE ..........................................................................................93 4.6.4 EVALUATION RESULTS ...........................................................................................................93 4.6.5 APPLICABILITY OF RESULTS TO DIFFERENT CIRCUMSTANCES .................................................. 118 4.6.6 DISCUSSION ....................................................................................................................... 118 4.7 Societal collaboration to prevent railway suicide- TrV&KAU .......................................... 120 4.7.1 OVERVIEW OF THE PILOTED MEASURE .................................................................................. 120 4.7.2 METHODOLOGY TO EVALUATE THE PILOTED MEASURES ......................................................... 120 4.7.3 REPORTED COSTS FOR MEASURE ........................................................................................ 120 4.7.4 EVALUATION RESULTS ......................................................................................................... 121 4.7.5 APPLICABILITY OF RESULTS TO DIFFERENT CIRCUMSTANCES .................................................. 127 4.7.6 DISCUSSION ....................................................................................................................... 127 4.8 Gatekeeper Programme – HMGU ...................................................................................... 129 4.8.1 OVERVIEW OF THE PILOTED MEASURE .................................................................................. 129 4.8.2 METHODOLOGY TO EVALUATE THE PILOTED MEASURES ......................................................... 129 4.8.3 REPORTED COSTS FOR MEASURE ........................................................................................ 130 4.8.4 EVALUATION RESULTS ......................................................................................................... 130 4.8.5 APPLICABILITY OF RESULTS TO DIFFERENT CIRCUMSTANCES .................................................. 132 4.8.6 DISCUSSION ....................................................................................................................... 132 4.9 Gatekeeper Programme – PRORAIL ................................................................................. 133 4.9.1 OVERVIEW OF THE PILOTED MEASURE .................................................................................. 133 4.9.2 METHODOLOGY TO EVALUATE THE PILOTED MEASURES ......................................................... 133 4.9.3 REPORTED COSTS FOR MEASURE ........................................................................................ 134 4.9.4 EVALUATION RESULTS ......................................................................................................... 135 4.9.5 APPLICABILITY OF RESULTS TO DIFFERENT CIRCUMSTANCES .................................................. 142 4.9.6 DISCUSSION ....................................................................................................................... 142 4.10 Enhancement of cooperation of the police and legal entities through Computer Based Training-MTRS3 .......................................................................................................................... 143 4.10.1 OVERVIEW OF THE PILOTED MEASURE .................................................................................. 143 4.10.2 METHODOLOGY TO EVALUATE THE PILOTED MEASURES ......................................................... 143 4.10.3 REPORTED COSTS FOR MEASURE ........................................................................................ 144 4.10.4 EVALUATION RESULTS ......................................................................................................... 144 4.10.5 APPLICABILITY OF RESULTS TO DIFFERENT CIRCUMSTANCES .................................................. 147 4.10.6 DISCUSSION ....................................................................................................................... 147 4.11 Forward Facing CCTV in trains- MTRS3 ........................................................................... 149 4.11.1 OVERVIEW OF THE PILOTED MEASURE .................................................................................. 149
RESTRAIL SCP1-GA-2011-285153
RESTRAIL-WP5-CIDAUT-D5.2-B2-24102014_public Page 6 of 168 24 October 2014
4.11.2 METHODOLOGY TO EVALUATE THE PILOTED MEASURES ......................................................... 151 4.11.3 REPORTED COSTS FOR MEASURE ........................................................................................ 151 4.11.4 EVALUATION RESULTS ......................................................................................................... 151 4.11.5 APPLICABILITY OF RESULTS TO DIFFERENT CIRCUMSTANCES .................................................. 154 4.11.6 DISCUSSION ....................................................................................................................... 155
5. GENERAL CONCLUSIONS: RECOMMENDATIONS ......................... 158
5.1. Lessons learnt in suicide prevention ................................................................................. 158 5.2. Lessons learnt in trespass prevention ............................................................................... 159 5.3. Lessons learnt in post incident consequences mitigation ............................................... 161 5.4. The way forward ................................................................................................................... 163
6. REFERENCES .................................................................................... 165
RESTRAIL SCP1-GA-2011-285153
RESTRAIL-WP5-CIDAUT-D5.2-B2-24102014_public Page 7 of 168 24 October 2014
Tables Table 3.2-1: Cost data obtained from RESTRAIL pilot tests .................................................... 19
Table 3.2-2 Two Pilot tests’ targets for effectiveness that are directly associable with values ................................................................................................................................................ 20
Table 3.2-3: The remaining Pilot tests’ targets for effectiveness for which it is required to make assumption for their transformation into monetary benefits .......................................... 21
Table 3.3-1: Advantages and disadvantages of CEA and CBA .............................................. 22
Table 3.4-1: Value of Statistical Life (VSL) ................................................................................. 23
Table 3.4-2 : Values for Social Discount Rate to be used for CBA in some European countries, as reported by Florio et al. (2008) .............................................................................. 25
Table 4.1-1: Total number of participants .................................................................................... 28
Table 4.1-2: Group of participants ................................................................................................ 28
Table 4.1-3: Gender ........................................................................................................................ 28
Table 4.1-4: Occupation of the participants ................................................................................ 28
Table 4.1-5: Reported costs for Warning signs and posters .................................................... 29
Table 4.1-6: Chi Square tests for the significance of the results ............................................. 30
Table 4.1-7: CEA of Pilot test 1: “Warning signs and posters” ................................................ 37
Table 4.2-1: Monitoring data collected ......................................................................................... 40
Table 4.2-2: Data of the Railway Safety Education Programme pilot. .................................... 42
Table 4.2-3: Change in the level of confidence and capacity .................................................. 49
Table 4.2-4: Costs for the implementation of railway safety education programme ............ 50
Table 4.2-5: Pre-survey. Knowledge on railway safety ............................................................. 51
Table 4.2-6: Post-survey. Knowledge on railway safety ........................................................... 51
Table 4.2-7: High speed trains are faster than a car ................................................................. 51
Table 4.2-8: High speed trains are very fast and take a long time to stop ............................. 52
Table 4.2-9: If you are on the railway track and see a train coming, the train has time to stop .................................................................................................................................................... 52
Table 4.2-10: Trains are always noisy and so it´s easy to hear when they are coming down the track or into the station............................................................................................................. 52
Table 4.2-11: Firefighters are allowed to cross the railway tracks .......................................... 53
Table 4.2-12: People are allowed to cross railway tracks ........................................................ 53
Table 4.2-13: You are not allowed to cross the yellow line on the platform .......................... 53
Table 4.2-14: You should not listen to music with headphones/earphones at a train station because it may stop you from hearing the train coming and from hearing the warning messages ......................................................................................................................................... 54

RESTRAIL SCP1-GA-2011-285153
RESTRAIL-WP5-CIDAUT-D5.2-B2-24102014_public Page 8 of 168 24 October 2014
Table 4.2-15: You are allowed to throw balls onto the track .................................................... 54
Table 4.2-16: Knowledge on railway safety by location ............................................................ 55
Table 4.2-17: Knowledge gained in the workshop by city ........................................................ 56
Table 4.2-18: Knowledge on railway safety by school .............................................................. 57
Table 4.2-19: Knowledge gained in the workshop by school ................................................... 58
Table 4.2-20: Knowledge on railway safety by Grade ............................................................... 59
Table 4.2-21: Knowledge gained in the workshop by Grade ................................................... 60
Table 4.2-22 CEA of Pilot test 2 Railway safety education ...................................................... 63
Table 4.3-1: Costs Education at schools for 8-11 year old children ........................................ 69
Table 4.3-2: Share of correct answers in base level (before) and post-lesson (after) surveys .............................................................................................................................................. 70
Table 4.3-3: Share of correct answers in base level (before) and post-lesson (after) surveys .............................................................................................................................................. 70
Table 4.3-4: Share of correct answers in base level (before) and post-lesson (after) surveys .............................................................................................................................................. 71
Table 4.3-5: Summary of statistically significant differences between answers in base level and post-lesson surveys................................................................................................................. 71
Table 4.3-6: CEA of Pilot test 3 “: Education at schools for 8–11 year old children”............ 72
Table 4.4-1: costs for video enforcement and sound warning ................................................. 76
Table 4.4-2: Observed daily numbers of trespassers at the Kirkkonummi site ..................... 77
Table 4.4-3: Observed daily numbers of trespassers at the Tammisaari site ....................... 77
Table 4.4-4: Summary of trespasser counts at the two test sites ............................................ 78
Table 4.4-5: CEA for video enforcement and sound warning .................................................. 79
Table 4.5-1: Descriptions of all measures implemented at Aydin station .............................. 83
Table 4.5-2: Costs considered in the pilot test named “Combination of measures at Aydin station”............................................................................................................................................... 85
Table 4.5-3: Results of the camera records in Aydin Station ................................................... 86
Table 4.5-4 CEA of Pilot test 5 " a combination of measures at Aydin station" .................... 86
Table 4.6-1: Costs associated to Mid-platform fencing at stations for the prevention of rail suicide ............................................................................................................................................... 93
Table 4.6-2: Extract from a table collating progress with the implementation of a range of other preventative measures ......................................................................................................... 97
Table 4.6-3: Extent of implementation of the mid-platform fencing intervention in each of the three pilot areas ...................................................................................................................... 101
Table 4.6-4: Factors influencing the design and implementation of the programme ......... 102
RESTRAIL SCP1-GA-2011-285153
RESTRAIL-WP5-CIDAUT-D5.2-B2-24102014_public Page 9 of 168 24 October 2014
Table 4.6-5: Extract showing fatality incidents on different lines at stations, by year, including details of the dates of restriction of access to fast lines at stations ...................... 103
Table 4.6-6: Numbers of incidents on fast lines and slow lines at each station .................. 105
Table 4.6-7: Numbers of incidents at stations with different types of restrictions to access .......................................................................................................................................................... 107
Table 4.6-8: Overview and assessment of evidence that has been used in the evaluation, linked to the structure of the logic map ...................................................................................... 114
Table 4.6-9: CEA of Pilot test 6: “Mid-platform fencing” .......................................................... 117
Table 4.7-1: Societal collaboration to prevent railway suicide ............................................... 120
Table 4.7-2: Number of suicide threats by month .................................................................... 123
Table 4.7-3: Number of suicide threats by weekday ............................................................... 123
Table 4.7-4: Number of suicide threats by time of day ............................................................ 123
Table 4.7-5: Number of suicide threats by access point ......................................................... 124
Table 4.7-6: Number of suicide threats by action .................................................................... 124
Table 4.7-7: Number of suicide treats by type of traffic stop .................................................. 124
Table 4.7-8: Number of suicide treats by taken into custody ................................................. 124
Table 4.7-9: Number of suicide treats by length of delay ....................................................... 125
Table 4.7-10: Admitted numbers into numerical example regarding traffic stop on the railway ............................................................................................................................................. 126
Table 4.7-11: CEA of “Societal collaboration to prevent railway suicide” ............................ 126
Table 4.8-1: Reported Costs for German gatekeeper programme ....................................... 130
Table 4.8-2 Summary of results of data collection ................................................................... 132
Table 4.9-1: Costs for the Gatekeeper programme in the Netherlands ............................... 134
Table 4.9-2: Characteristics of the interviewees ...................................................................... 135
Table 4.9-3: Number of questionnaires filled out ..................................................................... 136
Table 4.9-4: Personal data referred to participants of this study ........................................... 136
Table 4.9-5: Mean score of Feeling of competence ................................................................ 136
Table 4.9-6: Mean score of knowledge ...................................................................................... 138
Table 4.9-7: Number of reported sightings and conversations with potentially suicidal people .............................................................................................................................................. 140
Table 4.9-8: Number of conversations with potentially suicidal people per respondent and their feeling of competence .......................................................................................................... 140
Table 4.9-9: Reported endings of conversations with suicidal people.................................. 141
Table 4.9-10: Feeling after an intervention in relation to the social environment of the respondents .................................................................................................................................... 141
RESTRAIL SCP1-GA-2011-285153
RESTRAIL-WP5-CIDAUT-D5.2-B2-24102014_public Page 10 of 168 24 October 2014
Table 4.10-1: Costs of measure: enhancement of cooperation of the police and legal entities through CBT ..................................................................................................................... 144
Table 4.11-1: Costs associated to the Forward Facing on train CCTV ................................ 151
Table 4.11-2: Fatalities - delays & costs .................................................................................... 152
Table 4.11-3: Non-recurring costs - project management ...................................................... 153
Table 4.11-4: Optional non-recurring costs - software & hardware ...................................... 153
Table 4.11-5: Non recurring costs – single cab installation .................................................... 153
Table 4.11-6: Recurring costs ..................................................................................................... 154
RESTRAIL SCP1-GA-2011-285153
RESTRAIL-WP5-CIDAUT-D5.2-B2-24102014_public Page 11 of 168 24 October 2014
Figures Figure 4.1-1: Spanish warning sign referring to the fine for trespassing. ............................... 26
Figure 4.1-2: Perception of illegality crossing over the tracks, when train is not approaching ............................................................................................................................................................ 31
Figure 4.1-3: Awareness about the sanction applied in case of crossing over the tracks, when train is not approaching ....................................................................................................... 31
Figure 4.1-4: Perception of illegality crossing over the tracks, when train is not approaching ............................................................................................................................................................ 32
Figure 4.1-5: Percentage of responses about sanctions for crossing over the tracks when train is approaching ......................................................................................................................... 32
Figure 4.1-6: Awareness about illegality about breaking/painting the fence ......................... 33
Figure 4.1-7: Percentage of answer about sanction for painting/breaking the fence ........... 33
Figure 4.1-8: Percentage of answers concerning the time takes to stop a train ................... 33
Figure 4.1-9: Knowledge about the trains that stop at this station. ......................................... 34
Figure 4.1-10 Knowledge about the speed of the trains at the stations ................................. 34
Figure 4.1-11: Percentage of answers concerning the prohibited behaviour ........................ 35
Figure 4.1-12: Asymptotic significance for the variables studied in the survey. .................... 36
Figure 4.2-1: School provision of road pedestrian safety (%) .................................................. 43
Figure 4.2-2: School provision of railway safety education (individual teacher responses) % ............................................................................................................................................................ 44
Figure 4.2-3: Reasons that it is important to teach pupils about railway safety and the dangers of trespassing on railway property ................................................................................ 46
Figure 4.2-4: Change to attitude regarding teaching railway safety. ...................................... 47
Figure 4.3-1: Locations linked to the questions: location A (picture left), location B (picture middle) and location C (picture right) ........................................................................................... 68
Figure 4.4-1: Average daily numbers of trespassers by week at the Kirkkonummi site ...... 78
Figure 4.4-2: Average daily numbers of trespassers by week at the Tammisaari site ........ 78
Figure 4.5-1: Location of Aydin Station ........................................................................................ 82
Figure 4.5-2: Aydin Station risk map ............................................................................................ 82
Figure 4.5-3: Locations of technical measures implemented at Aydin Station ...................... 84
Figure 4.6-1: Logic map for the evaluation .................................................................................. 91
Figure 4.6-2: Extract from the schematic diagram showing the configuration and restriction of access at 5 stations on the Western route .............................................................................. 96
Figure 4.6-3: Easy access to the line from platform ends. Places to hide behind solid buildings ............................................................................................................................................ 98
RESTRAIL SCP1-GA-2011-285153
RESTRAIL-WP5-CIDAUT-D5.2-B2-24102014_public Page 12 of 168 24 October 2014
Figure 4.6-4: Extract showing the timing of different stages of the mid-platform fencing intervention at 6 stations on one of the pilot test areas ........................................................... 100
Figure 4.6-5 : Changes in the numbers of incidents per month at fast and slow lines, by station .............................................................................................................................................. 108
Figure 4.6-6: Changes in the numbers of incidents per month at fast and slow lines, by station .............................................................................................................................................. 109
Figure 4.6-7: Changes in incidents per month on all lines, by station .................................. 110
Figure 4.8-1: Data on knowledge before a Gatekeeper trainings course for staff working in a railway environment (=baseline, t1), shortly after the course (t2) and three months after the course (t3). ............................................................................................................................... 131
Figure 4.8-2: Data on attitudes toward railway suicides (communication with and support of suicidal subjects............................................................................................................................. 131
Figure 4.9-1: Scores taking into account the age .................................................................... 137
Figure 4.9-2: Scores taking into account number of years on the job .................................. 137
Figure 4.9-3: Scores taking into account the gender ............................................................... 138
Figure 4.9-4: Scores taking into account the age .................................................................... 139
Figure 4.9-5: Scores taking into number of years on the job ................................................. 139
Figure 4.9-6: Scores taking into the gender .............................................................................. 139
Figure 4.10-1: The influence of the various means in shortening shut-downtime in the event of suicides and fatal trespassing incidents ..................................................................... 147
Figure 4.11-1: FFCCTV Schematic overview (Source: R2Protec GmbH) ........................... 150
RESTRAIL SCP1-GA-2011-285153
RESTRAIL-WP5-CIDAUT-D5.2-B2-24102014_public Page 13 of 168 24 October 2014
1. EXECUTIVE SUMMARY This document collects the evaluations that have been made of each measure implemented in WP5 of the RESTRAIL project. The final list of tested measures was:
- Warnings signs and posters (Spain).
- Railway safety education programme (Spain).
- Education in schools for 8-11 year old children (Finland).
- Video enforcement and sound warning (Finland).
- A combination of measures at Aydin station (Turkey).
- Mid-platform fencing (United Kingdom).
- Societal collaboration to prevent railway suicides (Sweden).
- Gatekeeper programme (Germany).
- Gatekeeper programme: “Contact with a (possibly) suicidal person” (The Netherlands).
- Computer based training (Israel).
- Forward Facing CCTV (FFCCTV) in trains.
The main purpose of these evaluations has been to estimate quantitatively the effect of all these measures or combination of measures on railway suicides and (fatal) trespassing accidents. In addition, two of them have pursued mitigation of the consequences of these events on train traffic.
Furthermore, this document explains the methodologies used in the evaluation of these measures, which in most cases have been before-after evaluations. In other words, results have compared the data obtained from the baseline with the data collected after the application of the measure. However, in order to know the effect of these measures, other methodologies were used as was the case with the measure “Mid-platform fencing”. A logic map was created following the guidance of Hills (2010). This map clarifies the overall objectives of the Mid-platform fencing intervention and the context in which the intervention was implemented. As result of this, important steps are outlined that are thought to be needed to realise the aims of reducing suicides on fast lines and authorised access to these fast lines. These steps are described as a series of inputs, outputs, outcomes, and impacts as defined by Hills (2010).
However, more specific methodologies were used in the evaluations targeted at mitigation of consequences of these events on railway property. The evaluation of the CBT module was qualitative - assessing the CBT’s capacity to achieve these objectives. In the case of FFCCTV, it was not possible to organise an FFCCTV trial. Instead a study was carried out focusing on the numbers and costs to the rail industry of rail fatalities; the application, costs and the effectiveness of FFCCTV and how, by whom and for what purpose the available information is used.
As identified in this document, interesting results were found in the different evaluations. The preventive measures such as the warning signs/posters and video enforcement and sound warning have found a positive effect on the reduction of trespassers after the implementation of the measures. Others such as the Railway Education Programme and Education in schools through the different pupil evaluation exercises together with anecdotal reports and researchers’ observations, demonstrate the effectiveness in terms of developed safer attitudes to trains and railways, improved pupil knowledge and awareness of safety on railway property, including dangers and consequences of games and inappropriate activities on/ near the tracks, and how to
RESTRAIL SCP1-GA-2011-285153
RESTRAIL-WP5-CIDAUT-D5.2-B2-24102014_public Page 14 of 168 24 October 2014
cross the tracks safely. For their part, the Gatekeeper programmes evaluated in the RESTRAIL framework have also had positive effects concerning the knowledge and attitudes towards railway suicides of those working in the railway environment. Moreover, mid-platform fencing seems to be very effective on the reduction of number of suicide, when used in the right locations, but this measure can not be used everywhere. Likewise, other collaboration measures, such as societal collaboration to prevent suicides, the enhancement of cooperation with rail organisations by the police and legal entities through Computer Based Training (CBT), seem to have positive effects as well. Societal collaboration can reduce the number of suicides and CBT can reduce shut-down time as a result of suicides and fatal trespassing incidents. Lastly, the study based on a combination of measures (anti-trespass panels; warning signs; close gates, etc…) indicated positive effects on the reduction of the number of trespassers.
Furthermore, a first attempt of socio-economic evaluation of measures has been carried out using data from tests and data provided by the project partners: CEA (Cost Effectiveness Analysis) and CBA (Cost Benefits Analysis). For each pilot test, and whenever available, cost data included those related to design, implementation, maintenance of the measure itself, whereas effectiveness data include one or several variables assessed before and after test period. CEA were performed (and mini CBA in two cases: pilot test “Mid-platform fencing” and pilot test “Societal collaboration to prevent railway suicide”) for measures: warning signs and posters, education in schools for 8-11 year old children, railway safety education programme, video enforcement and sound warning and a combination of measures, using data collected in the WP5 field studies. It was not possible to perform any preliminary economic analyses in the case of four pilot tests: (Dutch and German) gatekeeper programmes, computer based training and FFCCTV. However, bearing in mind the fact that CEA ratios are not comparable between measures for many structural reasons, and the same is true for CBA, the main results enable for each measure to make clear the amount of investment required to achieve a given goal where it has been implemented. The CBA show a very positive indication for the two concerned measures with ratio greater than 2. A general conclusion is that although these preliminary socio-economics analyses appear promising, there are several limits and gaps in knowledge to fill in before being able to perform some scientifically well-founded and socio-economic evaluations and comparisons among (set of) measures. Several perspectives are drawn, based on measures identified and documented during RESTRAIL project; especially in order to develop a theory-based approach of evaluation of interventions.
Lastly, after the evaluations, several recommendations and lessons learnt have been provided, especially, those addressed to the applicability of these preventive measures to other circumstances. General speaking, most measures evaluated in WP5 are flexible and cheap to be applied to other circumstances. Furthermore, many of them can be combined with different preventive measures to increase the positive effects on the reduction of trespassing or suicide attempt or suicides.
RESTRAIL SCP1-GA-2011-285153
RESTRAIL-WP5-CIDAUT-D5.2-B2-24102014_public Page 15 of 168 24 October 2014
2. INTRODUCTION
2.1 Purpose of the document
The document D5.2 Evaluation of measures, recommendations and guidelines for further implementation takes part of the WP5, which works on the pilot tests. This paper has an objective to present an exhaustive analysis about the different piloted measures after their implementation.
This document collects the main results obtained from each evaluation of the piloted measures selected in WP5. Thus, the effectiveness of four of the evaluated measures targeted mainly suicides (Gatekeeper programme “train the trainers”; Dutch Gatekeeper programme, Societal Collaboration to prevent railway suicide and Mid-Platform fencing) can be found below; five targeted trespassing accidents (warning signs and posters; railway safety education programme; education at schools for 8-11 year old children; video enforcement and sound warning and a combination of measures at Ayden station and two measures aimed to mitigate the consequences by speeding up the system recovery from such incidents.
In order to know the results, a short description of the each one of the piloted measures is collected as well as the methodology used for the evaluation of the results. More information concerning these issues can be found in D5.1 Selection of the measures and their implementation in pilot test planning and execution (Kallberg, Plaza, Silla, García et al, 2014). In addition to this, two subsections are collected as well for each evaluated measure: applicability of the results to different circumstances and a discussion about the results obtained. Another important point is that a subsection about the cost benefit analysis for each implemented measure is included in the section of results of each pilot test.
Lastly, a set of general conclusions about the results gained for the evaluations can be found at the end of the document, as well as several recommendations.

RESTRAIL SCP1-GA-2011-285153
RESTRAIL-WP5-CIDAUT-D5.2-B2-24102014_public Page 16 of 168 24 October 2014
2.2 Definitions and acronyms Term Meaning Accident Involuntary collision between a train and/or persons on the tracks, resulting in
injury or death. Emergency An unforeseen or unplanned situation that has implications for the safety of
persons and for assets and requires immediate attention First Responders
The fire, police or ambulance services where an incident occurs
Gatekeeper programmes
Gatekeeper programmes include a range of interventions focused on community or organizational gatekeepers (e.g. railway personnel, security personal, Samaritans) whose contact with potentially vulnerable populations provides an opportunity to identify at-risk individuals and to engage in preventive action. Education of gatekeeper programmes covers awareness of risk factors, policy changes to encourage help-seeking and availability of resources. In order to be effective, gatekeeper training must be a continuous, sustained effort with close monitoring and evaluation, ideally as part of a professional training curriculum.
Incident Either trespassing accidents or suicides or both, depending on the context. Infrastructure Manager
The organisation responsible for providing, maintaining and controlling the use of the infrastructure by railway undertakings.
Preventative measures
Known interventions or initiatives that are used in countries across Europe, which attempt to minimise incidents of suicide or trespass. These measures may take the form of different modes of operation, such as physical barriers to prevent or inhibit access to the track, or other interventions to influence the behaviours of people who might access track areas.
Railway Undertaking
An organisation, public or private, that manages the operations of public transport services concerned with the mass mobility of citizens. This includes their support facilities, such as rolling stock and maintenance facilities, and may involve international, national, suburban or urban networks. A railway undertaking may also be an infrastructure manager
Soft measure
Measures dedicated to influence actors’ knowledge and behaviours by actions such as communication, training, calls for more socially-responsible behaviour aimed at preventing voluntary decisions to commit the acts, legal measures and sanctions following such acts.
Suicide
Act to deliberately injure oneself, resulting in death, as recorded and classified by the competent national authority.
Technical measure
Physical or technological artefact dedicated to the prevention of trespassing and/or suicides.
Trespassing accident
Accidents resulting in injuries to unauthorised persons on railway premises who are hit by a railway vehicle or by other object attached to or has become detached from the vehicle, including electrocution related to rolling stock in motion.

RESTRAIL SCP1-GA-2011-285153
RESTRAIL-WP5-CIDAUT-D5.2-B2-24102014_public Page 17 of 168 24 October 2014
Acronym Meaning ADIF ERA
ADministrador de Infraestructuras Ferroviarias European Rail Agency
BTP British Transport Police CAEX CAPital Expenditure CBT Computer Based Training CCTV Close-Circuit TeleVision CN Canadian National DOW Description Of Work FFCCTV Forward Facing Closed-Circuit TeleVision GDL German Drivers Leasing HMTreasury Her Majesty’s Treasury IM Infrastructure Manager IP Important Point IT Information Technology NPV Net Present Value OPEX OPeration Expenditures OTDR On Train Data Recorder PIER Program in Interdisciplinary Education Research 2RProtect Rail and Road Protect RAILPOL European Network of RAILway POLice Forces RSSB Rail Safety and Standards Board RU Railway Undertaking SMIS Safety Management Information System SPSS Statistical Package for the Social Sciences STS SysTemS SWOV Institute for Road Safety Research TCRP Transit Cooperative Research Programme VAS Visual Analogue Scale VPC Values of Preventing a Casualty
VT Value of Time
CBA Cost Benefit Analysis
CEA Cost Effectiveness Analysis
RESTRAIL SCP1-GA-2011-285153
RESTRAIL-WP5-CIDAUT-D5.2-B2-24102014_public Page 18 of 168 24 October 2014
3. CBA AND CEA ANALYSIS IN THE RESTRAIL FRAMEWORK
3.1 Introduction and definitions General aspects of CBA and CEA analysis have been previously reviewed in the RESTRAIL deliverable D2.2/3.2. (Burkhardt, Beurkens, Ryan, Hedqvist et al, 2013).
Cost Benefits analysis can be defined as a systematic process for calculating and comparing benefits and costs of several projects using the following steps (Commonwealth of Australia, 2006; Meunier, 2009):
- Identify alternatives.
- Define alternatives in a way that allows fair comparison.
- Adjust for occurrence of costs and benefits at different times.
- Calculate monetary values for things that are not usually expressed in money.
- Cope with uncertainty in the data.
Sum up a pattern of costs and benefits to provide the support for decision making.
There are some alternatives to formal CBA when outcomes cannot (or can hardly) be quantified. First, one can attempt to attach monetary values to benefits so that they can be measured on the same basis as costs. Second, is to quantify benefits and determine ratios of the quantity of benefits per spent monetary unit, i.e. what is called a cost effectiveness analysis (CEA) (Commonwealth of Australia, 2006). At a very general level, these two techniques can be theoretically defined below, adapted from World Road Association, Technical Committee C2, safer road operations (2012):
Number of accidents /or incidents prevented Cost Effectiveness Analysis (CEA) = --------------------------------------------------------------- Cost of implementation Present value of all benefits Cost Benefits Analysis (CBA) = --------------------------------------------------------------------- Present value of the implementation costs
By the way, making the CEA and CBA of different safety measures comparable requires relating both the assessed performance and the costs of implementing the measure to a certain time reference (World Road Association, Technical Committee C2, safer road operations, 2012).
RESTRAIL SCP1-GA-2011-285153
RESTRAIL-WP5-CIDAUT-D5.2-B2-24102014_public Page 19 of 168 24 October 2014
3.2 Collected data for costs, effectiveness and benefits assessment This section defines the data collected as part of the evaluation of the piloted prevention measures in WP5, the methods and some assumptions used for conducting the CBA and CEA with these data.
Different types of measures for costs are used. Implementation costs are those related to all means of production (labour and capital) that are employed to implement the measure. Maintenance and operation costs are those related to the maintenance and operation of the measure. Secondary effects of implemented measures (i.e. effects on other field(s) such as safety, environment, mobility etc.) can be eventually considered; given that the effect can be established and can be either positive or negative).
Various measures of impacts have been used, some being directly related to a performance in terms of accidents and their consequences and some being only indirectly related to accidents or incidents. As it will be discussed later, the former can be directly associated to monetary values whereas the latter would require making explicit assumptions linking the observed performance value and the inferred potential impact in terms of rail accidents or incidents reduction. For rail safety, the estimation of the reduction of accidents due to trespass or suicide that will be achieved by a particular (set of) measure(s) is obviously a crucial step for the assessment. Evidence and theories from the research can support some predictions about the manner in which the existing pattern of accidents would change if a new measure were introduced. Nevertheless, as stressed in the domain of road safety evaluation, “it is important to monitor the new pattern of accident after a measure has been introduced in order to check the accuracy of the prediction” (World Road Association, Technical Committee C2, safer road operations, 2012).
In order to be able to get comparable implementation costs for all safety measures, independent of the duration of their safety effects, the easiest method is to convert investment costs to annual capital costs, i.e. by converting investment costs to an annuity with the value of the original cost investment. The total costs can thus be obtained by adding the investment costs expressed as annuities to the annual costs of operation and maintenance (World Road Association, Technical Committee C2, safer road operations, 2012).
3.2.1 Cost data
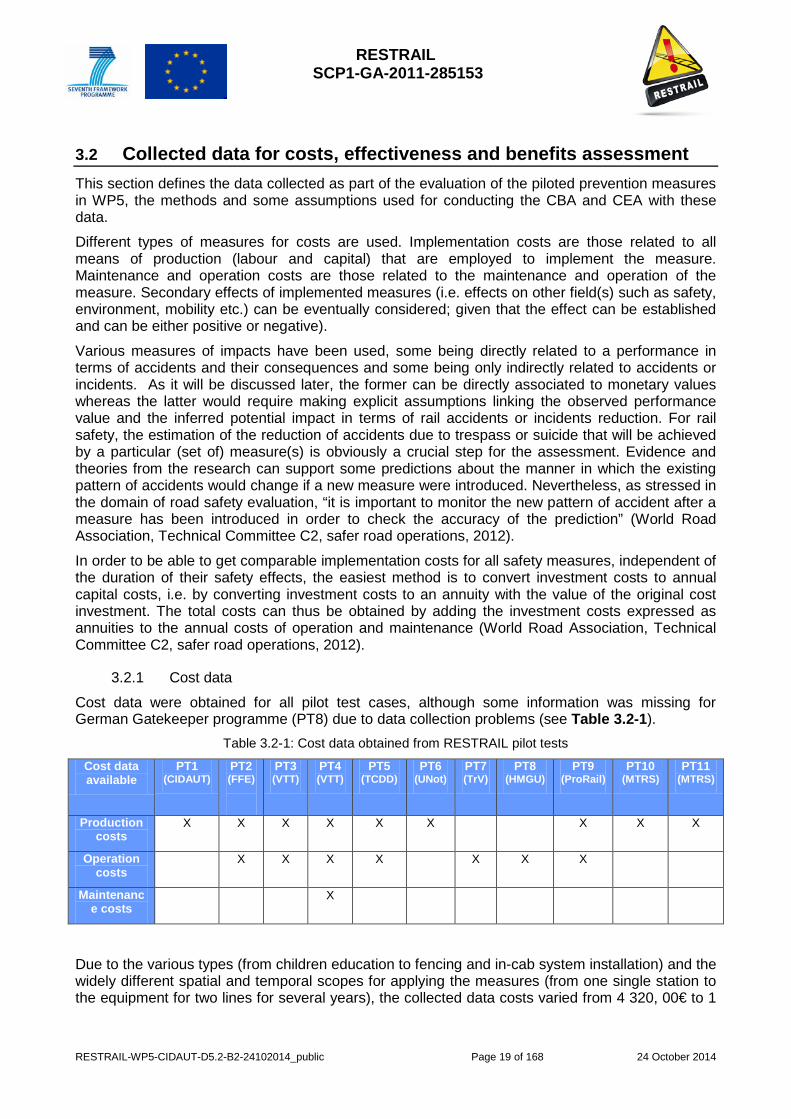
Cost data were obtained for all pilot test cases, although some information was missing for German Gatekeeper programme (PT8) due to data collection problems (see Table 3.2-1).
Table 3.2-1: Cost data obtained from RESTRAIL pilot tests Cost data available
PT1 (CIDAUT)
PT2 (FFE)
PT3 (VTT)
PT4 (VTT)
PT5 (TCDD)
PT6 (UNot)
PT7 (TrV)
PT8 (HMGU)
PT9 (ProRail)
PT10 (MTRS)
PT11 (MTRS)
Production costs
X X X X X X X X X
Operation costs
X X X X X X X
Maintenance costs
X
Due to the various types (from children education to fencing and in-cab system installation) and the widely different spatial and temporal scopes for applying the measures (from one single station to the equipment for two lines for several years), the collected data costs varied from 4 320, 00€ to 1
RESTRAIL SCP1-GA-2011-285153
RESTRAIL-WP5-CIDAUT-D5.2-B2-24102014_public Page 20 of 168 24 October 2014
713 343,75 €, with different patterns of costs. Education was mostly concerned with production and/or operations costs whereas technological devices are also included and maintenance costs.
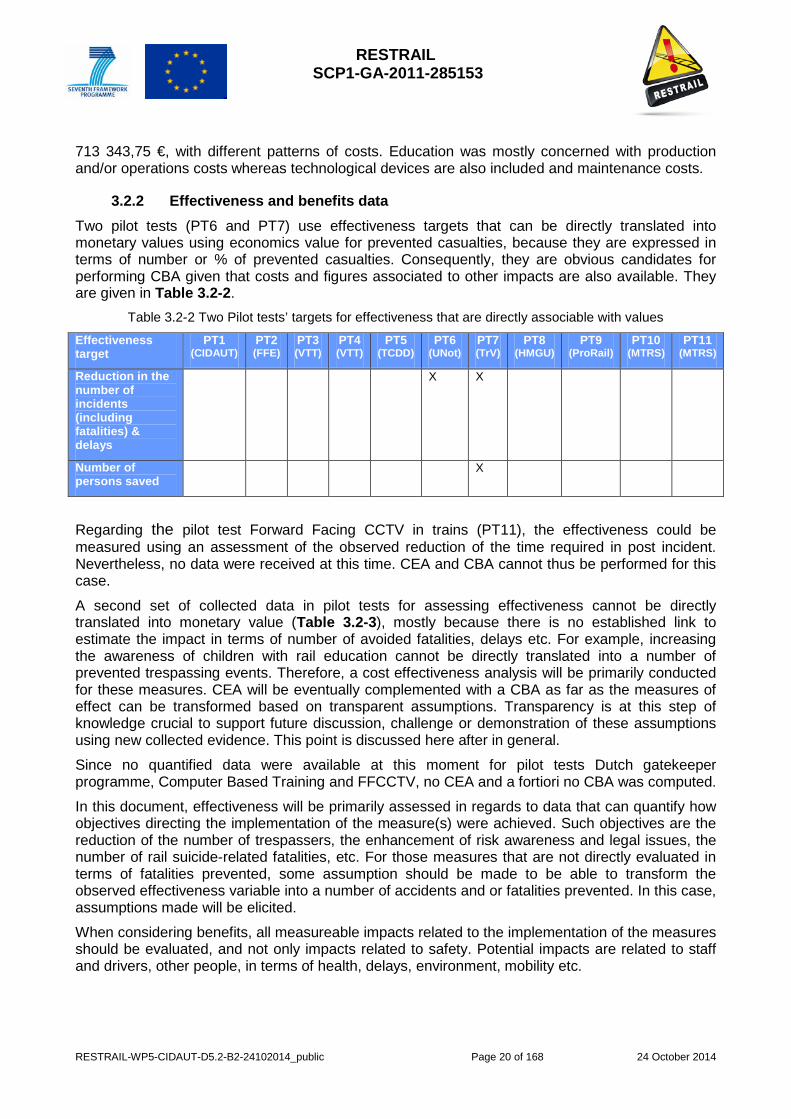
3.2.2 Effectiveness and benefits data Two pilot tests (PT6 and PT7) use effectiveness targets that can be directly translated into monetary values using economics value for prevented casualties, because they are expressed in terms of number or % of prevented casualties. Consequently, they are obvious candidates for performing CBA given that costs and figures associated to other impacts are also available. They are given in Table 3.2-2.
Table 3.2-2 Two Pilot tests’ targets for effectiveness that are directly associable with values
Effectiveness target
PT1 (CIDAUT)
PT2 (FFE)
PT3 (VTT)
PT4 (VTT)
PT5 (TCDD)
PT6 (UNot)
PT7 (TrV)
PT8 (HMGU)
PT9 (ProRail)
PT10 (MTRS)
PT11 (MTRS)
Reduction in the number of incidents (including fatalities) & delays
X X
Number of persons saved
X
Regarding the pilot test Forward Facing CCTV in trains (PT11), the effectiveness could be measured using an assessment of the observed reduction of the time required in post incident. Nevertheless, no data were received at this time. CEA and CBA cannot thus be performed for this case.
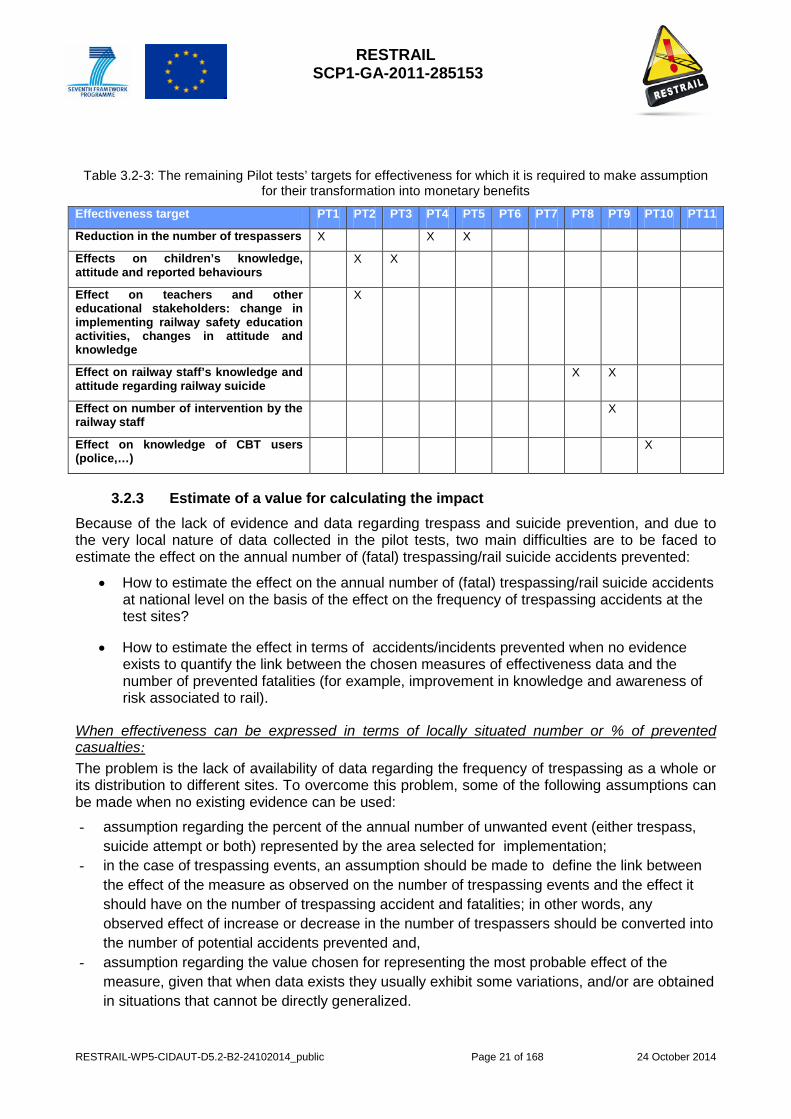
A second set of collected data in pilot tests for assessing effectiveness cannot be directly translated into monetary value (Table 3.2-3), mostly because there is no established link to estimate the impact in terms of number of avoided fatalities, delays etc. For example, increasing the awareness of children with rail education cannot be directly translated into a number of prevented trespassing events. Therefore, a cost effectiveness analysis will be primarily conducted for these measures. CEA will be eventually complemented with a CBA as far as the measures of effect can be transformed based on transparent assumptions. Transparency is at this step of knowledge crucial to support future discussion, challenge or demonstration of these assumptions using new collected evidence. This point is discussed here after in general.
Since no quantified data were available at this moment for pilot tests Dutch gatekeeper programme, Computer Based Training and FFCCTV, no CEA and a fortiori no CBA was computed.
In this document, effectiveness will be primarily assessed in regards to data that can quantify how objectives directing the implementation of the measure(s) were achieved. Such objectives are the reduction of the number of trespassers, the enhancement of risk awareness and legal issues, the number of rail suicide-related fatalities, etc. For those measures that are not directly evaluated in terms of fatalities prevented, some assumption should be made to be able to transform the observed effectiveness variable into a number of accidents and or fatalities prevented. In this case, assumptions made will be elicited.
When considering benefits, all measureable impacts related to the implementation of the measures should be evaluated, and not only impacts related to safety. Potential impacts are related to staff and drivers, other people, in terms of health, delays, environment, mobility etc.
RESTRAIL SCP1-GA-2011-285153
RESTRAIL-WP5-CIDAUT-D5.2-B2-24102014_public Page 21 of 168 24 October 2014
Table 3.2-3: The remaining Pilot tests’ targets for effectiveness for which it is required to make assumption
for their transformation into monetary benefits
Effectiveness target PT1 PT2 PT3 PT4 PT5 PT6 PT7 PT8 PT9 PT10 PT11
Reduction in the number of trespassers X X X
Effects on children’s knowledge, attitude and reported behaviours
X X
Effect on teachers and other educational stakeholders: change in implementing railway safety education activities, changes in attitude and knowledge
X
Effect on railway staff’s knowledge and attitude regarding railway suicide
X X
Effect on number of intervention by the railway staff
X
Effect on knowledge of CBT users (police,…)
X
3.2.3 Estimate of a value for calculating the impact Because of the lack of evidence and data regarding trespass and suicide prevention, and due to the very local nature of data collected in the pilot tests, two main difficulties are to be faced to estimate the effect on the annual number of (fatal) trespassing/rail suicide accidents prevented:
• How to estimate the effect on the annual number of (fatal) trespassing/rail suicide accidents at national level on the basis of the effect on the frequency of trespassing accidents at the test sites?
• How to estimate the effect in terms of accidents/incidents prevented when no evidence exists to quantify the link between the chosen measures of effectiveness data and the number of prevented fatalities (for example, improvement in knowledge and awareness of risk associated to rail).
When effectiveness can be expressed in terms of locally situated number or % of prevented casualties: The problem is the lack of availability of data regarding the frequency of trespassing as a whole or its distribution to different sites. To overcome this problem, some of the following assumptions can be made when no existing evidence can be used:
- assumption regarding the percent of the annual number of unwanted event (either trespass, suicide attempt or both) represented by the area selected for implementation;
- in the case of trespassing events, an assumption should be made to define the link between the effect of the measure as observed on the number of trespassing events and the effect it should have on the number of trespassing accident and fatalities; in other words, any observed effect of increase or decrease in the number of trespassers should be converted into the number of potential accidents prevented and,
- assumption regarding the value chosen for representing the most probable effect of the measure, given that when data exists they usually exhibit some variations, and/or are obtained in situations that cannot be directly generalized.
RESTRAIL SCP1-GA-2011-285153
RESTRAIL-WP5-CIDAUT-D5.2-B2-24102014_public Page 22 of 168 24 October 2014
When no evidence are available to quantify the link between used measures of effectiveness data and avoided casualties and fatalities: Let us consider education measures for example. The cost effectiveness of educational measures can be calculated, given that the targets are expressed in terms of knowledge acquisition. One should note that there is still a difficult issue for comparing between measures, due to the lack of standardization regarding the knowledge goals to be acquired by children in order to adopt a safe behaviour, and the way to assess their acquisition. However in the context of RESTRAIL, we aim also to perform some cost benefits analyses in order to be able to compare between measures of different types and targets. In the context of education, it means that an assumption should be made regarding the impact of the measure on the number of accidents prevented. With this type of measure, one can consider that the maximum knowledge gain achieved by children will be associated with a good level of awareness related to risk and wider consequences of trespassing in the railway vicinity (train drivers, fines, delays...) in the railway vicinity. However, risk awareness is not the only factors that might explain the occurrence of a trespassing accident (see Burkhardt, Radbo, Silla and Paran, 2014). Furthermore, the problem is that there is no evidence that supports the association of the effect of the level of knowledge/ gained awareness with a number of avoided fatalities.
In this case, some assumption should be made for supporting any calculation to transform efficiency indicator into monetary benefits, as for example:
- Assumption 1: the number of fatalities related to lack of awareness represents a low proportion of cases, for example 1% of trespassing accidents.
- Assumption 2: a good awareness of risk and consequences of railway trespassing has an effect only on this subset of accidents related to lack of awareness.
Obviously, such assumption should be confronted to existing evidence, and even reconsidered in the future as new evidence and/or theory will be available. For each PT, we thus attempt to emphasize the exact assumptions made so they can be discussed, updated or questioned.
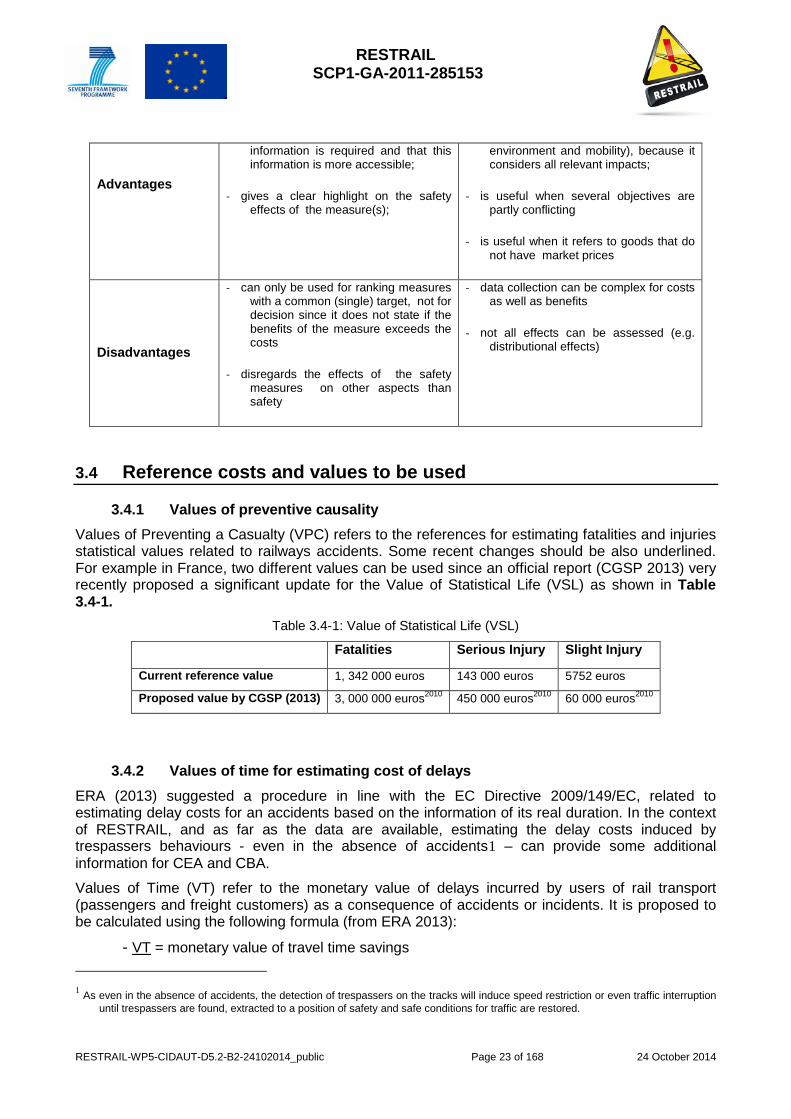
3.3 Choosing between CBA and CEA As exposed in World Road Association, Technical Committee C2, safer road operations (2012), CEA has the main advantage that “only data about the implementation costs and an estimate of the accidents prevented are needed”. It is thus particularly appropriate for comparing projects whose benefits are not easily measureable in monetary terms, and/or projects with clear goals where a substantial component of the benefits are not measurable in monetary units. In addition to information used in CEA, CBA requires “the monetary valuation of the accident costs (that includes the valuation of human life, which is very controversial)” as well as other impacts, e.g. delays on traffic, environmental impact, etc.
To help in choosing between CBA and CEA, the Table 3.3-1 provides a short reminder of the main advantages and limits of CBA and CEA. However, as stated by World Road Association, Technical Committee C2, and safer road operations (2012) one of the greatest problems in cost-benefit analysis is to obtain valid and reliable monetary valuations of all relevant impacts. This objective is rarely, if ever, fully realized. It is therefore often relevant to carry out a cost-effectiveness analysis in addition to, or instead of, a cost-benefit analysis”.
Table 3.3-1: Advantages and disadvantages of CEA and CBA
CEA CBA
- is easier to calculate than cost-benefit ratio due to the fact that less
- is useful when there are multiple objectives (e.g., both safety,
RESTRAIL SCP1-GA-2011-285153
RESTRAIL-WP5-CIDAUT-D5.2-B2-24102014_public Page 23 of 168 24 October 2014
Advantages
information is required and that this information is more accessible;
- gives a clear highlight on the safety effects of the measure(s);
environment and mobility), because it considers all relevant impacts;
- is useful when several objectives are partly conflicting
- is useful when it refers to goods that do not have market prices
Disadvantages
- can only be used for ranking measures with a common (single) target, not for decision since it does not state if the benefits of the measure exceeds the costs
- disregards the effects of the safety measures on other aspects than safety
- data collection can be complex for costs as well as benefits
- not all effects can be assessed (e.g. distributional effects)
3.4 Reference costs and values to be used
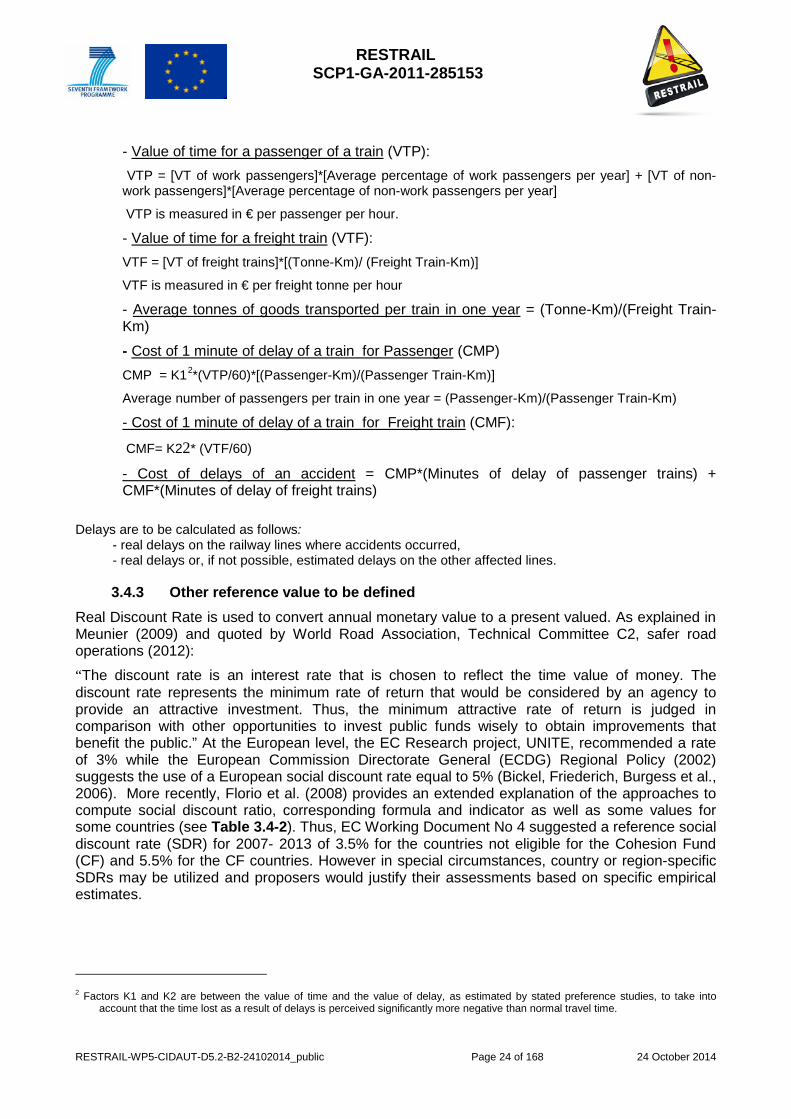
3.4.1 Values of preventive causality Values of Preventing a Casualty (VPC) refers to the references for estimating fatalities and injuries statistical values related to railways accidents. Some recent changes should be also underlined. For example in France, two different values can be used since an official report (CGSP 2013) very recently proposed a significant update for the Value of Statistical Life (VSL) as shown in Table 3.4-1.
Table 3.4-1: Value of Statistical Life (VSL)
Fatalities Serious Injury Slight Injury
Current reference value 1, 342 000 euros 143 000 euros 5752 euros
Proposed value by CGSP (2013) 3, 000 000 euros2010 450 000 euros2010 60 000 euros2010
3.4.2 Values of time for estimating cost of delays ERA (2013) suggested a procedure in line with the EC Directive 2009/149/EC, related to estimating delay costs for an accidents based on the information of its real duration. In the context of RESTRAIL, and as far as the data are available, estimating the delay costs induced by trespassers behaviours - even in the absence of accidents1 – can provide some additional information for CEA and CBA.
Values of Time (VT) refer to the monetary value of delays incurred by users of rail transport (passengers and freight customers) as a consequence of accidents or incidents. It is proposed to be calculated using the following formula (from ERA 2013):
- VT = monetary value of travel time savings 1 As even in the absence of accidents, the detection of trespassers on the tracks will induce speed restriction or even traffic interruption
until trespassers are found, extracted to a position of safety and safe conditions for traffic are restored.
RESTRAIL SCP1-GA-2011-285153
RESTRAIL-WP5-CIDAUT-D5.2-B2-24102014_public Page 24 of 168 24 October 2014
- Value of time for a passenger of a train (VTP): VTP = [VT of work passengers]*[Average percentage of work passengers per year] + [VT of non-work passengers]*[Average percentage of non-work passengers per year]
VTP is measured in € per passenger per hour.
- Value of time for a freight train (VTF): VTF = [VT of freight trains]*[(Tonne-Km)/ (Freight Train-Km)]
VTF is measured in € per freight tonne per hour
- Average tonnes of goods transported per train in one year = (Tonne-Km)/(Freight Train-Km)
- Cost of 1 minute of delay of a train for Passenger (CMP) CMP = K12*(VTP/60)*[(Passenger-Km)/(Passenger Train-Km)]
Average number of passengers per train in one year = (Passenger-Km)/(Passenger Train-Km)
- Cost of 1 minute of delay of a train for Freight train (CMF):
CMF= K22* (VTF/60)
- Cost of delays of an accident = CMP*(Minutes of delay of passenger trains) + CMF*(Minutes of delay of freight trains)
Delays are to be calculated as follows: - real delays on the railway lines where accidents occurred, - real delays or, if not possible, estimated delays on the other affected lines.
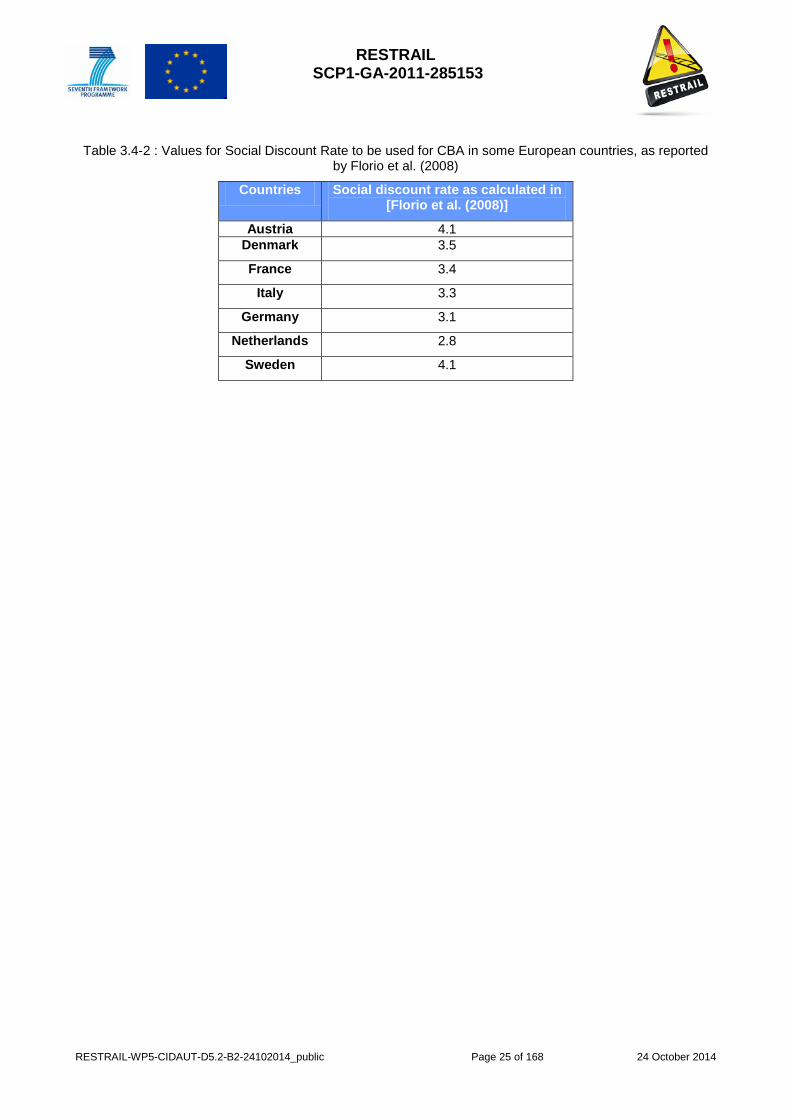
3.4.3 Other reference value to be defined Real Discount Rate is used to convert annual monetary value to a present valued. As explained in Meunier (2009) and quoted by World Road Association, Technical Committee C2, safer road operations (2012): “The discount rate is an interest rate that is chosen to reflect the time value of money. The discount rate represents the minimum rate of return that would be considered by an agency to provide an attractive investment. Thus, the minimum attractive rate of return is judged in comparison with other opportunities to invest public funds wisely to obtain improvements that benefit the public.” At the European level, the EC Research project, UNITE, recommended a rate of 3% while the European Commission Directorate General (ECDG) Regional Policy (2002) suggests the use of a European social discount rate equal to 5% (Bickel, Friederich, Burgess et al., 2006). More recently, Florio et al. (2008) provides an extended explanation of the approaches to compute social discount ratio, corresponding formula and indicator as well as some values for some countries (see Table 3.4-2). Thus, EC Working Document No 4 suggested a reference social discount rate (SDR) for 2007- 2013 of 3.5% for the countries not eligible for the Cohesion Fund (CF) and 5.5% for the CF countries. However in special circumstances, country or region-specific SDRs may be utilized and proposers would justify their assessments based on specific empirical estimates.
2 Factors K1 and K2 are between the value of time and the value of delay, as estimated by stated preference studies, to take into
account that the time lost as a result of delays is perceived significantly more negative than normal travel time.
RESTRAIL SCP1-GA-2011-285153
RESTRAIL-WP5-CIDAUT-D5.2-B2-24102014_public Page 25 of 168 24 October 2014
Table 3.4-2 : Values for Social Discount Rate to be used for CBA in some European countries, as reported by Florio et al. (2008)
Countries Social discount rate as calculated in [Florio et al. (2008)]
Austria 4.1 Denmark 3.5
France 3.4
Italy 3.3
Germany 3.1
Netherlands 2.8
Sweden 4.1
RESTRAIL SCP1-GA-2011-285153
RESTRAIL-WP5-CIDAUT-D5.2-B2-24102014_public Page 26 of 168 24 October 2014
4. EVALUATION OF THE MEASURES: SAFETY IMPACT ON RAILWAY CONTEXT
4.1 Warning signs and posters- CIDAUT
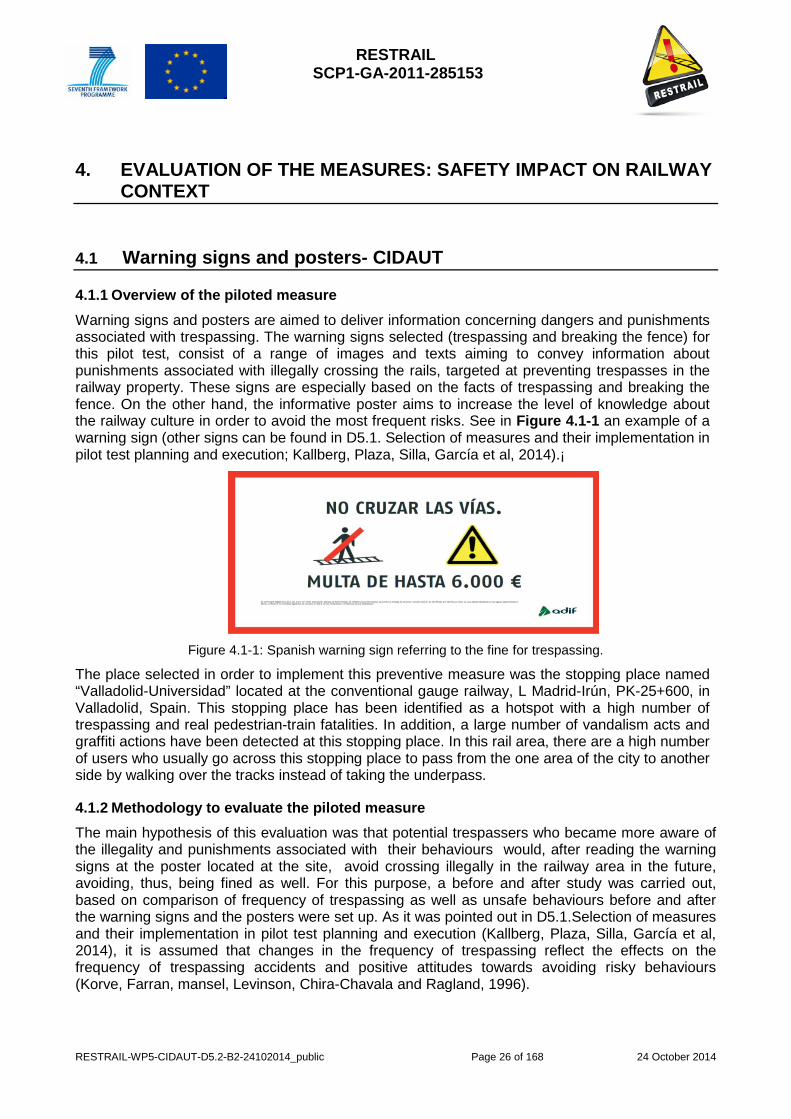
4.1.1 Overview of the piloted measure Warning signs and posters are aimed to deliver information concerning dangers and punishments associated with trespassing. The warning signs selected (trespassing and breaking the fence) for this pilot test, consist of a range of images and texts aiming to convey information about punishments associated with illegally crossing the rails, targeted at preventing trespasses in the railway property. These signs are especially based on the facts of trespassing and breaking the fence. On the other hand, the informative poster aims to increase the level of knowledge about the railway culture in order to avoid the most frequent risks. See in Figure 4.1-1 an example of a warning sign (other signs can be found in D5.1. Selection of measures and their implementation in pilot test planning and execution; Kallberg, Plaza, Silla, García et al, 2014).¡
Figure 4.1-1: Spanish warning sign referring to the fine for trespassing.
The place selected in order to implement this preventive measure was the stopping place named “Valladolid-Universidad” located at the conventional gauge railway, L Madrid-Irún, PK-25+600, in Valladolid, Spain. This stopping place has been identified as a hotspot with a high number of trespassing and real pedestrian-train fatalities. In addition, a large number of vandalism acts and graffiti actions have been detected at this stopping place. In this rail area, there are a high number of users who usually go across this stopping place to pass from the one area of the city to another side by walking over the tracks instead of taking the underpass.
4.1.2 Methodology to evaluate the piloted measure The main hypothesis of this evaluation was that potential trespassers who became more aware of the illegality and punishments associated with their behaviours would, after reading the warning signs at the poster located at the site, avoid crossing illegally in the railway area in the future, avoiding, thus, being fined as well. For this purpose, a before and after study was carried out, based on comparison of frequency of trespassing as well as unsafe behaviours before and after the warning signs and the posters were set up. As it was pointed out in D5.1.Selection of measures and their implementation in pilot test planning and execution (Kallberg, Plaza, Silla, García et al, 2014), it is assumed that changes in the frequency of trespassing reflect the effects on the frequency of trespassing accidents and positive attitudes towards avoiding risky behaviours (Korve, Farran, mansel, Levinson, Chira-Chavala and Ragland, 1996).
RESTRAIL SCP1-GA-2011-285153
RESTRAIL-WP5-CIDAUT-D5.2-B2-24102014_public Page 27 of 168 24 October 2014
In order to carry out this comparison an observation study was carried out, consisting of two phases: (1) pre-intervention (baseline) and (2) post-intervention (short-term effects).
Observations The days of observation were established on the basis of the user profiles for the stopping place and their usual behaviour. For this purpose, a pre-study was carried out in order to detect the usual behaviours and the times of increased presence of passengers and users. As result of this, observations were established from 9.00 to 19.00 on four consecutive days, from Wednesday to Saturday, when the main type of illegal and unsafe behaviours at this stopping place were registered.
One inconspicuous and trained observer was located at each platform during the four days of observation. Each observation day was divided into seven observation hours on the basis of the pre-study, except the observation time from 09.00 to 10.00 on Friday and from 16.00h to 17.00 on Saturday because ADIF workers were on the track, and thereby, this situation could affect the actual behaviours of the users. The observers collected separately the legal and illegal behaviours carried out in the stopping place. To check the reliability of the observations after each period of observation, the recordings were checked out among both observers.
Furthermore, every day during the second evaluation (post-intervention), the repaired fence was checked in order to know if it had been broken or not. The fence broken by users to take a short cut was mended during the implementation of the measure with the aim of knowing the effect of one of the warning signs that identified the punishment for breaking the fence.
The second hypothesis was that people, who became more aware of the dangers of crossing illegally after reading the posters set up at the stopping place, would pay the greatest attention in the future when they cross by using the authorised places and would acquire positive attitudes towards avoiding risk behaviours.
In order to know if users were aware of the dangers of crossing illegally as well as the illegality of some behaviour, a before and after study was carried out, comparing the knowledge acquired between (1) pre-intervention (baseline) and (2) post-intervention (short-term effects).
Surveys
The questions of the survey concentrated on perceptions of safety and illegality, frequency of walking across the tracks and using the level crossing and underpass. These surveys were conducted from 09.00 to 19.00 the following week after the observations in both periods of the study. On the one hand, the surveys were carried out at the stopping place and on the other hand, in one community centre near the stopping place. A total of 162 forms were issued prior to the intervention and 142 after the intervention. Concerning the interviewees, people from the community centre were the same for both the before and after surveys and most people interviewed at the stopping place were also the same (around 88%).
Furthermore, one question about the illegality of breaking fences and punishment associated was also asked. At the end, three questions concerning the railway culture were carried out as well to know basically if during the study period the warning and educational signals have been read.
The sample was taken from two places during the before and after study. These places were at the stopping place and a community centre close to the rail station. The number of subjects that filled the surveys in the pre-study was 107 at the stopping place and 55 in the community centre. On the other hand, 106 people at the stopping place in the after-study and 37 in the community centre (Table 4.1-1).

RESTRAIL SCP1-GA-2011-285153
RESTRAIL-WP5-CIDAUT-D5.2-B2-24102014_public Page 28 of 168 24 October 2014
Table 4.1-1: Total number of participants
Surveys
Total Before After Place Stopping place 107 106 213
Community centre 55 37 92
Total 162 143 305
The subjects were divided into four groups according to their age. As it could be observed (Table 4.1-2), the number of participants in these groups was quite similar before and after the study.
Table 4.1-2: Group of participants
Surveys
Total Before After Group of participants Teenagers 1 0 1
Youth 35 27 62
Adults 80 53 133
Elderly 46 63 109
Total 162 143 305
As it can be observed in Table 4.1-3, the number of females and males who participated was similar before and after the study.
Table 4.1-3: Gender
Surveys
Total Before After Gender F 99 83 182
M 63 60 123
Total 162 143 305
Finally, another characteristic was taken into account was the occupation of the participants. Thus, four groups were created: students, retired, unemployed and workers. As described in the table, no big differences were found according the occupation before and after the study (Table 4.1-4).
Table 4.1-4: Occupation of the participants
Surveys
Total Before After Professional situation Student 22 24 46
Retired 53 62 115
Unemployed 44 27 71
Worker 43 30 73
Total 162 143 305
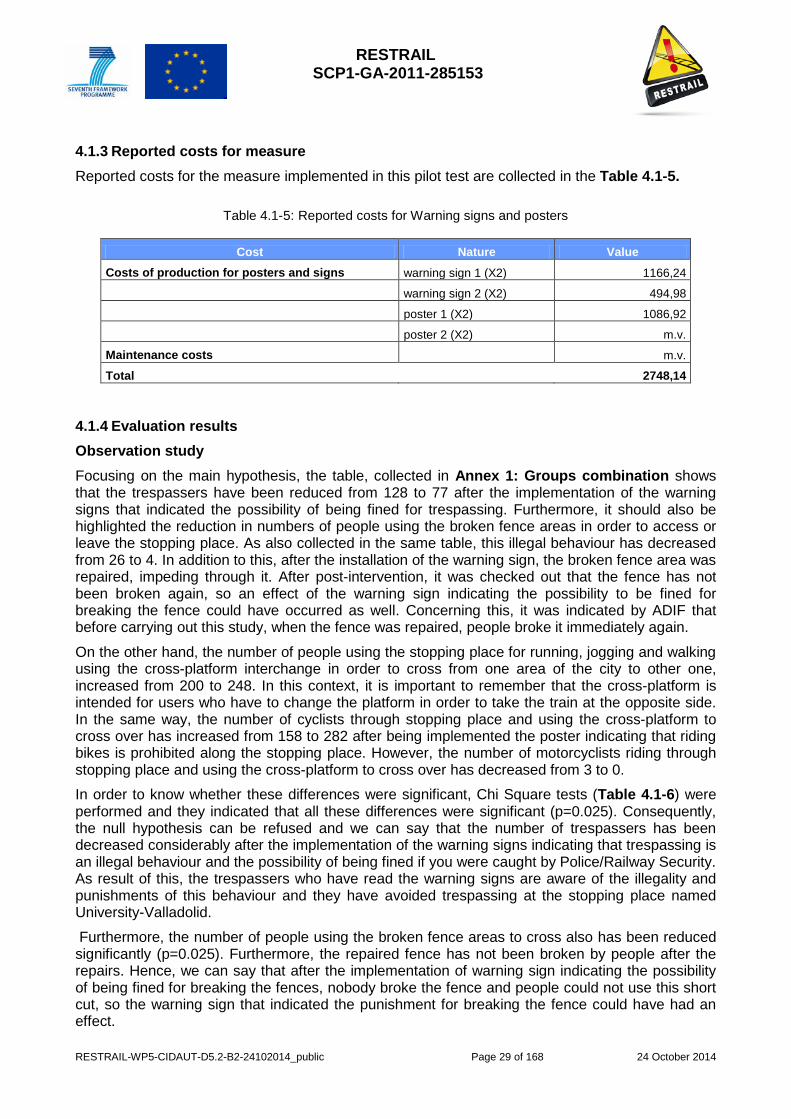
RESTRAIL SCP1-GA-2011-285153
RESTRAIL-WP5-CIDAUT-D5.2-B2-24102014_public Page 29 of 168 24 October 2014
4.1.3 Reported costs for measure Reported costs for the measure implemented in this pilot test are collected in the Table 4.1-5.
Table 4.1-5: Reported costs for Warning signs and posters
Cost Nature Value Costs of production for posters and signs warning sign 1 (X2) 1166,24
warning sign 2 (X2) 494,98
poster 1 (X2) 1086,92
poster 2 (X2) m.v.
Maintenance costs m.v.
Total 2748,14
4.1.4 Evaluation results Observation study Focusing on the main hypothesis, the table, collected in Annex 1: Groups combination shows that the trespassers have been reduced from 128 to 77 after the implementation of the warning signs that indicated the possibility of being fined for trespassing. Furthermore, it should also be highlighted the reduction in numbers of people using the broken fence areas in order to access or leave the stopping place. As also collected in the same table, this illegal behaviour has decreased from 26 to 4. In addition to this, after the installation of the warning sign, the broken fence area was repaired, impeding through it. After post-intervention, it was checked out that the fence has not been broken again, so an effect of the warning sign indicating the possibility to be fined for breaking the fence could have occurred as well. Concerning this, it was indicated by ADIF that before carrying out this study, when the fence was repaired, people broke it immediately again.
On the other hand, the number of people using the stopping place for running, jogging and walking using the cross-platform interchange in order to cross from one area of the city to other one, increased from 200 to 248. In this context, it is important to remember that the cross-platform is intended for users who have to change the platform in order to take the train at the opposite side. In the same way, the number of cyclists through stopping place and using the cross-platform to cross over has increased from 158 to 282 after being implemented the poster indicating that riding bikes is prohibited along the stopping place. However, the number of motorcyclists riding through stopping place and using the cross-platform to cross over has decreased from 3 to 0.
In order to know whether these differences were significant, Chi Square tests (Table 4.1-6) were performed and they indicated that all these differences were significant (p=0.025). Consequently, the null hypothesis can be refused and we can say that the number of trespassers has been decreased considerably after the implementation of the warning signs indicating that trespassing is an illegal behaviour and the possibility of being fined if you were caught by Police/Railway Security. As result of this, the trespassers who have read the warning signs are aware of the illegality and punishments of this behaviour and they have avoided trespassing at the stopping place named University-Valladolid.
Furthermore, the number of people using the broken fence areas to cross also has been reduced significantly (p=0.025). Furthermore, the repaired fence has not been broken by people after the repairs. Hence, we can say that after the implementation of warning sign indicating the possibility of being fined for breaking the fences, nobody broke the fence and people could not use this short cut, so the warning sign that indicated the punishment for breaking the fence could have had an effect.
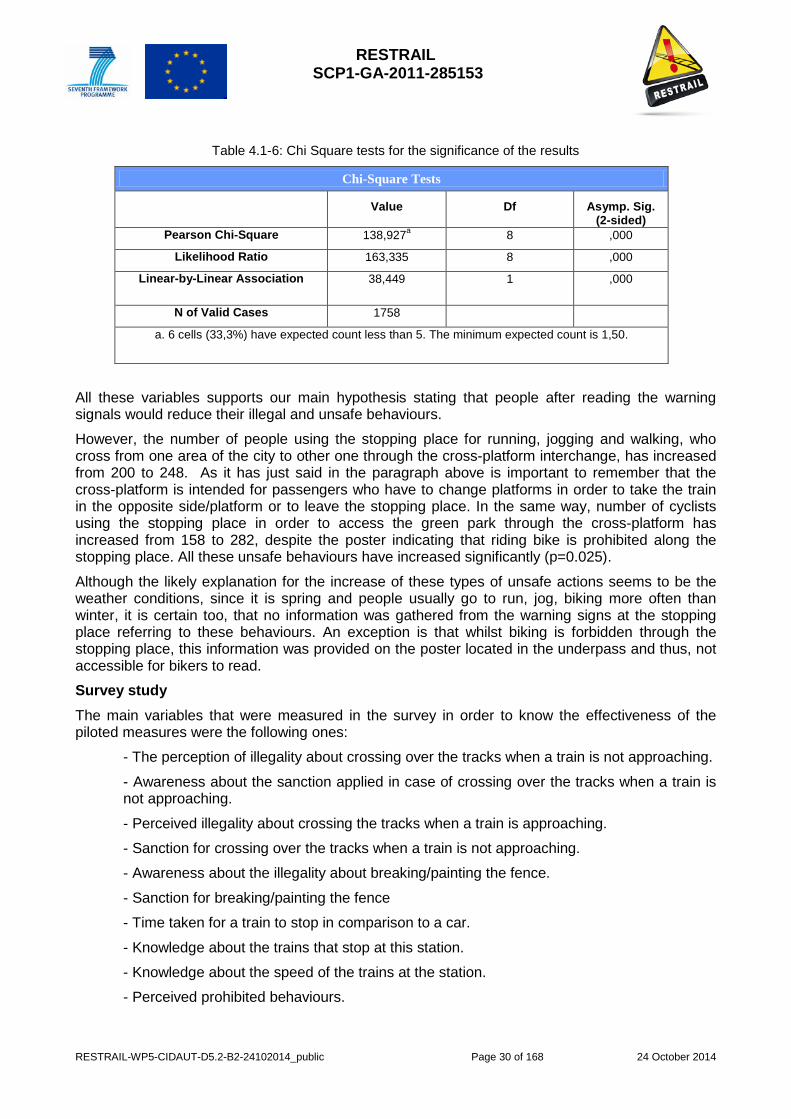
RESTRAIL SCP1-GA-2011-285153
RESTRAIL-WP5-CIDAUT-D5.2-B2-24102014_public Page 30 of 168 24 October 2014
Table 4.1-6: Chi Square tests for the significance of the results
Chi-Square Tests
Value
Df
Asymp. Sig. (2-sided)
Pearson Chi-Square 138,927a 8 ,000
Likelihood Ratio 163,335 8 ,000
Linear-by-Linear Association 38,449 1 ,000
N of Valid Cases 1758 a. 6 cells (33,3%) have expected count less than 5. The minimum expected count is 1,50.
All these variables supports our main hypothesis stating that people after reading the warning signals would reduce their illegal and unsafe behaviours.
However, the number of people using the stopping place for running, jogging and walking, who cross from one area of the city to other one through the cross-platform interchange, has increased from 200 to 248. As it has just said in the paragraph above is important to remember that the cross-platform is intended for passengers who have to change platforms in order to take the train in the opposite side/platform or to leave the stopping place. In the same way, number of cyclists using the stopping place in order to access the green park through the cross-platform has increased from 158 to 282, despite the poster indicating that riding bike is prohibited along the stopping place. All these unsafe behaviours have increased significantly (p=0.025).
Although the likely explanation for the increase of these types of unsafe actions seems to be the weather conditions, since it is spring and people usually go to run, jog, biking more often than winter, it is certain too, that no information was gathered from the warning signs at the stopping place referring to these behaviours. An exception is that whilst biking is forbidden through the stopping place, this information was provided on the poster located in the underpass and thus, not accessible for bikers to read.
Survey study The main variables that were measured in the survey in order to know the effectiveness of the piloted measures were the following ones:
- The perception of illegality about crossing over the tracks when a train is not approaching.
- Awareness about the sanction applied in case of crossing over the tracks when a train is not approaching.
- Perceived illegality about crossing the tracks when a train is approaching.
- Sanction for crossing over the tracks when a train is not approaching.
- Awareness about the illegality about breaking/painting the fence.
- Sanction for breaking/painting the fence
- Time taken for a train to stop in comparison to a car.
- Knowledge about the trains that stop at this station.
- Knowledge about the speed of the trains at the station.
- Perceived prohibited behaviours.
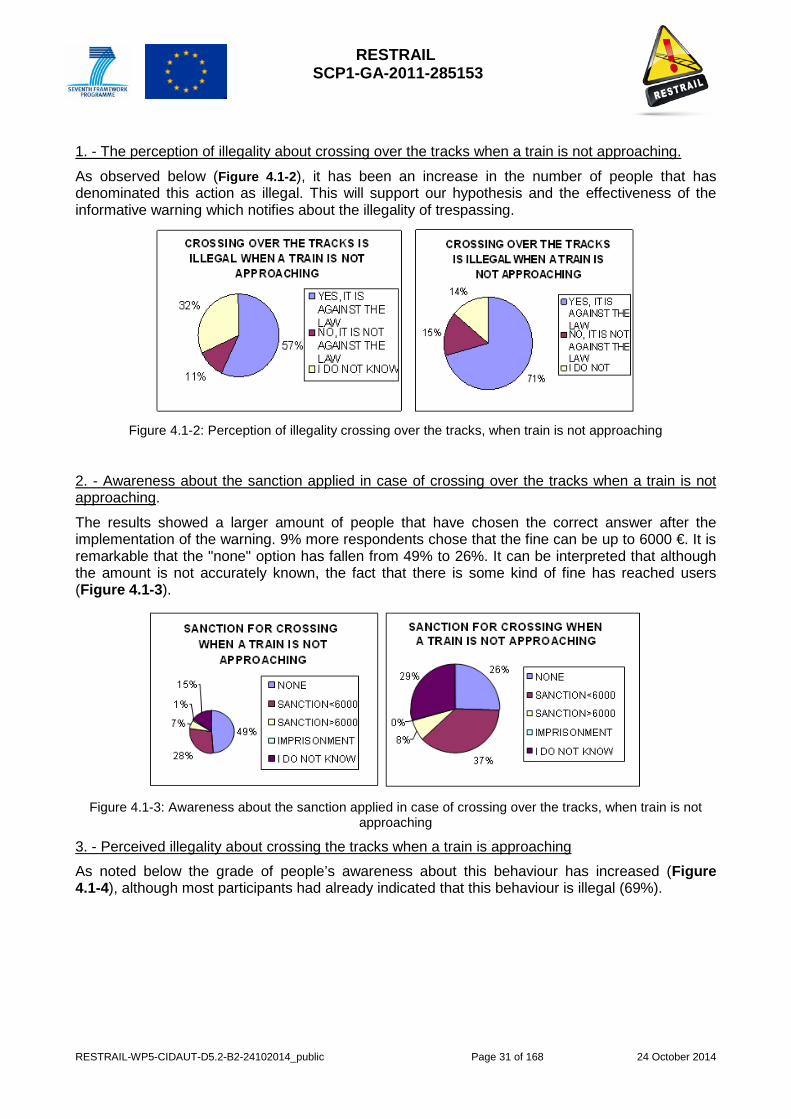
RESTRAIL SCP1-GA-2011-285153
RESTRAIL-WP5-CIDAUT-D5.2-B2-24102014_public Page 31 of 168 24 October 2014
1. - The perception of illegality about crossing over the tracks when a train is not approaching.
As observed below (Figure 4.1-2), it has been an increase in the number of people that has denominated this action as illegal. This will support our hypothesis and the effectiveness of the informative warning which notifies about the illegality of trespassing.
Figure 4.1-2: Perception of illegality crossing over the tracks, when train is not approaching
2. - Awareness about the sanction applied in case of crossing over the tracks when a train is not approaching.
The results showed a larger amount of people that have chosen the correct answer after the implementation of the warning. 9% more respondents chose that the fine can be up to 6000 €. It is remarkable that the "none" option has fallen from 49% to 26%. It can be interpreted that although the amount is not accurately known, the fact that there is some kind of fine has reached users (Figure 4.1-3).
Figure 4.1-3: Awareness about the sanction applied in case of crossing over the tracks, when train is not
approaching
3. - Perceived illegality about crossing the tracks when a train is approaching
As noted below the grade of people’s awareness about this behaviour has increased (Figure 4.1-4), although most participants had already indicated that this behaviour is illegal (69%).
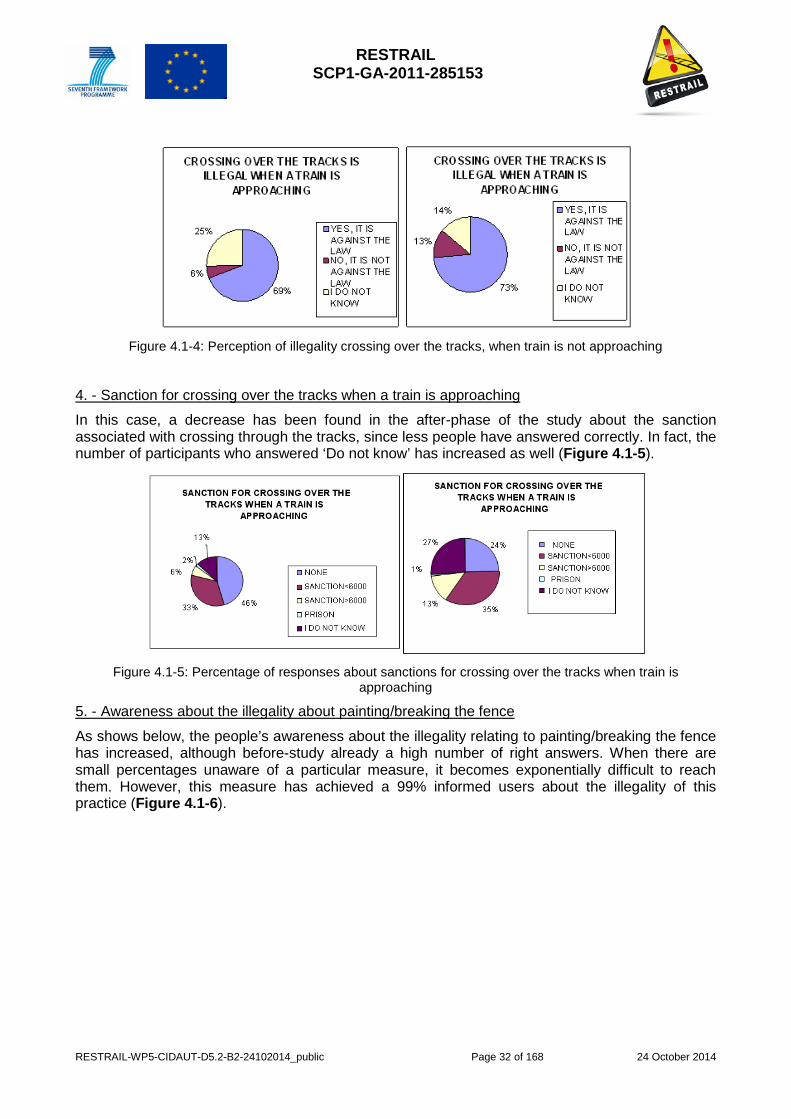
RESTRAIL SCP1-GA-2011-285153
RESTRAIL-WP5-CIDAUT-D5.2-B2-24102014_public Page 32 of 168 24 October 2014
Figure 4.1-4: Perception of illegality crossing over the tracks, when train is not approaching
4. - Sanction for crossing over the tracks when a train is approaching
In this case, a decrease has been found in the after-phase of the study about the sanction associated with crossing through the tracks, since less people have answered correctly. In fact, the number of participants who answered ‘Do not know’ has increased as well (Figure 4.1-5).
Figure 4.1-5: Percentage of responses about sanctions for crossing over the tracks when train is
approaching
5. - Awareness about the illegality about painting/breaking the fence
As shows below, the people’s awareness about the illegality relating to painting/breaking the fence has increased, although before-study already a high number of right answers. When there are small percentages unaware of a particular measure, it becomes exponentially difficult to reach them. However, this measure has achieved a 99% informed users about the illegality of this practice (Figure 4.1-6).
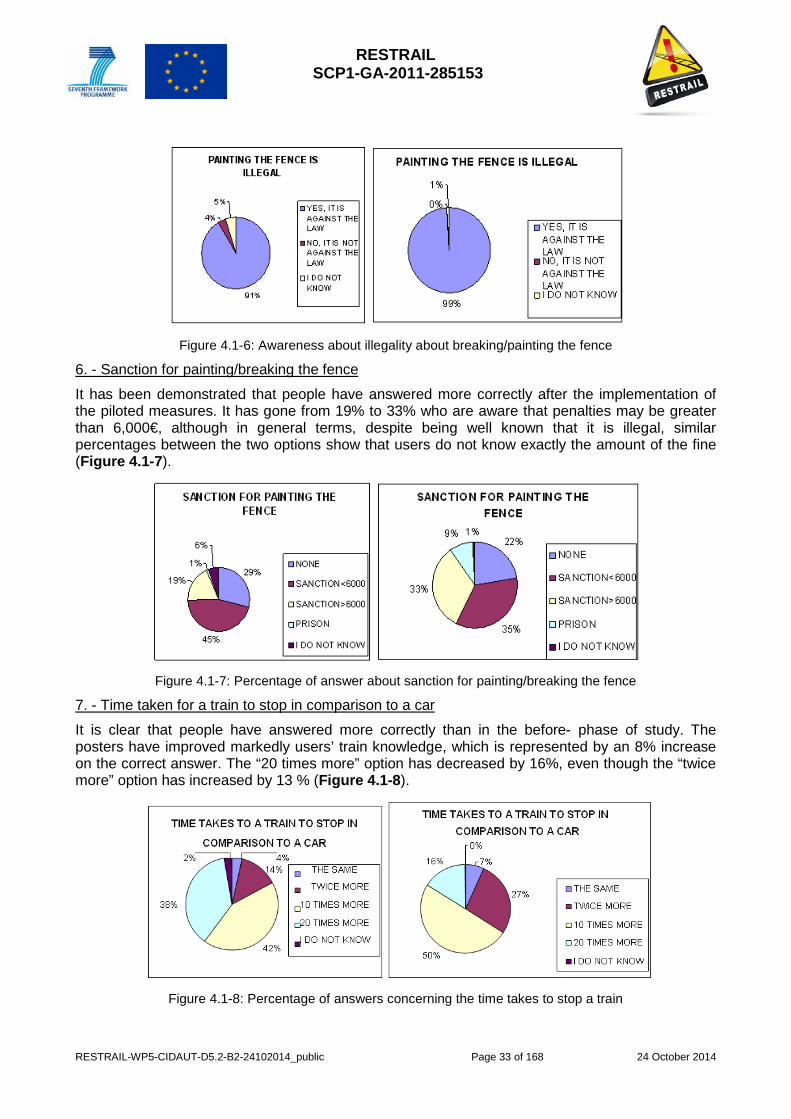
RESTRAIL SCP1-GA-2011-285153
RESTRAIL-WP5-CIDAUT-D5.2-B2-24102014_public Page 33 of 168 24 October 2014
Figure 4.1-6: Awareness about illegality about breaking/painting the fence
6. - Sanction for painting/breaking the fence
It has been demonstrated that people have answered more correctly after the implementation of the piloted measures. It has gone from 19% to 33% who are aware that penalties may be greater than 6,000€, although in general terms, despite being well known that it is illegal, similar percentages between the two options show that users do not know exactly the amount of the fine (Figure 4.1-7).
Figure 4.1-7: Percentage of answer about sanction for painting/breaking the fence
7. - Time taken for a train to stop in comparison to a car
It is clear that people have answered more correctly than in the before- phase of study. The posters have improved markedly users’ train knowledge, which is represented by an 8% increase on the correct answer. The “20 times more” option has decreased by 16%, even though the “twice more” option has increased by 13 % (Figure 4.1-8).
Figure 4.1-8: Percentage of answers concerning the time takes to stop a train
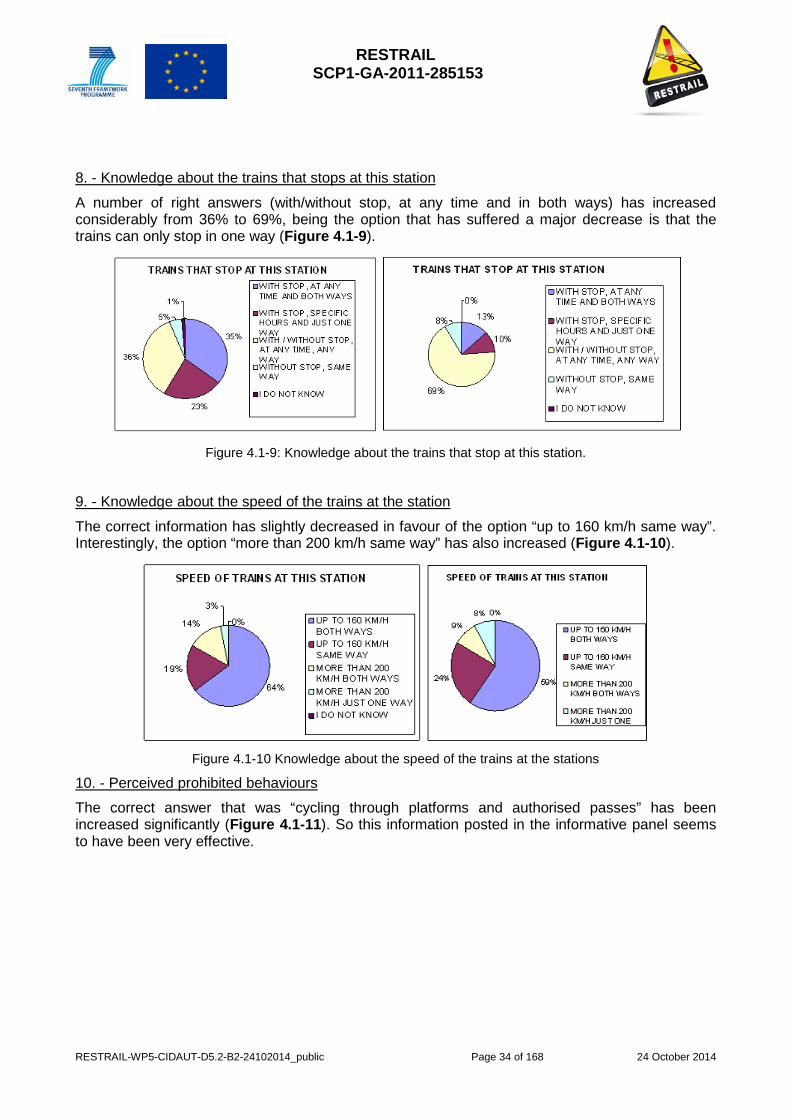
RESTRAIL SCP1-GA-2011-285153
RESTRAIL-WP5-CIDAUT-D5.2-B2-24102014_public Page 34 of 168 24 October 2014
8. - Knowledge about the trains that stops at this station
A number of right answers (with/without stop, at any time and in both ways) has increased considerably from 36% to 69%, being the option that has suffered a major decrease is that the trains can only stop in one way (Figure 4.1-9).
Figure 4.1-9: Knowledge about the trains that stop at this station.
9. - Knowledge about the speed of the trains at the station
The correct information has slightly decreased in favour of the option “up to 160 km/h same way”. Interestingly, the option “more than 200 km/h same way” has also increased (Figure 4.1-10).
Figure 4.1-10 Knowledge about the speed of the trains at the stations
10. - Perceived prohibited behaviours
The correct answer that was “cycling through platforms and authorised passes” has been increased significantly (Figure 4.1-11). So this information posted in the informative panel seems to have been very effective.
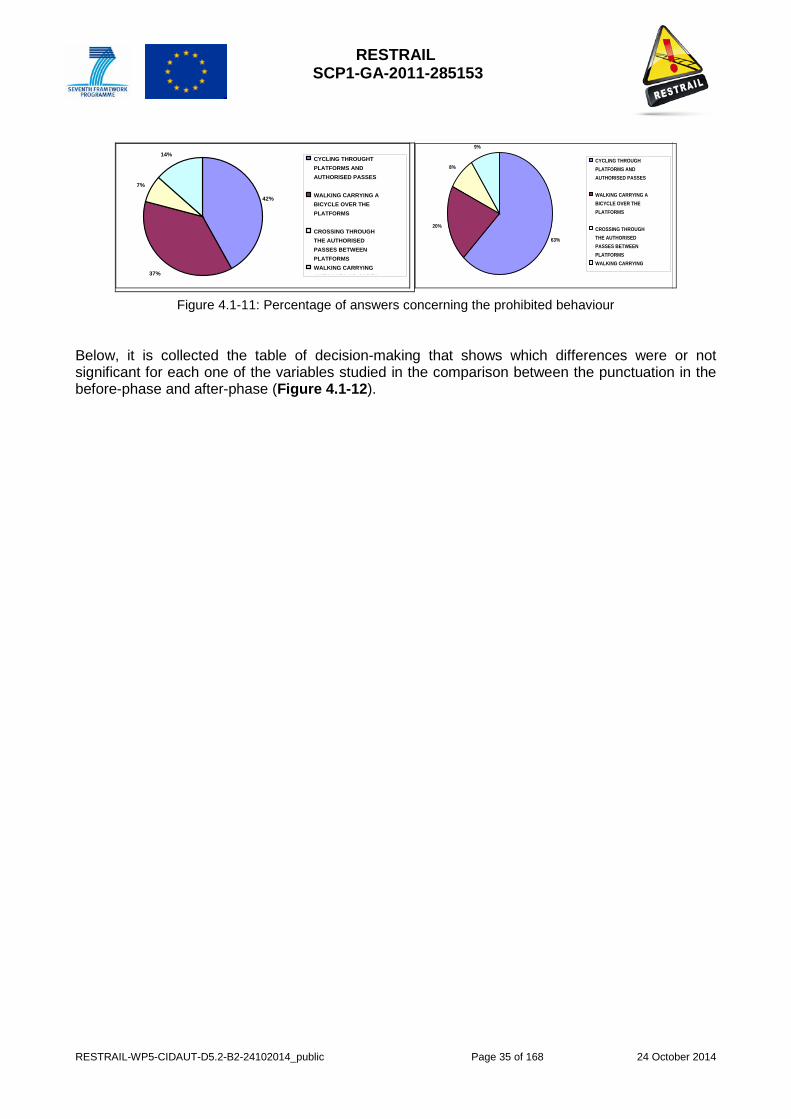
RESTRAIL SCP1-GA-2011-285153
RESTRAIL-WP5-CIDAUT-D5.2-B2-24102014_public Page 35 of 168 24 October 2014
42%
37%
7%
14%CYCLING THROUGHTPLATFORMS ANDAUTHORISED PASSES
WALKING CARRYING ABICYCLE OVER THEPLATFORMS
CROSSING THROUGHTHE AUTHORISEDPASSES BETWEENPLATFORMSWALKING CARRYINGSUITCASES OR CARTS
63%
20%
8%
9%
CYCLING THROUGHPLATFORMS ANDAUTHORISED PASSES
WALKING CARRYING ABICYCLE OVER THEPLATFORMS
CROSSING THROUGHTHE AUTHORISEDPASSES BETWEENPLATFORMSWALKING CARRYINGSUITCASES OR CARTS
Figure 4.1-11: Percentage of answers concerning the prohibited behaviour
Below, it is collected the table of decision-making that shows which differences were or not significant for each one of the variables studied in the comparison between the punctuation in the before-phase and after-phase (Figure 4.1-12).
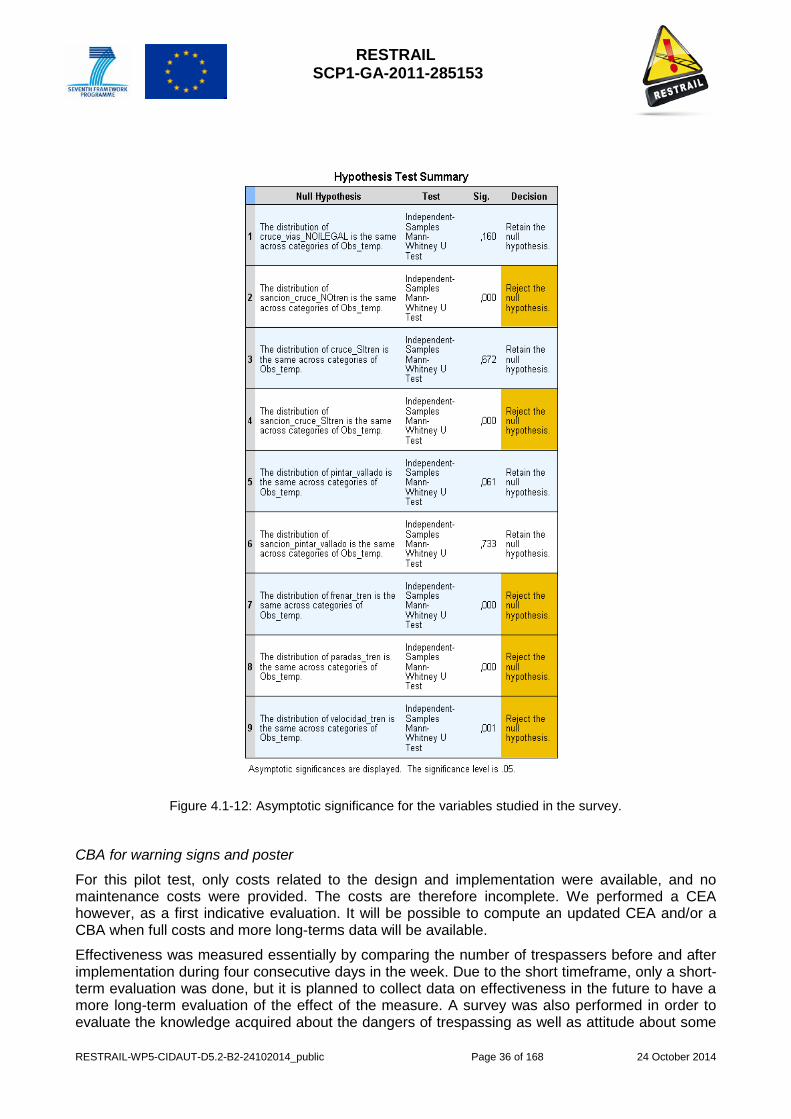
RESTRAIL SCP1-GA-2011-285153
RESTRAIL-WP5-CIDAUT-D5.2-B2-24102014_public Page 36 of 168 24 October 2014
Figure 4.1-12: Asymptotic significance for the variables studied in the survey.
CBA for warning signs and poster
For this pilot test, only costs related to the design and implementation were available, and no maintenance costs were provided. The costs are therefore incomplete. We performed a CEA however, as a first indicative evaluation. It will be possible to compute an updated CEA and/or a CBA when full costs and more long-terms data will be available.
Effectiveness was measured essentially by comparing the number of trespassers before and after implementation during four consecutive days in the week. Due to the short timeframe, only a short-term evaluation was done, but it is planned to collect data on effectiveness in the future to have a more long-term evaluation of the effect of the measure. A survey was also performed in order to evaluate the knowledge acquired about the dangers of trespassing as well as attitude about some

RESTRAIL SCP1-GA-2011-285153
RESTRAIL-WP5-CIDAUT-D5.2-B2-24102014_public Page 37 of 168 24 October 2014
risky behaviour. It was not possible to use these results as a measure of effectiveness given that no standard calculation formula was available to transform responses to each item into a global quantitative score to be used in CEA or CBA. Results and assumptions are provided in Table 4.1-7. Bearing in mind the limits of the current calculation, the observed ratio could be interpreted in the following way: an investment of 1 euro reduces by 0.96 the number of trespassers per year. Alternately, it can be also understood as an investment of 1,04 Euros (1/0.96) will reduce by 1 the number of trespassers in one year at the considered location.
Table 4.1-7: CEA of Pilot test 1: “Warning signs and posters”
Cost [C] 2 748€
Effectiveness measures
Number of trespassers prevented per year
2652 (51 decrease/ week * 52 weeks)
Assumption(s) The reduction in the number of trespassers is considered as
constant and representative of the cumulated effect whatever the
period in the year
Cost effectiveness ratio (CEA results (E/C)
0,96501
It should be noted that a mini CBA could be calculated given that an estimation of the following parameters could be obtained or assumptions made in the future:
- Number of accidents due to trespassing events per year. - Distribution of trespass consequences (fatalities, injuries). - The effect of decreasing the frequency of trespassing on the frequency of fatal trespassing
accidents. - Average delay induced by trespassing events.
4.1.4 Applicability of results to different circumstances Existence of empirical evidence from other studies makes clear and supports the fact of signals and posters’ effectiveness. Some years ago, Silla and Luoma (2011) obtained a reduction of 30.7 % in trespassing in a specific Finnish location. In this paper, authors suggest, as improvement and future line, that posters are aimed only to deliver information about dangers related to trespassing and they highlight that they should have just an informative purpose and should not prohibit or dictate behaviours. These points have been successfully collected in the poster and signs applied in the University of Valladolid stopping place where information about economic charges have been provided. Even though a general effectiveness seems to be clear, the characteristic of these signs and posters should be adapted depends on the context and country; especially, it should be flexible regarding three main points: content, amount of signs and posters and period of time. The design of the signs/posters should be carefully planned. It might be that the same design is not effective in all cultures. For example some train operators could disagree with the message shown as they might not like the depiction of a (recognizable, their company) train on a poster. In addition, it is important that the posters have a language such that everyone can understand its content (i.e.
RESTRAIL SCP1-GA-2011-285153
RESTRAIL-WP5-CIDAUT-D5.2-B2-24102014_public Page 38 of 168 24 October 2014
removing old posters and replacing them with posters in a modern language). Finally, it is crucial to be careful with the message "trespassing is dangerous" this could attract potentially suicidal persons to the tracks. It is better to address to "the delays caused by trespassers" and "the number of people that are deceived by those delays". The amount of signs presented is another important factor to be considered. It should be made sure that there is no unnecessary signing. Otherwise, people could look at the posters without taking much notice of them. On the other hand, paying attention depends on the amount of posters that are installed, in this way, it should be study carefully how many and where the posters are allocated. Thirdly, it is important to take into account the period of time the signs and posters are exposed in a determinate area. The effect of posters is likely to be reduced over time. However, this effect could be maintained by replacing the old and ‘grungy’ posters by new ones. Their effectiveness could be increased also by changing the content / design of the posters from time to time (e.g. every year or twice a year a new poster). As a general idea, the optimal measure would be to combine these signs with targeted campaigns. Furthermore, another successful resource could be to combine these measures with prohibitive signs. Placing signs with the same message next to each other (e.g. one is an icon, the other a picture with text, the other is a prohibitive sign). Finally, it is crucial to receive support from station owners etc. for space to place posters as these may compete with others for space (e.g. displacing advertising revenue). After all, one of the most important factors is government involvement. Budget and political will would be the main paths in order to generalize those methodologies.
4.1.5 Discussion As it collected above, the warning signs had a significant effect on the reduction of trespassing. It seems to be an effective measure in order to reduce trespassing incidents as also indicated in some previous studies (Silla and Luoma, 2011). In addition at the trial location, warning about the possibility of being fined by breaking the fences located at the stopping place has had an effect on avoiding this behaviour in the future. Consequently, after the implementation of this type of warning, the stopping place users have not again broken the fence, reducing significantly the use of an illegal area in order to cross to the stopping place.
RESTRAIL SCP1-GA-2011-285153
RESTRAIL-WP5-CIDAUT-D5.2-B2-24102014_public Page 39 of 168 24 October 2014
4.2 Railway safety education programme-FFE
4.2.1 Overview of the piloted measure The Railway Safety Education Programme worked with primary school children (aged 8 to 10 years) and primary school teachers, to raise awareness about the dangers and consequences of railway trespassing and how to be safe in the railway environment. The overall aim of the measure was to positively influence the behaviours and habits of children and young people towards acting safely around railways, preventing risky behaviour related to trespassing, thus reducing the possibility of accidents and incidents. The measure sought to achieve this aim through the following specific objectives:
− Develop attitudes about safety on trains and railways.
− Improve knowledge and awareness of safety on railway property, including the dangers and consequences of games and /or inappropriate activities on / near the tracks.
− Teach personal skills, such as awareness of danger/risk and safety on the tracks, how to be safe in railway environments and how to cross the tracks safely.
The programme comprised the delivery of railway safety workshops to both teachers and pupils between January and March. These took place at the two national railway museums in Spain (Madrid and Cataluña) and at three public primary schools in the city of Alicante. All participating schools are located close to a railway line and experience problems with railway trespassing.
The 8 - 10 year age group was selected in order to prepare this group with the safety skills that they will need for the next stage in their independent development. As teenagers the pupils will be more vulnerable to acting out high risk behaviour, such as railway trespassing, therefore intervening at an earlier age will help to shape attitudes that will influence safer behaviour in the future.
The measure worked with teachers and schools as a mechanism to reinforce the rail safety message to pupils. The involvement of teachers in delivering railway safety at school offers the chance to do prevention work in a continuous and sustained way, reaching a wide audience. In order for schools to act as delivery agents of railway safety education the measure had two key objectives:
− Create interest and awareness of the need to teach railway safety at schools.
− Provide knowledge and tools that enable teachers to have the confidence and capacity to teach railway safety at schools.
The FFE research team designed developed and delivered the rail safety workshops. The programme and workshop materials were based on an extensive review of existing railway safety education programmes and consultation with education and railway safety experts: Spanish Railway Museum learning teams, Autónoma University of Madrid Education Department, York National Railway Museum and British Transport Police, the Spanish Infrastructure Manager (ADIF) and Alicante City Council.
3.2.2 Methodology to evaluate the piloted measures The focus of the evaluation is twofold to reflect the work carried out with the two beneficiary groups. On the one hand the evaluation has assessed the impact on teachers/schools and on the other hand the study has sought to measure the effects on the participating students. In addition to the specific data collected for the two evaluations, monitoring data was gathered for both, summarized in Table 4.2-1.

RESTRAIL SCP1-GA-2011-285153
RESTRAIL-WP5-CIDAUT-D5.2-B2-24102014_public Page 40 of 168 24 October 2014
Table 4.2-1: Monitoring data collected
Information Teacher Pupil Number of schools engaged ✓ ✓ Proximity of school to railway line ✓ ✓ Number of activities delivered ✓ ✓ Number of participants (age, sex) ✓ ✓ Teacher Evaluation In line with the objectives of the measure the evaluation aimed to assess the impact on teachers´ attitudes, knowledge and skills. Specifically the following indicators were identified to measure effectiveness:
− Provision of rail and road safety education at the school: before and after participation;
− Perception of the importance of teaching railway safety and the dangers of railway trespassing: before and after participation;
− Level of confidence and capacity to teach railway safety at school: before and after participation;
− Level of satisfaction with teacher´s workshop.
The study explored a mix of qualitative and quantitative information by employing a semi-structured (self-completion) questionnaire with a mix of open-ended and closed questions, in addition to Likert scales. In order to assess the impact of the Railway Safety Education Programme, a questionnaire was distributed at the end of the workshop session and a follow up questionnaire was sent 1-2 months after participation.
The analysis of the teacher´s evaluation is structured under the four indicator headings outlined above. The questionnaire responses were translated from Spanish to English. The collected data was then cleansed and processed using Excel, before undergoing a descriptive analysis, within which the univariate analysis method was applied.
Responses to the open ended questions underwent a thematic analysis, by coding the answers under themed categories and then carrying out a univariate analysis of these themes. The analysis has been further enriched by the inclusion of verbatim quotes and qualitative (anecdotal) information captured from discussions generated during the workshop (translated from Spanish into English).
Please note, many of the questions sought to discover the impacts on individual teachers whilst others concerned practices at a school level. The analysis of the latter type of question has taken into account responses from all teachers, even though in a small number of cases contradictory responses were given by individual teachers from the same school. This may be explained by the degree of autonomy that individual teachers have in their classes.
In terms of the teacher sample, 7 educational centres participated in the workshops, comprising a total of 27 participants. Representatives from all educational centres completed the initial Teacher Evaluation (24 participants) and representatives from four of the educational centres completed the Teacher/School Follow up Evaluation (five participants).
Please note, due to the fact that not all participating organizations were schools, the respondents will be referred to as educational centres. Where relevant the data will be disaggregated to highlight responses from the specific organizations.
RESTRAIL SCP1-GA-2011-285153
RESTRAIL-WP5-CIDAUT-D5.2-B2-24102014_public Page 41 of 168 24 October 2014
Pupil Evaluation The evaluation of the pupils’ workshops sought to gauge the change in the knowledge, attitudes and behaviour of the students regarding railway safety. The assessment of pupils´ knowledge, attitudes and behaviour regarding crossing the railway tracks safely was evaluated at the beginning of the session (baseline) before starting the workshop and then again at the end of the workshop, in order to detect any change in attitude and knowledge.
The assessment was made using two evaluation activities. On the one hand, students were asked to help a character, named Daniela, get from her house to school by choosing between three possible routes. All paths involved having to cross a railway track, two of which included crossing the track in unauthorised and dangerous places and one option involved using a bridge. At the end of the workshop, in order to assess the knowledge acquisition of the pupils, this same exercise was repeated along with a series of true or false questions about the information presented in the workshop.
The results of the pupils´ workshops have been analysed using descriptive analysis methods. On the one hand, a univariate analysis has been performed, using a confidence interval of 95% which describes the distribution, trend and dispersion of the single variables. A bivariate analysis has been used to examine the relationship between pairs of variables. The Pearson’s Chi-square test has been carried out to test the relationship or independence of the variables examined. The analysis has been further enriched by the inclusion of qualitative (anecdotal) information captured from discussions generated during the workshop.
The data processing and statistical analysis of the results were performed using the SPSS statistical package for Windows and the data analysis programme Epidat 4.0. The database was created according to information collected in the questionnaire. The codification of the variables is determined by the design of the questionnaire.
The sample is based on the 271 pupils that participated in the pilot. Workshops were carried out with pupils from schools in the town of Vilanova i la Geltrú in Cataluña (n=99; 36.5%; C.I. 95%: 30.8-42.3), Alicante (n= 98; 26.9%; C.I. 95%: 30.4-41.9) and Madrid (n= 74; 27.3%; C.I. 95%: 22.0-32.6).
4.2.2 Evaluation results Monitoring data The Table 4.2-2 summarizes the key monitoring data regarding participation in the Railway Safety Education Programme pilot collected for both types of workshops.

RESTRAIL SCP1-GA-2011-285153
RESTRAIL-WP5-CIDAUT-D5.2-B2-24102014_public Page 42 of 168 24 October 2014
Table 4.2-2: Data of the Railway Safety Education Programme pilot.
Location Participating
Education Centres
Proximity to railway
(metres) aprox
Workshops delivered
Number of participants
Pupil profile
Age (years) Sex
T* P* T* P* 8-9 9-10 Female Male
Alicante
San Francisco de Asis Public Primary School
200 m
1 4 20 98 80 18 49 47
Jose Carlos Aguilera Public Primary School
300 m
Gabriel Miró Public Primary School
5 m
Cataluña
L'Arjau Public Primary School 100 m
1 3 7** 99 37 62 44 55
Llebetx Public Primary School 100 m
Mataró Local Education Resource Centre
N/A
Cataluña Railway Museum learning team
20 m
Madrid Jorge Guillén Public Primary School
600 m 0 2 0 74 27 47 38 36
TOTAL 8 2 9 27 271 144 124 130 138
* T= teacher; P= pupil
** Five of the teacher workshop participants were members of educational staff from two different organizations: Cataluña Railway Museum Learning Team and Mataró Local Education Resource Centre.
As can be observed from the analysed data a total of 8 organizations participated in the pilot study, 6 of which were state primary schools. The other two, whilst not schools, have within their remit the delivery of educational activities to primary and secondary audiences3. A total of 2 teacher and 9 pupil workshops were delivered with participation rates of 27 and 271 respectively.
3 The Mataró Local Education Resource Centre is responsible for giving professional development support to teachers
within its catchment. In this way it has knowledge of the curriculum provision of schools within the Mataró area and as such its questionnaire responses are representative of school practices. The inclusion of such an organization in the project is interesting due to its potential to reach a number of schools and disseminate railway safety work. It is also worth noting that the catchment area covered by this organization is different from that of the two schools that participated from Cataluña.
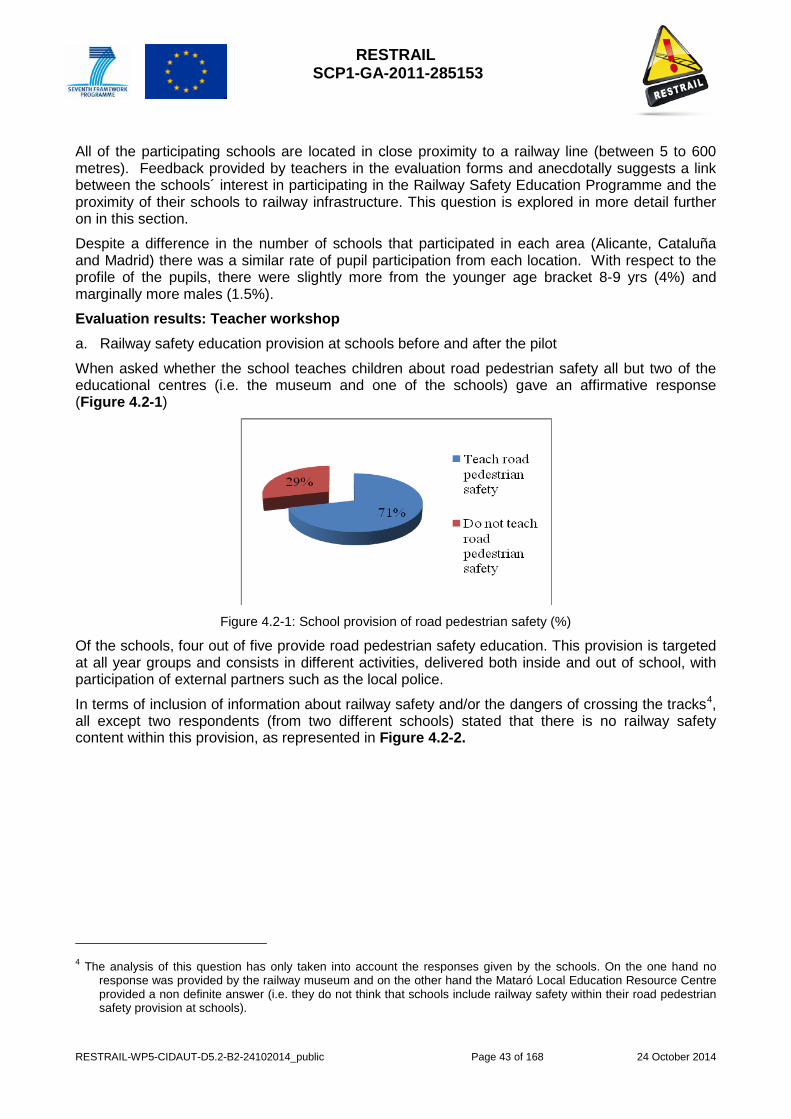
RESTRAIL SCP1-GA-2011-285153
RESTRAIL-WP5-CIDAUT-D5.2-B2-24102014_public Page 43 of 168 24 October 2014
All of the participating schools are located in close proximity to a railway line (between 5 to 600 metres). Feedback provided by teachers in the evaluation forms and anecdotally suggests a link between the schools´ interest in participating in the Railway Safety Education Programme and the proximity of their schools to railway infrastructure. This question is explored in more detail further on in this section.
Despite a difference in the number of schools that participated in each area (Alicante, Cataluña and Madrid) there was a similar rate of pupil participation from each location. With respect to the profile of the pupils, there were slightly more from the younger age bracket 8-9 yrs (4%) and marginally more males (1.5%).
Evaluation results: Teacher workshop a. Railway safety education provision at schools before and after the pilot
When asked whether the school teaches children about road pedestrian safety all but two of the educational centres (i.e. the museum and one of the schools) gave an affirmative response (Figure 4.2-1)
Figure 4.2-1: School provision of road pedestrian safety (%)
Of the schools, four out of five provide road pedestrian safety education. This provision is targeted at all year groups and consists in different activities, delivered both inside and out of school, with participation of external partners such as the local police.
In terms of inclusion of information about railway safety and/or the dangers of crossing the tracks4, all except two respondents (from two different schools) stated that there is no railway safety content within this provision, as represented in Figure 4.2-2.
4 The analysis of this question has only taken into account the responses given by the schools. On the one hand no
response was provided by the railway museum and on the other hand the Mataró Local Education Resource Centre provided a non definite answer (i.e. they do not think that schools include railway safety within their road pedestrian safety provision at schools).
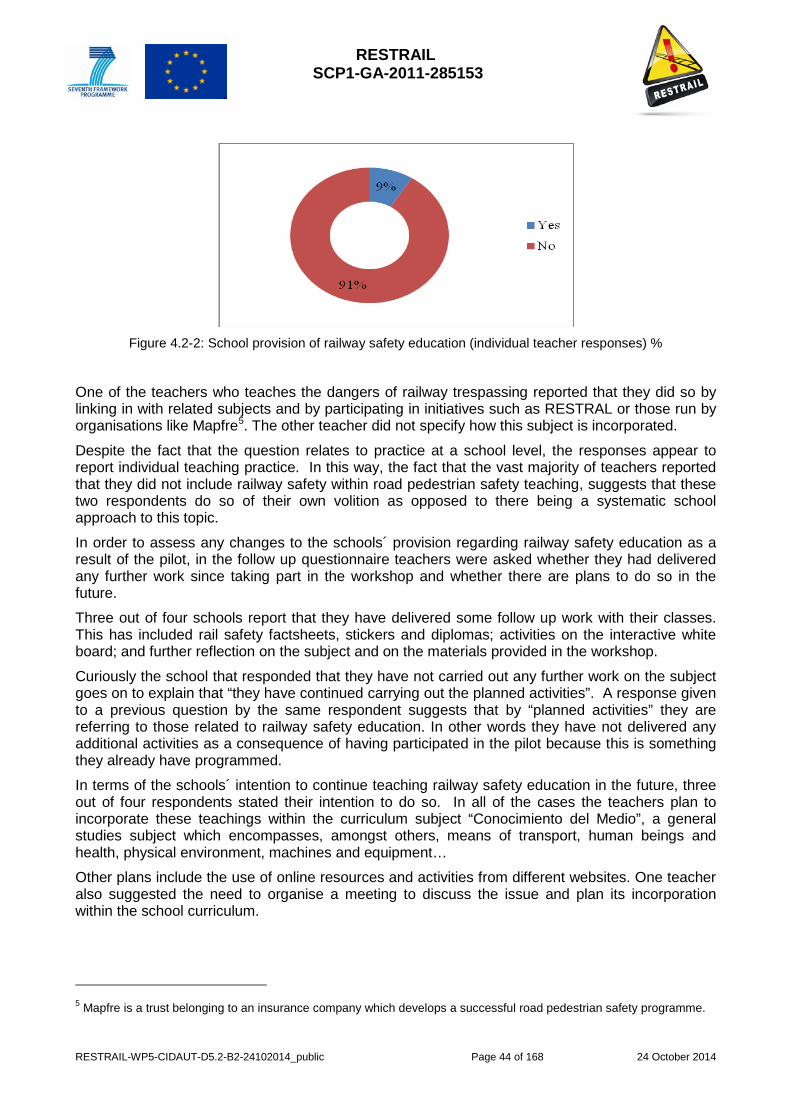
RESTRAIL SCP1-GA-2011-285153
RESTRAIL-WP5-CIDAUT-D5.2-B2-24102014_public Page 44 of 168 24 October 2014
Figure 4.2-2: School provision of railway safety education (individual teacher responses) %
One of the teachers who teaches the dangers of railway trespassing reported that they did so by linking in with related subjects and by participating in initiatives such as RESTRAL or those run by organisations like Mapfre5. The other teacher did not specify how this subject is incorporated.
Despite the fact that the question relates to practice at a school level, the responses appear to report individual teaching practice. In this way, the fact that the vast majority of teachers reported that they did not include railway safety within road pedestrian safety teaching, suggests that these two respondents do so of their own volition as opposed to there being a systematic school approach to this topic.
In order to assess any changes to the schools´ provision regarding railway safety education as a result of the pilot, in the follow up questionnaire teachers were asked whether they had delivered any further work since taking part in the workshop and whether there are plans to do so in the future.
Three out of four schools report that they have delivered some follow up work with their classes. This has included rail safety factsheets, stickers and diplomas; activities on the interactive white board; and further reflection on the subject and on the materials provided in the workshop.
Curiously the school that responded that they have not carried out any further work on the subject goes on to explain that “they have continued carrying out the planned activities”. A response given to a previous question by the same respondent suggests that by “planned activities” they are referring to those related to railway safety education. In other words they have not delivered any additional activities as a consequence of having participated in the pilot because this is something they already have programmed.
In terms of the schools´ intention to continue teaching railway safety education in the future, three out of four respondents stated their intention to do so. In all of the cases the teachers plan to incorporate these teachings within the curriculum subject “Conocimiento del Medio”, a general studies subject which encompasses, amongst others, means of transport, human beings and health, physical environment, machines and equipment…
Other plans include the use of online resources and activities from different websites. One teacher also suggested the need to organise a meeting to discuss the issue and plan its incorporation within the school curriculum.
5 Mapfre is a trust belonging to an insurance company which develops a successful road pedestrian safety programme.
RESTRAIL SCP1-GA-2011-285153
RESTRAIL-WP5-CIDAUT-D5.2-B2-24102014_public Page 45 of 168 24 October 2014
Despite the fact one of the schools responded “no” to this question, a response given to an earlier question suggests that they will indeed continue delivering railway safety education, due to the fact that this is already something covered by the school.
Incorporating the subject of railway safety within the school curriculum can ensure the continuity of the teachings. This does not exclude the value of carrying out specific activities such as rail safety workshops. Indeed one of the respondents expressed an opinion endorsing this approach, saying that the pupils often pay more attention when someone external delivers the activity.
Key findings:
Based on the responses of the workshop participants there currently does not appear to be a systematic approach to delivering railway pedestrian safety at the schools.
Despite a lack of current provision, evidence provided in the follow up questionnaire suggests that most of the schools that have participated in the pilot intend to deliver railway safety contents in the future, by incorporating learning within the school curriculum. Further evidence of the impact of the measure on teachers´ practice is the fact that some of the teachers have already carried out follow up work on the subject since their participation in the workshop.
Taking into account the baseline situation the measure appears to have successful in encouraging teachers to adopt these teachings.
a. Perception of the importance of teaching railway safety at schools before and after the pilot
According to their questionnaire responses all participants consider it important to teach railway safety and the dangers of railway trespassing. This result is perhaps not too surprising given that all of the participating educational centres are located close to a railway and in areas where trespassing is common. Indeed the very fact of having signed up to the workshop indicates an awareness of the need for such an intervention.
In order to further explore perceptions regarding this problem, participants were asked to explain their answer. Given that the question was open, often more than one reason was cited. The responses given to this question (17 in total) have been grouped thematically and given a percentage frequency rating (see Figure 4.2-3). Some verbatim examples are listed by way of illustration.
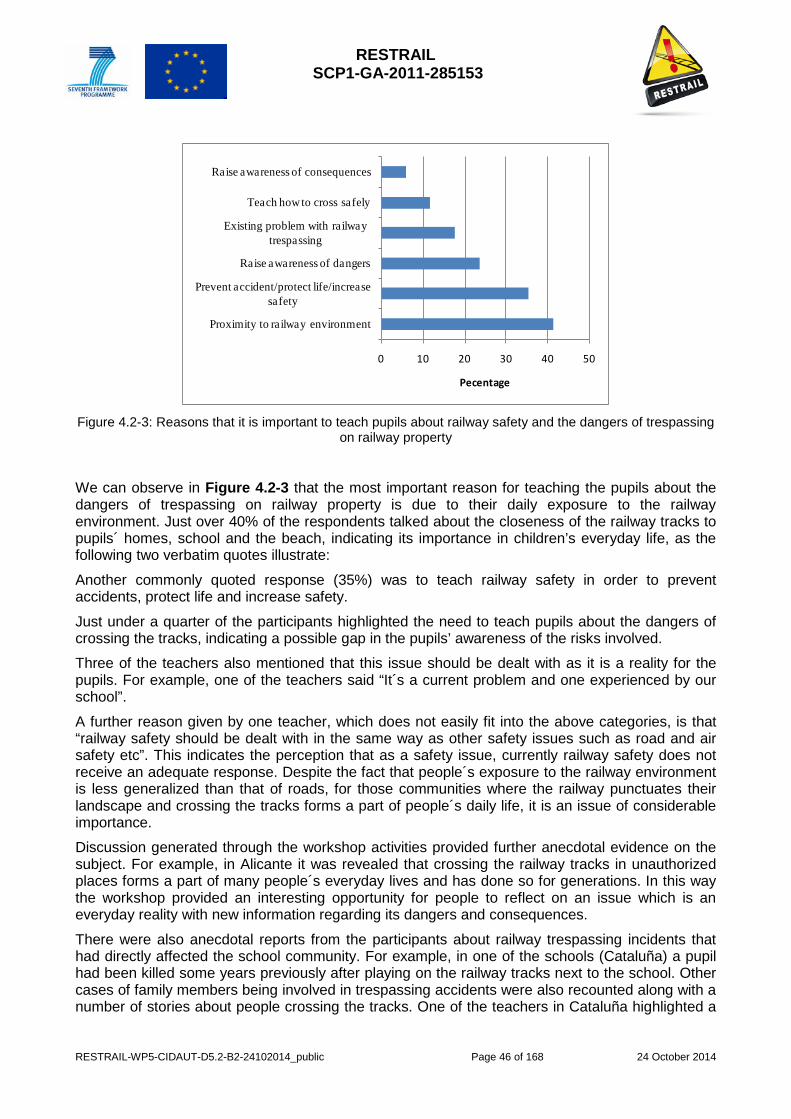
RESTRAIL SCP1-GA-2011-285153
RESTRAIL-WP5-CIDAUT-D5.2-B2-24102014_public Page 46 of 168 24 October 2014
0 10 20 30 40 50
Proximity to railway environment
Prevent accident/protect life/increase safety
Raise awareness of dangers
Existing problem with railway trespassing
Teach how to cross safely
Raise awareness of consequences
Pecentage
Figure 4.2-3: Reasons that it is important to teach pupils about railway safety and the dangers of trespassing
on railway property
We can observe in Figure 4.2-3 that the most important reason for teaching the pupils about the dangers of trespassing on railway property is due to their daily exposure to the railway environment. Just over 40% of the respondents talked about the closeness of the railway tracks to pupils´ homes, school and the beach, indicating its importance in children’s everyday life, as the following two verbatim quotes illustrate:
Another commonly quoted response (35%) was to teach railway safety in order to prevent accidents, protect life and increase safety.
Just under a quarter of the participants highlighted the need to teach pupils about the dangers of crossing the tracks, indicating a possible gap in the pupils’ awareness of the risks involved.
Three of the teachers also mentioned that this issue should be dealt with as it is a reality for the pupils. For example, one of the teachers said “It´s a current problem and one experienced by our school”.
A further reason given by one teacher, which does not easily fit into the above categories, is that “railway safety should be dealt with in the same way as other safety issues such as road and air safety etc”. This indicates the perception that as a safety issue, currently railway safety does not receive an adequate response. Despite the fact that people´s exposure to the railway environment is less generalized than that of roads, for those communities where the railway punctuates their landscape and crossing the tracks forms a part of people´s daily life, it is an issue of considerable importance.
Discussion generated through the workshop activities provided further anecdotal evidence on the subject. For example, in Alicante it was revealed that crossing the railway tracks in unauthorized places forms a part of many people´s everyday lives and has done so for generations. In this way the workshop provided an interesting opportunity for people to reflect on an issue which is an everyday reality with new information regarding its dangers and consequences.
There were also anecdotal reports from the participants about railway trespassing incidents that had directly affected the school community. For example, in one of the schools (Cataluña) a pupil had been killed some years previously after playing on the railway tracks next to the school. Other cases of family members being involved in trespassing accidents were also recounted along with a number of stories about people crossing the tracks. One of the teachers in Cataluña highlighted a
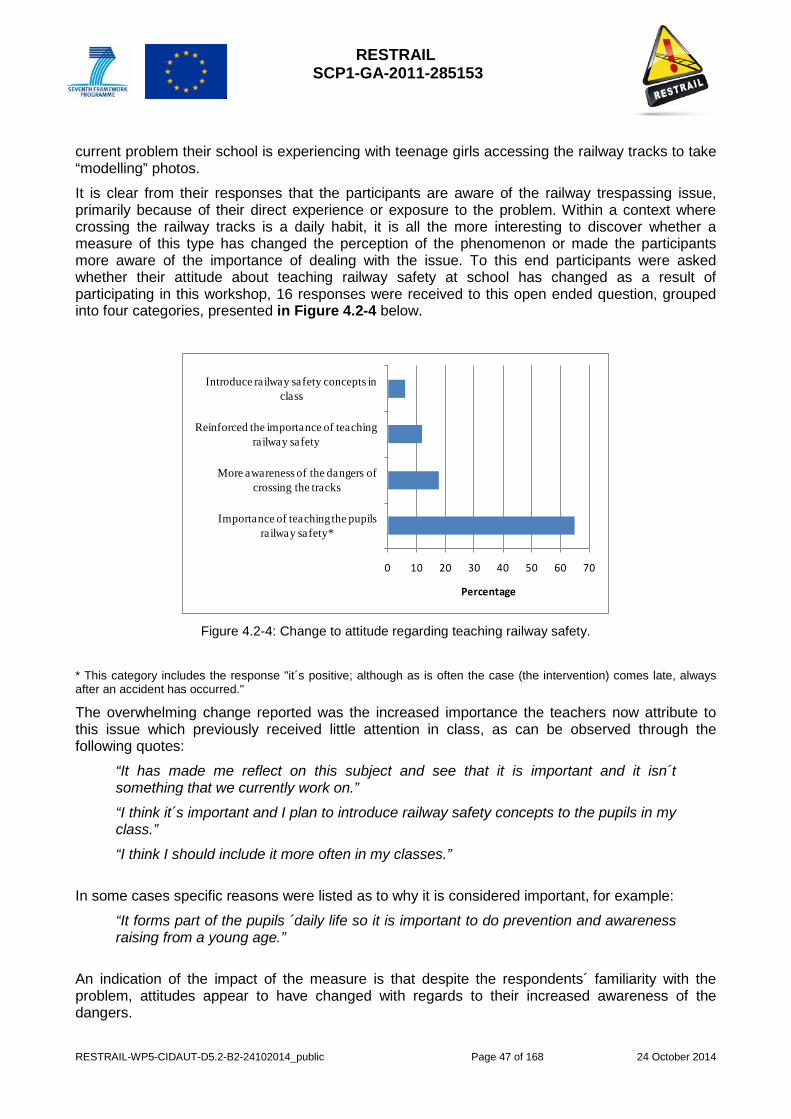
RESTRAIL SCP1-GA-2011-285153
RESTRAIL-WP5-CIDAUT-D5.2-B2-24102014_public Page 47 of 168 24 October 2014
current problem their school is experiencing with teenage girls accessing the railway tracks to take “modelling” photos.
It is clear from their responses that the participants are aware of the railway trespassing issue, primarily because of their direct experience or exposure to the problem. Within a context where crossing the railway tracks is a daily habit, it is all the more interesting to discover whether a measure of this type has changed the perception of the phenomenon or made the participants more aware of the importance of dealing with the issue. To this end participants were asked whether their attitude about teaching railway safety at school has changed as a result of participating in this workshop, 16 responses were received to this open ended question, grouped into four categories, presented in Figure 4.2-4 below.
0 10 20 30 40 50 60 70
Importance of teaching the pupils railway safety*
More awareness of the dangers of crossing the tracks
Reinforced the importance of teaching railway safety
Introduce railway safety concepts in class
Percentage
Figure 4.2-4: Change to attitude regarding teaching railway safety.
* This category includes the response "it´s positive; although as is often the case (the intervention) comes late, always after an accident has occurred."
The overwhelming change reported was the increased importance the teachers now attribute to this issue which previously received little attention in class, as can be observed through the following quotes:
“It has made me reflect on this subject and see that it is important and it isn´t something that we currently work on.” “I think it´s important and I plan to introduce railway safety concepts to the pupils in my class.” “I think I should include it more often in my classes.”
In some cases specific reasons were listed as to why it is considered important, for example:
“It forms part of the pupils ´daily life so it is important to do prevention and awareness raising from a young age.”
An indication of the impact of the measure is that despite the respondents´ familiarity with the problem, attitudes appear to have changed with regards to their increased awareness of the dangers.

RESTRAIL SCP1-GA-2011-285153
RESTRAIL-WP5-CIDAUT-D5.2-B2-24102014_public Page 48 of 168 24 October 2014
In the follow up questionnaire teachers were asked again whether their perception regarding the importance of teaching railway safety at school has changed as a result of taking part in the railway safety programme. Three out of five teachers gave an affirmative answer. Their responses included:
“We were already conscious of the importance of this issue due to the fact that our school is situated right next to a railway station and therefore a railway line, but the workshop has made us think about taking a more systematic approach to rail pedestrian safety at school.” “I thought that the children travelled little in train. All of the information, activities, workshops … that help to protect and keep the pupils safe is very important.” “It is important to see the danger of crossing the railway tracks.”
In the case of the two schools who responded that their perception had not changed, one did recognize that their participation had served to reinforce the importance they place on this issue:
“For us the road pedestrian safety has always been very important. Maybe having carried out this activity has made us maintain this line of preventative work, given its importance.”
Key findings
There is a strong awareness of the need to teach railway safety and the dangers of crossing the tracks amongst the participating education centres and a clear understanding as to why it is important. Specifically there appears to be a link between this awareness and the proximity of the educational centres to railway infrastructure and exposure to the problem, albeit there was not a control group6 to corroborate this theory.
Despite their awareness of the importance of this issue, critically, it appears that participation in the pilot has led to teachers taking responsibility for putting these teachings into practice in their classrooms, with many reporting their commitment to introducing railway safety concepts within their teaching. This is evidence of the impact of the pilot, especially in a context where crossing the rail tracks is a daily habit for many people.
b. Confidence and capacity to teach railway safety at school before and after the pilot In addition to understanding the teachers´ interest and disposition to teach railway safety education in their classrooms, the evaluation sought to assess their level of confidence and ability to do so, by asking them to rate their level of confidence and capacity on the scale of 1-5 (5 = very confident) before and after participating in the workshop7.
In order to assess the impact on the level of confidence and capacity, the difference between the rating before and after has been calculated for each teacher as an indicator of the degree of change. The results of the changes are summarized in Table 4.2-3.
6 A school located in an area with little contact with the railway environment
7 Please note, in Cataluña information on the participants´ level of confidence before the workshop was not provided, as such an analysis of the change in their confidence and capacity to teach railway safety is not included in this analysis. The results relate only to teachers participating in the Alicante workshop.

RESTRAIL SCP1-GA-2011-285153
RESTRAIL-WP5-CIDAUT-D5.2-B2-24102014_public Page 49 of 168 24 October 2014
Table 4.2-3: Change in the level of confidence and capacity
Degree of change (0-5): confidence / capacity level
Number of teachers (%)
0 1 (5.9%) +1 4 (23.5%) +2 8 (47.1%) +3 3 (17.6%) +4 1 (5.9%) +5 0 (0%)
All except one of the participants reported an increase in their level of confidence and capacity to teach railway safety education in their classrooms as a result of participating in the workshop. Just under half of the teachers (47%) experienced an increase of 2 points on the scale of confidence/capacity. Almost a fifth reported an increase of three points and for just under a quarter of the participants their level had gone up 1 point. Just one teacher reported no change (very confident before and after).
Key findings
The participants´ responses to this question clearly evidence the impact of the measure on teachers´ confidence and ability to teach railway safety education.
An increase in the confidence and skills of educators to teach children about railway safety as a result of taking part in the workshop indicates the effectiveness of the measure in terms of its potential to promote safe attitudes and behaviour in the railway environment.
c. Satisfaction with teacher´s workshop and other feedback A further measure of success of the pilot was to get feedback from the teachers regarding their level of satisfaction with the workshop. To this end, participants were asked to score their satisfaction on a scale of 1-5 (1=very unsatisfied, 5= very satisfied).
The results from this aspect of the evaluation demonstrate a high level of satisfaction with the workshop. From a total of 23 workshop participants who responded to this question, 69.6% gave the top satisfaction rating (5) and the remaining 30.4% rated their satisfaction as 4. In this way the total average satisfaction score was 4.7 out of a maximum score of 5.
4.2.3 Reported costs for measure Reported costs for this measure implemented are given in Table 4.2-4.

RESTRAIL SCP1-GA-2011-285153
RESTRAIL-WP5-CIDAUT-D5.2-B2-24102014_public Page 50 of 168 24 October 2014
Table 4.2-4: Costs for the implementation of railway safety education programme
Cost Nature value Estimated Person Month costs allocated to the FFE research team to deliver Work Package 5 of the Restrail project
Researchers Personnel: Preparation of workshop materials (design and development). Workshop organisation and coordination tasks. Delivery of 11 workshops. Meeting attendance. Evaluation design, analysis and reporting. 40 837 €
Travel expenses: Travel to deliver workshops in Cataluña Railway Museum, meeting and workshops in Alicante, meetings and workshop in Madrid. 5 200 €
Indirect costs 24 502 €
Total 70 539 €
Costs of the non-monetary contributions of collaborating organizations (internal and external to the FFE) achieved through the contacts made by the FFE
Museum staff (FFE) Support development of educational workshop materials. Workshop organisation and coordination tasks. Meeting attendance. Participation in teacher and pupil workshop. Room hire. Time & effort (18h/4 members museum staff) 72 hours
Teachers[1] Support organisation of workshops. Participation in teacher and pupil workshop and evaluation exercises. Time & effort (4h/22 teachers) 88 hours
Adif Coordination tasks. Meeting attendance. Participation in workshops. Travel costs. Time & effort (10h/2 members of staff) 20 hours
Alicante Council Coordination tasks. Meeting attendance. Time & effort (3h/3 members of staff) 9 hours
Autonoma University of Madrid Support development of educational materials. Meeting attendance. Time & effort (2.5h/1 member of staff (professor) 2.5 hours
Total 191.5 hours
[1] According to sources from the Spanish Ministry of Education, Culture and Sport (2013) the average salary of a public primary school teacher is 27,325 euros per annum.
4.2.4 Evaluation results: Pupil workshop a. Univariate analysis
As described previously, before starting the workshops an initial evaluation of the children´s knowledge of railway safety and indication of behaviour was conducted. The participants were asked to help Daniela to get from her home to school by choosing from three possible routes (the correct way being Option 2).
From a total of 271 students who participated in the workshops, 269 gave a response to this question (non-response: 0.7%). The results indicate that children know where it is safer to cross train tracks with 97% choosing Option 2 (97%; C.I. 95%: 95-99.1), 1.1% respondents choosing Option 1 (C.I. 95%: -0.1-2.4) and the remaining 1.9% the Option 3 (C.I. 95%: 0.2-3.5) (Table 4.2-5).
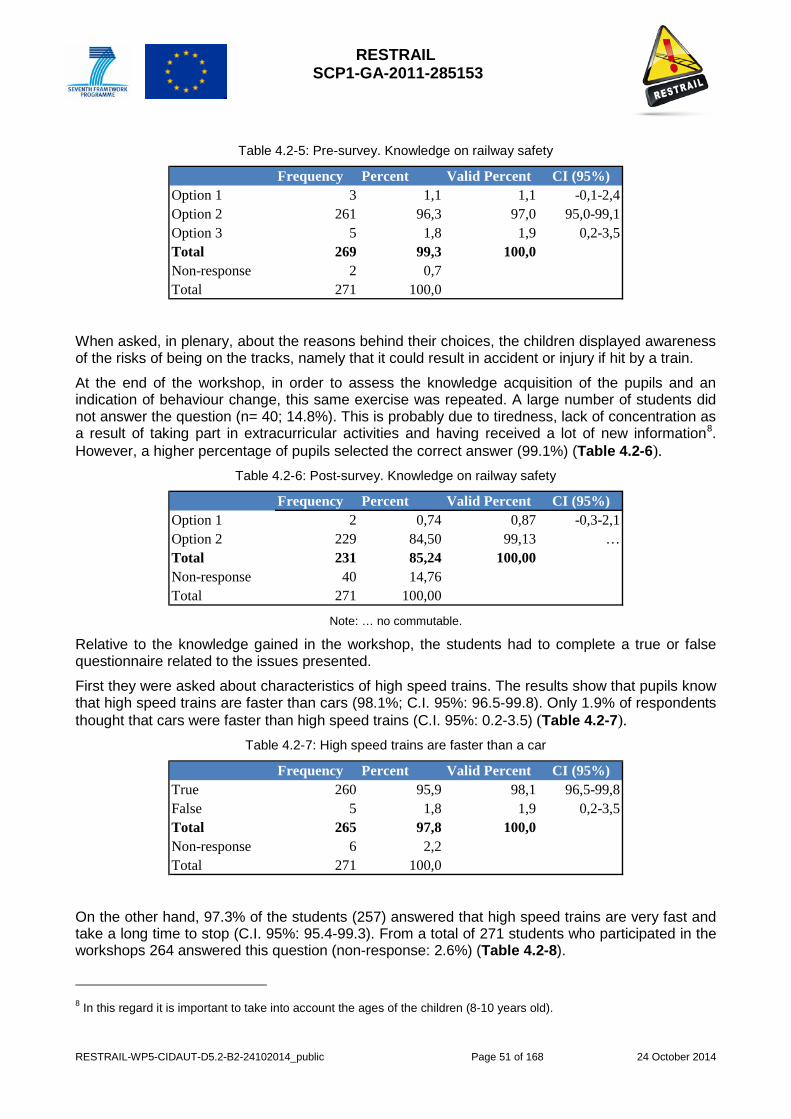
RESTRAIL SCP1-GA-2011-285153
RESTRAIL-WP5-CIDAUT-D5.2-B2-24102014_public Page 51 of 168 24 October 2014
Table 4.2-5: Pre-survey. Knowledge on railway safety
Frequency Percent Valid Percent CI (95%)Option 1 3 1,1 1,1 -0,1-2,4Option 2 261 96,3 97,0 95,0-99,1Option 3 5 1,8 1,9 0,2-3,5Total 269 99,3 100,0Non-response 2 0,7Total 271 100,0
When asked, in plenary, about the reasons behind their choices, the children displayed awareness of the risks of being on the tracks, namely that it could result in accident or injury if hit by a train.
At the end of the workshop, in order to assess the knowledge acquisition of the pupils and an indication of behaviour change, this same exercise was repeated. A large number of students did not answer the question (n= 40; 14.8%). This is probably due to tiredness, lack of concentration as a result of taking part in extracurricular activities and having received a lot of new information8. However, a higher percentage of pupils selected the correct answer (99.1%) (Table 4.2-6).
Table 4.2-6: Post-survey. Knowledge on railway safety
Frequency Percent Valid Percent CI (95%)Option 1 2 0,74 0,87 -0,3-2,1Option 2 229 84,50 99,13 …Total 231 85,24 100,00Non-response 40 14,76Total 271 100,00
Note: … no commutable.
Relative to the knowledge gained in the workshop, the students had to complete a true or false questionnaire related to the issues presented.
First they were asked about characteristics of high speed trains. The results show that pupils know that high speed trains are faster than cars (98.1%; C.I. 95%: 96.5-99.8). Only 1.9% of respondents thought that cars were faster than high speed trains (C.I. 95%: 0.2-3.5) (Table 4.2-7).
Table 4.2-7: High speed trains are faster than a car
Frequency Percent Valid Percent CI (95%)True 260 95,9 98,1 96,5-99,8False 5 1,8 1,9 0,2-3,5Total 265 97,8 100,0Non-response 6 2,2Total 271 100,0
On the other hand, 97.3% of the students (257) answered that high speed trains are very fast and take a long time to stop (C.I. 95%: 95.4-99.3). From a total of 271 students who participated in the workshops 264 answered this question (non-response: 2.6%) (Table 4.2-8).
8 In this regard it is important to take into account the ages of the children (8-10 years old).
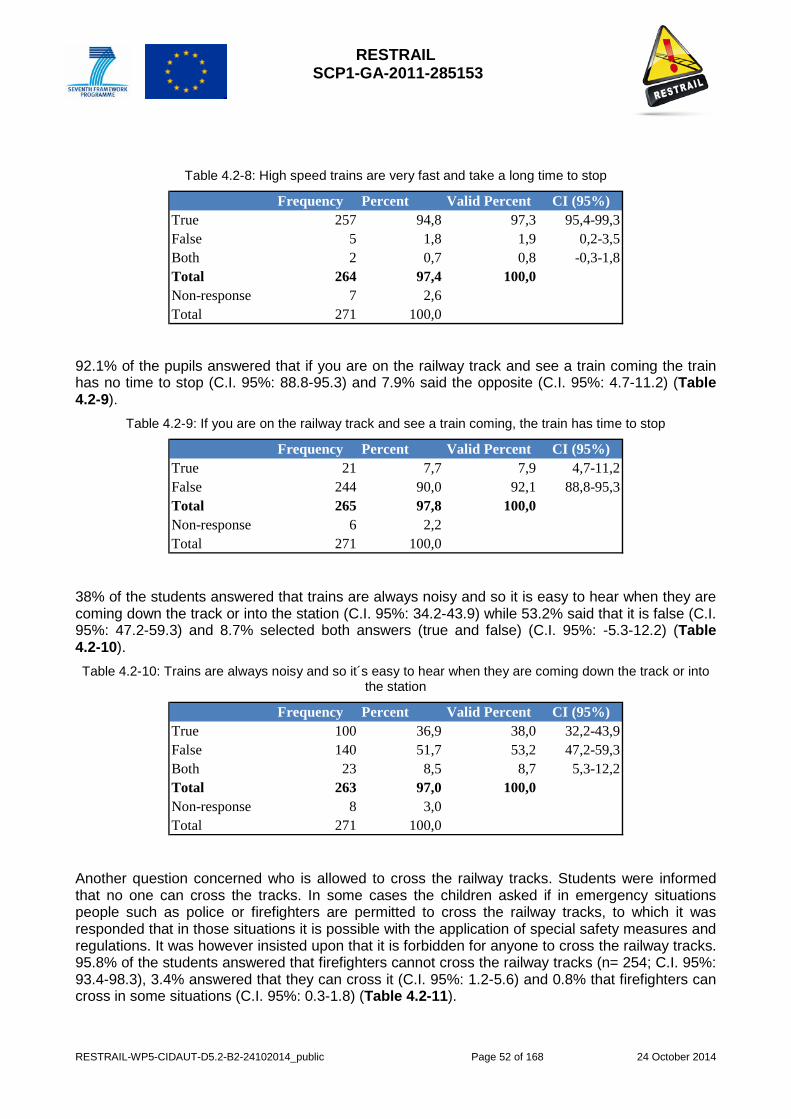
RESTRAIL SCP1-GA-2011-285153
RESTRAIL-WP5-CIDAUT-D5.2-B2-24102014_public Page 52 of 168 24 October 2014
Table 4.2-8: High speed trains are very fast and take a long time to stop
Frequency Percent Valid Percent CI (95%)True 257 94,8 97,3 95,4-99,3False 5 1,8 1,9 0,2-3,5Both 2 0,7 0,8 -0,3-1,8Total 264 97,4 100,0Non-response 7 2,6Total 271 100,0
92.1% of the pupils answered that if you are on the railway track and see a train coming the train has no time to stop (C.I. 95%: 88.8-95.3) and 7.9% said the opposite (C.I. 95%: 4.7-11.2) (Table 4.2-9).
Table 4.2-9: If you are on the railway track and see a train coming, the train has time to stop
Frequency Percent Valid Percent CI (95%)True 21 7,7 7,9 4,7-11,2False 244 90,0 92,1 88,8-95,3Total 265 97,8 100,0Non-response 6 2,2Total 271 100,0
38% of the students answered that trains are always noisy and so it is easy to hear when they are coming down the track or into the station (C.I. 95%: 34.2-43.9) while 53.2% said that it is false (C.I. 95%: 47.2-59.3) and 8.7% selected both answers (true and false) (C.I. 95%: -5.3-12.2) (Table 4.2-10). Table 4.2-10: Trains are always noisy and so it´s easy to hear when they are coming down the track or into
the station
Frequency Percent Valid Percent CI (95%)True 100 36,9 38,0 32,2-43,9False 140 51,7 53,2 47,2-59,3Both 23 8,5 8,7 5,3-12,2Total 263 97,0 100,0Non-response 8 3,0Total 271 100,0
Another question concerned who is allowed to cross the railway tracks. Students were informed that no one can cross the tracks. In some cases the children asked if in emergency situations people such as police or firefighters are permitted to cross the railway tracks, to which it was responded that in those situations it is possible with the application of special safety measures and regulations. It was however insisted upon that it is forbidden for anyone to cross the railway tracks. 95.8% of the students answered that firefighters cannot cross the railway tracks (n= 254; C.I. 95%: 93.4-98.3), 3.4% answered that they can cross it (C.I. 95%: 1.2-5.6) and 0.8% that firefighters can cross in some situations (C.I. 95%: 0.3-1.8) (Table 4.2-11).

RESTRAIL SCP1-GA-2011-285153
RESTRAIL-WP5-CIDAUT-D5.2-B2-24102014_public Page 53 of 168 24 October 2014
Table 4.2-11: Firefighters are allowed to cross the railway tracks
Frequency Percent Valid Percent CI (95%)True 9 3,3 3,4 1,2-5,6False 254 93,7 95,8 93,4-98,3Both 2 0,7 0,8 0,3-1,8Total 265 97,8 100,0Non-response 6 2,2Total 271 100,0
With regards to this issue students were further asked if it is true or false that people are allowed to cross railway tracks. 94% answered that is false (C.I. 95%: 91.1-96.8) and 6% that is true (3.2-8.9) (Table 4.2-12). The emphasis on this issue derives from the importance of this concept within the workshop.
Table 4.2-12: People are allowed to cross railway tracks
Frequency Percent Valid Percent CI (95%)True 16 5,9 6,0 3,2-8,9False 249 91,9 94,0 91,1-96,8Total 265 97,8 100,0Non-response 6 2,2Total 271 100,0
In the workshops children were also informed about how they must behave in railway stations. Regarding the question: you are not allowed to cross the yellow line near the platform edge, 85.7% of the pupils answered that it is not allowed (n= 227; C.I. 95%: 85.7-89.9) (Table 4.2-13).
Table 4.2-13: You are not allowed to cross the yellow line on the platform
Frequency Percent Valid Percent CI (95%)True 227 83,8 85,7 81,4-89,9False 37 13,7 14,0 9,8-18,1Both 1 0,4 0,4 -0,4-1,1Total 265 97,8 100,0Non-response 6 2,2Total 271 100,0
84.2% of the students answered that you should not listen to music with headphones/earphones in railway stations (C.I. 95%: 79.8-88.5), 15.1% said that you can (C.I. 95%: 10.8-19.4) and the 0.8% they selected both answers (true and false) (C.I. 95%: -0.3-1.8) (Table 4.2-14).
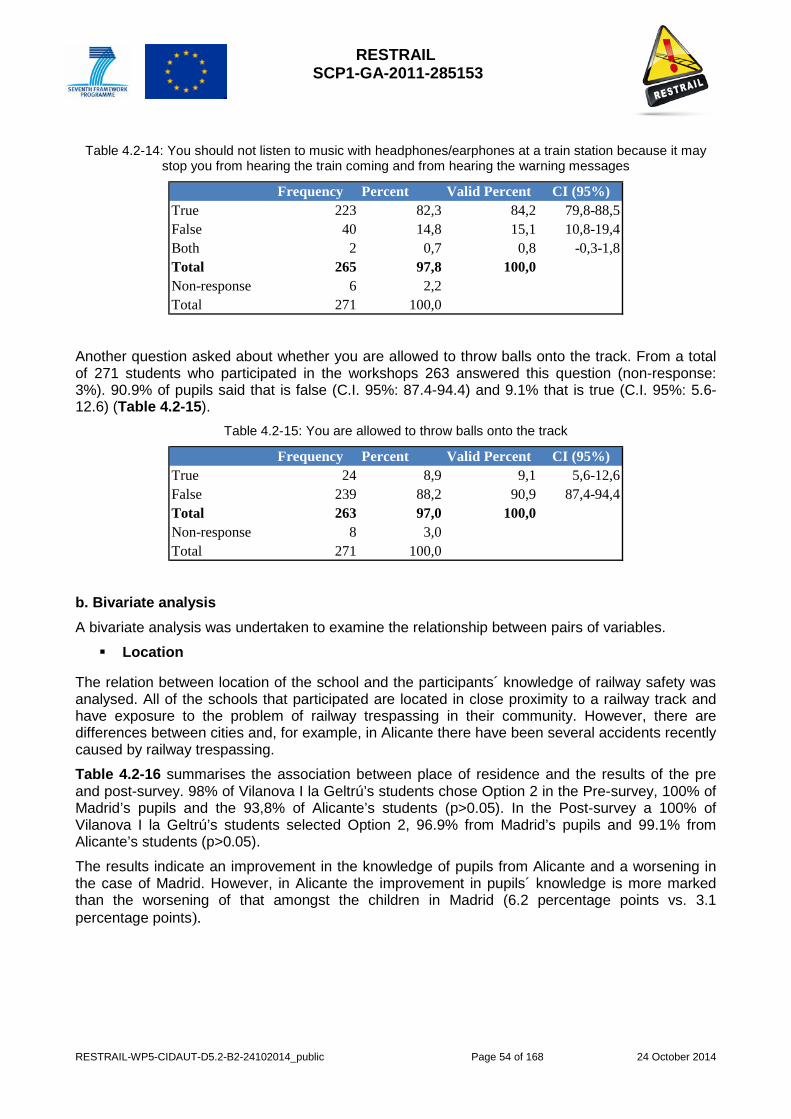
RESTRAIL SCP1-GA-2011-285153
RESTRAIL-WP5-CIDAUT-D5.2-B2-24102014_public Page 54 of 168 24 October 2014
Table 4.2-14: You should not listen to music with headphones/earphones at a train station because it may stop you from hearing the train coming and from hearing the warning messages
Frequency Percent Valid Percent CI (95%)True 223 82,3 84,2 79,8-88,5False 40 14,8 15,1 10,8-19,4Both 2 0,7 0,8 -0,3-1,8Total 265 97,8 100,0Non-response 6 2,2Total 271 100,0
Another question asked about whether you are allowed to throw balls onto the track. From a total of 271 students who participated in the workshops 263 answered this question (non-response: 3%). 90.9% of pupils said that is false (C.I. 95%: 87.4-94.4) and 9.1% that is true (C.I. 95%: 5.6-12.6) (Table 4.2-15).
Table 4.2-15: You are allowed to throw balls onto the track
Frequency Percent Valid Percent CI (95%)True 24 8,9 9,1 5,6-12,6False 239 88,2 90,9 87,4-94,4Total 263 97,0 100,0Non-response 8 3,0Total 271 100,0
b. Bivariate analysis A bivariate analysis was undertaken to examine the relationship between pairs of variables.
Location
The relation between location of the school and the participants´ knowledge of railway safety was analysed. All of the schools that participated are located in close proximity to a railway track and have exposure to the problem of railway trespassing in their community. However, there are differences between cities and, for example, in Alicante there have been several accidents recently caused by railway trespassing.
Table 4.2-16 summarises the association between place of residence and the results of the pre and post-survey. 98% of Vilanova I la Geltrú’s students chose Option 2 in the Pre-survey, 100% of Madrid’s pupils and the 93,8% of Alicante’s students (p>0.05). In the Post-survey a 100% of Vilanova I la Geltrú’s students selected Option 2, 96.9% from Madrid’s pupils and 99.1% from Alicante’s students (p>0.05).
The results indicate an improvement in the knowledge of pupils from Alicante and a worsening in the case of Madrid. However, in Alicante the improvement in pupils´ knowledge is more marked than the worsening of that amongst the children in Madrid (6.2 percentage points vs. 3.1 percentage points).
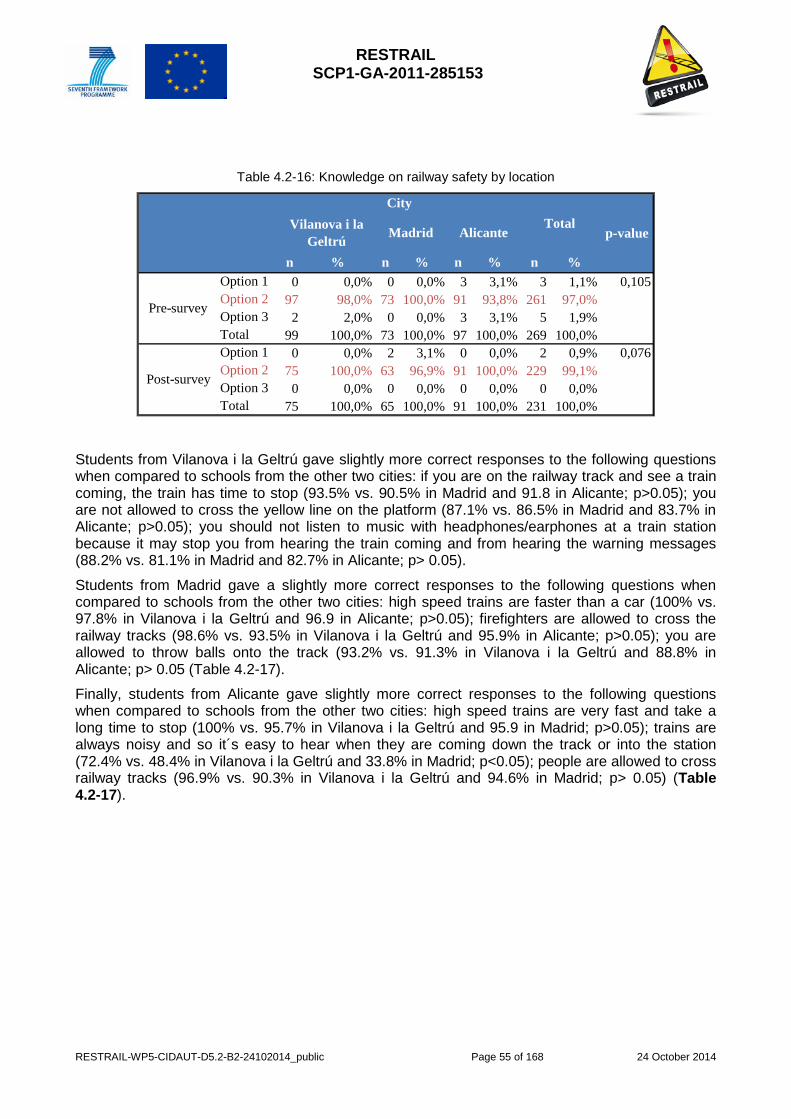
RESTRAIL SCP1-GA-2011-285153
RESTRAIL-WP5-CIDAUT-D5.2-B2-24102014_public Page 55 of 168 24 October 2014
Table 4.2-16: Knowledge on railway safety by location
n % n % n % n %Option 1 0 0,0% 0 0,0% 3 3,1% 3 1,1% 0,105Option 2 97 98,0% 73 100,0% 91 93,8% 261 97,0%Option 3 2 2,0% 0 0,0% 3 3,1% 5 1,9%Total 99 100,0% 73 100,0% 97 100,0% 269 100,0%Option 1 0 0,0% 2 3,1% 0 0,0% 2 0,9% 0,076Option 2 75 100,0% 63 96,9% 91 100,0% 229 99,1%Option 3 0 0,0% 0 0,0% 0 0,0% 0 0,0%Total 75 100,0% 65 100,0% 91 100,0% 231 100,0%
p-value
Pre-survey
Post-survey
TotalVilanova i la Geltrú Madrid Alicante
City
Students from Vilanova i la Geltrú gave slightly more correct responses to the following questions when compared to schools from the other two cities: if you are on the railway track and see a train coming, the train has time to stop (93.5% vs. 90.5% in Madrid and 91.8 in Alicante; p>0.05); you are not allowed to cross the yellow line on the platform (87.1% vs. 86.5% in Madrid and 83.7% in Alicante; p>0.05); you should not listen to music with headphones/earphones at a train station because it may stop you from hearing the train coming and from hearing the warning messages (88.2% vs. 81.1% in Madrid and 82.7% in Alicante; p> 0.05).
Students from Madrid gave a slightly more correct responses to the following questions when compared to schools from the other two cities: high speed trains are faster than a car (100% vs. 97.8% in Vilanova i la Geltrú and 96.9 in Alicante; p>0.05); firefighters are allowed to cross the railway tracks (98.6% vs. 93.5% in Vilanova i la Geltrú and 95.9% in Alicante; p>0.05); you are allowed to throw balls onto the track (93.2% vs. 91.3% in Vilanova i la Geltrú and 88.8% in Alicante; p> 0.05 (Table 4.2-17).
Finally, students from Alicante gave slightly more correct responses to the following questions when compared to schools from the other two cities: high speed trains are very fast and take a long time to stop (100% vs. 95.7% in Vilanova i la Geltrú and 95.9 in Madrid; p>0.05); trains are always noisy and so it´s easy to hear when they are coming down the track or into the station (72.4% vs. 48.4% in Vilanova i la Geltrú and 33.8% in Madrid; p<0.05); people are allowed to cross railway tracks (96.9% vs. 90.3% in Vilanova i la Geltrú and 94.6% in Madrid; p> 0.05) (Table 4.2-17).

RESTRAIL SCP1-GA-2011-285153
RESTRAIL-WP5-CIDAUT-D5.2-B2-24102014_public Page 56 of 168 24 October 2014
Table 4.2-17: Knowledge gained in the workshop by city
n % n % n % n %True 91 97,8% 74 100,0% 95 96,9% 260 98,1% 0,335False 2 2,2% 0 0,0% 3 3,1% 5 1,9%Total 93 100,0% 74 100,0% 98 100,0% 265 100,0%True 89 95,7% 71 95,9% 97 100,0% 257 97,3% 0,370False 3 3,2% 2 2,7% 0 0,0% 5 1,9%Both 1 1,1% 1 1,4% 0 0,0% 2 0,8%Total 93 100,0% 74 100,0% 97 100,0% 264 100,0%True 6 6,5% 7 9,5% 8 8,2% 21 7,9% 0,770False 87 93,5% 67 90,5% 90 91,8% 244 92,1%Total 93 100,0% 74 100,0% 98 100,0% 265 100,0%True 38 41,8% 37 50,0% 25 25,5% 100 38,0% 0,000False 44 48,4% 25 33,8% 71 72,4% 140 53,2%Both 9 9,9% 12 16,2% 2 2,0% 23 8,7%Total 91 100,0% 74 100,0% 98 100,0% 263 100,0%True 5 5,4% 0 0,0% 4 4,1% 9 3,4% 0,282False 87 93,5% 73 98,6% 94 95,9% 254 95,8%Both 1 1,1% 1 1,4% 0 0,0% 2 0,8%Total 93 100,0% 74 100,0% 98 100,0% 265 100,0%True 9 9,7% 4 5,4% 3 3,1% 16 6,0% 0,153False 84 90,3% 70 94,6% 95 96,9% 249 94,0%Total 93 100,0% 74 100,0% 98 100,0% 265 100,0%True 81 87,1% 64 86,5% 82 83,7% 227 85,7% 0,738False 12 12,9% 10 13,5% 15 15,3% 37 14,0%Both 0 0,0% 0 0,0% 1 1,0% 1 0,4%Total 93 100,0% 74 100,0% 98 100,0% 265 100,0%True 82 88,2% 60 81,1% 81 82,7% 223 84,2% 0,280False 11 11,8% 14 18,9% 15 15,3% 40 15,1%Both 0 0,0% 0 0,0% 2 2,0% 2 0,8%Total 93 100,0% 74 100,0% 98 100,0% 265 100,0%True 8 8,7% 5 6,8% 11 11,2% 24 9,1% 0,607False 84 91,3% 68 93,2% 87 88,8% 239 90,9%Total 92 100,0% 73 100,0% 98 100,0% 263 100,0%
You are allowed to throw balls onto the track
Trains are always noisy and so it´s easy to hear when they are coming down the track or into the station
CityTotal
p-valueVilanova i la Geltrú Madrid Alicante
High speed trains are faster than a car
Firefighters are allowed to cross the railway tracks
High speed trains are very fast and take a long time to stop
People are allowed to cross railway tracks
You are not allowed to cross the yellow line on the platform
You should not listen to music with headphones/earphones at a train station because it may stop you from hearing the train coming and from hearing the warning messages
If you are on the railway track and see a train coming, the train has time to stop
School
The evaluation also sought to identify whether there is an association between the school and knowledge on railway safety. All of the schools that participated are located in close proximity to a railway track. However, there are differences in the distance to the train tracks. For example, Gabriel Miró Public Primary school is located within approximately 5 metres of the railway track (closest of all schools) whilst Jorge Guillén Public Primary school in Madrid is located some 600 metres (furthest away of all schools).
Table 4.2-18 summarises the linkage between school and the results of the pre-survey and post-survey. This shows that the lower percentages of success in the pre-survey are found in San Francisco de Asís Public Primary school and Gabriel Miró school (91.7% and 92.3%; p>0.05)9. In the post-survey 100% of the pupils matched the correct answer in all schools except Jorge Guillén Public Primary school in Madrid (96.9%; p>0.05).
9 San Francisco de Asis Public Primary School, is located within approximately 200 metres of the railway track. Gabriel
Miró Public Primary school is located within approximately 5 metres of the railway track.
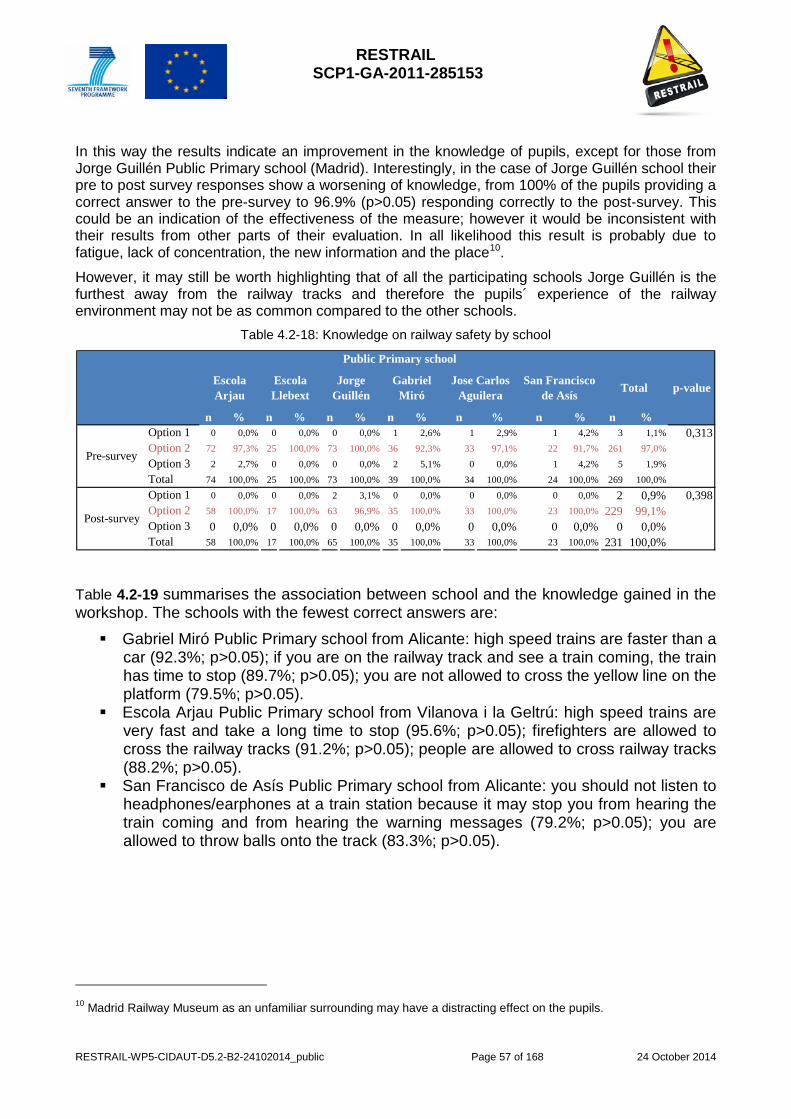
RESTRAIL SCP1-GA-2011-285153
RESTRAIL-WP5-CIDAUT-D5.2-B2-24102014_public Page 57 of 168 24 October 2014
In this way the results indicate an improvement in the knowledge of pupils, except for those from Jorge Guillén Public Primary school (Madrid). Interestingly, in the case of Jorge Guillén school their pre to post survey responses show a worsening of knowledge, from 100% of the pupils providing a correct answer to the pre-survey to 96.9% (p>0.05) responding correctly to the post-survey. This could be an indication of the effectiveness of the measure; however it would be inconsistent with their results from other parts of their evaluation. In all likelihood this result is probably due to fatigue, lack of concentration, the new information and the place10.
However, it may still be worth highlighting that of all the participating schools Jorge Guillén is the furthest away from the railway tracks and therefore the pupils´ experience of the railway environment may not be as common compared to the other schools.
Table 4.2-18: Knowledge on railway safety by school
n % n % n % n % n % n % n %Option 1 0 0,0% 0 0,0% 0 0,0% 1 2,6% 1 2,9% 1 4,2% 3 1,1% 0,313Option 2 72 97,3% 25 100,0% 73 100,0% 36 92,3% 33 97,1% 22 91,7% 261 97,0%Option 3 2 2,7% 0 0,0% 0 0,0% 2 5,1% 0 0,0% 1 4,2% 5 1,9%Total 74 100,0% 25 100,0% 73 100,0% 39 100,0% 34 100,0% 24 100,0% 269 100,0%Option 1 0 0,0% 0 0,0% 2 3,1% 0 0,0% 0 0,0% 0 0,0% 2 0,9% 0,398Option 2 58 100,0% 17 100,0% 63 96,9% 35 100,0% 33 100,0% 23 100,0% 229 99,1%Option 3 0 0,0% 0 0,0% 0 0,0% 0 0,0% 0 0,0% 0 0,0% 0 0,0%Total 58 100,0% 17 100,0% 65 100,0% 35 100,0% 33 100,0% 23 100,0% 231 100,0%
Public Primary school
p-valueEscola Arjau
Escola Llebext
Gabriel Miró Total
Pre-survey
Post-survey
Jorge Guillén
Jose Carlos Aguilera
San Francisco de Asís
Table 4.2-19 summarises the association between school and the knowledge gained in the workshop. The schools with the fewest correct answers are: Gabriel Miró Public Primary school from Alicante: high speed trains are faster than a
car (92.3%; p>0.05); if you are on the railway track and see a train coming, the train has time to stop (89.7%; p>0.05); you are not allowed to cross the yellow line on the platform (79.5%; p>0.05).
Escola Arjau Public Primary school from Vilanova i la Geltrú: high speed trains are very fast and take a long time to stop (95.6%; p>0.05); firefighters are allowed to cross the railway tracks (91.2%; p>0.05); people are allowed to cross railway tracks (88.2%; p>0.05).
San Francisco de Asís Public Primary school from Alicante: you should not listen to headphones/earphones at a train station because it may stop you from hearing the train coming and from hearing the warning messages (79.2%; p>0.05); you are allowed to throw balls onto the track (83.3%; p>0.05).
10 Madrid Railway Museum as an unfamiliar surrounding may have a distracting effect on the pupils.
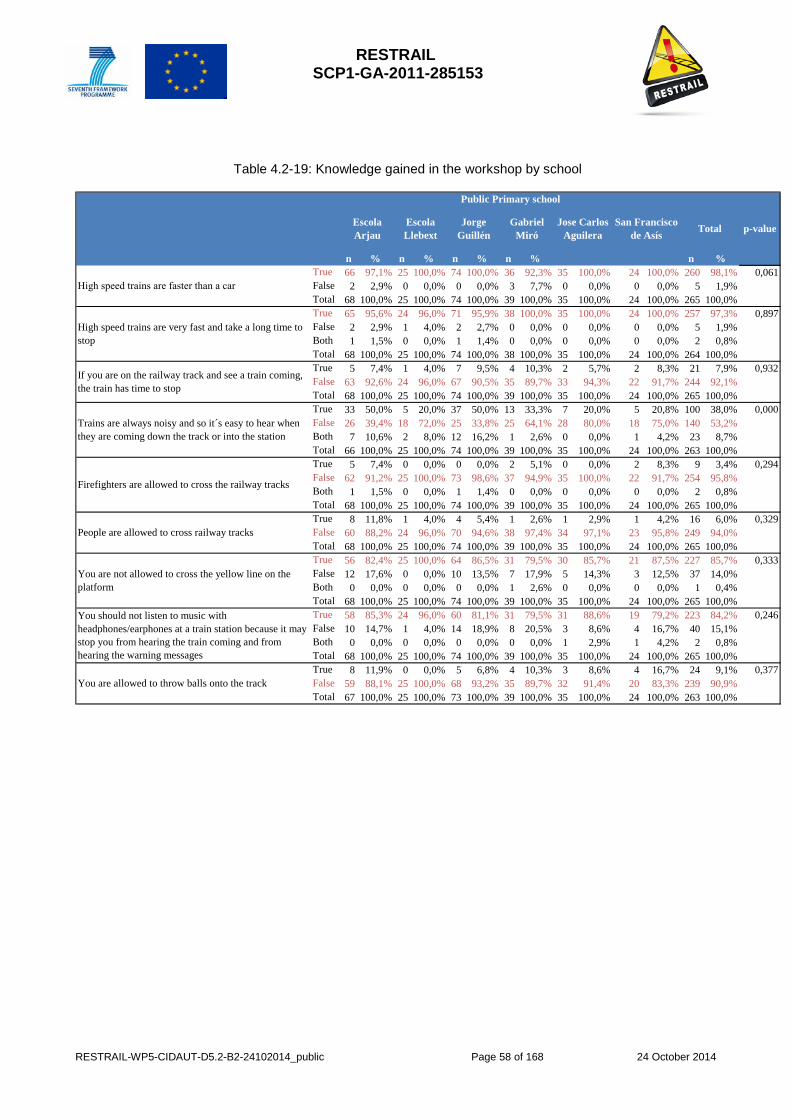
RESTRAIL SCP1-GA-2011-285153
RESTRAIL-WP5-CIDAUT-D5.2-B2-24102014_public Page 58 of 168 24 October 2014
Table 4.2-19: Knowledge gained in the workshop by school
n % n % n % n % n %True 66 97,1% 25 100,0% 74 100,0% 36 92,3% 35 100,0% 24 100,0% 260 98,1% 0,061False 2 2,9% 0 0,0% 0 0,0% 3 7,7% 0 0,0% 0 0,0% 5 1,9%Total 68 100,0% 25 100,0% 74 100,0% 39 100,0% 35 100,0% 24 100,0% 265 100,0%True 65 95,6% 24 96,0% 71 95,9% 38 100,0% 35 100,0% 24 100,0% 257 97,3% 0,897False 2 2,9% 1 4,0% 2 2,7% 0 0,0% 0 0,0% 0 0,0% 5 1,9%Both 1 1,5% 0 0,0% 1 1,4% 0 0,0% 0 0,0% 0 0,0% 2 0,8%Total 68 100,0% 25 100,0% 74 100,0% 38 100,0% 35 100,0% 24 100,0% 264 100,0%True 5 7,4% 1 4,0% 7 9,5% 4 10,3% 2 5,7% 2 8,3% 21 7,9% 0,932False 63 92,6% 24 96,0% 67 90,5% 35 89,7% 33 94,3% 22 91,7% 244 92,1%Total 68 100,0% 25 100,0% 74 100,0% 39 100,0% 35 100,0% 24 100,0% 265 100,0%True 33 50,0% 5 20,0% 37 50,0% 13 33,3% 7 20,0% 5 20,8% 100 38,0% 0,000False 26 39,4% 18 72,0% 25 33,8% 25 64,1% 28 80,0% 18 75,0% 140 53,2%Both 7 10,6% 2 8,0% 12 16,2% 1 2,6% 0 0,0% 1 4,2% 23 8,7%Total 66 100,0% 25 100,0% 74 100,0% 39 100,0% 35 100,0% 24 100,0% 263 100,0%True 5 7,4% 0 0,0% 0 0,0% 2 5,1% 0 0,0% 2 8,3% 9 3,4% 0,294False 62 91,2% 25 100,0% 73 98,6% 37 94,9% 35 100,0% 22 91,7% 254 95,8%Both 1 1,5% 0 0,0% 1 1,4% 0 0,0% 0 0,0% 0 0,0% 2 0,8%Total 68 100,0% 25 100,0% 74 100,0% 39 100,0% 35 100,0% 24 100,0% 265 100,0%True 8 11,8% 1 4,0% 4 5,4% 1 2,6% 1 2,9% 1 4,2% 16 6,0% 0,329False 60 88,2% 24 96,0% 70 94,6% 38 97,4% 34 97,1% 23 95,8% 249 94,0%Total 68 100,0% 25 100,0% 74 100,0% 39 100,0% 35 100,0% 24 100,0% 265 100,0%True 56 82,4% 25 100,0% 64 86,5% 31 79,5% 30 85,7% 21 87,5% 227 85,7% 0,333False 12 17,6% 0 0,0% 10 13,5% 7 17,9% 5 14,3% 3 12,5% 37 14,0%Both 0 0,0% 0 0,0% 0 0,0% 1 2,6% 0 0,0% 0 0,0% 1 0,4%Total 68 100,0% 25 100,0% 74 100,0% 39 100,0% 35 100,0% 24 100,0% 265 100,0%True 58 85,3% 24 96,0% 60 81,1% 31 79,5% 31 88,6% 19 79,2% 223 84,2% 0,246False 10 14,7% 1 4,0% 14 18,9% 8 20,5% 3 8,6% 4 16,7% 40 15,1%Both 0 0,0% 0 0,0% 0 0,0% 0 0,0% 1 2,9% 1 4,2% 2 0,8%Total 68 100,0% 25 100,0% 74 100,0% 39 100,0% 35 100,0% 24 100,0% 265 100,0%True 8 11,9% 0 0,0% 5 6,8% 4 10,3% 3 8,6% 4 16,7% 24 9,1% 0,377False 59 88,1% 25 100,0% 68 93,2% 35 89,7% 32 91,4% 20 83,3% 239 90,9%Total 67 100,0% 25 100,0% 73 100,0% 39 100,0% 35 100,0% 24 100,0% 263 100,0%
You are not allowed to cross the yellow line on the platform
You should not listen to music with headphones/earphones at a train station because it may stop you from hearing the train coming and from hearing the warning messages
You are allowed to throw balls onto the track
p-value
High speed trains are faster than a car
High speed trains are very fast and take a long time to stop
If you are on the railway track and see a train coming, the train has time to stop
Trains are always noisy and so it´s easy to hear when they are coming down the track or into the station
Firefighters are allowed to cross the railway tracks
People are allowed to cross railway tracks
Public Primary school
Escola Arjau
Escola Llebext
Jorge Guillén
Gabriel Miró
Jose Carlos Aguilera
San Francisco de Asís Total

RESTRAIL SCP1-GA-2011-285153
RESTRAIL-WP5-CIDAUT-D5.2-B2-24102014_public Page 59 of 168 24 October 2014
Whilst all schools demonstrate a good level of knowledge regarding where it is safe to cross the tracks, the results suggest that the schools that are closer to the railway tracks, such as Gabriel Miro from Alicante and Escola Arjau from Vilanova i la Geltrú, have relatively less knowledge about railway safety. In the communities where these schools are located, the railway track and railway station are part of everyday life. In this way one possible explanation is that the pupils’ knowledge depends on the socially accepted behaviour of the family, friends and neighbours around them and therefore their knowledge may be confused by the risky behaviour they observe in these adults. Overall however, the good level of knowledge demonstrated by students´ responses to the evaluation activities indicates the effectiveness of the measure in terms of knowledge about railway safety following participation in the workshop. Grade
In order to analyse the influence of the age (Grade) on railway safety knowledge a statistical analysis linking these variables has been performed.
Students from Grade 3 and 4 (8-10 years old) took part in the workshop. As previously mentioned, in Jose Carlos Aguilera Primary Public school pupils from Grade 3 and 4 participated in the workshop together. The survey was completed anonymously so it is not possible to determine the age or grade of the students, for this reason, there is a category for “Grade 3 & 4” (n=34).
The results indicate that Grade 4 students have more knowledge about where you have to cross the railway tracks. In addition, the post-survey demonstrated an improvement in their knowledge following participation in the workshop. Table 4.2-20 summarizes the association between grade and the results of the pre-survey and post-survey. 96% (n= 121) of Grade 3 pupils selected the right answer (Option 2) in the pre-survey and 98.2% (n= 107) of pupils from Grade 4 (p>0.05). In the post-survey 98.2% of the pupils from Grade 3 chose the correct answer and 100% of the pupils from Grade 4 (p>0.05).
Table 4.2-20: Knowledge on railway safety by Grade
n % n % n % n %Option 1 2 1,6% 0 0,0% 1 2,9% 3 1,1% 0,504Option 2 121 96,0% 107 98,2% 33 97,1% 261 97,0%Option 3 3 2,4% 2 1,8% 0 0,0% 5 1,9%Total 126 100,0% 109 100,0% 34 100,0% 269 100,0%Option 1 2 1,8% 0 0,0% 0 0,0% 2 0,9% 0,349Option 2 111 98,2% 85 100,0% 33 100,0% 229 99,1%Option 3 0 0,0% 0 0,0% 0 0,0% 0 0,0%Total 113 100,0% 85 100,0% 33 100,0% 231 100,0%
Pre-survey
Post-survey
Gradep-valueGrade 3 Grade 4 Grade 3 & 4 Total
In addition, Table 4.2-21 presents the association between Grade and the knowledge gained in the workshop.
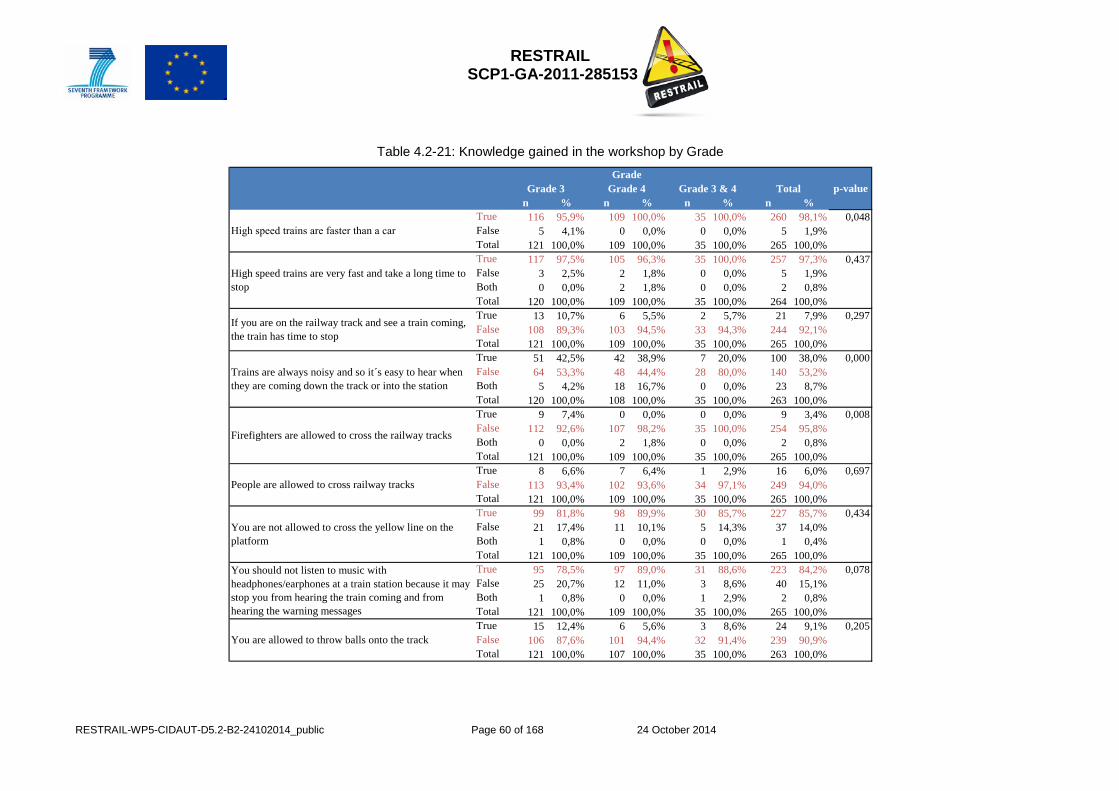
RESTRAIL SCP1-GA-2011-285153
RESTRAIL-WP5-CIDAUT-D5.2-B2-24102014_public Page 60 of 168 24 October 2014
Table 4.2-21: Knowledge gained in the workshop by Grade
n % n % n % n %True 116 95,9% 109 100,0% 35 100,0% 260 98,1% 0,048False 5 4,1% 0 0,0% 0 0,0% 5 1,9%Total 121 100,0% 109 100,0% 35 100,0% 265 100,0%True 117 97,5% 105 96,3% 35 100,0% 257 97,3% 0,437False 3 2,5% 2 1,8% 0 0,0% 5 1,9%Both 0 0,0% 2 1,8% 0 0,0% 2 0,8%Total 120 100,0% 109 100,0% 35 100,0% 264 100,0%True 13 10,7% 6 5,5% 2 5,7% 21 7,9% 0,297False 108 89,3% 103 94,5% 33 94,3% 244 92,1%Total 121 100,0% 109 100,0% 35 100,0% 265 100,0%True 51 42,5% 42 38,9% 7 20,0% 100 38,0% 0,000False 64 53,3% 48 44,4% 28 80,0% 140 53,2%Both 5 4,2% 18 16,7% 0 0,0% 23 8,7%Total 120 100,0% 108 100,0% 35 100,0% 263 100,0%True 9 7,4% 0 0,0% 0 0,0% 9 3,4% 0,008False 112 92,6% 107 98,2% 35 100,0% 254 95,8%Both 0 0,0% 2 1,8% 0 0,0% 2 0,8%Total 121 100,0% 109 100,0% 35 100,0% 265 100,0%True 8 6,6% 7 6,4% 1 2,9% 16 6,0% 0,697False 113 93,4% 102 93,6% 34 97,1% 249 94,0%Total 121 100,0% 109 100,0% 35 100,0% 265 100,0%True 99 81,8% 98 89,9% 30 85,7% 227 85,7% 0,434False 21 17,4% 11 10,1% 5 14,3% 37 14,0%Both 1 0,8% 0 0,0% 0 0,0% 1 0,4%Total 121 100,0% 109 100,0% 35 100,0% 265 100,0%True 95 78,5% 97 89,0% 31 88,6% 223 84,2% 0,078False 25 20,7% 12 11,0% 3 8,6% 40 15,1%Both 1 0,8% 0 0,0% 1 2,9% 2 0,8%Total 121 100,0% 109 100,0% 35 100,0% 265 100,0%True 15 12,4% 6 5,6% 3 8,6% 24 9,1% 0,205False 106 87,6% 101 94,4% 32 91,4% 239 90,9%Total 121 100,0% 107 100,0% 35 100,0% 263 100,0%
Gradep-valueGrade 3 Grade 4 Grade 3 & 4
People are allowed to cross railway tracks
You are not allowed to cross the yellow line on the platform
You should not listen to music with headphones/earphones at a train station because it may stop you from hearing the train coming and from hearing the warning messages
You are allowed to throw balls onto the track
Total
High speed trains are faster than a car
High speed trains are very fast and take a long time to stop
If you are on the railway track and see a train coming, the train has time to stop
Trains are always noisy and so it´s easy to hear when they are coming down the track or into the station
Firefighters are allowed to cross the railway tracks
RESTRAIL SCP1-GA-2011-285153
RESTRAIL-WP5-CIDAUT-D5.2-B2-24102014_public Page 61 of 168 24 October 2014
The results show that the students from Grade 4 have more knowledge about railway safety in the workshops: high speed trains are faster than a car (100%; p<0.05); if you are on the railway track and see a train coming, the train has time to stop (94.5%; p>0.05); firefighters are allowed to cross the railway tracks (98.2%; p<0.05); people are allowed to cross railway tracks (93.6%; p>0.05); you are not allowed to cross the yellow line on the platform (89.9%; p>0.05); you should not listen to music with headphones/earphones at a train station because it may stop you from hearing the train coming and from hearing the warning messages (89%; p>0.05); you are allowed to throw balls onto the track (94.4%; p>0.05).
On the other hand, Grade 3 students selected more right answers regarding the following: high speed trains are very fast and take a long time to stop (97.5%; p>0.05); trains are always noisy and so it´s easy to hear when they are coming down the track or into the station (53.3%; p<0.05). These results are logical (older children know more). However, the values for both courses are similar. This indicates that the selection of this age group was appropriate in terms of the participants acquiring new knowledge. This was confirmed anecdotally by some of the teachers who spoke about how this age group absorbs knowledge easily, albeit teachers also expressed a demand to work with older children, particularly teenagers who are seen to be at higher risk of crossing the tracks.
c. Anecdotal evidence from pupils All of the workshops were characterized by the active participation of the pupils, in which comments, reflections and experiences regarding the issues under discussion were frequently volunteered. These comments provide some anecdotal information regarding the students´ attitudes and behavior in relation to railway safety and reflect the reality of railway trespassing in the community where these pupils live and go to school.
This feedback demonstrated that a number of pupils have personally crossed the railway tracks in unauthorized places and/or know people that have done so. For example, in one of the schools a boy talked about having sat on the railway tracks with friends whilst watching a firework display. He said it was safe due to it being night time (therefore not so many trains passing). Other displays of risky attitudes included a comment defending crossing the tracks by saying “you can be lucky”. Indeed in many cases the pupils need to cross the tracks everyday to get from their home to school. In some cases this involves crossing the tracks in unauthorized places. There were also examples of pupils talking about railway trespassing accidents that had affected people they know.
A further source of evidence regarding the pupils´ baseline knowledge and awareness of the risks of railway trespassing was gauged when voting for the correct answer in the quiz. Pupils´ responses were noted down by the researchers, although due to the pace of the activity it was not possible to record these results systematically and as such cannot form part of a rigorous analysis. However, anecdotally it is possible to report some patterns that emerged regarding pupils pre-knowledge of the risks of crossing the tracks.
In general pupils appeared to have awareness of the speed of high-speed trains relative to other things, such as a car or a cheetah. There was a lesser degree of certainty regarding pupils´ awareness of the weight of trains when compared to a herd of 40 elephants or a blue whale. There was far less awareness regarding the stopping distance required by trains in all of the workshops, with few pupils voting for the correct answer (10 football fields), rather underestimating the distance required for the train to brake.

RESTRAIL SCP1-GA-2011-285153
RESTRAIL-WP5-CIDAUT-D5.2-B2-24102014_public Page 62 of 168 24 October 2014
Following the presentation of the information, it became clear that the pupils were gaining an understanding of the risks of railway trespassing. They were able to apply the information by explaining why it is dangerous to be on or near the tracks and act unsafely in the station. For example, during the discussion about behaving safely in the station one pupil commented “if you went to pick up the teddy bear from the tracks a train could suddenly appear”. This comment demonstrates an understanding of the risks by understanding that the speed, weight, stopping distance and silence of some trains can result in a train suddenly appearing, leaving no time for the person to move off the tracks and avoid an accident.
A question was included in the post teacher/school evaluation regarding any feedback or comments made by the pupils in class following their participation in the workshop. Three out of five teachers reported that pupils had made reflections following the workshop. These included:
One teacher noted that the pupils had reflected on following points covered in the workshop: − Breaking distance − Speed of trains compared to animals − The volume of trains
The students talked about their experiences and anecdotes… journeys they
have made in trains or when they have waited for family members or friends in the station. They did not talk about crossing the railway tracks, perhaps because of their young age.
They think the tracks should be put underground.
d. Key findings
The results of the evaluation exercises, together with evidence collected through the researchers´ observations, demonstrate the pupils’ comprehension of the information presented and the awareness generated about the risks of crossing the tracks and acting unsafely in stations.
This evidence indicates that the students have acquired knowledge regarding risk factors related to the speed; weight and stopping distance of trains and was able to explain the potential repercussions of these factors for someone on or near the tracks.
Most pupils also understood the illegality of crossing the tracks, although there was slightly less awareness concerning the application of safety rules within stations, specifically crossing the yellow line on the platform edge and risks of listening to music with headphones/earphones at a train station.
The measure appears to have been effective, with evidence that the students have: − Developed safer attitudes to trains and railways. − Improved their knowledge and awareness of safety on railway property, including the
dangers and consequences of games and / or inappropriate activities on / near the tracks.
− Know how to be safe in railway environments and how to cross the tracks safely.

RESTRAIL SCP1-GA-2011-285153
RESTRAIL-WP5-CIDAUT-D5.2-B2-24102014_public Page 63 of 168 24 October 2014
− The results suggest there may be a relationship between the place of residence and knowledge of railway safety. Specifically in the case of the pilot study, the schools that are located in closer proximity to the railway tracks have relatively less knowledge about railway safety than those located further away. One possible explanation for this could be that these children live in communities where it is socially accepted to take risks in railway environments therefore leading to a perception of railway trespassing as normal and thus greater confusion about how to act in the railway environment. Children are heavily influenced by the actions they observe in the adults around them which may lead them to reproduce the behaviour observed. Furthermore acting out high risk behaviour may be the children´s response to an adaptation to their environment.
− The results indicate that the older students (Grade 4) have more knowledge regarding railway pedestrian safety. However, there is evidence that Grade 3 pupils improved their knowledge from before the workshop.
CBA for Railway Safety Education
For this measure, which is (as the one after) of an educational nature, we have made a first attempt of computing a CEA. Cost data are essentially design costs of teaching program, information dissemination costs, human costs (effort and time). Variables for evaluating measures effectiveness were twofold: (1) knowledge, awareness and attitudes related to risks inherent to railway trespass; (2) attitude of teachers and school staff related to delivering such preventative education. Results and assumptions are provided in Table 4.2-22.
Table 4.2-22 CEA of Pilot test 2 Railway safety education
Cost [C] 70 539€
Effectiveness measures (/year) [E]
Children’s attitude & knowledge changes between pre and post workshop survey (for all pilot school)
Participation of schools in delivering railway safety education before and after taking part in pilot measure
2,1% of 271 pupils (5,7 children changed towards correct behaviour after attending the training)
0% before, 75% after (6 schools)
Assumptions The effect will remain stable at least during one year
CEA [E/C] 0, 0000806645
0, 0000850593
The results might appear somewhat disappointing but one should keep in mind that the current CEA might not accurately do justice to the measure efficiency, at least for the following line of reasons:
• Effectiveness might not be accurately measured regarding the current knowledge and attitudes of children towards rail safety and how these are impacted by the measures. On the one hand, the score of children during pre-test was quite high (97% correct answer), which can explain the weak increment (3%) to achieve a level of 99%, giving rise to a potential ceiling effect. The literature frequently refers to the existence of a deficit of knowledge by children regarding risk and safe behaviour in railway areas, however. Thus, either the children in the sample differ widely from the usual child population or either the

RESTRAIL SCP1-GA-2011-285153
RESTRAIL-WP5-CIDAUT-D5.2-B2-24102014_public Page 64 of 168 24 October 2014
evaluation material is not sensitive enough. It is worth to note that such a high level was also observed for pilot test 3;
• Some other impact might not be accurately reflected as well. For example, if teachers and school staff are stimulated to implement preventative education related to railway risks and safe behaviour at schools, this will imply to lowering the need for educational intervention by railway staff in the schools;
• We are still missing some criterion to support the delimitation of the optimal scope for applying the measures are not available at this step. Different from the context of road safety where CBA are usually performed with the idea that measures should be applied on all situations for which they are designed across the whole country, the exact scope (in terms of space and population) of application has to be defined, as most of the measures won’t be implemented in a systematic and uniform manner on the whole network areas. Identified hot spots or a certain fixed minimal distance between living areas and railways properties could be part of the criteria used to clarify the scope for application of the preventative measures
Subsequently, conclusions should not be drawn at the moment from this first attempt to compute CEA/CBA and further work is needed to address these issues. Moreover, we need to consider in the future a weighted formula to compute the CEA as well as the CBA taking into account the various impacts of the measure in terms of educational efficiency related to preventing trespass, as well as in terms of stimulating the willingness of teachers and school staff to deliver such educational actions. Furthermore, many assumptions should be clarified in the future about the potential impact of such educational measures on incidents and accidents; the size of the potential targeted population, how persistent is the effect, etc. In the same vein, it would be important to know the figures regarding the implication of children in trespassing accidents, and how these differ depending on where they are living relatively to the railway network location.
4.2.5 Applicability of results to different circumstances The measure aimed to positively influence the behaviours and habits of children and young people towards acting safely around railways, preventive risky behaviour related to trespassing, thus reducing the possibility of trespassing accidents and incidents. These objectives are closely related to what has been termed as citizenship and social skills.
Social and civic competence is the ability to use knowledge about society, understood from different perspectives, to interpret phenomena and social problems in contexts and variable spatial scales, develop responses and decisions, as well as to interact with other people and groups according to social norms. The competence aims to help students develop the skills to identify problems in their environment, analyze and reflect on their personal experiences, obtain, interpret and evaluate relevant information, make decisions that ultimately enable the student to act with increasing responsibility and independence.
The importance of acquiring railway safety skills and the methodology used in the pilot makes its applicability in different social contexts possible. It is obviously necessary to adapt the contents to the reality of where the measure is being applied (national characteristics, cultural references, language, age,...).The selection of educational tools (workshops, posters, social media campaigns, etc..) and contents must take into account the demographic profile of the target population and the characteristics of the local implementation site.
When considering the applicability of the results of the Railway Safety Education Programme to other contexts, it is also important to take into account the fact that children reproduce the behaviours of the adults around them, a phenomenon common to all countries. If children observe

RESTRAIL SCP1-GA-2011-285153
RESTRAIL-WP5-CIDAUT-D5.2-B2-24102014_public Page 65 of 168 24 October 2014
risky behaviours on a daily basis, these may be perceived as normal, acting as models for the children´s future behaviour.
In this sense railway trespassing is a social problem which involves different actors and therefore requires a multi-dimensional and multi-stakeholder response. This emphasizes the essential role of the school and the society in providing the children with information about the real risks of this type of behaviour, regardless of national or cultural context.
Schools clearly have the potential to act as an effective delivery mechanism of railway safety. They offer a space and structure that promotes the sustainability and reach of the measure and the fact that schools exists in all countries, indicates the applicability of this measure in different cultural contexts.
It should be taken into account however, that depending on the country, there may be differences in the scope of a school´s curriculum activities and their willingness to include railway safety within the school programme. Furthermore, there may be some sections of the population who do not regularly attend school (for example, traveller and gypsies) for whom the mainstream education system may not be the most effective communication channel.
In this sense, the application of the educational workshops may be considered in other learning contexts, including more informal situations, such as museums, youth groups and associations or in situ at railway installations.
In countries where railway safety education is undeveloped and there is limited awareness of its need, it is especially recommended to develop workshop materials that complement and add value to the school´s learning objectives. By incorporating railway safety learning into the mainstream curriculum it encourages schools´ participation in such an initiative and the inclusion of railway safety education within its activities.
The social actors with significant responsibility within a child´s education are parents. A measure of this type, therefore, should consider being applied to this group. Educational workshops directed at parents could be delivered as a family learning activity at school or other learning spaces, such as museums or community centres. Whilst schools can be a good way to engage parents in learning activities, the degree of participation may depend on the school´s approach to parental involvement and the relationship between the two parties.
The success of the participatory approach and age appropriate content used in both pupil and teacher workshop is evidence of the applicability of this type of methodology to all age groups, as it stimulates interest and active reflection on the subject.
In terms of applying the workshop to the adolescent age group, the communication channel may need to be reconsidered. Whereas the primary workshop used the Daniela character, the older age group would respond more effectively to the message being transmitted via other peers or media figures that are references for this age group. A good example of this is the Rail-life campaign in the UK. Rail-life is a website aimed at raising teenagers´ awareness of the dangers of railway trespassing. The contents of the website include, amongst others, audio-visual resources with the campaign message often communicated by music artists, rappers and professional sports people, in addition to testimonials and campaign adverts by other young people.
Findings from both the pupils´ and teachers´ evaluation, suggest that the greater the exposure to railway tracks, the more willing people are to risk crossing. However, it is not possible to comment on its effectiveness when applied to contexts where there is no problem with trespassing or the population has limited contact with the railway environment, because no control group was conducted in the pilot. Despite this, it is likely that the result can be extended to other contexts and population groups, although the scope for impact is likely to be greater in contexts where there is a problem with railway trespassing, once people are informed of the real dangers and consequences of these actions.

RESTRAIL SCP1-GA-2011-285153
RESTRAIL-WP5-CIDAUT-D5.2-B2-24102014_public Page 66 of 168 24 October 2014
4.2.6 Discussion Evidence collected through the teacher and pupil evaluation exercises, together with anecdotal reports and the researchers´ observations, demonstrate the effectiveness of the measure in terms of impacts on both pupils and teachers. In this way, the Railway Safety Education Programme will form a valuable part of the RESTRAIL toolbox.
On the one hand, the pupil workshop succeeded in generating knowledge about how to cross the tracks safely and stay safe in the railway environment, with the pupils expressing safe attitudes and awareness of the dangers of crossing the tracks on foot.
On the other hand, responses to the teachers´ questionnaire point to the impact of the measure in raising awareness of the importance of teaching railway pedestrian safety and the dangers of trespassing at school, as well as a self reported increase in their confidence and skills to do so.
In the past there does not appear to be have been a systematic school approach to dealing with the issue of railway safety or trespassing, despite the concern schools expressed and their first hand experience of the issue. Taking into account this baseline situation, the fact that the participating schools and individual teachers have reported their intention to continue delivering railway safety education in the future is further evidence of the effectiveness of the measure.
The results indicate a possible relationship between an awareness of the dangers of trespassing and the proximity of the school and/or place of residence to the railway tracks11. This may be due to the risky behaviour observed by the pupils on a daily basis leading to a perception of railway trespassing as normal and thus confusion about how to act in the railway environment.
Indeed findings from both the pupils´ and teachers´ evaluation suggest that the greater the exposure to railway tracks, the more willing people are to risk crossing. In such a context however, the scope for impact is greater, once people are informed of the real dangers and consequences of these actions. It is a clear indication of the impact of this measure therefore, that the participants´ attitudes appear to have changed, with both pupils and teachers having reported an increased awareness of the dangers.
The findings of the pilot study suggest that children´s knowledge of railway safety and their subsequent behaviour is heavily influenced by the actions they observe in the adults around them. Anecdotal evidence given by teachers and pupils indicate that parents and peers cross the tracks in unauthorized places thus establishing models of behaviour that the pupils may follow in the future. This emphasizes the essential role of the school in providing the pupils with information about the real risks of this type of behavior as well as the importance of parental involvement in the pupils´ learning.
As observed by more than one of the teachers, people´s awareness of the dangers of crossing the tracks may be heightened directly following an accident or incident, only to rapidly dissipate with the passing of time. These further highlights the need for schools to take a systematic approach to dealing with the issue of the dangers of railway trespassing with the aim of embedding a culture of railway safety, starting by addressing it within the school curriculum as has been successfully done with road pedestrian safety.
Incorporating the teachings within the school curriculum is a valuable approach for different reasons. It ensures continuity of the teachings and in a variety of learning contexts. It is also practical, in terms of the management of teachers´ time, because rather than delivering a standalone activity which is additional to the curriculum, the subject will be dealt with in an integrated way, reducing the risk that the subject is left aside. 11 Based on the fact that the school located closest to the tracks scored comparatively lower in the evaluation results (i.e.
less knowledge about the dangers of crossing the tracks) than the other schools.

RESTRAIL SCP1-GA-2011-285153
RESTRAIL-WP5-CIDAUT-D5.2-B2-24102014_public Page 67 of 168 24 October 2014
This does not exclude the value of carrying out specific activities such as rail safety workshops, visits to the school by external practitioners or specialists or visits out of school, for example, to the railway museums or railway installations. Indeed one of the respondents expressed an opinion endorsing this approach, saying that the pupils often pay more attention when someone external delivers the activity.
Accidents and incidents caused by crossing the tracks in unauthorised places is a problem which transcends different areas of life affecting many different actors. In this way, it requires a sustained, coordinated and multidisciplinary response, led by experts. It is recommended that the stakeholders involved should comprise, as a minimum, the railway infrastructure manager, railway operator and public administration within the affected area, in addition to other groups affected by the problem (e.g. schools, community associations ...).
Education delivered outside of school, through organisations such as the Railway Museums or transport police, also plays an important role in communicating the safety message. One approach to reducing accidents and incidents on railway property could be to increase the society´s understanding of railways and trains. In this sense the Railway Museums have a crucial role in bringing the society closer to the world of trains, being the institution that can mediate between railway companies and railway infrastructure managers, schools and the society as a whole.
As mentioned previously, given the scope of railway trespassing, it is important to tackle the issue from different angles, by working with the different groups affected. There is recognition amongst teachers of the benefit of working with the 8-10 year primary age group, in terms of future prevention and potential to shape attitudes, thus impacting their future behaviour. However, there is also a demand from the schools to work with the adolescent age group, as they are seen to be at greater risk of perpetrating this behaviour.
Materials and work methodology would need to be adapted, taking into account maturational effects and the nature of the problem being tackled with this age group. In this sense, the work with teenagers may be more intervention focused rather than purely prevention. For example, in the UK the British Transport Police carry out targeted interventions in secondary schools when young people have been identified trespassing on railway property. The hotspot is also then closely monitored.
One issue mentioned anecdotally by one of the teachers participating in the teacher workshop, is the concern that talking to pupils about railway trespassing may incite the very behaviour the measure seeks to prevent. Overall, recognition of the need to deal with the issue appears to outweigh this fear, although it is important to take this factor into account when planning such a measure and engaging the schools.
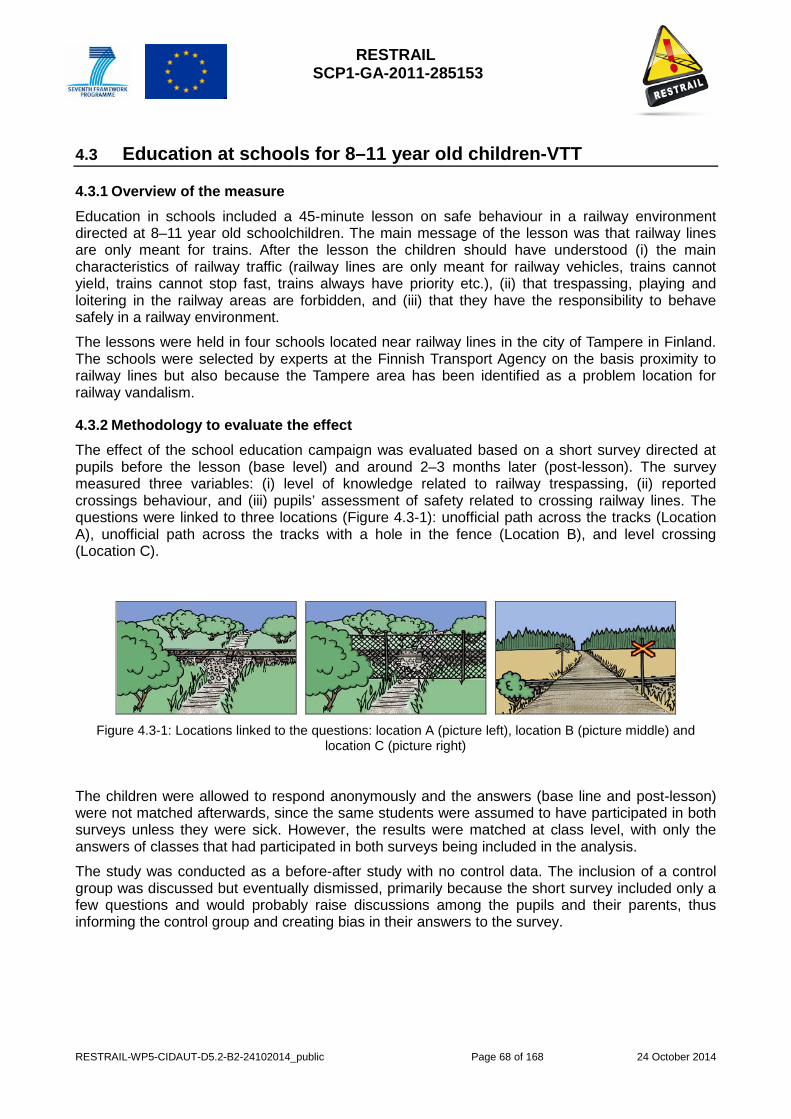
RESTRAIL SCP1-GA-2011-285153
RESTRAIL-WP5-CIDAUT-D5.2-B2-24102014_public Page 68 of 168 24 October 2014
4.3 Education at schools for 8–11 year old children-VTT
4.3.1 Overview of the measure Education in schools included a 45-minute lesson on safe behaviour in a railway environment directed at 8–11 year old schoolchildren. The main message of the lesson was that railway lines are only meant for trains. After the lesson the children should have understood (i) the main characteristics of railway traffic (railway lines are only meant for railway vehicles, trains cannot yield, trains cannot stop fast, trains always have priority etc.), (ii) that trespassing, playing and loitering in the railway areas are forbidden, and (iii) that they have the responsibility to behave safely in a railway environment.
The lessons were held in four schools located near railway lines in the city of Tampere in Finland. The schools were selected by experts at the Finnish Transport Agency on the basis proximity to railway lines but also because the Tampere area has been identified as a problem location for railway vandalism.
4.3.2 Methodology to evaluate the effect The effect of the school education campaign was evaluated based on a short survey directed at pupils before the lesson (base level) and around 2–3 months later (post-lesson). The survey measured three variables: (i) level of knowledge related to railway trespassing, (ii) reported crossings behaviour, and (iii) pupils’ assessment of safety related to crossing railway lines. The questions were linked to three locations (Figure 4.3-1): unofficial path across the tracks (Location A), unofficial path across the tracks with a hole in the fence (Location B), and level crossing (Location C).
Figure 4.3-1: Locations linked to the questions: location A (picture left), location B (picture middle) and
location C (picture right)
The children were allowed to respond anonymously and the answers (base line and post-lesson) were not matched afterwards, since the same students were assumed to have participated in both surveys unless they were sick. However, the results were matched at class level, with only the answers of classes that had participated in both surveys being included in the analysis.
The study was conducted as a before-after study with no control data. The inclusion of a control group was discussed but eventually dismissed, primarily because the short survey included only a few questions and would probably raise discussions among the pupils and their parents, thus informing the control group and creating bias in their answers to the survey.
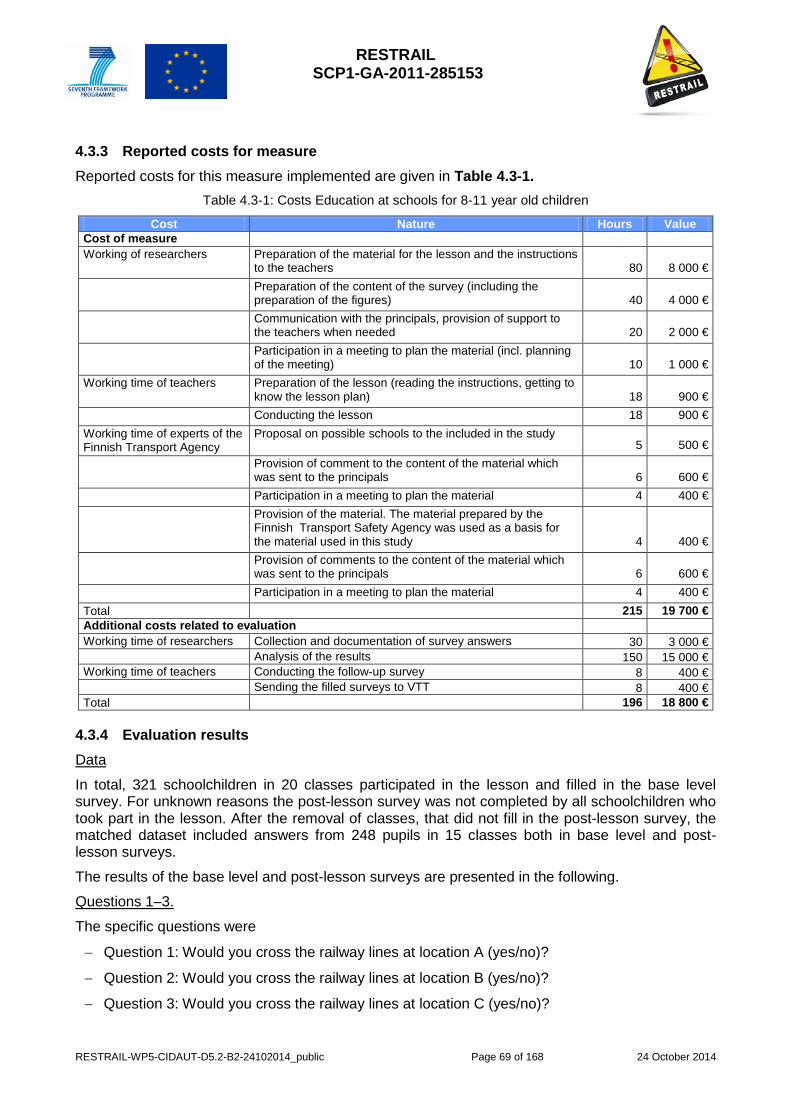
RESTRAIL SCP1-GA-2011-285153
RESTRAIL-WP5-CIDAUT-D5.2-B2-24102014_public Page 69 of 168 24 October 2014
4.3.3 Reported costs for measure Reported costs for this measure implemented are given in Table 4.3-1.
Table 4.3-1: Costs Education at schools for 8-11 year old children
Cost Nature Hours Value Cost of measure Working of researchers Preparation of the material for the lesson and the instructions
to the teachers 80 8 000 € Preparation of the content of the survey (including the
preparation of the figures) 40 4 000 € Communication with the principals, provision of support to
the teachers when needed 20 2 000 € Participation in a meeting to plan the material (incl. planning
of the meeting) 10 1 000 € Working time of teachers Preparation of the lesson (reading the instructions, getting to
know the lesson plan) 18 900 € Conducting the lesson 18 900 € Working time of experts of the Finnish Transport Agency
Proposal on possible schools to the included in the study 5 500 €
Provision of comment to the content of the material which was sent to the principals 6 600 €
Participation in a meeting to plan the material 4 400 € Provision of the material. The material prepared by the
Finnish Transport Safety Agency was used as a basis for the material used in this study 4 400 €
Provision of comments to the content of the material which was sent to the principals 6 600 €
Participation in a meeting to plan the material 4 400 € Total 215 19 700 € Additional costs related to evaluation Working time of researchers Collection and documentation of survey answers 30 3 000 € Analysis of the results 150 15 000 € Working time of teachers Conducting the follow-up survey 8 400 € Sending the filled surveys to VTT 8 400 € Total 196 18 800 €
4.3.4 Evaluation results Data
In total, 321 schoolchildren in 20 classes participated in the lesson and filled in the base level survey. For unknown reasons the post-lesson survey was not completed by all schoolchildren who took part in the lesson. After the removal of classes, that did not fill in the post-lesson survey, the matched dataset included answers from 248 pupils in 15 classes both in base level and post-lesson surveys.
The results of the base level and post-lesson surveys are presented in the following.
Questions 1–3.
The specific questions were
− Question 1: Would you cross the railway lines at location A (yes/no)?
− Question 2: Would you cross the railway lines at location B (yes/no)?
− Question 3: Would you cross the railway lines at location C (yes/no)?
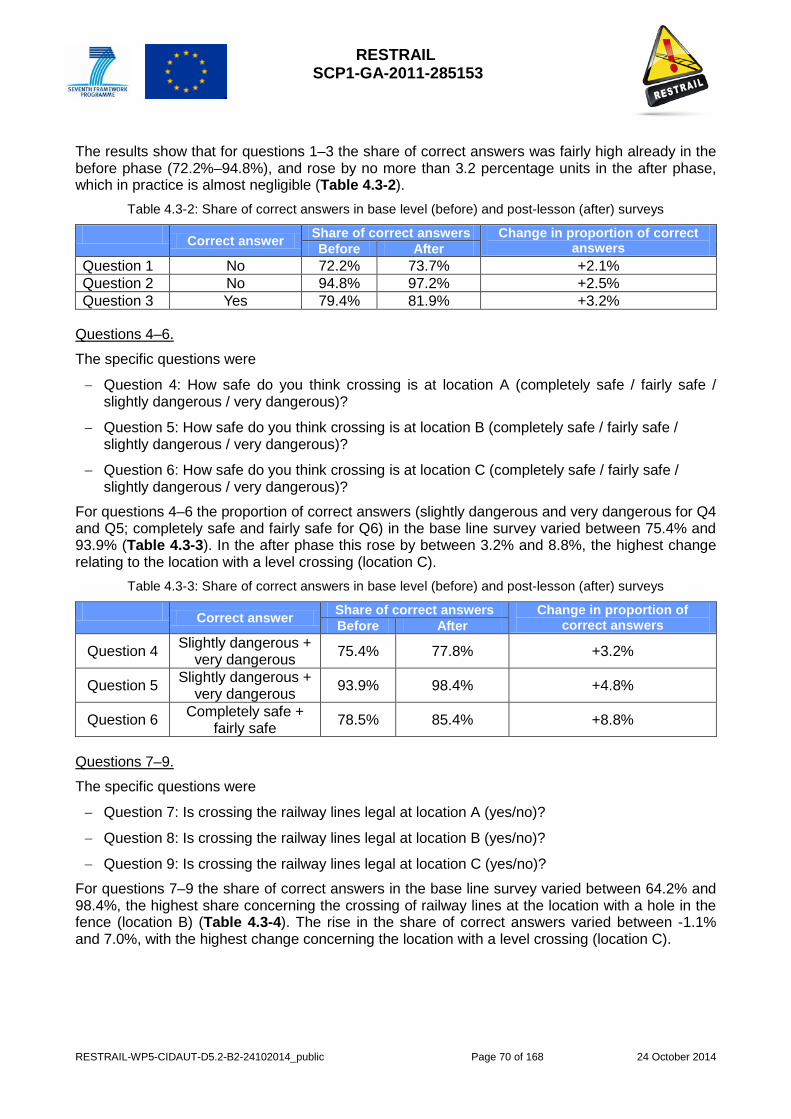
RESTRAIL SCP1-GA-2011-285153
RESTRAIL-WP5-CIDAUT-D5.2-B2-24102014_public Page 70 of 168 24 October 2014
The results show that for questions 1–3 the share of correct answers was fairly high already in the before phase (72.2%–94.8%), and rose by no more than 3.2 percentage units in the after phase, which in practice is almost negligible (Table 4.3-2).
Table 4.3-2: Share of correct answers in base level (before) and post-lesson (after) surveys
Correct answer Share of correct answers Change in proportion of correct answers Before After
Question 1 No 72.2% 73.7% +2.1% Question 2 No 94.8% 97.2% +2.5% Question 3 Yes 79.4% 81.9% +3.2%
Questions 4–6.
The specific questions were
− Question 4: How safe do you think crossing is at location A (completely safe / fairly safe / slightly dangerous / very dangerous)?
− Question 5: How safe do you think crossing is at location B (completely safe / fairly safe / slightly dangerous / very dangerous)?
− Question 6: How safe do you think crossing is at location C (completely safe / fairly safe / slightly dangerous / very dangerous)?
For questions 4–6 the proportion of correct answers (slightly dangerous and very dangerous for Q4 and Q5; completely safe and fairly safe for Q6) in the base line survey varied between 75.4% and 93.9% (Table 4.3-3). In the after phase this rose by between 3.2% and 8.8%, the highest change relating to the location with a level crossing (location C).
Table 4.3-3: Share of correct answers in base level (before) and post-lesson (after) surveys
Correct answer Share of correct answers Change in proportion of correct answers Before After
Question 4 Slightly dangerous + very dangerous 75.4% 77.8% +3.2%
Question 5 Slightly dangerous + very dangerous 93.9% 98.4% +4.8%
Question 6 Completely safe + fairly safe 78.5% 85.4% +8.8%
Questions 7–9.
The specific questions were
− Question 7: Is crossing the railway lines legal at location A (yes/no)?
− Question 8: Is crossing the railway lines legal at location B (yes/no)?
− Question 9: Is crossing the railway lines legal at location C (yes/no)?
For questions 7–9 the share of correct answers in the base line survey varied between 64.2% and 98.4%, the highest share concerning the crossing of railway lines at the location with a hole in the fence (location B) (Table 4.3-4). The rise in the share of correct answers varied between -1.1% and 7.0%, with the highest change concerning the location with a level crossing (location C).

RESTRAIL SCP1-GA-2011-285153
RESTRAIL-WP5-CIDAUT-D5.2-B2-24102014_public Page 71 of 168 24 October 2014
Table 4.3-4: Share of correct answers in base level (before) and post-lesson (after) surveys
Correct answer Share of correct answers Change in proportion of correct answers Before After
Question 7 No 64.2% 66.4% +3.4% Question 8 No 98.4% 97.3% -1.1% Question 9 Yes 86.0% 92.0% +7.0%
Statistical tests The results of the statistical tests (Chi-Square Test) comparing the answers in base level and post-lesson surveys are presented in Table 4.3-5, for each question and all pupils, and for each question by school and by grade.
Table 4.3-5: Summary of statistically significant differences between answers in base level and post-lesson
surveys
Q1 Q2 Q3 Q4 Q5 Q6 Q7 Q8 Q9 All pupils, n=496 − − − − yes (p<0.05)* − − − yes (p<0.05)
School A, n= 33 − np** np** − np** − − np** np** School B, n=104 − − − − − − − _ yes (p<0.05) School C, n=307 − − − − yes (p<0.05)* − − − − School D, n=52 np** _ − np** np** − np** np** −
2nd Grade, n=176 − − − − yes (p<0.05)* − − − − 3rd Grade, n=141 − − − − − − − − − 4th Grade, n=179 − − − − − − − np** −
* Due to categories with zero answers in one/more categories the safe and dangerous categories were combined (completely safe + fairly safe = safe and slightly dangerous + very dangerous = dangerous)
** np = statistical analysis was not possible due to categories with zero answers. The combination of categories was not possible or did not help to solve the problem.
For all respondents together, the only statistically significant differences in the share of correct answers between base level and post-lesson surveys were those obtained for question 5 (How safe do you estimate crossing at location B?) and question 9 (Is crossing the railway lines legal at location C?). Specifically,
− crossing the railway lines at location B (Question 5, hole in the fence) was considered dangerous more often after the lesson than before (x2(1)=6.62 p < 0.05)
− crossing the railway lines at location C (Question 9, level crossing) was considered legal more often after the lesson than before (x2(1)=4.25, p < 0.05)
For the results by school and by grade, in nine cases significance testing was not possible because of zero answers in the Chi-square tests (marked np in Table 4.3-5). However, as seen from the distributions of answers to the respective questions, the changes in numbers of answers in the relevant categories between base level and post-level surveys is only one or two. Therefore the effect in these cases, marked np in Table 4.3-5, was probably negligible.
For the results by school in Table 4, in two cases the effect was statistically significant:
− In school C, education improved understanding of the dangerousness of location B (Question 5, hole in the fence) (x2(1)=6.15, p < 0.05) . Specifically, the change in proportion of correct answers improved from 92.9% to 98.7%.
− In school B, education improved understanding of the legality of crossing the railway lines at location C (Question 9, level crossing) (x2(1)=4.16, p < 0.05). Specifically, the change in the proportion of correct answers in school B improved from 81.6% to 96.9%.

RESTRAIL SCP1-GA-2011-285153
RESTRAIL-WP5-CIDAUT-D5.2-B2-24102014_public Page 72 of 168 24 October 2014
For the results by grade, in one case the effect was statistically significant:
− 2nd Grade schoolchildren considered crossing the railway lines at location B (Question 5, hole in the fence) to be more often dangerous after the lesson than before (x2(1)=5.93, p < 0.05). It should be noted, however, that the proportion of correct answers in the base-level survey was lower (88.4%) for 2nd grade pupils than for 3rd and 4th grade pupils (97.7% and 97.2%).
− We are unable to provide a clear explanation for the variation between schools. However, the teachers constructed the content of their lesson independently based on the lesson plan provided, and they could have weighed the issues differently. In particular, in school B they may have spent more time on the legality of crossing railway lines than in other schools, and in school C they may have paid more attention to the dangers of different crossing points.
In addition to the survey results one filled feedback form was received from one 4th grade teacher. The content of this feedback was:
− The content of the lesson was good and the pictures in the PowerPoint-presentation were clear and illustrative.
− The children were attentive and seemed to be interested in the topic.
− Recommendation: the safe places to cross the railway lines could be more emphasized in the material.
CBA for Education at school for 8-11 years old
Again for this pilot test, cost data are essentially design costs of teaching program and human costs (effort and time). Effectiveness is evaluated through an evaluation of the children’s knowledge gained from being exposed to education. Results and assumptions are provided in Table 4.3-6.
Table 4.3-6: CEA of Pilot test 3 “: Education at schools for 8–11 year old children”
Cost [C] 19 600€
Effectiveness measures (/year) [E]
Children’s attitude & knowledge changes (questionnaire pre and 2-3 months after)
3,76% (that represents the average increase of knowledge to all children regardless of their grade)
Assumptions The effect will remain stable at least during one year
CEA [E/C] 0,00019183673469
CBA (same formula as CEA with E monetized)
As mentioned in the previous CEA section for pilot test 2, the weak measured gain due to the high initial level of success by children before the educational action might explain the low CEA ratio. Beyond the study and validation of an assessment tools for children’s attitude and competencies required to predict the adoption of safe behaviours in the railway area, other issues to consider in the future are weighted formula to compute the CEA as well as the CBA taking into account the various impacts of the measure in terms of educational efficiency related to preventing trespass, and assumption should be clarified about the potential impact of such educational measures on the number of incidents and accidents, the size of the potential targeted population, how persistent the effect, etc. It would be also important to know the figures regarding the implication of children in
RESTRAIL SCP1-GA-2011-285153
RESTRAIL-WP5-CIDAUT-D5.2-B2-24102014_public Page 73 of 168 24 October 2014
trespassing accidents, and how these differ depending on where they are living relatively to the railway network location.
4.3.5 Discussion and conclusions The main aim of this study was to evaluate whether railway safety lessons are effective in increasing schoolchildren’s safety knowledge and self-reported behaviour; thus the results provide valuable input to the discussion on the effectiveness of railway safety education campaigns. The effectiveness of this measure was estimated based on three variables: self-reported behaviour, estimated dangerousness of the behaviour, and level of knowledge on the legality of the behaviour. All these variables are considered as strong determinants of actual behaviour.
− Self-reported behaviour: The self-reported behaviour is assumed to have a direct link to actual behaviour. Therefore the reduction in self-reported behaviour is assumed to lead to a reduction in the frequency of railway trespassing.
− Estimated dangerousness of the behaviour: The assumption is that the higher the children evaluate the risk to be, the smaller the probability of an unsafe crossing of railway lines. This is supported by the findings of Silla (2012), which show that perceived risk has proven to be predictive of trespassing behaviour. Specifically, trespassing was considered dangerous by (i) 98.0% of the respondents in the survey, who indicated that they had not trespassed, followed by (ii) 76.8% of the respondents who indicated that they had trespassed and (iii) 50.0% of the interviewed trespassers.
− Knowledge of legality of the behaviour: The assumption is that the higher the knowledge of the illegality of the crossing, the smaller the probability of an unsafe crossing of railway lines. This is supported by the findings of Silla and Luoma (2012), which indicate that the effect of awareness of legality on the respondents’ own reported trespassing was significant, with a more substantial proportion trespassing among respondents who indicated trespassing to be legal compared to those who considered it illegal.
The results show that railway safety education in schools has a positive effect for all the measured variables. Specifically, the change in the share of correct answers was positive except for question 8 (Is crossing the railway lines legal at location B?). However, upon closer examination the number of yes answers was four at base level and six post-lesson, which is not a significant difference. Based on this we can reasonably assume that railway safety education in schools will also have a positive effect on the frequency of trespassing in that area.
The size of the effect depends on the children’s base level understanding of the dangers related to railway lines. According to the results of this study, a fairly large majority of the children had a reasonably adequate perception of the dangers related to railways, and their self-reported behaviour reflected their perception even before the lesson. It may well be that the base level knowledge of schoolchildren is better in schools located near railway lines than in schools located farther away. Nonetheless it is always useful to review the topic so that the children maintain their awareness of these dangers.
We can assume from the results that the positive changes in self-reported behaviour, estimation of danger and understanding of legality will have a positive effect on the frequency of trespassing (i.e. fewer unsafe crossings in the future). We can further assume that reduction in the frequency of trespassing could have an effect (i.e. reduction) on the frequency of trespassing accidents. What the results do not do is to answer to the question of how many trespassing accidents could be prevented with this intervention.

RESTRAIL SCP1-GA-2011-285153
RESTRAIL-WP5-CIDAUT-D5.2-B2-24102014_public Page 74 of 168 24 October 2014
4.3.6 Applicability of results to different circumstances A similar railway safety education programme could be implemented in other European countries, given that the main safety message is valid everywhere. However, the material should be adjusted to comply with local circumstances (e.g. typical environments where trespassing occurs). In addition, it should be noted that this measure is expected to be more effective in raising the level of knowledge when implemented in cities and/or countries in which the children’s level of knowledge is not as high in the before phase as in the Tampere region.
RESTRAIL SCP1-GA-2011-285153
RESTRAIL-WP5-CIDAUT-D5.2-B2-24102014_public Page 75 of 168 24 October 2014
4.4 Video enforcement and sound warning-VTT
4.4.1 Overview of the piloted measure The measure Video enforcement and sound warning was piloted at two locations in southern Finland between May and December 2013. At the pilot test locations trespassing occurred along illegal footpaths across railway tracks. Trespassers were detected by video cameras which triggered a sound warning by a loudspeaker when movement was detected in a predefined area in the picture. A detailed description of the measure and pilot test is in RESTRAIL Deliverable 5.1 (2014).
4.4.2 Methodology to evaluate the piloted measure The evaluation of the effects on the frequency of trespassing and trespassing accidents was based on trespasser counts before and after implementation. It was assumed that changes in the frequency of trespassing reflect the effects on the frequency of trespassing accidents. This is a fair assumption since e.g. in road accident studies exposure (expressed for example in kilometres driven) is by far the most important variable explaining the number of accidents (Elvik et al. 2009). Even though the effect of exposure is not necessarily strictly linear, changes in exposure have a clear effect on the probability of accidents.
The evaluation method was a naive before-after study, meaning that the frequency of trespassing after the implementation of the measure was compared to respective frequency before implementation, without control for other factors which may have - and probably have – affected the frequency of trespassing during the study period. Examples of such factors include e.g. seasonal variation of pedestrian traffic, weather, temperature, and number of daylight hours per day. It would have been desirable to use a control group for the elimination of the effects of such confounding factors. However, it was practically impossible to find valid comparison data because the development of trespassing frequency in time can vary between sites. The routes pedestrians use daily can change for reasons other than safety measures, and the changes can vary between sites. In a small-scale study like ours it was not possible to use control data that would have enabled reliable estimation of what would have been the frequency of trespassing at the test sites if the measure had not been implemented.
The effect of the measure on the frequency of trespassing was calculated by a method designed for naive before-after studies (Hauer 1997). In principle, the method consists of two steps:
- Step1: prediction of frequency of trespassing in the after period, if the measure had not been implemented and;
- Step2: estimation of the frequency of trespassing in the after period, when the measure was at place.
The effect of the measure is achieved by comparing the results of these two steps.
In the first step the predicted frequency of trespassing is calculated by multiplying the trespassing frequency in the before period by the ratio of the durations of after and before periods. The estimate of the trespassing frequency in step two is simply the observed frequency.
It is assumed that the number of trespassers per unit time is Poisson distributed. Then the statistical notations and calculations are as follows:
K is the observed number of trespassers per observation unit in the before period.
L is the observed number of trespassers per observation unit in the after period.
π is the predicted number of trespassers of a specific entity (location) in the after period, if the measure had not been implemented.
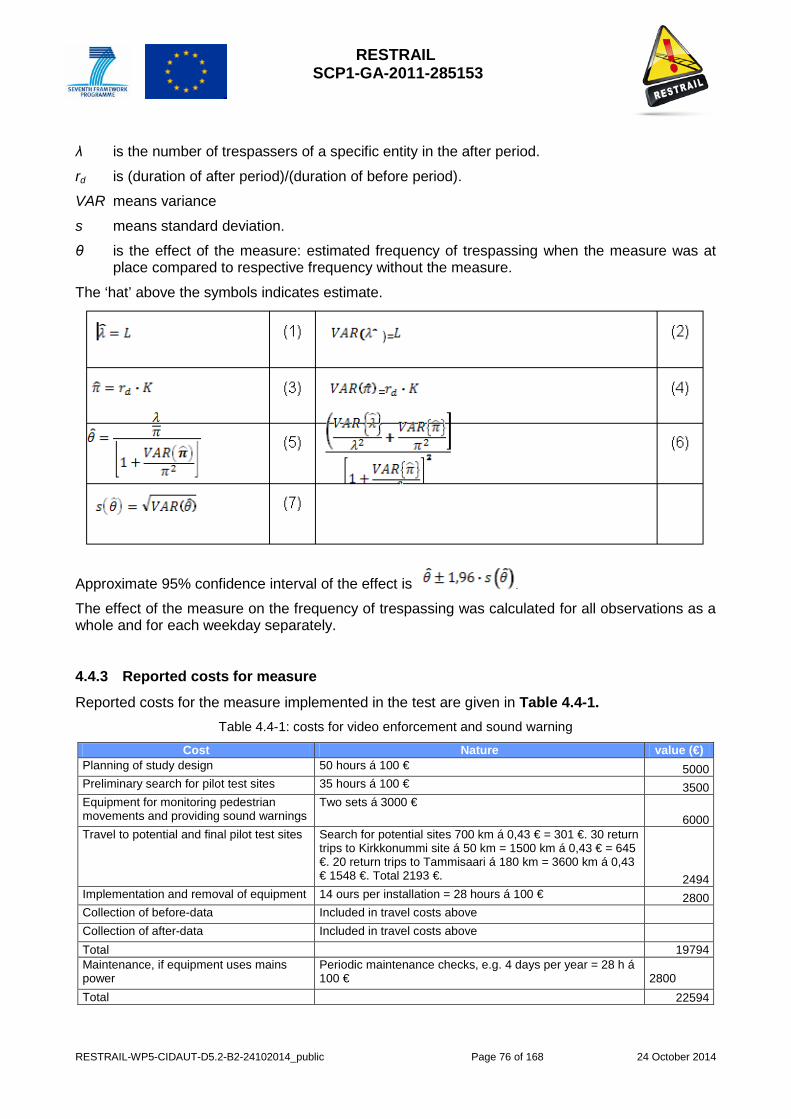
RESTRAIL SCP1-GA-2011-285153
RESTRAIL-WP5-CIDAUT-D5.2-B2-24102014_public Page 76 of 168 24 October 2014
λ is the number of trespassers of a specific entity in the after period.
rd is (duration of after period)/(duration of before period).
VAR means variance
s means standard deviation.
θ is the effect of the measure: estimated frequency of trespassing when the measure was at place compared to respective frequency without the measure.
The ‘hat’ above the symbols indicates estimate.
Approximate 95% confidence interval of the effect is
The effect of the measure on the frequency of trespassing was calculated for all observations as a whole and for each weekday separately.
4.4.3 Reported costs for measure
Reported costs for the measure implemented in the test are given in Table 4.4-1. Table 4.4-1: costs for video enforcement and sound warning
Cost Nature value (€) Planning of study design 50 hours á 100 € 5000 Preliminary search for pilot test sites 35 hours á 100 € 3500 Equipment for monitoring pedestrian movements and providing sound warnings
Two sets á 3000 € 6000
Travel to potential and final pilot test sites Search for potential sites 700 km á 0,43 € = 301 €. 30 return trips to Kirkkonummi site á 50 km = 1500 km á 0,43 € = 645 €. 20 return trips to Tammisaari á 180 km = 3600 km á 0,43 € 1548 €. Total 2193 €. 2494
Implementation and removal of equipment 14 ours per installation = 28 hours á 100 € 2800 Collection of before-data Included in travel costs above Collection of after-data Included in travel costs above Total 19794 Maintenance, if equipment uses mains power
Periodic maintenance checks, e.g. 4 days per year = 28 h á 100 € 2800
Total 22594
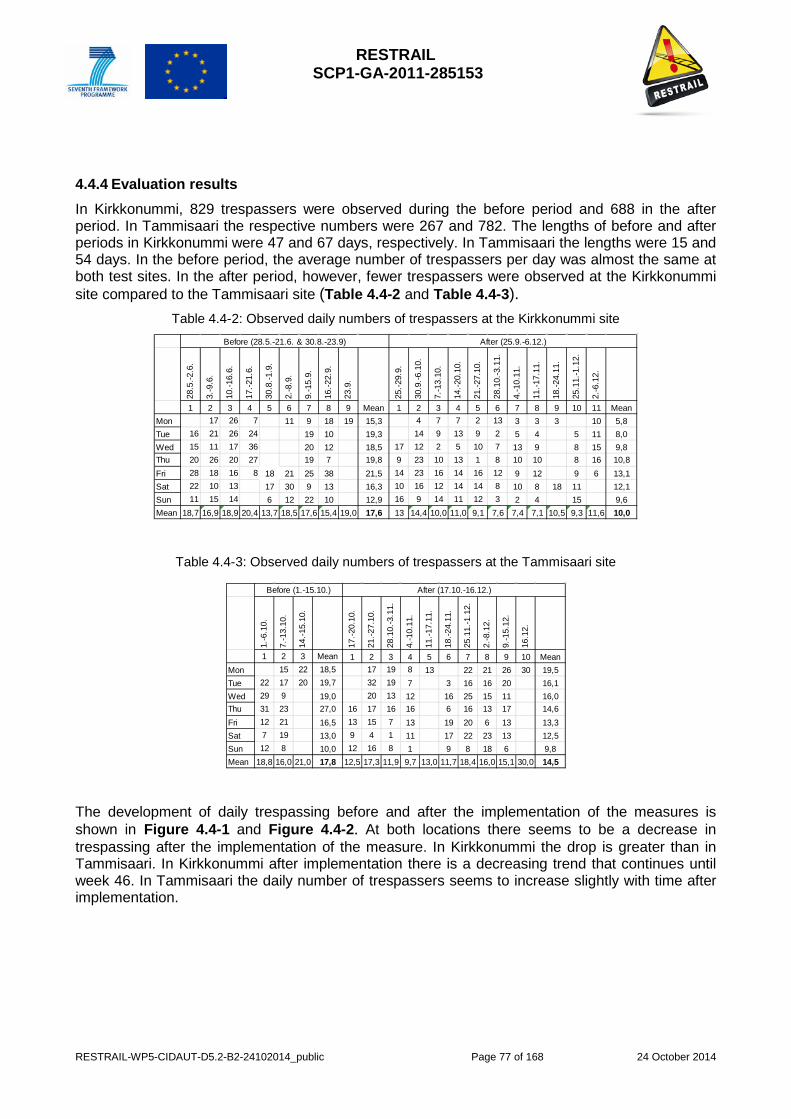
RESTRAIL SCP1-GA-2011-285153
RESTRAIL-WP5-CIDAUT-D5.2-B2-24102014_public Page 77 of 168 24 October 2014
4.4.4 Evaluation results In Kirkkonummi, 829 trespassers were observed during the before period and 688 in the after period. In Tammisaari the respective numbers were 267 and 782. The lengths of before and after periods in Kirkkonummi were 47 and 67 days, respectively. In Tammisaari the lengths were 15 and 54 days. In the before period, the average number of trespassers per day was almost the same at both test sites. In the after period, however, fewer trespassers were observed at the Kirkkonummi site compared to the Tammisaari site (Table 4.4-2 and Table 4.4-3).
Table 4.4-2: Observed daily numbers of trespassers at the Kirkkonummi site
28.5
.-2.6
.
3.-9
.6.
10.-1
6.6.
17.-2
1.6.
30.8
.-1.9
.
2.-8
.9.
9.-1
5.9.
16.-2
2.9.
23.9
.
25.-2
9.9.
30.9
.-6.1
0.
7.-1
3.10
.
14.-2
0.10
.
21.-2
7.10
.
28.1
0.-3
.11.
4.-1
0.11
.
11.-1
7.11
.
18.-2
4.11
.
25.1
1.-1
.12.
2.-6
.12.
1 2 3 4 5 6 7 8 9 Mean 1 2 3 4 5 6 7 8 9 10 11 MeanMon 17 26 7 11 9 18 19 15,3 4 7 7 2 13 3 3 3 10 5,8Tue 16 21 26 24 19 10 19,3 14 9 13 9 2 5 4 5 11 8,0Wed 15 11 17 36 20 12 18,5 17 12 2 5 10 7 13 9 8 15 9,8Thu 20 26 20 27 19 7 19,8 9 23 10 13 1 8 10 10 8 16 10,8Fri 28 18 16 8 18 21 25 38 21,5 14 23 16 14 16 12 9 12 9 6 13,1Sat 22 10 13 17 30 9 13 16,3 10 16 12 14 14 8 10 8 18 11 12,1Sun 11 15 14 6 12 22 10 12,9 16 9 14 11 12 3 2 4 15 9,6Mean 18,7 16,9 18,9 20,4 13,7 18,5 17,6 15,4 19,0 17,6 13 14,4 10,0 11,0 9,1 7,6 7,4 7,1 10,5 9,3 11,6 10,0
Before (28.5.-21.6. & 30.8.-23.9) After (25.9.-6.12.)
Table 4.4-3: Observed daily numbers of trespassers at the Tammisaari site
1.-6
.10.
7.-1
3.10
.
14.-1
5.10
.
17.-2
0.10
.
21.-2
7.10
.
28.1
0.-3
.11.
4.-1
0.11
.
11.-1
7.11
.
18.-2
4.11
.
25.1
1.-1
.12.
2.-8
.12.
9.-1
5.12
.
16.1
2.
1 2 3 Mean 1 2 3 4 5 6 7 8 9 10 MeanMon 15 22 18,5 17 19 8 13 22 21 26 30 19,5Tue 22 17 20 19,7 32 19 7 3 16 16 20 16,1Wed 29 9 19,0 20 13 12 16 25 15 11 16,0Thu 31 23 27,0 16 17 16 16 6 16 13 17 14,6Fri 12 21 16,5 13 15 7 13 19 20 6 13 13,3Sat 7 19 13,0 9 4 1 11 17 22 23 13 12,5Sun 12 8 10,0 12 16 8 1 9 8 18 6 9,8Mean 18,8 16,0 21,0 17,8 12,5 17,3 11,9 9,7 13,0 11,7 18,4 16,0 15,1 30,0 14,5
Before (1.-15.10.) After (17.10.-16.12.)
The development of daily trespassing before and after the implementation of the measures is shown in Figure 4.4-1 and Figure 4.4-2. At both locations there seems to be a decrease in trespassing after the implementation of the measure. In Kirkkonummi the drop is greater than in Tammisaari. In Kirkkonummi after implementation there is a decreasing trend that continues until week 46. In Tammisaari the daily number of trespassers seems to increase slightly with time after implementation.
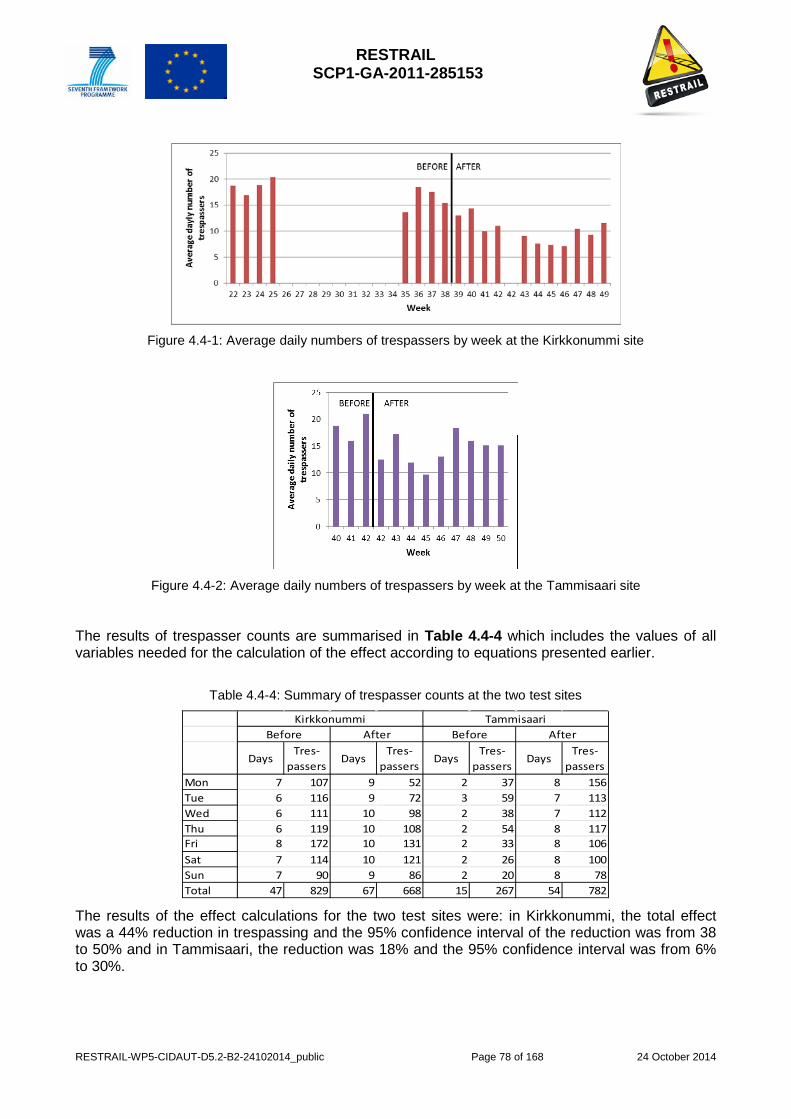
RESTRAIL SCP1-GA-2011-285153
RESTRAIL-WP5-CIDAUT-D5.2-B2-24102014_public Page 78 of 168 24 October 2014
Figure 4.4-1: Average daily numbers of trespassers by week at the Kirkkonummi site
Figure 4.4-2: Average daily numbers of trespassers by week at the Tammisaari site
The results of trespasser counts are summarised in Table 4.4-4 which includes the values of all variables needed for the calculation of the effect according to equations presented earlier.
Table 4.4-4: Summary of trespasser counts at the two test sites
DaysTres-
passersDays
Tres- passers
DaysTres-
passersDays
Tres- passers
Mon 7 107 9 52 2 37 8 156Tue 6 116 9 72 3 59 7 113Wed 6 111 10 98 2 38 7 112Thu 6 119 10 108 2 54 8 117Fri 8 172 10 131 2 33 8 106Sat 7 114 10 121 2 26 8 100Sun 7 90 9 86 2 20 8 78Total 47 829 67 668 15 267 54 782
TammisaariBefore After
KirkkonummiBefore After
The results of the effect calculations for the two test sites were: in Kirkkonummi, the total effect was a 44% reduction in trespassing and the 95% confidence interval of the reduction was from 38 to 50% and in Tammisaari, the reduction was 18% and the 95% confidence interval was from 6% to 30%.
RESTRAIL SCP1-GA-2011-285153
RESTRAIL-WP5-CIDAUT-D5.2-B2-24102014_public Page 79 of 168 24 October 2014
In Tammisaari the before period was quite short (only about two weeks) for reasons explained in RESTRAIL Deliverable 5.1 (2014). This is shows in the confidence which are much greater than in Kirkkonummi where the lengths of before and after periods were in better balance.
In Kirkkonummi there were significant differences in the effect between weekdays: The reduction was smaller during weekend (26%) than on Monday and Tuesday (63% and 59%). No explanation for this difference could be found. In Tammisaari the confidence intervals of the effect estimates of different days were overlapping, and there were no significant differences between weekdays.
Trespassers were also classified by e.g. age, sex, direction of travel and whether they were alone or part of a larger group. No clear differences in the effect were detected between such categories.
CBA for video enforcement and sound warning
Concerning this measure, costs are essentially study and design costs, location research costs, maintenance and implementation equipment costs. The variables used to assess the measure are the number of prevented trespassers for each site.
When a cost-effectiveness study is performed, it is imperative to express the cost-effectiveness ratio (CER),that is obtained by dividing the efficiency E by the cost generated by the implementation of the measure C:
CER=E/C
With regards to this measure, efficiency is defined as the number of prevented trespass on the tracks by cost unit of the implemented measure:
CER = (number of trespass prevented by the implementation of the measure) / cost of the measure).
Reported to a one-year period, we can calculate the number of avoided trespass since the implementation of the measure and the real cost of the measure for the same period, which provides a CER = 2078/22594 = 0.091984205. It should be note that the higher is the CER value, more efficient is the measure. Results and assumptions are provided in Table 4.4-5.
Table 4.4-5: CEA for video enforcement and sound warning Cost 22 594 € Effectiveness measures
Number of trespassers prevented per year
2078 (365* 5,69 prevented / days)
Assumption(s) The reduction in the number of trespassers is considered as constant and representative of the cumulated effect whatever the period in the year
Cost effectiveness ratio (CEA results (E/C) 0,091984205
The resulting CEA ratio can be interpreted in the following way: an investment of 1 euro enable to reduce by 0.09 the number of trespasser per year at a location. A Cost-Benefit analysis would probably be more meaningful in terms of decision support. For that purpose however, it is necessary to operate the efficiency variables, in particular here the number of trespass prevented by the measure. Financial gain can be calculated depending on the type of avoided trespass-
RESTRAIL SCP1-GA-2011-285153
RESTRAIL-WP5-CIDAUT-D5.2-B2-24102014_public Page 80 of 168 24 October 2014
related events; deaths, light and serious injured being fixed in an ERA document (see section 3.1.5) With no information on the distribution of trespass consequences, we can focus on trespass causing no deaths or injuries (majority of cases), that may result delays linked to reduction in speed on the rail network (service or emergency braking, disruption in service, run on sight, restricted speed....). The cost of delay per time unit is considered in subsection 3.1.5.2. Performing a CBA from CEA would be easy to apply provided that all these input variables will be given, estimated or assumed.
4.4.5 Discussion and conclusions
The fact that there was a clear reduction in the frequency of trespassing at both test sites indicates that the measure worked as intended. The calculated effect was quite high -44% (-38…-50%) in Kirkkonummi and -18% (-6…-30%) in Tammisaari. However, because no control site was included in the study, the effect was not only the effect of the measure but included also the effects of other factors such as the changes in people’s needs to cross the railway, season of the year and weather, for example. It seems likely that the detected effect represent the upper boundaries of the real effect of the measure rather than the long term effects of possible similar installations. This is the case because in both pilot tests sites the conditions for walking were less favourable (less daylight hours, colder weather) in the after periods than in the before periods.
In principle, the effects could have been affected by the regression-to-the-mean; i.e. a statistical phenomenon meaning that if a variable is extreme on its first measurement, it will tend to be closer to the mean on its next measurement. It is not likely, however that the results were much contaminated by such regression tendency, because the sites were selected because of frequent trespassing during several years rather than only previous year, for example.
The large difference in the effect between test sites also indicates that the effect depends greatly on local circumstances, and perhaps also on safety culture of the society in general. For example, the effect can depend on the motives for illegal crossing and the distance to alternative (safe and legal) crossing facilities. Pedestrians who take the shortcut as part of their daily exercise could change their route easier than people who hurry to work in the morning. It is also easier to take another route if safe and legal crossing place is near compared to a situation where it is far away. It is also possible that the effect was smaller in Tammisaari because the speed of trains was lower there (typically about 50 km/h) than in Kirkkonummi (up to 120 km/h), and sites with slower train speed may be considered less dangerous.
In these pilot tests there was no real threat of punishment for illegal crossing, even though the sound message given to trespassers mentioned that crossing in this particular place was illegal and dangerous. Some people may have thought that there is also a possibility of punishment, but it is also possible that such fears diminished with time as there were no knowledge or rumours that somebody had actually been punished.
These pilot tests were not advertised in the media, and the perceptions of the public about the measure were based on their own experiences (and perhaps also the experiences of other people they know). In a way this may have increased the effect of the measure, because people remained uncertain about the possibility of punishment for trespassing. Media attention could also have increased the perception of dangers related to trespassing, and thus improved the effect.
It seems likely that adding media campaigns and true threat of punishment to video enforcement and sound warning, its effect on trespassing could be enhanced, at least in the short term. In order to maintain the effect high, media coverage should be maintained and include also information on issued penalties.
Overall, video enforcement combined with sound warning can reduce trespassing significantly. In the two pilot test sites the reduction in the frequency of trespassing was 18% and 44%. However, because of the lack of control sites the effect may have become somewhat overestimated. Those

RESTRAIL SCP1-GA-2011-285153
RESTRAIL-WP5-CIDAUT-D5.2-B2-24102014_public Page 81 of 168 24 October 2014
who are planning to implement a similar measure are advised to use an expected effect of the reduction of trespassing between 10% and 30%, depending on local circumstances, especially the distance to alternative legal crossing facilities.
The pilot test equipment operated on 12 V batteries, which had to be changed weekly. Otherwise the system seemed to work reliable with the exception of a breakdown of infrared sensor at the Tammisaari site (RESTRAIL Deliverable 5.1). The need for maintenance would be much reduced if mains power was used instead of batteries.
Video enforcement combined with sound warning suits best to locations where trespassing is concentrated in a limited area, such as a footpath across the railway, where detection of trespasser is more reliable and sound warnings are less likely to be disturbing to those living or moving in the neighbourhood, compared to sites where trespassing is spread to a wider area. Furthermore, mains power should be fairly easily available to avoid the need for frequent maintenance of the system. An obvious alternative to video enforcement and sound warning is fencing, which can be more effective, suits for limited locations where trespassing is concentrated on certain routes and does not need electricity.
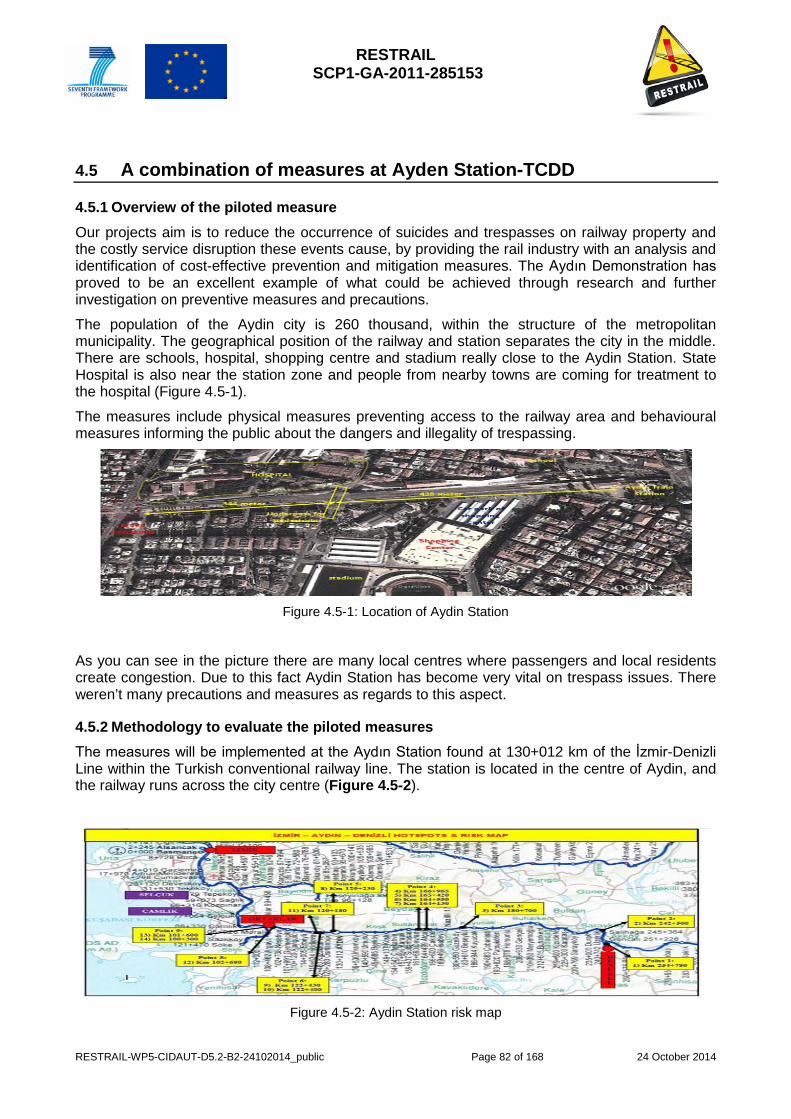
RESTRAIL SCP1-GA-2011-285153
RESTRAIL-WP5-CIDAUT-D5.2-B2-24102014_public Page 82 of 168 24 October 2014
4.5 A combination of measures at Ayden Station-TCDD
4.5.1 Overview of the piloted measure Our projects aim is to reduce the occurrence of suicides and trespasses on railway property and the costly service disruption these events cause, by providing the rail industry with an analysis and identification of cost-effective prevention and mitigation measures. The Aydın Demonstration has proved to be an excellent example of what could be achieved through research and further investigation on preventive measures and precautions.
The population of the Aydin city is 260 thousand, within the structure of the metropolitan municipality. The geographical position of the railway and station separates the city in the middle. There are schools, hospital, shopping centre and stadium really close to the Aydin Station. State Hospital is also near the station zone and people from nearby towns are coming for treatment to the hospital (Figure 4.5-1).
The measures include physical measures preventing access to the railway area and behavioural measures informing the public about the dangers and illegality of trespassing.
Figure 4.5-1: Location of Aydin Station
As you can see in the picture there are many local centres where passengers and local residents create congestion. Due to this fact Aydin Station has become very vital on trespass issues. There weren’t many precautions and measures as regards to this aspect.
4.5.2 Methodology to evaluate the piloted measures The measures will be implemented at the Aydın Station found at 130+012 km of the İzmir-Denizli Line within the Turkish conventional railway line. The station is located in the centre of Aydin, and the railway runs across the city centre (Figure 4.5-2).
Figure 4.5-2: Aydin Station risk map

RESTRAIL SCP1-GA-2011-285153
RESTRAIL-WP5-CIDAUT-D5.2-B2-24102014_public Page 83 of 168 24 October 2014
The TCDD Accident/Incident Reports related to the last 3 years have been investigated. According to the results the Torbalı-Aydın-Denizli line has been detected as the most frequent trespass area. Consequently:
- 20 risk points are precisely defined.
-On 3rd of February 2013 TCDD Team has visited these points on site and gathered required data.
-On April 2013 20 risk points have been narrowed down to 9 according to the project members perspective (Table 4.5-1).
Table 4.5-1: Descriptions of all measures implemented at Aydin station
Title of measure Description
1
Cancellation of one of the two gates that has been used for logistics centre and arranging the second gate to be automated and locked.
There were two gates the logistics centre used - one has been cancelled by building 10 metres of wall and the other gate is made into automated gate door.4 metres fencing is made in addition
2
Fencing to the end platform where there was the main getaway point towards the lines.
11 metres of fence has been built
3 Extending the fence between 1st and 2nd platforms
120 metres of fence extension
4
Fencing the hospital side of the Station Area and rebuilding of fence on top of the short wall that borders the area.
384 metres of fencing +60 metres
5
Fencing towards IZMIR direction from the level crossing.
180 metres of fencing
6 2 IP Cameras in order to collect data.
2 cameras are placed - one at the level crossing and the other at the end of the platform
7
Anti-trespass panels below level crossing and at the end of the platform.
30 square metres at the level crossing and 21 square metres at the end of the platform.
8
Warning Signs and Posters
Non-technical precaution is taken in several spots for directing to safe paths. Approximately 4 different styles of warning sign at related areas and in total 50 sticker signs which are at the ground directing to hospital and city centres.
9
Leaflets
5000 pcs have been printed out and distributed to local citizens and passengers. These leaflets are describing the safety ways via a small map and also indicating the measures that are taken in respect of ensuring correct direction.
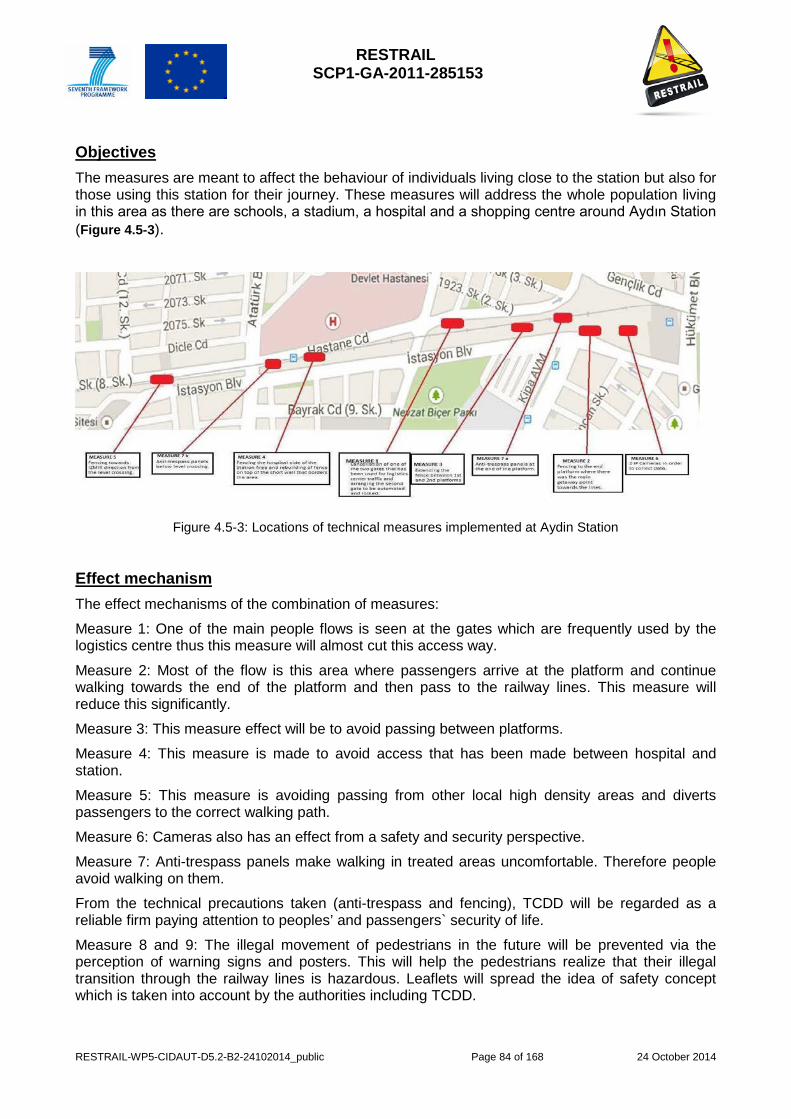
RESTRAIL SCP1-GA-2011-285153
RESTRAIL-WP5-CIDAUT-D5.2-B2-24102014_public Page 84 of 168 24 October 2014
Objectives The measures are meant to affect the behaviour of individuals living close to the station but also for those using this station for their journey. These measures will address the whole population living in this area as there are schools, a stadium, a hospital and a shopping centre around Aydın Station (Figure 4.5-3).
Figure 4.5-3: Locations of technical measures implemented at Aydin Station
Effect mechanism The effect mechanisms of the combination of measures:
Measure 1: One of the main people flows is seen at the gates which are frequently used by the logistics centre thus this measure will almost cut this access way.
Measure 2: Most of the flow is this area where passengers arrive at the platform and continue walking towards the end of the platform and then pass to the railway lines. This measure will reduce this significantly.
Measure 3: This measure effect will be to avoid passing between platforms.
Measure 4: This measure is made to avoid access that has been made between hospital and station.
Measure 5: This measure is avoiding passing from other local high density areas and diverts passengers to the correct walking path.
Measure 6: Cameras also has an effect from a safety and security perspective.
Measure 7: Anti-trespass panels make walking in treated areas uncomfortable. Therefore people avoid walking on them.
From the technical precautions taken (anti-trespass and fencing), TCDD will be regarded as a reliable firm paying attention to peoples’ and passengers` security of life.
Measure 8 and 9: The illegal movement of pedestrians in the future will be prevented via the perception of warning signs and posters. This will help the pedestrians realize that their illegal transition through the railway lines is hazardous. Leaflets will spread the idea of safety concept which is taken into account by the authorities including TCDD.
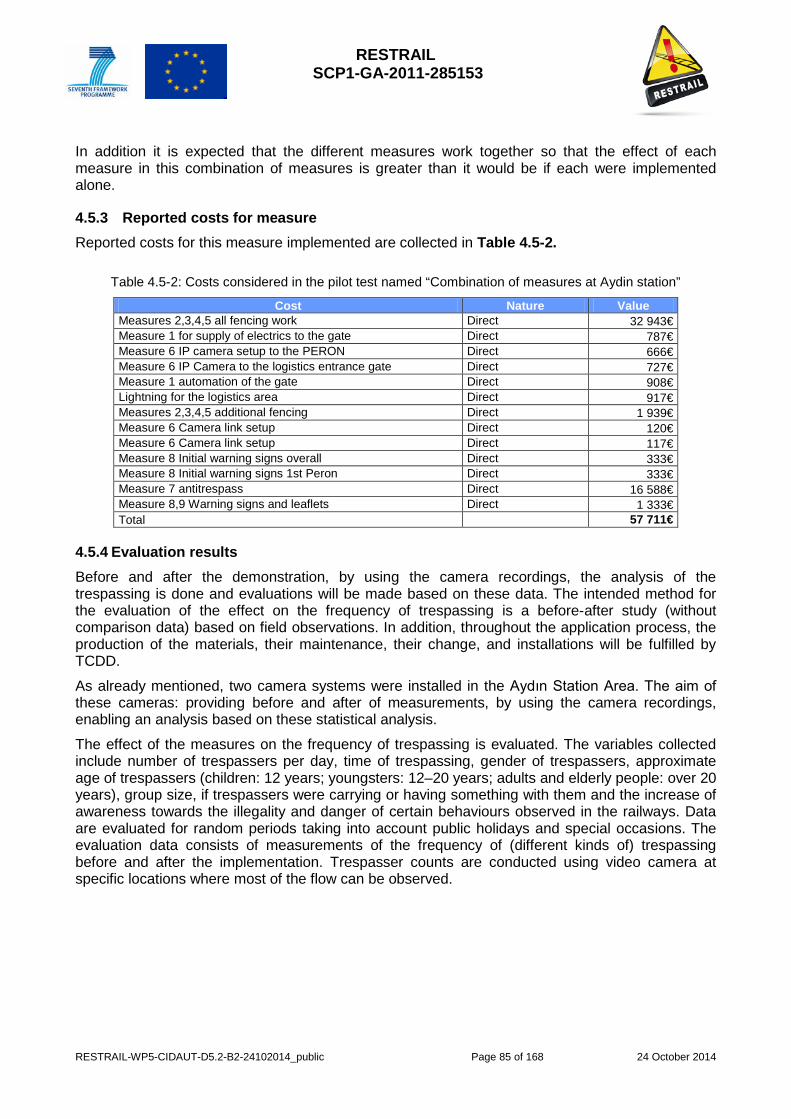
RESTRAIL SCP1-GA-2011-285153
RESTRAIL-WP5-CIDAUT-D5.2-B2-24102014_public Page 85 of 168 24 October 2014
In addition it is expected that the different measures work together so that the effect of each measure in this combination of measures is greater than it would be if each were implemented alone.
4.5.3 Reported costs for measure Reported costs for this measure implemented are collected in Table 4.5-2.
Table 4.5-2: Costs considered in the pilot test named “Combination of measures at Aydin station”
Cost Nature Value Measures 2,3,4,5 all fencing work Direct 32 943€ Measure 1 for supply of electrics to the gate Direct 787€ Measure 6 IP camera setup to the PERON Direct 666€ Measure 6 IP Camera to the logistics entrance gate Direct 727€ Measure 1 automation of the gate Direct 908€ Lightning for the logistics area Direct 917€ Measures 2,3,4,5 additional fencing Direct 1 939€ Measure 6 Camera link setup Direct 120€ Measure 6 Camera link setup Direct 117€ Measure 8 Initial warning signs overall Direct 333€ Measure 8 Initial warning signs 1st Peron Direct 333€ Measure 7 antitrespass Direct 16 588€ Measure 8,9 Warning signs and leaflets Direct 1 333€ Total 57 711€
4.5.4 Evaluation results Before and after the demonstration, by using the camera recordings, the analysis of the trespassing is done and evaluations will be made based on these data. The intended method for the evaluation of the effect on the frequency of trespassing is a before-after study (without comparison data) based on field observations. In addition, throughout the application process, the production of the materials, their maintenance, their change, and installations will be fulfilled by TCDD.
As already mentioned, two camera systems were installed in the Aydın Station Area. The aim of these cameras: providing before and after of measurements, by using the camera recordings, enabling an analysis based on these statistical analysis.
The effect of the measures on the frequency of trespassing is evaluated. The variables collected include number of trespassers per day, time of trespassing, gender of trespassers, approximate age of trespassers (children: 12 years; youngsters: 12–20 years; adults and elderly people: over 20 years), group size, if trespassers were carrying or having something with them and the increase of awareness towards the illegality and danger of certain behaviours observed in the railways. Data are evaluated for random periods taking into account public holidays and special occasions. The evaluation data consists of measurements of the frequency of (different kinds of) trespassing before and after the implementation. Trespasser counts are conducted using video camera at specific locations where most of the flow can be observed.
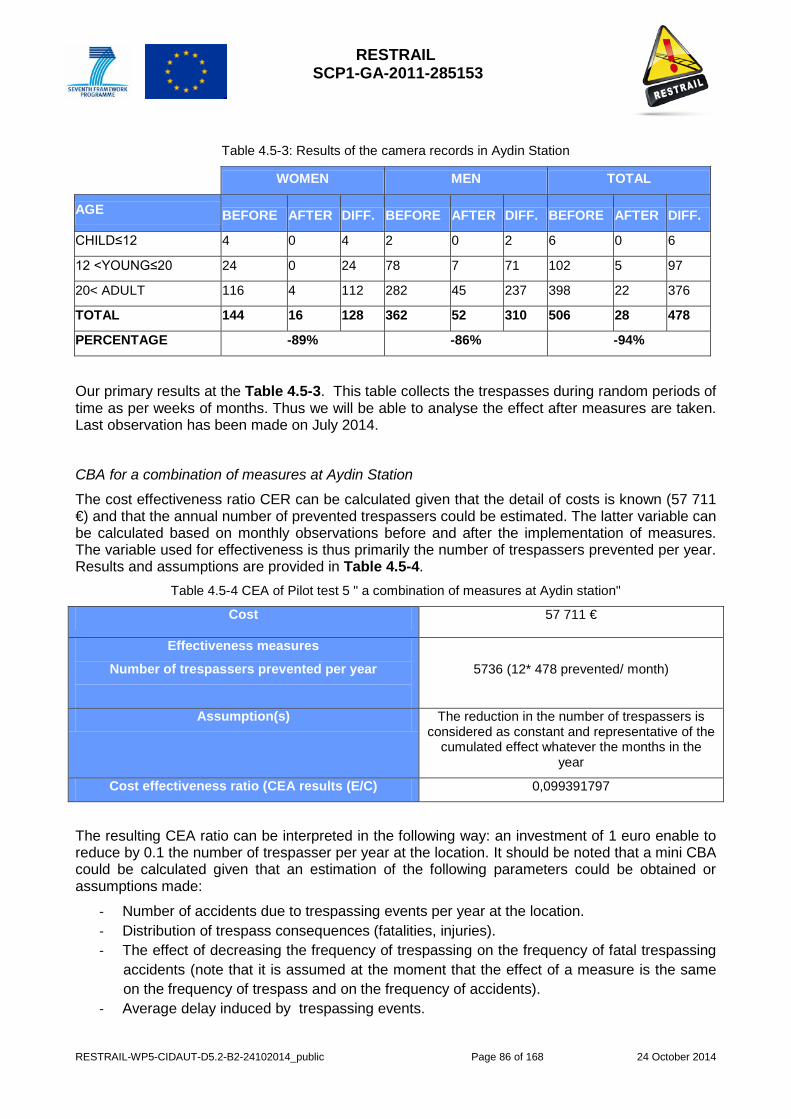
RESTRAIL SCP1-GA-2011-285153
RESTRAIL-WP5-CIDAUT-D5.2-B2-24102014_public Page 86 of 168 24 October 2014
Table 4.5-3: Results of the camera records in Aydin Station
WOMEN MEN TOTAL
AGE BEFORE AFTER DIFF. BEFORE AFTER DIFF. BEFORE AFTER DIFF.
CHILD≤12 4 0 4 2 0 2 6 0 6
12 <YOUNG≤20 24 0 24 78 7 71 102 5 97
20< ADULT 116 4 112 282 45 237 398 22 376
TOTAL 144 16 128 362 52 310 506 28 478
PERCENTAGE -89% -86% -94%
Our primary results at the Table 4.5-3. This table collects the trespasses during random periods of time as per weeks of months. Thus we will be able to analyse the effect after measures are taken. Last observation has been made on July 2014.
CBA for a combination of measures at Aydin Station
The cost effectiveness ratio CER can be calculated given that the detail of costs is known (57 711 €) and that the annual number of prevented trespassers could be estimated. The latter variable can be calculated based on monthly observations before and after the implementation of measures. The variable used for effectiveness is thus primarily the number of trespassers prevented per year. Results and assumptions are provided in Table 4.5-4.
Table 4.5-4 CEA of Pilot test 5 " a combination of measures at Aydin station"
Cost 57 711 €
Effectiveness measures
Number of trespassers prevented per year
5736 (12* 478 prevented/ month)
Assumption(s) The reduction in the number of trespassers is considered as constant and representative of the
cumulated effect whatever the months in the year
Cost effectiveness ratio (CEA results (E/C) 0,099391797
The resulting CEA ratio can be interpreted in the following way: an investment of 1 euro enable to reduce by 0.1 the number of trespasser per year at the location. It should be noted that a mini CBA could be calculated given that an estimation of the following parameters could be obtained or assumptions made:
- Number of accidents due to trespassing events per year at the location. - Distribution of trespass consequences (fatalities, injuries). - The effect of decreasing the frequency of trespassing on the frequency of fatal trespassing
accidents (note that it is assumed at the moment that the effect of a measure is the same on the frequency of trespass and on the frequency of accidents).
- Average delay induced by trespassing events.
RESTRAIL SCP1-GA-2011-285153
RESTRAIL-WP5-CIDAUT-D5.2-B2-24102014_public Page 87 of 168 24 October 2014
4.5.5 Applicability of results to different circumstances The following information was used in this study:
- Type of Incident/Accident
- Date of Incident/Accident
- Place of Incident/Accident
- Kilometer of Incident/Accident
- Type of Train
- Casualties
- The number of wounded
- Cause of the event
It is not known whether similar combinations of measures against trespassing in railway area have been implemented before in TCDD. Nor are there results on the frequency of trespassing or trespassing accidents of such approaches.
The variables collected will include the frequency of trespassing, the information of number-age-gender, etc., and the increase of awareness towards the illegality and danger of certain behaviours observed in the railways.
The evaluation data consists of measurements of the frequency of (different kinds of) trespassing before and after the implementation. Trespasser counts will be conducted using video cameras.
Data of the costs of the measures will be collected by TCDD throughout the implementation process, and the cost components include material, installation of these material, maintenance and implementation costs.
4.5.6 Discussion Planned technical and non-technical precautions included cancelling the gate used by the logistics centre and controlling the other gate or keeping it locked, installing and manufacturing warning signs and posters, also distributing leaflets to the passengers at the station on certain days. These precautions are not complicated because they are undertaken on a local basis.
However, the installation of fencing can be difficult in hot spots and in relation to rail operations safety depending on the scope of the project, so audit and control should be done during installation.
TCDD will be installing anti-trespass panels for the first time in Aydin Station. Therefore, the technical team of TCDD has started research related to anti-trespass panels.
To be concluded that project, we have identified tangible benefits from the actions taken. Many people have taken notice of the changes and warnings provided resulting in reduced trespassing hence increased safety
RESTRAIL SCP1-GA-2011-285153
RESTRAIL-WP5-CIDAUT-D5.2-B2-24102014_public Page 88 of 168 24 October 2014
4.6 Mid-platform fencing-U.NOT
4.6.1 Overview of the piloted measure Mid-platform fencing (fencing along the centre line of island platforms) prevents access to fast lines where trains are not scheduled to stop. The measure therefore only targets those who choose fast lines and non-stopping trains for the purpose of suicide. There are situations where passengers will need access to trains on the fast lines (to get on / off trains at peak times or for unscheduled stops), therefore it is necessary to include closable (sometimes lockable) gates along the length of the platform, in the design of the fence. This type of fencing has been implemented at a number of stations in GB by Network Rail. In addition, this measure is often supplemented by the provision of additional fencing to restrict access to fast lines at the stations, either at lone platforms that are used rarely by stopping trains or at the platform end ramps.
This field test focused on three pilot areas in GB around London, including 51 stations (20 on the Western route, 23 on the London North West route and 8 on the Sussex route). Access has been restricted through mid-platform fencing at 23 of these stations as part of recent programmes of suicide prevention. Access to fast lines is restricted to some degree at 17 additional stations (the different types of restrictions will be described in this report). There are no restrictions on access to fast lines at 11 stations. There are a wide range of factors that can influence the numbers of incidents at these stations. This pilot test therefore aimed to collect evidence about the potential outcomes from implementation of measures to restrict access to the fast lines. Of equal importance to the evaluation, detailed, descriptive evidence has been collected on the implementation of the fencing at stations.
4.6.2 Methodology to evaluate the piloted measure The evaluation addressed the following questions:
− Does installing mid platform fencing lead to a reduction in suicides on the rail network?
− How has the programme been introduced and implemented at the target locations (e.g. including progress with implementation of the programme, variations in levels of implementation, whether it has been implemented as it was intended)?
− Does installing mid platform fencing lead to other positive or negative operational impacts on the railway (e.g. a reduction in disruption caused by rail suicides on the rail network; impacts on passenger flows or movements on the platform, passenger satisfaction of the platform environment)? Are there any intended and unintended outcomes and any unexpected benefits or problems?
− Does the intervention work in relation to specific situations or contexts, or for certain groups of individuals (e.g. age, gender)? Does it work for some rather than others? Does it reach the target group?
− Are there changes in numbers of incidents? If so, can these be attributed to the intervention or are there other factors (including other interventions) that could have influenced the outcomes?
− Which factors contributed to the success (or not) of the programme?
− What obstacles have been identified and how have these been overcome?
− Is there anything that could have been done to improve installation?
RESTRAIL SCP1-GA-2011-285153
RESTRAIL-WP5-CIDAUT-D5.2-B2-24102014_public Page 89 of 168 24 October 2014
A logic map, given in full in Figure 4.6-1, has been created following the guidance of Hills (2010), to help with structuring the collection and analysis of data for this evaluation. The map clarifies the overall objectives of the mid-platform fencing intervention and the context in which the intervention is implemented. Important steps that are thought to be needed to realise the objectives of reducing suicides on fast lines and unauthorised access to these fast lines are outlined.These steps are described as a series of inputs, outputs, outcomes and impacts, as defined and explained by Hills (2010).
The logic map covers a wide range of issues and highlights the opportunities for the collection of the data that are needed to establish links that are implied within the logic of the diagram. Each of the components of the map has been coded (A1-D3), to enable cross-referencing with more detailed tables of data and explanatory information.
This type of logic map has been valuable in setting out the different aspects of the rail environment and the organisational and individual factors that are important in understanding how mid-platform fencing can contribute to the reduction of the problem of rail suicide. The map is a useful resource that can be used to identify gaps or opportunities to enhance aspects of the evaluation (e.g. refining the analysis by using the logic within the mapping to prescribe new searches for data to establish how fencing may impact on the prevention of rail suicide and trespass).
The evaluation focused on the collection and analysis of three types of data:
− Statistical data on incidents;
− Descriptive data on stations and the details (dates and types) of different fencing interventions (including descriptive data on the process of implementing the intervention);
− Information on stakeholder perceptions of the intervention from interviews and other relevant sources (e.g. analysis of content from an on-line rail forum).
A detailed account of the method for collecting and analysing the different data for the evaluation has been given in the RESTRAIL D5.1 (Kallberg, Plaza, Silla, García et al, 2014). The following sections contain an overview of the main data types that have been used within this evaluation and the general details of the methods of data collection and analysis.
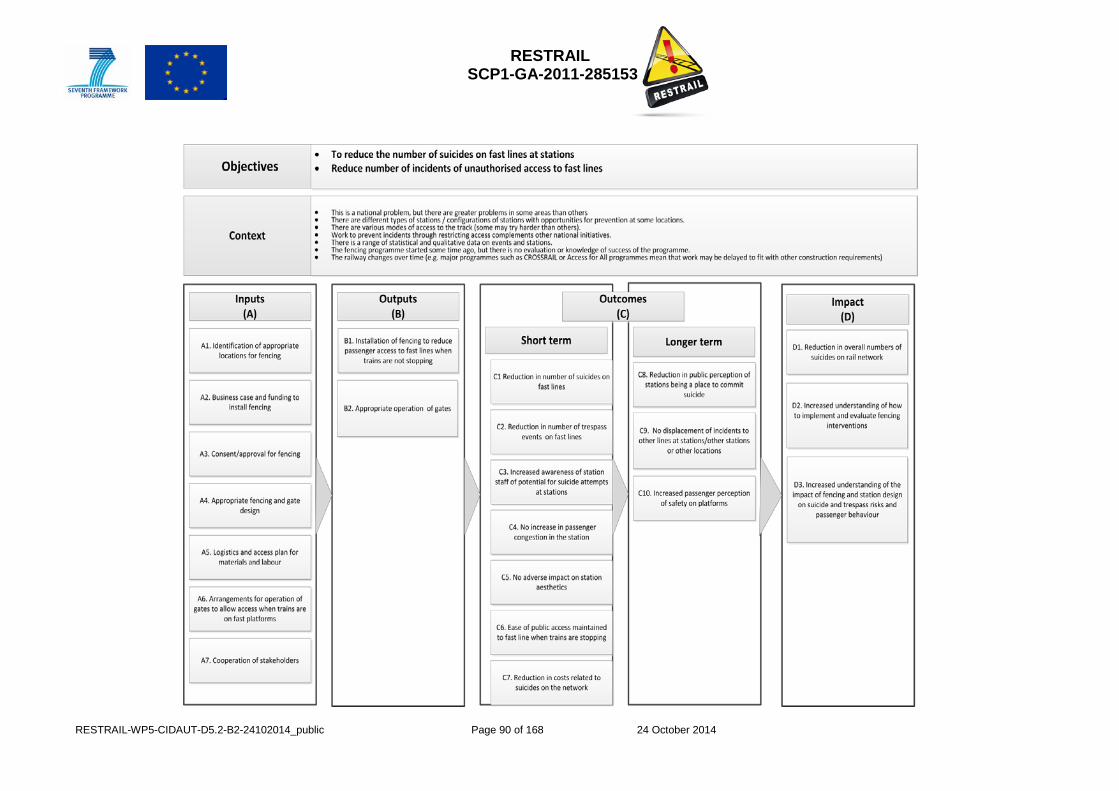
RESTRAIL SCP1-GA-2011-285153
RESTRAIL-WP5-CIDAUT-D5.2-B2-24102014_public Page 90 of 168 24 October 2014
RESTRAIL SCP1-GA-2011-285153
RESTRAIL-WP5-CIDAUT-D5.2-B2-24102014_public Page 91 of 168 24 October 2014
Figure 4.6-1: Logic map for the evaluation
Statistical data on incidents (results are reported in section 4.6.4.1, below)
It was intended that the evaluation would attempt to produce preliminary estimates of the effect of restricting access to fast lines through mid-platform and associated fencing. It was acknowledged at the outset that it would be difficult to demonstrate significant changes in the numbers of fatalities over the course of the monitoring period, because of the relatively small numbers of incidents and the likely variability in the incidents at any particular location. The period of monitoring after the implementation of the fencing was also short, ranging from the introduction of fencing within the last year for many stations, to as many as 5 years ago for two stations. There were also stations within the pilot areas where access has been restricted to fast lines for many years, due to the design and configuration of the station. For example, there are some pre-existing fences between fast and slow lines. In some locations fast and slow lines are separated by distance or in others the configuration of the station buildings may restrict access to the fast lines. It was therefore possible to look in more detail at the different characteristics of these stations to see how the restriction of access to fast lines, over a longer period of time, could influence the numbers of incidents on fast and slow lines at these locations.
The analysis of the potential impact of the restriction of access to fast lines used data on incidents over a period of approximately 20 years from the industry safety management system (SMIS). This was supplemented by incident data that were held by staff in each of the pilot test routes (e.g. event review forms and performance review reports were available for some recent incidents). This type of evidence was used to clarify the specific locations of incidents (especially the line on which the incident occurred) and other details of the event.
This analysis therefore covered the periods before and after the provision of fencing and any other interventions at many of these stations. These data have been reviewed, classified and analysed to produce descriptive statistics for a range of variables that are relevant to the type of event, location and circumstances associated with the event. These include mean values across the three routes, upper and lower limits to show the range for each data type across the three areas in the pilot test areas).
Descriptive data on stations and the details of different fencing interventions (results are reported in section 4.6.4.2, below)
It was important to consider that there are a range of local circumstances and other preventative measures in place that could impact on the numbers of incidents at stations. Detailed descriptive evidence was therefore collected about the stations in the trial areas and the implementation of the fencing (including the layouts and configurations of stations, other preventative measures at the stations, the extent to which the fencing has been implemented in each of the three railway routes, descriptions of the process of implementing the fencing, and factors affecting implementation of the fencing).
Data were collected from the following:
• reports and documents (design documents, plans, consultancy, period end summaries etc.);
• consultation with route based staff / programme staff at each of the pilots.
The evidence was collated to produce text based descriptions for each station. Summaries were produced and included within tables to enable comparisons on the following categories of information:

RESTRAIL SCP1-GA-2011-285153
RESTRAIL-WP5-CIDAUT-D5.2-B2-24102014_public Page 92 of 168 24 October 2014
• Incident history (dates, locations / lines, descriptive details of incidents where available) • Preventative measures – fencing (including mid-platform fencing, dates of implementation
and other fencing or the means of restricting access to the fast lines • Preventative measures – other (summarised in text, and in a tabular format to enable
comparisons) • Descriptions of layouts and configurations of platforms / lines • Station characteristics / station operation (staffing, opening times, management of stations,
other operational aspects such as passenger movement) • Local area / socioeconomic details (provided for a small sample of stations by local staff
and from reports from British Transport Police for several stations) • Train services (including numbers of stopping and non-stopping trains, summarised within
tables • Footfall, passenger numbers.
Descriptive content and diagrams from rail industry documents were used to produce simplified schematic diagrams. These were produced to illustrate important features of the configuration of stations (platforms and line descriptions), as well as the types of restrictions to access to fast lines that have been introduced in the recent fencing programmes (or other restrictions as a result of the historic design and construction of the station and infrastructure).
Descriptive data on the implementation of the fencing interventions (results are reported in section 4.6.4.3, below)
Descriptive data have been collected on the process of implementing the mid-platform fencing (results are reported in Section 4.6.4.3, below). This was largely based on the information that was provided by representatives from one of the routes (Western), but also included review of some programme documentation from the other two routes (LNW, Sussex). This included the following:
• review of content from design documents, architectural plans and consultancy reports; • review of monthly reports (period end summaries) on progress with different phases of the
work at stations; • consultation with route based staff / programme staff; • interviews with a small sample of staff involved in the development and implementation of
the mid-platform fencing programmes.
Analyses have been conducted to identify important elements of the implementation process and to record relevant timings (the start and end points of different phases of the process, where the content of reports would allow this) for the progress of the work across the 10 stations where mid-platform fencing has been installed within this route. A summary diagram, plotting the progress with different phases of the programme has been prepared from the data from this route.
Linking data on incidents at or near stations to details of the restriction of access (the results of this analysis are reported in section 4.6.4.4, below)
Data on fatality incidents (collated in work that has been reported in 4.6.4.1) were combined with information on interventions at stations (section 4.6.4.2). Tables were constructed to display the fatality incidents on each line at a station by year (from 1994-2014). The dates of fencing interventions were also recorded within these tables.
Collecting data on what people think of the mid-platform fencing intervention (results are reported in section 4.6.4.5, below).
Data on the perception of stakeholders have been collected by two methods:
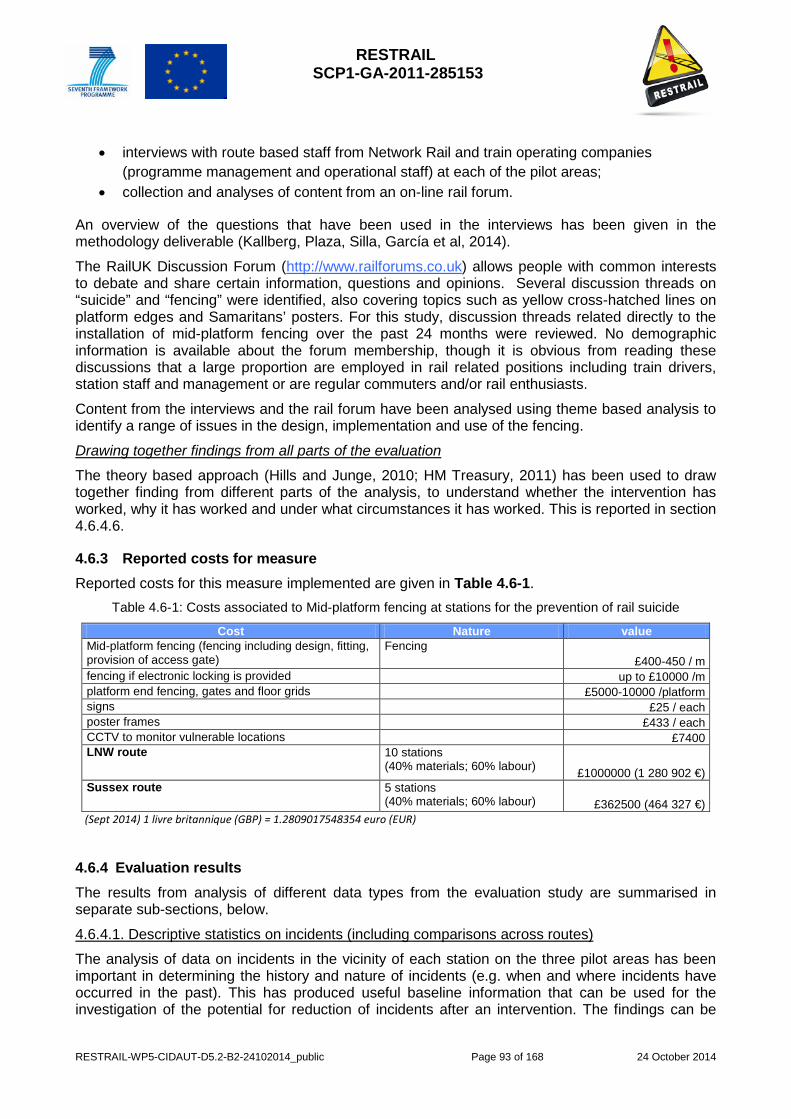
RESTRAIL SCP1-GA-2011-285153
RESTRAIL-WP5-CIDAUT-D5.2-B2-24102014_public Page 93 of 168 24 October 2014
• interviews with route based staff from Network Rail and train operating companies (programme management and operational staff) at each of the pilot areas;
• collection and analyses of content from an on-line rail forum.
An overview of the questions that have been used in the interviews has been given in the methodology deliverable (Kallberg, Plaza, Silla, García et al, 2014).
The RailUK Discussion Forum (http://www.railforums.co.uk) allows people with common interests to debate and share certain information, questions and opinions. Several discussion threads on “suicide” and “fencing” were identified, also covering topics such as yellow cross-hatched lines on platform edges and Samaritans’ posters. For this study, discussion threads related directly to the installation of mid-platform fencing over the past 24 months were reviewed. No demographic information is available about the forum membership, though it is obvious from reading these discussions that a large proportion are employed in rail related positions including train drivers, station staff and management or are regular commuters and/or rail enthusiasts.
Content from the interviews and the rail forum have been analysed using theme based analysis to identify a range of issues in the design, implementation and use of the fencing.
Drawing together findings from all parts of the evaluation
The theory based approach (Hills and Junge, 2010; HM Treasury, 2011) has been used to draw together finding from different parts of the analysis, to understand whether the intervention has worked, why it has worked and under what circumstances it has worked. This is reported in section 4.6.4.6.
4.6.3 Reported costs for measure Reported costs for this measure implemented are given in Table 4.6-1.
Table 4.6-1: Costs associated to Mid-platform fencing at stations for the prevention of rail suicide Cost Nature value
Mid-platform fencing (fencing including design, fitting, provision of access gate)
Fencing £400-450 / m
fencing if electronic locking is provided up to £10000 /m platform end fencing, gates and floor grids £5000-10000 /platform signs £25 / each poster frames £433 / each CCTV to monitor vulnerable locations £7400 LNW route 10 stations
(40% materials; 60% labour) £1000000 (1 280 902 €) Sussex route 5 stations
(40% materials; 60% labour) £362500 (464 327 €) (Sept 2014) 1 livre britannique (GBP) = 1.2809017548354 euro (EUR)
4.6.4 Evaluation results The results from analysis of different data types from the evaluation study are summarised in separate sub-sections, below.
4.6.4.1. Descriptive statistics on incidents (including comparisons across routes)
The analysis of data on incidents in the vicinity of each station on the three pilot areas has been important in determining the history and nature of incidents (e.g. when and where incidents have occurred in the past). This has produced useful baseline information that can be used for the investigation of the potential for reduction of incidents after an intervention. The findings can be
RESTRAIL SCP1-GA-2011-285153
RESTRAIL-WP5-CIDAUT-D5.2-B2-24102014_public Page 94 of 168 24 October 2014
used to understand the characteristics of each of the areas that have been included in the pilot tests, including judgements on how far it is possible to generalise with the findings to the wider population of stations in GB (or more widely in Europe).
The analysis has produced statistics on the following:
• Numbers of different types of incidents (e.g. suicide, trespass fatality, attempted suicide), in various locations (e.g. such as stations, whether incidents are at or outside stations, the line of incident, access points),
• Time of the event (day, month, year, time of day, classification of lighting conditions such as daylight or dark, whether peak or off-peak),
• Individual data (sex, age, mental health, social or other problems) • Other data types (whether there are witnesses to the event, delay time and costs – where
available) Issues at particular locations (examples of patterns of incidents at specific stations, notable
incidents) • Immediate and pre-cursor behaviours of people involved in incidents. There were a range of different incident types (e.g. suicide, accidental fatality, attempted suicide). All fatalities, except those that have been given a clear accident classification (and which are likely to be of a different nature to rail suicide events), were selected for further study in this part of the project. The analysis therefore included open verdicts, narrative verdicts and a very small number of cases in which the cause is not known. This investigation is focusing on understanding as much as possible about the potential for preventive suicides. Whilst a small number of these fatalities have not been classified as suicides officially, there are aspects of the events (e.g. similar prior behaviours and similar modes of access to the railway) that are relevant to understanding how to improve the prevention of rail suicide related events, even if there has not been a clear determination of the intention to commit suicide in these situations. It was clear that there were some differences in recording of data by route. For example, the numbers of attempted suicide events were much higher on one route than the other two routes. This is likely to be explained by differences in recording practices, rather than differences in the number of incidents of this type. Therefore, attempted suicide incidents are not analysed in this current evaluation. A more complete analysis of attempted suicide events will be carried out in the near future when we will receive more reliable data from the British Transport Police on these non-fatality events. This analysis will not be reported in the deliverable for RESTRAIL, but will be used to update results of the mid-platform fencing evaluation on the RESTRAIL toolbox, which will be maintained after the completion of the project. The analysis has demonstrated that there are high numbers of incidents at stations (and particularly at fast lines at stations) within these pilot areas. The proportion of incidents at stations is much higher than the proportion nationally (approximately 40% nationally). Very few events occurred at crossings, which have been closed some years ago on these lines, because of the speed and frequency of traffic in these areas close to London. A small proportion of the events involved jumps from bridges onto the track. These findings demonstrate the relevance of applying a station based preventative measure in these areas. Nevertheless, there are still an appreciable number of incidents on slower lines (22-43%). The analysis (section 4.6.3.4) considers the question of whether the introduction of fast line fencing, might make the other slower lines more attractive to people as a place for suicide (i.e. a displacement effect). The analysis has produced preliminary classifications of some of the mental health and social problems that have been reported in the incident databases. These types of problems are only recorded in a small proportion of events in the database. For example, mental health history is only
RESTRAIL SCP1-GA-2011-285153
RESTRAIL-WP5-CIDAUT-D5.2-B2-24102014_public Page 95 of 168 24 October 2014
mentioned in the databases for one fifth to one quarter of those involved in events. It is not known if this reflects the true proportion of people experiencing these problems in this population, or whether this is indicative of lack of knowledge or limitations of recording of mental health history of those involved. The analysis is reliant on the data that have been available. If a fact is not recorded in the databases (also relevant to data on whether there were witnesses to the event, if access was from the platform end, train type) it is unlikely to be included in findings. A high degree of effort was needed to classify the line of the incident as there was no specific field in existing databases. This was crucial information for understanding the likely impact of mid-platform fencing, which is designed to prevent access from fast line platforms. Details of the line on which incidents occurred were usually recorded within a text field, but it was sometimes necessary to identify this from the recorded details of headcode of the train (if these were available). There were a small number of incidents where it was not possible to determine the line on which the incident occurred, particularly with the older data, where fewer details were available. There was often a lack of descriptive data in the narrative fields in the incident database, such as on behaviours of people in the period leading up to the events or the point of access to the railway. During this analysis, it was evident that people often crossed over one or more lines in incidents at certain stations where access to fast lines is restricted. However, this was not always explicit within the text and needed to be inferred from knowledge of the location of the point of impact and knowledge of the configuration of the station and local infrastructure (i.e. the type of information that is compiled in Section 4.6.4.2, below). In spite of the gaps in the descriptive data, the current analysis has been successful in collating enough detail on behaviours leading up to events, identifying much common behaviour, but also a number of anomalous behaviours).This descriptive detail on the events was used to extend earlier classifications of this kind (e.g. on the jumping, lying and wandering prior to suicide events). It is possible to make comparisons with national data (national SMIS data) (e.g. see numbers of event at stations above) and international data. Findings on some other data types are broadly consistent with other national and European findings (as reported in the RESTRAIL deliverable in Work package 1, for example for time of day, peak / off peak). More detailed analysis could be carried out in future work. 4.6.4.2. Descriptions of stations and preventative measures The collection and analysis of descriptive information from stations has been necessary to understand the circumstances at the different stations, within and across each of the three pilot test areas. This has been important in developing an in-depth understanding of some of the less well known differences between the configurations of lines and platforms at stations, preventative measures and local circumstances across each of the stations. All of these could influence the numbers of incidents at stations. Aspects of these have been used in determining the potential impacts of the restriction of access to fast lines on the reduction of suicide incidents (Section 4.6.4.4).
This section of the report therefore contains general explanatory text which summarises the data that have been collected across the stations and pilot areas, based in observations, photographs, and discussions with route based staff and detail from various reports and industry documents.
Information on the location of incidents in the vicinity of stations (especially on which line incidents occur) is important in understanding the potential impact of the mid-platform fencing initiative. The description of the mid-platform fencing measures includes details of when and where the fencing was fitted. This also includes specific characteristics of the location that might have had an impact on the decision to fit fencing and the design and implementation of the fencing measures.
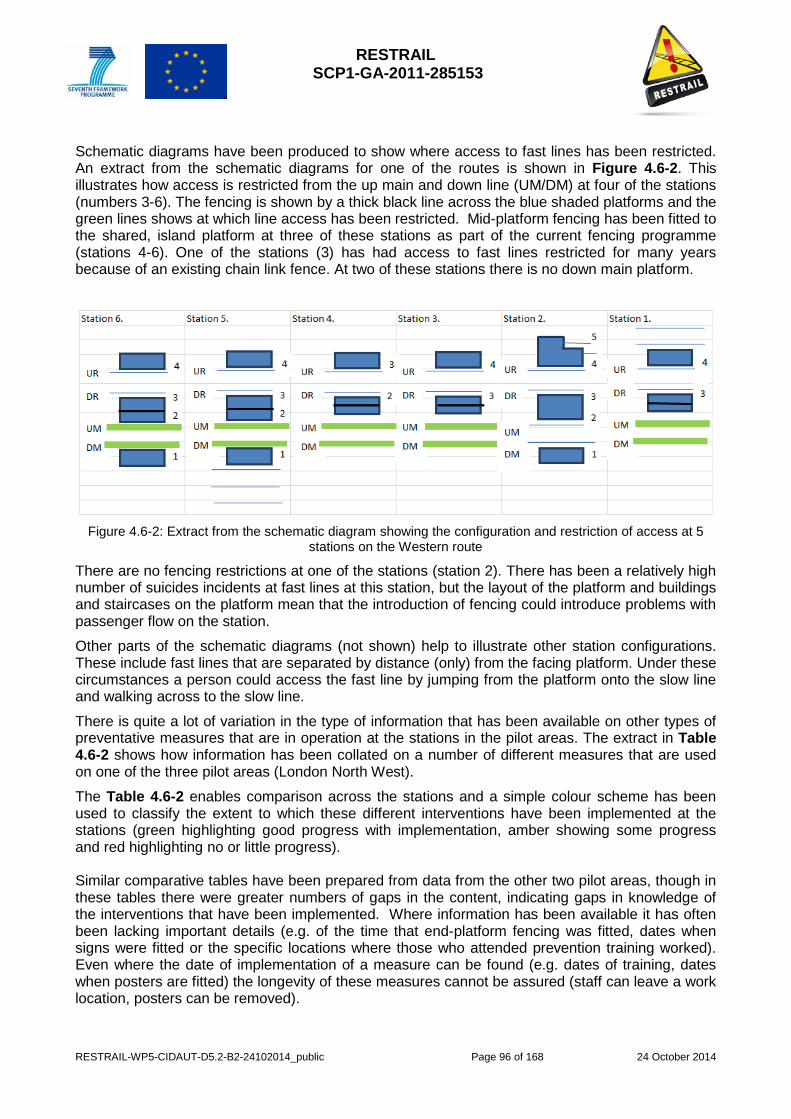
RESTRAIL SCP1-GA-2011-285153
RESTRAIL-WP5-CIDAUT-D5.2-B2-24102014_public Page 96 of 168 24 October 2014
Schematic diagrams have been produced to show where access to fast lines has been restricted. An extract from the schematic diagrams for one of the routes is shown in Figure 4.6-2. This illustrates how access is restricted from the up main and down line (UM/DM) at four of the stations (numbers 3-6). The fencing is shown by a thick black line across the blue shaded platforms and the green lines shows at which line access has been restricted. Mid-platform fencing has been fitted to the shared, island platform at three of these stations as part of the current fencing programme (stations 4-6). One of the stations (3) has had access to fast lines restricted for many years because of an existing chain link fence. At two of these stations there is no down main platform.
Figure 4.6-2: Extract from the schematic diagram showing the configuration and restriction of access at 5
stations on the Western route
There are no fencing restrictions at one of the stations (station 2). There has been a relatively high number of suicides incidents at fast lines at this station, but the layout of the platform and buildings and staircases on the platform mean that the introduction of fencing could introduce problems with passenger flow on the station.
Other parts of the schematic diagrams (not shown) help to illustrate other station configurations. These include fast lines that are separated by distance (only) from the facing platform. Under these circumstances a person could access the fast line by jumping from the platform onto the slow line and walking across to the slow line.
There is quite a lot of variation in the type of information that has been available on other types of preventative measures that are in operation at the stations in the pilot areas. The extract in Table 4.6-2 shows how information has been collated on a number of different measures that are used on one of the three pilot areas (London North West).
The Table 4.6-2 enables comparison across the stations and a simple colour scheme has been used to classify the extent to which these different interventions have been implemented at the stations (green highlighting good progress with implementation, amber showing some progress and red highlighting no or little progress). Similar comparative tables have been prepared from data from the other two pilot areas, though in these tables there were greater numbers of gaps in the content, indicating gaps in knowledge of the interventions that have been implemented. Where information has been available it has often been lacking important details (e.g. of the time that end-platform fencing was fitted, dates when signs were fitted or the specific locations where those who attended prevention training worked). Even where the date of implementation of a measure can be found (e.g. dates of training, dates when posters are fitted) the longevity of these measures cannot be assured (staff can leave a work location, posters can be removed).
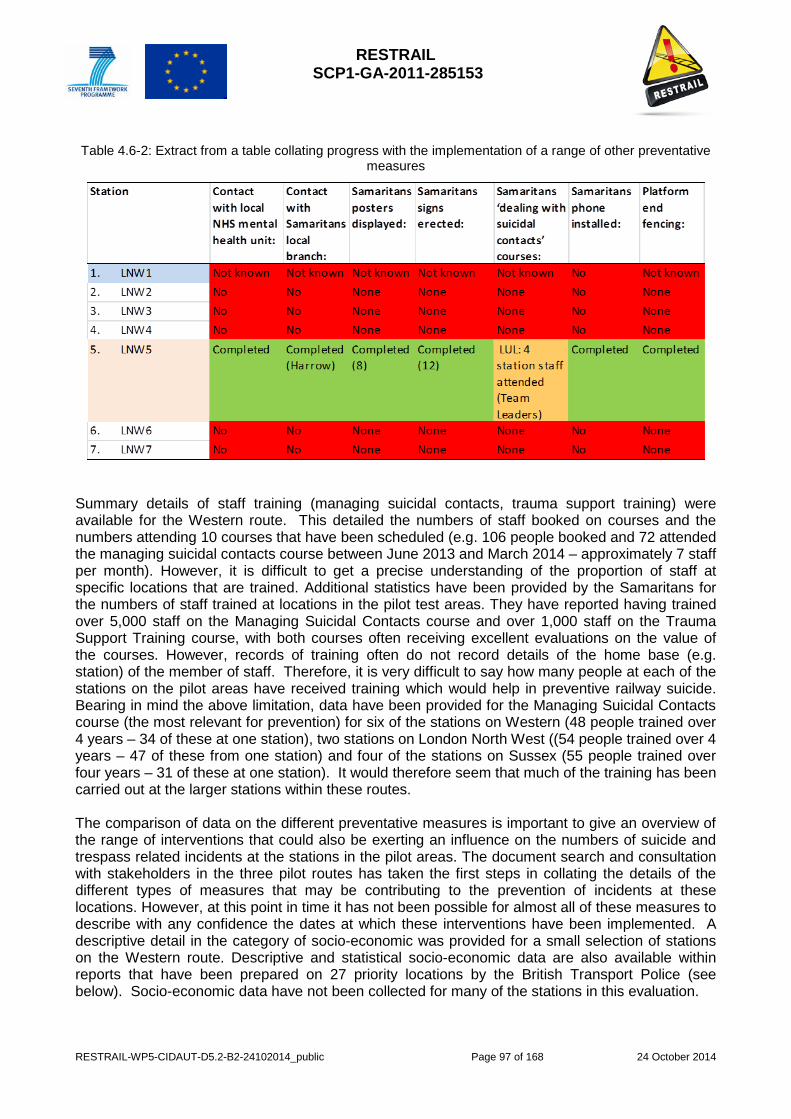
RESTRAIL SCP1-GA-2011-285153
RESTRAIL-WP5-CIDAUT-D5.2-B2-24102014_public Page 97 of 168 24 October 2014
Table 4.6-2: Extract from a table collating progress with the implementation of a range of other preventative measures
Summary details of staff training (managing suicidal contacts, trauma support training) were available for the Western route. This detailed the numbers of staff booked on courses and the numbers attending 10 courses that have been scheduled (e.g. 106 people booked and 72 attended the managing suicidal contacts course between June 2013 and March 2014 – approximately 7 staff per month). However, it is difficult to get a precise understanding of the proportion of staff at specific locations that are trained. Additional statistics have been provided by the Samaritans for the numbers of staff trained at locations in the pilot test areas. They have reported having trained over 5,000 staff on the Managing Suicidal Contacts course and over 1,000 staff on the Trauma Support Training course, with both courses often receiving excellent evaluations on the value of the courses. However, records of training often do not record details of the home base (e.g. station) of the member of staff. Therefore, it is very difficult to say how many people at each of the stations on the pilot areas have received training which would help in preventive railway suicide. Bearing in mind the above limitation, data have been provided for the Managing Suicidal Contacts course (the most relevant for prevention) for six of the stations on Western (48 people trained over 4 years – 34 of these at one station), two stations on London North West ((54 people trained over 4 years – 47 of these from one station) and four of the stations on Sussex (55 people trained over four years – 31 of these at one station). It would therefore seem that much of the training has been carried out at the larger stations within these routes. The comparison of data on the different preventative measures is important to give an overview of the range of interventions that could also be exerting an influence on the numbers of suicide and trespass related incidents at the stations in the pilot areas. The document search and consultation with stakeholders in the three pilot routes has taken the first steps in collating the details of the different types of measures that may be contributing to the prevention of incidents at these locations. However, at this point in time it has not been possible for almost all of these measures to describe with any confidence the dates at which these interventions have been implemented. A descriptive detail in the category of socio-economic was provided for a small selection of stations on the Western route. Descriptive and statistical socio-economic data are also available within reports that have been prepared on 27 priority locations by the British Transport Police (see below). Socio-economic data have not been collected for many of the stations in this evaluation.
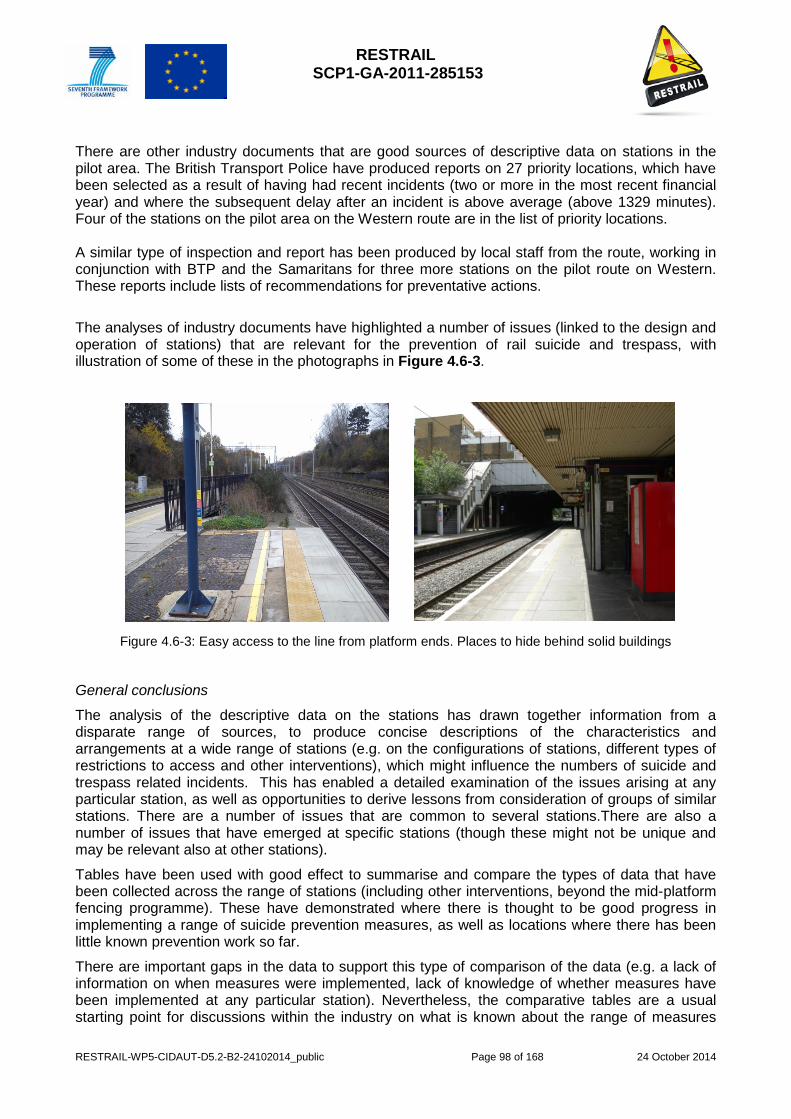
RESTRAIL SCP1-GA-2011-285153
RESTRAIL-WP5-CIDAUT-D5.2-B2-24102014_public Page 98 of 168 24 October 2014
There are other industry documents that are good sources of descriptive data on stations in the pilot area. The British Transport Police have produced reports on 27 priority locations, which have been selected as a result of having had recent incidents (two or more in the most recent financial year) and where the subsequent delay after an incident is above average (above 1329 minutes). Four of the stations on the pilot area on the Western route are in the list of priority locations. A similar type of inspection and report has been produced by local staff from the route, working in conjunction with BTP and the Samaritans for three more stations on the pilot route on Western. These reports include lists of recommendations for preventative actions.
The analyses of industry documents have highlighted a number of issues (linked to the design and operation of stations) that are relevant for the prevention of rail suicide and trespass, with illustration of some of these in the photographs in Figure 4.6-3.
Figure 4.6-3: Easy access to the line from platform ends. Places to hide behind solid buildings
General conclusions
The analysis of the descriptive data on the stations has drawn together information from a disparate range of sources, to produce concise descriptions of the characteristics and arrangements at a wide range of stations (e.g. on the configurations of stations, different types of restrictions to access and other interventions), which might influence the numbers of suicide and trespass related incidents. This has enabled a detailed examination of the issues arising at any particular station, as well as opportunities to derive lessons from consideration of groups of similar stations. There are a number of issues that are common to several stations.There are also a number of issues that have emerged at specific stations (though these might not be unique and may be relevant also at other stations).
Tables have been used with good effect to summarise and compare the types of data that have been collected across the range of stations (including other interventions, beyond the mid-platform fencing programme). These have demonstrated where there is thought to be good progress in implementing a range of suicide prevention measures, as well as locations where there has been little known prevention work so far.
There are important gaps in the data to support this type of comparison of the data (e.g. a lack of information on when measures were implemented, lack of knowledge of whether measures have been implemented at any particular station). Nevertheless, the comparative tables are a usual starting point for discussions within the industry on what is known about the range of measures
RESTRAIL SCP1-GA-2011-285153
RESTRAIL-WP5-CIDAUT-D5.2-B2-24102014_public Page 99 of 168 24 October 2014
that could be in operation at each site and prompt discussion on what is desirable in relation to these and other preventative measures.
4.6.4.3. Description of the design and implementation of the mid-platform fencing initiative, plus associated preventative measures
The collection and analysis of data on the implementation of the mid-platform fencing initiative has been carried out in order to clarify the process steps that are necessary for the implementation of this type of preventative measure. Progress with the programme has been assessed. This analysis produced a range of data types. These include: the different stages in the process for design and implementation; progress with the implementation of work in the programme; issues arising with design and implementation; and the costs of implementing the programme.
1. Stages in the process for design and implementation
All works on station fencing of this type are subject to the detailed design and approval of the fencing. Examples of planning documentation have been provided by staff on each of the routes. Overall, these contain the following types of information:
• Detailed plans and photographs of the platforms and line of fencing, measurements and dimensions, fully annotated to explain the extent of the works, including precautions when working around the existing structure and fabric of the railway platform.
• Specification of the fencing (e.g. height, design features (e.g. blunt top), construction, and foundations and fixings, details of gates, opening and locking mechanisms, and associated works (hatching, removal of station furniture).
• Method of operation of the fencing – (whether gates are left open at night if the stations not manned, signs for passengers for location and operation of the gates operation.
• Locations of platform end fencing and gates. • Investigation of the potential effects of the proposed fencing on passenger flow at the
station in normal and emergency situations. • The type of detail that is needed when applying for a permission for a Deviation from
Railway Group Standards (e.g. when the introduction of fencing to divide a platform may result in a platform width of less than the minimum 3 metre width along the entire length or part of the station.
Detailed evidence on the implementation of the fencing from one of the pilot areas has been collected from industry documentation.
The extract in Figure 4.6-4 shows the implementation of the fencing in 6 stations on this route.
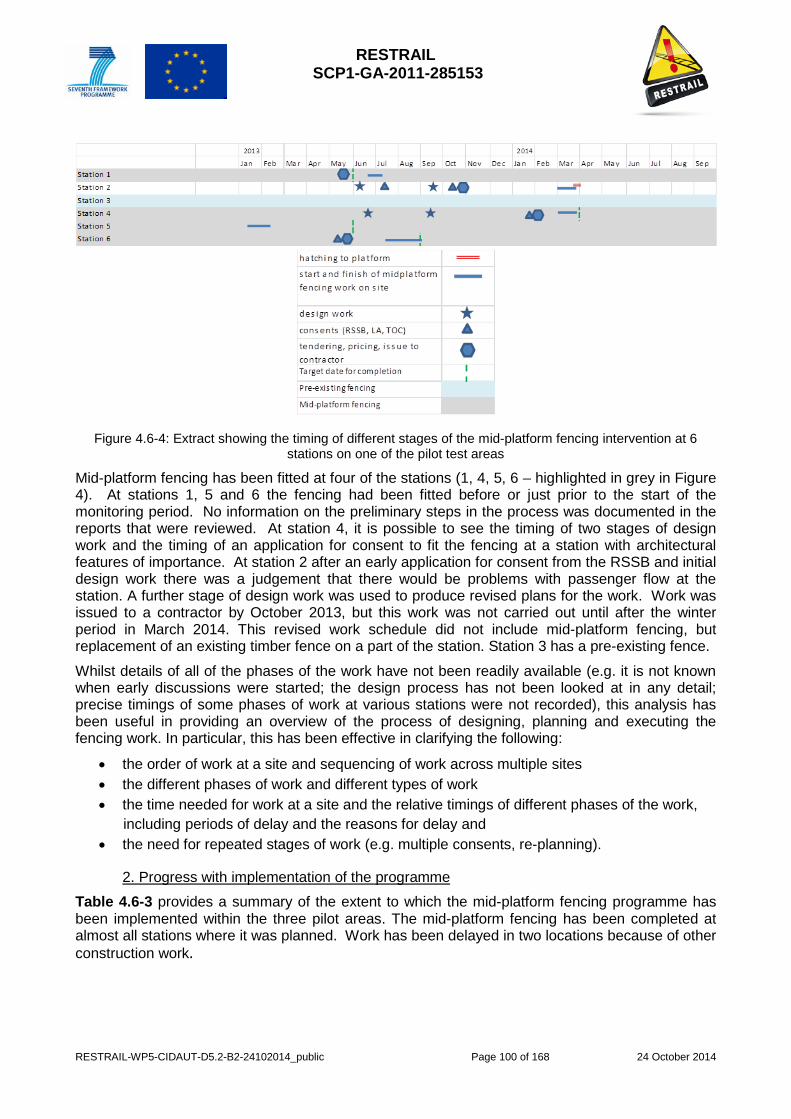
RESTRAIL SCP1-GA-2011-285153
RESTRAIL-WP5-CIDAUT-D5.2-B2-24102014_public Page 100 of 168 24 October 2014
Figure 4.6-4: Extract showing the timing of different stages of the mid-platform fencing intervention at 6 stations on one of the pilot test areas
Mid-platform fencing has been fitted at four of the stations (1, 4, 5, 6 – highlighted in grey in Figure 4). At stations 1, 5 and 6 the fencing had been fitted before or just prior to the start of the monitoring period. No information on the preliminary steps in the process was documented in the reports that were reviewed. At station 4, it is possible to see the timing of two stages of design work and the timing of an application for consent to fit the fencing at a station with architectural features of importance. At station 2 after an early application for consent from the RSSB and initial design work there was a judgement that there would be problems with passenger flow at the station. A further stage of design work was used to produce revised plans for the work. Work was issued to a contractor by October 2013, but this work was not carried out until after the winter period in March 2014. This revised work schedule did not include mid-platform fencing, but replacement of an existing timber fence on a part of the station. Station 3 has a pre-existing fence.
Whilst details of all of the phases of the work have not been readily available (e.g. it is not known when early discussions were started; the design process has not been looked at in any detail; precise timings of some phases of work at various stations were not recorded), this analysis has been useful in providing an overview of the process of designing, planning and executing the fencing work. In particular, this has been effective in clarifying the following:
• the order of work at a site and sequencing of work across multiple sites • the different phases of work and different types of work • the time needed for work at a site and the relative timings of different phases of the work,
including periods of delay and the reasons for delay and • the need for repeated stages of work (e.g. multiple consents, re-planning).
2. Progress with implementation of the programme Table 4.6-3 provides a summary of the extent to which the mid-platform fencing programme has been implemented within the three pilot areas. The mid-platform fencing has been completed at almost all stations where it was planned. Work has been delayed in two locations because of other construction work.
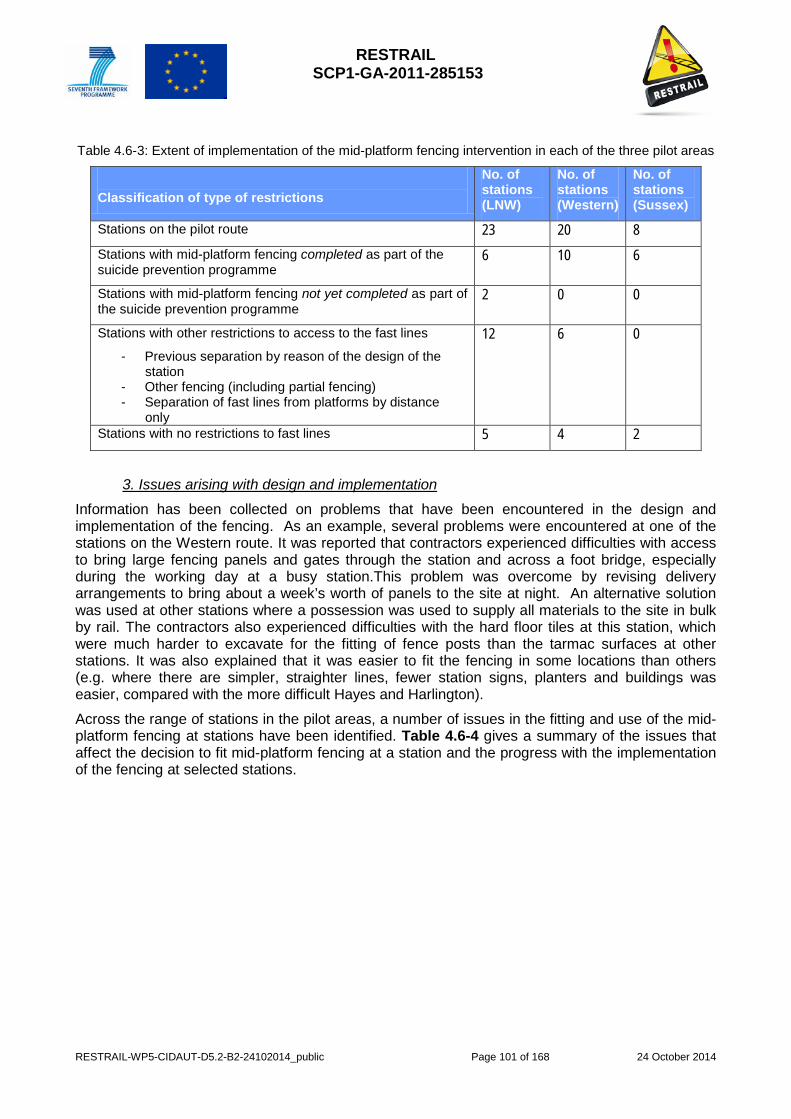
RESTRAIL SCP1-GA-2011-285153
RESTRAIL-WP5-CIDAUT-D5.2-B2-24102014_public Page 101 of 168 24 October 2014
Table 4.6-3: Extent of implementation of the mid-platform fencing intervention in each of the three pilot areas
Classification of type of restrictions
No. of stations (LNW)
No. of stations (Western)
No. of stations (Sussex)
Stations on the pilot route 23 20 8 Stations with mid-platform fencing completed as part of the suicide prevention programme
6 10 6
Stations with mid-platform fencing not yet completed as part of the suicide prevention programme
2 0 0
Stations with other restrictions to access to the fast lines
- Previous separation by reason of the design of the station
- Other fencing (including partial fencing) - Separation of fast lines from platforms by distance
only
12 6 0
Stations with no restrictions to fast lines 5 4 2
3. Issues arising with design and implementation
Information has been collected on problems that have been encountered in the design and implementation of the fencing. As an example, several problems were encountered at one of the stations on the Western route. It was reported that contractors experienced difficulties with access to bring large fencing panels and gates through the station and across a foot bridge, especially during the working day at a busy station.This problem was overcome by revising delivery arrangements to bring about a week’s worth of panels to the site at night. An alternative solution was used at other stations where a possession was used to supply all materials to the site in bulk by rail. The contractors also experienced difficulties with the hard floor tiles at this station, which were much harder to excavate for the fitting of fence posts than the tarmac surfaces at other stations. It was also explained that it was easier to fit the fencing in some locations than others (e.g. where there are simpler, straighter lines, fewer station signs, planters and buildings was easier, compared with the more difficult Hayes and Harlington).
Across the range of stations in the pilot areas, a number of issues in the fitting and use of the mid-platform fencing at stations have been identified. Table 4.6-4 gives a summary of the issues that affect the decision to fit mid-platform fencing at a station and the progress with the implementation of the fencing at selected stations.

RESTRAIL SCP1-GA-2011-285153
RESTRAIL-WP5-CIDAUT-D5.2-B2-24102014_public Page 102 of 168 24 October 2014
Table 4.6-4: Factors influencing the design and implementation of the programme
Issue Commentary
Approvals To ensure compliance with railway safety standards (e.g. sufficient platform widths) – via RSSB
Listed building consent is needed in circumstances where station buildings may be of particular architectural interest
Agreement with stakeholders – over safety on platforms, pedestrian flow, dependent on passenger counts
Delay in the process of implementation
Work at a station may be dependent on the completion of other work at a station (e.g. demolition and re-building of footbridges, fitting of lifts and staircases, as part of station enhancement and “access for all” programmes
Work may be delayed by delays in work at other sites (e.g. where the same contractors are carrying out the work)
Failure to get appropriate contractor to tender for the work, with need to re-issue a tender
New contractors and new methods of working may introduce some delay at a station
Difficulties with access for materials (resolved at some stations with the delivery of materials in bulk to a platform based compound in a possession)
Problems due to local circumstances (e.g. hard floor tiles (e.g. Figure 5a) which are difficult to excavate, compared with tarmac surface, working around station structures, architecture and equipment)
Consultation with stakeholders on the best line for the fencing (Figure 5b)
Time for approval of method statements from contractors
Weather related delays
Delays in work over holiday periods
4. Costs
Example costs have been provided by staff from two of the pilot test areas. A unit cost of mid-platform fencing can be assumed to be in the region of £400-450 per metre of fencing, inclusive of design, fitting and provision of access gates. Details of other costs are also available (e.g. for fencing to close off access at other disused lone platforms (unit cost of fencing per metre, up to £10000 if electronic locking is provided); for platform end fencing, gates and floor grids (£5000-10000 per platform); signs (£25), poster frames (£433), CCTV to monitor vulnerable locations (£7400).
General conclusions Generally, there has been good progress in the implementation of the fencing and work has been completed at most of the targeted stations. Fencing is awaiting completion at several stations, pending completion of other construction work.
It is not possible to fit mid-platform fencing (or full mid-platform at fencing) at some locations. In some circumstances partial mid-platform fencing has been fitted where there is a gap in the fence at a point at which the platform is too narrow, and at the ends of platforms.
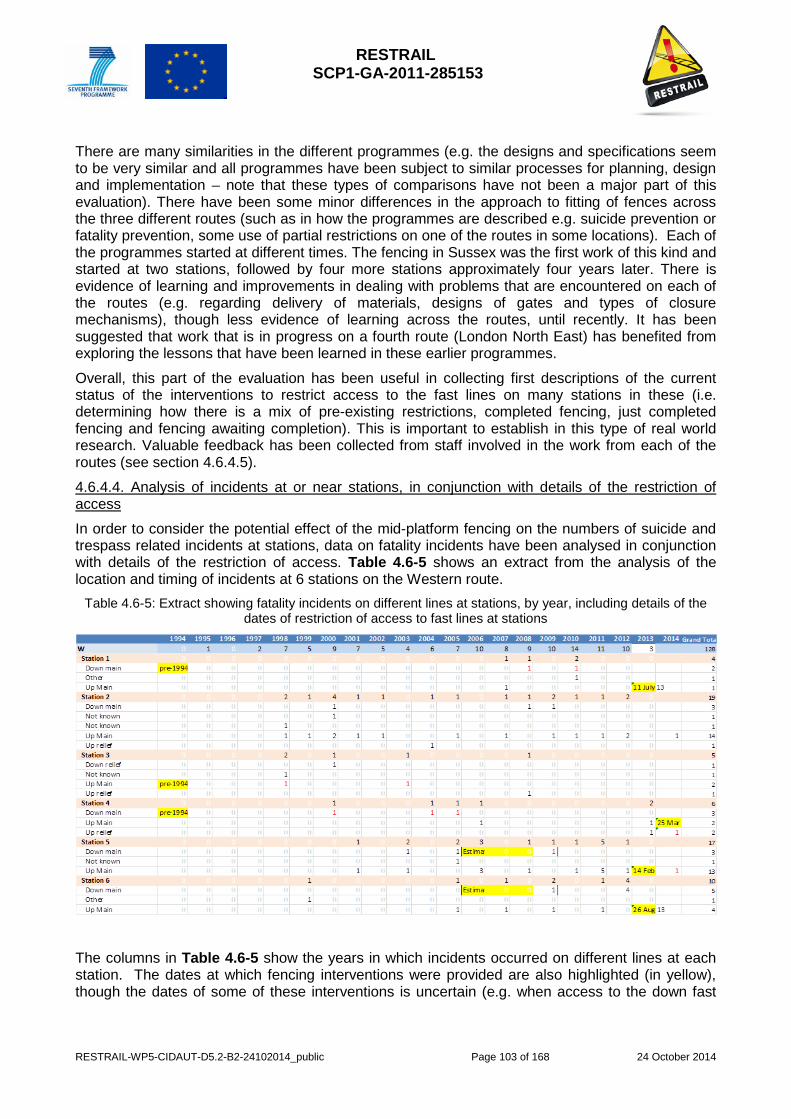
RESTRAIL SCP1-GA-2011-285153
RESTRAIL-WP5-CIDAUT-D5.2-B2-24102014_public Page 103 of 168 24 October 2014
There are many similarities in the different programmes (e.g. the designs and specifications seem to be very similar and all programmes have been subject to similar processes for planning, design and implementation – note that these types of comparisons have not been a major part of this evaluation). There have been some minor differences in the approach to fitting of fences across the three different routes (such as in how the programmes are described e.g. suicide prevention or fatality prevention, some use of partial restrictions on one of the routes in some locations). Each of the programmes started at different times. The fencing in Sussex was the first work of this kind and started at two stations, followed by four more stations approximately four years later. There is evidence of learning and improvements in dealing with problems that are encountered on each of the routes (e.g. regarding delivery of materials, designs of gates and types of closure mechanisms), though less evidence of learning across the routes, until recently. It has been suggested that work that is in progress on a fourth route (London North East) has benefited from exploring the lessons that have been learned in these earlier programmes.
Overall, this part of the evaluation has been useful in collecting first descriptions of the current status of the interventions to restrict access to the fast lines on many stations in these (i.e. determining how there is a mix of pre-existing restrictions, completed fencing, just completed fencing and fencing awaiting completion). This is important to establish in this type of real world research. Valuable feedback has been collected from staff involved in the work from each of the routes (see section 4.6.4.5).
4.6.4.4. Analysis of incidents at or near stations, in conjunction with details of the restriction of access In order to consider the potential effect of the mid-platform fencing on the numbers of suicide and trespass related incidents at stations, data on fatality incidents have been analysed in conjunction with details of the restriction of access. Table 4.6-5 shows an extract from the analysis of the location and timing of incidents at 6 stations on the Western route.
Table 4.6-5: Extract showing fatality incidents on different lines at stations, by year, including details of the dates of restriction of access to fast lines at stations
The columns in Table 4.6-5 show the years in which incidents occurred on different lines at each station. The dates at which fencing interventions were provided are also highlighted (in yellow), though the dates of some of these interventions is uncertain (e.g. when access to the down fast
RESTRAIL SCP1-GA-2011-285153
RESTRAIL-WP5-CIDAUT-D5.2-B2-24102014_public Page 104 of 168 24 October 2014
main platforms at station 5 and station 6 were closed off was thought to be between 2006 and 2008).
It is possible to see from this table how fatality events were distributed in the period prior to the introduction of fencing and (in some cases) on the different lines at the station after the introduction of fencing. For example, fatality incidents occurred periodically in the prior to the implementation of fencing at station 6 on the up main and then there have been no more incidents since August 2013. It is also possible to see that an incident occurred on one of the slower lines at station 4 after fitting of fencing that was intended to protect the fast lines at station (highlighted in red font). It is possible to look in greater detail at the circumstances surrounding this small number of events to determine the explanations for how people could have got access to the lines (e.g. how the configuration of the lines, platforms and fencing at the stations could allow access).
A summary of some conclusions and questions arising from an initial review of this type of table is given below.
• Incidents can occur in spite of fencing. This can be explained by people crossing from other lines to get access to the fast lines, getting access from outside of the station, getting access at the station ends.
• Some recent incidents on slow lines have occurred where there has been an engineering possession on fast lines and so faster, non-stopping trains are passing stations on the slower lines. The labelling of incidents on lines (fast, slow) can be misleading in some circumstances and cause problems for analysis and interpreting the results (i.e. there are various circumstances in which there are non-stopping trains on slow lines – more detailed analysis is needed with respect to stopping patterns).
• There might be displacement to other lines at stations, but it is difficult to say this after a short period of observation after the fitting of fences.
• There could also be some displacement to other stations, though again this needs more investigation.
• There has been a suggestion that incidents on the slow lines are more likely to occur at some stations where there are higher numbers of non-stopping trains on a slow / relief line.
• Partial fences may be ineffective in some cases.
• It is not always clear whether some fatalities were before or after restriction of access (especially for down fast / main lines), because details of access restrictions are not always known.
• It is not always clear from which platform access was achieved, though the industry is getting better at this using CCTV and better reports from drivers and others.
A number of preliminary analyses were carried out in an attempt to estimate of the effect of mid-platform fencing, as well as other restrictions to access to fast lines.
Table 4.6-6 shows the numbers of incidents per month on fast lines and slow lines at each station, before and after different types of fencing interventions or other restrictions to access (red highlighting has been used to identify situations where the number of incidents per month is 0.1 or above and amber highlighting where the number of incidents per month is between 0.01 and less than 0.1). As some the restrictions have been longstanding (linked to the original design and configuration of the railway) it has not been possible to show before and after data for all types of intervention. Table 4.6-7 shows these results for the four different classes of restriction of access; mid-platform fencing, some other restrictions to access, separation from fast lines by distance only, no restrictions to access to fast lines).

RESTRAIL SCP1-GA-2011-285153
RESTRAIL-WP5-CIDAUT-D5.2-B2-24102014_public Page 105 of 168 24 October 2014
The monthly rate on fast lines is quite low in many locations. For example, a monthly rate below 0.01 (typically 0.004-0.008) equates to around 0.05 fatalities per year. This rises to a higher order of magnitude in some locations (e.g. a monthly rate of 0.012-0.077), between 0.14 and 0.924 fatalities per year. The highest monthly rates (0.11 and 0.25) would indicate an expectation of 1.32 to 3 fatalities per year at these stations. (It is important to note that that these rates are influenced by recent events occurring, shortly after the introduction of the fencing and might result in inflated estimates. The rate of incidents should be monitored over a longer period of time.)
There has been only one fatality incident on the fast lines after fitting full mid-platform fencing (i.e. includes restricting access to the shared platform and other lone platforms from which people can access the fast lines – there were some incidents in the time period when only one of the fast line platforms was restricted and people could cross over lines to another fast line). Whilst this is not a desirable outcome, the monthly frequency of fatalities at this station has lowered in the period after the fitting of the fencing.
Mid-platform fencing has been fitted at 22 stations and there has been a general reduction in the numbers of incidents on fast lines across all of these stations (mean = 0.019 per station per month, s.d. = 0.015, max = 0.06, min = 0.004, median = 0.015). Larger effects are evident where there have been a greater number of incidents at a station.
Table 4.6-6: Numbers of incidents on fast lines and slow lines at each station
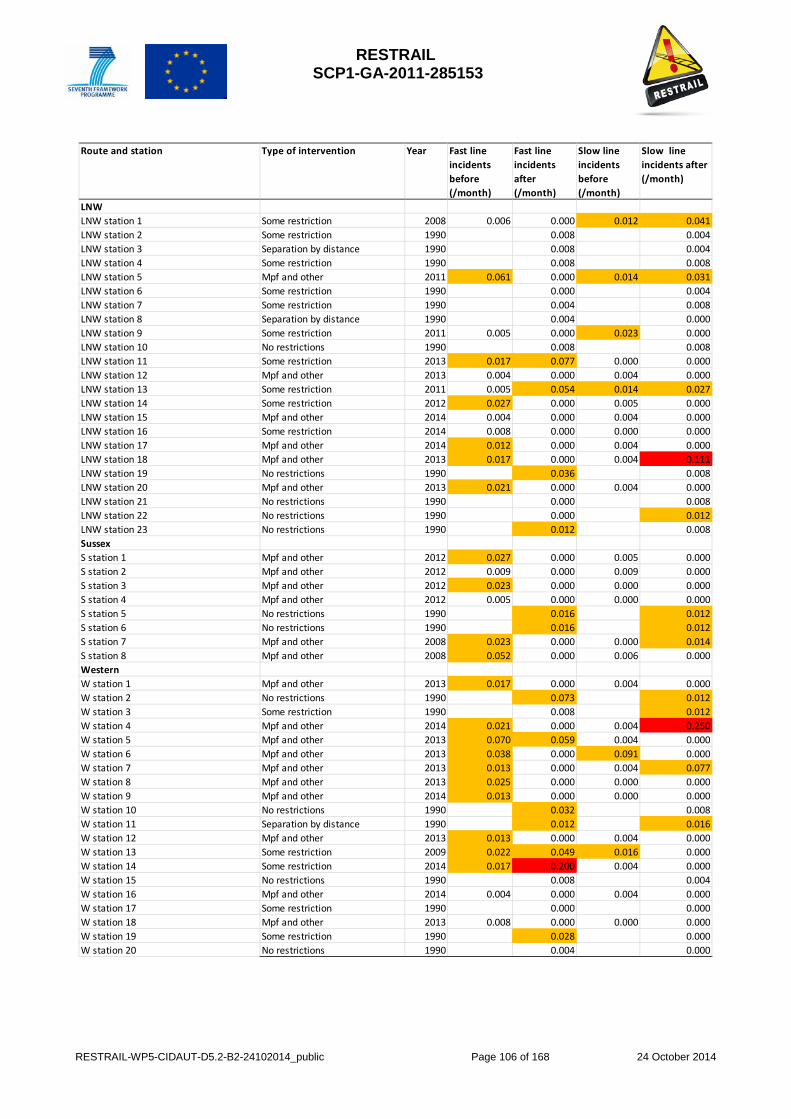
RESTRAIL SCP1-GA-2011-285153
RESTRAIL-WP5-CIDAUT-D5.2-B2-24102014_public Page 106 of 168 24 October 2014
Route and station Type of intervention Year Fast line incidents before (/month)
Fast line incidents after (/month)
Slow line incidents before (/month)
Slow line incidents after (/month)
LNWLNW station 1 Some restriction 2008 0.006 0.000 0.012 0.041LNW station 2 Some restriction 1990 0.008 0.004LNW station 3 Separation by distance 1990 0.008 0.004LNW station 4 Some restriction 1990 0.008 0.008LNW station 5 Mpf and other 2011 0.061 0.000 0.014 0.031LNW station 6 Some restriction 1990 0.000 0.004LNW station 7 Some restriction 1990 0.004 0.008LNW station 8 Separation by distance 1990 0.004 0.000LNW station 9 Some restriction 2011 0.005 0.000 0.023 0.000LNW station 10 No restrictions 1990 0.008 0.008LNW station 11 Some restriction 2013 0.017 0.077 0.000 0.000LNW station 12 Mpf and other 2013 0.004 0.000 0.004 0.000LNW station 13 Some restriction 2011 0.005 0.054 0.014 0.027LNW station 14 Some restriction 2012 0.027 0.000 0.005 0.000LNW station 15 Mpf and other 2014 0.004 0.000 0.004 0.000LNW station 16 Some restriction 2014 0.008 0.000 0.000 0.000LNW station 17 Mpf and other 2014 0.012 0.000 0.004 0.000LNW station 18 Mpf and other 2013 0.017 0.000 0.004 0.111LNW station 19 No restrictions 1990 0.036 0.008LNW station 20 Mpf and other 2013 0.021 0.000 0.004 0.000LNW station 21 No restrictions 1990 0.000 0.008LNW station 22 No restrictions 1990 0.000 0.012LNW station 23 No restrictions 1990 0.012 0.008SussexS station 1 Mpf and other 2012 0.027 0.000 0.005 0.000S station 2 Mpf and other 2012 0.009 0.000 0.009 0.000S station 3 Mpf and other 2012 0.023 0.000 0.000 0.000S station 4 Mpf and other 2012 0.005 0.000 0.000 0.000S station 5 No restrictions 1990 0.016 0.012S station 6 No restrictions 1990 0.016 0.012S station 7 Mpf and other 2008 0.023 0.000 0.000 0.014S station 8 Mpf and other 2008 0.052 0.000 0.006 0.000WesternW station 1 Mpf and other 2013 0.017 0.000 0.004 0.000W station 2 No restrictions 1990 0.073 0.012W station 3 Some restriction 1990 0.008 0.012W station 4 Mpf and other 2014 0.021 0.000 0.004 0.250W station 5 Mpf and other 2013 0.070 0.059 0.004 0.000W station 6 Mpf and other 2013 0.038 0.000 0.091 0.000W station 7 Mpf and other 2013 0.013 0.000 0.004 0.077W station 8 Mpf and other 2013 0.025 0.000 0.000 0.000W station 9 Mpf and other 2014 0.013 0.000 0.000 0.000W station 10 No restrictions 1990 0.032 0.008W station 11 Separation by distance 1990 0.012 0.016W station 12 Mpf and other 2013 0.013 0.000 0.004 0.000W station 13 Some restriction 2009 0.022 0.049 0.016 0.000W station 14 Some restriction 2014 0.017 0.200 0.004 0.000W station 15 No restrictions 1990 0.008 0.004W station 16 Mpf and other 2014 0.004 0.000 0.004 0.000W station 17 Some restriction 1990 0.000 0.000W station 18 Mpf and other 2013 0.008 0.000 0.000 0.000W station 19 Some restriction 1990 0.028 0.000W station 20 No restrictions 1990 0.004 0.000
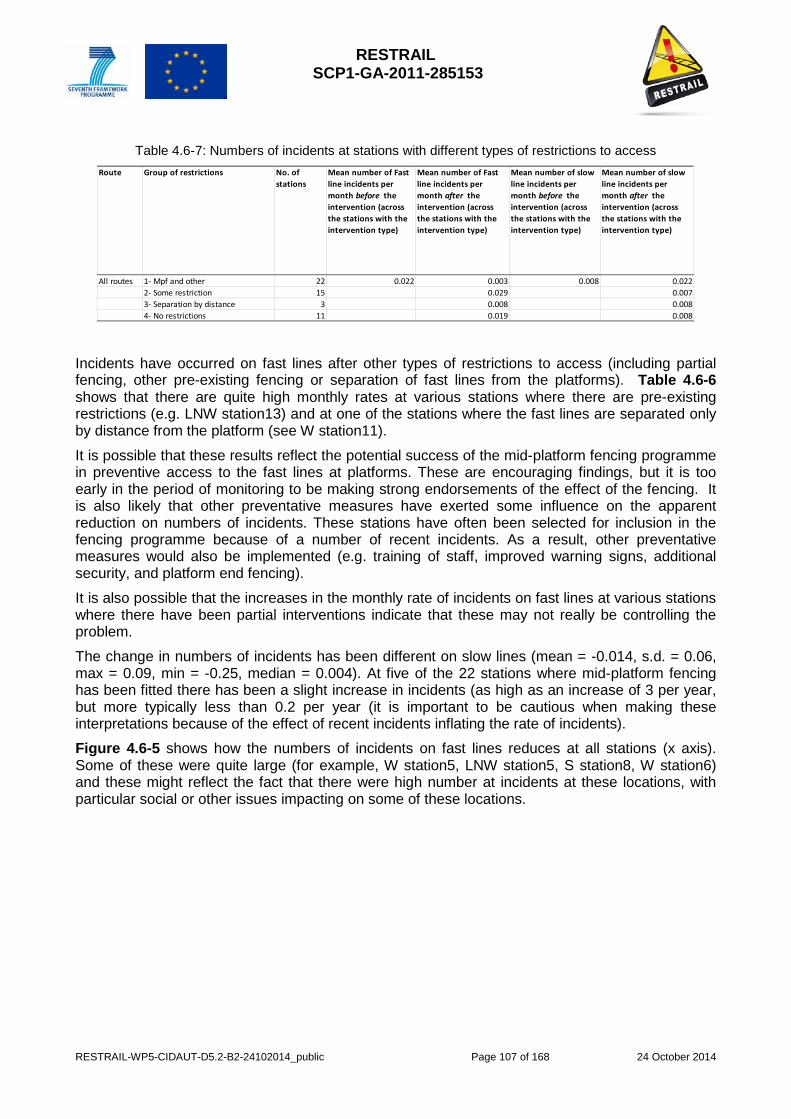
RESTRAIL SCP1-GA-2011-285153
RESTRAIL-WP5-CIDAUT-D5.2-B2-24102014_public Page 107 of 168 24 October 2014
Table 4.6-7: Numbers of incidents at stations with different types of restrictions to access Route Group of restrictions No. of
stationsMean number of Fast line incidents per month before the intervention (across the stations with the intervention type)
Mean number of Fast line incidents per month after the intervention (across the stations with the intervention type)
Mean number of slow line incidents per month before the intervention (across the stations with the intervention type)
Mean number of slow line incidents per month after the intervention (across the stations with the intervention type)
All routes 1- Mpf and other 22 0.022 0.003 0.008 0.0222- Some restriction 15 0.029 0.0073- Separation by distance 3 0.008 0.0084- No restrictions 11 0.019 0.008
Incidents have occurred on fast lines after other types of restrictions to access (including partial fencing, other pre-existing fencing or separation of fast lines from the platforms). Table 4.6-6 shows that there are quite high monthly rates at various stations where there are pre-existing restrictions (e.g. LNW station13) and at one of the stations where the fast lines are separated only by distance from the platform (see W station11).
It is possible that these results reflect the potential success of the mid-platform fencing programme in preventive access to the fast lines at platforms. These are encouraging findings, but it is too early in the period of monitoring to be making strong endorsements of the effect of the fencing. It is also likely that other preventative measures have exerted some influence on the apparent reduction on numbers of incidents. These stations have often been selected for inclusion in the fencing programme because of a number of recent incidents. As a result, other preventative measures would also be implemented (e.g. training of staff, improved warning signs, additional security, and platform end fencing).
It is also possible that the increases in the monthly rate of incidents on fast lines at various stations where there have been partial interventions indicate that these may not really be controlling the problem.
The change in numbers of incidents has been different on slow lines (mean = -0.014, s.d. = 0.06, max = 0.09, min = -0.25, median = 0.004). At five of the 22 stations where mid-platform fencing has been fitted there has been a slight increase in incidents (as high as an increase of 3 per year, but more typically less than 0.2 per year (it is important to be cautious when making these interpretations because of the effect of recent incidents inflating the rate of incidents).
Figure 4.6-5 shows how the numbers of incidents on fast lines reduces at all stations (x axis). Some of these were quite large (for example, W station5, LNW station5, S station8, W station6) and these might reflect the fact that there were high number at incidents at these locations, with particular social or other issues impacting on some of these locations.
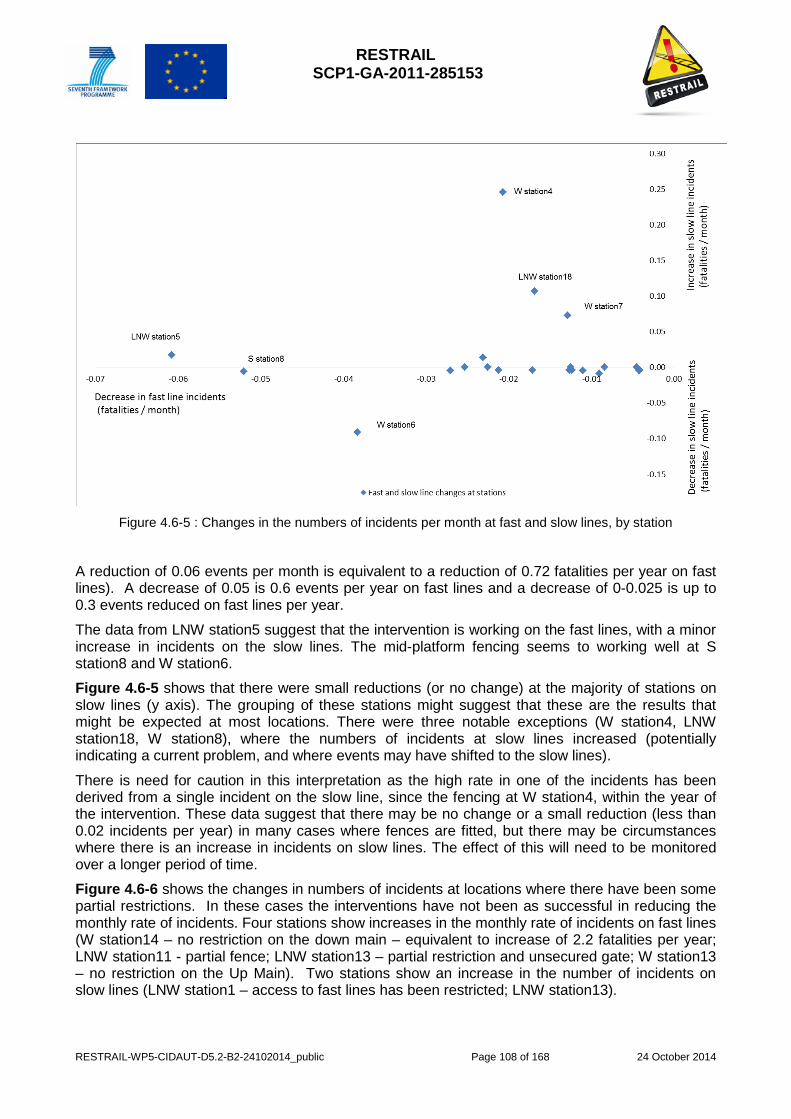
RESTRAIL SCP1-GA-2011-285153
RESTRAIL-WP5-CIDAUT-D5.2-B2-24102014_public Page 108 of 168 24 October 2014
Figure 4.6-5 : Changes in the numbers of incidents per month at fast and slow lines, by station
A reduction of 0.06 events per month is equivalent to a reduction of 0.72 fatalities per year on fast lines). A decrease of 0.05 is 0.6 events per year on fast lines and a decrease of 0-0.025 is up to 0.3 events reduced on fast lines per year.
The data from LNW station5 suggest that the intervention is working on the fast lines, with a minor increase in incidents on the slow lines. The mid-platform fencing seems to working well at S station8 and W station6.
Figure 4.6-5 shows that there were small reductions (or no change) at the majority of stations on slow lines (y axis). The grouping of these stations might suggest that these are the results that might be expected at most locations. There were three notable exceptions (W station4, LNW station18, W station8), where the numbers of incidents at slow lines increased (potentially indicating a current problem, and where events may have shifted to the slow lines).
There is need for caution in this interpretation as the high rate in one of the incidents has been derived from a single incident on the slow line, since the fencing at W station4, within the year of the intervention. These data suggest that there may be no change or a small reduction (less than 0.02 incidents per year) in many cases where fences are fitted, but there may be circumstances where there is an increase in incidents on slow lines. The effect of this will need to be monitored over a longer period of time.
Figure 4.6-6 shows the changes in numbers of incidents at locations where there have been some partial restrictions. In these cases the interventions have not been as successful in reducing the monthly rate of incidents. Four stations show increases in the monthly rate of incidents on fast lines (W station14 – no restriction on the down main – equivalent to increase of 2.2 fatalities per year; LNW station11 - partial fence; LNW station13 – partial restriction and unsecured gate; W station13 – no restriction on the Up Main). Two stations show an increase in the number of incidents on slow lines (LNW station1 – access to fast lines has been restricted; LNW station13).
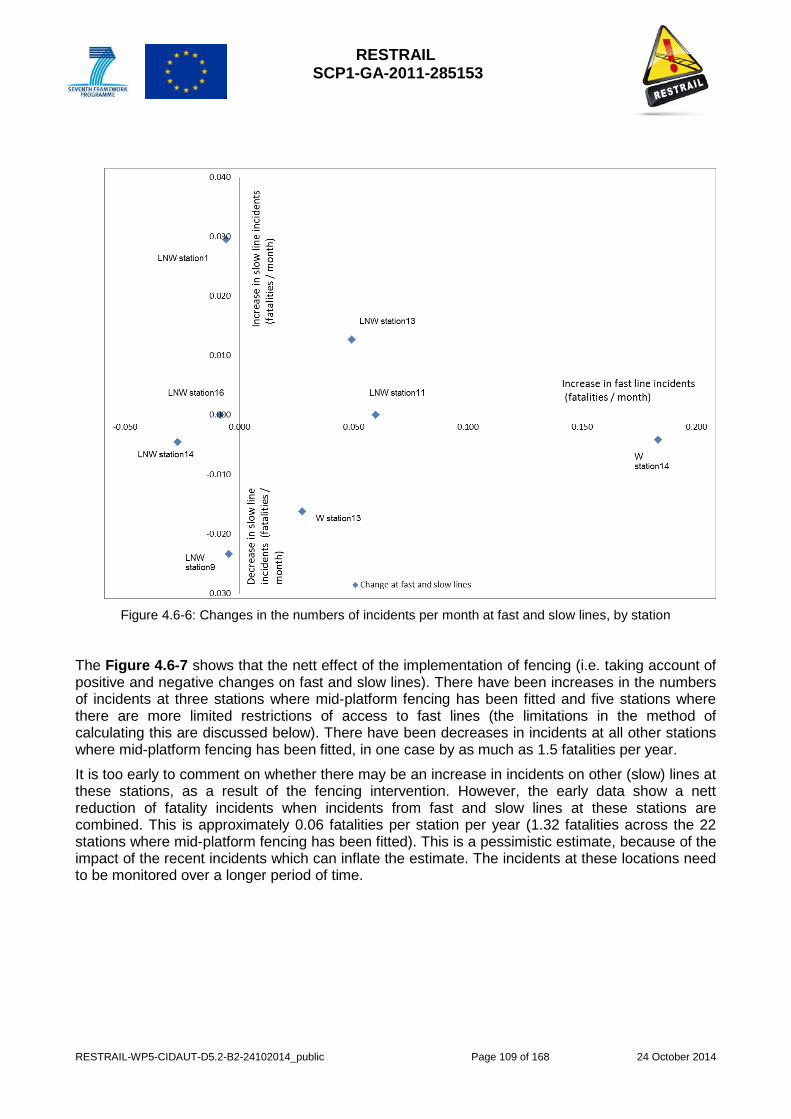
RESTRAIL SCP1-GA-2011-285153
RESTRAIL-WP5-CIDAUT-D5.2-B2-24102014_public Page 109 of 168 24 October 2014
Figure 4.6-6: Changes in the numbers of incidents per month at fast and slow lines, by station
The Figure 4.6-7 shows that the nett effect of the implementation of fencing (i.e. taking account of positive and negative changes on fast and slow lines). There have been increases in the numbers of incidents at three stations where mid-platform fencing has been fitted and five stations where there are more limited restrictions of access to fast lines (the limitations in the method of calculating this are discussed below). There have been decreases in incidents at all other stations where mid-platform fencing has been fitted, in one case by as much as 1.5 fatalities per year.
It is too early to comment on whether there may be an increase in incidents on other (slow) lines at these stations, as a result of the fencing intervention. However, the early data show a nett reduction of fatality incidents when incidents from fast and slow lines at these stations are combined. This is approximately 0.06 fatalities per station per year (1.32 fatalities across the 22 stations where mid-platform fencing has been fitted). This is a pessimistic estimate, because of the impact of the recent incidents which can inflate the estimate. The incidents at these locations need to be monitored over a longer period of time.
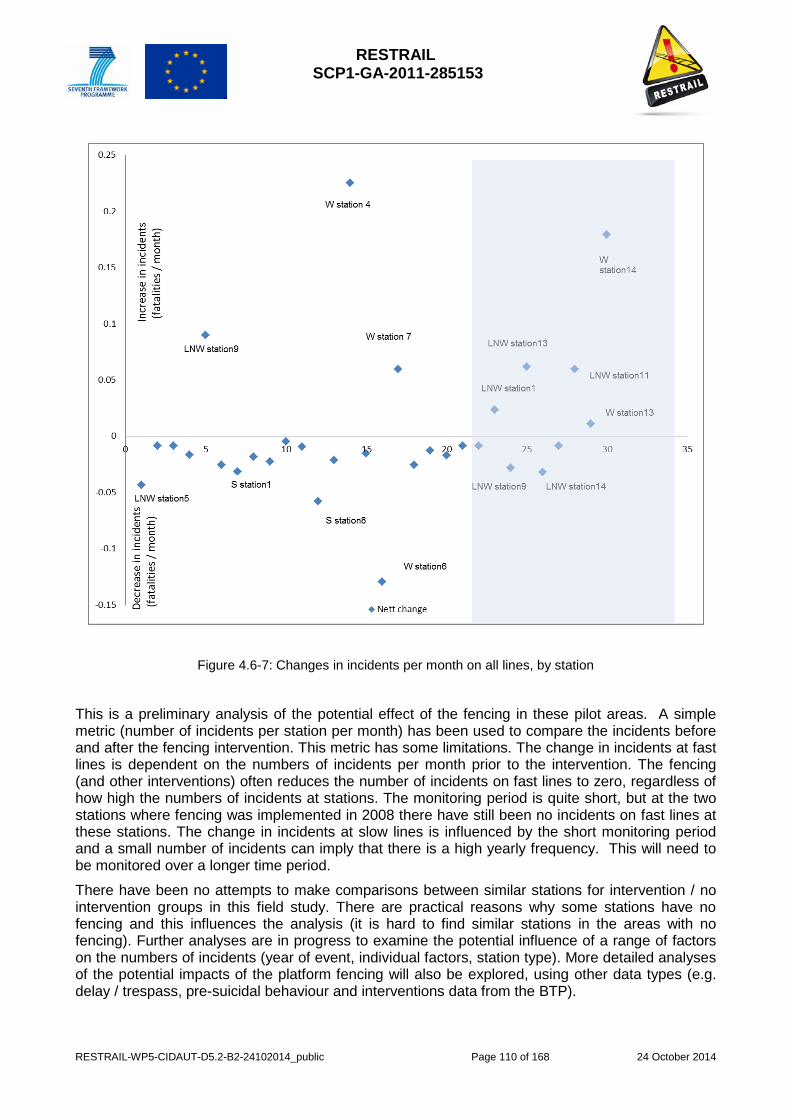
RESTRAIL SCP1-GA-2011-285153
RESTRAIL-WP5-CIDAUT-D5.2-B2-24102014_public Page 110 of 168 24 October 2014
Figure 4.6-7: Changes in incidents per month on all lines, by station
This is a preliminary analysis of the potential effect of the fencing in these pilot areas. A simple metric (number of incidents per station per month) has been used to compare the incidents before and after the fencing intervention. This metric has some limitations. The change in incidents at fast lines is dependent on the numbers of incidents per month prior to the intervention. The fencing (and other interventions) often reduces the number of incidents on fast lines to zero, regardless of how high the numbers of incidents at stations. The monitoring period is quite short, but at the two stations where fencing was implemented in 2008 there have still been no incidents on fast lines at these stations. The change in incidents at slow lines is influenced by the short monitoring period and a small number of incidents can imply that there is a high yearly frequency. This will need to be monitored over a longer time period.
There have been no attempts to make comparisons between similar stations for intervention / no intervention groups in this field study. There are practical reasons why some stations have no fencing and this influences the analysis (it is hard to find similar stations in the areas with no fencing). Further analyses are in progress to examine the potential influence of a range of factors on the numbers of incidents (year of event, individual factors, station type). More detailed analyses of the potential impacts of the platform fencing will also be explored, using other data types (e.g. delay / trespass, pre-suicidal behaviour and interventions data from the BTP).
RESTRAIL SCP1-GA-2011-285153
RESTRAIL-WP5-CIDAUT-D5.2-B2-24102014_public Page 111 of 168 24 October 2014
Conclusions This analysis has therefore analysed data on the following:
• Numbers of incidents at each of the locations (stations and lines and in relation to restrictions) over time
• How there are different types of access restrictions to fast lines (mid-platform fencing, other fences, due to the configuration of track and stations, by distance), with different levels of security. These have been provided at various time periods (historical, recently as part of the fencing programmes). Explanations can be offered as to why there are incidents on some lines after restrictions have been put in place.
• Differences in numbers of accidents before and after restrictions
4.6.4.5. Perceptions of the fencing initiative
Part of the evaluation has included the collection and analysis of feedback from a range of stakeholders to collect their perceptions on the mid-platform fencing programme. This has been carried out with the intention of providing an additional source of data on the potential effectiveness of the fencing, the experiences of users on the operation of the fencing, and their perceptions of the process for implementing the fencing.
Interviews have been carried out with five staff to date (several additional interviews have been scheduled and findings from these interviews will be incorporated into a later draft of this report).
The analysis of content from the RailUK Discussion forum is a second source of data on the perceptions of stakeholders. The RailUK Discussion Forum (http://www.railforums.co.uk) was launched on-line in 2005. There are currently 21,710 members. The most users ever online were 1950 on 7th February 2013 at 19:57. On 18/6/2014 at 16:11 (when the data reported below was collected) there were 104 members on line (and 528 guests).
Although contributors to such forums can in no way be considered as a representative sample of public opinion, posts in forums can be a rich source of qualitative data. The anonymity of forum members can be advantageous from a research point of view as the data collected can represent the real views of the contributors and the on-line environment can allow them to be uninhibited by social-norms, obligations and taboos. However, the nature of anonymous discussion forums means that researchers cannot be sure about the identity of contributors.
The following conclusions have been derived from these interviews and the analysis of the content from the rail forum:
More posiitive aspects
• There are very positive reactions to the fences (the design, the choice of locations, the construction, the aesthetics, they are robust).
• The interviewees spoke positively about the potential effectiveness of the fences – they can be a deterrent and can give staff enough time to react to a person who is at risk. They can be the most effective way of preventing incidents, though this depends on the configuration of the station. There are thought to be few if any incidents occurring with access over the fences at the stations where they have been fitted. Contributors to the rail forum also commented on their perception of the effectiveness of the fencing in preventing incidents (for example, acting as a physical barrier, causing people to stop and think, making it easier for staff to see people in places that they should not be).
• The fencing can help with other aspects of station safety and security – for example, people can feel safer on platforms, the fencing helps manage movements of people and prevents them going to places where they should not be.
RESTRAIL SCP1-GA-2011-285153
RESTRAIL-WP5-CIDAUT-D5.2-B2-24102014_public Page 112 of 168 24 October 2014
• The fencing operates well with other measures (e.g. where access is controlled by platform staff at some stations).
• There were very few problems with implementation of the programme. Some consideration is needed for the method of delivering materials to the site (taking account of presence of passengers and need to move fencing and gates on staircases and along narrow subways and footbridges). Work can be labour intensive (digging out surfaced and removing waste), requiring usual arrangements for safe construction work.
• The fencing is good value for money, but this may not be the right question to consider. They are worthwhile if they save a single life.
• There have been very few complaints about the fences from passengers.
Less positive aspects:
• Whilst the fencing is thought to be effective, it is important to not underestimate the scale of the work that is needed. The work should to be set up like a proper project and a wide range of stakeholders must be consulted. The programme needs to include other restriction of access (e.g. platform ends). There needs to be good negotiation and arrangements between stakeholders, to maximise the amount of work that can be achieved with a given amount of money. It might be perceived to be expensive, but there will be payback. Therefore, it has been suggested that this should only be used where there are likely to be problems
• The reason for putting in the fences is not always clear to members of the forum (e.g. some thought it was to demarcate different areas of responsibility at the station).
• Some contributors to the forum were sceptical about the likely success of the fencing. • Fences are not suitable for all locations – they have to be used in the right locations. Some
locations can be too narrow to be divided (e.g. Battersea). Some stations don’t have fast non-stopping trains. Trains can enter some stations very slowly. Some stations do not have island platforms. Fencing could be fitted to prevent crossing from slow to fast lines in some circumstances, but this could also introduce new risks (e.g. inspection staff may be in more confined spaces and unable to move to a place of safety when trains are approaching; signal sighting issues)
• Gates can be left open. Automated systems to open and close gates can be expensive. • It can be a problem if trains come into a platform and station staff have not been informed –
there may not be staff available to help with opening and closing of gates. Some confusion about how the gates will be opened has been evident in comments on the rail forum (who would open the gates, would the gates be too heavy for passengers to operate? – some were even unaware that there were gates in the fencing).
• More work needs to be done on the design of the locking mechanisms of gates, in conjunction with other platforming arrangements, to enable ease of opening of the gates when trains stop on the fast line platform that is being protected. Whether the gates should be locked or not and options for improving the closure mechanism have been discussed on the rail forum.
• There are circumstances where a partial fence is needed (e.g. if the platform width is not sufficient to fully divide the shared platform). Additional arrangements for protection of the weakness in the fencing is needed (e.g. monitored CCTV, staffing arrangements).
RESTRAIL SCP1-GA-2011-285153
RESTRAIL-WP5-CIDAUT-D5.2-B2-24102014_public Page 113 of 168 24 October 2014
• CCTV can be used successfully in the prevention of rail suicide, but this is often fitted for security of people on platforms, so CCTV coverage may not be good at some platforms where trains are not scheduled to stop.
• There can be problems of crowding on the slow shared platform if there are train delays at peak times.
• There can be quite a few non-stopping trains on slow lines on some parts of the routes. • It is hard to say if there could be a problem of moving the incidents to other lines or stations. • More work may be needed to secure other access points around stations. For example,
there are unlocked gates at platform ends and fencing cannot extend to the end of the platform to ensure no train collision. Fencing may need to be of non-conducting material to eliminate touch potential on third rail areas. Care is needed in siting signs at platform ends so as not to restrict sighting of signals and signal number plates. Better security is needed at bridges.
• Some contributors to the rail forum complained that the fences increased the lengths of walking routes to platforms or prevented access to toilets on some platforms.
The data from interviews and analysis of the rail forum content provide valuable insights into the opinions and perceptions of the fencing from a variety of rail staff and members of the public. Rail staff involved in the development of the programmes and other staff involved in managing stations with gates spoke very favourably about the fencing. The people contributing to the discussion threads on the forum had more mixed views. There was evidence of the robust exchange of opinions and efforts to inform others about a number of relevant issues (e.g. the effectiveness of the training some staff had received from the Samaritans and comments about how it had really helped them to understand possible pre-suicide behaviours). Some of those who were initially sceptical about the fencing seemed to appreciate the value of this type of barrier once they were aware of the reasons for the fencing. Some contributors were adamant that those at risk of suicides would be determined to carry out the attempt no matter what barriers were placed in their way and were not convinced of the effectiveness of the fences at reducing suicides. This might suggest that fencing programmes should be accompanied by information campaigns to advise commuters and rail staff why they are being installed.
4.6.4.6. Analysis and interpretation of all data, linked to the main evaluation questions
The collection and analysis of data for this evaluation has focused on two main questions:
• Does installing mid platform fencing lead to a reduction in suicides on the rail network? • How has the programme been introduced and implemented in the target locations (for example,
including progress with implementation of the programme, variations in levels of implementation, whether it has been implemented as it was intended)?
The structure for the evaluation has been outlined in the logic map in Figure 4.6-1. Table 4.6-8 gives an overview of the sources and content of data that have been used to understand more about the different components of the logic map. This table also includes a preliminary assessment of the following, in relation to these data:
• the extent to which relevant data have been available; • the quality of the data; • any areas on which it has been possible to derive conclusions • suggestions for further data collection and analysis.
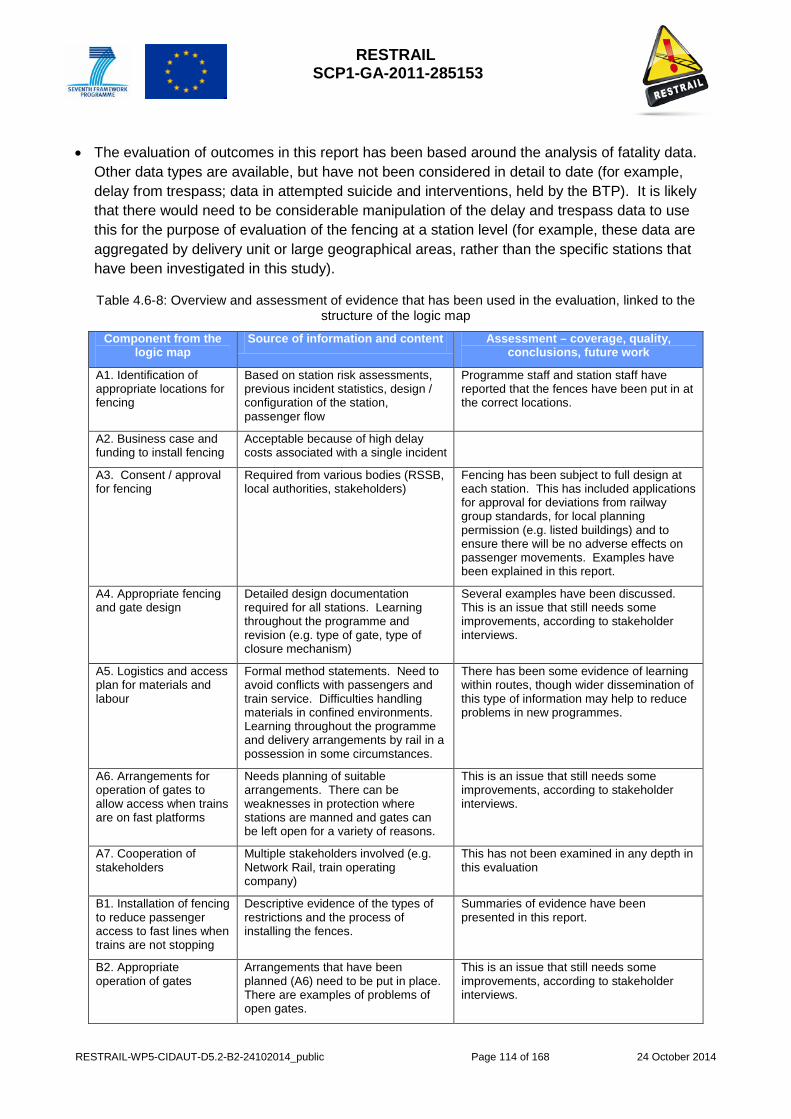
RESTRAIL SCP1-GA-2011-285153
RESTRAIL-WP5-CIDAUT-D5.2-B2-24102014_public Page 114 of 168 24 October 2014
• The evaluation of outcomes in this report has been based around the analysis of fatality data. Other data types are available, but have not been considered in detail to date (for example, delay from trespass; data in attempted suicide and interventions, held by the BTP). It is likely that there would need to be considerable manipulation of the delay and trespass data to use this for the purpose of evaluation of the fencing at a station level (for example, these data are aggregated by delivery unit or large geographical areas, rather than the specific stations that have been investigated in this study).
Table 4.6-8: Overview and assessment of evidence that has been used in the evaluation, linked to the structure of the logic map
Component from the logic map
Source of information and content Assessment – coverage, quality, conclusions, future work
A1. Identification of appropriate locations for fencing
Based on station risk assessments, previous incident statistics, design / configuration of the station, passenger flow
Programme staff and station staff have reported that the fences have been put in at the correct locations.
A2. Business case and funding to install fencing
Acceptable because of high delay costs associated with a single incident
A3. Consent / approval for fencing
Required from various bodies (RSSB, local authorities, stakeholders)
Fencing has been subject to full design at each station. This has included applications for approval for deviations from railway group standards, for local planning permission (e.g. listed buildings) and to ensure there will be no adverse effects on passenger movements. Examples have been explained in this report.
A4. Appropriate fencing and gate design
Detailed design documentation required for all stations. Learning throughout the programme and revision (e.g. type of gate, type of closure mechanism)
Several examples have been discussed. This is an issue that still needs some improvements, according to stakeholder interviews.
A5. Logistics and access plan for materials and labour
Formal method statements. Need to avoid conflicts with passengers and train service. Difficulties handling materials in confined environments. Learning throughout the programme and delivery arrangements by rail in a possession in some circumstances.
There has been some evidence of learning within routes, though wider dissemination of this type of information may help to reduce problems in new programmes.
A6. Arrangements for operation of gates to allow access when trains are on fast platforms
Needs planning of suitable arrangements. There can be weaknesses in protection where stations are manned and gates can be left open for a variety of reasons.
This is an issue that still needs some improvements, according to stakeholder interviews.
A7. Cooperation of stakeholders
Multiple stakeholders involved (e.g. Network Rail, train operating company)
This has not been examined in any depth in this evaluation
B1. Installation of fencing to reduce passenger access to fast lines when trains are not stopping
Descriptive evidence of the types of restrictions and the process of installing the fences.
Summaries of evidence have been presented in this report.
B2. Appropriate operation of gates
Arrangements that have been planned (A6) need to be put in place. There are examples of problems of open gates.
This is an issue that still needs some improvements, according to stakeholder interviews.

RESTRAIL SCP1-GA-2011-285153
RESTRAIL-WP5-CIDAUT-D5.2-B2-24102014_public Page 115 of 168 24 October 2014
Component from the logic map
Source of information and content Assessment – coverage, quality, conclusions, future work
C1. Reduction in number of suicides on fast lines
Analysis of statistical data. Perceptions of stakeholders.
Results from a preliminary analysis have been presented, though more in-depth analysis is needed (preferably incorporating data over a longer period of monitoring and including additional explanatory variables and data from additional locations where fencing has been fitted). Feedback has been collected from a small number of stakeholders.
C2. Reduction in number of trespass events on fast lines
Analysis of statistical data, though there are issues relating to the format and aggregation of data
The data types have been examined. There will be need for manipulation of the data to understand any changes in trespass at a station level. Revised approaches to analysis will be considered.
C3. Increased awareness of station staff of potential for suicide attempts at stations
Analysis of numbers of interventions by staff. Perceptions of stakeholders.
The analysis of statistics on interventions has not yet been considered, but will be carried out in future work using data from BTP. Information from a small sample of stakeholders are indicative of a positive attitude of staff. A wider survey would be needed to draw conclusions on staff awareness in stations where fencing has been fitted.
C4. No increase in passenger congestion in the stations
Perceptions of stakeholders Programme staff and station staff have reported that there are no major problems of congestion. It is likely that any minor problems (also raised on the rail forum) can be managed if staff are available at stations.
C5. No adverse impacts on station aesthetics
Perceptions of stakeholders Programme staff and station staff have commented favourably on the appearance of the fences.
C6. Ease of public access maintained to fast line when trains are stopping
Perceptions of stakeholders This is an issue that still needs some improvements, according to stakeholder interviews and comments on the rail forum.
C7. Reduction in costs related to suicides on the network
Data in SMIS database, but limited data collected for recent incidents.
This has not been examined in any depth in this evaluation
C8. Reduction in public perception of stations being a place to commit suicide
There were no plans in this study to use interviews with the public because of limited scope of the evaluation
C9. No displacement of incidents to other lines at stations / other stations or other locations
Some preliminary indication through analysis of statistical data. Perceptions of stakeholders.
This will need monitoring over a longer period of time.
C10. Increased passenger perception of safety on platforms
Perceptions of stakeholders No relevant data found within Passenger Focus survey. Some anecdotal reports of stakeholders suggest that people feel safe on platforms that are protected when very fast trains pass by.
D1. Reduction in the overall numbers of suicides on rail network
Preliminary indication through numbers of events on each of the pilot areas.
This has not been examined at this stage of the evaluation.
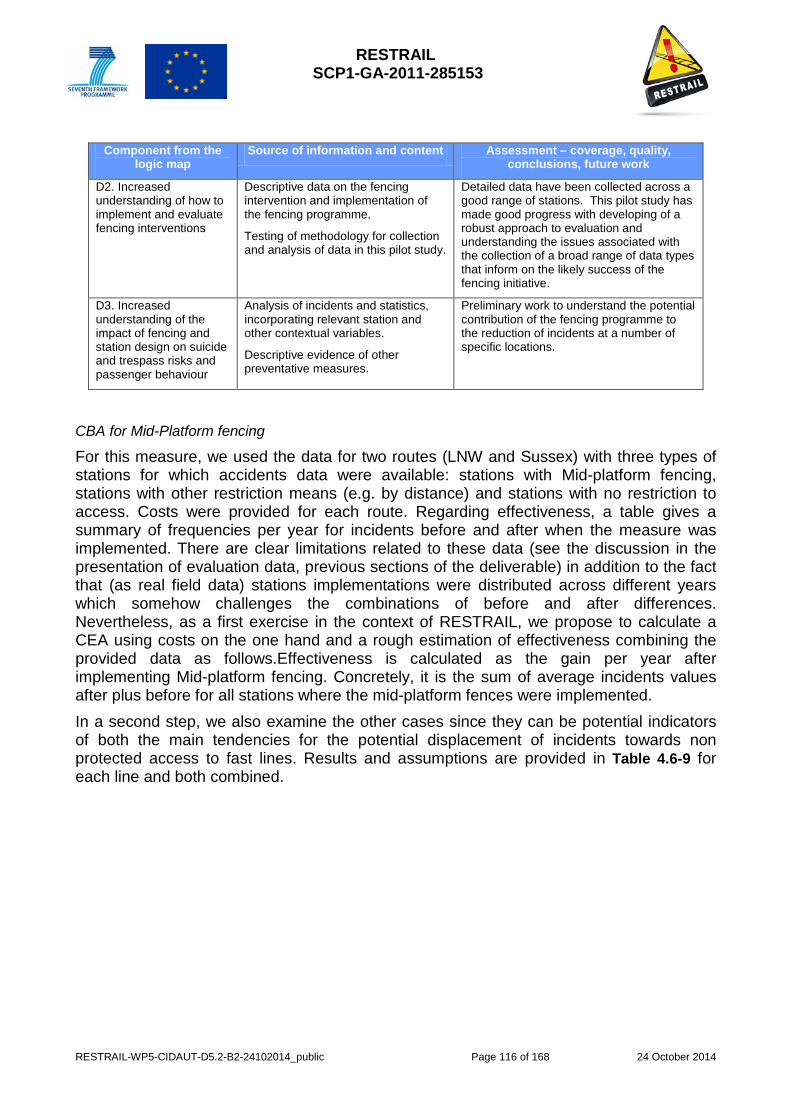
RESTRAIL SCP1-GA-2011-285153
RESTRAIL-WP5-CIDAUT-D5.2-B2-24102014_public Page 116 of 168 24 October 2014
Component from the logic map
Source of information and content Assessment – coverage, quality, conclusions, future work
D2. Increased understanding of how to implement and evaluate fencing interventions
Descriptive data on the fencing intervention and implementation of the fencing programme.
Testing of methodology for collection and analysis of data in this pilot study.
Detailed data have been collected across a good range of stations. This pilot study has made good progress with developing of a robust approach to evaluation and understanding the issues associated with the collection of a broad range of data types that inform on the likely success of the fencing initiative.
D3. Increased understanding of the impact of fencing and station design on suicide and trespass risks and passenger behaviour
Analysis of incidents and statistics, incorporating relevant station and other contextual variables.
Descriptive evidence of other preventative measures.
Preliminary work to understand the potential contribution of the fencing programme to the reduction of incidents at a number of specific locations.
CBA for Mid-Platform fencing
For this measure, we used the data for two routes (LNW and Sussex) with three types of stations for which accidents data were available: stations with Mid-platform fencing, stations with other restriction means (e.g. by distance) and stations with no restriction to access. Costs were provided for each route. Regarding effectiveness, a table gives a summary of frequencies per year for incidents before and after when the measure was implemented. There are clear limitations related to these data (see the discussion in the presentation of evaluation data, previous sections of the deliverable) in addition to the fact that (as real field data) stations implementations were distributed across different years which somehow challenges the combinations of before and after differences. Nevertheless, as a first exercise in the context of RESTRAIL, we propose to calculate a CEA using costs on the one hand and a rough estimation of effectiveness combining the provided data as follows.Effectiveness is calculated as the gain per year after implementing Mid-platform fencing. Concretely, it is the sum of average incidents values after plus before for all stations where the mid-platform fences were implemented. In a second step, we also examine the other cases since they can be potential indicators of both the main tendencies for the potential displacement of incidents towards non protected access to fast lines. Results and assumptions are provided in Table 4.6-9 for each line and both combined.
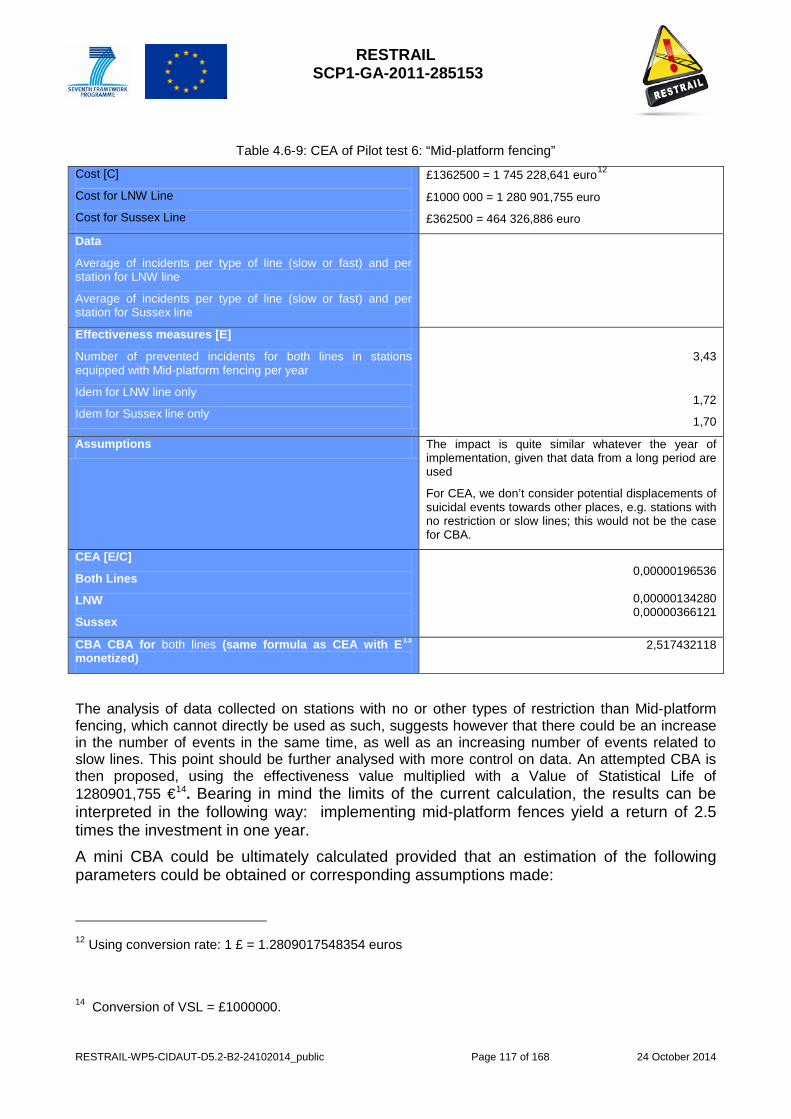
RESTRAIL SCP1-GA-2011-285153
RESTRAIL-WP5-CIDAUT-D5.2-B2-24102014_public Page 117 of 168 24 October 2014
Table 4.6-9: CEA of Pilot test 6: “Mid-platform fencing”
Cost [C]
Cost for LNW Line
Cost for Sussex Line
£1362500 = 1 745 228,641 euro12
£1000 000 = 1 280 901,755 euro
£362500 = 464 326,886 euro
Data
Average of incidents per type of line (slow or fast) and per station for LNW line
Average of incidents per type of line (slow or fast) and per station for Sussex line
Effectiveness measures [E]
Number of prevented incidents for both lines in stations equipped with Mid-platform fencing per year
Idem for LNW line only
Idem for Sussex line only
3,43
1,72
1,70
Assumptions The impact is quite similar whatever the year of implementation, given that data from a long period are used
For CEA, we don’t consider potential displacements of suicidal events towards other places, e.g. stations with no restriction or slow lines; this would not be the case for CBA.
CEA [E/C]
Both Lines
LNW
Sussex
0,00000196536
0,00000134280 0,00000366121
CBA CBA for both lines (same formula as CEA with E13 monetized)
2,517432118
The analysis of data collected on stations with no or other types of restriction than Mid-platform fencing, which cannot directly be used as such, suggests however that there could be an increase in the number of events in the same time, as well as an increasing number of events related to slow lines. This point should be further analysed with more control on data. An attempted CBA is then proposed, using the effectiveness value multiplied with a Value of Statistical Life of 1280901,755 €14. Bearing in mind the limits of the current calculation, the results can be interpreted in the following way: implementing mid-platform fences yield a return of 2.5 times the investment in one year. A mini CBA could be ultimately calculated provided that an estimation of the following parameters could be obtained or corresponding assumptions made:
12 Using conversion rate: 1 £ = 1.2809017548354 euros
14 Conversion of VSL = £1000000.
RESTRAIL SCP1-GA-2011-285153
RESTRAIL-WP5-CIDAUT-D5.2-B2-24102014_public Page 118 of 168 24 October 2014
• distribution of injuries and death related to suicide and suicide attempts; • cost per minute of delay, per network unavailability, per traffic disruption; and • accurate estimate of potential displacements towards other sites
4.6.5 Applicability of results to different circumstances The analysis of various data types suggests the potential value of this type of fencing, though it is only possible in particular circumstances (see section 4.6.6. below for discussion on the need for certain configurations of lines and arrangements for access and opening of the gates in a variety of circumstances). The measure also needs high standards of security / restriction of access at other parts of the station (e.g. lone platforms, platform ends, other fencing to prevent crossing of lines to fast lines).
The fencing is not high (1.4m) and is not intended for those who are determined to go to great lengths to find access to the railway. Staff have commented on how the fencing is at the right height to prevent access, without it becoming too obtrusive and ”looking like a prison”. This type of fencing might therefore be effective as a deterrent to those at stations where behaviours are impulsive (as is thought to be the case in many suicide incidents).
4.6.6 Discussion There have been no previous studies of mid-platform fencing. This type of intervention is different to other platform screening intervention studies. This was a field study, and as would be expected, there were a complex range of circumstances that could impact on the outcome of the intervention. The study included 51 stations, across three of the operations routes in GB. Mid-platform fencing restrictions were provided at 22 of these stations and other restrictions to access to fast lines were identified at 18 of the stations.
The stations in this pilot study are representative of fast, mainline stations and therefore do not represent the circumstances at all other parts of the rail network (see the descriptive statistics on incidents and the differences with national statistics, section 4.6.3.1).
Results on the potential impact of the fencing on the numbers of suicide incidents need to be interpreted with some caution. There seems to be a positive effect of the mid-platform fencing and a range of potential effect sizes have been identified across the stations in the pilot. However, this is a very simple metric for the potential effect size and this does not take account of the other factors that can affect incident rates over time. Where there has been a larger reduction in incidents (per station/year) there may be a selection bias which has inflated the effect size (particular issues may have contributed to high numbers of incidents at particular station). The fencing may have contributed to the reduction of the numbers of incidents, but this is unlikely to have been the only contributing factor (intervention). Smaller effects of the intervention can be explained by the fact that there have not been high numbers of incidents at a station, historically. Furthermore, the monitoring period (post-intervention) has been short and there is need for collection and analysis of statistics over a longer period of time.
Detailed data have been collected on stations and the implementation of the fencing intervention at stations. This is needed to understand the range of design related factors that can influence the numbers of incidents (especially the configurations of lines and platforms). Several lessons have been learned by the organisations involved and these can help to contribute to better design and the ease of implementation of future programmes.
People generally seem to like the fencing (there are some dissenting voices, demonstrating the need for communication around the purpose of the fencing and potential effects of the programme). People think that the fences work in preventing incidents (e.g. acting as a deterrent,

RESTRAIL SCP1-GA-2011-285153
RESTRAIL-WP5-CIDAUT-D5.2-B2-24102014_public Page 119 of 168 24 October 2014
or giving time for people to intervene). The fences are thought to have been put in the right location (it is important to note that they are not suitable everywhere). The fences are thought to have other benefits, such as in increasing perceptions of safety while on platforms and in preventing unsociable behaviour and access to places where people should not be. The fences are also described as looking nice.
There are thought to be few negative effects of the fencing. There are perhaps some issues with crowding, though station managers have found that these can be managed, even when there are large crowds at football matches. One difficult area is in maintaining the integrity of the fencing by ensuring that the access gates are closed. There are circumstances in which the gates need to be opened to allow access to trains and to allow people off trains in a range of circumstances. This situation is easier to manage where there are staff at a station, but much harder to control where a station in not staffed.
There is a need for better data in the future. This includes better data from investigations of incidents (more details on events, the lines of incidents, points of access) and also data on the dates and locations of all preventative measures (to help with interpretation of the likely effectiveness of interventions).
Mid-platform fencing has a role to play alongside other preventative measures. It is likely to be very effective when used in the right locations, but it can’t be used everywhere.
RESTRAIL SCP1-GA-2011-285153
RESTRAIL-WP5-CIDAUT-D5.2-B2-24102014_public Page 120 of 168 24 October 2014
4.7 Societal collaboration to prevent railway suicide- TrV&KAU
4.7.1 Overview of the piloted measure This measure is collaboration among local authorities in the society to prevent railway suicide. When there is a threat of suicide a collaborated emergency plan is activated that involves both the infrastructure manager and other societal stakeholders. The involved parties go to the site where a threat of suicide have been reported and act to prevent a train-person collision.
The major part of the measure is that the train traffic is adapted to prevent a collision from happening when an unauthorized person is detected in the railway system. Another important part of the measure is that the involved stakeholders go to the identified site to perform the search and rescue. The temporary traffic shutdown or speed reduction ensures the safety of the person at risk, but also the safety for the police, rescue services and ambulance, the parties responsible for conducting search and rescue. See more in chapter 5.7.1 in Deliverable 5.1 (Kallberg, Plaza, Silla, García et al, 2014)
4.7.2 Methodology to evaluate the piloted measures In the evaluation of the measure, the following methods were used:
− Qualitative interviews with stakeholders Eight interviews have been conducted with participants in the collaboration about their experiences of working together. Among those, there are representatives from the police, the fire brigade and the National Transport Administration. Each interview was semi-structured and based on a list of themes that was accounted for in all the interviews. Sometimes the respondents' answers lead to new questions to follow up. The questions could also vary depending on the information given. The interviews were then transcribed and analysed based on a method of content analysis. The interviews were coded in meaning units, categorised and condensed into main themes (Hsieh and Shannon, 2005).
− Quantitative analysis of relevant events in the targeted rail network from June 1st to December 31st, 2013.
All registered events in the Transport Administration database were analysed together with rail-related incidents from the police database. A total of 185 events that occurred during the seven month period June 1 to December 31, 2013, have been studied. The data report shows on when - where - how these events have occurred and the delays that these events have caused.
4.7.3 Reported costs for measure
Reported costs for the measure implemented are given Table 4.7-1.
Table 4.7-1: Societal collaboration to prevent railway suicide Cost Nature value
Travel costs for meetings 2 times a year (estimated travel cost per meeting/person: 30 EUR)
8 persons x 2 meetings x 30 €
480 €
Personell costs á 3 hours each meeting (estimated cost per hour/person 80 EUR)
8 persons x 2 meetings x 3 hours x 80 €
3 840 €
Total 4 320 €
RESTRAIL SCP1-GA-2011-285153
RESTRAIL-WP5-CIDAUT-D5.2-B2-24102014_public Page 121 of 168 24 October 2014
4.7.4 Evaluation results The outcome of the qualitative interview study shows three main themes that can summarize the experience of the involved participant in the societal collaboration in Skåne. These themes are: thoughts about the value of the collaboration, the importance of communication and experiences of working with traffic stops.
Thoughts about the value of the collaboration
The ”Blue-light-” collaboration started out as a project, initiated by the police, and was later decided as the common way of working together. Initially there were some doubts from the persons working about this new task, but eventually, gaining experiences and knowledge with this project, is now considered to be an ordinary part of the daily work. As one of participants, from the rescue services, writes: “the task to act whenever there is a threat for suicide in the railway is now our work.
The purpose of this collaboration is to save lives by stopping the trains and remove the person who has threatened to take their life and this initiative has huge benefits. It is short traffic stops instead of the long stops (approximately 2 hours) that a person-train accident would cause.
There is a lot to gain from reducing the number of suicides in the railway system since a suicide does not only affect the relatives and friends, but it also causes delays, that in their turn cause problems for both the infrastructure manager, the train companies and the passengers. According to the rescue services/fire brigade suicide and trespass accidents in the railway system is one of the more demanding and tough tasks they face.
Importance of communication
When there is an alert that someone unauthorized is in the track, it usually comes through the Police or the emergency call centre. The Emergency call centre makes contact with the transport administration, to ask for the trains to be stopped (if there is knowledge of exactly where the person is) or a speed reduction (if there is uncertainty of the exact spot) if an area needs to be searched. The emergency call centre alerts the other participants. But there are also alerts from train drivers if they see someone in the wrong place. In those events, the Train Control centre alerts the emergency call centre, and they make contact to police, rescue service and ambulance.
It is important that direct contact is established between the Traffic Management/traffic control centres emergency telephone and the officer in command at the search site (police or emergency services, depending on who is first to arrive) so that no communication goes through any other channels of communication, for example, the police call centre. This can be complicated since those involved in the rescue use the Rakel-phone (radio system, Swedish version of the TETRA-system), and this is not necessarily the phone used by the train control centre, at least not the phone used by one responsible for stopping the traffic and restarting it again. The Transport Administration want all incoming alerts to go through a designated phone at the train control centre, this since it is listened to by others that also might get involved (for example if the traction current electricity needs to be shut off).
A Rakel-phone is a joint phone system among the “blue-light” authorities and now it is also used by parts the Train Control centre in the region. The advantage with Rakel is that everyone gets the same information which is a huge benefit when there is an acute situation. But, there can be problems in the train control centre, since the person using the Rakel-phone is not the same as the person handling the traffic. This might give a sense of false safety for the others that believe that the person running the traffic and stopping the train can hear what they are saying. This is a potential for improvement. To maintain a good quality and avoid long traffic stop the Transport Administration should expand the cooperation and improve communication so they can support the other participants. This would in turn support the rescue services that work in track environment to save lives. They give the opportunity to get the traffic back to normal again as soon as possible.
RESTRAIL SCP1-GA-2011-285153
RESTRAIL-WP5-CIDAUT-D5.2-B2-24102014_public Page 122 of 168 24 October 2014
The other stakeholders have expressed that there is confusion about who to communicate with at the Transport Administration. Often it may be several different persons involved in a situation/conversation. The traffic management and operational management within the transport administration is different people.
For the safety of everyone, the communication needs to be optimized and it is essential that everyone uses a “language” that is understood by everyone. There have been problems since the railway use kilometre of the track and the other participants’ use a GPS coordinate and/or refer to the road system.
Experiences of working with traffic stops
The Collaboration is now a reality; it has turned from being a project into a phase where it is managed on daily bases. Everyone involved recognize that the collaboration is important and can see advantages in that the rescue services can support the police, and many times even act faster than the police and remove the suicidal person themselves. There is a constant evaluation going in this work, where the participants meet and go through the deviations that have happened.
It is and important issue that anyone can ask for the traffic stop but only those present on the scene can evoke. The emergency call centre can never evoke the traffic stop. Different authorities have their own chain of command and the rescue services always call on an officer in command to go to the scene to facilitate decision making between the participants.
When the mission is finished, everyone gets together to make sure that no one is still working in the track area. Only when everyone is accounted for the traffic stop can be called off.
It is also important that the police or rescue service not make demands for more than a traffic stop. There is no need to shut down the power in the overhead lines to perform search and rescue. Shutting down the power means that a very large part of the railway system is down and that many trains are left on the track without working toilets or air-condition/heating. A traffic stop is sufficient enough.
The train operators want the search and rescue to work more with speed reductions than traffic stops. This is also a view that the train control centre is known to support. If there is a specific place that is known, a traffic stop is arranged, but if not, for the sake of traffic, it gives a huge difference if a temporary speed reduction is put in place. A speed reduction can always be changed for a traffic stop at a later time, and a traffic stop can also be changed into a temporary speed reduction.
Quantitative results
To gain more knowledge on the situation in Skåne concerning trespass and suicide threats, data have been compiled during a seven month period. The quantitative part of this report has analyzed these data to describe the situation during this period.
The numbers of events that have been reviewed are 185 cases in the period of 2013-06-01 to 2013-12-31. There have been 111 cases of traffic stops, and 28 with a temporary speed reduction. 64 threats of suicide and 40 persons have been taken into custody by the police (and referred to psychiatric care).In this study only “threat of suicide” has been examined since this is a project to prevent suicides. A breakdown of incidents and threats of suicide occurred in Skåne, (Malmö maintenance area and Hässleholms maintenance area). There are some comments regarding the different variables under each table.
Threat of suicide (total= 64)
When these events occur:

RESTRAIL SCP1-GA-2011-285153
RESTRAIL-WP5-CIDAUT-D5.2-B2-24102014_public Page 123 of 168 24 October 2014
- By Month
During the summer months there are few cases and during Sept–Dec, there is a fairly even distribution (11–14 threat of suicide) as it is collected in Table 4.7-2.
Table 4.7-2: Number of suicide threats by month
Month Nº of incidents June 3 July 9 August 1 September 13 October 14 November 11 December 13 Total 64
- By weekday
Most incidents registered occur on Tuesday and Saturday (14 cases) and least Thursday (4 cases) (Table 4.7-3).
Table 4.7-3: Number of suicide threats by weekday
Weekday Nº of incidents Sunday 5 Monday 8 Tuesday 14 Wednesday 11 Thursday 4 Friday 8 Saturday 14 Total 64
- Time of day
Even between 12 and 24, and from midnight until 12 (Table 4.7-4). Table 4.7-4: Number of suicide threats by time of day
Time of day Nº of incidents 06-09 3 12-15 12 15-18 13 18-21 11 21-24 12 24-03 4 03-06 3 09-12 6 Total n:o 64
- Where these events occur
- Access point: Most incidents are on the platform or in the station area close to the platform (Table 4.7-5).
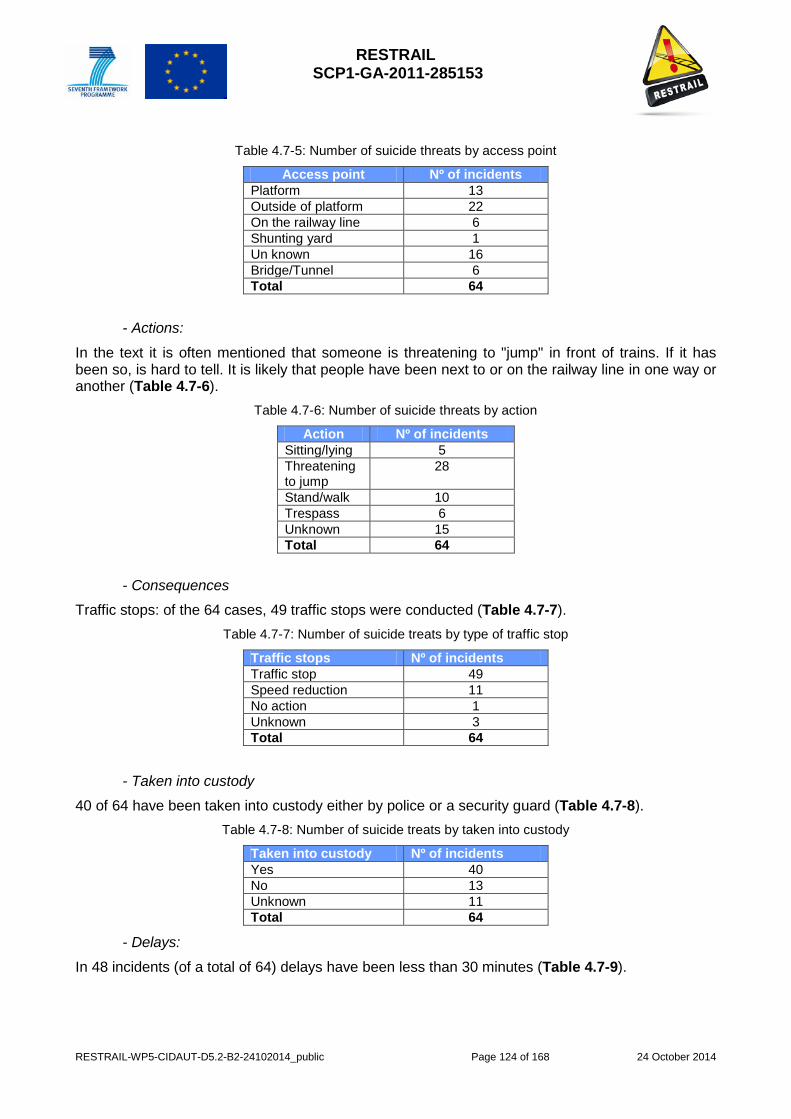
RESTRAIL SCP1-GA-2011-285153
RESTRAIL-WP5-CIDAUT-D5.2-B2-24102014_public Page 124 of 168 24 October 2014
Table 4.7-5: Number of suicide threats by access point
Access point Nº of incidents Platform 13 Outside of platform 22 On the railway line 6 Shunting yard 1 Un known 16 Bridge/Tunnel 6 Total 64
- Actions:
In the text it is often mentioned that someone is threatening to "jump" in front of trains. If it has been so, is hard to tell. It is likely that people have been next to or on the railway line in one way or another (Table 4.7-6).
Table 4.7-6: Number of suicide threats by action
Action Nº of incidents Sitting/lying 5 Threatening to jump
28
Stand/walk 10 Trespass 6 Unknown 15 Total 64
- Consequences
Traffic stops: of the 64 cases, 49 traffic stops were conducted (Table 4.7-7). Table 4.7-7: Number of suicide treats by type of traffic stop
Traffic stops Nº of incidents Traffic stop 49 Speed reduction 11 No action 1 Unknown 3 Total 64
- Taken into custody
40 of 64 have been taken into custody either by police or a security guard (Table 4.7-8). Table 4.7-8: Number of suicide treats by taken into custody
Taken into custody Nº of incidents Yes 40 No 13 Unknown 11 Total 64
- Delays:
In 48 incidents (of a total of 64) delays have been less than 30 minutes (Table 4.7-9).
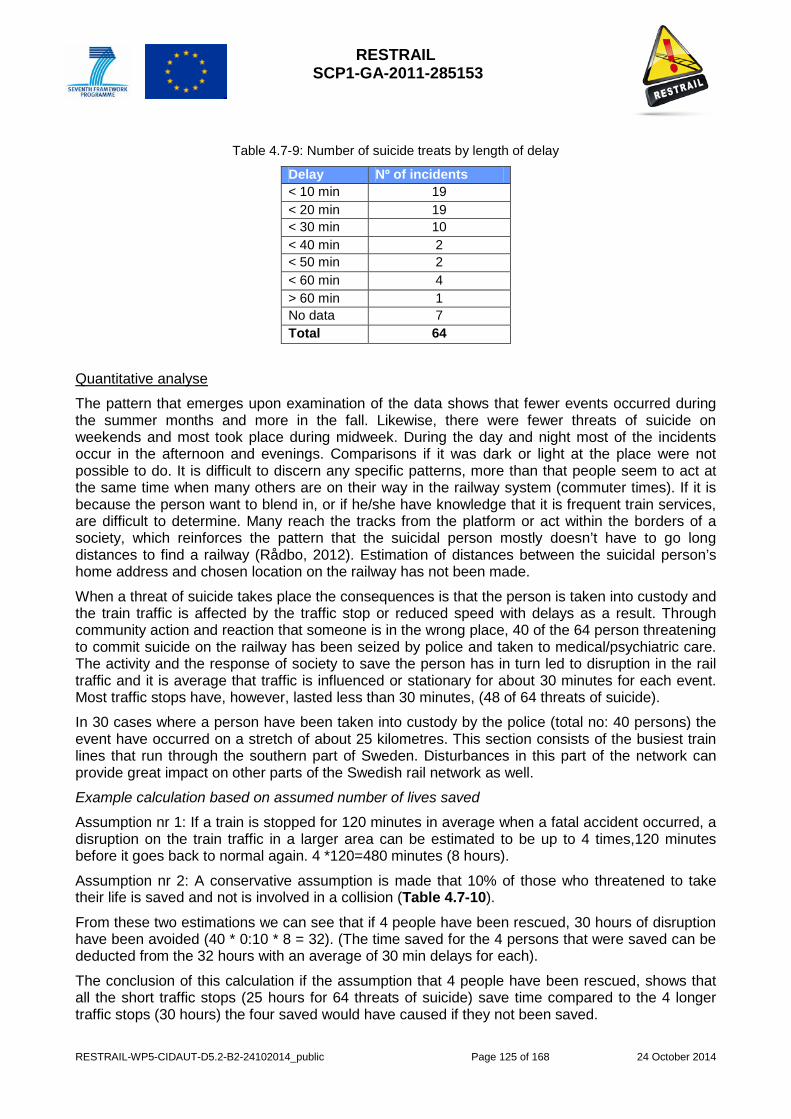
RESTRAIL SCP1-GA-2011-285153
RESTRAIL-WP5-CIDAUT-D5.2-B2-24102014_public Page 125 of 168 24 October 2014
Table 4.7-9: Number of suicide treats by length of delay
Delay Nº of incidents < 10 min 19 < 20 min 19 < 30 min 10 < 40 min 2 < 50 min 2 < 60 min 4 > 60 min 1 No data 7 Total 64
Quantitative analyse
The pattern that emerges upon examination of the data shows that fewer events occurred during the summer months and more in the fall. Likewise, there were fewer threats of suicide on weekends and most took place during midweek. During the day and night most of the incidents occur in the afternoon and evenings. Comparisons if it was dark or light at the place were not possible to do. It is difficult to discern any specific patterns, more than that people seem to act at the same time when many others are on their way in the railway system (commuter times). If it is because the person want to blend in, or if he/she have knowledge that it is frequent train services, are difficult to determine. Many reach the tracks from the platform or act within the borders of a society, which reinforces the pattern that the suicidal person mostly doesn’t have to go long distances to find a railway (Rådbo, 2012). Estimation of distances between the suicidal person’s home address and chosen location on the railway has not been made.
When a threat of suicide takes place the consequences is that the person is taken into custody and the train traffic is affected by the traffic stop or reduced speed with delays as a result. Through community action and reaction that someone is in the wrong place, 40 of the 64 person threatening to commit suicide on the railway has been seized by police and taken to medical/psychiatric care. The activity and the response of society to save the person has in turn led to disruption in the rail traffic and it is average that traffic is influenced or stationary for about 30 minutes for each event. Most traffic stops have, however, lasted less than 30 minutes, (48 of 64 threats of suicide).
In 30 cases where a person have been taken into custody by the police (total no: 40 persons) the event have occurred on a stretch of about 25 kilometres. This section consists of the busiest train lines that run through the southern part of Sweden. Disturbances in this part of the network can provide great impact on other parts of the Swedish rail network as well.
Example calculation based on assumed number of lives saved
Assumption nr 1: If a train is stopped for 120 minutes in average when a fatal accident occurred, a disruption on the train traffic in a larger area can be estimated to be up to 4 times,120 minutes before it goes back to normal again. 4 *120=480 minutes (8 hours).
Assumption nr 2: A conservative assumption is made that 10% of those who threatened to take their life is saved and not is involved in a collision (Table 4.7-10).
From these two estimations we can see that if 4 people have been rescued, 30 hours of disruption have been avoided (40 * 0:10 * 8 = 32). (The time saved for the 4 persons that were saved can be deducted from the 32 hours with an average of 30 min delays for each).
The conclusion of this calculation if the assumption that 4 people have been rescued, shows that all the short traffic stops (25 hours for 64 threats of suicide) save time compared to the 4 longer traffic stops (30 hours) the four saved would have caused if they not been saved.
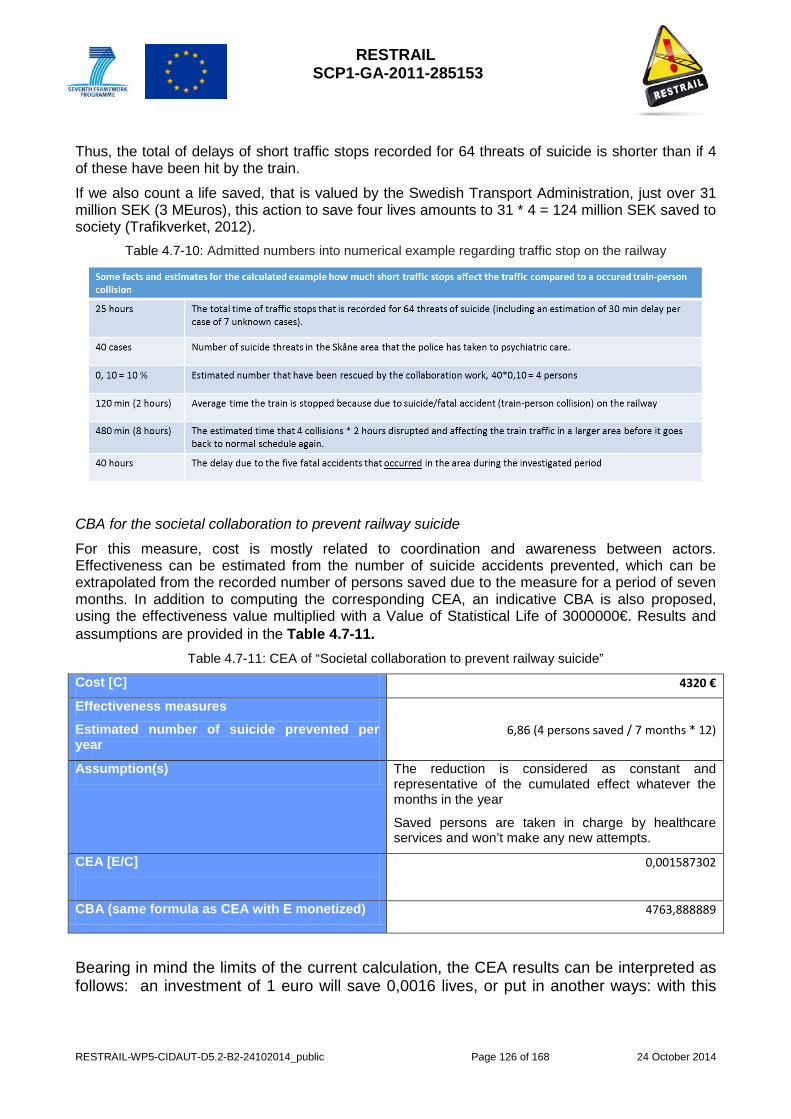
RESTRAIL SCP1-GA-2011-285153
RESTRAIL-WP5-CIDAUT-D5.2-B2-24102014_public Page 126 of 168 24 October 2014
Thus, the total of delays of short traffic stops recorded for 64 threats of suicide is shorter than if 4 of these have been hit by the train.
If we also count a life saved, that is valued by the Swedish Transport Administration, just over 31 million SEK (3 MEuros), this action to save four lives amounts to 31 * 4 = 124 million SEK saved to society (Trafikverket, 2012).
Table 4.7-10: Admitted numbers into numerical example regarding traffic stop on the railway
CBA for the societal collaboration to prevent railway suicide
For this measure, cost is mostly related to coordination and awareness between actors. Effectiveness can be estimated from the number of suicide accidents prevented, which can be extrapolated from the recorded number of persons saved due to the measure for a period of seven months. In addition to computing the corresponding CEA, an indicative CBA is also proposed, using the effectiveness value multiplied with a Value of Statistical Life of 3000000€. Results and assumptions are provided in the Table 4.7-11.
Table 4.7-11: CEA of “Societal collaboration to prevent railway suicide”
Cost [C] 4320 €
Effectiveness measures
Estimated number of suicide prevented per year
6,86 (4 persons saved / 7 months * 12)
Assumption(s) The reduction is considered as constant and representative of the cumulated effect whatever the months in the year
Saved persons are taken in charge by healthcare services and won’t make any new attempts.
CEA [E/C]
0,001587302
CBA (same formula as CEA with E monetized) 4763,888889
Bearing in mind the limits of the current calculation, the CEA results can be interpreted as follows: an investment of 1 euro will save 0,0016 lives, or put in another ways: with this
RESTRAIL SCP1-GA-2011-285153
RESTRAIL-WP5-CIDAUT-D5.2-B2-24102014_public Page 127 of 168 24 October 2014
measure, an investment of 630 Euros corresponds to one saved life). The CBA ratio can be interpreted as the fact that an investment of 1 euro will yield 4764 euros. It is worth to note that a complete CBA should take a real account of all impacts, including delays due to the measure as well as any other impacts on staff, drivers etc. To go a step further, it would be also required to be able to distinguish between traffic interruptions and delays generated from these interruptions due to an intervention and those due to accidents or incidents that were not detected. A more extensive discussion on these impacts and potential benefits can be found in the section dedicated to providing results for this measure.
4.7.5 Applicability of results to different circumstances The collaboration between the authorities needs to be seen from different contexts in different countries. The society and public resources is used in different ways. But since suicide is a public health problem there is a need not only for the work of the authorities respectively, but also for their joint collaboration. In an emergency situation, when someone is threatening to take their life, the society has a very limited time to act. If the authorities join forces, a result can be achieved that would not have been possible otherwise. The achieved result is a great success for society. During this study we have learned that a very clear communication between the participants is of great importance. Not only because of safety reasons, but also to better achieve success and create opportunities to save lives.
4.7.6 Discussion The purpose of the measure is to create good circumstances for a proactive societal collaboration when there is a threat of suicide in the railway system, and by this reduce the number of fatalities and injured persons due to suicide attempts.
Societal collaboration as a measure of suicide prevention is an activity that all the involved parties believe makes a difference, and are certain that lives have been saved. The partnership in the collaboration has created good circumstances to act if there is a person who threatens to take his or her life. By interviewing and examining data concerning past events, the result show that this action can be considered as an effective measure to prevent suicide on railways.
According to the quantitative analysis, 40 of the 64 persons threatening to commit suicide has been found and taken (into custody) by the police. Very few suicide prevention measures are as close to potential suicidal persons and have the opportunity to influence the outcome the same way as does this societal collaboration.
Skåne and the areas where most trespasses are reported is a relatively densely populated area with some major cities with a large population. Thirty or forty threats of suicide have occurred on a stretch of about 25 kilometres. This section consists of the busiest train lines that run through the southern part of Sweden. Disturbances in this part of the network can provide considerable impact on other parts of the network as well.
Consequently, societal collaboration is a method of suicide prevention that saves lives and all the involved parties believe that their work makes a difference
Good communication is essential when different stakeholders work together in a dangerous environment (railway area).
40 of 64 suicidal persons has been found and taken to psychiatric care by the police.

RESTRAIL SCP1-GA-2011-285153
RESTRAIL-WP5-CIDAUT-D5.2-B2-24102014_public Page 128 of 168 24 October 2014
A first try of assumption and calculation show that the train service is less disturbed by short traffic stop on more occasions than of an actual fatal accident.
Based on the pattern of how and where suicidal persons are acting it is clear that the problems are largest within towns.
For this area most events occur on a relatively small part of the railway system.
Along with increased fencing and developed camera surveillance this societal cooperation is an effective measure to prevent suicide. The huge strength in the measure is that instead of expecting the suicidal person to reconsider and turn away from the railway property and the suicide intent, there are fellow human beings that react and try to stop a suicidal person to act out (Rådbo 2012).
RESTRAIL SCP1-GA-2011-285153
RESTRAIL-WP5-CIDAUT-D5.2-B2-24102014_public Page 129 of 168 24 October 2014
4.8 Gatekeeper Programme – HMGU
4.8.1 Overview of the piloted measure Previous research (Lukaschek K, Baumert J, Ladwig KH. Behavioural patterns preceding a railway suicide: Explorative study of German Federal Police officers’ experiences. BMC Public Health (2011) 11: 620; Gaylord MS, Lester D: Suicide in the Hong Kong subway. Soc Sci Med1994, 38:427-430;; O’Donnell I, Farmer R, Tranah T: Suicide on railways. Soc Sci Med 1994,39:399-400) has shown that subjects willing to commit railway suicide display distinctive behavioural patterns prior to the suicide. Additionally, high risk time windows for railway suicide have been identified (Karoline Lukaschek, Jens Baumert, Natalia Erazo, Karl-Heinz Ladwig (2014). Stable time patterns of railway suicides in Germany: comparative analysis of 7,187 cases across two observation periods (1995–1998; 2005–2008). BMC Public Health 2014, 14:124; Erazo N, Baumert J, Ladwig KH. Factors associated with failed and completed railway suicides. J Affect Disord (2005) 88, 137-43;; Erazo NS, Baumert J, Ladwig KH. Sex specific time patterns of suicidal acts on the German railway system. An analysis of 4003 cases. J Affect Disord (2004) 83: 1-9); van Houwelingen CA, Beersma DG: Seasonal changes in 24-h patterns of suicide rates: a study on train suicides in The Netherlands. J Affect Disord 2001, 66:215-223). Gatekeepers are frontline staff, whose contact with potentially vulnerable subjects provides an opportunity to identify at-risk individuals. Gatekeepers possess 1) knowledge about high risk time windows for railway suicide, 2) awareness of deviant behaviour preceding railway suicide, 3) the courage to show initiative, and 4) the ability to handle people in despair. Gatekeeper training is one of the most effective approaches to prevent suicide (Mann JJ, Apter A, Bertolote J, Beautrais A, Currier D, Haas A, et al: Suicideprevention strategies: a systematic review. JAMA 2005, 294:2064-2074.), but up to now, there is only one gatekeeper training programme (run by The Samaritans and British Rail) for individuals working in a railway environment
The Gatekeeper Programme developed by HMGU within the RESTRAIL framework addresses railway frontline staff and individuals working in a railway environment (e.g. Police Officers, train drivers, security personnel, aid organisations, Samaritans). Its objectives were a) the prevention of railway suicides by intervention of staff working in a railway environment when being confronted with apparently suspicious behaviour during their daily routine work, b) the enhancement of staff’s intervention skills when being confronted with apparently suspicious behaviour during their daily routine work.
The HMGU Gatekeeper Programme was designed as a 4 h taught course with different modules (see Kallberg, Plaza, Silla, García et al, 2014) for a maximum of 12-15 participants.
4.8.2 Methodology to evaluate the piloted measures The measure is targeted to prevent railway suicides by intervention of staff working in a railway environment when being confronted with apparently suspicious behaviour during their daily routine work. The evaluated effects concern the knowledge about and attitudes towards (railway) suicides of those working in a railway environment.
The evaluation consists of the change in knowledge about, and attitudes towards, railway suicide among two time points:
- Time point 1 (t1): baseline assessment shortly before the gatekeeper course.
- Time point 2 (t2): Post-intervention assessment shortly after the gatekeeper course
- Time point 3 (t3): Post-intervention assessment three months after the gatekeeper course. Note: Information at t3 was obtained from 10 participants only (N=10).
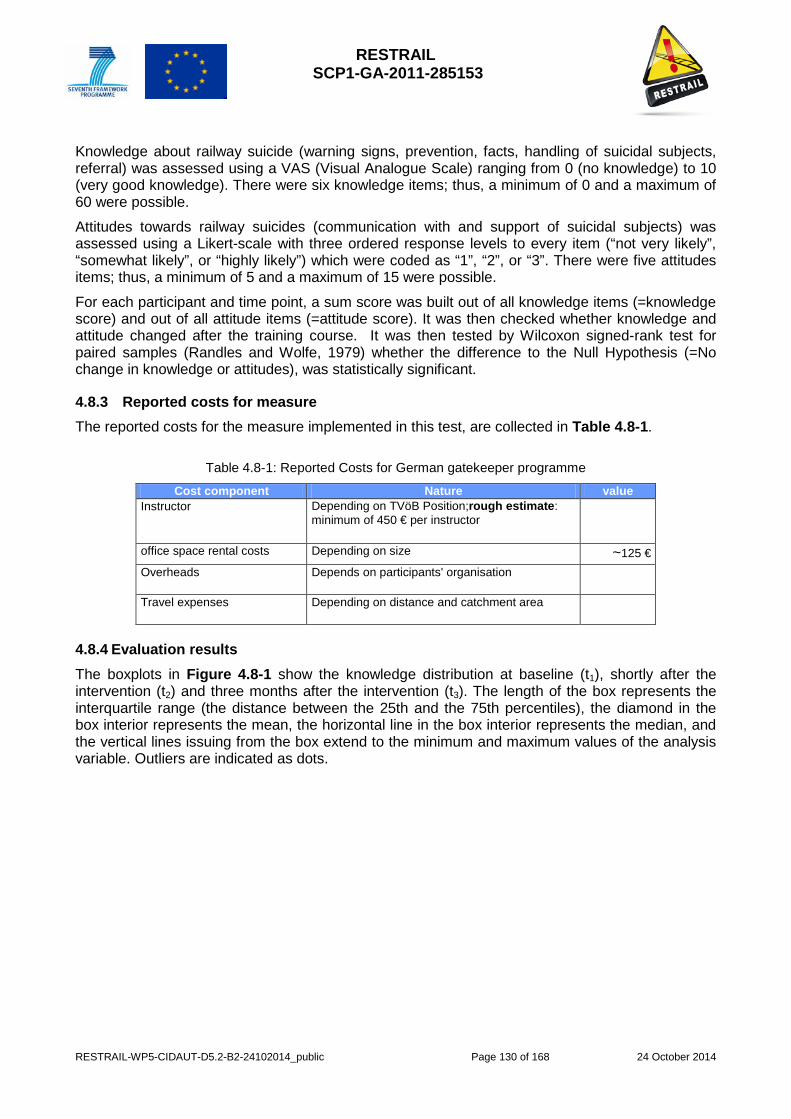
RESTRAIL SCP1-GA-2011-285153
RESTRAIL-WP5-CIDAUT-D5.2-B2-24102014_public Page 130 of 168 24 October 2014
Knowledge about railway suicide (warning signs, prevention, facts, handling of suicidal subjects, referral) was assessed using a VAS (Visual Analogue Scale) ranging from 0 (no knowledge) to 10 (very good knowledge). There were six knowledge items; thus, a minimum of 0 and a maximum of 60 were possible.
Attitudes towards railway suicides (communication with and support of suicidal subjects) was assessed using a Likert-scale with three ordered response levels to every item (“not very likely”, “somewhat likely”, or “highly likely”) which were coded as “1”, “2”, or “3”. There were five attitudes items; thus, a minimum of 5 and a maximum of 15 were possible.
For each participant and time point, a sum score was built out of all knowledge items (=knowledge score) and out of all attitude items (=attitude score). It was then checked whether knowledge and attitude changed after the training course. It was then tested by Wilcoxon signed-rank test for paired samples (Randles and Wolfe, 1979) whether the difference to the Null Hypothesis (=No change in knowledge or attitudes), was statistically significant.
4.8.3 Reported costs for measure The reported costs for the measure implemented in this test, are collected in Table 4.8-1.
Table 4.8-1: Reported Costs for German gatekeeper programme
Cost component Nature value Instructor Depending on TVöB Position;rough estimate:
minimum of 450 € per instructor
office space rental costs Depending on size ~125 € Overheads Depends on participants' organisation
Travel expenses Depending on distance and catchment area
4.8.4 Evaluation results The boxplots in Figure 4.8-1 show the knowledge distribution at baseline (t1), shortly after the intervention (t2) and three months after the intervention (t3). The length of the box represents the interquartile range (the distance between the 25th and the 75th percentiles), the diamond in the box interior represents the mean, the horizontal line in the box interior represents the median, and the vertical lines issuing from the box extend to the minimum and maximum values of the analysis variable. Outliers are indicated as dots.
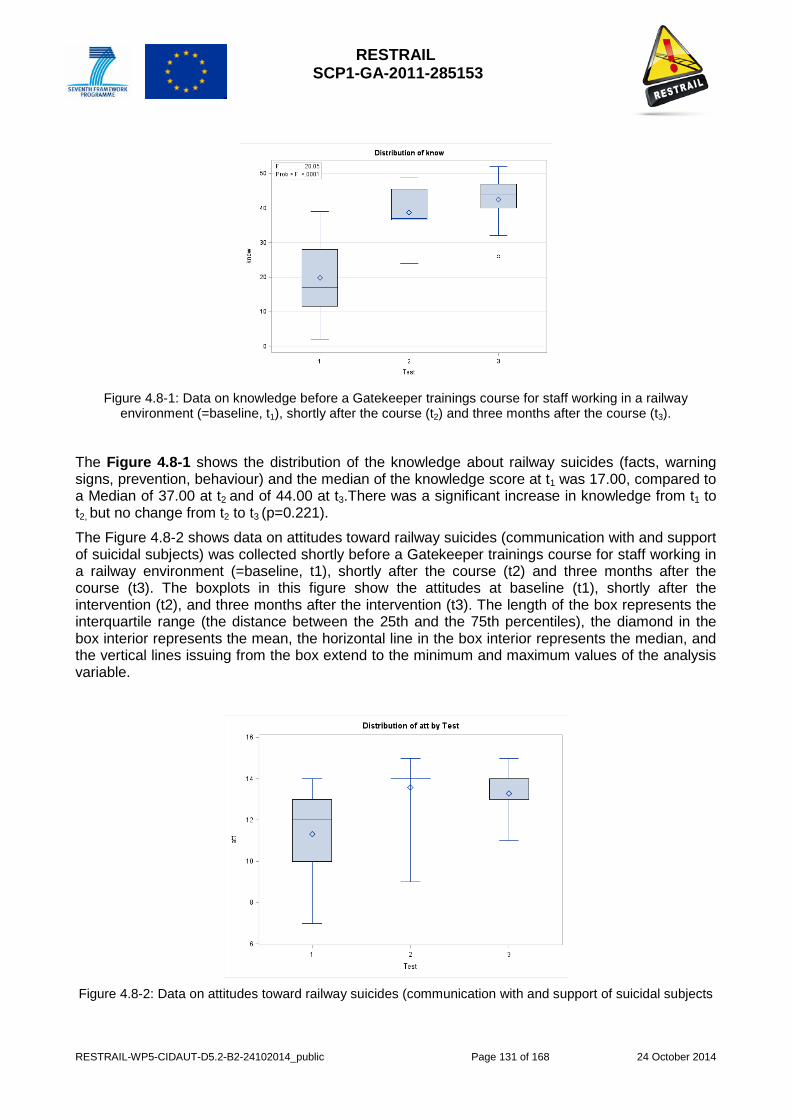
RESTRAIL SCP1-GA-2011-285153
RESTRAIL-WP5-CIDAUT-D5.2-B2-24102014_public Page 131 of 168 24 October 2014
Figure 4.8-1: Data on knowledge before a Gatekeeper trainings course for staff working in a railway
environment (=baseline, t1), shortly after the course (t2) and three months after the course (t3).
The Figure 4.8-1 shows the distribution of the knowledge about railway suicides (facts, warning signs, prevention, behaviour) and the median of the knowledge score at t1 was 17.00, compared to a Median of 37.00 at t2 and of 44.00 at t3.There was a significant increase in knowledge from t1 to t2, but no change from t2 to t3 (p=0.221).
The Figure 4.8-2 shows data on attitudes toward railway suicides (communication with and support of suicidal subjects) was collected shortly before a Gatekeeper trainings course for staff working in a railway environment (=baseline, t1), shortly after the course (t2) and three months after the course (t3). The boxplots in this figure show the attitudes at baseline (t1), shortly after the intervention (t2), and three months after the intervention (t3). The length of the box represents the interquartile range (the distance between the 25th and the 75th percentiles), the diamond in the box interior represents the mean, the horizontal line in the box interior represents the median, and the vertical lines issuing from the box extend to the minimum and maximum values of the analysis variable.
Figure 4.8-2: Data on attitudes toward railway suicides (communication with and support of suicidal subjects
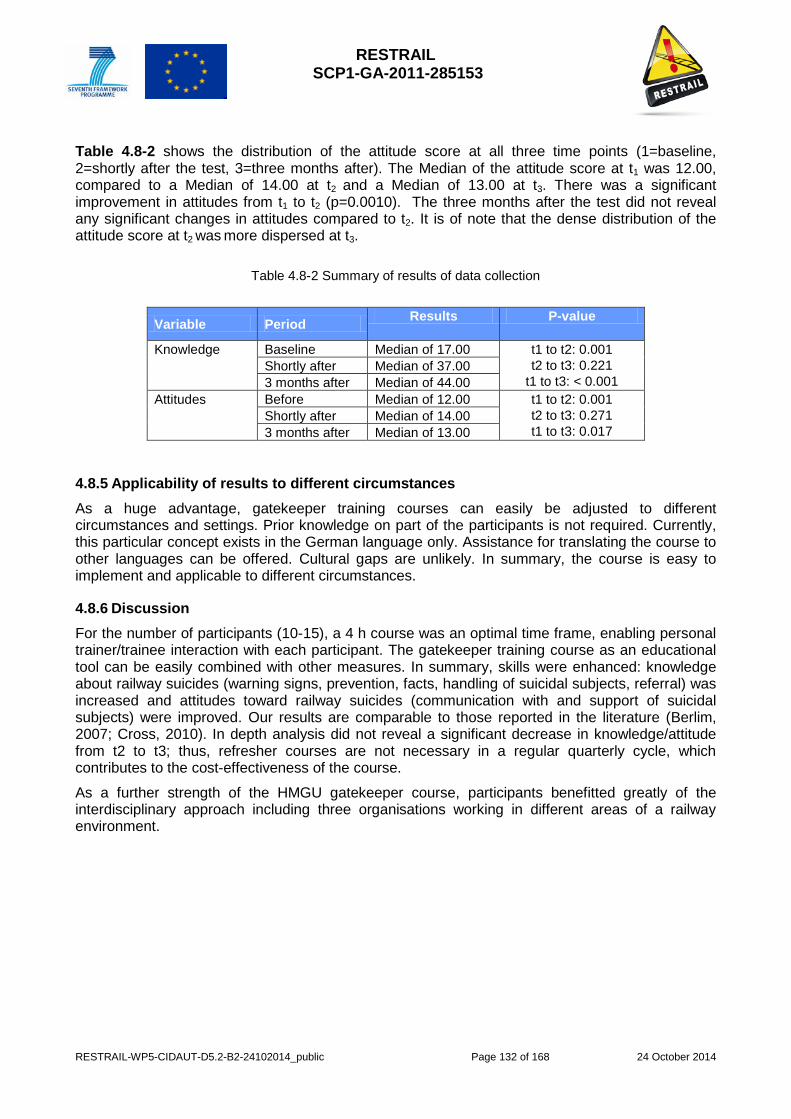
RESTRAIL SCP1-GA-2011-285153
RESTRAIL-WP5-CIDAUT-D5.2-B2-24102014_public Page 132 of 168 24 October 2014
Table 4.8-2 shows the distribution of the attitude score at all three time points (1=baseline, 2=shortly after the test, 3=three months after). The Median of the attitude score at t1 was 12.00, compared to a Median of 14.00 at t2 and a Median of 13.00 at t3. There was a significant improvement in attitudes from t1 to t2 (p=0.0010). The three months after the test did not reveal any significant changes in attitudes compared to t2. It is of note that the dense distribution of the attitude score at t2 was more dispersed at t3.
Table 4.8-2 Summary of results of data collection
Variable Period Results P-value
Knowledge Baseline Median of 17.00 t1 to t2: 0.001 t2 to t3: 0.221
t1 to t3: < 0.001 Shortly after Median of 37.00 3 months after Median of 44.00
Attitudes Before Median of 12.00 t1 to t2: 0.001 t2 to t3: 0.271 t1 to t3: 0.017
Shortly after Median of 14.00 3 months after Median of 13.00
4.8.5 Applicability of results to different circumstances As a huge advantage, gatekeeper training courses can easily be adjusted to different circumstances and settings. Prior knowledge on part of the participants is not required. Currently, this particular concept exists in the German language only. Assistance for translating the course to other languages can be offered. Cultural gaps are unlikely. In summary, the course is easy to implement and applicable to different circumstances.
4.8.6 Discussion For the number of participants (10-15), a 4 h course was an optimal time frame, enabling personal trainer/trainee interaction with each participant. The gatekeeper training course as an educational tool can be easily combined with other measures. In summary, skills were enhanced: knowledge about railway suicides (warning signs, prevention, facts, handling of suicidal subjects, referral) was increased and attitudes toward railway suicides (communication with and support of suicidal subjects) were improved. Our results are comparable to those reported in the literature (Berlim, 2007; Cross, 2010). In depth analysis did not reveal a significant decrease in knowledge/attitude from t2 to t3; thus, refresher courses are not necessary in a regular quarterly cycle, which contributes to the cost-effectiveness of the course.
As a further strength of the HMGU gatekeeper course, participants benefitted greatly of the interdisciplinary approach including three organisations working in different areas of a railway environment.

RESTRAIL SCP1-GA-2011-285153
RESTRAIL-WP5-CIDAUT-D5.2-B2-24102014_public Page 133 of 168 24 October 2014
4.9 Gatekeeper Programme – PRORAIL
4.9.1 Overview of the piloted measure ProRail and NS (Largest Railway Undertaking in the Netherlands) have developed a one-day gatekeeper course for people working in the railway environment. This course was developed during the year 2013 after the example of the Samaritans/Network Rail course “Managing Suicidal Contacts” in the UK and adjusted to the Dutch context. The course takes 6 hours (from 9.30 to 15.30 o’clock). This kind of course-group consists of 9 to 12 participants.
The course consists of a work book with examples, exercises and information. Following a PowerPoint presentation, the trainers guide them through the facts concerning suicidal behaviour. They are guided through recognising suicidal behaviour and they exercise with approaching suspicious people and starting a conversation with them. The participants learn how to:
- make contact,
- move to a safe place,
- listen,
- refer (to crisis hotline 113 Online) and,
- conclude the contact.
Effect mechanism
The hypothesis is that after taking the course, railway personnel will feel better equipped to recognise, act on, and deal with vulnerable or suicidal people, thus, these workers are able to prevent the occurrence of this type of incidents.
4.9.2 Methodology to evaluate the piloted measures The evaluation of the course was conducted in two ways:
1. An in-depth interview study 2. Effect analysis: statistical before-after analysis with a control group
In-depth interview study
In total, 10 interviews were held with 11 employees of NS, the largest railway undertaking for passengers in the Netherlands. Two employees took the interview together, because they also made the intervention together. Interviews were held in January and February 2014. The location of the interview was chosen by the interviewees. The study aimed to find out what problems employees encounter when confronted with a potentially suicidal person. This way the contents of the course can be optimized.
Effect analysis
After the development of the course ten groups of maximum 12 persons were set up. Employees were invited to take the course. In total 100 employees attended the course.
A questionnaire was developed with three sections:
1. feeling of competence, 2. knowledge of suicide and ways to deal with it 3. actual interventions

RESTRAIL SCP1-GA-2011-285153
RESTRAIL-WP5-CIDAUT-D5.2-B2-24102014_public Page 134 of 168 24 October 2014
Each section contained several questions. To avoid that employees would remember the answer they gave to a certain question in an earlier stage (and simply give the same answer), for each question three variations were created. The software would randomly choose one out of the three variations. This way each questionnaire was different.
Each of the 100 employees received the invitation the fill out a version of the questionnaire before and three months after attending the course. In the second questionnaire the employees were asked to give the name of a colleague for the control group.
The control group was added to the effect analysis to check whether the fact that employees voluntarily attended the course would lead to different scores from randomly chosen employees.
The results of the questionnaires were collected using Qualtrics ®15 and analysed by SPSS ®16.
4.9.3 Reported costs for measure The reported costs for this measure are collected in Table 4.9-1.
Table 4.9-1: Costs for the Gatekeeper programme in the Netherlands
Cost component Nature Value Design 2 400 € design of three concepts 440 € Development of chosen design 550 € Design of two cards to be inserted 110 € corrections and pre-press work 330 € test work book for pilot sessions and two types of cards 475 € cover, plastic inserts for cards 495 €
Printing work book, 2 types of cards to insert, 113Online pen 325 €
Photography for work book 2 300 € Training facilities and hiring of trainers 26 000 € Effect analysis course 2 300 € In-depth interviews 4 500 € interview script and discussion with NS and ProRail 25 hours In-depth interviews 10 persons 15 hours Writing interview report 30 hours Management report 20 hours
Total 37 825 €
15 http://www.qualtrics.com/
16 http://www-01.ibm.com/software/analytics/spss/

RESTRAIL SCP1-GA-2011-285153
RESTRAIL-WP5-CIDAUT-D5.2-B2-24102014_public Page 135 of 168 24 October 2014
4.9.4 Evaluation results 4.9.4.1. In-depth interview study
This study aimed to find out what problems employees encounter when confronted with a potentially suicidal person. The characteristics of the interviewees can see in Table 4.9-2.
Table 4.9-2: Characteristics of the interviewees
Job Sex Age Years on job
Train driver Train guard SSS17
1 7 3
Male Female
7 4
Below 40 Above 40
6 5
Below 7 Above 7
6 5
The main results regarding the contents of the course is what employees say they missed during their confrontation with a potentially suicidal person. The contents indicated were:
1. One person wants to follow a course to be better prepared for this kind of situation 2. More persons: How to start a conversation? What are your first questions? What do you
say and what not? 3. Hear from other colleagues who already had an experience 4. How to handle the emotions of a potential victim? How will a person open up and allow real
contact? 5. How to influence people’s thoughts?
The interviewees were also asked to give tips for colleagues. The main tips provided were:
1. Take care of your own safety 2. Try to behave as a counselor 3. Stay calm 4. Keep on talking to colleagues, family and friends after an incident 5. Ask for other people’s experience (that gives you the feeling that you are not alone).
All ten remarks are dealt with in the program of the course, except for “6. Take care of your own safety”. Based upon these 10 interviews we conclude that the right topics are addressed in the course. Some attention on “own safety” could be added to the course.
One remark that was added by multiple interviewees was that the psychological impact of the intervention appeared later. This makes it harder for employees to ask for help (within the company or from family and friends).
4.9.4.1. Effect analysis
The number of filled out questionnaires were distributed as shown in the Table 4.9-3.
17 Service, Safety and Security employee
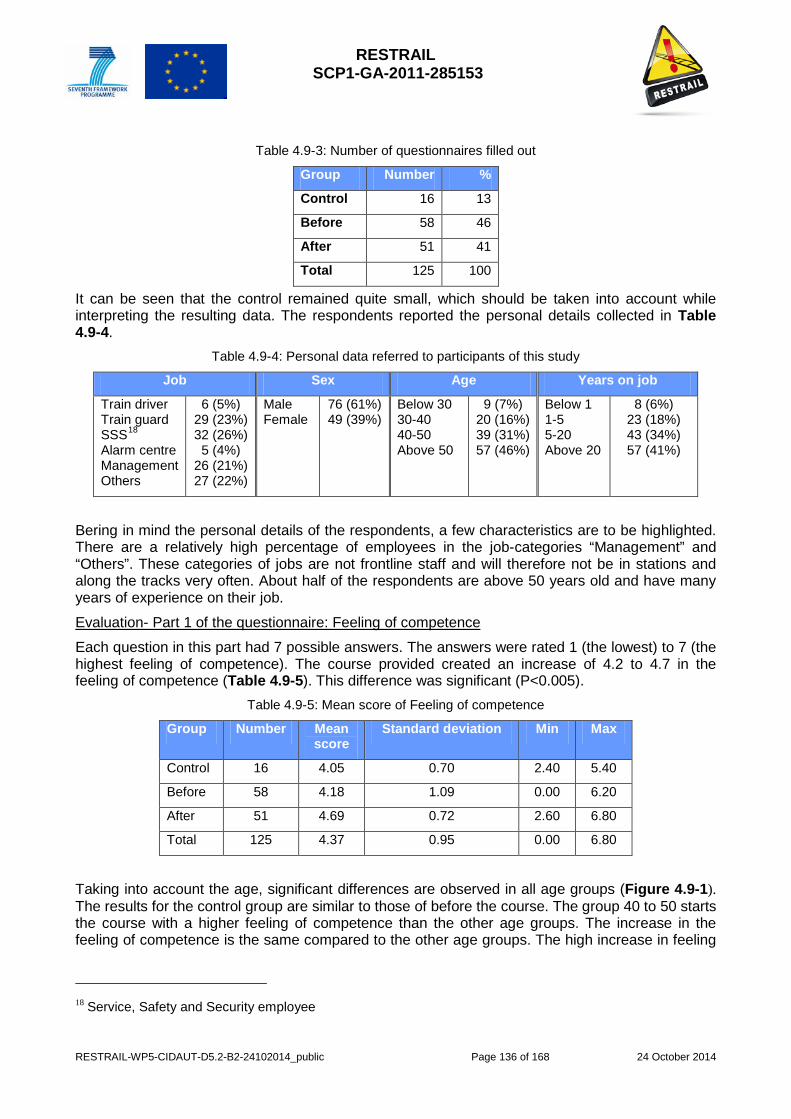
RESTRAIL SCP1-GA-2011-285153
RESTRAIL-WP5-CIDAUT-D5.2-B2-24102014_public Page 136 of 168 24 October 2014
Table 4.9-3: Number of questionnaires filled out
It can be seen that the control remained quite small, which should be taken into account while interpreting the resulting data. The respondents reported the personal details collected in Table 4.9-4.
Table 4.9-4: Personal data referred to participants of this study
Job Sex Age Years on job
Train driver Train guard SSS18 Alarm centre Management Others
6 (5%) 29 (23%) 32 (26%) 5 (4%)
26 (21%) 27 (22%)
Male Female
76 (61%) 49 (39%)
Below 30 30-40 40-50 Above 50
9 (7%) 20 (16%) 39 (31%) 57 (46%)
Below 1 1-5 5-20 Above 20
8 (6%) 23 (18%) 43 (34%) 57 (41%)
Bering in mind the personal details of the respondents, a few characteristics are to be highlighted. There are a relatively high percentage of employees in the job-categories “Management” and “Others”. These categories of jobs are not frontline staff and will therefore not be in stations and along the tracks very often. About half of the respondents are above 50 years old and have many years of experience on their job.
Evaluation- Part 1 of the questionnaire: Feeling of competence
Each question in this part had 7 possible answers. The answers were rated 1 (the lowest) to 7 (the highest feeling of competence). The course provided created an increase of 4.2 to 4.7 in the feeling of competence (Table 4.9-5). This difference was significant (P<0.005).
Table 4.9-5: Mean score of Feeling of competence
Group Number Mean score
Standard deviation Min Max
Control 16 4.05 0.70 2.40 5.40
Before 58 4.18 1.09 0.00 6.20
After 51 4.69 0.72 2.60 6.80
Total 125 4.37 0.95 0.00 6.80
Taking into account the age, significant differences are observed in all age groups (Figure 4.9-1). The results for the control group are similar to those of before the course. The group 40 to 50 starts the course with a higher feeling of competence than the other age groups. The increase in the feeling of competence is the same compared to the other age groups. The high increase in feeling
18 Service, Safety and Security employee
Group Number %
Control 16 13
Before 58 46
After 51 41
Total 125 100
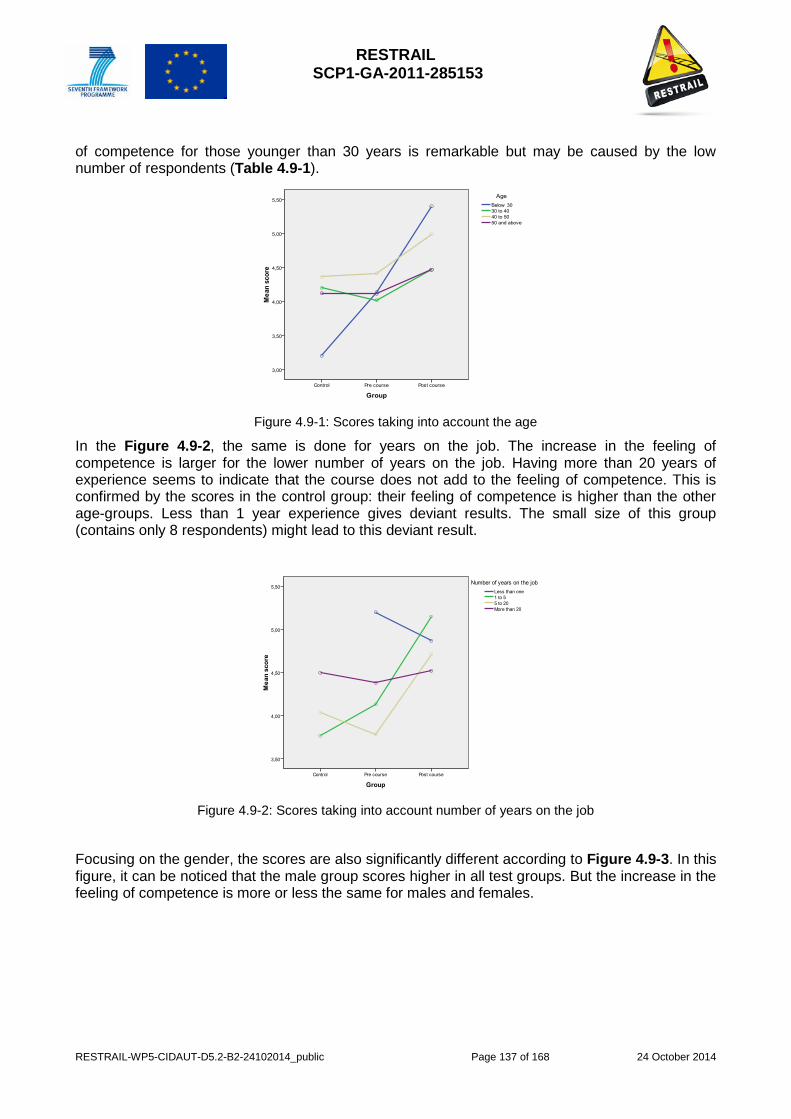
RESTRAIL SCP1-GA-2011-285153
RESTRAIL-WP5-CIDAUT-D5.2-B2-24102014_public Page 137 of 168 24 October 2014
of competence for those younger than 30 years is remarkable but may be caused by the low number of respondents (Table 4.9-1).
Figure 4.9-1: Scores taking into account the age
In the Figure 4.9-2, the same is done for years on the job. The increase in the feeling of competence is larger for the lower number of years on the job. Having more than 20 years of experience seems to indicate that the course does not add to the feeling of competence. This is confirmed by the scores in the control group: their feeling of competence is higher than the other age-groups. Less than 1 year experience gives deviant results. The small size of this group (contains only 8 respondents) might lead to this deviant result.
Figure 4.9-2: Scores taking into account number of years on the job
Focusing on the gender, the scores are also significantly different according to Figure 4.9-3. In this figure, it can be noticed that the male group scores higher in all test groups. But the increase in the feeling of competence is more or less the same for males and females.
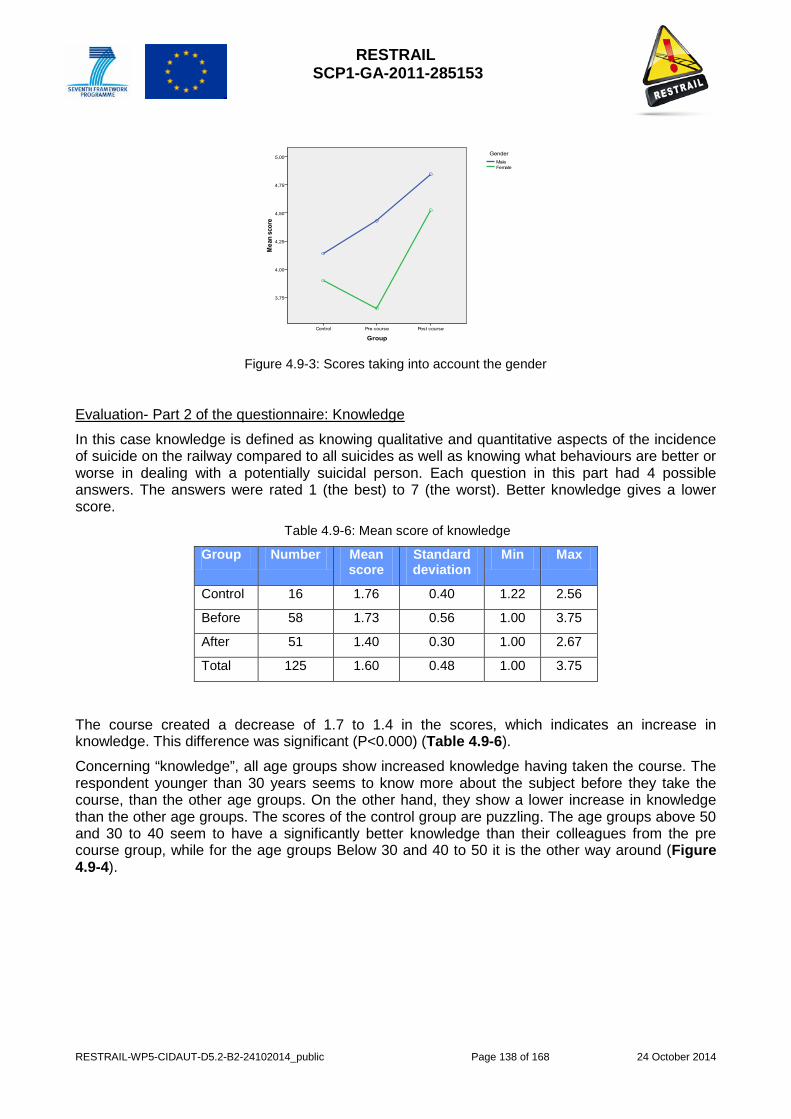
RESTRAIL SCP1-GA-2011-285153
RESTRAIL-WP5-CIDAUT-D5.2-B2-24102014_public Page 138 of 168 24 October 2014
Figure 4.9-3: Scores taking into account the gender
Evaluation- Part 2 of the questionnaire: Knowledge
In this case knowledge is defined as knowing qualitative and quantitative aspects of the incidence of suicide on the railway compared to all suicides as well as knowing what behaviours are better or worse in dealing with a potentially suicidal person. Each question in this part had 4 possible answers. The answers were rated 1 (the best) to 7 (the worst). Better knowledge gives a lower score.
Table 4.9-6: Mean score of knowledge
Group Number Mean score
Standard deviation
Min Max
Control 16 1.76 0.40 1.22 2.56
Before 58 1.73 0.56 1.00 3.75
After 51 1.40 0.30 1.00 2.67
Total 125 1.60 0.48 1.00 3.75
The course created a decrease of 1.7 to 1.4 in the scores, which indicates an increase in knowledge. This difference was significant (P<0.000) (Table 4.9-6).
Concerning “knowledge”, all age groups show increased knowledge having taken the course. The respondent younger than 30 years seems to know more about the subject before they take the course, than the other age groups. On the other hand, they show a lower increase in knowledge than the other age groups. The scores of the control group are puzzling. The age groups above 50 and 30 to 40 seem to have a significantly better knowledge than their colleagues from the pre course group, while for the age groups Below 30 and 40 to 50 it is the other way around (Figure 4.9-4).
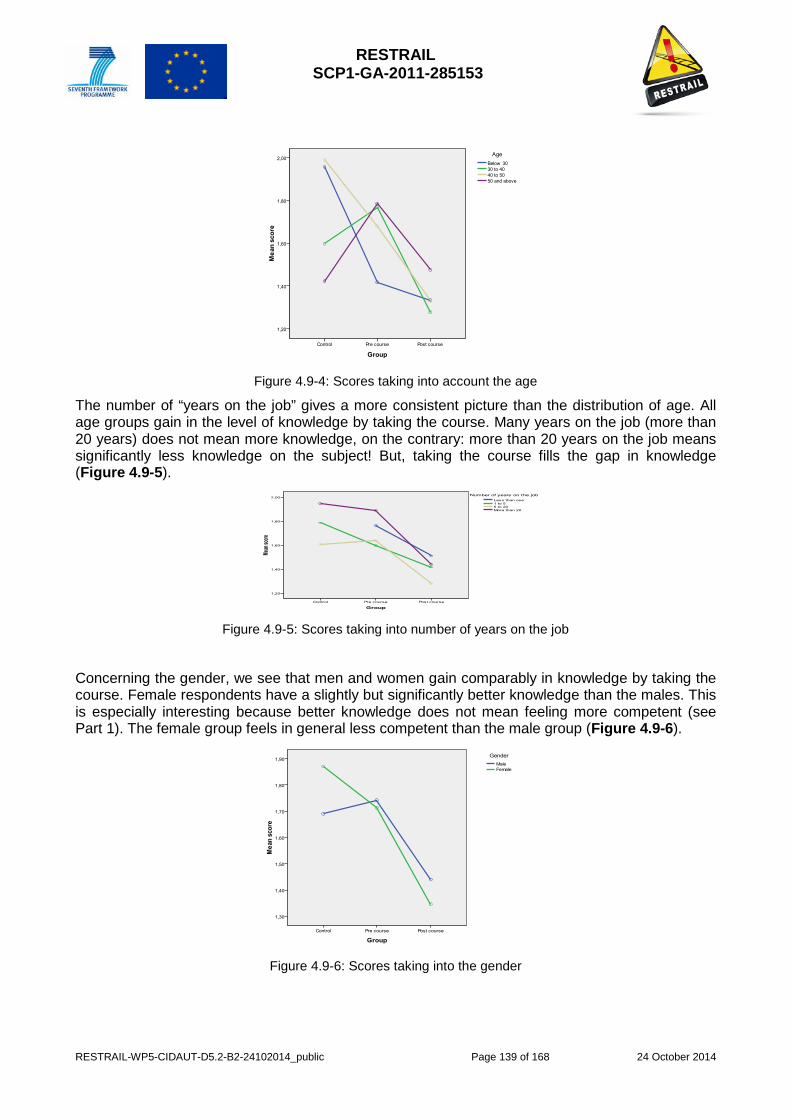
RESTRAIL SCP1-GA-2011-285153
RESTRAIL-WP5-CIDAUT-D5.2-B2-24102014_public Page 139 of 168 24 October 2014
Figure 4.9-4: Scores taking into account the age
The number of “years on the job” gives a more consistent picture than the distribution of age. All age groups gain in the level of knowledge by taking the course. Many years on the job (more than 20 years) does not mean more knowledge, on the contrary: more than 20 years on the job means significantly less knowledge on the subject! But, taking the course fills the gap in knowledge (Figure 4.9-5).
Figure 4.9-5: Scores taking into number of years on the job
Concerning the gender, we see that men and women gain comparably in knowledge by taking the course. Female respondents have a slightly but significantly better knowledge than the males. This is especially interesting because better knowledge does not mean feeling more competent (see Part 1). The female group feels in general less competent than the male group (Figure 4.9-6).
Figure 4.9-6: Scores taking into the gender
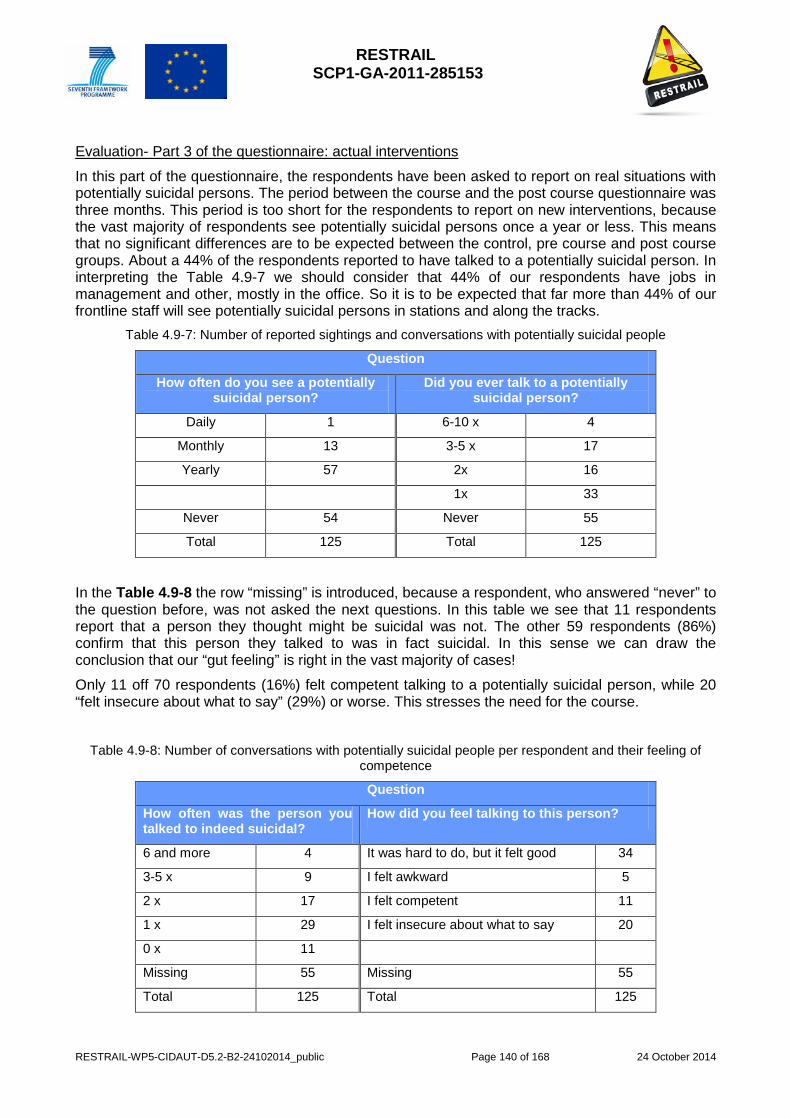
RESTRAIL SCP1-GA-2011-285153
RESTRAIL-WP5-CIDAUT-D5.2-B2-24102014_public Page 140 of 168 24 October 2014
Evaluation- Part 3 of the questionnaire: actual interventions
In this part of the questionnaire, the respondents have been asked to report on real situations with potentially suicidal persons. The period between the course and the post course questionnaire was three months. This period is too short for the respondents to report on new interventions, because the vast majority of respondents see potentially suicidal persons once a year or less. This means that no significant differences are to be expected between the control, pre course and post course groups. About a 44% of the respondents reported to have talked to a potentially suicidal person. In interpreting the Table 4.9-7 we should consider that 44% of our respondents have jobs in management and other, mostly in the office. So it is to be expected that far more than 44% of our frontline staff will see potentially suicidal persons in stations and along the tracks.
Table 4.9-7: Number of reported sightings and conversations with potentially suicidal people
Question
How often do you see a potentially suicidal person?
Did you ever talk to a potentially suicidal person?
Daily 1 6-10 x 4
Monthly 13 3-5 x 17
Yearly 57 2x 16
1x 33
Never 54 Never 55
Total 125 Total 125
In the Table 4.9-8 the row “missing” is introduced, because a respondent, who answered “never” to the question before, was not asked the next questions. In this table we see that 11 respondents report that a person they thought might be suicidal was not. The other 59 respondents (86%) confirm that this person they talked to was in fact suicidal. In this sense we can draw the conclusion that our “gut feeling” is right in the vast majority of cases!
Only 11 off 70 respondents (16%) felt competent talking to a potentially suicidal person, while 20 “felt insecure about what to say” (29%) or worse. This stresses the need for the course.
Table 4.9-8: Number of conversations with potentially suicidal people per respondent and their feeling of
competence
Question
How often was the person you talked to indeed suicidal?
How did you feel talking to this person?
6 and more 4 It was hard to do, but it felt good 34
3-5 x 9 I felt awkward 5
2 x 17 I felt competent 11
1 x 29 I felt insecure about what to say 20
0 x 11
Missing 55 Missing 55
Total 125 Total 125

RESTRAIL SCP1-GA-2011-285153
RESTRAIL-WP5-CIDAUT-D5.2-B2-24102014_public Page 141 of 168 24 October 2014
Our respondents were asked how the interventions they reported ended. 70 respondents answered the question, where they could choose more than one answer. This leads to a total of 90 answers (Table 4.9-9).
Table 4.9-9: Reported endings of conversations with suicidal people
How did the conversation end?
The person subsided and went home 6
The person was handed over to emergency services 50
The person was handed over to family 15
The person left, I don’t know what happened afterwards 10
The person committed suicide 5
I brought the person into contact with 113-online 0
Other 4
Total 90
The last group of questions concerned how the respondents felt after an intervention with a potentially suicidal person in relation to their social environment. The respondents were asked to score which of the suggested sentences apply to their situation. They could score 1 (does not apply at all) till 7 (applies completely). The scores from the groups showed no significant differences. This was already expected from the short period between the course and the Post course questionnaire compared to the number of years on the job. All mean scores are below 3, so the sentences do not really apply to the feeling of the respondents. The way the sentences are constructed (multiple feelings in one sentence) might be the reason for this. Still some doubt remains on the effectiveness of the after care for employees (Table 4.9-10).
Table 4.9-10: Feeling after an intervention in relation to the social environment of the respondents
Sentence Mean score
I did it, but had problems sleeping afterwards 1.6
It touched me, but talking to colleagues helped 2.5
Family and friends listened to my experiences 2.6
I was touched and felt lonely with that afterwards 1.3
The after care in the company was good 2.0
It was hard, but I experienced satisfaction afterwards 2.7
I was glad with the result 2.6
Conclusions
1. The result from the in-depth interview study and the effect analysis show that the developed course contains topics that employees report as needing.
2. Due to the course the feeling of competence to handle a conversation with a potentially suicidal person increase significantly for men and women, for all ages and for all years on the job (except more than 20 years on the job)

RESTRAIL SCP1-GA-2011-285153
RESTRAIL-WP5-CIDAUT-D5.2-B2-24102014_public Page 142 of 168 24 October 2014
3. Due to the course the knowledge about suicide on the railway and about preferred behaviour in contact with potentially suicidal people increase significantly for men and women, all age groups and all years on the job.
4. After care is important for employees having experienced contact with potentially suicidal persons.
4.9.5 Applicability of results to different circumstances The contents of the course strongly depend on the local culture. In The Netherlands suicide is largely considered as understandable. So the topic itself is discussable. The whole idea of the course is based on openness. So in countries where (thinking about) suicide is not accepted, this kind of course will probably not work. In countries where the chance of noticing a possibly suicidal person is very low, the investment (1 day training) might be too high for the result obtained. One could on the other hand select employees working in regions where the most suicides take place on the basis of a regional analysis of the locations of suicides. In this way the number of employees taking the course can be optimized.
4.9.6 Discussion The fact that younger employees learn more than older employees could lead to the conclusion that the course could be given to younger employees only. This conclusion is not right, because each course group should contain younger and older employees for the younger employees to learn from older colleagues. For older colleagues the course can be a way to talk about what they experienced, thus helping the process of digestion.
The knowledge about suicide on the railways and about preferred ways of intervention increases by taking the course. Also the feeling of competence to deal with that kind of situations increases. This result has actually TWO (possible) advantages:
1. When many employees take the course more quick alerts to train traffic control can be expected, more good interventions take place and more suicidal persons are referred to professional care, we might see a decrease in the amount of suicides on the railway
2. The course helps employees to cope with difficult situations and employees are therefore they are less likely to develop frustration after an incident. That might decrease the amount of sick leave.
It is advised to repeat the in-depth-interview study with employees who took the course and afterwards had a confrontation with a suicidal person. This makes it possible to see what the effect of taking the course is in real life situations.
In this study one after measurement was conducted three months after the course. It is advisable to repeat the after-measurement at a later point in time.
RESTRAIL SCP1-GA-2011-285153
RESTRAIL-WP5-CIDAUT-D5.2-B2-24102014_public Page 143 of 168 24 October 2014
4.10 Enhancement of cooperation of the police and legal entities through Computer Based Training-MTRS3
4.10.1 Overview of the piloted measure A key issue for IMs who lead the rail industry’s response to incidents, and also for RUs, is minimising service restoration time, whilst providing the police with necessary support to allow them to meet their investigation needs. The police, with the exception of the railway police, and also other specialists they involve on or off site, may not be familiar with the implications of managing fatalities or trespassing incidents on rail infrastructure for rail operations and safety. In many municipal or regional police forces, and in some Member States, the judicial entities (general prosecution, judge on call), have incident response decision making roles that critically affect traffic restoration time.
Discussions with several end users resulted in a recommendation to develop a computer based training (CBT) module for responding bodies handling railway suicides and fatal trespassing incidents under RESTRAIL umbrella. The CBT module, which has been developed and tested, is intended for decision makers dealing with railway incidents, primarily the police, and also other decision makers among the executive or judicial authorities. The purpose of this tool is to enhance cooperation between the IM and RU and the relevant entities among the bodies involved in the decision making process (e.g. police, the representative of the general prosecution and the judge on call). It is believed that improving these decision makers’ understanding of the manner in which suicides and fatal trespassing incidents on rail infrastructure are handled will support more effective cooperation and help minimize service disruption.
The CBT is being developed in the form of an interactive tool, thus the trainee will not only follow the topics of the lesson step-by-step, but also answer multiple choice questions and benefit from other interactive methods that are embedded into the CBT tool. The module covers the following main topics:
(1) Understanding the problem, its scope and severity.
(2) Understanding railways’ incident response arrangements.
(3) Supporting the railway with the quickest possible incident resolution.
(4) Case study.
(5) Lesson summary.
The duration of this CBT module is approximately 45 minutes. In order to activate it, the user needs a computer and standard browser (e.g., Chrome, Safari). It is also possible to activate the CBT as a web service using an LMS (Learning Management System) environment, via Internet connection and using a browser.
4.10.2 88BMethodology to evaluate the piloted measures The evaluation of the CBT module will be qualitative – assessing the CBT’s capacity to achieve these objectives.
The evaluation of the CBT is detailed in a CBT evaluation form (ref: RESTRAIL-WP5-MTR-TEC-004-0114-A-CBT Evaluation Form), which was integrated into an online survey service (www.surveymonkey.com). The evaluation form includes the following fields of evaluation:
(1) General questions – place of employment, and several questions regarding the individual’s familiarity and experience with fatalities or trespassing incidents.
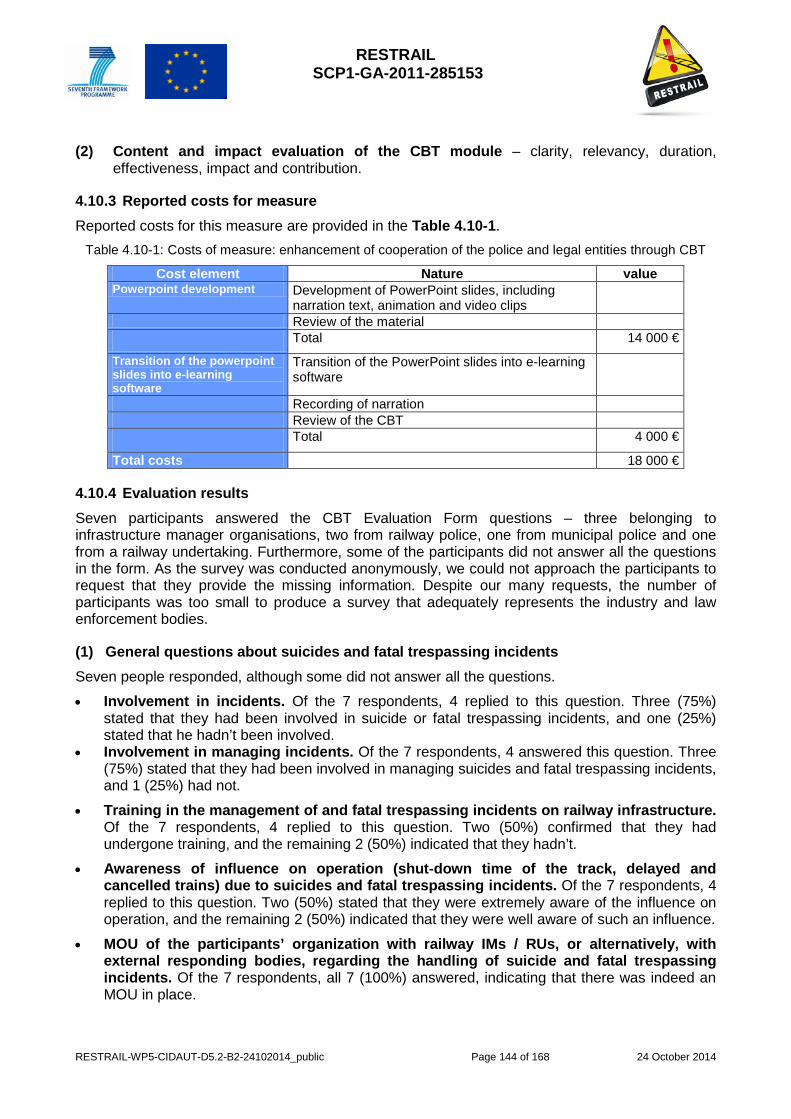
RESTRAIL SCP1-GA-2011-285153
RESTRAIL-WP5-CIDAUT-D5.2-B2-24102014_public Page 144 of 168 24 October 2014
(2) Content and impact evaluation of the CBT module – clarity, relevancy, duration, effectiveness, impact and contribution.
4.10.3 Reported costs for measure Reported costs for this measure are provided in the Table 4.10-1.
Table 4.10-1: Costs of measure: enhancement of cooperation of the police and legal entities through CBT
Cost element Nature value Powerpoint development Development of PowerPoint slides, including
narration text, animation and video clips
Review of the material Total 14 000 €
Transition of the powerpoint slides into e-learning software
Transition of the PowerPoint slides into e-learning software
Recording of narration Review of the CBT Total 4 000 €
Total costs 18 000 €
4.10.4 Evaluation results Seven participants answered the CBT Evaluation Form questions – three belonging to infrastructure manager organisations, two from railway police, one from municipal police and one from a railway undertaking. Furthermore, some of the participants did not answer all the questions in the form. As the survey was conducted anonymously, we could not approach the participants to request that they provide the missing information. Despite our many requests, the number of participants was too small to produce a survey that adequately represents the industry and law enforcement bodies.
(1) General questions about suicides and fatal trespassing incidents Seven people responded, although some did not answer all the questions.
• Involvement in incidents. Of the 7 respondents, 4 replied to this question. Three (75%) stated that they had been involved in suicide or fatal trespassing incidents, and one (25%) stated that he hadn’t been involved.
• Involvement in managing incidents. Of the 7 respondents, 4 answered this question. Three (75%) stated that they had been involved in managing suicides and fatal trespassing incidents, and 1 (25%) had not.
• Training in the management of and fatal trespassing incidents on railway infrastructure. Of the 7 respondents, 4 replied to this question. Two (50%) confirmed that they had undergone training, and the remaining 2 (50%) indicated that they hadn’t.
• Awareness of influence on operation (shut-down time of the track, delayed and cancelled trains) due to suicides and fatal trespassing incidents. Of the 7 respondents, 4 replied to this question. Two (50%) stated that they were extremely aware of the influence on operation, and the remaining 2 (50%) indicated that they were well aware of such an influence.
• MOU of the participants’ organization with railway IMs / RUs, or alternatively, with external responding bodies, regarding the handling of suicide and fatal trespassing incidents. Of the 7 respondents, all 7 (100%) answered, indicating that there was indeed an MOU in place.
RESTRAIL SCP1-GA-2011-285153
RESTRAIL-WP5-CIDAUT-D5.2-B2-24102014_public Page 145 of 168 24 October 2014
• Specific procedure in for handling suicide and fatal trespassing incidents on the railway infrastructure. Of the 7 respondents, 4 answered this question. Three (75%) confirmed that their organisation had such a procedure, and one (25%) replied that it didn’t.
(2) Questions concerning the lesson content Four people answered this questionnaire, although some did not answer all the questions.
• Clarity of the lesson. Of the 4 respondents, 2 replied to this question. One (50%) indicated that the lesson content was very clear, and the other (50%) – that it was clear.
• Relevance of the content to the organisation. Four participants replied to this question. Two (50%) stated that it was extremely relevant to their organisation, one (25%) answered that it was relevant, and the remaining participant (25%) indicated that it was slightly relevant.
• Lesson duration in relation to the content. Four participants answered this question. Three (75%) replied that the duration was reasonable, and one (25%) did not express an opinion.
• Lesson effectiveness. Four participants replied to this question. One (25%) stated that it was extremely effective, and 3 (75%) answered that it was effective.
• Effectiveness of the CBT module. Four participants answered this question. One (25%) indicated that it was extremely effective, and 3 (75%) answered that it was effective.
• Accurate description in the lesson of the problem that IMs and RUs face. Four participants replied to this question. One (25%) answered that the lesson described the problem extremely well, 2 respondents (50%) indicated that the lesson described the problem well, and the remaining respondent (25%) stated that the lesson described the problem slightly well.
• Accurate description in the lesson of the problem that the participants’ organisations face with respect to suicides and fatal trespassing incidents. Four participants answered this question. One (25%) answered that the lesson described the problem his organisation faces extremely well, 2 respondents (50%) indicated that the lesson described the problem well, and the remaining respondent (25%) stated that the lesson described the problem moderately well.
• Extent to which the lesson contributes to understanding how IMs and RUs manage suicides and fatal trespassing incidents. Four participants responded to this question. One (25%) answered that the lesson contributed to a very large extent to the understanding, 2 respondents (50%) indicated that the lesson described the problem well, and the remaining respondent (25%) stated that it contributed to a large extent, and the remaining participant indicated that it contributed to a slight extent.
• Extent to which the information provided is likely to contribute to the participants’ organisations’ response by shortening the rail shut-down time in the event of suicides and fatal trespassing incidents. Four participants answered this question. One (25%) answered that the lesson will help shorten the rail shut-down time to a very large extent, 2 respondents (50%) indicated that it would help to a large extent, and the remaining respondent (25%) stated that it would help to a slight extent.
• The extent to which the use case described in the lesson reflects an actual incident. Four participants responded to this question. One (25%) stated that it reflected an actual incident extremely well, and 3 (75%) answered that it described it well.
• Extent to which the use case provides tools that allow your organisation to assist IMs and RUs in managing and shortening the rail shut-down time in the event of suicides and fatal trespassing incidents. Four participants answered this question. One (25%) answered that the use case will help to a very large extent, 2 respondents (50%) indicated that
RESTRAIL SCP1-GA-2011-285153
RESTRAIL-WP5-CIDAUT-D5.2-B2-24102014_public Page 146 of 168 24 October 2014
it would help to a large extent, and the remaining respondent (25%) stated that it would help to a slight extent.
(3) Questions concerning the influence of the various measures in shortening the shut-down time in the event of suicides and fatal trespassing incidents, as expressed in the lesson.
• Memorandum of understanding (MOU). Four participants answered this question. One (25%) indicated that the MOU contributed to a very large extent, and 3 (75%) answered that it contributed to a large extent.
• Incident response software and procedures. Four participants responded to this question. Two (50%) stated that incident response software and procedures contributed to a very large extent to shortening the shut-down time, and the other 2 (50%) answered that they contributed to a large extent.
• Predetermined incident & track access point using GIS web services. Four participants answered this question. Three (75%) indicated that GIS web services contributed to a very large extent to shortening the shut-down time, and one (25%) replied that they contributed to a large extent.
• Agreed lines of communication and communication means. Four participants responded to this question. Three (75%) stated that lines of communication and communication means contributed to a very large extent to shortening the shut-down time, and one (25%) replied that they contributed to a large extent.
• Training and exercises to develop and improve management skills and decision making competences. Four participants responded to this question. Three (75%) replied training and exercises contributed to a very large extent to shortening the shut-down time, and one (25%) replied that they contributed to a large extent.
• Forward facing CCTV (FFCCTV). Four respondents answered this question, and they all (100%) agreed that FFCCTV contributed to a large extent to shortening the shut-down time resulting from suicides and fatal trespassing incidents on railway infrastructure.
• On-train data recorder (OTDR). Four respondents replied to this question, and all 4 (100%) agreed that OTDR contributed to a large extent to shortening the shut-down time resulting from suicides and fatal trespassing incidents on railway infrastructure.
The radar chart below summarises the influence of the various means described in the lesson (CBT module) on shortening the shut-down time resulting from suicides and fatal trespassing incidents on railway infrastructure. 1 represents a great deal of influence (‘to a very large extent’), and 5 represents no contribution (‘do not contribute at all’) (Figure 4.10-1).
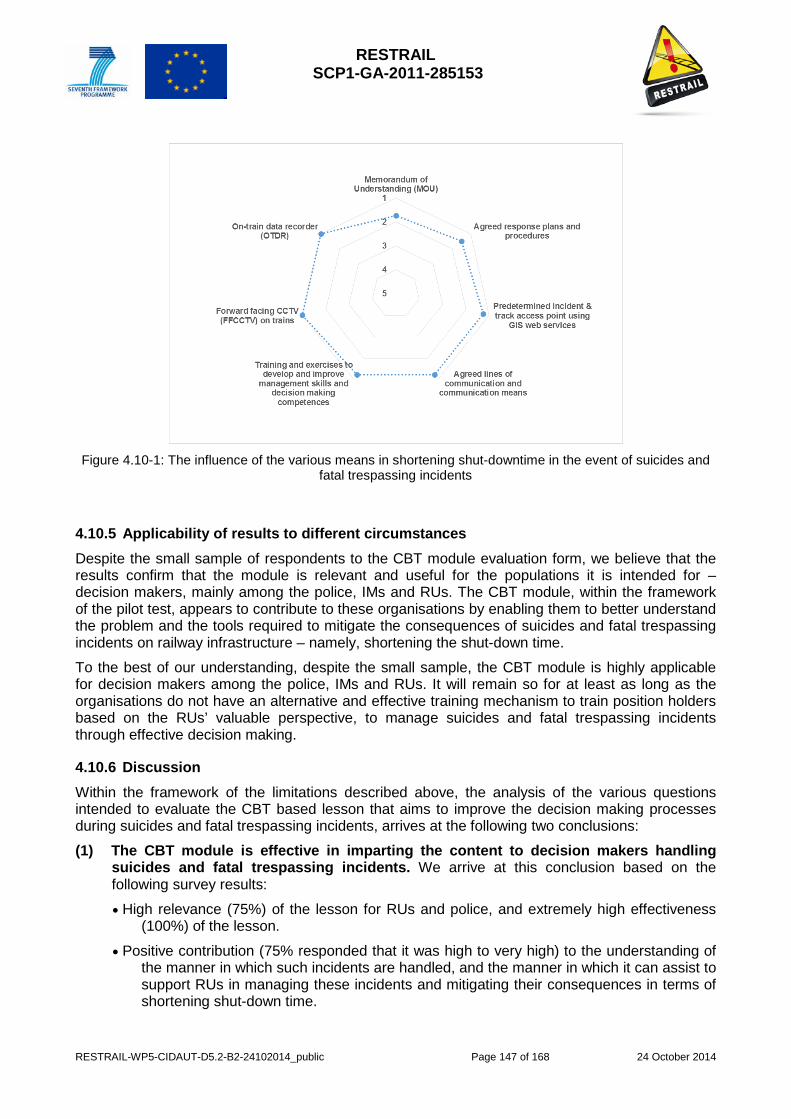
RESTRAIL SCP1-GA-2011-285153
RESTRAIL-WP5-CIDAUT-D5.2-B2-24102014_public Page 147 of 168 24 October 2014
Figure 4.10-1: The influence of the various means in shortening shut-downtime in the event of suicides and
fatal trespassing incidents
4.10.5 Applicability of results to different circumstances Despite the small sample of respondents to the CBT module evaluation form, we believe that the results confirm that the module is relevant and useful for the populations it is intended for – decision makers, mainly among the police, IMs and RUs. The CBT module, within the framework of the pilot test, appears to contribute to these organisations by enabling them to better understand the problem and the tools required to mitigate the consequences of suicides and fatal trespassing incidents on railway infrastructure – namely, shortening the shut-down time.
To the best of our understanding, despite the small sample, the CBT module is highly applicable for decision makers among the police, IMs and RUs. It will remain so for at least as long as the organisations do not have an alternative and effective training mechanism to train position holders based on the RUs’ valuable perspective, to manage suicides and fatal trespassing incidents through effective decision making.
4.10.6 Discussion Within the framework of the limitations described above, the analysis of the various questions intended to evaluate the CBT based lesson that aims to improve the decision making processes during suicides and fatal trespassing incidents, arrives at the following two conclusions:
(1) The CBT module is effective in imparting the content to decision makers handling suicides and fatal trespassing incidents. We arrive at this conclusion based on the following survey results: • High relevance (75%) of the lesson for RUs and police, and extremely high effectiveness
(100%) of the lesson.
• Positive contribution (75% responded that it was high to very high) to the understanding of the manner in which such incidents are handled, and the manner in which it can assist to support RUs in managing these incidents and mitigating their consequences in terms of shortening shut-down time.

RESTRAIL SCP1-GA-2011-285153
RESTRAIL-WP5-CIDAUT-D5.2-B2-24102014_public Page 148 of 168 24 October 2014
• Good compatibility between the use case and an actual incident and the tools described to manage incidents and mitigate their consequences.
(2) The means described in the lesson are perceived as valuable to reducing shut-down time as a result of suicides and fatal trespassing incidents. • Means that have the capacity to document, such as FFCCTV and OTDR, are perceived by
all (100%) the respondents as having a great deal of influence on the potential to reduce shut-down time resulting from suicides and fatal trespassing incidents.
• GIS web services assist all those involved in incident management. The geographical tools are perceived as contributing to an extremely large to very large extent to reducing shut-down time, since they assist the responding forces to arrive at the precise incident site and find the track entry point quickly.
• Incident response procedures and plans, training, communication means and MOUs are perceived by all (100%) respondents as having a great to very large influence on reducing shut-down time resulting from suicides and fatal trespassing incidents.
RESTRAIL SCP1-GA-2011-285153
RESTRAIL-WP5-CIDAUT-D5.2-B2-24102014_public Page 149 of 168 24 October 2014
4.11 Forward Facing CCTV in trains- MTRS3
4.11.1 Overview of the piloted measure A key need for railway undertakings (RU) and infrastructure managers (IM) is to minimise the service down time and disruption following suicides or trespassing fatalities on rail infrastructure. A principal benefit of Forward Facing CCTV (FFCCTV) systems is its ability to serve the three main entities involved in the investigation of these incidents - the RU, the IM and the police. Viewing the recorded images provides factual information, confirming witness information and enabling determination of the nature of the incident as either non suspicious or suspicious (potentially involving criminal activity). Knowing whether the circumstances are a suicide, accident or homicide is a key input for the police investigation of the circumstances and benefits the RU and IM as well as passengers, by helping minimise the incident investigation time, allowing resumption of operation as quickly as possible and reducing the associated costs. To gain the maximum benefit FFCCTV images need to be available to the police as quickly as possible after the incident to enable an assessment of the circumstances leading up to and the actual incident. In addition to rail fatality investigations the visual evidence provided by FFCTV is also utilised by many RUs, IMs and independent investigation bodies, e.g. RAIB and the BTP in GB.
A typical FFCCTV system includes four operating modes:
(1) Active mode. The camera and recorder are connected to a power supply, and the system is fully functional. In this mode, the status display panel shows that the system is operating properly.
(2) Inactive mode. The power supply to the camera and/or recorder is disconnected, or alternatively, the system is connected to the power supply and the camera, but is switched off.
(3) Debriefing mode. An external viewing device (PC, tablet or smartphone) is connected to the system for the purpose of viewing recorded images.
(4) Malfunction mode. The system is connected to the power supply and to the camera, but there is a malfunction in the system (whether power, communication, hardware, software), which is displayed in the status display LED and/or off-train equipment.
The Figure 4.11-1 gives an example schematic overview of the application of FFCCTV to multiple unit rolling stock.
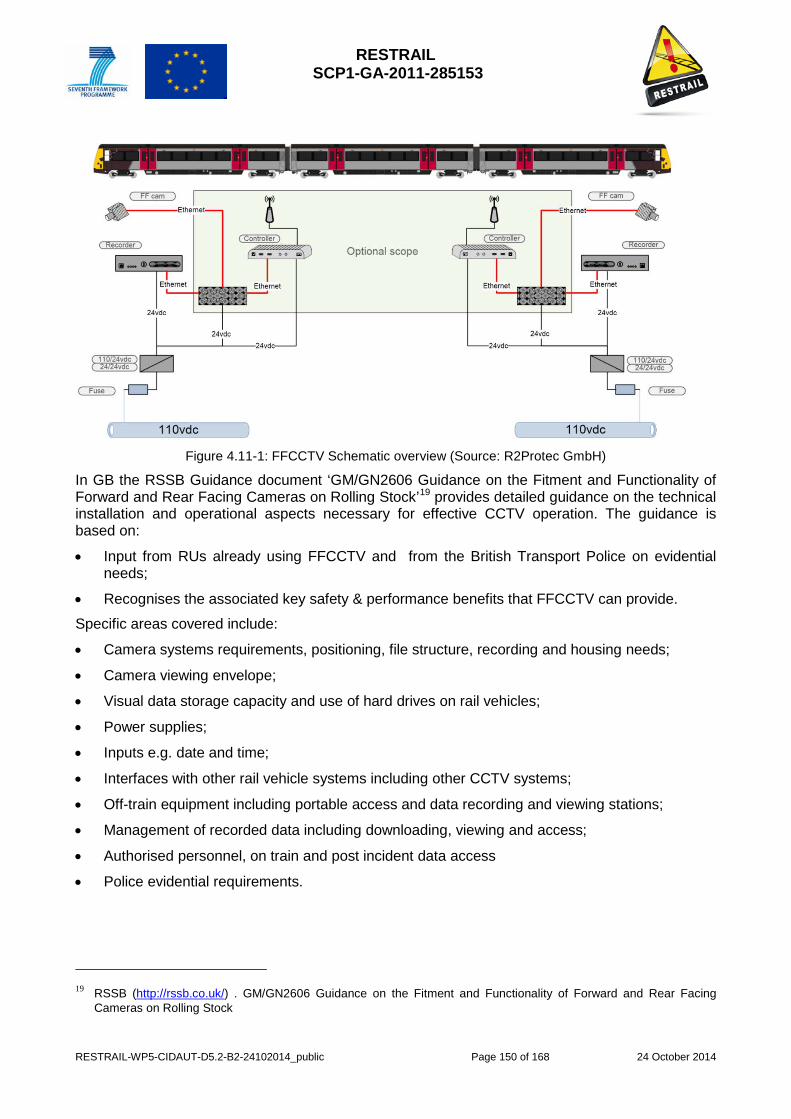
RESTRAIL SCP1-GA-2011-285153
RESTRAIL-WP5-CIDAUT-D5.2-B2-24102014_public Page 150 of 168 24 October 2014
Figure 4.11-1: FFCCTV Schematic overview (Source: R2Protec GmbH)
In GB the RSSB Guidance document ‘GM/GN2606 Guidance on the Fitment and Functionality of Forward and Rear Facing Cameras on Rolling Stock’19 provides detailed guidance on the technical installation and operational aspects necessary for effective CCTV operation. The guidance is based on:
• Input from RUs already using FFCCTV and from the British Transport Police on evidential needs;
• Recognises the associated key safety & performance benefits that FFCCTV can provide.
Specific areas covered include:
• Camera systems requirements, positioning, file structure, recording and housing needs;
• Camera viewing envelope;
• Visual data storage capacity and use of hard drives on rail vehicles;
• Power supplies;
• Inputs e.g. date and time;
• Interfaces with other rail vehicle systems including other CCTV systems;
• Off-train equipment including portable access and data recording and viewing stations;
• Management of recorded data including downloading, viewing and access;
• Authorised personnel, on train and post incident data access
• Police evidential requirements.
19 RSSB (http://rssb.co.uk/) . GM/GN2606 Guidance on the Fitment and Functionality of Forward and Rear Facing
Cameras on Rolling Stock
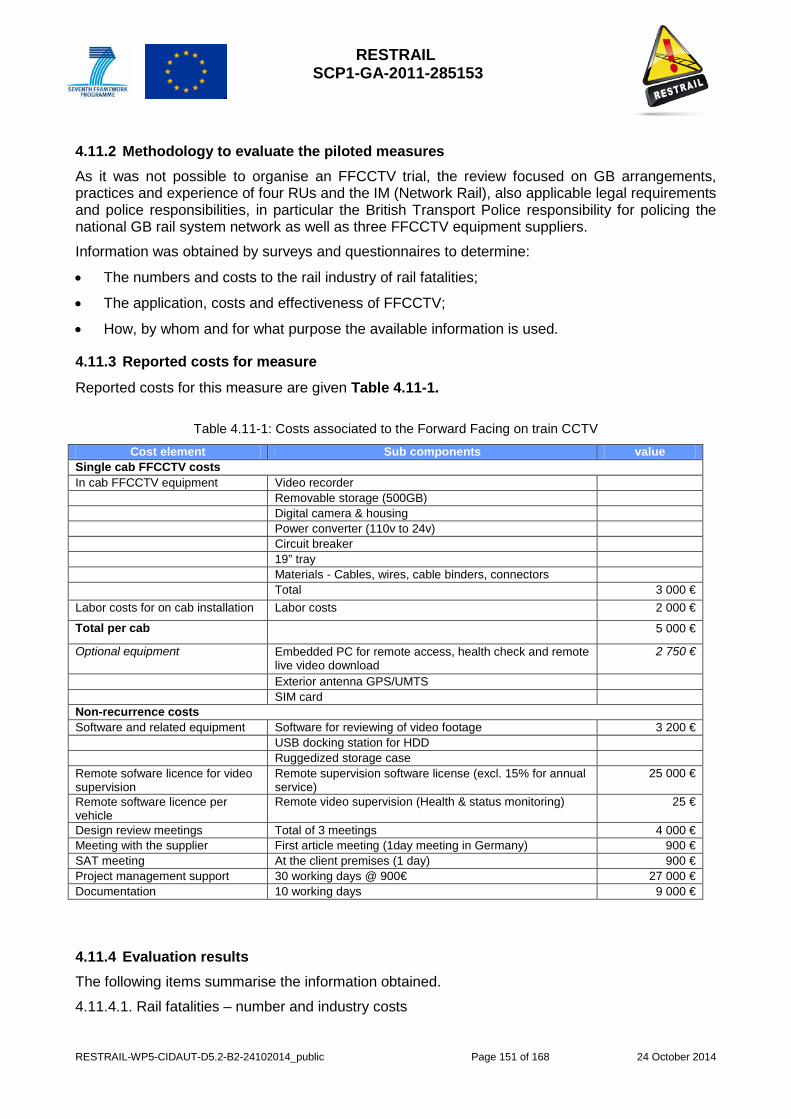
RESTRAIL SCP1-GA-2011-285153
RESTRAIL-WP5-CIDAUT-D5.2-B2-24102014_public Page 151 of 168 24 October 2014
4.11.2 Methodology to evaluate the piloted measures As it was not possible to organise an FFCCTV trial, the review focused on GB arrangements, practices and experience of four RUs and the IM (Network Rail), also applicable legal requirements and police responsibilities, in particular the British Transport Police responsibility for policing the national GB rail system network as well as three FFCCTV equipment suppliers.
Information was obtained by surveys and questionnaires to determine:
• The numbers and costs to the rail industry of rail fatalities;
• The application, costs and effectiveness of FFCCTV;
• How, by whom and for what purpose the available information is used.
4.11.3 Reported costs for measure
Reported costs for this measure are given Table 4.11-1.
Table 4.11-1: Costs associated to the Forward Facing on train CCTV
Cost element Sub components value Single cab FFCCTV costs In cab FFCCTV equipment Video recorder Removable storage (500GB) Digital camera & housing Power converter (110v to 24v) Circuit breaker 19” tray Materials - Cables, wires, cable binders, connectors Total 3 000 € Labor costs for on cab installation Labor costs 2 000 €
Total per cab 5 000 €
Optional equipment Embedded PC for remote access, health check and remote live video download
2 750 €
Exterior antenna GPS/UMTS SIM card Non-recurrence costs Software and related equipment Software for reviewing of video footage 3 200 € USB docking station for HDD Ruggedized storage case Remote sofware licence for video supervision
Remote supervision software license (excl. 15% for annual service)
25 000 €
Remote software licence per vehicle
Remote video supervision (Health & status monitoring) 25 €
Design review meetings Total of 3 meetings 4 000 € Meeting with the supplier First article meeting (1day meeting in Germany) 900 € SAT meeting At the client premises (1 day) 900 € Project management support 30 working days @ 900€ 27 000 € Documentation 10 working days 9 000 €
4.11.4 Evaluation results The following items summarise the information obtained.
4.11.4.1. Rail fatalities – number and industry costs

RESTRAIL SCP1-GA-2011-285153
RESTRAIL-WP5-CIDAUT-D5.2-B2-24102014_public Page 152 of 168 24 October 2014
The Table 4.11-2 aggregates data collected relating to rail fatalities, the delays these cause and the associated industry costs. However there will be wide range of delays for each incident depending on the location, time of day and the service frequency with incidents in urban areas during peak traffic hours involving immediate and serious delays even when service shut down is minimised.
The largest elements of the identified costs are the service delay and cancellation costs paid by the IM to RUs as part of the GB performance regime intended to incentivise RUs and Network Rail to improve operational performance through operational decision making and investment appraisal. Over 4 years the payment from the IM to RUs has averaged over £17M a year. In addition the major direct costs for RUs arising from the impact of suicides on rail staff (particularly drivers), train cleaning and repairs, and compensation to passengers are estimated at approximately £12M a year. BTP annual costs for dealing with suicides are estimated to be £4.5M per annum20.
The cost data given in Table 4.11-2 is based on the average cost per minute used in GB21. The actual cost per minute for each incident depends on its location - those involving urban areas attracting a much higher cost than those in rural areas with low traffic volumes
Table 4.11-2: Fatalities - delays & costs
Year Suicides Minutes delay Cost 2011/2012 242 422,067 £31M
2012/2013 239 333,920 £24.5M
2013/2014 277 290,752 Not available
In addition to the number of suicides identified in Table 4.11-2, there have also been between 38 and 60 other fatalities per year during the period 2010 – 2014. In the same period individual RUs have been involved in between 10 and 25 suicides and other fatalities annually.
4.11.4.2. FFCCTV Application
To gain an understanding of the extent to which FFCCTV is fitted to RU fleets four RUs provided information for their rolling stock fleets – whether owned or leased. This identified a wide variation in the % of rolling stock fitted with FFCCTV (31% - 100%) and recording times (7- 40 days).
4.11.4.3. FFCCTV Costs FCCTV installation and management costs will depend on:
• whether the equipment is installed as part of the design of new rolling stock or fitted to existing stock.
• The installation of optional equipment providing a link to a shore based surveillance management system facilitating system management and data retrieval especially in large fleets Table 4.11-3 to Table 4.11-6 outline the costs involved.
20 Costs data. RSSB ‘Improving suicide prevention measures on the rail network in Great Britain. T845- February 2014’
21 Sources. Minutes delay BT2011/12 & 2012/13. RSSM 2013/2014 P. Cost data (£73.47/Min) National Audit Office 2008 Appendix 3.

RESTRAIL SCP1-GA-2011-285153
RESTRAIL-WP5-CIDAUT-D5.2-B2-24102014_public Page 153 of 168 24 October 2014
FFCCTV Indicative costs tables (all prices excluding VAT) Table 4.11-3: Non-recurring costs - project management
Item Cost Element Sub Components Cost
1 Design review meetings • Design review meetings - total of 3 meetings
€ 4,000
2 Meeting with the supplier • First article I day meeting € 900
3 SAT meeting • At client’s premises - 1 day € 900
4 Project management support • 30 working days @ € 900 € 27,000
5 Documentation • 10 working days € 9,000
Total € 41,800
Table 4.11-4: Optional non-recurring costs - software & hardware
Item Cost Element Sub Components Cost 6 Software and related
portable equipment to review images
• Software for reviewing of video footage • USB docking station for HDD • Rugged storage case
€ 3,200
7 Shore based video supervision software license
Remote supervision software license - one off payment
€ 25,000
8 Design acceptance Notified Body design acceptance – particular need for retrofits to unfitted stock
Application specific agreement
Table 4.11-5: Non recurring costs – single cab installation
Item Cost Element Sub Components Cost 9 FFCCTV equipment • Video recorder
• Removable storage (500GB) • Digital camera & housing • Power converter (110v to 24v) • Circuit breaker • Mounting tray for DVR & PSU • Materials - Cables, wires, cable binders,
connectors • Ethernet network switch
€ 3,000
10 Labour costs for one cab installation
Actual cost depends on type of vehicle € 2,000
11 Total per cab € 5,000
12 Optional equipment See Item 7
• Embedded PC for remote access, health check and remote live video download
• Exterior antenna GPS/UMTS • SIM card
€ 2,750

RESTRAIL SCP1-GA-2011-285153
RESTRAIL-WP5-CIDAUT-D5.2-B2-24102014_public Page 154 of 168 24 October 2014
13 Total per cab with optional equipment
€ 7,750
Table 4.11-6: Recurring costs
Item Cost Element Sub Components Cost/Comments 14 See Item 7 Optional
Shore based video - vehicle software license
Per vehicle and month Application specific agreement
15 See Item 7 Optional Shore based video equipment – software service fee
X% per annum covering debugging and software updates for both rolling stock and RU software
Application specific agreement
16 See Item 7 Optional Vehicle license – health & status monitoring
Per vehicle and month Application specific agreement
17 Operational costs ( e.g. inspection, calibration., image retrieval etc.)
Staff to oversee shore based system and initiate maintenance, remove hard drives, copy footage for police or other investigations. This person would also cover similar requirements for any other on train CCTV covered by the same management system
One person full time – depending on fleet size
18 Maintenance costs Based on predetermined expected failure rates
for each item of equipment and periodic equipment operational checks. Agreed KPIs can provide a basis for determining likely costs.
Application specific agreement
19 Life expectancy Based on life expectancy of individual items of equipment
Application specific agreement
4.11.5 Applicability of results to different circumstances FFCCTV systems provide a number of significant safety and performance benefits in addition to those associated with the investigation of rail suicide and trespass fatalities. Images can provide retrospective information on the position before an incident occurred – useful for subsequent investigation and cost attribution. Benefits include:
• The investigation of many other types of incidents, accidents and near misses e.g. collisions, derailments, signals passed at danger, possible signalling system irregularities, trespass, incorrect use of crossings by individuals and vehicles, staff incidents;
• Undertaking infrastructure surveys e.g. overhead line condition, track conditions including flooding, lineside litter, encroaching vegetation, equipment and materials left on the line, security checks;
• Observing the condition of passing trains e.g. for loose fittings/equipment on freight vehicles; • Facilitating train service recovery following an incident e.g. reducing time for asset testing; • Crime prevention e.g. identification and subsequent arrest of individuals involved in trespass,
vandalism, metal / cable theft and other criminal activities including off-rail crime investigation; • Platform incidents – observing activity on platforms during station pass through;

RESTRAIL SCP1-GA-2011-285153
RESTRAIL-WP5-CIDAUT-D5.2-B2-24102014_public Page 155 of 168 24 October 2014
• Input to driver route knowledge training and use in cab simulators for driver competence and performance;
• Input to rolling stock fleet management systems.
4.11.6 Discussion The review confirmed that FFCCTV systems provide an important information source for the management of rail fatalities incidents and associated investigations, as well as other significant safety, security and performance benefits. Following a fatality quick access by key decision makers, e.g. the police, to the recorded images can provide an important input to the key decision which can help minimise the impact on services – i.e. are the circumstances suspicious or not. In many cases the installed technology does not provide immediate post incident access and the information available is used primarily as an input to subsequent investigation. However systems are available providing remote access to images recorded on stationary trains and if linked directly to the police could provide the essential quick decision making means, although the potential improvement in incident clear up time needs further consideration.
However, information concerning the effect of FFCCTV as a contributing factor to the investigation of suicides and fatal trespassing incidents is insufficient. This is mainly because RUs and IMs do not collect relevant data, which would enable a quantitative assessment of the extent of FFCCTV benefits.
Benefits From an individual RU point of view the potential benefits of FFCCTV in relation to fatalities alone are arguably limited. An individual RU may only be involved in a limited number of fatalities and the cost of associated delays (in GB) is much less than the potential cost of fitting the remaining unfitted rolling stock of those RUs seen. However FFCCTV tends to be fitted as part of a package including on train CCTV and at least one of the RUs seen makes considerable use of on train CCTV images as an input to providing a safe and secure travel experience for their passengers. As previously mentioned there are of course the wider potential benefits to RUs and the IM in terms of e.g. safety management and reduced incident downtime, reduced investigation time and costs also as part of an RU’s management system with remote access providing for aspects such as monitoring rolling stock condition and performance, optimising driving performance and timetable adherence.
Investment The disaggregated rail industry adds a particular dimension to investment in projects such as FFCCTV fitted to rolling stock owned or leased by an RU. It is important to recognise that the actual and potential benefits of FFCCTV are not realised solely by one RU as there are considerable actual and potential benefits for other rail industry players – the Infrastructure Manager (IM) and other RUs using the same routes - and indirectly passengers. The reduction in incident time, hence costs, achievable by the police having direct access to FFCCTV images needs identification. A financial appraisal of these and other benefits and costs e.g. which rail organisation actually bears the costs of an incident, would be necessary to support equitable investment by the involved industry partners. For example with one RU seen the IM invests in the CAPEX and the RU the OPEX costs
However fitting FFCCTV now appears to be becoming the accepted way forward for new rolling stock builds e.g. for Crossrail and rolling stock for the Inter City Express Programme (IEP).
Police considerations Police investigation decision making is a key element in reducing the period of disruption following a fatality. In GB development of this process has already resulted in a considerable reduction in the

RESTRAIL SCP1-GA-2011-285153
RESTRAIL-WP5-CIDAUT-D5.2-B2-24102014_public Page 156 of 168 24 October 2014
time involved when an incident is deemed to be non-suspicious. Fundamental to this reduction has moving from the risk averse approach previously applied by police officers responding to a fatality. This often involved fatalities being classified as unexplained i.e. no immediate cause explanation and no available information or intelligence to confirm the circumstances. This approach involved the (often unnecessary) deployment of significant police resources to site with extended disruption of rail services and attendant potential for harm to passengers and staff who may be stranded on a train for an unusually long time.
Following a review and consultation with involved industry and external stakeholders, BTP instituted a revised risk assessed approach based on incident classification guidelines and starting with a non suspicious mindset. This approach was supported by the education of BTP officers and reflecting the need:
• for diligent, professional investigations;
• to meet the expectations of external stakeholders e.g. Coroners and pathologists;
• to ensure the respect and dignity of the deceased.
If no suspicious circumstances are identified and death is declared the body may be covered by a ‘forensic’ sheet and/or moved. With this classification and after any site clean-up steps are taken to resume services - although the associated police investigation continues to ensure provision of a fully documented file for the Coroner/Procurator Fiscal.
The aspects considered in the classification of fatalities are as follows:
• Obtaining Train driver / eye witness accounts;
• Viewing FFCCTV / CCTV images;
• Identifying any vehicles found near scene;
• Assessing the fatality scene;
• Searching the body / assessing items found;
• Obtaining information from next of kin;
• Intelligence regards individual.
The revised approach has reduced the number of unexplained incidents considerably (2011/12 – 101, 2012/2013 – 30 and 2013/2014 – 10 to date) and the average time for conclusion of a fatality declared as non-suspicious (from the time reported to the BTP) is now 73 minutes. This has resulted in a 21% reduction in total delay minutes from the year 2011/2012 to 2012/2013.
Where the facility is provided a direct review by BTP officers on site on the involved train of FFCCTV images can assist site investigation in particular determination of the circumstances involved – suspicious or non-suspicious. The capability to remotely view recorded images immediately following an incident provides the most beneficial input possible to police decision making in term of speed. However BTP access to this facility is at present through RU or IM equipment and speed depends on the physical location of BTP officers in relation to the access equipment.
There are of course limitations on the extent to which the incident response time can be reduced. Specialists will always need to attend the site (e.g. IM and RU managers and support specialist staff, the police, the mortician and clean up contractors) and the time necessary to replace the involved driver will depend on driver availability, the location and access. In

RESTRAIL SCP1-GA-2011-285153
RESTRAIL-WP5-CIDAUT-D5.2-B2-24102014_public Page 157 of 168 24 October 2014
Suggested improvements A standardised approach to considering what is necessary for effective fitment and functionality of FFCCTV systems, whether for new or retro-fit applications, would be of benefit to all potential users. An example of this approach is RSSB document GM/GN2606 appropriate to both new and retro-fit installations. Any industry guidance needs to reflect the fact that technology in this field is constantly developing both in terms of technological advances and to meet the emerging needs of IMs and RUs to exploit the benefits of these systems.
As FFCCTV becomes more widely used, with increased use of video surveillance management systems enabling remote access to data using wireless links, it is essential to ensure that data protection is maintained during access and transmission. Documented controls and procedures will need to reflect the development of FFCCTV systems and their application.
The use of desktop shore based video management systems enabling data to be automatically transferred from rolling stock to central location/s using wireless links are of particular benefit when large fleets are involved. These systems enable the application of KPIs (agreed by the supplier with the RU) to system and individual equipment availability and performance. They also make it much easier to access the relevant information when an incident occurs and to produce video and still images for investigation and evidential purposes. This is particularly the case with systems providing a live view connection with remote access and playback. Subject to any legal implications this approach provides the capability for future direct police access to images relating to any type of incident involving a train, including on train internal and door operation CCTV images. In the event of a rail fatality this type of system provides the quickest possible information for decision making - before a police officer is on site.
RESTRAIL SCP1-GA-2011-285153
RESTRAIL-WP5-CIDAUT-D5.2-B2-24102014_public Page 158 of 168 24 October 2014
5. GENERAL CONCLUSIONS: RECOMMENDATIONS Interesting results were found in the evaluations carried out in the RESTRAIL project. Altogether, they provide new recommendations to improve reduce the number of railway suicide, (fatal) trespassing accidents and post-incident consequences. Those results which do not bring new recommendations are in line with the evidence from the literature, and bring new empirical support for the effectiveness of particular measures.
5.1. Lessons learnt in suicide prevention Concerning the reduction of the number of suicides, the gatekeeper training courses provided an improvement in skills such as knowledge about railway suicide (warning signs, prevention, facts, handling of suicidal subjects, referral) and attitude toward railway suicides (communication with and support of suicidal subjects). In addition to this, the Dutch gatekeeper training course concluded that topics developed in the course are those requested by the employees. Importantly, this type of courses significantly increases the feeling of competence of staff, particularly those with less than 20 years on the job experience, to handle a conversation with potentially suicidal persons.
Furthermore, these types of courses are highly recommended since they are cheap and adjusted easily to different circumstances and settings, and prior knowledge on the part of participants is not required. The contents of the course depend on the local culture and in countries where suicide is not accepted this kind of course will not probably work. Finally this kind of course can be combined with other measures without any problem.
The results of the both evaluations are comparable to those reported in the literature (Berlim, 2007; Cross; 2010). Although gatekeeper training assessed in RESTRAIL have identified that the feeling of competence to handle a conversation with a potentially suicidal person, increases significantly for men and women, for all ages and for all years on the job, except more than 20 year on the job. Furthermore, the need of after care for employees who have experienced contact with potentially suicidal persons is a key issue to be taken into account after the intervention of these employees.
Likewise, interesting recommendations have been obtained form these evaluations:
- It is important to have combined groups of people for the training; not only in position, but also in organisation they work for (NS, ProRail or other company). This enables a better understanding of other people’s work and experiences in a similar incident.
-The experiences that people had and talked about should not be underestimated. On one hand, this can be made the organisers realise to focus on a safe environment to enable these discussions, and on the other hand also, make sure there was a good plan to provide mental support to the participants if necessary, before, during and after taking the course.
- The selection of course participants is important. The organisers need to be careful who to invite to the course and make sure that management is able to provide back-up for mental support for the participants if necessary.
Another measure evaluated aimed at railway suicides was societal collaboration. This measure has not been evaluated before; therefore this field test has a major added value. According to the results of this particular evaluation, 40 of the 64 persons threatening to commit suicide were found and taken to psychiatric care by the Police. In addition, train services were less disturbed by short traffic stops on more occasions than an actual fatal accident. For example, short traffic stops (involving 25 hours for 64 threats of suicide) where people have been saved can be compared to 4 cases where this was not the case involving trains stopped for 30 hours. This study identified the great importance of the need for very clear communication among the participants and actions to ensure this is achieved.
RESTRAIL SCP1-GA-2011-285153
RESTRAIL-WP5-CIDAUT-D5.2-B2-24102014_public Page 159 of 168 24 October 2014
For the further implementation of this measure, the participants in this field test underline the importance of a possibility for the involved stakeholders to meet and discuss, not only the project itself, but also views and ideas from the personnel who are involved in the rescues. The meetings are basically to make the implementation and the actual collaboration run smoothly. In these meetings deviations is an important matter. For example if not all have been accounted for when the traffic starts again. It is also important to communicate the purpose and the reason why the collaboration was started.
Another of the evaluations in the RESTRAIL framework targeted to reduce suicide and attempt of suicide has been mid-platform fencing, and this evaluation has been one of the more expected, since whilst there have been evaluations of some types of fencing at railway stations, there have been no previous studies of the effectiveness of mid-platform fencing. This has been an extensive trial in RESTRAIL and is an important contribution to the RESTRAIL project. The findings from the trial are encouraging. There has been only one fatality at fast lines at a station, after mid-platform fencing has been fitted. The results need to be interpreted with some caution. There have been recent incidents at slow lines at a small number of these stations and other stations along the line of route where mid-platform fencing has been fitted. The monitoring period (post-intervention) has been short in relation to many of the stations.
There is need for collection and analysis of statistics over a longer period of time to determine if the fencing is preventing access to fast lines and potentially contributing to a displacement of incidents to other lines or stations. This is one of several interventions that have been applied at stations in GB (e.g. the partnership programme between Network Rail and the Samaritans) and the fencing may not be the only factor that is contributing to any change in the numbers of events at stations. Nevertheless, the evaluation has shown that people like the fencing and think that they work in preventing incidents. There may also be other benefits, such as increasing perceptions of safety while on platforms and the prevention of unsociable behaviour and access to places where people should not be. This type of fencing may be an effective intervention in stations, preventing access to fast lines where trains do not usually stop. It can be used in combination with other interventions (e.g. training of staff, improved surveillance) and should not present problems in transferring to other countries. It can be costly and is not a solution that can be applied and every station. However, this can be a realistic option to consider where there is an appropriate station configuration and a high proportion of non-stopping trains at a platform at the station.
5.2. Lessons learnt in trespass prevention Regarding the prevention of trespassing incidents, two of the evaluated measures were focused on the educational aspects. Education in schools for 8-11 year old children and the Railway Safety Education Programme promoted safe behaviour and habits in the railway environments, in order to educate pupils in the dangers inherent in taking short cuts, playing on the tracks and behaving unsafely at stations. In the case of education in schools, this campaign had a positive effect for all measures studied: level of knowledge related to railway trespassing, reported crossing behaviour, and pupils’ assessment of safety related to crossing railway lines. In the same line, the Railway Safety Education Programme achieved an increase in teacher awareness about the need to cover railway safety at school and greater confidence, skills and commitment to do so in the future. Moreover, students learnt about the risk factors related to trains speed, weight and stopping distance and were able to apply this knowledge to explain the repercussions for someone acting dangerously on or near the railway tracks and in a station.
Both measures’ findings suggest the children’s knowledge of railway safety and their subsequent behaviour is heavily influenced by the actions observed in the adults around them. For this reason, education outside of schools also plays an important role in communications the safely message. In this sense the railway museums have a crucial role in bringing the society closer to the world trains.
RESTRAIL SCP1-GA-2011-285153
RESTRAIL-WP5-CIDAUT-D5.2-B2-24102014_public Page 160 of 168 24 October 2014
These programmes can be applicable in different social contexts, although it is obviously necessary to adapt the contents to the reality of where the measure is being applied and contents should take into account the demographic profile of the target population and the features of the local implementation site. In addition, in the case of applying this educational programme in other contexts, it is also important to bear in mind the fact that children reproduce the behaviours around them. In these circumstances a multidimensional and multi-stakeholder response is required. On the other hand, this kind of programme in the schools could be implemented in other European countries; however the material should be adjusted to comply with local circumstances where courses would be implemented.
Another prevention measure found quite effective to prevent trespassing were the use of warning signs and posters to discourage pedestrians from using illegal crossing places. These can provide information concerning the possibility of being fined if users cross through prohibited or unauthorised places as well as conveying information about the rail safety culture. Even though a general effectiveness seems to be clear, the characteristic of these signs and posters should be adapted depends on the context and country; especially, it should be flexible regarding three main points: content, amount of signs and posters and period of time. Concerning these issues some recommendations have been indicated for the further implementation of these measures:
- The design of the signs/posters should be carefully planned. It might be that the same design is not effective in all cultures. For example some train operators could disagree with the message shown as they might not like the depiction of a (recognizable, their company) train on a poster. In addition, it is important that the posters have a language such that everyone can understand its content (i.e. removing old posters and replacing them with posters in a modern language). Finally, it is crucial to be careful with the message "trespassing is dangerous" this could attract potentially suicidal persons to the tracks. It is better to address to "the delays caused by trespassers" and "the number of people that are deceived by those delays".
- The amount of signs presented is another important factor to be considered. It should be made sure that there is no unnecessary signing. Otherwise, people could look at the posters without taking much notice of them. On the other hand, paying attention depends on the amount of posters that are installed, in this way, it should be study carefully how many and where the posters are allocated.
- And, thirdly, it is important to take into account the period of time the signs and posters are exposed in a determinate area. The effect of posters is likely to be reduced over time. However, this effect could be maintained by replacing the old and ‘grungy’ posters by new ones. Their effectiveness could be increased also by changing the content / design of the posters from time to time (e.g. every year or twice a year a new poster).
As a general idea, the optimal measure would be to combine these signs with targeted campaigns. Furthermore, another successful resource could be to combine these measures with prohibitive signs. Placing signs with the same message next to each other (e.g. one is an icon, the other a picture with text, the other is a prohibitive sign). Finally, it is crucial to receive support from station owners etc. for space to place posters as these may compete with others for space (e.g. displacing advertising revenue). After all, one of the most important factors is government involvement. Budget and political will would be the main paths in order to generalize those methodologies.
Furthermore, another measure addressing the prevention of trespassing was the use of video enforcement and sound warning systems. After implementation the number of trespassing incidents was reduced significantly. However, since no control site was included in the study, the effect reflects not only the intervention but also the effects of other factors such as changes in for
RESTRAIL SCP1-GA-2011-285153
RESTRAIL-WP5-CIDAUT-D5.2-B2-24102014_public Page 161 of 168 24 October 2014
example; people needs to cross the railway, season of the year and weather. Some recommendations were arisen form this pilot test for the further implementation of this measure:
1. These pilot tests were not advertised in the media, and the perceptions of the public about the measure were based on their own experiences (and perhaps also the experiences of other people they know). In a way this may have increased the effect of the measure, because people remained uncertain about the possibility of punishment for trespassing. Media attention could also have increased the perception of dangers related to trespassing, and thus improved the effect.
It seems likely that adding media campaigns and true threat of punishment to video enforcement and sound warning, its effect on trespassing could be enhanced, at least in the short term. In order to maintain the effect high, media coverage should be maintained and include also information on issued penalties.
2. Overall, video enforcement combined with sound warning can reduce trespassing significantly. In the two pilot test sites the reduction in the frequency of trespassing was 18% and 44%. However, because of the lack of control sites the effect may have become somewhat overestimated. Those who are planning to implement a similar measure are advised to use an expected effect of the reduction of trespassing between 10% and 30%, depending on local circumstances, especially the distance to alternative legal crossing facilities.
3. The pilot test equipment operated on 12 V batteries, which had to be changed weekly. Otherwise the system seemed to work reliable with the exception of a breakdown of infrared sensor at the Tammisaari site (Kallberg, Plaza, Silla, García et al, 2014). The need for maintenance would be much reduced if mains power was used instead of batteries.
4. Video enforcement combined with sound warning suits best to locations where trespassing is concentrated in a limited area, such as a footpath across the railway, where detection of trespasser is more reliable and sound warnings are less likely to be disturbing to those living or moving in the neighbourhood, compared to sites where trespassing is spread to a wider area. Furthermore, mains power should be fairly easily available to avoid the need for frequent maintenance of the system. An obvious alternative to video enforcement and sound warning is fencing, which can be more effective, suits for limited locations where trespassing is concentrated on certain routes and does not need electricity.
Lastly, there was a project, based on the combination of different measures, which included physical measures preventing the access to the railway area and behavioural measures informing the users and public the dangers and illegality of trespassing.
It is not known whether similar combinations of measures against trespassing in railway area have been implemented before. Nor are there results of the frequency of trespassing accidents of such approaches. For this reason, this pilot test has and added value. As was indicated, an important decrease on the number of trespassers was obtained with this project. A reduction of almost 95% on the trespassers was provided. Therefore, this combination of measures could be a good option in order to reduce the number of trespassers in on specific railway area. The issues to be taken into account for the further implementation should be the same than those aspects to be considered in each one of the measures used in this pilot.
5.3. Lessons learnt in post incident consequences mitigation Concerning the measures addressed to mitigate the consequences of these types of incidents, two means were assessed in RESTRAIL project: computer based training and Forward Facing CCTV in trains. With regard to the CBT, this training module was effective in making a positive contribution to the understanding by decision makers handling suicides and fatal trespassing incidents of the manner in which such incidents are handled. Collaboration between decision
RESTRAIL SCP1-GA-2011-285153
RESTRAIL-WP5-CIDAUT-D5.2-B2-24102014_public Page 162 of 168 24 October 2014
makers, RUs and IMs for effective incident management and the manner in which it can support them in managing these incidents was also emphasised. Altogether this training was considered highly relevant with extremely high effectiveness for RUs and the police. Above all, the means described in the lesson was perceived as valuable to reducing shut-down time as a result of suicides and fatal trespassing incidents.
FFCCTV, with a wireless link providing real time remote access to images by key decision makers, particularly the police, facilitates the earliest possible decision making on the circumstances involved with rail fatalities. Determining whether a suicide or homicide is involved has a considerable impact on system shut down time. Close liaison by RUs and IMs with the police is essential to maximise FFCCTV benefits.
Mostly CEA (and mini CBA in two cases) were performed with the cost and effectiveness data collected within the WP5 field studies. Unfortunately, it was not possible to perform any preliminary economic analyses in the case of four pilot tests (Dutch gatekeeper programme, German gatekeeper programme, training based on CBT and Forward Facing CCTV), due to various reasons like: (1) lack of time to collect long-term and robust data; unavailability of actual measures of measure effectiveness and/or of other effects and impacts on the network and (2) missing data that make difficult estimating the costs. These difficulties are however, in line with a common observation by authors (World road association, Technical committee C2, safer road operations, 2012) who have indicated that one of the greatest problems in cost-benefit analysis is to obtain valid and reliable monetary valuations of all relevant impacts. This objective is rarely, if ever, fully realized. It is therefore often relevant to carry out a cost-effectiveness analysis in addition to, or instead of, a cost-benefit analysis. It is worth to note that the CEA results reported for each measure cannot be compared for at least two reasons. First, data were collected in unique contexts. Second, they address at different objectives (e.g. increasing awareness of risk related to rail trespassing by children vs. decreasing the number of trespass-related events). Reported results provides consequently only a first indication of contextualised ratio between costs and effectiveness for one measure in the specific situation where implemented. Although it should be noticed that obtained values provide also no information on how they can be optimally applied and extended to (parts of) the network. Furthermore, the assumptions to be made are still scarcely supported by evidences, as reminded in the CBA/CEA results sections.
CBA are also not directly comparable even if both represent a ratio of monetary values. Beyond the reported limits, we obtained CBA ratio of respectively 2.52 (Mid plat-form fencing) and 4764 (Societal collaboration) representing positive situations. Indeed, CBA ratio greater than 1 will indicate that the investment yields at least the same amount that was invested. In practice, however, one usually consider that a measure is really interesting when it brings more than it costs, i.e the ratio is much larger than 1. A value from 2 or 5 is considered interesting in economic terms (and a fortiori when it is even greater). Such CBA ratio higher values might be obtained when costs are very low with at least a moderate effect or when the measure is highly effective measure with much higher costs. Nevertheless as it has been said before, these values should not be considered as definitive. Two additional conclusions can be drawn. First, the RESTRAIL frame was very efficient to develop field tests of measures but cannot gather the whole set of data required for conducting CEA or CBA to actually compare between the various options in the same (or very similar) locations. This is probably due to two main factors: (1) the initial overestimation of available published data for setting our calculations and (2) the unavailability of connected theories and evidences between the different measures' objectives with the common goal of decreasing railway suicide and trespass accidents and all their consequences. Subsequently, developing more sound socio-economic evaluations of measures for preventing suicide and trespass accidents will require a whole dedicated project focused on a smaller set of combination of measures leaving more time and more capability to parallelize several experimental and control situation; using controlled characteristics to select the different experimental sites and with measurement tools that enable the collection of all relevant data, during longer periods, and testing several comparable
RESTRAIL SCP1-GA-2011-285153
RESTRAIL-WP5-CIDAUT-D5.2-B2-24102014_public Page 163 of 168 24 October 2014
preventative measures and objectives. Secondly, the elaboration of a theory-based framework (Weiss, 1997)22 is required to accurately support these evaluations and economics estimates. In other words, we’ll need an explicit conceptualization of the chosen prevention measures in terms of a theory that attempts to explain how it produces the desired effects (e.g. significantly decreasing the number of rail trespassing accidents) as well as the various relevant impacts (e.g in terms of Time loss and Delays). As revealed in the previous working steps in RESTRAIL, a high amount of data and evidences are still unavailable or difficult to obtain, thus requiring developing relevant indicators from the field, collection procedure and tools at a wider scale than it was expected to do in the RESTRAIL context. A further step will thus be verifying and sometimes modifying the assumptions which base this theory-based framework. It would probably involve to carrying out new studies and investigation whenever needed. The recently proposed model of suicide and trespass process (Burkhardt, Radbo, Silla and Paran, 2014) and the updated knowledge in the RESTRAIL toolbox could provide the basis for initiating such a theory-based approach for evaluating Restrail measures1
5.4. The way forward All results obtained in each of these evaluations as well as the recommendations and lesson learnt are going to be collected in a toolkit, considered as the final outcome of this project. The RESTRAIL Toolbox is a problem-solving guide for implementation of measures to prevent railway suicides and trespassing accidents and to mitigate the post incident consequences. It is the main output of the RESTRAIL research project and it aims to be a helpful, intuitive and user-friendly tool.
It summarises practical information collected and produced during the project (synthesis, guidelines, best practice, lessons learned and empirical evidence for effectiveness). The content also makes links with scientific publications which support the recommended and promising measures, providing a wide list of references (research papers, research reports, reviews, etc.).
The Toolbox is designed to help railway undertakings (RUs), infrastructure managers (IMs), station managers and other concerned decision makers in three ways:
- lead them through the process of selecting from the range of preventative and mitigation measures,
- provide more detailed guidance on the implementation of those measures and
- provide a framework for collecting and structuring information in order to feed an accessible and documented database on measures for implementation and efficiency across the rail community and beyond
In this respect, the 11 pilot tests carried out in WP5 of the project cover:
- the 3 target problems (suicide, trespass and mitigation);
- the 3 types of measure: organisational and procedural measures; physical and technological measures and public awareness and educational measures.
- the 5 effect mechanisms: improve practice and processes, influence decision; deter access; influence behaviour and reduce consequences.
22 Weiss, C. H. (1997). Theory‐based evaluation: Past, present, and future. New directions for evaluation, 1997(76), 41-55.

RESTRAIL SCP1-GA-2011-285153
RESTRAIL-WP5-CIDAUT-D5.2-B2-24102014_public Page 164 of 168 24 October 2014
Finally, it would be important to highlight several gaps that could provide continuity to this project and to improve the results got, such as large real-life trials, implementation of measures in the safety management system and collaboration outside the direct railway vicinity for influencing suicide persons at an earlier stage. Scale and time should be enough to detect effect statistically.
RESTRAIL SCP1-GA-2011-285153
RESTRAIL-WP5-CIDAUT-D5.2-B2-24102014_public Page 165 of 168 24 October 2014
6. REFERENCES
Bickel, P., Friederich, R., Burgess, A et al.(2006). “Proposal for Harmonised Guidelines”, Deliverable 5, HEATCO “Developing Harmonised European Approaches for Transport Costing and Project Assessment”, 2nd Revision, February 2006.
Available at: http://heatco.ier.uni-stuttgart.de/HEATCO_D5.pdf
Burkhardt, J-M; Beurskens, E.; Ryan, B.; Hedqvist, M. et al (2013). RESTRAIL (Reduction of Suicides and Trespasses on RAILway property) project. Assessment of suitable measures (Technical and soft measures) for the prevention of suicides and trespasses. Merged Deliverable D5.3. and D3.2. ; 28/02/2013.
Burkhardt, J.-M, Radbo H., Silla, A. and Paran F. (2014). A model of suicide and trespassing processes to support the analysis and decision related to preventive railway suicides and trespassing accidents. Transport Research Arena, 14-17 Apr 2014 Paris La Défense (France).
Commonwealth of Australia (2006). Introduction to Cost-Benefits analysis and other alternative
evaluation methodologies. Dpt of finance and administration, January 2006.
Available at: http://www.ag.gov.au/cca
Cross, W., Matthieu, M.M., Lezine, D., and Knox, K.L. (2010) Does a brief suicide prevention
gatekeeper training program enhance observed skills? Crisis, 31(3):149-159.
CGSP (2013). L’évaluation socioéconomique des investissements publics (tome 1). Commissariat general à la stratégie et la prospective, septembre 2013.
Elvik, R., Høye, A., Vaa, T. & Sørensen, M. 2009. The Handbook of Road Safety Measures. Second Edition. Emerald.
Erazo N, Baumert J, Ladwig KH (2005). Factors associated with failed and completed railway suicides. J Affect Disord 88, 137-43.
Erazo NS, Baumert J, Ladwig KH (2004). Sex specific time patterns of suicidal acts on the German railway system. An analysis of 4003 cases. J Affect Disord 83: 1-9).
European Railway Agency (2013). Implementation guidance for CSIs, Annex I of directive 2004/49/EC as amended by directive 2009/149/EC. Report ERA/GUI/09-2013 v 2.3.
RESTRAIL SCP1-GA-2011-285153
RESTRAIL-WP5-CIDAUT-D5.2-B2-24102014_public Page 166 of 168 24 October 2014
Florio, M. et al. (2008) "Guide to cost-benefit analysis of investment projects: structural funds and instrument for pre-accession." (2008). EUROPEAN COMMISSION Directorate General Regional Policy. Available at:
http://ec.europa.eu/regional_policy/sources/docgener/guides/cost/guide2008_en.pdf
Hauer, E. (1997). Observational Before-After Studies in Road Safety. Pergamon.
Hills, D, Junge, K. (2010) Guidance for transport impact evaluations. The Tavistock Institute, London. Available from http://www.roadsafetyevaluation.com/evaluationguides/index.html.
Hills, D. (2010) Logic mapping: hints and tips guide, Department for Transport, UK.
HM Treasury (2011). The Magenta Book. Guidance for evaluation. HM Treasury. Downloaded from
http://www.hm-treasury.gov.uk/data_magentabook_index.htm, 1 February 2013.
Hsieh, H–F., Shannon, S.E., 2005. Three Approaches to Quantitative Analysis. Qualitative health research 15 No 9, 1277–1288.
Kallberg, Plaza, Silla, García et al (2014). RESTRAIL (Reduction of Suicides and Trespasses on RAILway property) project. D5.1. Selection of measures and their implementation in pilot tests planning and execution, 31/07/2014
Karoline, L., Baumert, J., Erazo, N. And Ladwig, K-H (2014). Stable time patterns of railway suicides in Germany: comparative analysis of 7,187 cases across two observation periods (1995–1998; 2005–2008). BMC Public Health 2014, 14:124.
Lukaschek K, Baumert J, Ladwig KH (2011). Behavioural patterns preceding a railway suicide: Explorative study of German Federal Police officers’ experiences. BMC Public Health 11: 620; Gaylord MS, Lester D: Suicide in the Hong Kong subway. Soc Sci Med1994, 38:427-430.
Mann, JJ; Apter, A; Bertolote, J; Beautrais A, Currier D, Haas A, et al (2005): Suicide prevention strategies: a systematic review. JAMA, 294:2064-2074
Meunier, V (2009). Analyse coût-bénéfices : guide méthodologique. Cahiers de la Sécurité Industrielle, 2009-06: Institute for an Industrial Safety Culture, Toulouse, France (ISSN 2100-3874) at http://www.icsi-eu.org/français/dev_cs/cahiers/.
O’Donnell I, Farmer R, Tranah T (1994): Suicide on railways. Soc Sci Med, 39:399-400
Trafikverket (2012).
RESTRAIL SCP1-GA-2011-285153
RESTRAIL-WP5-CIDAUT-D5.2-B2-24102014_public Page 167 of 168 24 October 2014
http://www.trafikverket.se/PageFiles/73641/samhallsekonomiska_principer_och_kalkylvarden_for_transportsektorn_asek_5_kapitel_9_trafiksakerhet_2.pdf
Rådbo, H., Renck, B., & Andersson, R. (2012). Feasibility of railway suicide prevention strategies; a focus group study. In C. Bérenguer, A. Grall & C. Soares (Eds.), Advances in safety, reliability and risk management. London: Taylor & Francis Group.
Randles, R.H. and Wolfe, D.A. Introduction to the theory of nonparametric statistics, John Wiley & Sons, New York etc (1979).
RESTRAIL. 2014. Deliverable 5.1. Selection of measures and their implementation in pilot test planning and execution.
Van Houwelingen CA and Beersma DG (2001): Seasonal changes in 24-h patterns of suicide rates: a study on train suicides in The Netherlands. J Affect Disord, 66:215-223.
Silla, A. (2012). Improving safety on Finnish railways by prevention of trespassing. Espoo 2012. VTT Science 27. 49 p. + app. 43 p.
Silla A. and Luoma, J. (2012). Opinions on railway trespassing of people living close to a railway line. Safety Science 50, 62–67.
Trafikverket (2012).
http://www.trafikverket.se/PageFiles/73641/samhallsekonomiska_principer_och_kalkylvarden_for_transportsektorn_asek_5_kapitel_9_trafiksakerhet_2.pdf
Transport Note TRN- 6, 33927 (2005) “When and How to use NPV, IRR2 and modified IRR”, ,The World Bank, Washington D.C. 2005.
World road association, Technical committee C2, safer road operations (2012). State of the practice for Cost-effectiveness analysis (CEA), cost-benefit analysis (CBA) and resource allocation

RESTRAIL SCP1-GA-2011-285153
RESTRAIL-WP5-CIDAUT-D5.2-B2-24102014_public Page 168 of 168 24 October 2014