Embed Size (px)
Citation preview
Page 1 of 23
Next release: To be announced
Release date: 3 September 2019
Contact: Beth Manders, Jasveer Kaur [email protected] +44 (0)1633 651901
Statistical bulletin
Suicides in the UK: 2018 registrationsRegistered deaths in the UK from suicide analysed by sex, age, area of usual residence of the deceased and suicide method.
Table of contents
1. Main points
2. Statistician’s comment
3. Things you need to know about this release
4. Suicides in the UK
5. Suicides by country
6. Suicides in 2018 by English region and Wales
7. Suicide patterns by age
8. Suicide methods
9. Registration delays have increased in England and Wales since the previous year
10. Links to related statistics
11. Quality and methodology
Page 2 of 23
1 . Main points
In 2018, there were 6,507 suicides registered in the UK, an age-standardised rate of 11.2 deaths per 100,000 population; the latest rate is significantly higher than that in 2017 and represents the first increase since 2013.
Three-quarters of registered deaths in 2018 were among men (4,903 deaths), which has been the case since the mid-1990s.
The UK male suicide rate of 17.2 deaths per 100,000 represents a significant increase from the rate in 2017; for females, the UK rate was 5.4 deaths per 100,000, consistent with the rates over the past 10 years.
Scotland had the highest suicide rate in GB with 16.1 deaths per 100,000 persons (784 deaths), followed by Wales with a rate of 12.8 per 100,000 (349 deaths) and England the lowest with 10.3 deaths per 100,000 (5,021 deaths); figures for Northern Ireland will be published later this year by the Northern Ireland Statistics and Research Agency.
Males aged 45 to 49 years had the highest age-specific suicide rate (27.1 deaths per 100,000 males); for females, the age group with the highest rate was also 45 to 49 years, at 9.2 deaths per 100,000.
Despite having a low number of deaths overall, rates among the under 25s have generally increased in recent years, particularly 10 to 24-year-old females where the rate has increased significantly since 2012 to its highest level with 3.3 deaths per 100,000 females in 2018.
As seen in previous years, the most common method of suicide in the UK was hanging, accounting for 59.4% of all suicides among males and 45.0% of all suicides among females.
2 . Statistician’s comment
Nick Stripe, Head of Health Analysis and Life Events, said:
“We saw a significant increase in the rate of deaths registered as suicide last year which has changed a trend of continuous decline since 2013. While the exact reasons for this are unknown, the latest data show that this was largely driven by an increase among men who have continued to be most at risk of dying by suicide. In recent years, there have also been increases in the rate among young adults, with females under 25 reaching the highest rate on record for their age group.
“Looking at the overall trend since the early 80s, we are still witnessing a gradual decline in the rate of suicide for the population as a whole. We will continue to monitor the recent increase, to help inform decision makers and others that are working to protect vulnerable people at risk.”
3 . Things you need to know about this release
Change in the standard of proof used by coroners in England and Wales
In England and Wales, all deaths caused by suicide are certified by a coroner. In July 2018, the standard of proofused by coroners to determine whether a death was caused by suicide was lowered to the “civil standard” – balance of probabilities – where previously a “criminal standard” was applied – beyond all reasonable doubt. The change does not affect Northern Ireland or Scotland.
Page 3 of 23
It is likely that lowering the standard of proof will result in an increased number of deaths recorded as suicide, possibly creating a discontinuity in our time series. With the data in this release, it is not possible to establish whether the higher number of recorded suicide deaths are a result of this change. Firstly, the change in the standard of proof occurred part way through 2018, and we therefore do not have a full year of data for which the change has been in place. Secondly, when looking at , increases 2018 suicide registrations by quarter in Englandappeared to begin prior to the change. Whenever a change in suicide rates occurs, the reasons are complex and will seldom be due to one factor alone. The Office for National Statistics will monitor and report the effect of this change when more evidence is available.
Further information on the change in the standard of proof can be found in our Quality and Methodology .Information report
Suicide definition
This release is based on the National Statistics definition of suicide; this includes all deaths from intentional self-harm for persons aged 10 and over, and deaths caused by injury or poisoning where the intent was undetermined for those aged 15 and over. Further information on the definition can be found in our Quality and
report.Methodology Information
Registration delays
In England, Wales and Northern Ireland, when someone dies unexpectedly, a coroner investigates the circumstances to establish the cause of death. The investigation, referred to as an “inquest”, is a process that can take months or, in some cases, years. The length of time it takes to hold an inquest creates a gap between the date of death and the date of death registration, referred to as a “registration delay”. For deaths caused by suicide, this generally means that around half of the deaths registered in a given year will have occurred in the previous year or earlier.
A different system in Scotland means that deaths caused by suicide are registered much sooner.
Further information, including the rationale for reporting suicide deaths based on the date of death registration, can be found in .Section 9, Registration delays have increased in England and Wales since the previous year
Data for Northern Ireland
In this year’s release, while we report data for the UK as a whole, which includes data for Northern Ireland, we do not report the latest 2018 numbers of deaths and rates for Northern Ireland; these will be published later this year on the .Northern Ireland Statistics and Research Agency website
Information for the media, and where to go for help
If you are a journalist covering a suicide-related issue, please consider following Samaritans’ media guidelines on e, owing to the potentially damaging consequences of irresponsible reporting. In particular, the reporting of suicid
the guidelines advise on terminology and include links to sources of support for anyone affected by the themes in the article.
Page 4 of 23
Where to go for help
If you are struggling to cope, please call Samaritans free on 116 123 (UK and ROI), email or [email protected] to find details of the nearest branch. Samaritans is available round the clock, every the Samaritans websitesingle day of the year, providing a safe place for anyone struggling to cope, whoever they are, however they feel, whatever life has done to them.
4 . Suicides in the UK
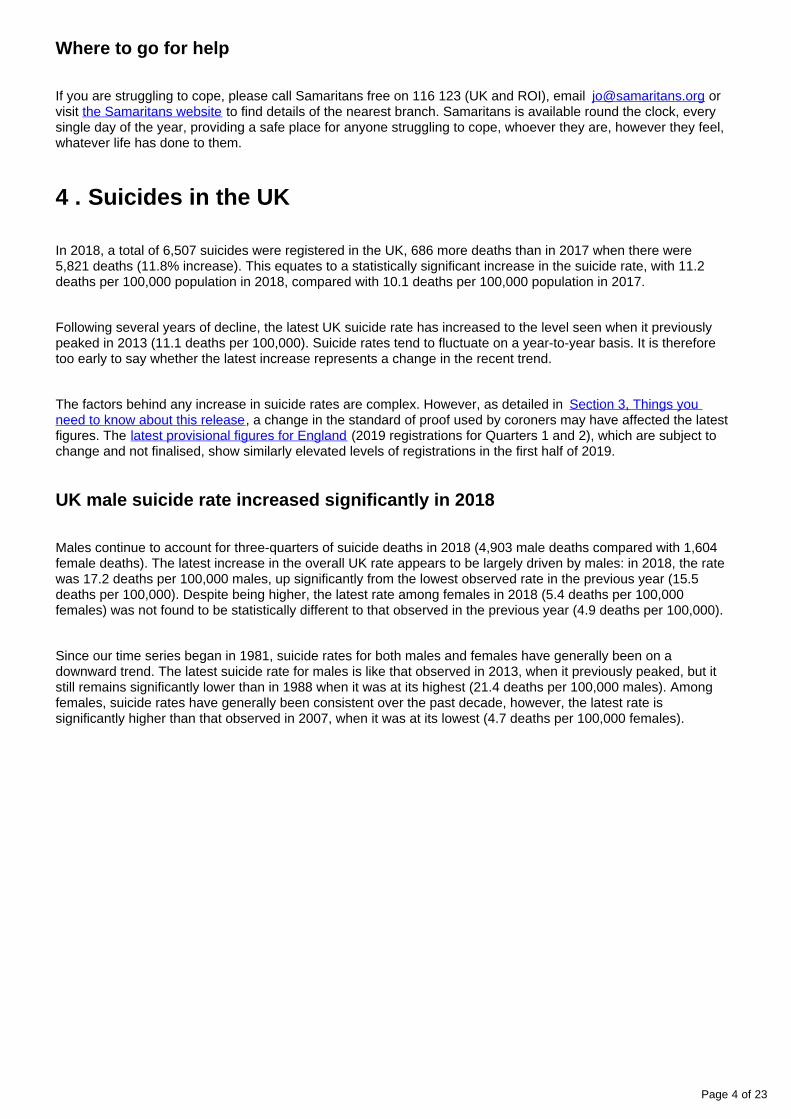
In 2018, a total of 6,507 suicides were registered in the UK, 686 more deaths than in 2017 when there were 5,821 deaths (11.8% increase). This equates to a statistically significant increase in the suicide rate, with 11.2 deaths per 100,000 population in 2018, compared with 10.1 deaths per 100,000 population in 2017.
Following several years of decline, the latest UK suicide rate has increased to the level seen when it previously peaked in 2013 (11.1 deaths per 100,000). Suicide rates tend to fluctuate on a year-to-year basis. It is therefore too early to say whether the latest increase represents a change in the recent trend.
The factors behind any increase in suicide rates are complex. However, as detailed in Section 3, Things you , a change in the standard of proof used by coroners may have affected the latest need to know about this release
figures. The (2019 registrations for Quarters 1 and 2), which are subject to latest provisional figures for Englandchange and not finalised, show similarly elevated levels of registrations in the first half of 2019.
UK male suicide rate increased significantly in 2018
Males continue to account for three-quarters of suicide deaths in 2018 (4,903 male deaths compared with 1,604 female deaths). The latest increase in the overall UK rate appears to be largely driven by males: in 2018, the rate was 17.2 deaths per 100,000 males, up significantly from the lowest observed rate in the previous year (15.5 deaths per 100,000). Despite being higher, the latest rate among females in 2018 (5.4 deaths per 100,000 females) was not found to be statistically different to that observed in the previous year (4.9 deaths per 100,000).
Since our time series began in 1981, suicide rates for both males and females have generally been on a downward trend. The latest suicide rate for males is like that observed in 2013, when it previously peaked, but it still remains significantly lower than in 1988 when it was at its highest (21.4 deaths per 100,000 males). Among females, suicide rates have generally been consistent over the past decade, however, the latest rate is significantly higher than that observed in 2007, when it was at its lowest (4.7 deaths per 100,000 females).
Page 5 of 23
1.
2.
3.
4.
5.
Figure 1: Significant increase in suicide rates for all persons and males in 2018
Age-standardised suicide rates by sex, UK, registered between 1981 and 2018
Source: Office for National Statistics, National Records of Scotland, and Northern Ireland Statistics and Research Agency
Notes:
The National Statistics definition of suicide is given in Section 3, Things you need to know about this .release
Figures are for persons aged 10 years and over.
Age-standardised suicide rates per 100,000 population, standardised to the European Standard Population 2013. Age-standardised rates are used to allow comparison between populations that may contain different proportions of people of different ages.
Figures include deaths of non-residents.
Figures are for deaths registered, rather than for deaths occurring in each calendar year. Owing to the length of time it takes to complete a coroner’s inquest, it can take months or even years for a suicide to be registered. More details can be found in Section 9, Registration delays have increased in England and
.Wales since the previous year
Page 6 of 23
5 . Suicides by country
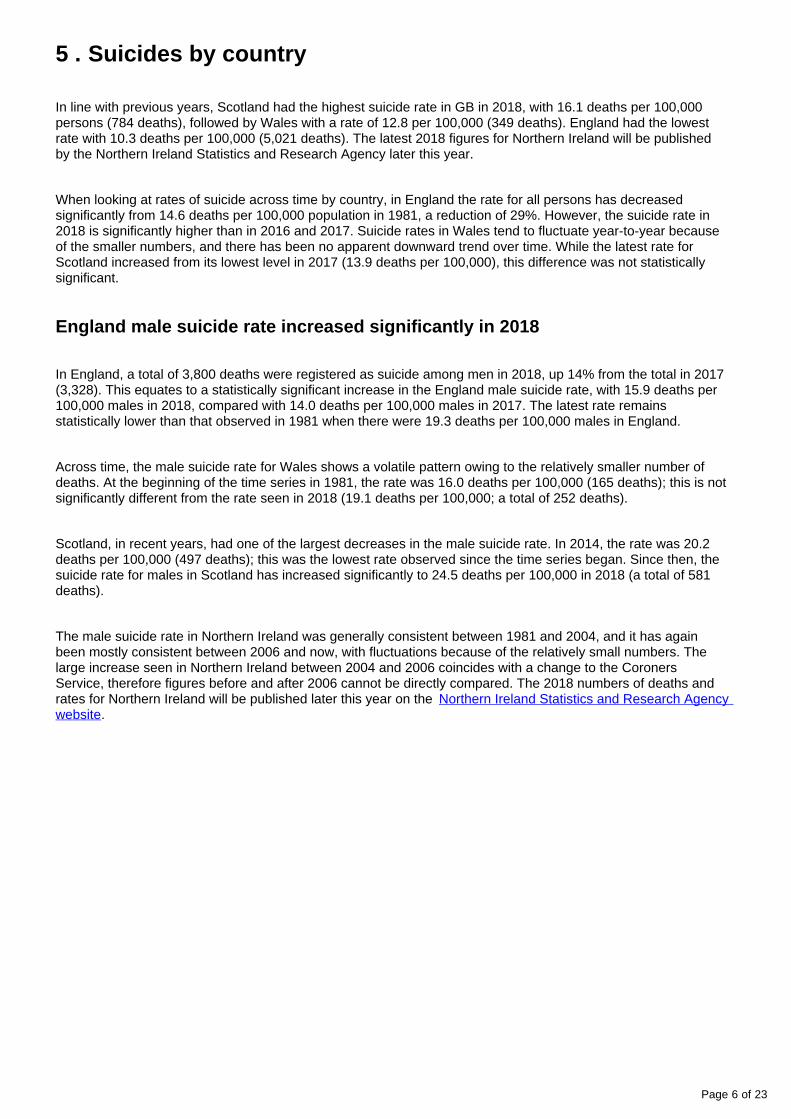
In line with previous years, Scotland had the highest suicide rate in GB in 2018, with 16.1 deaths per 100,000 persons (784 deaths), followed by Wales with a rate of 12.8 per 100,000 (349 deaths). England had the lowest rate with 10.3 deaths per 100,000 (5,021 deaths). The latest 2018 figures for Northern Ireland will be published by the Northern Ireland Statistics and Research Agency later this year.
When looking at rates of suicide across time by country, in England the rate for all persons has decreased significantly from 14.6 deaths per 100,000 population in 1981, a reduction of 29%. However, the suicide rate in 2018 is significantly higher than in 2016 and 2017. Suicide rates in Wales tend to fluctuate year-to-year because of the smaller numbers, and there has been no apparent downward trend over time. While the latest rate for Scotland increased from its lowest level in 2017 (13.9 deaths per 100,000), this difference was not statistically significant.
England male suicide rate increased significantly in 2018
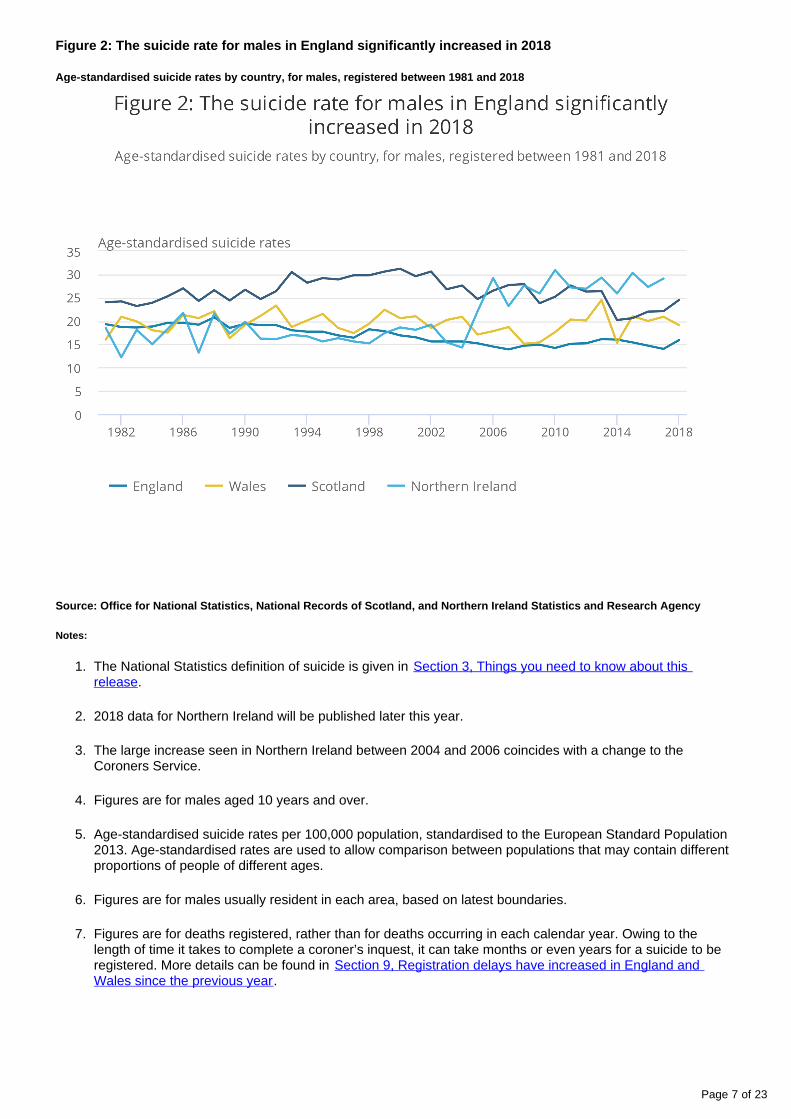
In England, a total of 3,800 deaths were registered as suicide among men in 2018, up 14% from the total in 2017 (3,328). This equates to a statistically significant increase in the England male suicide rate, with 15.9 deaths per 100,000 males in 2018, compared with 14.0 deaths per 100,000 males in 2017. The latest rate remains statistically lower than that observed in 1981 when there were 19.3 deaths per 100,000 males in England.
Across time, the male suicide rate for Wales shows a volatile pattern owing to the relatively smaller number of deaths. At the beginning of the time series in 1981, the rate was 16.0 deaths per 100,000 (165 deaths); this is not significantly different from the rate seen in 2018 (19.1 deaths per 100,000; a total of 252 deaths).
Scotland, in recent years, had one of the largest decreases in the male suicide rate. In 2014, the rate was 20.2 deaths per 100,000 (497 deaths); this was the lowest rate observed since the time series began. Since then, the suicide rate for males in Scotland has increased significantly to 24.5 deaths per 100,000 in 2018 (a total of 581 deaths).
The male suicide rate in Northern Ireland was generally consistent between 1981 and 2004, and it has again been mostly consistent between 2006 and now, with fluctuations because of the relatively small numbers. The large increase seen in Northern Ireland between 2004 and 2006 coincides with a change to the Coroners Service, therefore figures before and after 2006 cannot be directly compared. The 2018 numbers of deaths and rates for Northern Ireland will be published later this year on the Northern Ireland Statistics and Research Agency
.website
Page 7 of 23
1.
2.
3.
4.
5.
6.
7.
Figure 2: The suicide rate for males in England significantly increased in 2018
Age-standardised suicide rates by country, for males, registered between 1981 and 2018
Source: Office for National Statistics, National Records of Scotland, and Northern Ireland Statistics and Research Agency
Notes:
The National Statistics definition of suicide is given in Section 3, Things you need to know about this .release
2018 data for Northern Ireland will be published later this year.
The large increase seen in Northern Ireland between 2004 and 2006 coincides with a change to the Coroners Service.
Figures are for males aged 10 years and over.
Age-standardised suicide rates per 100,000 population, standardised to the European Standard Population 2013. Age-standardised rates are used to allow comparison between populations that may contain different proportions of people of different ages.
Figures are for males usually resident in each area, based on latest boundaries.
Figures are for deaths registered, rather than for deaths occurring in each calendar year. Owing to the length of time it takes to complete a coroner’s inquest, it can take months or even years for a suicide to be registered. More details can be found in Section 9, Registration delays have increased in England and
.Wales since the previous year
Page 8 of 23
Wales female suicide rate increased significantly since 2016
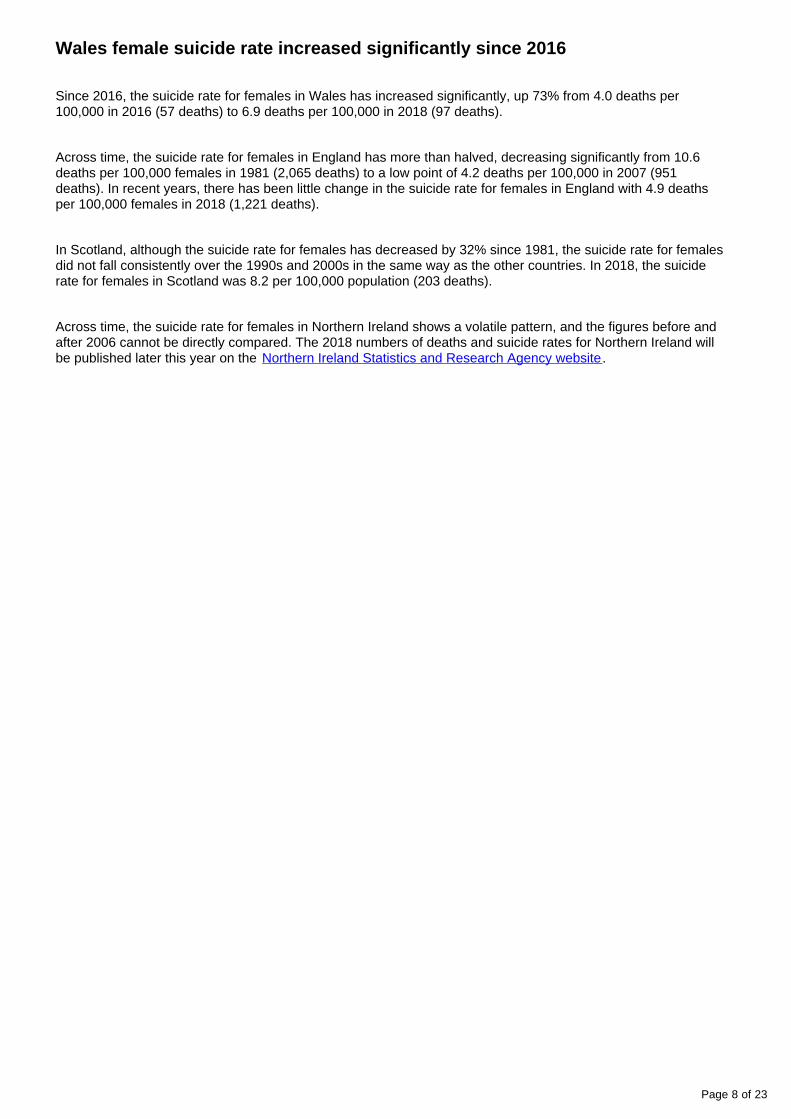
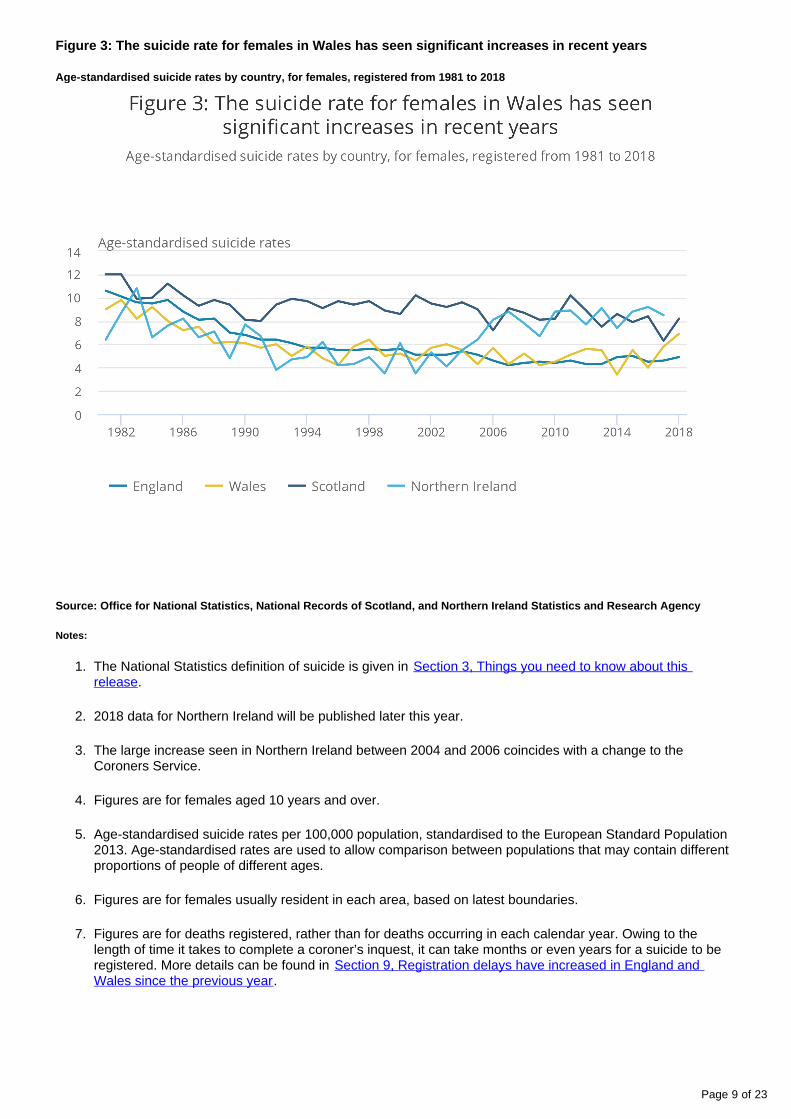
Since 2016, the suicide rate for females in Wales has increased significantly, up 73% from 4.0 deaths per 100,000 in 2016 (57 deaths) to 6.9 deaths per 100,000 in 2018 (97 deaths).
Across time, the suicide rate for females in England has more than halved, decreasing significantly from 10.6 deaths per 100,000 females in 1981 (2,065 deaths) to a low point of 4.2 deaths per 100,000 in 2007 (951 deaths). In recent years, there has been little change in the suicide rate for females in England with 4.9 deaths per 100,000 females in 2018 (1,221 deaths).
In Scotland, although the suicide rate for females has decreased by 32% since 1981, the suicide rate for females did not fall consistently over the 1990s and 2000s in the same way as the other countries. In 2018, the suicide rate for females in Scotland was 8.2 per 100,000 population (203 deaths).
Across time, the suicide rate for females in Northern Ireland shows a volatile pattern, and the figures before and after 2006 cannot be directly compared. The 2018 numbers of deaths and suicide rates for Northern Ireland will be published later this year on the .Northern Ireland Statistics and Research Agency website
Page 9 of 23
1.
2.
3.
4.
5.
6.
7.
Figure 3: The suicide rate for females in Wales has seen significant increases in recent years
Age-standardised suicide rates by country, for females, registered from 1981 to 2018
Source: Office for National Statistics, National Records of Scotland, and Northern Ireland Statistics and Research Agency
Notes:
The National Statistics definition of suicide is given in Section 3, Things you need to know about this .release
2018 data for Northern Ireland will be published later this year.
The large increase seen in Northern Ireland between 2004 and 2006 coincides with a change to the Coroners Service.
Figures are for females aged 10 years and over.
Age-standardised suicide rates per 100,000 population, standardised to the European Standard Population 2013. Age-standardised rates are used to allow comparison between populations that may contain different proportions of people of different ages.
Figures are for females usually resident in each area, based on latest boundaries.
Figures are for deaths registered, rather than for deaths occurring in each calendar year. Owing to the length of time it takes to complete a coroner’s inquest, it can take months or even years for a suicide to be registered. More details can be found in Section 9, Registration delays have increased in England and
.Wales since the previous year
Page 10 of 23
1.
2.
3.
4.
5.
6 . Suicides in 2018 by English region and Wales
Among men, the area with the highest suicide rate in 2018 was the North East (20.4 per 100,000); this suicide rate was significantly higher than London, the area with the lowest suicide rate for males (13.8 per 100,000). Both the North East and Yorkshire and the Humber had a statistically higher suicide rate for males in 2018 compared to the overall rate for males in England.
For females, the highest suicide rate in 2018 was seen in Yorkshire and the Humber and the South West (both 5.7 per 100,000) with the lowest rate seen in London (4.1 per 100,000). However, because of the relatively smaller number of deaths for females, the suicide rates for all English regions were not found to differ statistically from each other and from the overall England rate.
Among men, two regions of England had significantly higher rates of suicide when compared with the previous year. In Yorkshire and the Humber, the suicide rate among men increased from 15.3 to 19.0 deaths per 100,000 males, and in the East of England, the suicide rate increased from 13.2 to 17.6 deaths per 100,000 males. For females, the suicide rates seen in 2018 were generally consistent with those seen in 2017.
Suicide data from 1981 for English regions and data for local authorities in England and Wales can be found in the as well on the .accompanying datasets Public Health England Suicide Prevention Profile
Figure 4: The North East had the highest suicide rate for males in 2018
Age-standardised suicide rates for English regions and Wales, males, deaths registered in 2018
Notes:
The National Statistics definition of suicide is given in Section 3: Things you need to know about this .release
Figures are for males aged 10 years and over.
Age-standardised suicide rates per 100,000 population, standardised to the 2013 European Standard Population. Age-standardised rates are used to allow comparison between populations that may contain different proportions of people of different ages.
Figures are for males usually resident in each area, based on boundaries as of May 2019.
Figures are for deaths registered, rather than deaths occurring in each calendar year. Owing to the length of time it takes to complete a coroner’s inquest, it can take months or even years for a suicide to be registered. More details can be found in Section 9, Registration delays have increased in England and
.Wales since the previous year
Data download
Figure 5: Wales had the highest suicide rate for females in 2018
Age-standardised suicide rates for English regions and Wales, females, deaths registered in 2018
Notes:
Page 11 of 23
1.
2.
3.
4.
5.
The National Statistics definition of suicide is given in Section 3: Things you need to know about this .release
Figures are for females aged 10 years and over.
Age-standardised suicide rates per 100,000 population, standardised to the 2013 European Standard Population. Age-standardised rates are used to allow comparison between populations that may contain different proportions of people of different ages.
Figures are for females usually resident in each area, based on boundaries as of May 2019.
Figures are for deaths registered, rather than deaths occurring in each calendar year. Owing to the length of time it takes to complete a coroner’s inquest, it can take months or even years for a suicide to be registered. More details can be found in Section 9, Registration delays have increased in England and
.Wales since the previous year
Data download
7 . Suicide patterns by age
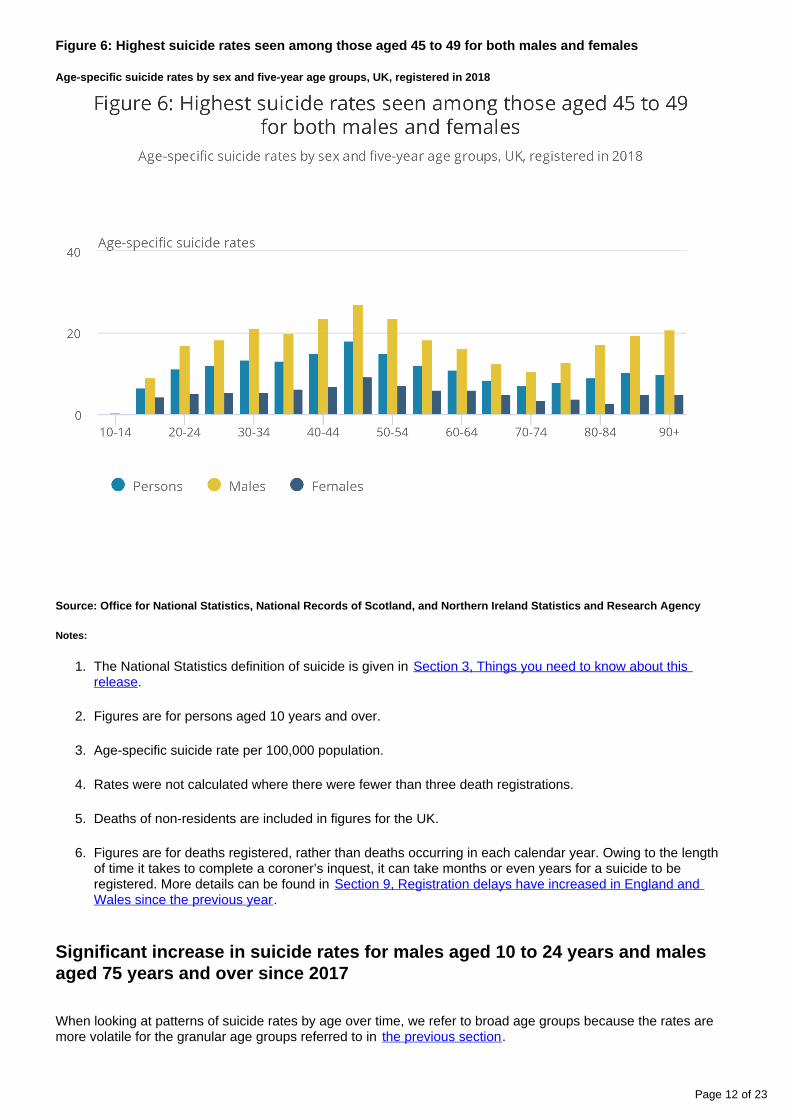
Since the early 1980s, suicide rates have increased with age, peaking among the middle-aged (45 to 49 years). Suicide rates then decrease until the age of 80 to 84, at which point they begin to rise.
In 2018, males and females aged 45 to 49 years had the highest suicide rates at 27.1 per 100,000 males (603 deaths) and 9.2 deaths per 100,000 for females (211 deaths), respectively.
Compared with the previous year, males aged 20 to 24 years saw a significant increase of 31% from 12.9 deaths per 100,000 males in 2017 (279 deaths) to 16.9 in 2018 (363 deaths). Following a significant reduction in their suicide rate between 2016 and 2017, there was also a significant increase for males aged 80 to 84 years from 9.1 deaths per 100,000 in 2017 (65 deaths) to 17.2 deaths per 100,000 in 2018 (126 deaths), with the latest suicide rate returning to previously observed levels.
For females aged 45 to 49 years, there was a significant increase from 2017 (6.6 deaths per 100,000; a total of 154 deaths) to 2018 (9.2 deaths per 100,000; a total of 211 deaths).
Suicide rates tend to increase in the oldest age groups for both males and females. Many factors contribute to this widely seen phenomenon around the world (see ) such as psychiatric illness, Suicide in Older Adultsdeterioration of physical health and functioning, and social factors.
For age-specific suicide rates for five-year age groups from 1981 for the UK, England and Wales, see the .accompanying reference tables
Page 12 of 23
1.
2.
3.
4.
5.
6.
Figure 6: Highest suicide rates seen among those aged 45 to 49 for both males and females
Age-specific suicide rates by sex and five-year age groups, UK, registered in 2018
Source: Office for National Statistics, National Records of Scotland, and Northern Ireland Statistics and Research Agency
Notes:
The National Statistics definition of suicide is given in Section 3, Things you need to know about this .release
Figures are for persons aged 10 years and over.
Age-specific suicide rate per 100,000 population.
Rates were not calculated where there were fewer than three death registrations.
Deaths of non-residents are included in figures for the UK.
Figures are for deaths registered, rather than deaths occurring in each calendar year. Owing to the length of time it takes to complete a coroner’s inquest, it can take months or even years for a suicide to be registered. More details can be found in Section 9, Registration delays have increased in England and
.Wales since the previous year
Significant increase in suicide rates for males aged 10 to 24 years and males aged 75 years and over since 2017
When looking at patterns of suicide rates by age over time, we refer to broad age groups because the rates are more volatile for the granular age groups referred to in .the previous section
Page 13 of 23
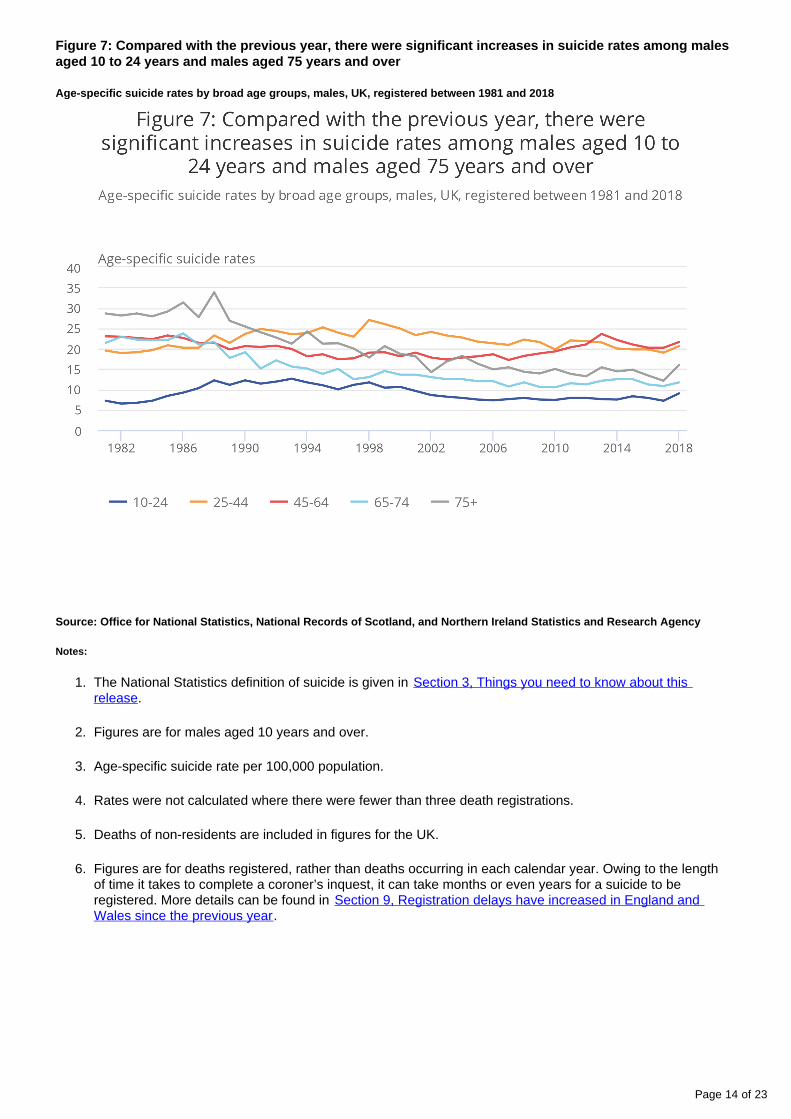
At the beginning of our time series, from 1981 to 1990, males aged 75 years and over had the highest age-specific suicide rate. Since then, suicide rates among this group fell the most to their lowest point in 2017 when there were 12.1 deaths per 100,000 males (277 deaths). 2018 saw the biggest increase in suicide rate among males aged 75 years and over, when compared to all other age groups; this is 32% higher (16.0 deaths per 100,000 males; 376 deaths) than the suicide rate in 2017.
Over time, males aged 10 to 24 years have always had the lowest suicide rates. However, following a period of recent stability in the suicide rate for this group, in 2018 their suicide rate increased to 9.0 deaths per 100,000 males (542 deaths), up 25% from 7.2 deaths per 100,000 males in 2017 (431 deaths).
From 1991 to 2012, males aged 25 to 44 years tended to have the highest suicide rates. Since 2013, males aged 45 to 64 years have had the highest age-specific suicide rates with 21.6 deaths per 100,000 population in 2018.
Generally, higher rates of suicide among middle-aged males in recent years might be because this group is more likely to be affected by economic adversity, alcoholism and isolation; furthermore, it could be that this group are less inclined to seek help. As well as being the most likely to die by suicide, it is also this middle-aged generation
. For more information, see that are most likely to die by drug poisoning Men, suicide and society: Why .disadvantaged men in mid-life die by suicide
Page 14 of 23
1.
2.
3.
4.
5.
6.
Figure 7: Compared with the previous year, there were significant increases in suicide rates among males aged 10 to 24 years and males aged 75 years and over
Age-specific suicide rates by broad age groups, males, UK, registered between 1981 and 2018
Source: Office for National Statistics, National Records of Scotland, and Northern Ireland Statistics and Research Agency
Notes:
The National Statistics definition of suicide is given in Section 3, Things you need to know about this .release
Figures are for males aged 10 years and over.
Age-specific suicide rate per 100,000 population.
Rates were not calculated where there were fewer than three death registrations.
Deaths of non-residents are included in figures for the UK.
Figures are for deaths registered, rather than deaths occurring in each calendar year. Owing to the length of time it takes to complete a coroner’s inquest, it can take months or even years for a suicide to be registered. More details can be found in Section 9, Registration delays have increased in England and
.Wales since the previous year
Page 15 of 23
The suicide rate among females aged 10 to 24 years has increased significantly to its highest recorded level since 1981
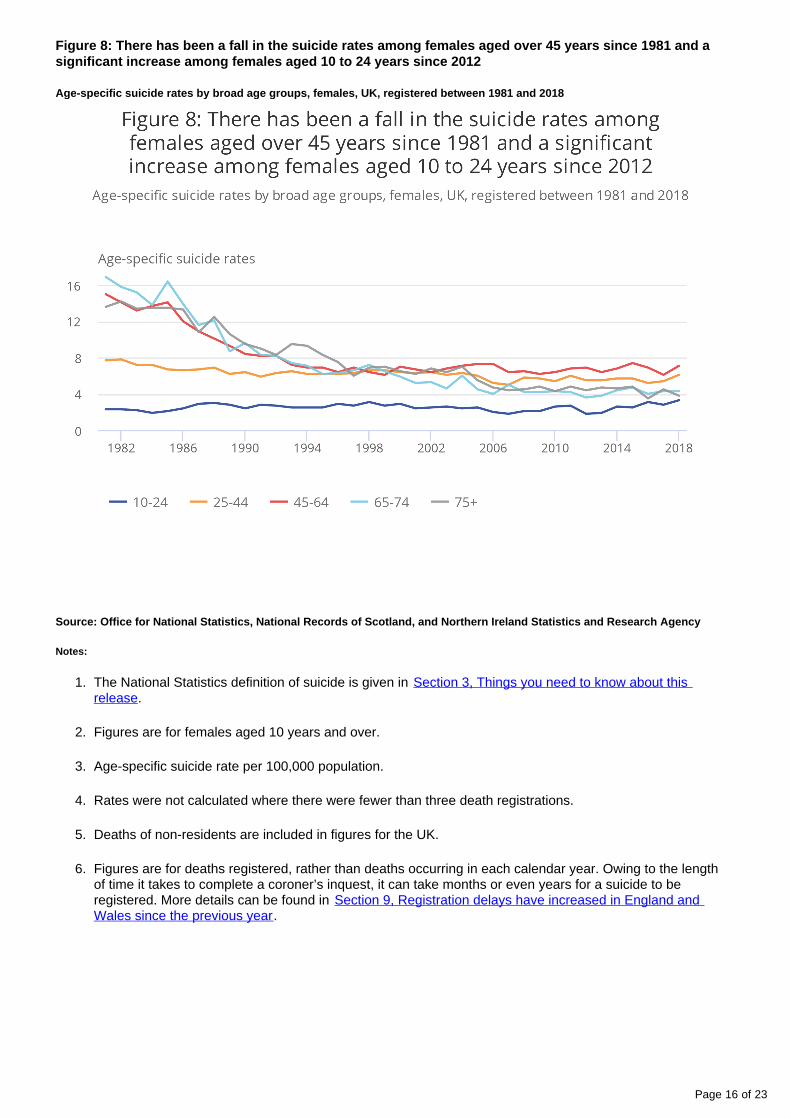
Despite having a low number of deaths overall, following a period of relative stability in the suicide rate among females aged 10 to 24 years, since 2012 the rate has increased by 83% from 1.8 deaths per 100,000 females (106 deaths) to 3.3 in 2018 (188 deaths).
The most noticeable change over time for females is the substantial fall in the suicide rates among those aged over 45 years; from 1981 to 2018, the suicide rate for females had fallen by 52.7% for those aged 45 to 64 years, by 74.6% for those aged 65 to 74 years and by 72.1% for those aged 75 years and over.
Page 16 of 23
1.
2.
3.
4.
5.
6.
Figure 8: There has been a fall in the suicide rates among females aged over 45 years since 1981 and a significant increase among females aged 10 to 24 years since 2012
Age-specific suicide rates by broad age groups, females, UK, registered between 1981 and 2018
Source: Office for National Statistics, National Records of Scotland, and Northern Ireland Statistics and Research Agency
Notes:
The National Statistics definition of suicide is given in Section 3, Things you need to know about this .release
Figures are for females aged 10 years and over.
Age-specific suicide rate per 100,000 population.
Rates were not calculated where there were fewer than three death registrations.
Deaths of non-residents are included in figures for the UK.
Figures are for deaths registered, rather than deaths occurring in each calendar year. Owing to the length of time it takes to complete a coroner’s inquest, it can take months or even years for a suicide to be registered. More details can be found in Section 9, Registration delays have increased in England and
.Wales since the previous year
Page 17 of 23
8 . Suicide methods
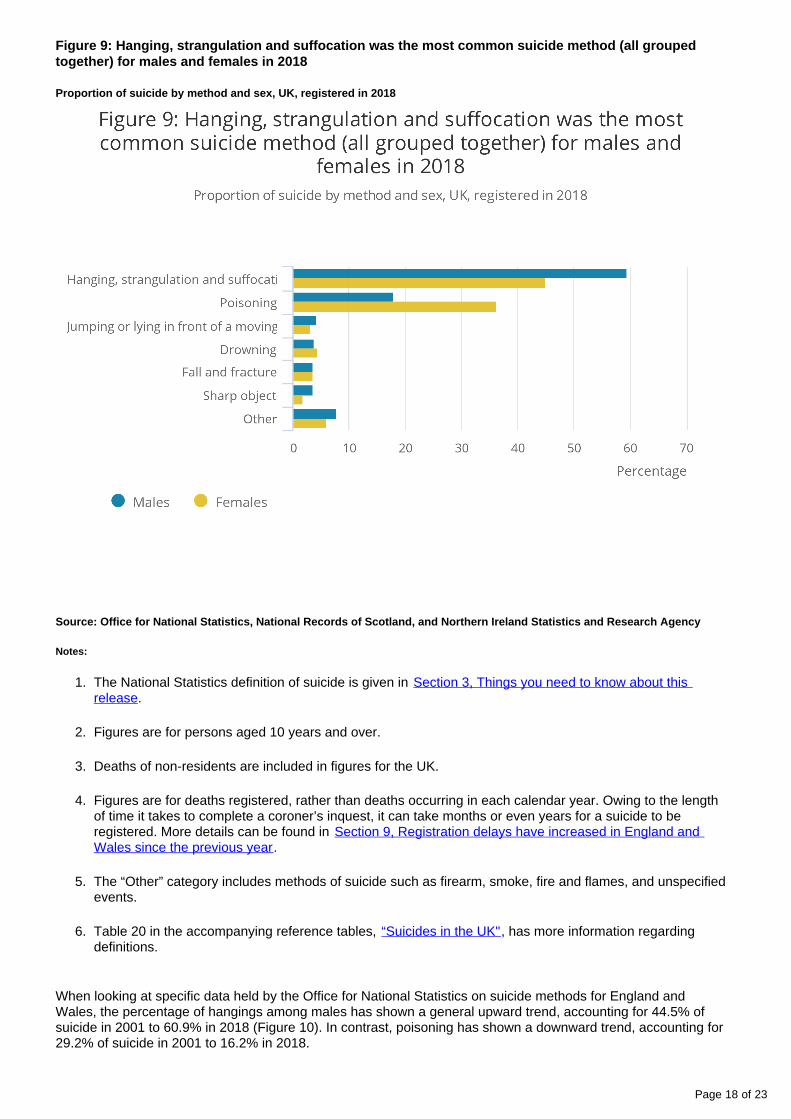
As in previous years, the most common method of suicide in the UK for both males and females was hanging, suffocation or strangulation (all grouped together). In 2018, this accounted for 59.4% of all suicides among males (2,912 deaths) and 45.0% of all suicides among females (722 deaths; see Figure 9).
The second most common method of suicide was poisoning, accounting for 17.9% of all suicides among males (877 deaths) and 36.2% of all suicides among females (580 deaths).
Page 18 of 23
1.
2.
3.
4.
5.
6.
Figure 9: Hanging, strangulation and suffocation was the most common suicide method (all grouped together) for males and females in 2018
Proportion of suicide by method and sex, UK, registered in 2018
Source: Office for National Statistics, National Records of Scotland, and Northern Ireland Statistics and Research Agency
Notes:
The National Statistics definition of suicide is given in Section 3, Things you need to know about this .release
Figures are for persons aged 10 years and over.
Deaths of non-residents are included in figures for the UK.
Figures are for deaths registered, rather than deaths occurring in each calendar year. Owing to the length of time it takes to complete a coroner’s inquest, it can take months or even years for a suicide to be registered. More details can be found in Section 9, Registration delays have increased in England and
.Wales since the previous year
The “Other” category includes methods of suicide such as firearm, smoke, fire and flames, and unspecified events.
Table 20 in the accompanying reference tables, , has more information regarding “Suicides in the UK"definitions.
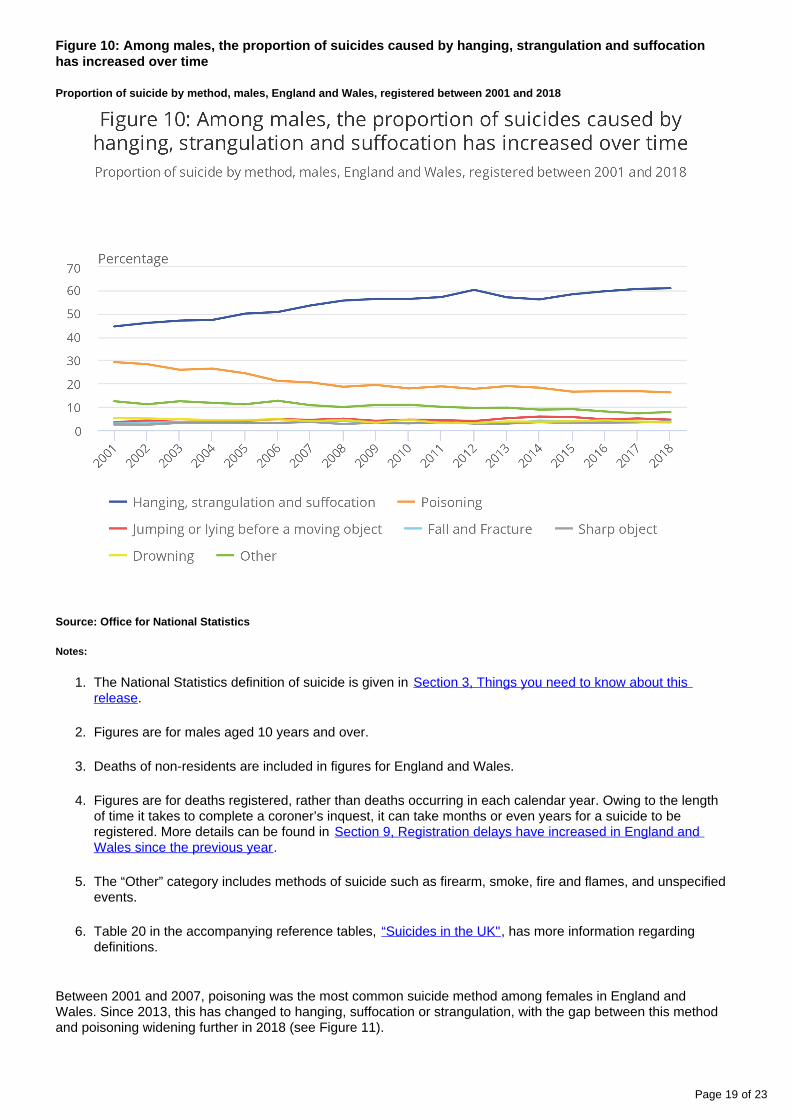
When looking at specific data held by the Office for National Statistics on suicide methods for England and Wales, the percentage of hangings among males has shown a general upward trend, accounting for 44.5% of suicide in 2001 to 60.9% in 2018 (Figure 10). In contrast, poisoning has shown a downward trend, accounting for 29.2% of suicide in 2001 to 16.2% in 2018.
Page 19 of 23
1.
2.
3.
4.
5.
6.
Figure 10: Among males, the proportion of suicides caused by hanging, strangulation and suffocation has increased over time
Proportion of suicide by method, males, England and Wales, registered between 2001 and 2018
Source: Office for National Statistics
Notes:
The National Statistics definition of suicide is given in Section 3, Things you need to know about this .release
Figures are for males aged 10 years and over.
Deaths of non-residents are included in figures for England and Wales.
Figures are for deaths registered, rather than deaths occurring in each calendar year. Owing to the length of time it takes to complete a coroner’s inquest, it can take months or even years for a suicide to be registered. More details can be found in Section 9, Registration delays have increased in England and
.Wales since the previous year
The “Other” category includes methods of suicide such as firearm, smoke, fire and flames, and unspecified events.
Table 20 in the accompanying reference tables, , has more information regarding “Suicides in the UK"definitions.
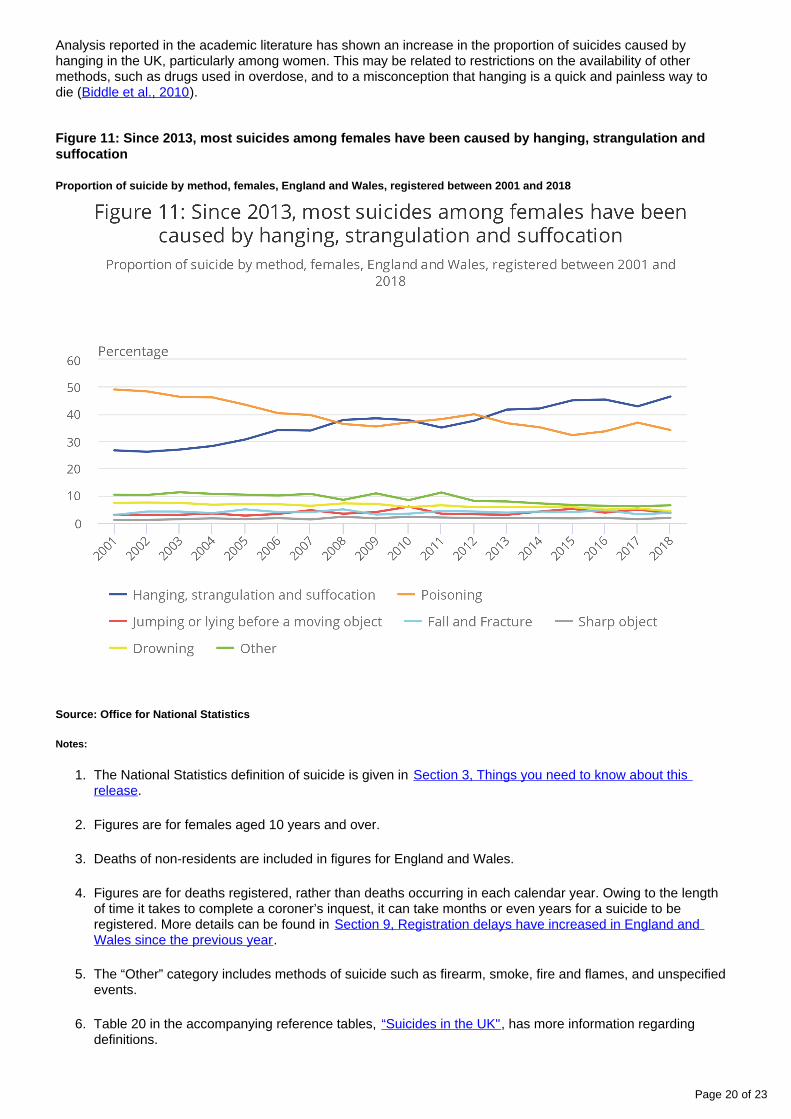
Between 2001 and 2007, poisoning was the most common suicide method among females in England and Wales. Since 2013, this has changed to hanging, suffocation or strangulation, with the gap between this method and poisoning widening further in 2018 (see Figure 11).
Page 20 of 23
1.
2.
3.
4.
5.
6.
Analysis reported in the academic literature has shown an increase in the proportion of suicides caused by hanging in the UK, particularly among women. This may be related to restrictions on the availability of other methods, such as drugs used in overdose, and to a misconception that hanging is a quick and painless way to die ( ).Biddle et al., 2010
Figure 11: Since 2013, most suicides among females have been caused by hanging, strangulation and suffocation
Proportion of suicide by method, females, England and Wales, registered between 2001 and 2018
Source: Office for National Statistics
Notes:
The National Statistics definition of suicide is given in Section 3, Things you need to know about this .release
Figures are for females aged 10 years and over.
Deaths of non-residents are included in figures for England and Wales.
Figures are for deaths registered, rather than deaths occurring in each calendar year. Owing to the length of time it takes to complete a coroner’s inquest, it can take months or even years for a suicide to be registered. More details can be found in Section 9, Registration delays have increased in England and
.Wales since the previous year
The “Other” category includes methods of suicide such as firearm, smoke, fire and flames, and unspecified events.
Table 20 in the accompanying reference tables, , has more information regarding “Suicides in the UK"definitions.
Page 21 of 23
9 . Registration delays have increased in England and Wales since the previous year
Registration delays refer to the time between the date of death and its eventual registration after inquest. When calculating the average delay between occurrence and registration, the median is used rather than the mean, as the median is not affected by rare cases where it takes many years for the death to be registered. For suicides, the median registration delay in 2018 for England was 159 days (up from 152 days in 2017) and 147 days for Wales (up from 132 days in 2017). In Scotland, the median delay was 7 days, similar to previous years. Figures for Northern Ireland will be published later this year on the Northern Ireland Statistics and Research Agency
.website
Data on registration delays per country and local authority can be found in the along with associated datasetsoccurrence data.
In England, Wales and Northern Ireland, all deaths caused by suicide are certified by a coroner following an inquest and cannot be registered until the inquest is completed. This can take months or even years and we are not notified of the death until it is registered.
Unlike the other countries of the UK, there is no system of coroners’ inquests in Scotland; instead, unexpected deaths are investigated by an official known as a procurator fiscal. In Scotland, the different system means that deaths caused by suicide are registered far earlier than those in any other country of the UK.
In line with other mortality statistics, analysis presented here is based on deaths registered in a particular year, rather than those occurring each year. This allows for more timely publications, but it can make trends difficult to interpret, especially for smaller geographical areas.
94% of all-cause deaths registered in 2018 in England and Wales also occurred in 2018 . This was lower for suicides, with only 53% of suicides registered in 2018 having actually occurred in 2018.
Further information on registration delays and their effects can be found in our Quality and Methodology report.Information
10 . Links to related statistics
Office for National Statistics releases:
Drug-related deaths and suicide in prison custody in England and Wales: 2008 to 2016
An article created in collaboration with HM Prison and Probation Service, discussing the risk of suicide and drug-related deaths among prisoners.
Middle-aged generation most likely to die by suicide and drug poisoning
An article discussing how age links to suicide and drug-related deaths.
Who is most at risk of suicide?
Page 22 of 23
An article created in collaboration with Samaritans, discussing factors such as marital status and levels of deprivation in relation to suicide.
Estimating suicide among higher education students, England and Wales: Experimental Statistics
An article created using mortality data linked to Higher Education Statistics Agency data to estimate suicides among higher education students by sex, age and ethnicity.
Suicide by occupation, England: 2011 to 2015
This report describes recent analyses of deaths from suicide in different occupational groups among those aged 20 to 64 years.
Nomis
Enables you to query a single data source in greater depth and download data. Nomis provides mortality statistics for England and Wales, broken down by calendar year of registration (currently 2013 to 2018), age, sex, underlying cause of death and area of usual residence of the deceased.
Instructions for use: ‘Query data’, ‘Life events’, ‘Mortality statistics - underlying cause, sex and age’, Make desired selections and download.
UK information:
National Records of Scotland provide the official suicide statistics for Scotland.
Northern Ireland Statistics and Research Agency provides the official suicide statistics for Northern Ireland.
Samaritans Suicide Statistics Report 2018 (PDF, 6,419KB)
This report pulls together the data about deaths by suicide for the UK and Republic of Ireland.
Coroners statistics
These include statistics on the verdicts returned at inquests and are available from the GOV.UK website.
International information:
Eurostat comparison of European suicide statistics by age group
World Health Organization compares international suicide statistics
UN Sustainable Development Goals
Page 23 of 23
Special extracts
The Office for National Statistics holds mortality data for England and Wales. Figures for the UK include data kindly provided by National Records of Scotland and Northern Ireland Statistics and Research Agency. Special extracts and tabulations of suicide data (and other causes of mortality) for England and Wales are available to order (subject to legal frameworks, , resources and , where appropriate). disclosure control agreement of costs
will be published on our website. Such requests or enquiries should be made to:User-requested data
Telephone: +44 (0)1633 651901Email: [email protected]
Post: Lifestyles and Risk Factors Analysis, Health Analysis and Life Events, Public Policy Analysis, Office for National Statistics, Government Buildings, Cardiff Road, Newport NP10 8XG.
11 . Quality and methodology
The report contains important information on:Suicide rates in the UK Quality and Methodology Information
the strengths and limitations of the data and how it compares with related data
uses and users of the data
how the output was created
the quality of the output including the accuracy of the data
The s provides further information on the collection, production and quality of the User guide to mortality statisticunderlying mortality data on which suicide death statistics are based.


![CHAPTER – 2 SUICIDES IN INDIA...Accidental Deaths & Suicides in India 2015 [192] CHAPTER – 2 SUICIDES IN INDIA Each suicide is a personal tragedy that prematurely takes the life](https://img.pdfslide.us/doc/110x75/5e2e9e4e30000f3c8f21f049/chapter-a-2-suicides-in-accidental-deaths-suicides-in-india-2015-192.jpg)