Embed Size (px)
Citation preview
EEVVAALLUUAATTIIOONN OOFF LLIIDDAARR FFOORR LLAANNDDSSLLIIDDEE MMAAPPPPIINNGG
FINAL REPORT F/CA/TL-2006/07 JUNE 30, 2006 F-01-TL-18 EA 65-680446
EEVVAALLUUAATTIIOONN OOFF LLIIDDAARR FFOORR LLAANNDDSSLLIIDDEE MMAAPPPPIINNGG
FINAL REPORT JUNE 30, 2006
F/CA/TL-2006/07 F-01-TL-18
EA 65-680446
PREPARED BY:
CHRIS J. WILLS CALIFORNIA GEOLOGICAL SURVEY
SUBMITTED TO:
LOREN TURNER
CALIFORNIA DEPARTMENT OF TRANSPORTATION DIVISION OF RESEARCH & INNOVATION
OFFICE OF MATERIALS & INFRASTRUCTURE THE GEORESEARCH GROUP 5900 FOLSOM BLVD. MS-5 SACRAMENTO CA 95819
(916) 227-7174 [email protected]
STATE OF CALIFORNIA DEPARTMENT OF TRANSPORTATION TECHNICAL REPORT DOCUMENTATION PAGE TR0003 (REV. 10/98) 1. REPORT NUMBER
F/CA/TL-2006/07
2. GOVERNMENT ASSOCIATION NUMBER
3. RECIPIENT’S CATALOG NUMBER 5. REPORT DATE
June 30, 2006
4. TITLE AND SUBTITLE
Evaluation of LIDAR for Landslide Mapping 6. PERFORMING ORGANIZATION CODE
7. AUTHOR(S)
Chris J. Wills
8. PERFORMING ORGANIZATION REPORT NO. 65-339/65-680446, Rec. ID 0240 10. WORK UNIT NUMBER
9. PERFORMING ORGANIZATION NAME AND ADDRESS
California Department of Transportation Division of Research & Innovation 5900 Folsom Blvd. MS-5 Sacramento, CA 95819
11. CONTRACT OR GRANT NUMBER
F-01-TL-18
13. TYPE OF REPORT AND PERIOD COVERED
Final Report
12. SPONSORING AGENCY AND ADDRESS
California Department of Transportation Sacramento, CA 95819
14. SPONSORING AGENCY CODE
15. SUPPLEMENTAL NOTES
16. ABSTRACT
The Caltrans’ GeoResearch Group, in collaboration with the Department of Conservation, successfully used LIDAR technology to map landslides along two heavily forested highway corridors in Humboldt and Del Norte Counties. LIDAR (Light Detection And Ranging) is a technique that uses reflections from lasers to determine distance, similar to a survey total station, but is typically performed aerially using a denser array of laser sources from a small aircraft. LIDAR has an advantage over conventional mapping methods in that it can effectively map true ground surface, and not just treetops in heavily forested areas. The LIDAR survey will be used in conjunction with traditional interpretation of aerial photographs and field methods to prepare landslide maps of two demonstration corridors. The deliverables of this study includes specifications for contracting LIDAR survey projects and this report that summarizes the results of the LIDAR surveys and their applicability to landslide mapping.
17. KEY WORDS
LIDAR, Light Detection And Ranging, Aerial Surveys, topographic mapping, landslide hazards
18. DISTRIBUTION STATEMENT No restrictions. This document is available to the public through the National Technical Information Service, Springfield, VA 22161
19. SECURITY CLASSIFICATION (of this report)
Unclassified
20. NUMBER OF PAGES
70
21. PRICE
Reproduction of completed page authorized
DISCLAIMER STATEMENT
THE CONTENTS OF THIS REPORT REFLECT THE VIEWS OF THE AUTHORS WHO ARE
RESPONSIBLE FOR THE FACTS AND THE ACCURACY OF THE DATA PRESENTED HEREIN.
THE CONTENTS DO NOT NECESSARILY REFLECT THE OFFICIAL VIEWS OR POLICIES OF
THE STATE OF CALIFORNIA OR THE FEDERAL HIGHWAY ADMINISTRATION.
THIS REPORT DOES NOT CONSTITUTE A STANDARD, SPECIFICATION, OR REGULATION.
THIS REPORT DOES NOT CONSTITUTE AN ENDORSEMENT BY THE DEPARTMENT OF ANY
PRODUCT DESCRIBED HEREIN.
ACQUISITION OF A LIDAR SURVEY OF THE HIGHWAY 299
CORRIDOR, HUMBOLDT COUNTY, CALIFORNIA AND PRELIMINARY ANALYSIS OF ITS UTILITY FOR LANDSLIDE
MAPPING
Prepared for California Department of Transportation New Technology and Research Program
Office of Infrastructure Research Project 65AO106
by
C.J. Wills
California Geological Survey
2002
SUMMARY REPORT
CALIFORNIA GEOLOGICAL SURVEY CALIFORNIA DEPARTMENT OF CONSERVATION
801 K STREET, MS 12-32 SACRAMENTO, CA 95814
- 1 -
INTRODUCTION ..................................................................................................3
PREPARATION OF LIDAR CONTRACT AND SPECIFICATIONS .....................4
ACQUISITION OF LIDAR DATA..........................................................................7
COMPARISON OF DEM’S.................................................................................10
INTERPRETATION OF LANDSLIDES FROM LIDAR DEM'S ...........................13
CONCLUSIONS .................................................................................................14
REFERENCES ...................................................................................................15
APPENDIX A......................................................................................................16
APPENDIX B......................................................................................................36
APPENDIX C......................................................................................................37
- 2 -
Introduction
The Caltrans - California Geological Survey project to evaluate LiDAR for mapping
landslides in densely forested terrain grew out of the Caltrans "corridors" project under
which CGS is preparing geologic and landslide maps of selected highway corridors
around the state. Several of these corridors are in the densely wooded northern coast
ranges. Mapping landslides in heavily forested terrain can require an extraordinary effort
to recognize landslides by field mapping, or in most cases where the time and money for
mapping is limited, the acceptance of maps that are less complete and less accurate
that those in un-forested land. This is because landslides are mapped based on their
geomorphology. The distinctive landforms created by landsliding must be recognized on
aerial photographs, topographic maps, or in the field. In heavily forested terrain, neither
aerial photos nor photogrammetrically-prepared topographic maps depict the ground
surface. Photos, of course, show the tops of the trees, but topographic maps also are
prepared from photos showing the tops of the trees, with some assumption of tree height
factored in so ground elevations can be approximated. Because the typical
reconnaissance techniques are less effective, either extra effort is spent on the ground
or a less accurate map is produced. Work on the first corridor, along Highway 101 in Del
Norte County, also made it apparent to us that the 1:24,000, 7.5 minute topographic
maps and more detailed photogrammetric maps obtained from Caltrans had substantial
errors and did not show many of the landforms related to landsliding. A subsequent
corridor, along Highway 299 in Humboldt County, has forest cover that is at least as
dense and has a comparable level of landslide hazard (Figure 1). We anticipated that
this corridor would be difficult and time-consuming to map accurately at the scale
requested by Caltrans.
On the recommendation of Tom Spittler, a CGS senior engineering geologist with
extensive experience mapping landslides in the northern Coast Ranges, we began to
inquire about the potential for LiDAR to acquire a more detailed and accurate image of
the ground beneath the forest. LiDAR stands for light detection and ranging and uses a
system that is essentially a laser rangefinder, which pulses rapidly and scans an area
from an aircraft. Airborne GPS and inertial navigation on the aircraft allow for the
precise location of each reflection off of the ground or other obstructions (Figure 2). A
computer system “filters” the distance measurements, retaining those that reach the
- 3 -
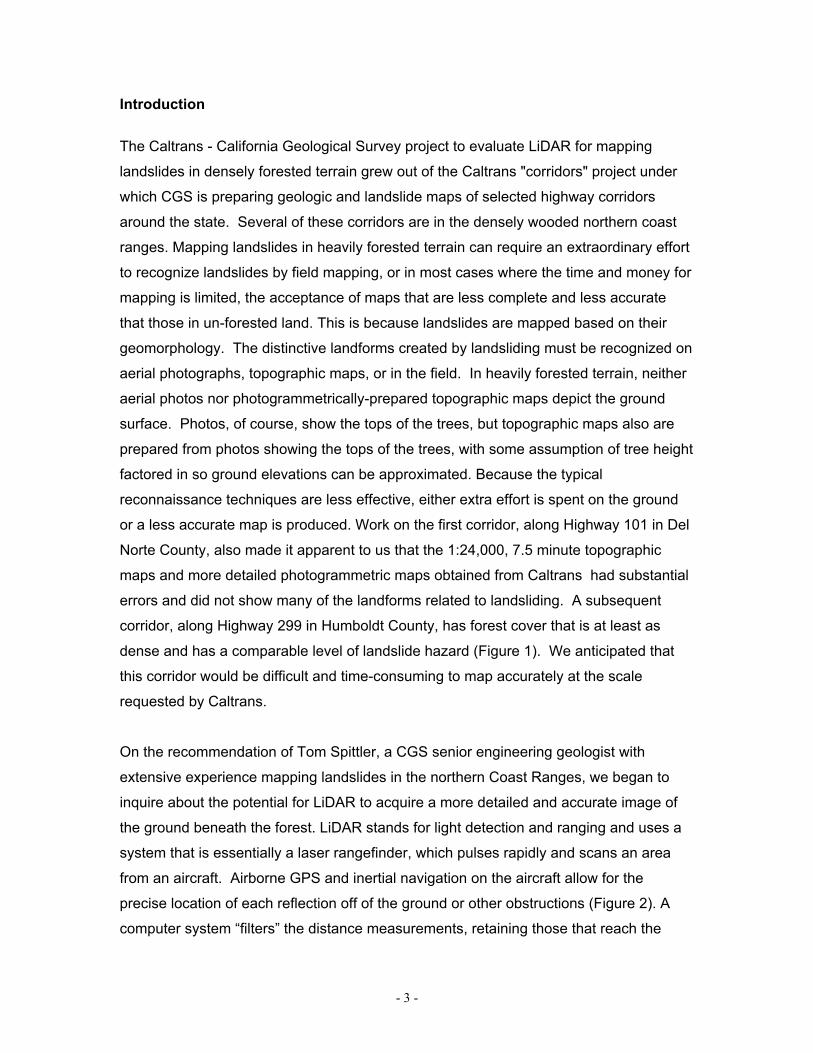
ground and rejecting reflections from
trees. The result can be detailed
digital elevation model (DEM) of the
tree tops, or of the ground surface.
The DEM can be processed in a
Geographic Information System
(GIS) to make a traditional
topographic contour map or a
shaded relief map to aid
interpretation. The DEM’s can be
much more detailed and more
accurate than either the available UGSS topographic DEM’s or photogrametric
topographic maps.
Figure 1. Navigation and LiDAR processing equipment aboard one of the aircraft used in this study.
To begin to evaluate LiDAR we contacted Dr. Bill Dietrich at U.C. Berkeley and several
LiDAR vendors. Dr. Dietrich has had several LiDAR surveys conducted for his research
on debris flow hazards. His experience suggested that LiDAR was a very promising
technology for producing a "bare-earth" digital elevation model (dem). His research has
focused on analysis of the dem to determine the points where debris flows could
originate, but he also pointed out that interpretation of larger, deep landslides was much
easier from a detailed LiDAR "bare earth" dem than a much less detailed USGS dem
derived from the 7.5 minute quad topographic map (Dietrich et al, 1999 and personal
communication).
Despite the promise of the technology, Dietrich stressed to us the difficulties he has had
with some LiDAR vendors and the importance of carefully-written specifications and
detailed quality assurance once the survey is completed. We kept this in mind as we
contacted LiDAR vendors and prepared the proposal to Caltrans to fund the LiDAR
survey.
Preparation of LiDAR contract and specifications Based on Dietrich's advice, research of the published literature about LiDAR, and
preliminary contacts with LiDAR vendors we proposed a contract with Caltrans. Under
- 4 -
this proposal Caltrans would pay CGS to develop detailed specifications for a LiDAR
survey, contract with LiDAR vendors for the survey and evaluate the results. We
presented this proposal to the Caltrans Research Program Advisors Council on
10/11/2000. The council asked several questions about the capabilities of LiDAR and
suggested that we have duplicate or overlapping surveys conducted to evaluate the
capabilities of different LiDAR contractors. The council supported our request for
$80,000 to acquire the LiDAR survey and evaluate the value of LiDAR for landslide
mapping, with the stipulation that we compare at least two different LiDAR surveys of
part of the area.
When the contract between Caltrans and CGS was in place, on 7/1/01, we began work
on the specifications for the LiDAR survey. We contacted several LiDAR vendors as
well as colleagues at USGS and other agencies that have experience with LiDAR. From
the LiDAR vendors, we learned that in order to obtain the amount of detail we wanted for
landslide mapping - the level of detail typically found on a topographic map with a 10-
foot contour interval - we should specify a dem with a 10-foot pixel size. All LiDAR
vendors indicated that the precision of the LiDAR point locations would be well under 1
meter, which is better than needed for a map of the scale we specify. From colleagues
at USGS we learned that one problem that they have encountered is that if flight lines
are too far apart there are more likely to be areas where no laser shots hit the ground,
because they are going through the trees at too shallow an angle. Ralph Haugured of
USGS also made available a draft contract they had prepared for the Puget Sound area.
Jim Appleton of Caltrans recommended that the ground survey control, which is needed
to check the accuracy of the LiDAR points, be conducted by a California Registered
Land Surveyor.
Using the draft contract from the Puget Sound LiDAR consortium as a template, we
modified the specifications to cover the corridor along Highway 299 in Humboldt County.
We specified the area to be covered, spacing of points in the resulting dem, coordinate
system and survey control. Our draft contract (Appendix A) was completed in
December, 2001 and mailed out with a Request for Proposals to potential LiDAR
vendors.
- 5 -
We had good response from LiDAR vendors to our RFP indicating a good deal of
interest in working on this study. Unfortunately, a question from one potential vendor led
us to discover that California State Law prohibits contracting for services of registered
professionals through an RFP. Since we specified Registered Land Surveyors in our
draft contract, we could not use the RFP. We immediately rescinded the RFP on
January 14 2002 and issued a request for qualifications (RFQ) on January 18 2002.
The RFQ process is a more appropriate and flexible process for this type of contract, but
we lost valuable time in releasing the RFP, rescinding it, and releasing the RFQ. As a
result the deadline for replying to the RFQ was very short.
Only two LiDAR vendors, 3Di Technologies Inc of Denver, Colorado and Sanborn
Colorado L.L.C. of Colorado Springs, Colorado replied to our RFQ. Based on their
responses and references we found both to be qualified to conduct the LiDAR survey.
We began working on contracts with both vendors, including reviewing the specifications
and negotiating the price.
Our draft contract, included with the RFQ, asked for separate bids on the western part of
the Highway 299 corridor (area a), the eastern part of the Highway 299 corridor (area b),
and part of the Highway 101 corridor in Del Norte County (area c). In consultation with
the vendors, we modified that slightly so that any mobilization costs were included with
area "a", and each vendor would only do areas "b" or "c" if they were also doing area "a".
With this arrangement we were able to ensure that we acquired two surveys of area "a",
and one of area "b". As it developed we did not have sufficient funds for area "c".
In reviewing the specifications, Sanborn Colorado indicated that they could do the
survey as we had specified. 3Di Technologies, however, requested some revisions. Our
specifications called for x, y and z coordinates for each of the laser reflections, plus a
time-stamp for each. They also specified ground survey control. 3Di informed us that
their standard processing did not include a time-stamp on each point, so including that
would increase the cost of the survey considerably. 3Di also indicated that their normal
procedure did not include ground surveys to check the aerial survey results.
- 6 -
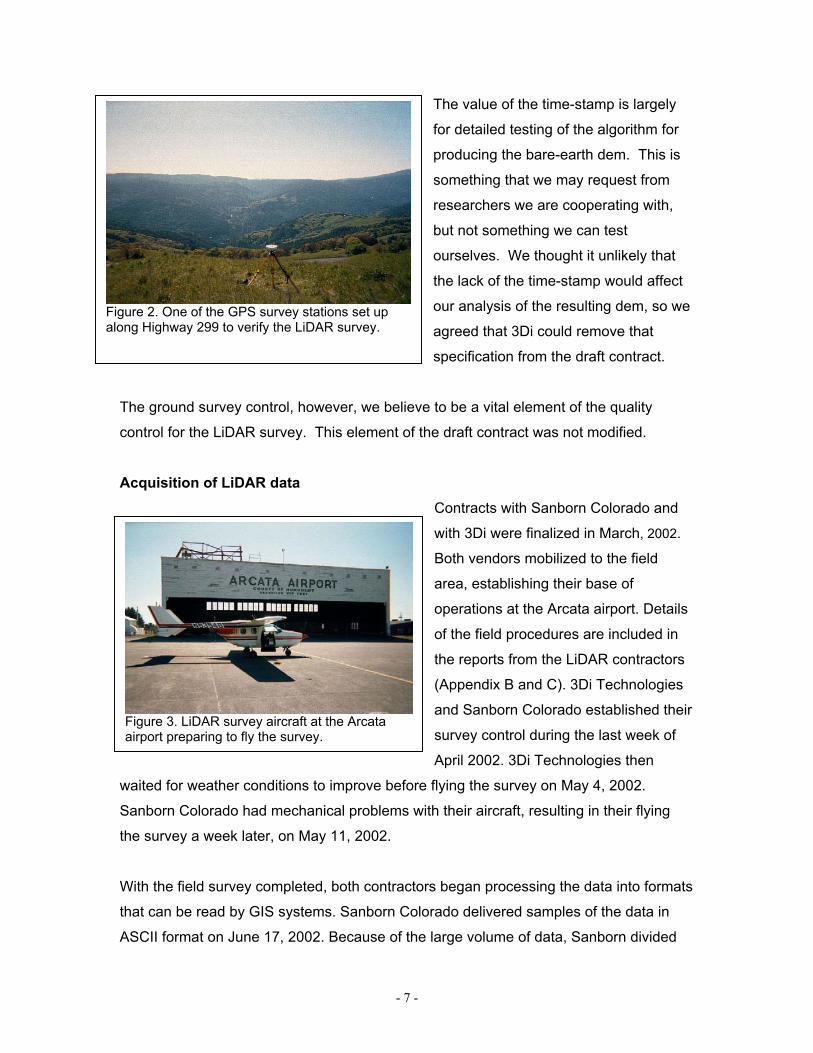
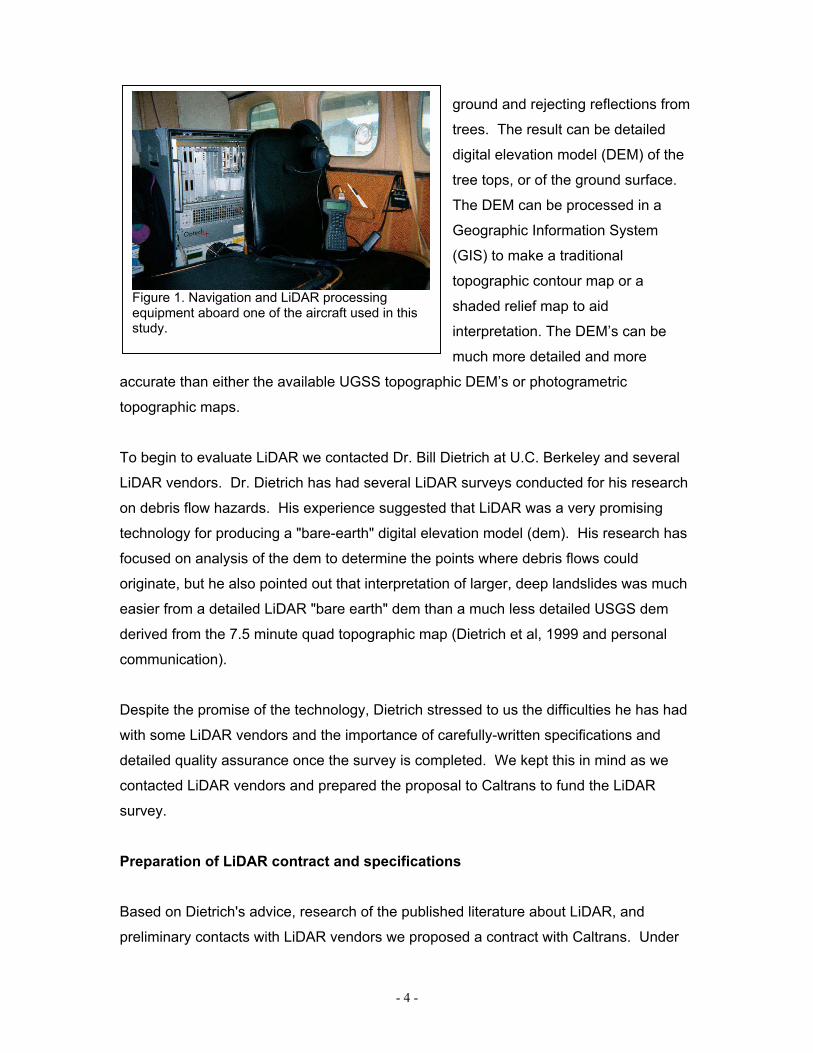
Figure 2. One of the GPS survey stations set up along Highway 299 to verify the LiDAR survey.
The value of the time-stamp is largely
for detailed testing of the algorithm for
producing the bare-earth dem. This is
something that we may request from
researchers we are cooperating with,
but not something we can test
ourselves. We thought it unlikely that
the lack of the time-stamp would affect
our analysis of the resulting dem, so we
agreed that 3Di could remove that
specification from the draft contract.
The ground survey control, however, we believe to be a vital element of the quality
control for the LiDAR survey. This element of the draft contract was not modified.
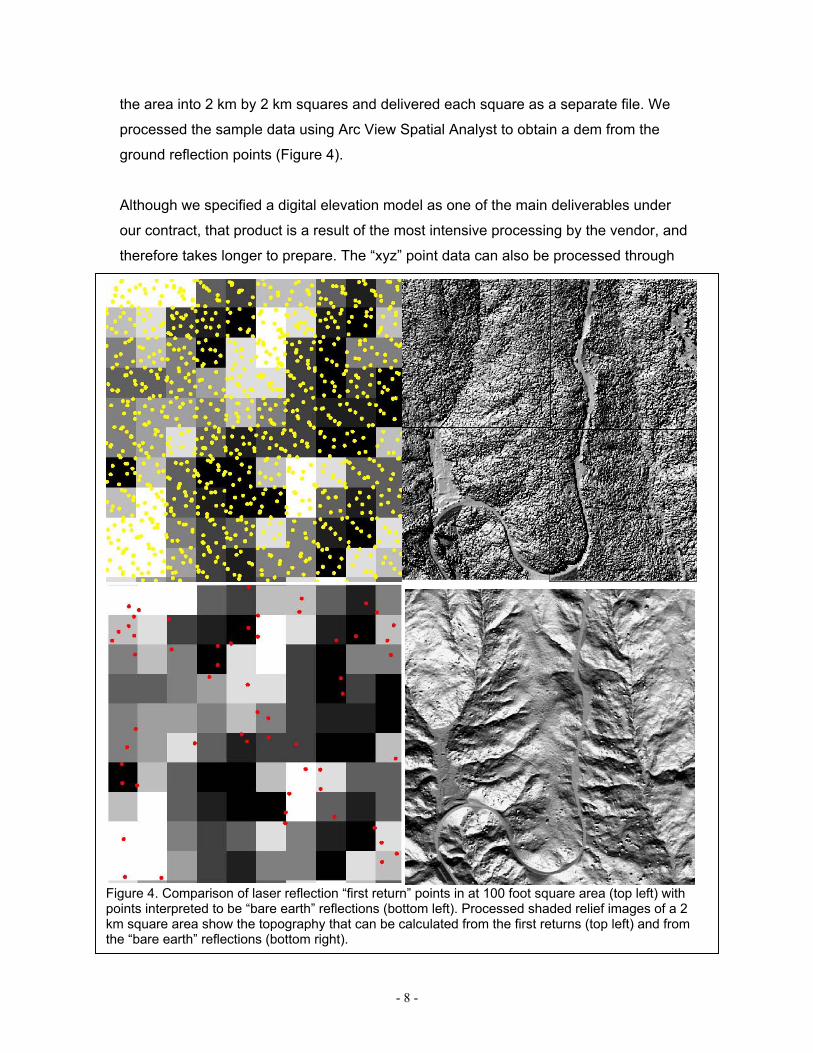
Acquisition of LiDAR data Contracts with Sanborn Colorado and
with 3Di were finalized in March, 2002.
Both vendors mobilized to the field
area, establishing their base of
operations at the Arcata airport. Details
of the field procedures are included in
the reports from the LiDAR contractors
(Appendix B and C). 3Di Technologies
and Sanborn Colorado established their
survey control during the last week of
April 2002. 3Di Technologies then
waited for weather conditions to improve before flying the survey on May 4, 2002.
Sanborn Colorado had mechanical problems with their aircraft, resulting in their flying
the survey a week later, on May 11, 2002.
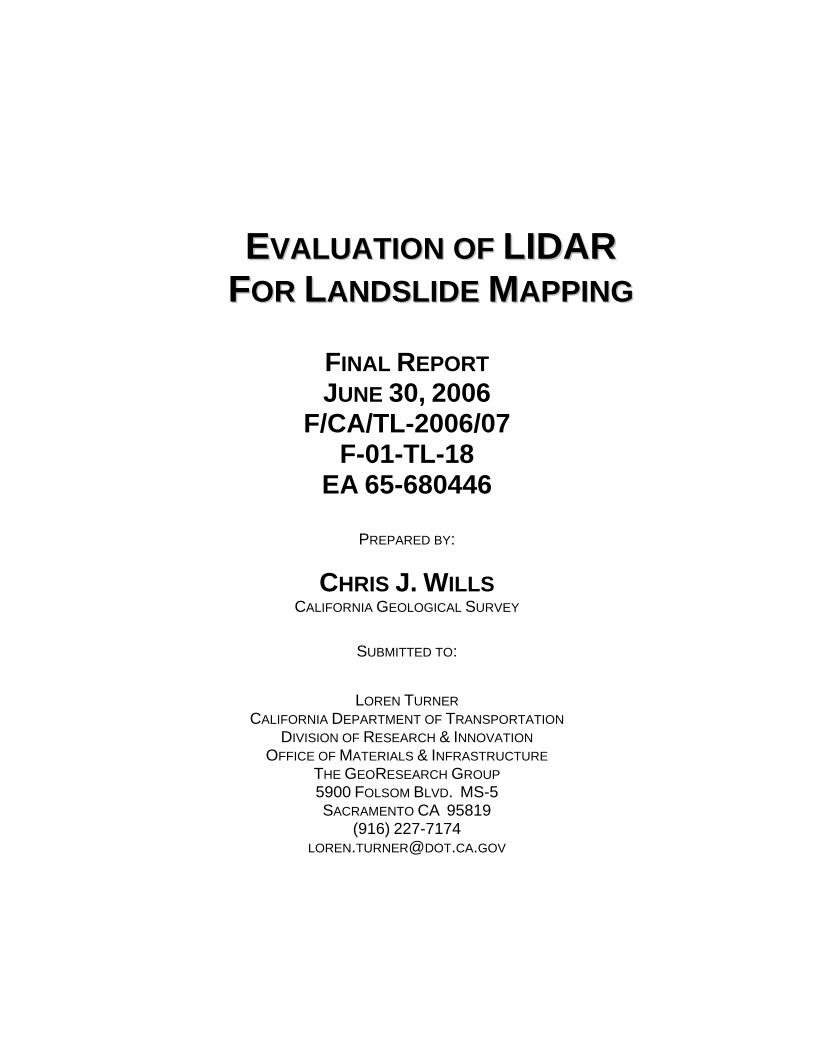
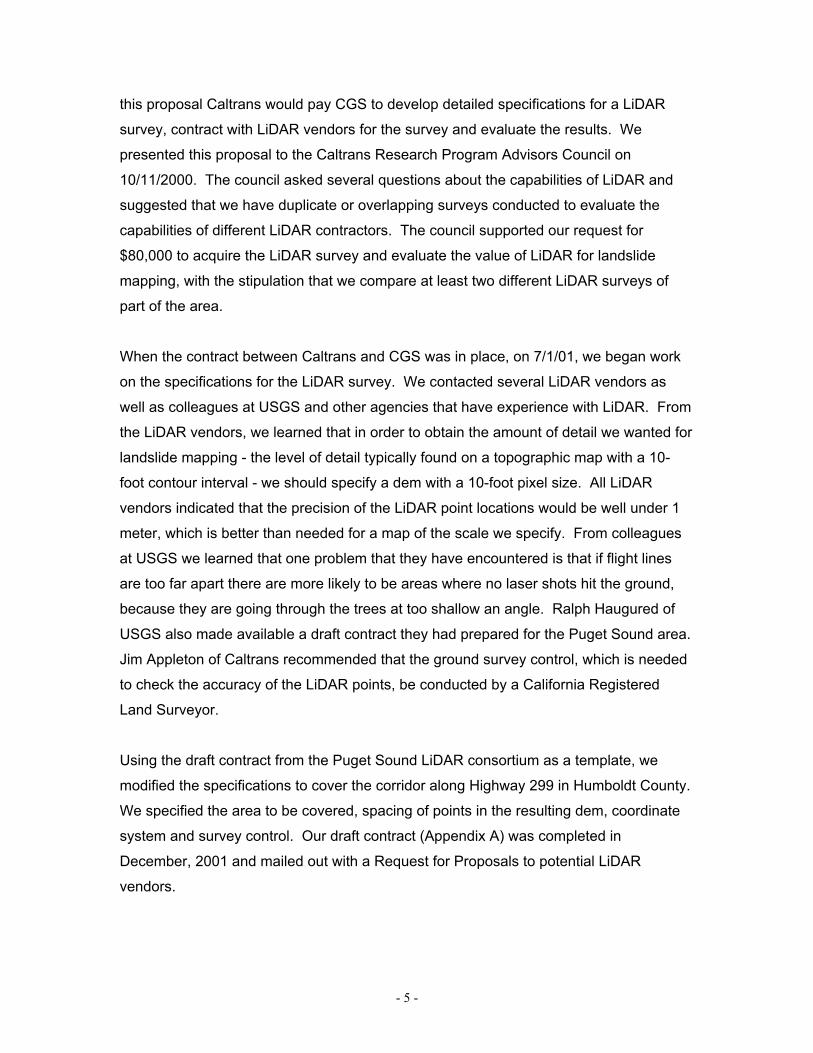
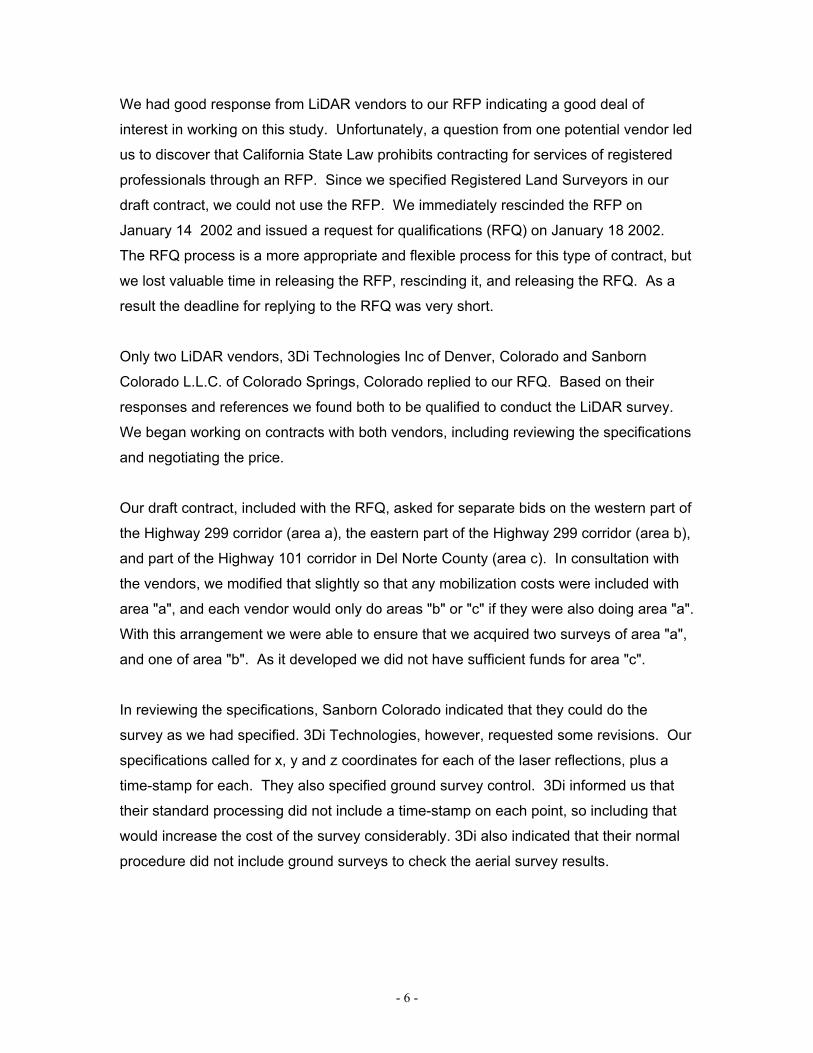
Figure 3. LiDAR survey aircraft at the Arcata airport preparing to fly the survey.
With the field survey completed, both contractors began processing the data into formats
that can be read by GIS systems. Sanborn Colorado delivered samples of the data in
ASCII format on June 17, 2002. Because of the large volume of data, Sanborn divided
- 7 -
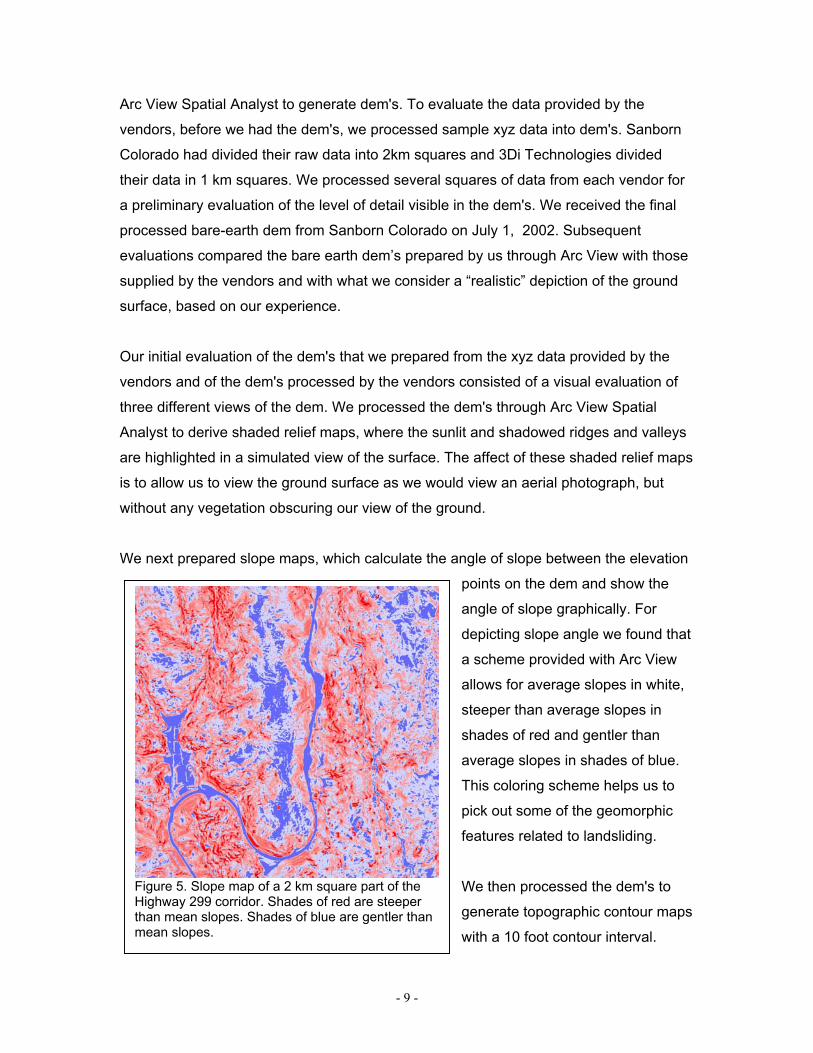
the area into 2 km by 2 km squares and delivered each square as a separate file. We
processed the sample data using Arc View Spatial Analyst to obtain a dem from the
ground reflection points (Figure 4).
Although we specified a digital elevation model as one of the main deliverables under
our contract, that product is a result of the most intensive processing by the vendor, and
therefore takes longer to prepare. The “xyz” point data can also be processed through
Figure 4. Comparison of laser reflection “first return” points in at 100 foot square area (top left) with points interpreted to be “bare earth” reflections (bottom left). Processed shaded relief images of a 2 km square area show the topography that can be calculated from the first returns (top left) and from the “bare earth” reflections (bottom right).
- 8 -
Arc View Spatial Analyst to generate dem's. To evaluate the data provided by the
vendors, before we had the dem's, we processed sample xyz data into dem's. Sanborn
Colorado had divided their raw data into 2km squares and 3Di Technologies divided
their data in 1 km squares. We processed several squares of data from each vendor for
a preliminary evaluation of the level of detail visible in the dem's. We received the final
processed bare-earth dem from Sanborn Colorado on July 1, 2002. Subsequent
evaluations compared the bare earth dem’s prepared by us through Arc View with those
supplied by the vendors and with what we consider a “realistic” depiction of the ground
surface, based on our experience.
Our initial evaluation of the dem's that we prepared from the xyz data provided by the
vendors and of the dem's processed by the vendors consisted of a visual evaluation of
three different views of the dem. We processed the dem's through Arc View Spatial
Analyst to derive shaded relief maps, where the sunlit and shadowed ridges and valleys
are highlighted in a simulated view of the surface. The affect of these shaded relief maps
is to allow us to view the ground surface as we would view an aerial photograph, but
without any vegetation obscuring our view of the ground.
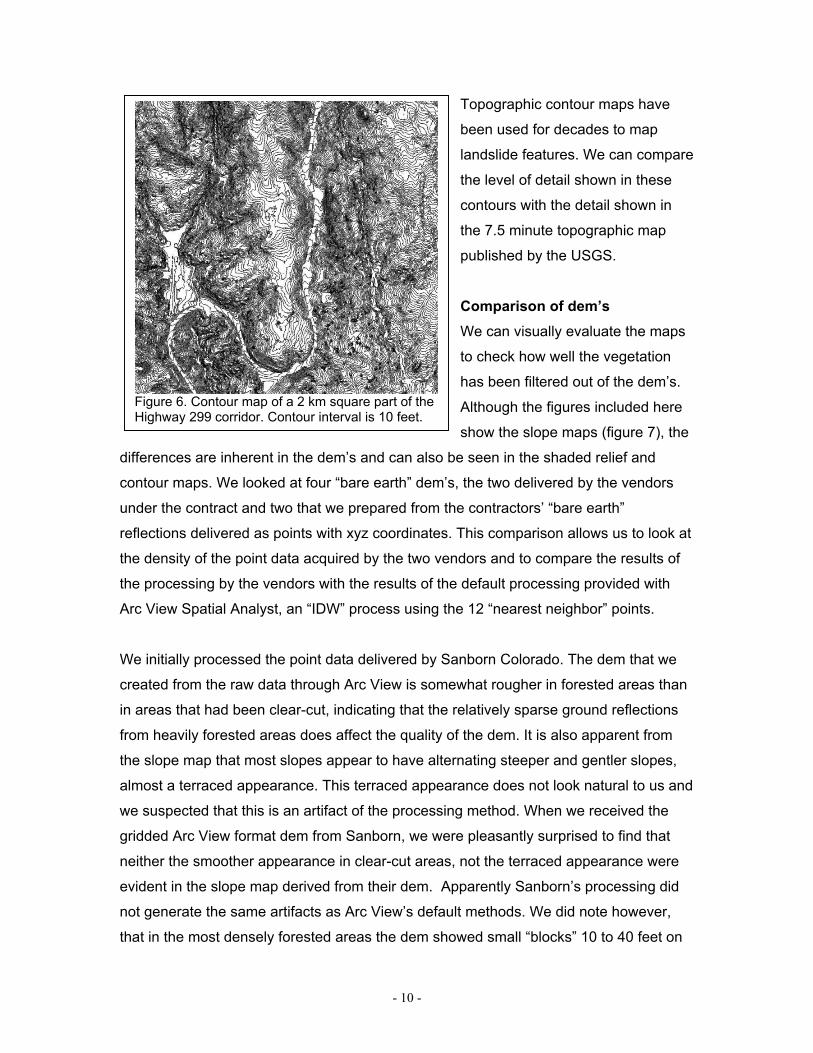
We next prepared slope maps, which calculate the angle of slope between the elevation
points on the dem and show the
angle of slope graphically. For
depicting slope angle we found that
a scheme provided with Arc View
allows for average slopes in white,
steeper than average slopes in
shades of red and gentler than
average slopes in shades of blue.
This coloring scheme helps us to
pick out some of the geomorphic
features related to landsliding.
Figure 5. Slope map of a 2 km square part of the Highway 299 corridor. Shades of red are steeper than mean slopes. Shades of blue are gentler than mean slopes.
We then processed the dem's to
generate topographic contour maps
with a 10 foot contour interval.
- 9 -
Topographic contour maps have
been used for decades to map
landslide features. We can compare
the level of detail shown in these
contours with the detail shown in
the 7.5 minute topographic map
published by the USGS.
Comparison of dem’s We can visually evaluate the maps
to check how well the vegetation
has been filtered out of the dem’s.
Although the figures included here
show the slope maps (figure 7), the
differences are inherent in the dem’s and can also be seen in the shaded relief and
contour maps. We looked at four “bare earth” dem’s, the two delivered by the vendors
under the contract and two that we prepared from the contractors’ “bare earth”
reflections delivered as points with xyz coordinates. This comparison allows us to look at
the density of the point data acquired by the two vendors and to compare the results of
the processing by the vendors with the results of the default processing provided with
Arc View Spatial Analyst, an “IDW” process using the 12 “nearest neighbor” points.
Figure 6. Contour map of a 2 km square part of the Highway 299 corridor. Contour interval is 10 feet.
We initially processed the point data delivered by Sanborn Colorado. The dem that we
created from the raw data through Arc View is somewhat rougher in forested areas than
in areas that had been clear-cut, indicating that the relatively sparse ground reflections
from heavily forested areas does affect the quality of the dem. It is also apparent from
the slope map that most slopes appear to have alternating steeper and gentler slopes,
almost a terraced appearance. This terraced appearance does not look natural to us and
we suspected that this is an artifact of the processing method. When we received the
gridded Arc View format dem from Sanborn, we were pleasantly surprised to find that
neither the smoother appearance in clear-cut areas, not the terraced appearance were
evident in the slope map derived from their dem. Apparently Sanborn’s processing did
not generate the same artifacts as Arc View’s default methods. We did note however,
that in the most densely forested areas the dem showed small “blocks” 10 to 40 feet on
- 10 -
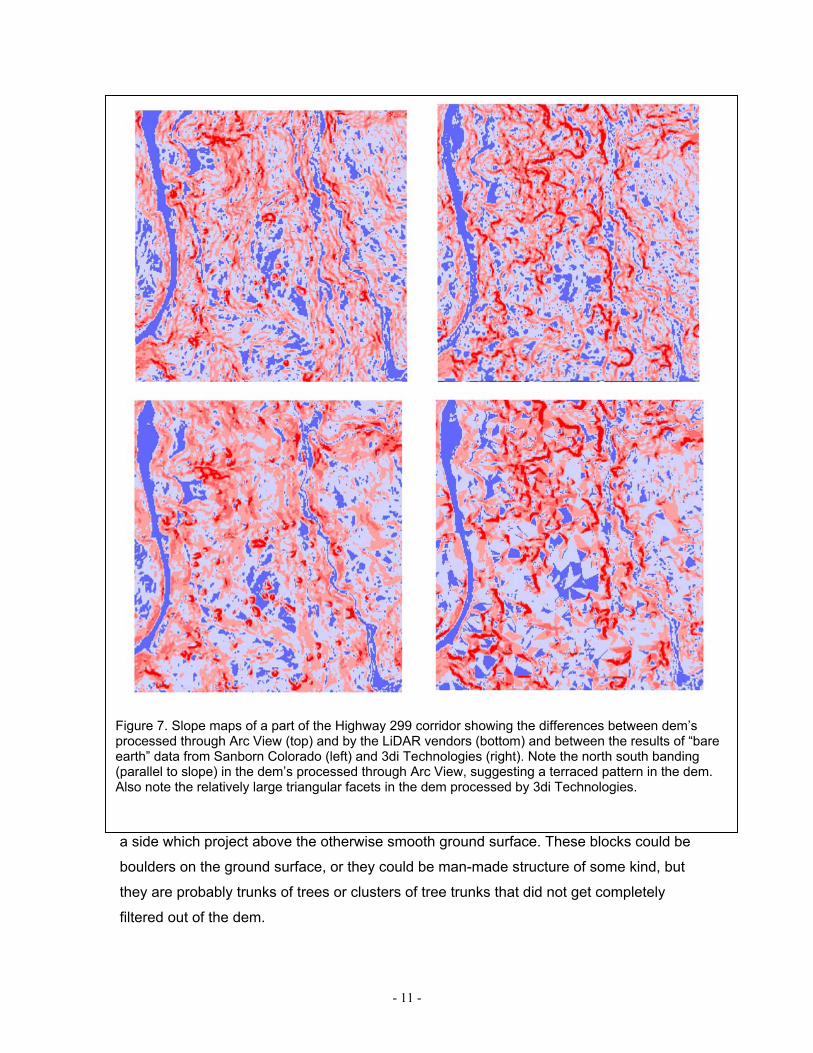
a side which project above the otherwise smooth ground surface. These blocks could be
boulders on the ground surface, or they could be man-made structure of some kind, but
they are probably trunks of trees or clusters of tree trunks that did not get completely
filtered out of the dem.
Figure 7. Slope maps of a part of the Highway 299 corridor showing the differences between dem’s processed through Arc View (top) and by the LiDAR vendors (bottom) and between the results of “bare earth” data from Sanborn Colorado (left) and 3di Technologies (right). Note the north south banding (parallel to slope) in the dem’s processed through Arc View, suggesting a terraced pattern in the dem. Also note the relatively large triangular facets in the dem processed by 3di Technologies.
- 11 -
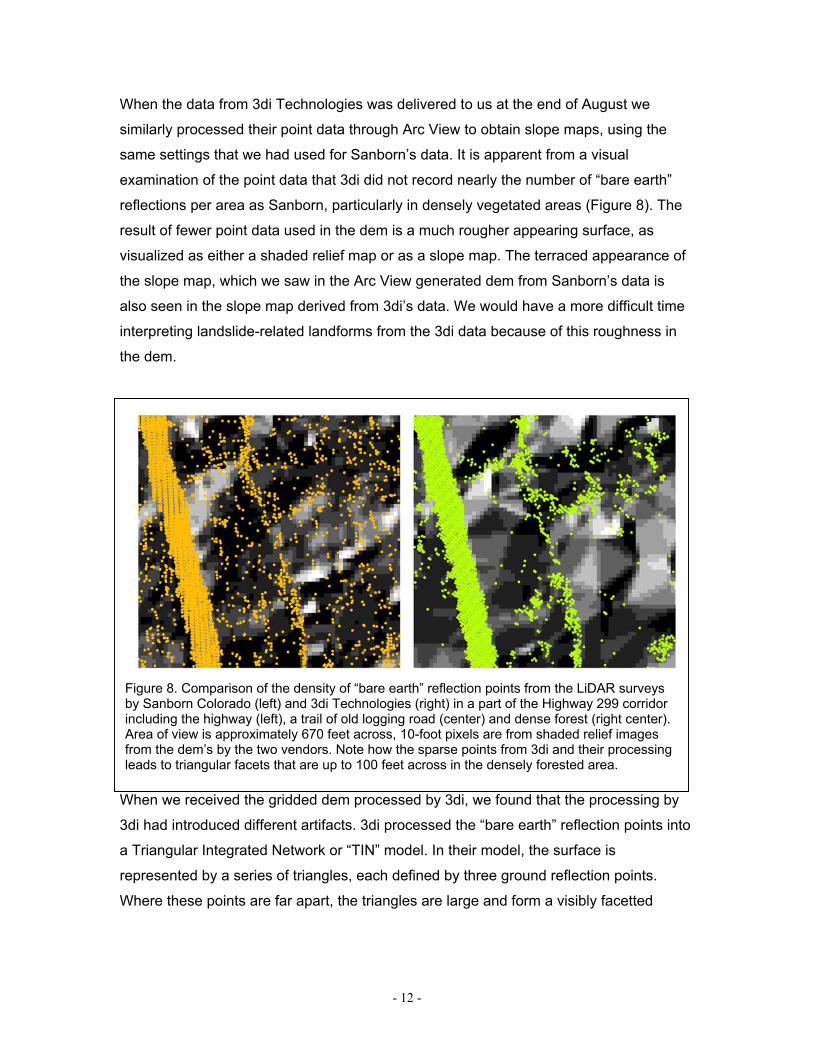
When the data from 3di Technologies was delivered to us at the end of August we
similarly processed their point data through Arc View to obtain slope maps, using the
same settings that we had used for Sanborn’s data. It is apparent from a visual
examination of the point data that 3di did not record nearly the number of “bare earth”
reflections per area as Sanborn, particularly in densely vegetated areas (Figure 8). The
result of fewer point data used in the dem is a much rougher appearing surface, as
visualized as either a shaded relief map or as a slope map. The terraced appearance of
the slope map, which we saw in the Arc View generated dem from Sanborn’s data is
also seen in the slope map derived from 3di’s data. We would have a more difficult time
interpreting landslide-related landforms from the 3di data because of this roughness in
the dem.
When we received the gridded dem processed by 3di, we found that the processing by
3di had introduced different artifacts. 3di processed the “bare earth” reflection points into
a Triangular Integrated Network or “TIN” model. In their model, the surface is
represented by a series of triangles, each defined by three ground reflection points.
Where these points are far apart, the triangles are large and form a visibly facetted
Figure 8. Comparison of the density of “bare earth” reflection points from the LiDAR surveys by Sanborn Colorado (left) and 3di Technologies (right) in a part of the Highway 299 corridor including the highway (left), a trail of old logging road (center) and dense forest (right center). Area of view is approximately 670 feet across, 10-foot pixels are from shaded relief images from the dem’s by the two vendors. Note how the sparse points from 3di and their processing leads to triangular facets that are up to 100 feet across in the densely forested area.
- 12 -
ground surface, a very artificial appearance. This appearance is greatest where the data
is sparsest, in the most densely vegetated areas.
The facetted appearance of the ground surface from the TIN model is even more
artificial in appearance than the rough or terraced appearance from the Arc View
processing of the same data. As a result, Interpretation of landslide-related
geomorphology from the 3di dem would be much more difficult than from the Sanborn
dem. It would even be more difficult than interpretation of the Arc View generated dem
from 3di’s data.
Interpretation of landslides from LiDAR dem's
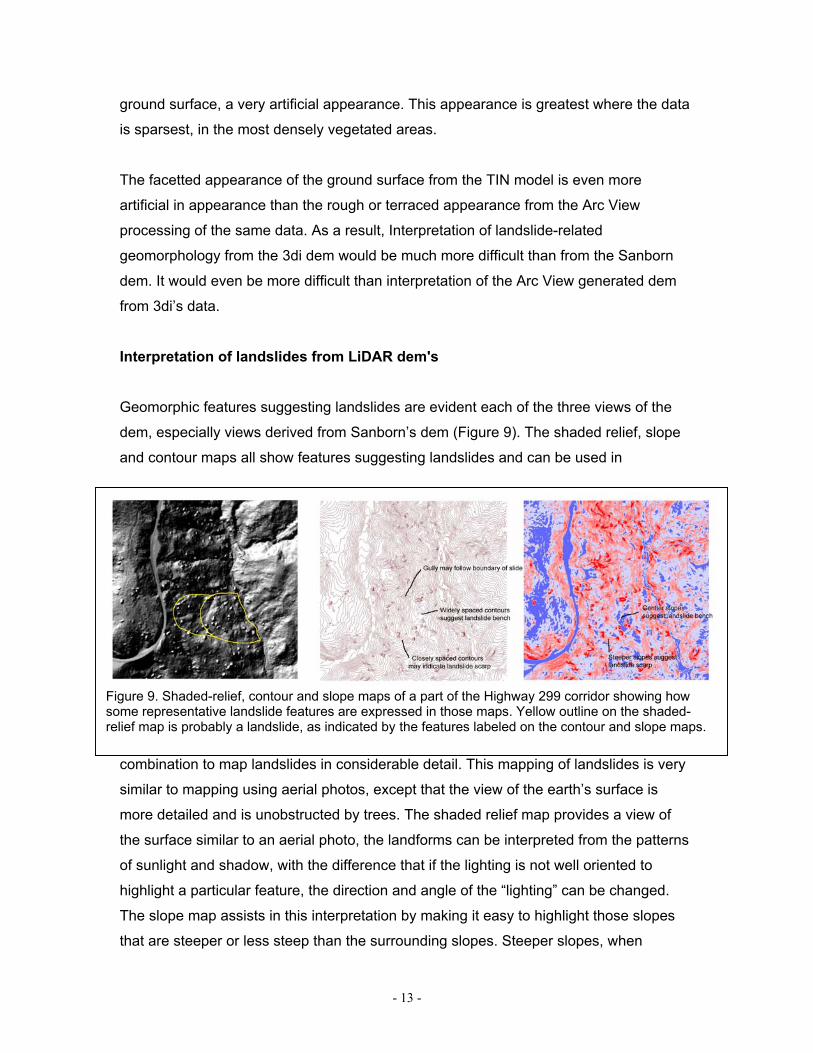
Geomorphic features suggesting landslides are evident each of the three views of the
dem, especially views derived from Sanborn’s dem (Figure 9). The shaded relief, slope
and contour maps all show features suggesting landslides and can be used in
combination to map landslides in considerable detail. This mapping of landslides is very
similar to mapping using aerial photos, except that the view of the earth’s surface is
more detailed and is unobstructed by trees. The shaded relief map provides a view of
the surface similar to an aerial photo, the landforms can be interpreted from the patterns
of sunlight and shadow, with the difference that if the lighting is not well oriented to
highlight a particular feature, the direction and angle of the “lighting” can be changed.
The slope map assists in this interpretation by making it easy to highlight those slopes
that are steeper or less steep than the surrounding slopes. Steeper slopes, when
Figure 9. Shaded-relief, contour and slope maps of a part of the Highway 299 corridor showing how some representative landslide features are expressed in those maps. Yellow outline on the shaded-relief map is probably a landslide, as indicated by the features labeled on the contour and slope maps.
- 13 -
juxtaposed with gentler slopes may represent the landslide scarp and adjacent bench.
Contour maps help to highlight the same features of steeper and gentler slopes, and
have the advantage that geologists have been using surfaces as expressed in
topographic contours to interpret landslides for decades. This more traditional and
familiar interpretation allows a check of the geomorphic interpretation from the less
familiar slope and shaded relief images.
The level of detail and realistic appearance of the Sanborn dem and the maps derived
from them suggest that LiDAR surveys will result in more detailed landslide maps,
especially in heavily forested terrain. The dramatically less detailed dem provided by 3di
suggests that the details of the data processing by different vendors is one of the key
factors in acquiring a dem that is useful for landslide mapping.
Conclusions To begin an evaluation of the potential for LiDAR to improve our ability to make
detailed and accurate maps of landslides in densely forested terrain, CGS
proposed a series of LiDAR surveys of the Highway 299 corridor as an addition
to our existing project to map landslides along highway corridors in California.
With funding from Caltrans’ New Technology and Research Program, we
prepared specifications and released an RFQ (Request for Qualifications) to
solicit proposals from LiDAR vendors. Despite some problems with this process,
we contracted with two vendors, both of whom conducted surveys of the
Highway 299 corridor.
The results of these surveys, delivered to us in July and August, 2002, show that
the two surveys resulted in substantially different densities of “bare earth”
reflections in the most densely vegetated areas. Largely due to the greater
density of “bare earth” reflections in the densely forested areas, the bare earth
dem by Sanborn Colorado shows considerably more terrain detail, which can be
used to map landslides. Processing of the dem into shaded-relief, slope, and
contour maps will very likely allow geologist to make more detailed and accurate
landslide maps than the use of aerial photographs alone. A detailed examination
- 14 -

of the comparative quality and time needed to prepare landslide maps of this
area using traditional techniques and utilizing the LiDAR surveys will be
conducted over the next year as part of CGS’s mapping of the Highway 299
corridor.
References Dietrich, W.E., D. Beluggi, J. Roering and M. Casadei, 1999, The use of airborne laser altimetry in theoretical and applied geomorphology: EOS, Transactions American Geophysical Union, v. 80, no. 46, p. F437.
- 15 -

Appendix A Request for Qualifications, including Draft Contract
- 16 -
REQUEST FOR QUALIFICATIONS
2002 LiDAR Data Acquisition
Regional Geologic and Hazards Mapping Program Division of Mines and Geology Department of Conservation
I. INTRODUCTION
The Regional Geologic and Hazards Mapping Program (RGHM) of the California Department of Conservation’s Division of Mines and Geology has funds available for survey using LiDAR technology via a contract with the Department of Transportation (Caltrans). By conducting a survey of specific portions of highway corridors RGHM will evaluate the usefulness of LiDAR for landslide mapping purposes. The LiDAR survey will be used in conjunction with traditional interpretation of aerial photographs and field methods to prepare a landslide map of the corridors. RGHM will prepare a report, which will compare the ability of the LiDAR survey to distinguish landslide geomorphology with the traditional methods and to improve the efficiency and accuracy of landslide mapping in heavily forested terrain.
II. GENERAL INFORMATION
The dates for release of the Request for Qualifications (RGQ), response submission, evaluation of responses for qualifications, and contract negotiations are given below. The starting date for conduction of the LiDAR survey funded under this RFQ is on or about March 1, 2002. Event Date
Release of RFQ January 18, 2002 Response Due Date February 5, 2002 Evaluation of Responses February 6-12, 2002 Contract Negotiations February 13-27, 2002 III. DATA INTERPRETATION TOPICS
Survey will be conducted along portions of the SR 299 corridor in Humboldt County and/or the US Hwy 101 Corridor in Del Norte county for a minimum of 3,000 acres. For comparison purposes the survey will have three components; the western part of the Highway 299 corridor, the eastern part of the Highway 299 corridor, and the Highway 101 “Last Chance Grade” area. The results of several contractors will be compared for certain corridors. Maximum budget level anticipated will be $54,000 A. All responses must be received by RGHM no later than 5:00 February 5, 2002.
Proof of receipt before deadline is the Mines and Geology date stamp. Responses not received at the place, date, and time specified will not be accepted and will be returned to the sender.
The response to the RFQ shall be mailed or delivered to: LiDAR Data Acquisition Division of Mines & Geology Department of Conservation 801 K Street, MS12-32 Sacramento, California 95814
- 17 -
Attn: Candi Baker
This address is valid for all means of delivery (e.g., Federal Express, UPS, US mail, hand delivery, etc.). Facsimile machine (FAX) or e-mail responses will not be accepted. B. One original each of Project Summary (Attachment A), Statement of Qualifications,
Scope of Work, Attachment B and Attachment C should be submitted in one package. Submit the package in one sealed envelope with the Contractor’s name clearly marked on the outside of the envelope. Mail or deliver the sealed envelope under a single cover to the above address.
NOTE: Responses should not be submitted in bound form. No cover letter is required.
C. All responses must include at least the following four elements:
1. Summary (Attachment A). 2. Statement of Qualifications. 3. Scope of Work. 4. Contractor Certification (Attachment B) 5. Payee Data Record
Elements 4 and 5 (Attachments B and C) are not required for the responses submitted by the University of California, the California State University, or California Local Government Entities. D. Questions regarding the data interpretation topic of this RFQ should be directed to Chris Wills at (916) 323-8553 or (415) 904-7729. Questions regarding requirements and other information requested herein should be directed to either Candi Baker at (916) 322-2358 or Angela Taylor at (916) 324-5115.
IV. RESPONSE CONTENTS
All responses should include the following elements. If any element is not included or not signed the response will be deemed non-responsive. They shall be assembled in the order given below. 1. Attachment A – Project Summary
Use this summary as the cover sheet for all responses. Identify only one data interpretation topic from the three topics listed in Section III. The form must be signed by the Contractor and an authorized institutional representative.
2. Statement of Qualifications
a. Statement of Qualifications should include proof of required licenses: California Certified Land Surveyor
b. References and prior experience: Contractors must submit 3 references for whom the contractor has performed similar services within the last five years and a list of projects of similar complexity and magnitude completed within the last five years.
c. Laser Safety Issues: A laser safety plan is included showing that the LiDAR instrument to be used in certified according to CDRH 1040
- 18 -

standards and that guidelines specified in ANSI Z136.1 for safe laser operation are followed.
- 19 -
3. Scope of Work
The Scope of Work in the response should include each of the following components: a. The contractor shall develop a work plan or schedule for task completion.
Identify each major task, necessary subtask, and/or specific milestones by which progress can be measured and payment made upon final delivery and approval of data.
b. Discuss and clearly explain the methodology that your firm proposes to use to satisfactorily achieve the required results on this project. Include all aspects of survey control, data acquisition and analysis and Quality Control procedures. Describe the attributes of the data as it is to be acquired, including: laser pulse repetition rate; scan pattern, angle and rate; laser footprint diameter on the ground; number of returns per shot collected (i.e., first and last, or multiple); swath width, overlap between adjacent swaths, average and worse-case spacing of laser shots cross and along-track within a swath; number of GPS base stations used and maximum distance to a station. For first and last, or multiple returns per shot, state the minimum resolvable distance between returns. State if the amplitude of the laser return and scan angle are to be included as part of the delivered data. List the software used to process the data, include the company name, version used and platform/operating system. Statements of Qualifications that stress activities that will exceed the requirements of this project at additional costs are not desired and will be rated negatively. Clarity of submittals is preferred.
c. Project Personnel: List all personnel who will be working on the project,
their titles, and resumes.
d. Facilities and Resources: List all equipment, hardware, and software that your firm intends to use during the course of this project. This shall include at a minimum: Aircraft, laser equipment, IMU, GPS equipment, processing software, etc. Please indicate specifics as to availability of equipment (as a function of time) for this project, as well as compatibility of your firm's internal software to accommodate this project's requirements in terms of deliverables.
e. Schedule: Identify any issues with meeting the schedule as outlined in
the Scope of Work.
4. Attachment B – Contractor Certification
The first page in Attachment B must be signed by the person who can legally bind the Contractor in a contract, unless it is not required for those institutions described in Section IV(C).
5. Attachment C – Statement of Compliance This form must be signed by the person who can legally bind the Contractor in a contract, unless it is not required for those institutions described in Section IV(C).
- 20 -
The proposed work should be broken down into the outline in Work Plan and Work Schedule (see 2) above) for the purpose of this submittal. Statement of Qualification/Cost Sheet should indicate on the Cost Sheet (Attachment 3) which Area the submittal addresses. The total costs of all contracts to be awarded under this RFQ for all areas to be surveyed cannot exceed $54,000.
V. Selection and Contract Negotiations
All responses will be evaluated by a panel comprised of staff members of the Division of Mines and Geology and Caltrans. At the time of submittal opening, each will be checked for the presence or absence of required information in conformance with the submission requirements of this RFQ. The State will put each Statement of Qualification through a process of evaluation to determine its responsiveness to the State's needs. Statement of Qualification’s that contain false or misleading statements, or which provide references which do not support an attribute or condition claimed may be rejected. If, in the opinion of the State, such information was intended to mislead the State in its evaluation, and the attribute, condition, or capability is a requirement of this RFQ, it will be the basis for rejection of the submittal.
The panel will rank the responses that meet the minimum qualifications will be evaluated and scored according to the criteria indicated below. A minimum of 85 points must be achieved in this phase to be considered responsive. (A responsive Statement of Qualification is one, which meets or exceeds the requirements stated in this RFQ.) A minimum of points (as shown below in parentheses) must be achieved for each rating/scoring criteria. Criteria are established by the customer based on information provided in B.1, B.2, B.3, B.4, and C.2 above. Below are the rating categories:
Rating/Scoring Criteria Maximum Possible Points 1. Technical quality of approach described by contractor. 25 (minimum pts. 21.25)
This factor considers the merit of the proposed approach and the probability of achieving positive results within the designated
period. Clarity of the submittal will be considered.
2. Schedule to acquire and process the data. 25 (minimum pts. 21.25)
Can the contractor meet the required schedule? 3. References responses. 20 (minimum pts. 17)
This factor considers responses from the contractor's references as to competency of
contractor.
4. Competence of the Contractor to 15 (minimum pts. 12.75)
perform the work. This factor considers the experience and competence to perform the proposed
project successfully, including their record of performance.
5. Relevant experience of firm. 15 (minimum pts. 12.75) This factor considers projects of similar magnitude and complexity completed
- 21 -

by contractor in the last five years.
Total Possible Points 100 (minimum pts. 85)
VI. LiDAR Acquisition Project Conditions
All Contracts for surveys funded by RGHM will contain the following Special Terms and General Contract Conditions. Contractors should be aware of these as they prepare their responses. SPECIAL RGHM TERMS AND CONDITIONS See Sample Contract
- 22 -

ATTACHMENT 1
PROJECT SUMMARY
LiDAR Data Acquisition
Project Title: ___________________________________________________________ ___________________________________________________________ ___________________________________________________________ Contractor Investigator(s): Signature ______________________________________ Name _________________________________________ Title __________________________________________ Phone No. _______________ Fax No. _______________ e-mail Address: _________________________________ Institution: _______________________________________________ (name and address) _______________________________________________ _______________________________________________ _______________________________________________ Authorized Institutional Representative: Signature __________________________ Name _____________________________
Title _______________________________
- 23 -
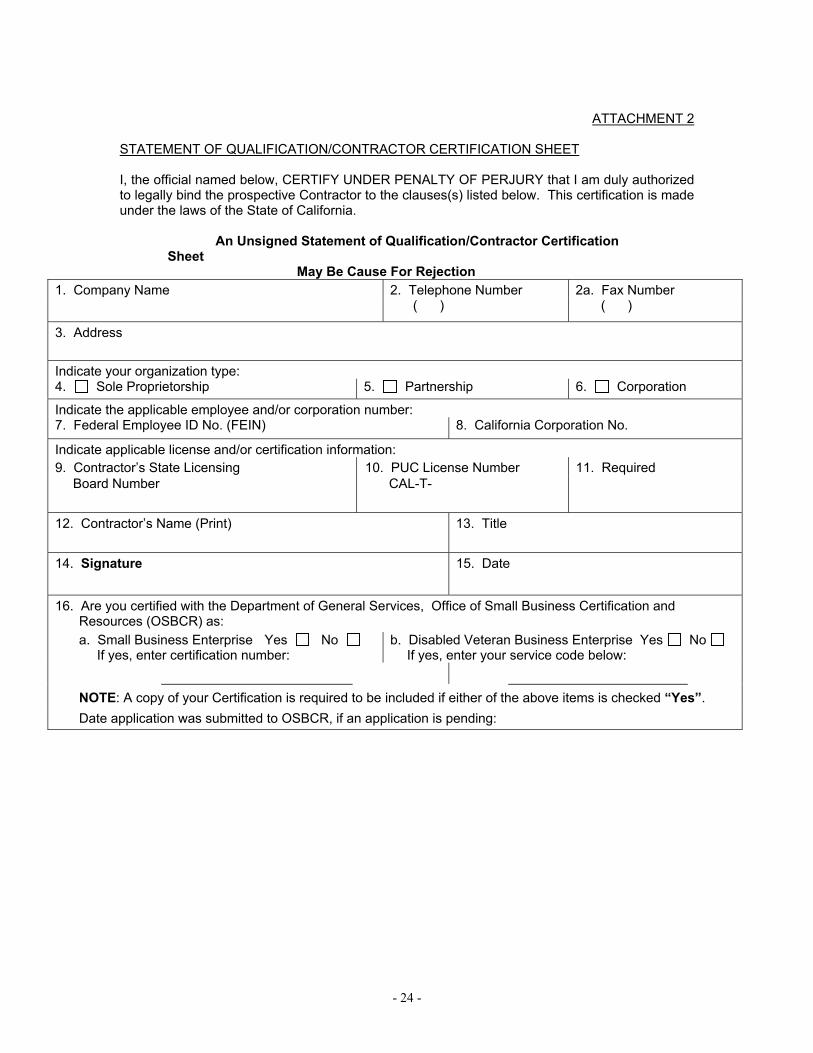
ATTACHMENT 2
STATEMENT OF QUALIFICATION/CONTRACTOR CERTIFICATION SHEET
I, the official named below, CERTIFY UNDER PENALTY OF PERJURY that I am duly authorized to legally bind the prospective Contractor to the clauses(s) listed below. This certification is made under the laws of the State of California.
An Unsigned Statement of Qualification/Contractor Certification Sheet
May Be Cause For Rejection 1. Company Name 2. Telephone Number 2a. Fax Number
( ) ( )
3. Address
Indicate your organization type: 4. Sole Proprietorship 5. Partnership 6. Corporation
Indicate the applicable employee and/or corporation number: 7. Federal Employee ID No. (FEIN) 8. California Corporation No.
Indicate applicable license and/or certification information: 9. Contractor’s State Licensing 10. PUC License Number 11. Required Board Number CAL-T-
12. Contractor’s Name (Print) 13. Title
14. Signature 15. Date
16. Are you certified with the Department of General Services, Office of Small Business Certification and Resources (OSBCR) as: a. Small Business Enterprise Yes No
If yes, enter certification number: b. Disabled Veteran Business Enterprise Yes No
If yes, enter your service code below:
NOTE: A copy of your Certification is required to be included if either of the above items is checked “Yes”. Date application was submitted to OSBCR, if an application is pending:
- 24 -
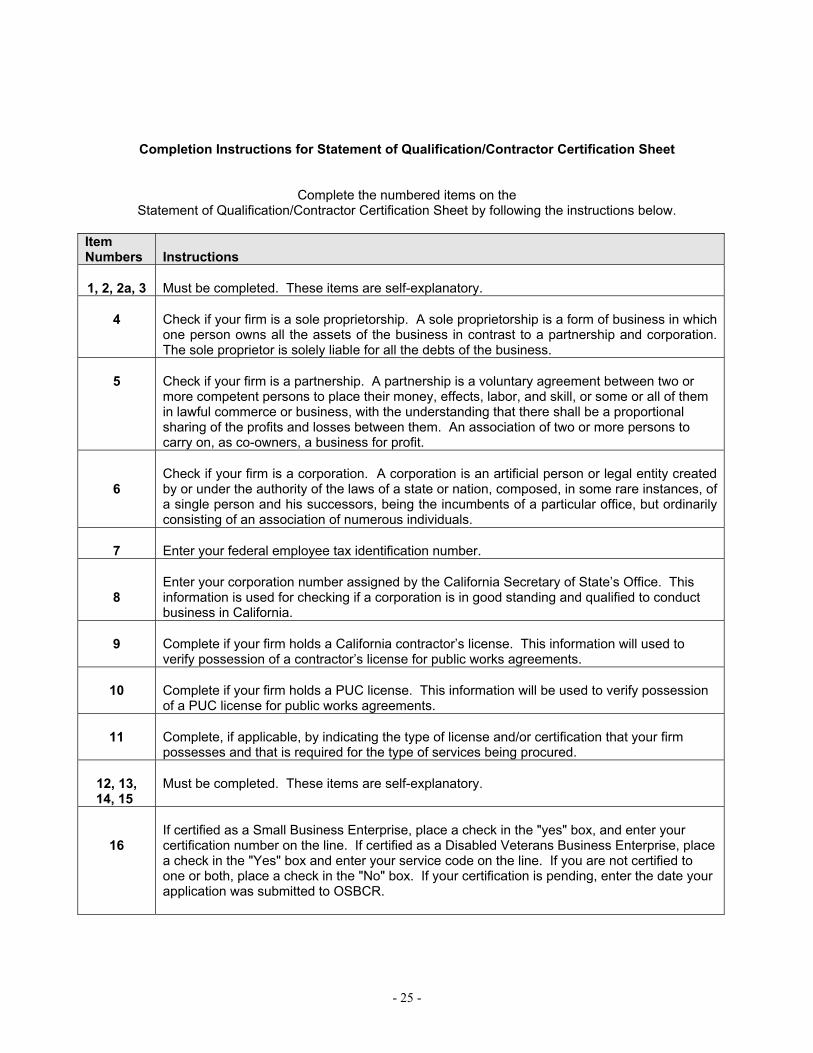
Completion Instructions for Statement of Qualification/Contractor Certification Sheet
Complete the numbered items on the Statement of Qualification/Contractor Certification Sheet by following the instructions below.
Item Numbers
Instructions
1, 2, 2a, 3
Must be completed. These items are self-explanatory.
4
Check if your firm is a sole proprietorship. A sole proprietorship is a form of business in which one person owns all the assets of the business in contrast to a partnership and corporation. The sole proprietor is solely liable for all the debts of the business.
5
Check if your firm is a partnership. A partnership is a voluntary agreement between two or more competent persons to place their money, effects, labor, and skill, or some or all of them in lawful commerce or business, with the understanding that there shall be a proportional sharing of the profits and losses between them. An association of two or more persons to carry on, as co-owners, a business for profit.
6
Check if your firm is a corporation. A corporation is an artificial person or legal entity created by or under the authority of the laws of a state or nation, composed, in some rare instances, of a single person and his successors, being the incumbents of a particular office, but ordinarily consisting of an association of numerous individuals.
7
Enter your federal employee tax identification number.
8
Enter your corporation number assigned by the California Secretary of State’s Office. This information is used for checking if a corporation is in good standing and qualified to conduct business in California.
9
Complete if your firm holds a California contractor’s license. This information will used to verify possession of a contractor’s license for public works agreements.
10
Complete if your firm holds a PUC license. This information will be used to verify possession of a PUC license for public works agreements.
11
Complete, if applicable, by indicating the type of license and/or certification that your firm possesses and that is required for the type of services being procured.
12, 13,
14, 15
Must be completed. These items are self-explanatory.
16
If certified as a Small Business Enterprise, place a check in the "yes" box, and enter your certification number on the line. If certified as a Disabled Veterans Business Enterprise, place a check in the "Yes" box and enter your service code on the line. If you are not certified to one or both, place a check in the "No" box. If your certification is pending, enter the date your application was submitted to OSBCR.
- 25 -
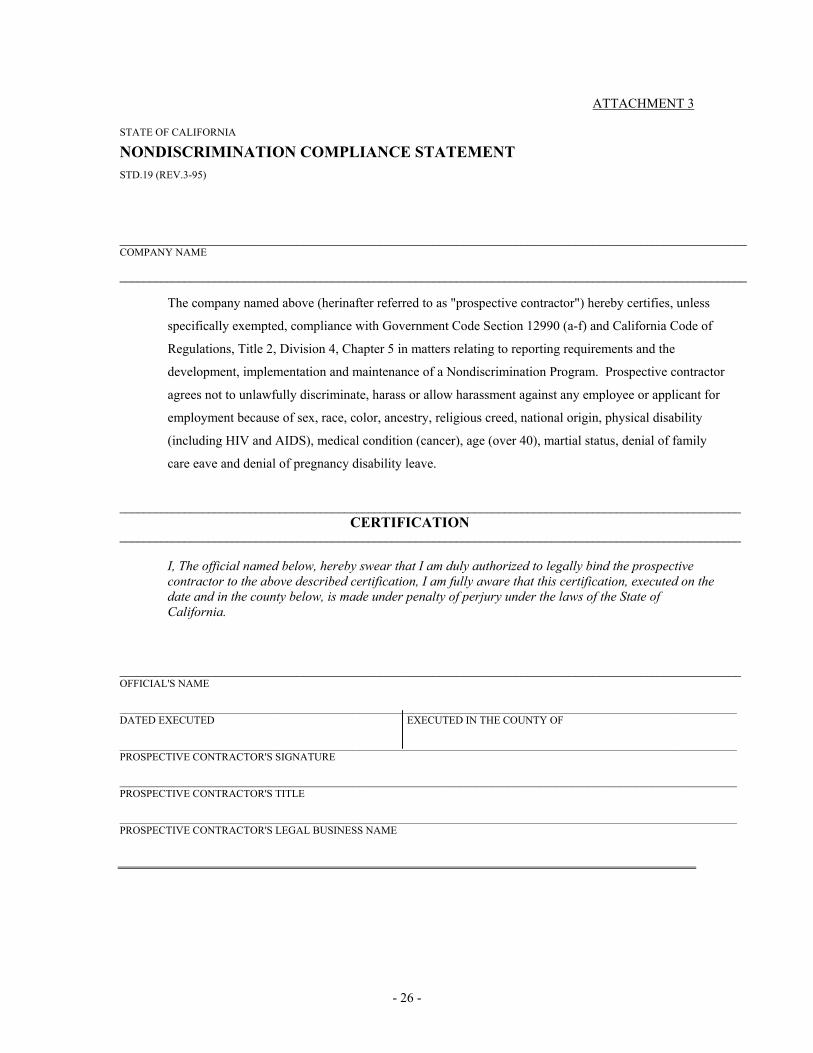
ATTACHMENT 3
STATE OF CALIFORNIA
NONDISCRIMINATION COMPLIANCE STATEMENT STD.19 (REV.3-95) __________________________________________________________________________________________________________ COMPANY NAME __________________________________________________________________________________________________________
The company named above (herinafter referred to as "prospective contractor") hereby certifies, unless
specifically exempted, compliance with Government Code Section 12990 (a-f) and California Code of
Regulations, Title 2, Division 4, Chapter 5 in matters relating to reporting requirements and the
development, implementation and maintenance of a Nondiscrimination Program. Prospective contractor
agrees not to unlawfully discriminate, harass or allow harassment against any employee or applicant for
employment because of sex, race, color, ancestry, religious creed, national origin, physical disability
(including HIV and AIDS), medical condition (cancer), age (over 40), martial status, denial of family
care eave and denial of pregnancy disability leave.
_________________________________________________________________________________________________________
CERTIFICATION _________________________________________________________________________________________________________
I, The official named below, hereby swear that I am duly authorized to legally bind the prospective contractor to the above described certification, I am fully aware that this certification, executed on the date and in the county below, is made under penalty of perjury under the laws of the State of California.
_________________________________________________________________________________________________________ OFFICIAL'S NAME ____________________________________________________________________________________________________________________ DATED EXECUTED EXECUTED IN THE COUNTY OF ____________________________________________________________________________________________________________________ PROSPECTIVE CONTRACTOR'S SIGNATURE ____________________________________________________________________________________________________________________ PROSPECTIVE CONTRACTOR'S TITLE ____________________________________________________________________________________________________________________ PROSPECTIVE CONTRACTOR'S LEGAL BUSINESS NAME
- 26 -
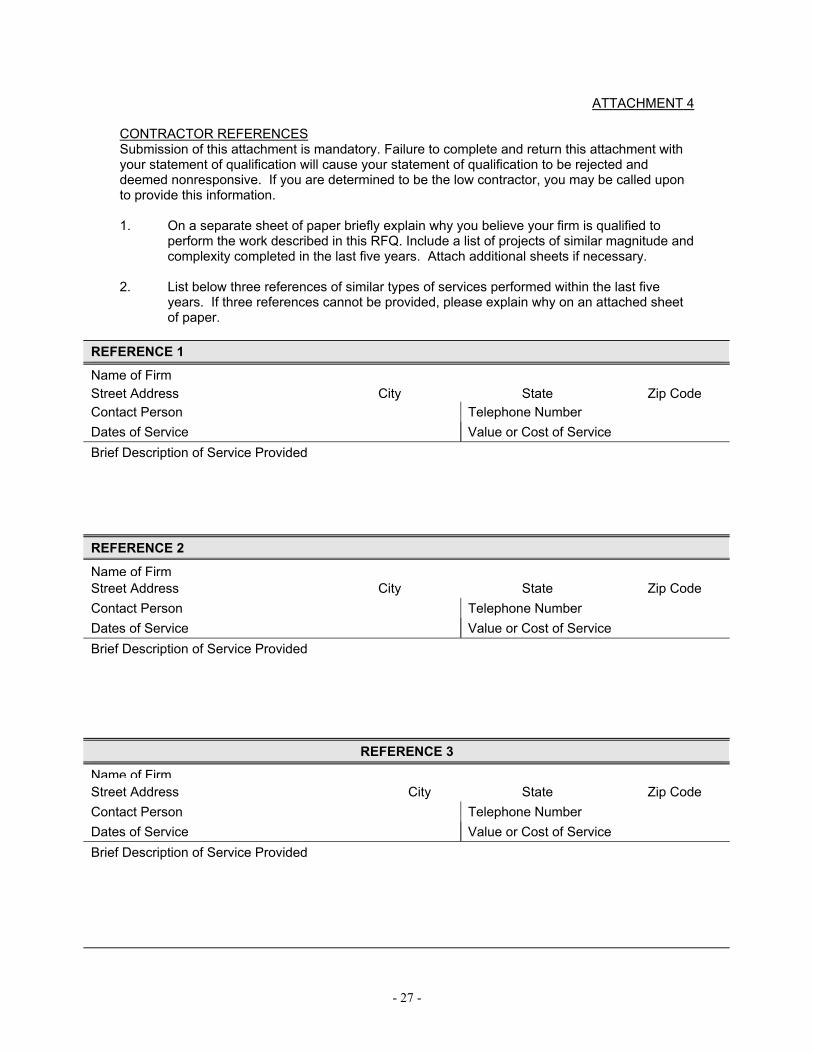
ATTACHMENT 4
CONTRACTOR REFERENCES Submission of this attachment is mandatory. Failure to complete and return this attachment with your statement of qualification will cause your statement of qualification to be rejected and deemed nonresponsive. If you are determined to be the low contractor, you may be called upon to provide this information. 1. On a separate sheet of paper briefly explain why you believe your firm is qualified to
perform the work described in this RFQ. Include a list of projects of similar magnitude and complexity completed in the last five years. Attach additional sheets if necessary.
2. List below three references of similar types of services performed within the last five
years. If three references cannot be provided, please explain why on an attached sheet of paper.
REFERENCE 1
Name of Firm Street Address City State Zip Code Contact Person Telephone Number Dates of Service Value or Cost of Service Brief Description of Service Provided
REFERENCE 2
Name of FirmStreet Address City State Zip Code Contact Person Telephone Number Dates of Service Value or Cost of Service Brief Description of Service Provided
REFERENCE 3
Name of FirmStreet Address City State Zip Code Contact Person Telephone Number Dates of Service Value or Cost of Service Brief Description of Service Provided
- 27 -

Note to Bidders: The following 13 pages represent a sample of the contract(s) that will be awarded, if any, from this RFQ. Please review it carefully and present any questions in writing to the contact identified for this RFQ.
- 28 -
Exhibit A STATEMENT OF WORK Scope of Work 1. Contractor shall provide all equipment and personnel necessary to conduct a LIDAR
survey for the California Department of Conservation, Division of Mines and Geology (DOC) for the period beginning 2/25/02 (or upon approval) through 12/31/02.
The State intends to administer this contract through a single administrator, herein called the "Contract Manager." The Contract Manager will make all determinations and take all actions as are appropriate under this contract, subject to the limitations of California law and State Administrative regulations.
2. The services shall be performed along the Highway 299 corridor in Humboldt County, California and the Highway 101 corridor in Del Norte County, California. This contract is being awarded for two areas:
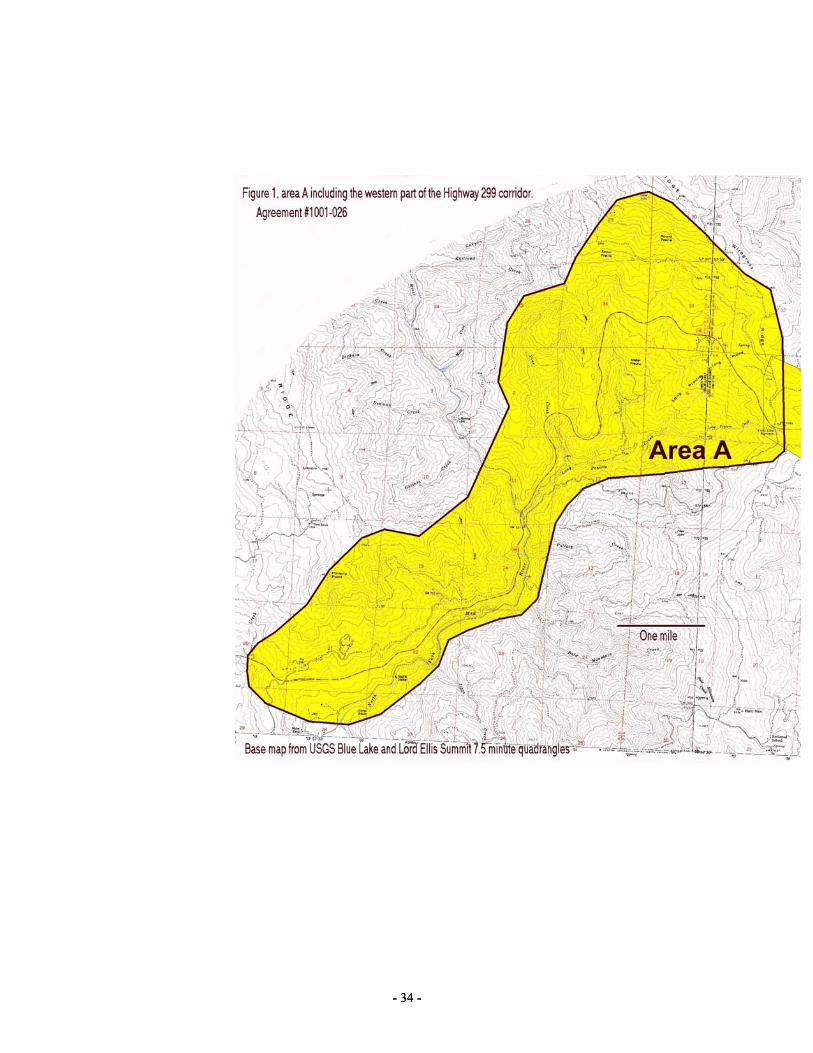
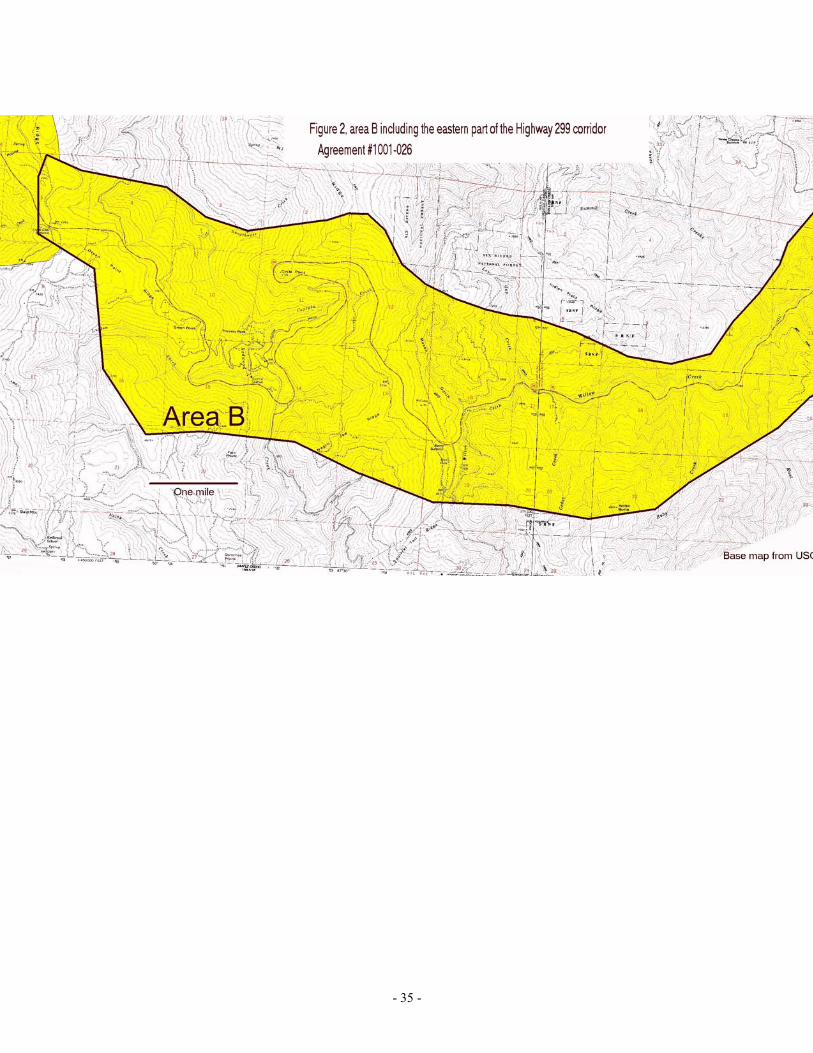
a) Area A: the western part of the Highway 299 corridor from east of Blue Lake to Lord Ellis Summit as shown on Figure 1.
b) Area B: the eastern part of the Highway 299 corridor from Lord Ellis Summit to Willow Creek as shown in Figure 2.
(DOC may award more than one contract for LiDAR surveys for “Area A” to compare the results of different vendors and their sensors and processing systems. No more than one contract will be awarded for Areas “B” or “C”. Contractor may submit proposals for any or all of the three areas.)
3. The services shall be provided between February 25, 2002 and December 31, 2002, with
data acquisition taking place before May 1, 2002 or “leaf-on” conditions. 4. The project representatives during the term of this agreement will be:
State Agency: Dept. of Conservation Contractor: Sanborn Colorado, L.L.C. Name: Chris Wills Name: Daniel Eric DesRoche Phone: 415/904-7729 or 916/323-8553 Phone: 719/593-0093 Fax: 415/904-7715 Fax: 719/528-5093
Direct all inquiries to: State Agency: Dept. of Conservation Contractor: Sanborn Colorado, L.L.C. Section/Unit: Mines and Geology Headquarters
Section/Unit:
Attention: Candi Baker Attention: B. Craig McDaniel Address: 801 K Street, MS 12-30 Sacramento, CA 95814
Address: 1935 Jamboree Drive, Suite 100 Colorado Springs, CO 80920
Phone: 916/322-2358 Phone: 719/593-0093 Fax: 916/445-5718 Fax: 719/528-5093
5. Description of work to be performed and duties of all parties. A. Deliverables
- 29 -
a. Pre-Flight Deliverables
Prior to data collection, the contractor must submit:
(1) A map showing the study area boundaries and planned flight path, at a large scale
(1:24,000) or medium scale (1:50,000). Map shall identify which GPS ground control points are used as base stations on particular flight path's and areas (see section IIC(4)).
(2) Data sheets documenting vertical & horizontal accuracy of selected GPS base points.
(3) Documentation specifying altitude, airspeed, scan angle, scan rate, LiDAR pulse rates,
receiver return mode, and other flight and equipment information deemed appropriate, and
(4) A plot of PDOP as a function of time during the data collection period indicating times
when data will not be acquired due to high PDOP. (5) Notification to the DOC Project Representative 5 days prior to flight so DOC staff may
make preliminary reviews of data as acquired.
b. Post-Project Deliverables
Within 60 days of completion of the survey, the contractor must submit:
(1) Time-stamp, (i.e., Date and time of acquisition indicated so as to uniquely identify each laser shot), x,y,z geolocation of all acquired laser returns with x and y position in US Survey Feet referenced to the California State Plane Coordinate System, Zone 1, NAD83, 1991 Adjustment, and z reported in Feet both as ellipsoid (WGS-84) and orthometric (NAVD-88) elevations derived from the National Geodetic Survey Geoid Model Geoid99 available from the NGS at: www.ngs.noaa.gov/GEOID/GEOID99/geoid99.html
(2) x,y,z geolocation of laser returns identified to be returns from the ground surface, with
time-stamp, to the same specifications noted in IIB(1).
(3) DEM gridded at 10ft easting and northing postings of the ground surface orthometric elevations derived using triangulated irregular network (TIN) processing and referenced to California State Plane Coordinates as noted in IIB(1).
(4) Shaded relief rendition of the 10ft, ground surface DEM as paper maps at 1:12,000 scale
referenced to California State Plane Coordinates as noted in IIB(1). The maps shall show greyscale hillshade with illumination from the south at a 45 degree inclination. Digital files shall also be provided on CD.
(5) x,y,z geolocation of laser returns identified to be returns from the upper-most surface (i.e., First-return from canopy and structure tops, ground where there is no vegetation or structures), with time stamp to the same specifications noted in IIB(1).
(6) Time-stamped GPS aircraft x,y,z trajectory with x and y referenced to California State
plane Coordinate System zone 1 easting and northing and with quality metrics such as, but not necessarily limited to, the PDOP and estimated RMS error at each GPS epoch, and
- 30 -
(7) Final reports documenting system calibration, instrument acquisition parameters, GPS ground control, data processing procedures, and validation of data quality demonstrating that specification in IID have been met.
B. Delivery Format The following specifications shall apply to all data deliveries Coordinates Double Precision Digital Media: CD ROM Digital Media Format: delimited ASCII, and ArcView shape file formats and gzip
compression for deliverables A .b 1,2 & 5 ArcView Grid file gzip compressed for deliverables in A.b 3 & 4 Maximum File Size: 20 megabytes uncompressed Transmittal: Shall include listing of all filenames and applicable project area
per Attachment 1 Hardcopy Media: Paper Hardcopy Scale: 1:12,000 Number of Copies: 3 C. Schedule Field data acquisition must be completed by 5/01/02 prior to leaf on conditions. The final delivery shall be made no later than 60 working days from end of data acquisition ( or July 1, 2002). The DOC shall review and accept/reject products within 30 days of delivery. The contractor should propose a preferred delivery schedule. Following a thorough Quality Control review by DOC, data will be accepted or rejected-based on specifications in the RFP. If it is determined the acquired LiDAR data is insufficient to meet the RFP specifications, the contractor will be required to re-fly at no additional costs to the state those areas identified as deficient. D. Technical Specifications The LiDAR data shall be acquired meeting the following specifications: (1) The flight lines shall be arranged to provide 50% overlap between adjacent lines to prevent
loss of data due to acquisition problems along any one line and to increase to potential for bare-earth reflections in areas of heavy forest cover.
(2) The average cross-track and along-track spacing of laser pulses yielding valid ranges shall
be no larger than 2 m, where a valid range is considered to be to the ground or to vegetation, buildings or structures on the ground.
(3) The cross-track and along-track spacing at the 90% frequency of occurrence of laser pulses
yielding valid ranges shall be no larger than 4 m.
(4) The laser ranging data shall be acquired using a LiDAR system that collects first and last returns, or multiple returns, for each laser pulse.
(5) Data collection will not be conducted while there is snow cover on the ground nor during inclement weather conditions (high winds, rain, fog, low cloud cover) that would significantly diminish the quality of the data.
- 31 -
(6) Geodetic GPS Base Station locations shall be control points in the Califonia High Precision Geodetic Network (HPGN) on points with Orthometric heights determined by differential leveling. The contractor shall provide a report of which base points were used on particular flights and areas. In the event there is insufficient density of HPGN points in a particular area, the contractor may:
a) Utilize existing Caltrans control.
b) Establish horizontal control as necessary to the HPGN utilizing dual frequency receivers with surveys done to at least Third-order, Class 1 specifications as promulgated by the Federal Geodetic Control Subcommittee (FGCS). Vertical control shall be established using differential levels according to third-order Class 1 FGCS Specs. Vertical control shall be tied to NGS benchmarks on NAVD88 Datum.
(7) The ground surface DEM (Deliverable A.b.2) shall have vertical accuracy no larger than 30
cm root mean square error (RMSE), using the NSSDA definition where RMSE is the square root of the average of the set of squared differences between elevation values from an independent source of higher accuracy and linearly interpolated elevations in the DEM for identical points.
Quality Control/Quality Assurance (QC/QA) of the LiDAR-derived data, demonstrating that the technical specifications are met, is primarily the responsibility of the contractor. The DOC or its designee may perform additional QC/QA testing. The contractor must field verify the vertical accuracy of the ground surface DEM to ensure that the RMSE requirement is satisfied for all major ground cover categories that predominate within the project area. The main categories of ground cover that the contractor must separately evaluate and report on the DEM accuracy for shall be:
a) High grass and brush; b) Fully covered by coniferous trees; c) Fully covered by deciduous trees
The contractor shall evenly distribute sample points throughout the project area for each cover category and not group the sample points in a small subarea. The contractor shall also ensure that the airborne data was acquired for the sample points during times of representative PDOP conditions and not limited only to times of best PDOP conditions. The RMSE calculated from a sample of test points will not be the RMSE of the DEM. The calculated value may be higher or it may be lower than that of the DEM. Confidence in the calculated value increases with the number of test points. If the errors (lack of accuracy) associated with the DEM are normally distributed and unbiased, the confidence in the calculated RMSE can be determined as a function of sample size. Similarly, the sample RMSE necessary to obtain 95-percent confidence that the DEM RMSE is less than 30 centimeters can also be determined as a function of sample size. For each of the three cover categories, the contractor must test a sample of points and show the test points have an RMSE less than or equal to:
nnnRMSEsample
1326.2)1(30 −−−≤
Where n is the number of test points in the sample. The contractor must select a minimum of 10 test points for each of the three cover categories. For all points tested the contractor must report the location of the point (x and y position in US Survey Feet referenced to the California State Plane Coordinate System, Zone
- 32 -
1, NAD83, 1991 Adjustment), its orthometric elevation from the independent source of higher accuracy (referenced to NAVD-88 datum), the method by which its elevation was independently established, the elevation at the point interpolated from the ground surface DEM (Deliverable A.b.2), and the cover category. Because the definition and criterion for measuring accuracy are derived from the assumption that the test point samples come from a uniformly distributed population with zero mean, the contractor must calculate other statistics. In particular, the mean and coefficient of skew must be calculated for each sample and reported to the DOC. Values of the mean of the test points outside of the interval ± 2 centimeters and/or values of the coefficient of skew outside of the interval ± 0.5 centimeters may indicate systematic error.
6. Additional Terms and Conditions
a. Complete Services/Products
The selected Contractor shall be required to:
• Furnish all tools, equipment, supplies, supervision, transportation, and other accessories, services and facilities. • Furnish all materials, supplies, and equipment specified and required to be incorporated in, and form a permanent part of, the completed work. • Provide and perform all necessary labor. • Allow the DOC to inspect the Contractors facilities and equipment. • Execute and complete all specified work with due diligence, in accordance with good technical practice and the requirements, stipulations, provisions, and conditions of this RFP and the resultant contract.
b. Access Agreements
The Contractor shall provide written notification to the DOC on the number and locations of
ground control points used in this project. The Contractor shall determine land ownership encompassing those locations and, as required, obtain site access permission. The Contractor shall notify landowners and coordinate with the appropriate personnel prior to on-site or over-site activities. The Contractor shall be solely responsible for the requisite filing of flight plans and obtaining appropriate permissions from the FAA and other agencies as necessary.
c. Ownership of Data
All products, data, information, findings and documents prepared or obtained under the terms of this RFP shall become the exclusive property of the DOC.
- 33 -
- 34 - - 34 -
- 35 -

Appendix B Report from Sanborn Colorado
- 36 -
FINAL REPORT
CALIFORNIA DEPARTMENT OF CONSERVATION
LIDAR Project
May 2002
Prepared by:
Sanborn 1935 Jamboree Drive, Suite 100
Colorado Springs, CO 80920
Tel: 1–719-593-0093 Fax: 1–719-528-5093
California Department of Conservation May 2002
EXECUTIVE SUMMARY
Sanborn was contracted to execute a LIDAR (Light Detection and Ranging) survey campaign to collect the 3-dimensional positions of a dense set of masspoints within a portion of the Highway 299 cooridor between Blue Lake and Willow Creek in the State of California. These data will be suitable for the development of a digital elevation model (DEM) to support orthometric photo rectification, contouring and land-slide studies.
Prior to beginning the LIDAR campaign, a fiducial network of Airborne GPS (AGPS) base stations was established within the area of interest. The network was constrained to local NGS HARN monuments and local benchmarks. The network observations and adjustment were completed on the GRS80 ellipsoid. In addition, several check points were established throughout the job location in accordance with the contract requirements.
The ALTM (Airborne Laser Terrain Mapping) system was calibrated by conducting several passes over a known test surface at the job location. Calibration flights were performed prior to and following every mission. The calibration parameters were inserted into the post-processing software before final data processing.
Although the acquired LIDAR data met the accuracy requirements of the project, a 15-centimeter bias was detected in the data relative to the ground truth survey. Because the accuracy statistic was met, all of the data is delivered without any adjustment to compensate for the bias. The precise source of the bias is not easily determined, but the error is of a systematic significance that makes it difficult to ignore. As a result, a second delivery of the filtered-to-ground data consisting of the original filtered data with a 15-centimeter vertical translation applied was assembled. The regular grid DEM and corresponding rendering are based on this adjusted data set.
The contents of this report summarize the methods used to establish the fiducial base station network, the check point survey, and the LIDAR data collection campaign along with the results.
Final Report ii
California Department of Conservation May 2002
TABLE OF CONTENTS 1. INTRODUCTION ....................................................................................................................1
1.1 DURATION/TIME PERIOD......................................................................................................1 1.2 CONTACT............................................................................................................................1 1.3 PURPOSE OF THE SURVEY...................................................................................................1 1.4 PROJECT LOCATION ............................................................................................................1 1.5 PROJECT SCOPE.................................................................................................................2 1.6 DATUM ISSUES....................................................................................................................2
1.6.1 Horizontal Datum........................................................................................................2 1.6.2 Vertical Datum ............................................................................................................2
2. LIDAR CALIBRATION ...........................................................................................................3
2.1 INTRODUCTION.....................................................................................................................3 2.2 CALIBRATION PROCEDURES .................................................................................................3
2.2.1 Building Calibration.....................................................................................................3 2.2.2 Runway Calibration.....................................................................................................3
2.3 CALIBRATION RESULTS ........................................................................................................4
3. GEODETIC BASE NETWORK...............................................................................................6
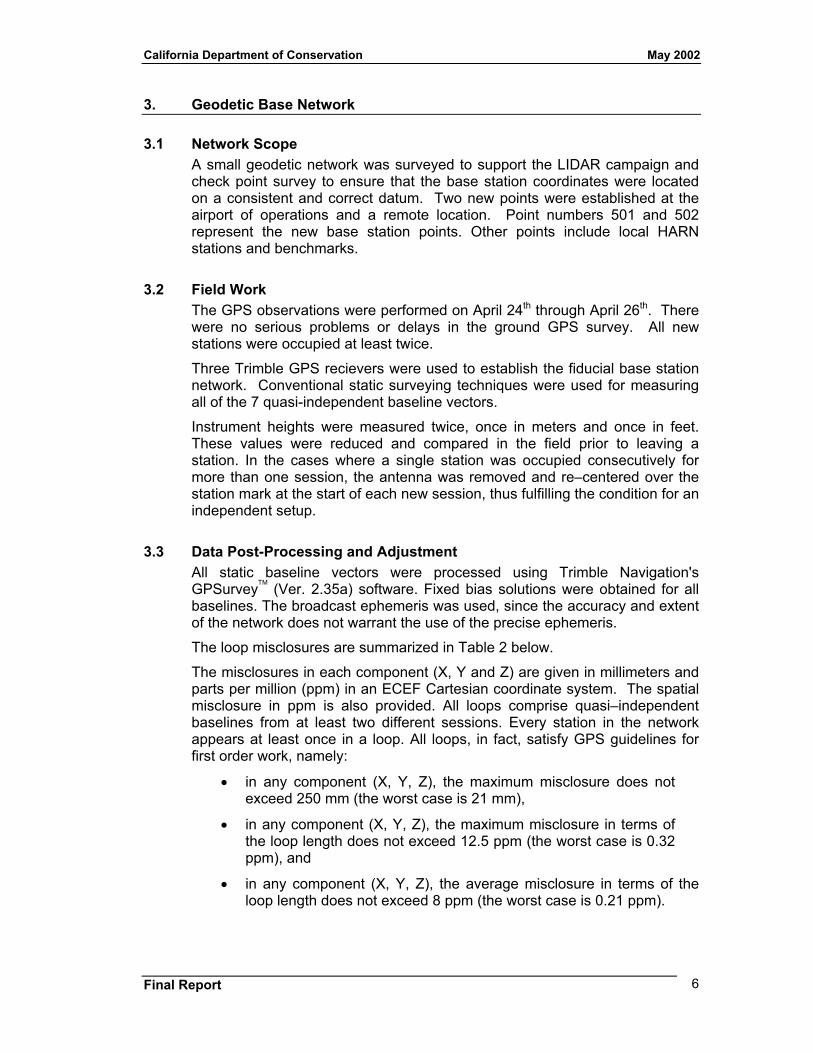
3.1 NETWORK SCOPE ................................................................................................................6 3.2 FIELD WORK........................................................................................................................6 3.3 DATA POST-PROCESSING AND ADJUSTMENT.........................................................................6
4. LIDAR DATA CAPTURE........................................................................................................9
4.1 FIELD WORK / PROCEDURES ................................................................................................9 4.2 DAILY RUNWAY PERFORMANCE / DATA VALIDATION TESTS ....................................................9 4.3 FINAL LIDAR PROCESSING ................................................................................................10
5. CHECK POINT DATA ..........................................................................................................11
5.1 CHECK-POINT SCOPE.........................................................................................................11 5.2 FIELD WORK......................................................................................................................11 5.3 DATA POST-PROCESSING AND ADJUSTMENT.......................................................................11 5.4 CHECK-POINT RESIDUALS AND STATISTICS..........................................................................14
6. FINAL COORDINATES AND DELIVERIES ........................................................................18
LIST OF FIGURES FIGURE 1. CALIBRATION PASS 1....................................................................................................3 FIGURE 2. CALIBRATION PASS 2....................................................................................................3 FIGURE 3. RUNWAY CALIBRATION .................................................................................................4 FIGURE 4. RUNWAY CALIBRATION RESULTS...................................................................................5 FIGURE 5. FIDUCIAL NETWORK DIAGRAM.......................................................................................7 FIGURE 6. CHECK-POINT NETWORK DIAGRAM..............................................................................13
Final Report iii
California Department of Conservation May 2002
LIST OF TABLES TABLE 1. ALTM 1210 CALIBRATION PARAMETERS.........................................................................4 TABLE 2. FIDUCIAL SURVEY LOOP CLOSURE SUMMARY..................................................................7 TABLE 3. EXISTING NGRS CONTROL ............................................................................................8 TABLE 4. LIDAR ACQUISITION PARAMETERS .................................................................................9 TABLE 5. RUNWAY VALIDATION RESULTS.....................................................................................10 TABLE 6. CHECK-POINT SURVEY LOOP CLOSURE SUMMARY.........................................................12 TABLE 7. CHECK-POINT RESIDUAL SUMMARY...............................................................................14 TABLE 8. CHECK-POINT STATISTICS ............................................................................................15 TABLE 9. ADJUSTED CHECK-POINT RESIDUAL SUMMARY..............................................................16 TABLE 10. ADJUSTED CHECK-POINT STATISTICS..........................................................................17
Final Report iv
California Department of Conservation May 2002
1. INTRODUCTION This report contains the technical write-up of the various phases of the California Department of Conservation LIDAR campaign, including system calibration techniques, the establishment of base stations and check points by differential GPS network surveys, and the collection and post-processing of the LIDAR data.
The major tasks of the campaign included the surveying of a small, geodetic control network in the project area to establish base stations, the surveying of the check points, the collection and post-processing of the airborne GPS data, and the collection and post-processing of the LIDAR data.
1.1 Duration/Time Period The fiducial and check point survey networks were established during the period April 24 through April 27, 2002. The LIDAR aircraft arrived on site May 8th and the LIDAR data collection was accomplished on May 11th.
1.2 Contact Questions regarding the technical aspects of this report should be addressed to:
Sanborn 1935 Jamboree Drive Colorado Springs, CO 80920 Attention: ----------- Keith Kirkby Telephone: --------- 1–719-593-0093 FAX: ----------------- 1–719-528-5093 email:----------------- [email protected]
1.3 Purpose of the Survey This LIDAR operation, based on existing NGRS control, was designed to provide a dense set of masspoints within the defined areas. The data are suitable for the development of a local DEM to support subsequent operations such as land-slide studies, orthometric photo rectification, and contouring.
1.4 Project Location The primary project location is in northern California and covers approximately 50 square miles. The project area includes a portion of the Highway 299 cooridor between Blue Lake and Willow Creek. The Arcata airport, located approximately 10 miles West of the project area, was used as the airfield of operations.
Final Report 1
California Department of Conservation May 2002
1.5 Project Scope The California Department of Conservation LIDAR campaign was designed specifically to collect LIDAR derived masspoints at an approximate spacing of 2.0 meters within the project areas. The data were filtered/classified to extract ground (terrain) points using Terrasolid’s Terrascan classification software. Rigorous quality assurance procedures were followed to ensure that the appropriate data accuracy was achieved. Deliveries include ASCII and ArcView files of the filtered and unfiltered LIDAR data, a regular grid DEM, and a 3-dimensional rendering of the DEM.
1.6 Datum Issues The datums are realized or implicitly defined by the actual physical monuments used as constraints in the base station control network and by the published coordinates and heights used in the network adjustment.
1.6.1 Horizontal Datum The horizontal datum is NAD83(1992), as realized by the physical control points HPGN CA 01 15 (PID = LV1173), HPGN D CA 01 RD (PID = AB5453), J 1402 (PID = LU1702), and HPGN CA 01 09 (PID = LV1170; adjusted from epoch of 1998) and their associated published coordinates.
1.6.2 Vertical Datum The vertical datum is the NAVD88, as realized by the physical benchmarks J 520 (PID = LV0322) and J 1402 (PID = LU1702), and their associated published elevations.
Final Report 2
California Department of Conservation May 2002
2. LIDAR CALIBRATION
2.1 Introduction The following procedures are intended to eliminate blunders in the field and office work, and are designed to detect the presence of horizontal and vertical datum inconsistencies. The emphasis is not only on the quality control (QC) aspects, but also on the documentation, i.e., on the quality assurance (QA).
2.2 Calibration Procedures
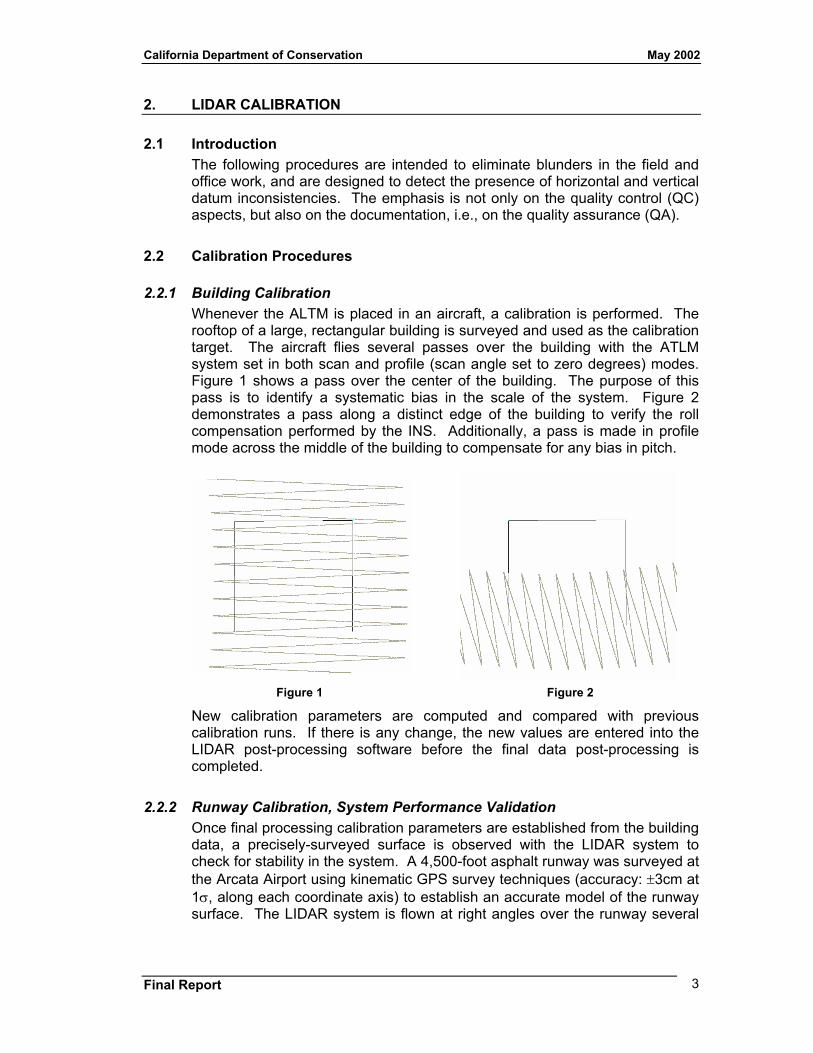
2.2.1 Building Calibration Whenever the ALTM is placed in an aircraft, a calibration is performed. The rooftop of a large, rectangular building is surveyed and used as the calibration target. The aircraft flies several passes over the building with the ATLM system set in both scan and profile (scan angle set to zero degrees) modes. Figure 1 shows a pass over the center of the building. The purpose of this pass is to identify a systematic bias in the scale of the system. Figure 2 demonstrates a pass along a distinct edge of the building to verify the roll compensation performed by the INS. Additionally, a pass is made in profile mode across the middle of the building to compensate for any bias in pitch.
Figure 1 Figure 2
New calibration parameters are computed and compared with previous calibration runs. If there is any change, the new values are entered into the LIDAR post-processing software before the final data post-processing is completed.
2.2.2 Runway Calibration, System Performance Validation Once final processing calibration parameters are established from the building data, a precisely-surveyed surface is observed with the LIDAR system to check for stability in the system. A 4,500-foot asphalt runway was surveyed at the Arcata Airport using kinematic GPS survey techniques (accuracy: ±3cm at 1σ, along each coordinate axis) to establish an accurate model of the runway surface. The LIDAR system is flown at right angles over the runway several
Final Report 3
California Department of Conservation May 2002
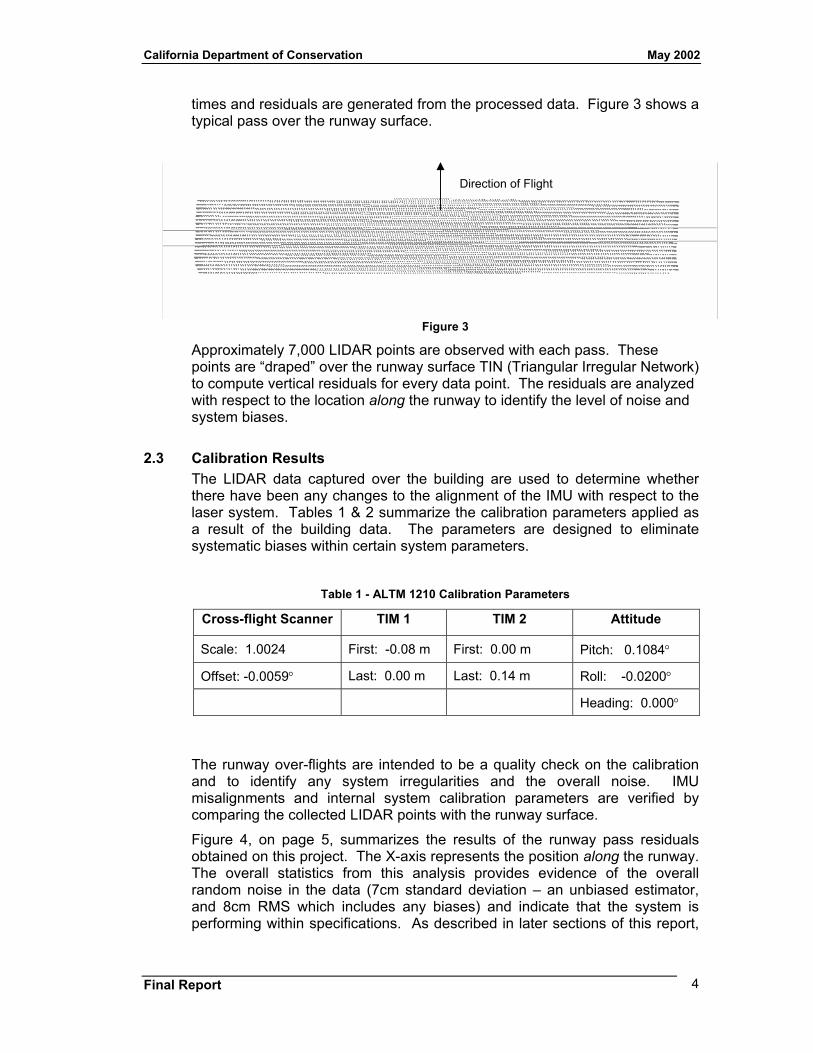
times and residuals are generated from the processed data. Figure 3 shows a typical pass over the runway surface.
Direction of Flight
Figure 3
Approximately 7,000 LIDAR points are observed with each pass. These points are “draped” over the runway surface TIN (Triangular Irregular Network) to compute vertical residuals for every data point. The residuals are analyzed with respect to the location along the runway to identify the level of noise and system biases.
2.3 Calibration Results The LIDAR data captured over the building are used to determine whether there have been any changes to the alignment of the IMU with respect to the laser system. Tables 1 & 2 summarize the calibration parameters applied as a result of the building data. The parameters are designed to eliminate systematic biases within certain system parameters.
Table 1 - ALTM 1210 Calibration Parameters
Cross-flight Scanner TIM 1 TIM 2 Attitude
Scale: 1.0024 First: -0.08 m First: 0.00 m Pitch: 0.1084°
Offset: -0.0059° Last: 0.00 m Last: 0.14 m Roll: -0.0200°
Heading: 0.000°
The runway over-flights are intended to be a quality check on the calibration and to identify any system irregularities and the overall noise. IMU misalignments and internal system calibration parameters are verified by comparing the collected LIDAR points with the runway surface.
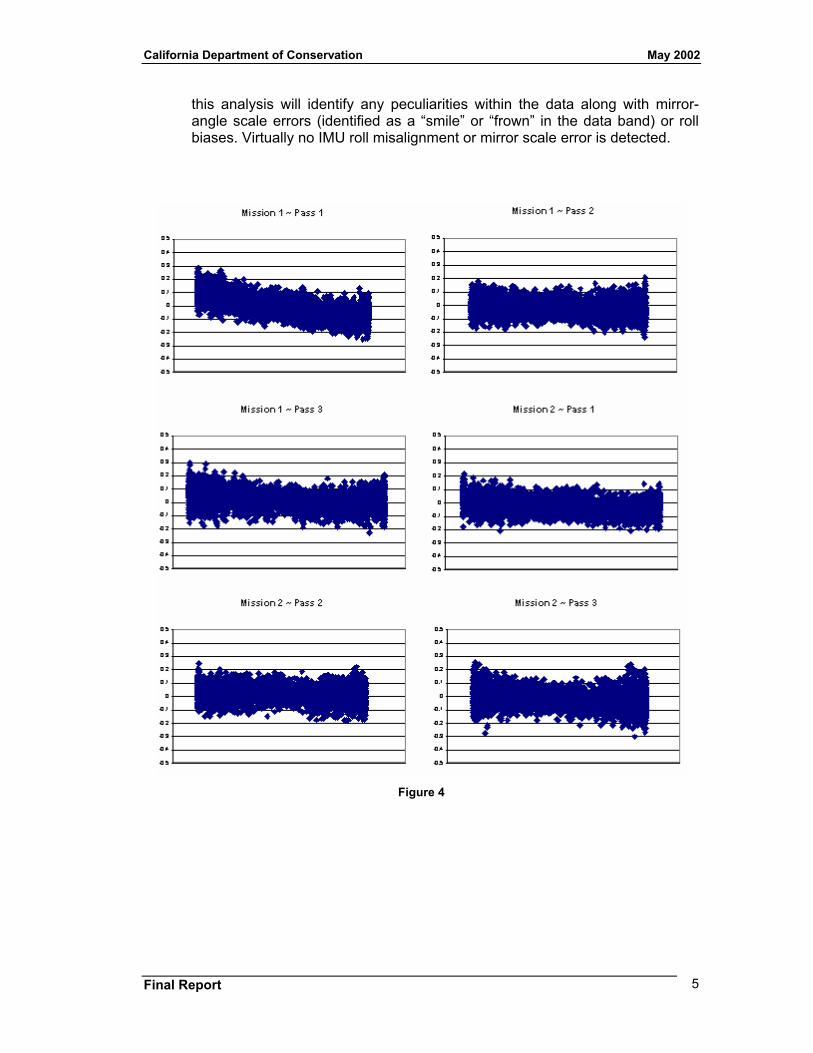
Figure 4, on page 5, summarizes the results of the runway pass residuals obtained on this project. The X-axis represents the position along the runway. The overall statistics from this analysis provides evidence of the overall random noise in the data (7cm standard deviation – an unbiased estimator, and 8cm RMS which includes any biases) and indicate that the system is performing within specifications. As described in later sections of this report,
Final Report 4
California Department of Conservation May 2002
this analysis will identify any peculiarities within the data along with mirror-angle scale errors (identified as a “smile” or “frown” in the data band) or roll biases. Virtually no IMU roll misalignment or mirror scale error is detected.
Figure 4
Final Report 5
California Department of Conservation May 2002
3. Geodetic Base Network
3.1 Network Scope A small geodetic network was surveyed to support the LIDAR campaign and check point survey to ensure that the base station coordinates were located on a consistent and correct datum. Two new points were established at the airport of operations and a remote location. Point numbers 501 and 502 represent the new base station points. Other points include local HARN stations and benchmarks.
3.2 Field Work The GPS observations were performed on April 24th through April 26th. There were no serious problems or delays in the ground GPS survey. All new stations were occupied at least twice.
Three Trimble GPS recievers were used to establish the fiducial base station network. Conventional static surveying techniques were used for measuring all of the 7 quasi-independent baseline vectors.
Instrument heights were measured twice, once in meters and once in feet. These values were reduced and compared in the field prior to leaving a station. In the cases where a single station was occupied consecutively for more than one session, the antenna was removed and re–centered over the station mark at the start of each new session, thus fulfilling the condition for an independent setup.
3.3 Data Post-Processing and Adjustment All static baseline vectors were processed using Trimble Navigation's GPSurveyTM (Ver. 2.35a) software. Fixed bias solutions were obtained for all baselines. The broadcast ephemeris was used, since the accuracy and extent of the network does not warrant the use of the precise ephemeris.
The loop misclosures are summarized in Table 2 below.
The misclosures in each component (X, Y and Z) are given in millimeters and parts per million (ppm) in an ECEF Cartesian coordinate system. The spatial misclosure in ppm is also provided. All loops comprise quasi–independent baselines from at least two different sessions. Every station in the network appears at least once in a loop. All loops, in fact, satisfy GPS guidelines for first order work, namely:
• in any component (X, Y, Z), the maximum misclosure does not exceed 250 mm (the worst case is 21 mm),
• in any component (X, Y, Z), the maximum misclosure in terms of the loop length does not exceed 12.5 ppm (the worst case is 0.32 ppm), and
• in any component (X, Y, Z), the average misclosure in terms of the loop length does not exceed 8 ppm (the worst case is 0.21 ppm).
Final Report 6
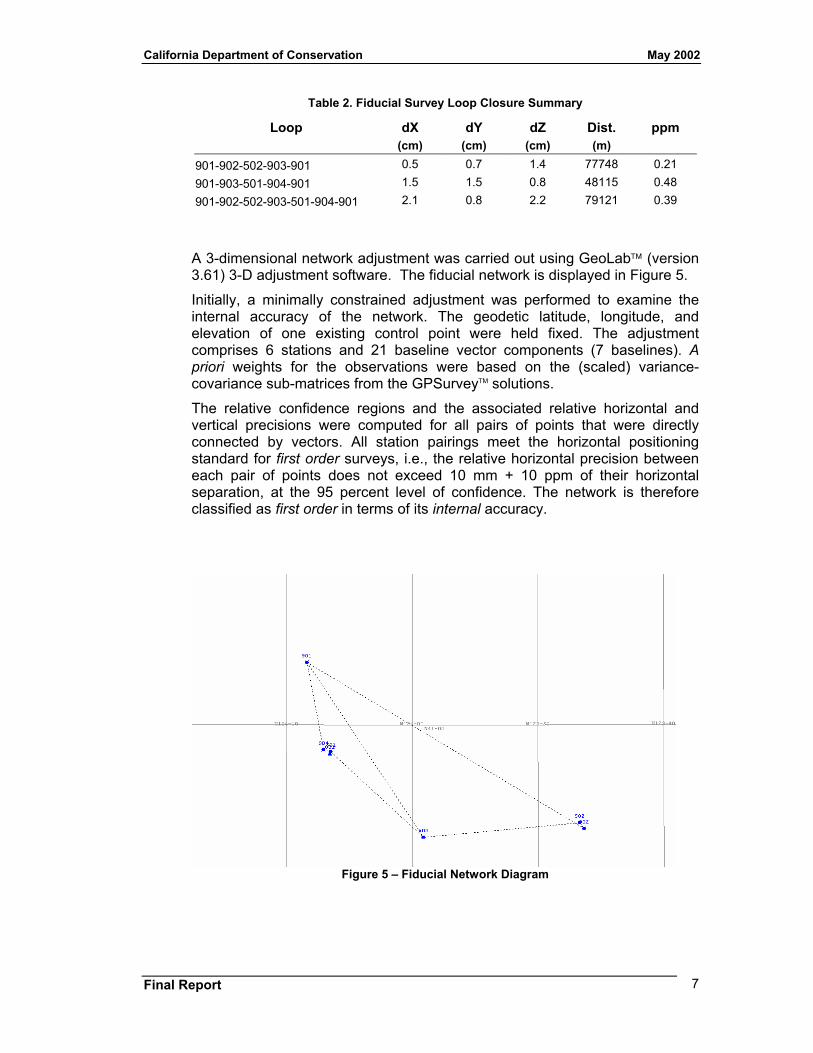
California Department of Conservation May 2002
Table 2. Fiducial Survey Loop Closure Summary
Loop dX dY dZ Dist. ppm (cm) (cm) (cm) (m)
901-902-502-903-901 0.5 0.7 1.4 77748 0.21 901-903-501-904-901 1.5 1.5 0.8 48115 0.48 901-902-502-903-501-904-901 2.1 0.8 2.2 79121 0.39
A 3-dimensional network adjustment was carried out using GeoLab (version 3.61) 3-D adjustment software. The fiducial network is displayed in Figure 5.
Initially, a minimally constrained adjustment was performed to examine the internal accuracy of the network. The geodetic latitude, longitude, and elevation of one existing control point were held fixed. The adjustment comprises 6 stations and 21 baseline vector components (7 baselines). A priori weights for the observations were based on the (scaled) variance-covariance sub-matrices from the GPSurveyTM solutions.
The relative confidence regions and the associated relative horizontal and vertical precisions were computed for all pairs of points that were directly connected by vectors. All station pairings meet the horizontal positioning standard for first order surveys, i.e., the relative horizontal precision between each pair of points does not exceed 10 mm + 10 ppm of their horizontal separation, at the 95 percent level of confidence. The network is therefore classified as first order in terms of its internal accuracy.
Figure 5 – Fiducial Network Diagram
Final Report 7
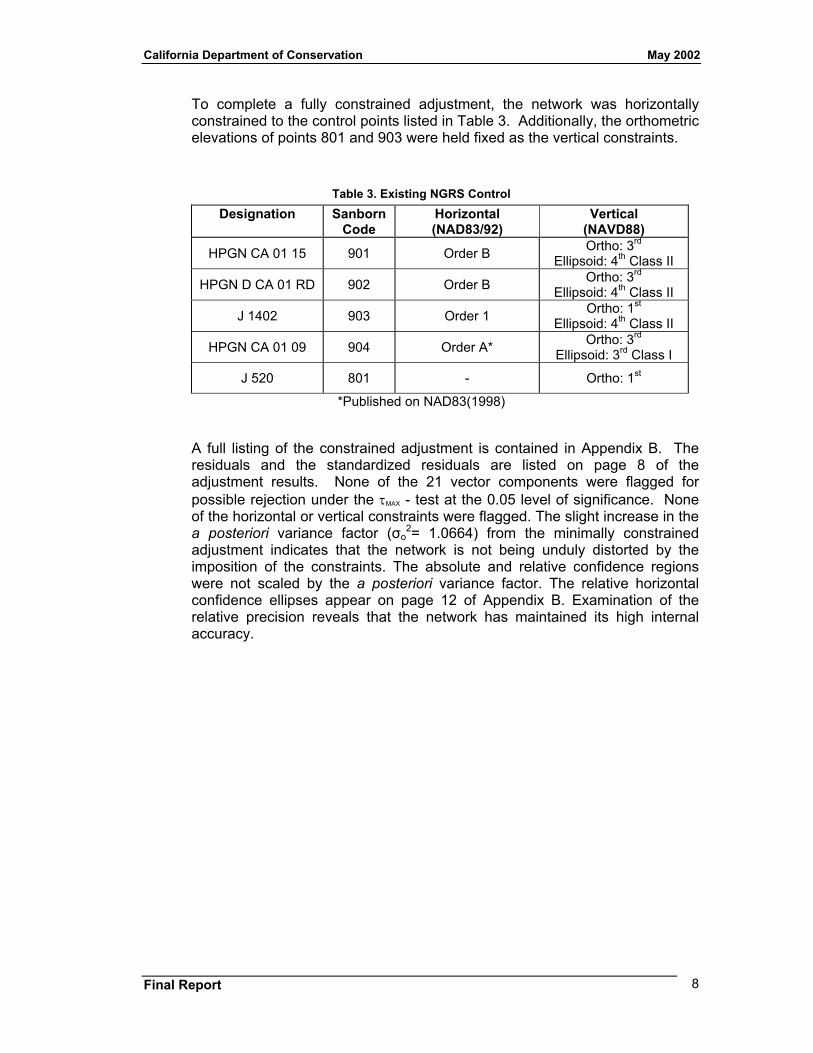
California Department of Conservation May 2002
To complete a fully constrained adjustment, the network was horizontally constrained to the control points listed in Table 3. Additionally, the orthometric elevations of points 801 and 903 were held fixed as the vertical constraints.
Table 3. Existing NGRS Control Designation Sanborn
Code Horizontal (NAD83/92)
Vertical (NAVD88)
HPGN CA 01 15 901 Order B Ortho: 3rd Ellipsoid: 4th Class II
HPGN D CA 01 RD 902 Order B Ortho: 3rd Ellipsoid: 4th Class II
J 1402 903 Order 1 Ortho: 1st Ellipsoid: 4th Class II
HPGN CA 01 09 904 Order A* Ortho: 3rd Ellipsoid: 3rd Class I
J 520 801 - Ortho: 1st
*Published on NAD83(1998)
A full listing of the constrained adjustment is contained in Appendix B. The residuals and the standardized residuals are listed on page 8 of the adjustment results. None of the 21 vector components were flagged for possible rejection under the τMAX - test at the 0.05 level of significance. None of the horizontal or vertical constraints were flagged. The slight increase in the a posteriori variance factor (σo
2= 1.0664) from the minimally constrained adjustment indicates that the network is not being unduly distorted by the imposition of the constraints. The absolute and relative confidence regions were not scaled by the a posteriori variance factor. The relative horizontal confidence ellipses appear on page 12 of Appendix B. Examination of the relative precision reveals that the network has maintained its high internal accuracy.
Final Report 8
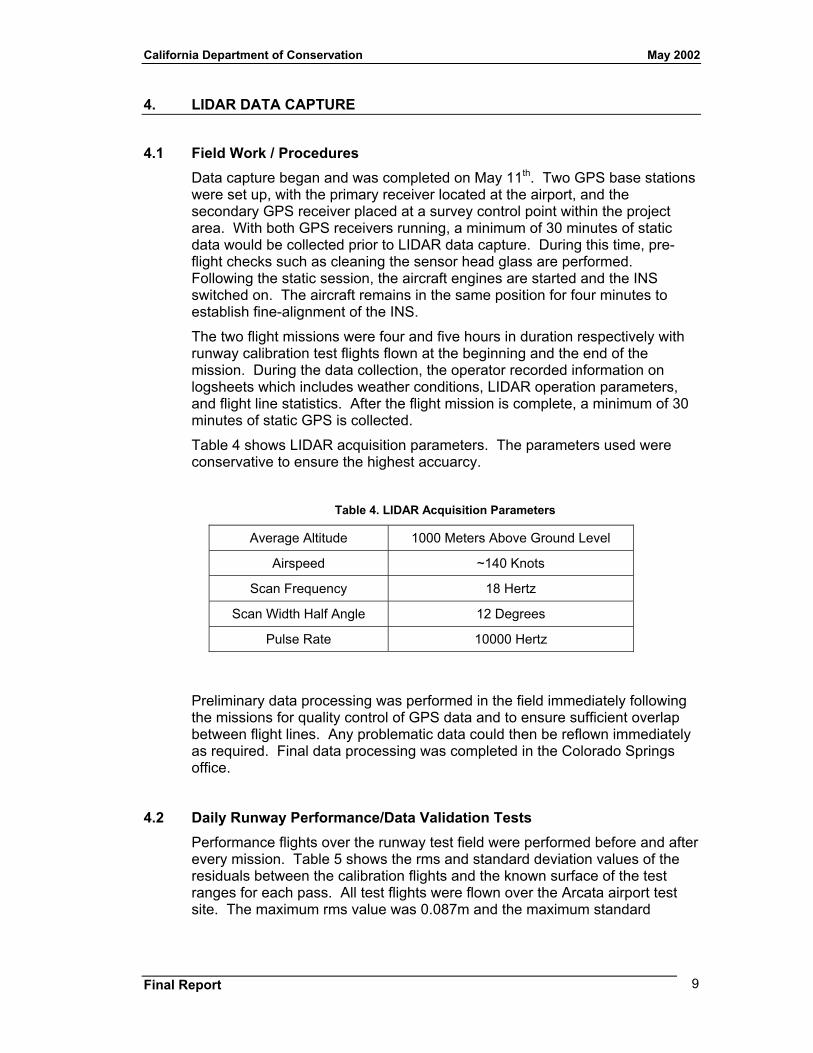
California Department of Conservation May 2002
4. LIDAR DATA CAPTURE 4.1 Field Work / Procedures
Data capture began and was completed on May 11th. Two GPS base stations were set up, with the primary receiver located at the airport, and the secondary GPS receiver placed at a survey control point within the project area. With both GPS receivers running, a minimum of 30 minutes of static data would be collected prior to LIDAR data capture. During this time, pre-flight checks such as cleaning the sensor head glass are performed. Following the static session, the aircraft engines are started and the INS switched on. The aircraft remains in the same position for four minutes to establish fine-alignment of the INS.
The two flight missions were four and five hours in duration respectively with runway calibration test flights flown at the beginning and the end of the mission. During the data collection, the operator recorded information on logsheets which includes weather conditions, LIDAR operation parameters, and flight line statistics. After the flight mission is complete, a minimum of 30 minutes of static GPS is collected.
Table 4 shows LIDAR acquisition parameters. The parameters used were conservative to ensure the highest accuarcy.
Table 4. LIDAR Acquisition Parameters
Average Altitude 1000 Meters Above Ground Level
Airspeed ~140 Knots
Scan Frequency 18 Hertz
Scan Width Half Angle 12 Degrees
Pulse Rate 10000 Hertz
Preliminary data processing was performed in the field immediately following the missions for quality control of GPS data and to ensure sufficient overlap between flight lines. Any problematic data could then be reflown immediately as required. Final data processing was completed in the Colorado Springs office.
4.2 Daily Runway Performance/Data Validation Tests Performance flights over the runway test field were performed before and after every mission. Table 5 shows the rms and standard deviation values of the residuals between the calibration flights and the known surface of the test ranges for each pass. All test flights were flown over the Arcata airport test site. The maximum rms value was 0.087m and the maximum standard
Final Report 9
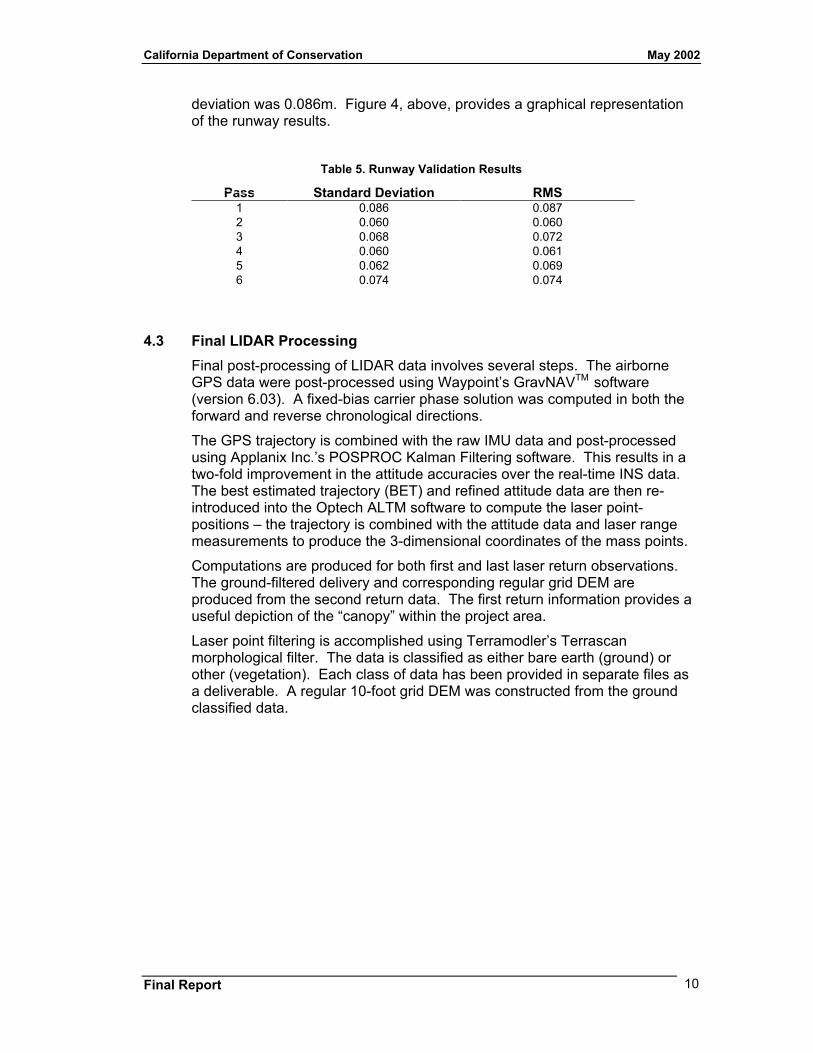
California Department of Conservation May 2002
deviation was 0.086m. Figure 4, above, provides a graphical representation of the runway results.
Table 5. Runway Validation Results
Pass Standard Deviation RMS 1 0.086 0.087 2 0.060 0.060 3 0.068 0.072 4 0.060 0.061 5 0.062 0.069 6 0.074 0.074
4.3 Final LIDAR Processing Final post-processing of LIDAR data involves several steps. The airborne GPS data were post-processed using Waypoint’s GravNAVTM software (version 6.03). A fixed-bias carrier phase solution was computed in both the forward and reverse chronological directions.
The GPS trajectory is combined with the raw IMU data and post-processed using Applanix Inc.’s POSPROC Kalman Filtering software. This results in a two-fold improvement in the attitude accuracies over the real-time INS data. The best estimated trajectory (BET) and refined attitude data are then re-introduced into the Optech ALTM software to compute the laser point-positions – the trajectory is combined with the attitude data and laser range measurements to produce the 3-dimensional coordinates of the mass points.
Computations are produced for both first and last laser return observations. The ground-filtered delivery and corresponding regular grid DEM are produced from the second return data. The first return information provides a useful depiction of the “canopy” within the project area.
Laser point filtering is accomplished using Terramodler’s Terrascan morphological filter. The data is classified as either bare earth (ground) or other (vegetation). Each class of data has been provided in separate files as a deliverable. A regular 10-foot grid DEM was constructed from the ground classified data.
Final Report 10
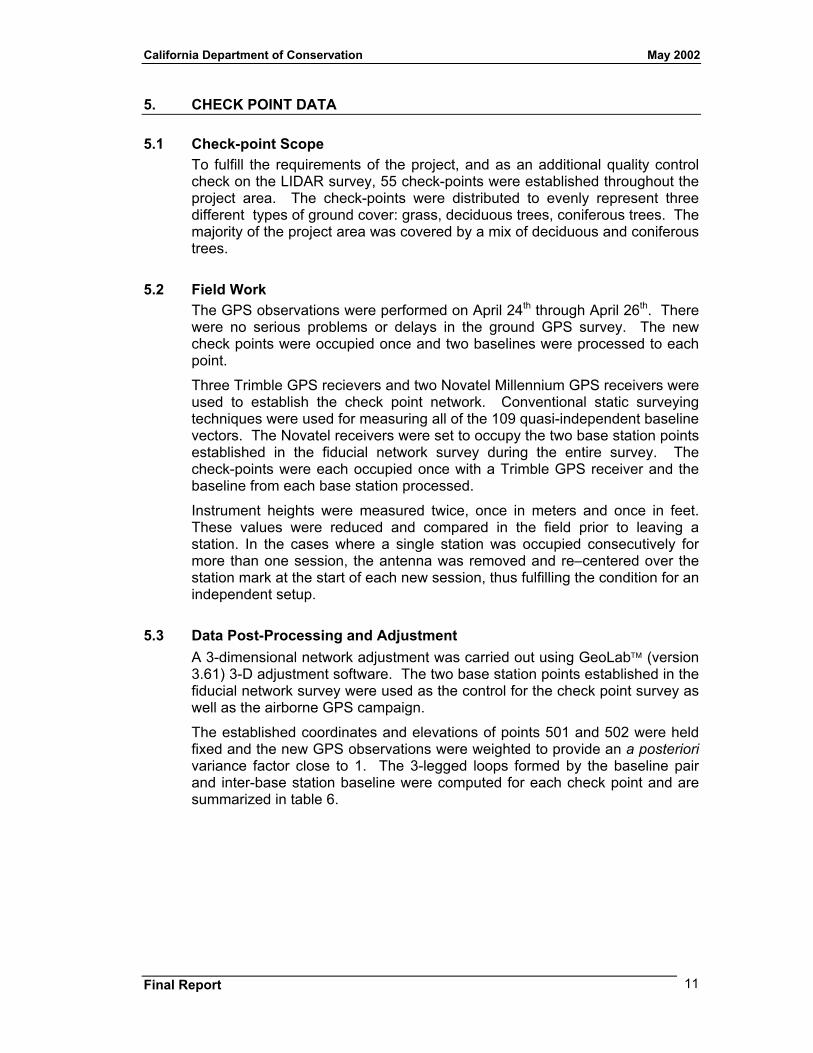
California Department of Conservation May 2002
5. CHECK POINT DATA
5.1 Check-point Scope To fulfill the requirements of the project, and as an additional quality control check on the LIDAR survey, 55 check-points were established throughout the project area. The check-points were distributed to evenly represent three different types of ground cover: grass, deciduous trees, coniferous trees. The majority of the project area was covered by a mix of deciduous and coniferous trees.
5.2 Field Work The GPS observations were performed on April 24th through April 26th. There were no serious problems or delays in the ground GPS survey. The new check points were occupied once and two baselines were processed to each point.
Three Trimble GPS recievers and two Novatel Millennium GPS receivers were used to establish the check point network. Conventional static surveying techniques were used for measuring all of the 109 quasi-independent baseline vectors. The Novatel receivers were set to occupy the two base station points established in the fiducial network survey during the entire survey. The check-points were each occupied once with a Trimble GPS receiver and the baseline from each base station processed.
Instrument heights were measured twice, once in meters and once in feet. These values were reduced and compared in the field prior to leaving a station. In the cases where a single station was occupied consecutively for more than one session, the antenna was removed and re–centered over the station mark at the start of each new session, thus fulfilling the condition for an independent setup.
5.3 Data Post-Processing and Adjustment A 3-dimensional network adjustment was carried out using GeoLab (version 3.61) 3-D adjustment software. The two base station points established in the fiducial network survey were used as the control for the check point survey as well as the airborne GPS campaign.
The established coordinates and elevations of points 501 and 502 were held fixed and the new GPS observations were weighted to provide an a posteriori variance factor close to 1. The 3-legged loops formed by the baseline pair and inter-base station baseline were computed for each check point and are summarized in table 6.
Final Report 11
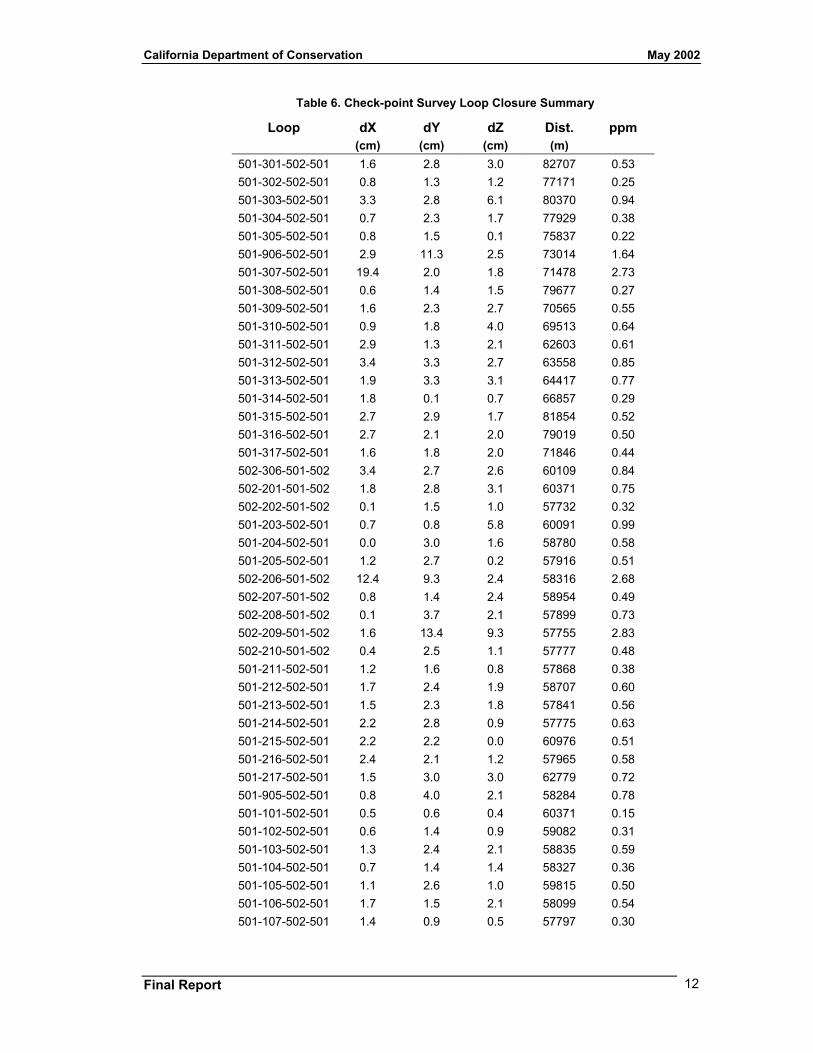
California Department of Conservation May 2002
Table 6. Check-point Survey Loop Closure Summary
Loop dX dY dZ Dist. ppm (cm) (cm) (cm) (m)
501-301-502-501 1.6 2.8 3.0 82707 0.53 501-302-502-501 0.8 1.3 1.2 77171 0.25 501-303-502-501 3.3 2.8 6.1 80370 0.94 501-304-502-501 0.7 2.3 1.7 77929 0.38 501-305-502-501 0.8 1.5 0.1 75837 0.22 501-906-502-501 2.9 11.3 2.5 73014 1.64 501-307-502-501 19.4 2.0 1.8 71478 2.73 501-308-502-501 0.6 1.4 1.5 79677 0.27 501-309-502-501 1.6 2.3 2.7 70565 0.55 501-310-502-501 0.9 1.8 4.0 69513 0.64 501-311-502-501 2.9 1.3 2.1 62603 0.61 501-312-502-501 3.4 3.3 2.7 63558 0.85 501-313-502-501 1.9 3.3 3.1 64417 0.77 501-314-502-501 1.8 0.1 0.7 66857 0.29 501-315-502-501 2.7 2.9 1.7 81854 0.52 501-316-502-501 2.7 2.1 2.0 79019 0.50 501-317-502-501 1.6 1.8 2.0 71846 0.44 502-306-501-502 3.4 2.7 2.6 60109 0.84 502-201-501-502 1.8 2.8 3.1 60371 0.75 502-202-501-502 0.1 1.5 1.0 57732 0.32 501-203-502-501 0.7 0.8 5.8 60091 0.99 501-204-502-501 0.0 3.0 1.6 58780 0.58 501-205-502-501 1.2 2.7 0.2 57916 0.51 502-206-501-502 12.4 9.3 2.4 58316 2.68 502-207-501-502 0.8 1.4 2.4 58954 0.49 502-208-501-502 0.1 3.7 2.1 57899 0.73 502-209-501-502 1.6 13.4 9.3 57755 2.83 502-210-501-502 0.4 2.5 1.1 57777 0.48 501-211-502-501 1.2 1.6 0.8 57868 0.38 501-212-502-501 1.7 2.4 1.9 58707 0.60 501-213-502-501 1.5 2.3 1.8 57841 0.56 501-214-502-501 2.2 2.8 0.9 57775 0.63 501-215-502-501 2.2 2.2 0.0 60976 0.51 501-216-502-501 2.4 2.1 1.2 57965 0.58 501-217-502-501 1.5 3.0 3.0 62779 0.72 501-905-502-501 0.8 4.0 2.1 58284 0.78 501-101-502-501 0.5 0.6 0.4 60371 0.15 501-102-502-501 0.6 1.4 0.9 59082 0.31 501-103-502-501 1.3 2.4 2.1 58835 0.59 501-104-502-501 0.7 1.4 1.4 58327 0.36 501-105-502-501 1.1 2.6 1.0 59815 0.50 501-106-502-501 1.7 1.5 2.1 58099 0.54 501-107-502-501 1.4 0.9 0.5 57797 0.30
Final Report 12
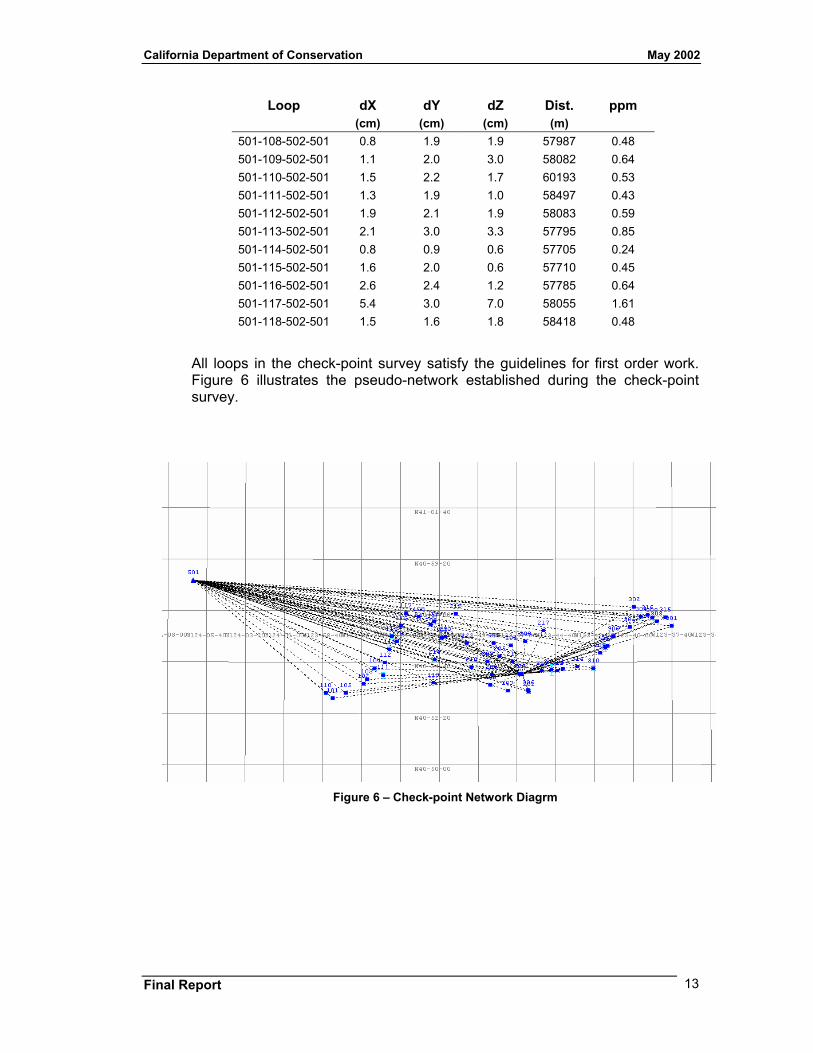
California Department of Conservation May 2002
Loop dX dY dZ Dist. ppm (cm) (cm) (cm) (m)
501-108-502-501 0.8 1.9 1.9 57987 0.48 501-109-502-501 1.1 2.0 3.0 58082 0.64 501-110-502-501 1.5 2.2 1.7 60193 0.53 501-111-502-501 1.3 1.9 1.0 58497 0.43 501-112-502-501 1.9 2.1 1.9 58083 0.59 501-113-502-501 2.1 3.0 3.3 57795 0.85 501-114-502-501 0.8 0.9 0.6 57705 0.24 501-115-502-501 1.6 2.0 0.6 57710 0.45 501-116-502-501 2.6 2.4 1.2 57785 0.64 501-117-502-501 5.4 3.0 7.0 58055 1.61 501-118-502-501 1.5 1.6 1.8 58418 0.48
All loops in the check-point survey satisfy the guidelines for first order work. Figure 6 illustrates the pseudo-network established during the check-point survey.
Figure 6 – Check-point Network Diagrm
Final Report 13
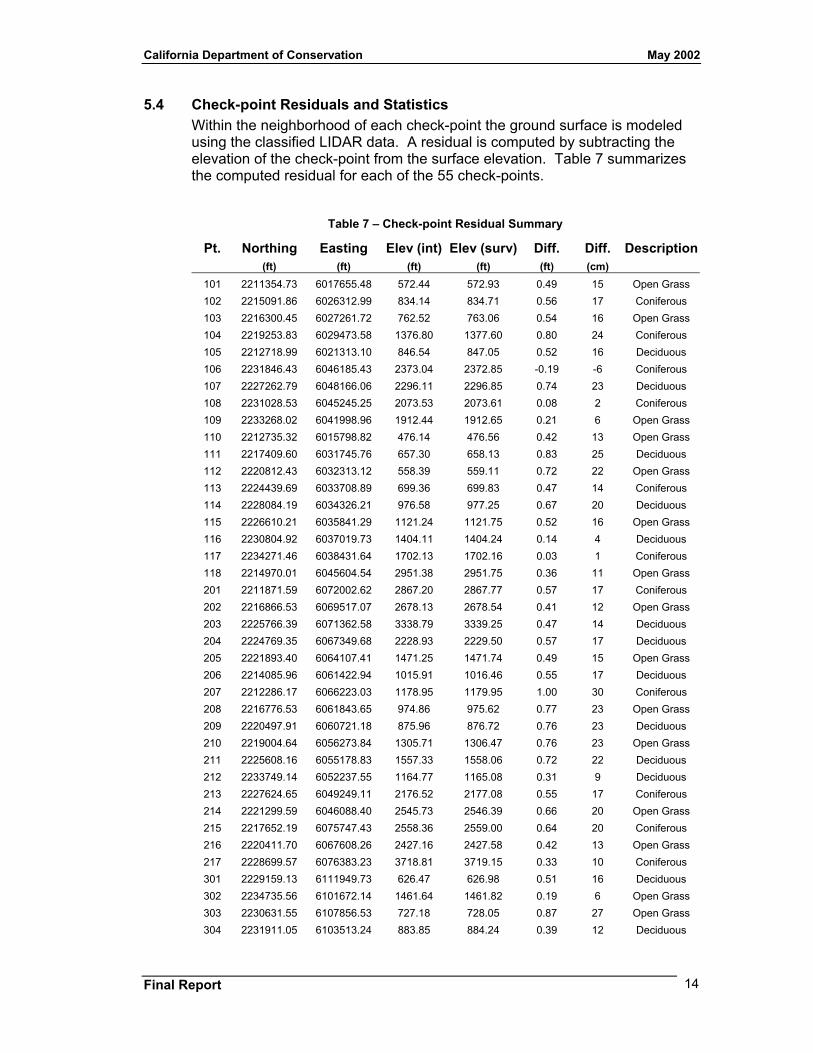
California Department of Conservation May 2002
5.4 Check-point Residuals and Statistics Within the neighborhood of each check-point the ground surface is modeled using the classified LIDAR data. A residual is computed by subtracting the elevation of the check-point from the surface elevation. Table 7 summarizes the computed residual for each of the 55 check-points.
Table 7 – Check-point Residual Summary
Pt. Northing Easting Elev (int) Elev (surv) Diff. Diff. Description (ft) (ft) (ft) (ft) (ft) (cm)
101 2211354.73 6017655.48 572.44 572.93 0.49 15 Open Grass 102 2215091.86 6026312.99 834.14 834.71 0.56 17 Coniferous 103 2216300.45 6027261.72 762.52 763.06 0.54 16 Open Grass 104 2219253.83 6029473.58 1376.80 1377.60 0.80 24 Coniferous 105 2212718.99 6021313.10 846.54 847.05 0.52 16 Deciduous 106 2231846.43 6046185.43 2373.04 2372.85 -0.19 -6 Coniferous 107 2227262.79 6048166.06 2296.11 2296.85 0.74 23 Deciduous 108 2231028.53 6045245.25 2073.53 2073.61 0.08 2 Coniferous 109 2233268.02 6041998.96 1912.44 1912.65 0.21 6 Open Grass 110 2212735.32 6015798.82 476.14 476.56 0.42 13 Open Grass 111 2217409.60 6031745.76 657.30 658.13 0.83 25 Deciduous 112 2220812.43 6032313.12 558.39 559.11 0.72 22 Open Grass 113 2224439.69 6033708.89 699.36 699.83 0.47 14 Coniferous 114 2228084.19 6034326.21 976.58 977.25 0.67 20 Deciduous 115 2226610.21 6035841.29 1121.24 1121.75 0.52 16 Open Grass 116 2230804.92 6037019.73 1404.11 1404.24 0.14 4 Deciduous 117 2234271.46 6038431.64 1702.13 1702.16 0.03 1 Coniferous 118 2214970.01 6045604.54 2951.38 2951.75 0.36 11 Open Grass 201 2211871.59 6072002.62 2867.20 2867.77 0.57 17 Coniferous 202 2216866.53 6069517.07 2678.13 2678.54 0.41 12 Open Grass 203 2225766.39 6071362.58 3338.79 3339.25 0.47 14 Deciduous 204 2224769.35 6067349.68 2228.93 2229.50 0.57 17 Deciduous 205 2221893.40 6064107.41 1471.25 1471.74 0.49 15 Open Grass 206 2214085.96 6061422.94 1015.91 1016.46 0.55 17 Deciduous 207 2212286.17 6066223.03 1178.95 1179.95 1.00 30 Coniferous 208 2216776.53 6061843.65 974.86 975.62 0.77 23 Open Grass 209 2220497.91 6060721.18 875.96 876.72 0.76 23 Deciduous 210 2219004.64 6056273.84 1305.71 1306.47 0.76 23 Open Grass 211 2225608.16 6055178.83 1557.33 1558.06 0.72 22 Deciduous 212 2233749.14 6052237.55 1164.77 1165.08 0.31 9 Deciduous 213 2227624.65 6049249.11 2176.52 2177.08 0.55 17 Coniferous 214 2221299.59 6046088.40 2545.73 2546.39 0.66 20 Open Grass 215 2217652.19 6075747.43 2558.36 2559.00 0.64 20 Coniferous 216 2220411.70 6067608.26 2427.16 2427.58 0.42 13 Open Grass 217 2228699.57 6076383.23 3718.81 3719.15 0.33 10 Coniferous 301 2229159.13 6111949.73 626.47 626.98 0.51 16 Deciduous 302 2234735.56 6101672.14 1461.64 1461.82 0.19 6 Open Grass 303 2230631.55 6107856.53 727.18 728.05 0.87 27 Open Grass 304 2231911.05 6103513.24 883.85 884.24 0.39 12 Deciduous
Final Report 14
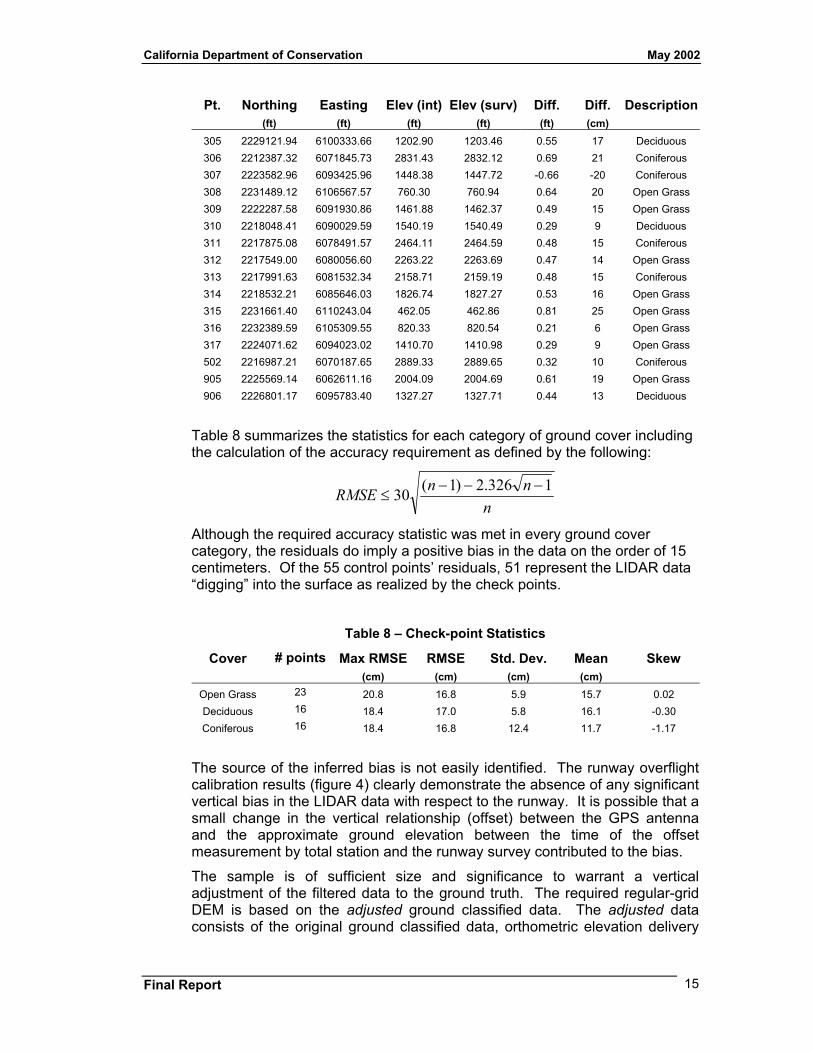
California Department of Conservation May 2002
Pt. Northing Easting Elev (int) Elev (surv) Diff. Diff. Description (ft) (ft) (ft) (ft) (ft) (cm)
305 2229121.94 6100333.66 1202.90 1203.46 0.55 17 Deciduous 306 2212387.32 6071845.73 2831.43 2832.12 0.69 21 Coniferous 307 2223582.96 6093425.96 1448.38 1447.72 -0.66 -20 Coniferous 308 2231489.12 6106567.57 760.30 760.94 0.64 20 Open Grass 309 2222287.58 6091930.86 1461.88 1462.37 0.49 15 Open Grass 310 2218048.41 6090029.59 1540.19 1540.49 0.29 9 Deciduous 311 2217875.08 6078491.57 2464.11 2464.59 0.48 15 Coniferous 312 2217549.00 6080056.60 2263.22 2263.69 0.47 14 Open Grass 313 2217991.63 6081532.34 2158.71 2159.19 0.48 15 Coniferous 314 2218532.21 6085646.03 1826.74 1827.27 0.53 16 Open Grass 315 2231661.40 6110243.04 462.05 462.86 0.81 25 Open Grass 316 2232389.59 6105309.55 820.33 820.54 0.21 6 Open Grass 317 2224071.62 6094023.02 1410.70 1410.98 0.29 9 Open Grass 502 2216987.21 6070187.65 2889.33 2889.65 0.32 10 Coniferous 905 2225569.14 6062611.16 2004.09 2004.69 0.61 19 Open Grass 906 2226801.17 6095783.40 1327.27 1327.71 0.44 13 Deciduous
Table 8 summarizes the statistics for each category of ground cover including the calculation of the accuracy requirement as defined by the following:
nnnRMSE 1326.2)1(30 −−−
≤
Although the required accuracy statistic was met in every ground cover category, the residuals do imply a positive bias in the data on the order of 15 centimeters. Of the 55 control points’ residuals, 51 represent the LIDAR data “digging” into the surface as realized by the check points.
Table 8 – Check-point Statistics
Cover # points Max RMSE RMSE Std. Dev. Mean Skew (cm) (cm) (cm) (cm)
Open Grass 23 20.8 16.8 5.9 15.7 0.02 Deciduous 16 18.4 17.0 5.8 16.1 -0.30 Coniferous 16 18.4 16.8 12.4 11.7 -1.17
The source of the inferred bias is not easily identified. The runway overflight calibration results (figure 4) clearly demonstrate the absence of any significant vertical bias in the LIDAR data with respect to the runway. It is possible that a small change in the vertical relationship (offset) between the GPS antenna and the approximate ground elevation between the time of the offset measurement by total station and the runway survey contributed to the bias.
The sample is of sufficient size and significance to warrant a vertical adjustment of the filtered data to the ground truth. The required regular-grid DEM is based on the adjusted ground classified data. The adjusted data consists of the original ground classified data, orthometric elevation delivery
Final Report 15
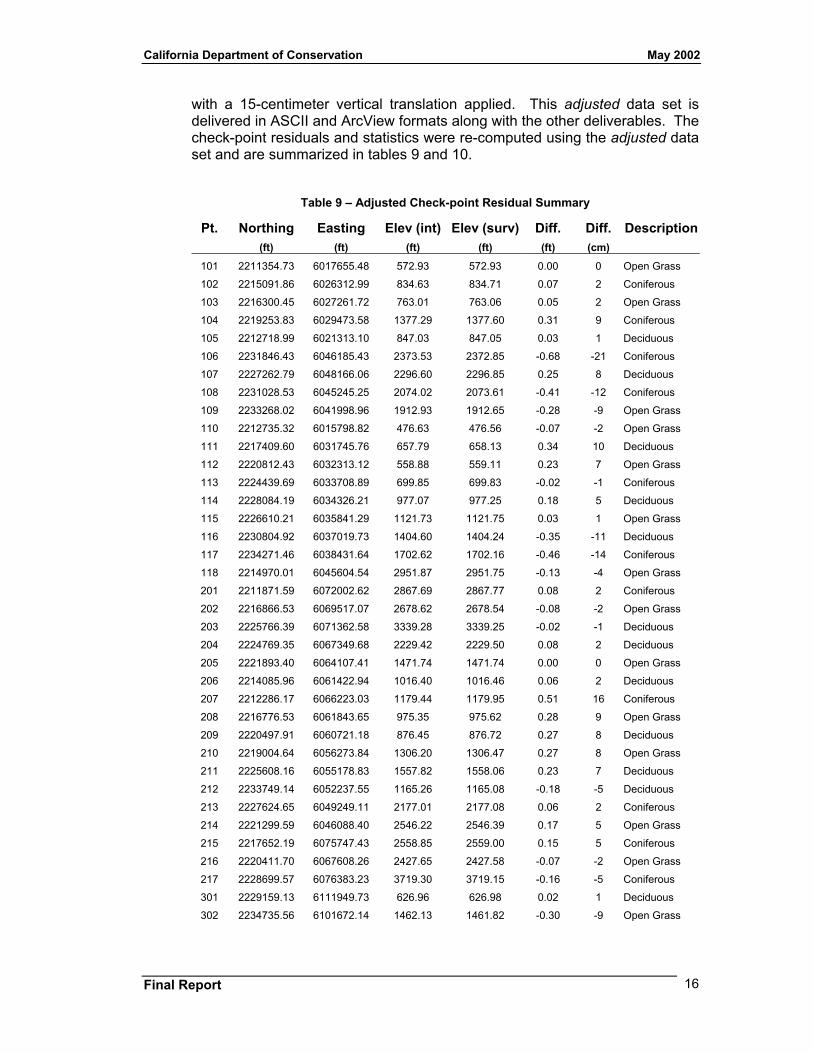
California Department of Conservation May 2002
with a 15-centimeter vertical translation applied. This adjusted data set is delivered in ASCII and ArcView formats along with the other deliverables. The check-point residuals and statistics were re-computed using the adjusted data set and are summarized in tables 9 and 10.
Table 9 – Adjusted Check-point Residual Summary
Pt. Northing Easting Elev (int) Elev (surv) Diff. Diff. Description (ft) (ft) (ft) (ft) (ft) (cm)
101 2211354.73 6017655.48 572.93 572.93 0.00 0 Open Grass
102 2215091.86 6026312.99 834.63 834.71 0.07 2 Coniferous
103 2216300.45 6027261.72 763.01 763.06 0.05 2 Open Grass
104 2219253.83 6029473.58 1377.29 1377.60 0.31 9 Coniferous
105 2212718.99 6021313.10 847.03 847.05 0.03 1 Deciduous
106 2231846.43 6046185.43 2373.53 2372.85 -0.68 -21 Coniferous
107 2227262.79 6048166.06 2296.60 2296.85 0.25 8 Deciduous
108 2231028.53 6045245.25 2074.02 2073.61 -0.41 -12 Coniferous
109 2233268.02 6041998.96 1912.93 1912.65 -0.28 -9 Open Grass
110 2212735.32 6015798.82 476.63 476.56 -0.07 -2 Open Grass
111 2217409.60 6031745.76 657.79 658.13 0.34 10 Deciduous
112 2220812.43 6032313.12 558.88 559.11 0.23 7 Open Grass
113 2224439.69 6033708.89 699.85 699.83 -0.02 -1 Coniferous
114 2228084.19 6034326.21 977.07 977.25 0.18 5 Deciduous
115 2226610.21 6035841.29 1121.73 1121.75 0.03 1 Open Grass
116 2230804.92 6037019.73 1404.60 1404.24 -0.35 -11 Deciduous
117 2234271.46 6038431.64 1702.62 1702.16 -0.46 -14 Coniferous
118 2214970.01 6045604.54 2951.87 2951.75 -0.13 -4 Open Grass
201 2211871.59 6072002.62 2867.69 2867.77 0.08 2 Coniferous
202 2216866.53 6069517.07 2678.62 2678.54 -0.08 -2 Open Grass
203 2225766.39 6071362.58 3339.28 3339.25 -0.02 -1 Deciduous
204 2224769.35 6067349.68 2229.42 2229.50 0.08 2 Deciduous
205 2221893.40 6064107.41 1471.74 1471.74 0.00 0 Open Grass
206 2214085.96 6061422.94 1016.40 1016.46 0.06 2 Deciduous
207 2212286.17 6066223.03 1179.44 1179.95 0.51 16 Coniferous
208 2216776.53 6061843.65 975.35 975.62 0.28 9 Open Grass
209 2220497.91 6060721.18 876.45 876.72 0.27 8 Deciduous
210 2219004.64 6056273.84 1306.20 1306.47 0.27 8 Open Grass
211 2225608.16 6055178.83 1557.82 1558.06 0.23 7 Deciduous
212 2233749.14 6052237.55 1165.26 1165.08 -0.18 -5 Deciduous
213 2227624.65 6049249.11 2177.01 2177.08 0.06 2 Coniferous
214 2221299.59 6046088.40 2546.22 2546.39 0.17 5 Open Grass
215 2217652.19 6075747.43 2558.85 2559.00 0.15 5 Coniferous
216 2220411.70 6067608.26 2427.65 2427.58 -0.07 -2 Open Grass
217 2228699.57 6076383.23 3719.30 3719.15 -0.16 -5 Coniferous
301 2229159.13 6111949.73 626.96 626.98 0.02 1 Deciduous
302 2234735.56 6101672.14 1462.13 1461.82 -0.30 -9 Open Grass
Final Report 16
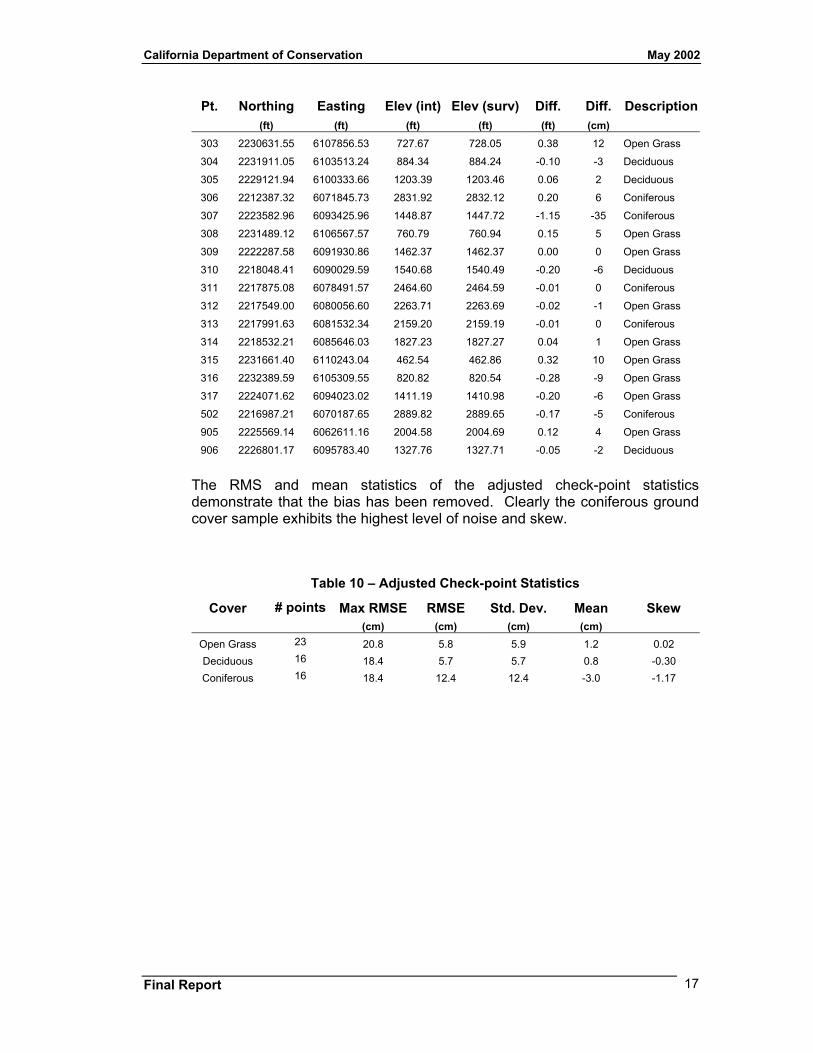
California Department of Conservation May 2002
Pt. Northing Easting Elev (int) Elev (surv) Diff. Diff. Description (ft) (ft) (ft) (ft) (ft) (cm)
303 2230631.55 6107856.53 727.67 728.05 0.38 12 Open Grass
304 2231911.05 6103513.24 884.34 884.24 -0.10 -3 Deciduous
305 2229121.94 6100333.66 1203.39 1203.46 0.06 2 Deciduous
306 2212387.32 6071845.73 2831.92 2832.12 0.20 6 Coniferous
307 2223582.96 6093425.96 1448.87 1447.72 -1.15 -35 Coniferous
308 2231489.12 6106567.57 760.79 760.94 0.15 5 Open Grass
309 2222287.58 6091930.86 1462.37 1462.37 0.00 0 Open Grass
310 2218048.41 6090029.59 1540.68 1540.49 -0.20 -6 Deciduous
311 2217875.08 6078491.57 2464.60 2464.59 -0.01 0 Coniferous
312 2217549.00 6080056.60 2263.71 2263.69 -0.02 -1 Open Grass
313 2217991.63 6081532.34 2159.20 2159.19 -0.01 0 Coniferous
314 2218532.21 6085646.03 1827.23 1827.27 0.04 1 Open Grass
315 2231661.40 6110243.04 462.54 462.86 0.32 10 Open Grass
316 2232389.59 6105309.55 820.82 820.54 -0.28 -9 Open Grass
317 2224071.62 6094023.02 1411.19 1410.98 -0.20 -6 Open Grass
502 2216987.21 6070187.65 2889.82 2889.65 -0.17 -5 Coniferous
905 2225569.14 6062611.16 2004.58 2004.69 0.12 4 Open Grass
906 2226801.17 6095783.40 1327.76 1327.71 -0.05 -2 Deciduous
The RMS and mean statistics of the adjusted check-point statistics demonstrate that the bias has been removed. Clearly the coniferous ground cover sample exhibits the highest level of noise and skew.
Table 10 – Adjusted Check-point Statistics
Cover # points Max RMSE RMSE Std. Dev. Mean Skew (cm) (cm) (cm) (cm)
Open Grass 23 20.8 5.8 5.9 1.2 0.02 Deciduous 16 18.4 5.7 5.7 0.8 -0.30 Coniferous 16 18.4 12.4 12.4 -3.0 -1.17
Final Report 17
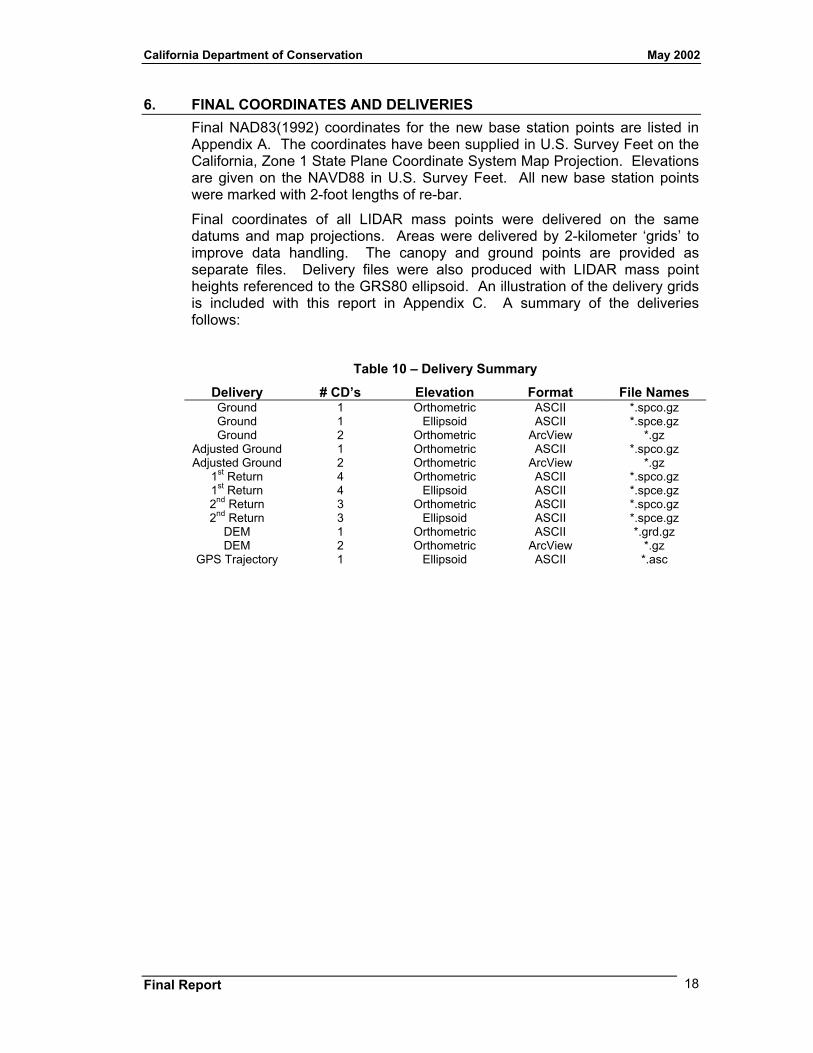
California Department of Conservation May 2002
6. FINAL COORDINATES AND DELIVERIES Final NAD83(1992) coordinates for the new base station points are listed in Appendix A. The coordinates have been supplied in U.S. Survey Feet on the California, Zone 1 State Plane Coordinate System Map Projection. Elevations are given on the NAVD88 in U.S. Survey Feet. All new base station points were marked with 2-foot lengths of re-bar.
Final coordinates of all LIDAR mass points were delivered on the same datums and map projections. Areas were delivered by 2-kilometer ‘grids’ to improve data handling. The canopy and ground points are provided as separate files. Delivery files were also produced with LIDAR mass point heights referenced to the GRS80 ellipsoid. An illustration of the delivery grids is included with this report in Appendix C. A summary of the deliveries follows:
Table 10 – Delivery Summary
Delivery # CD’s Elevation Format File Names Ground 1 Orthometric ASCII *.spco.gz Ground 1 Ellipsoid ASCII *.spce.gz Ground 2 Orthometric ArcView *.gz
Adjusted Ground 1 Orthometric ASCII *.spco.gz Adjusted Ground 2 Orthometric ArcView *.gz
1st Return 4 Orthometric ASCII *.spco.gz 1st Return 4 Ellipsoid ASCII *.spce.gz 2nd Return 3 Orthometric ASCII *.spco.gz 2nd Return 3 Ellipsoid ASCII *.spce.gz
DEM 1 Orthometric ASCII *.grd.gz DEM 2 Orthometric ArcView *.gz
GPS Trajectory 1 Ellipsoid ASCII *.asc
Final Report 18

Appendix C Report from 3di Technologies
- 37 -
3DI LIDAR Mapping Project Report
Table of Contents
Lidar System Data Acquisition Parameters
System Calibration
GPS Ground Control
Validation of DEM Data Quality
Data Processing Procedures
PDOP
Mission Project Information
GPS Processing Summary
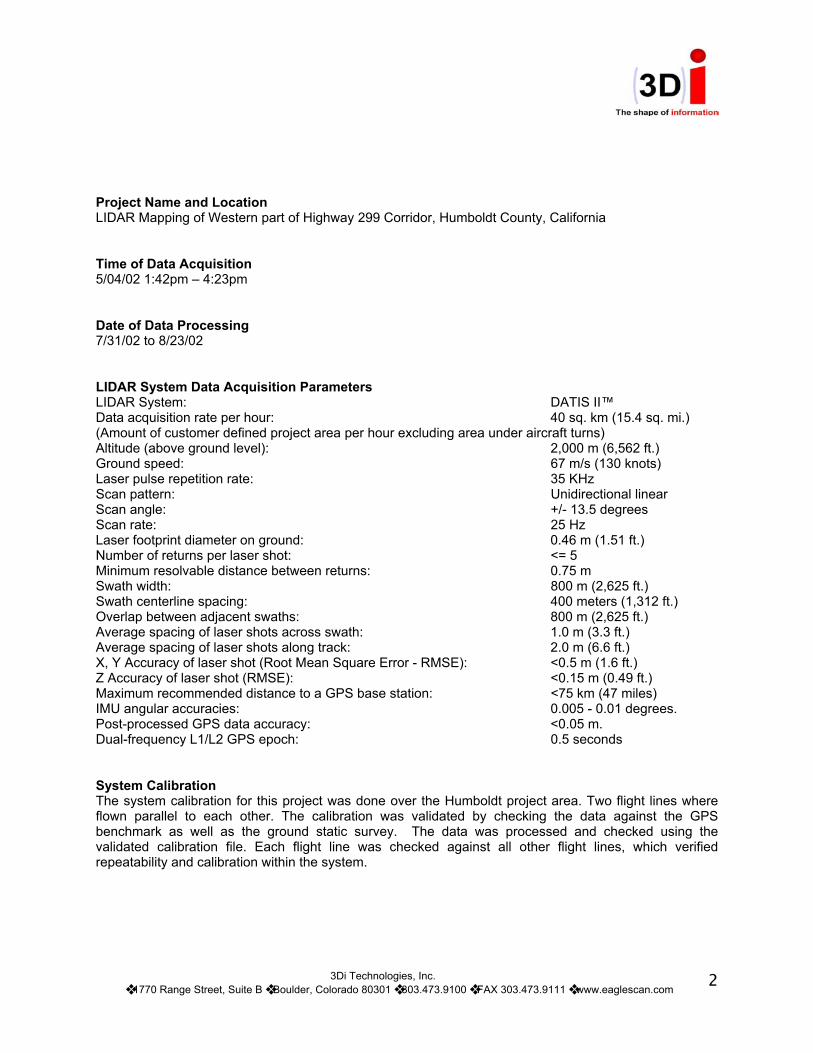
Project Name and Location LIDAR Mapping of Western part of Highway 299 Corridor, Humboldt County, California Time of Data Acquisition 5/04/02 1:42pm – 4:23pm Date of Data Processing 7/31/02 to 8/23/02 LIDAR System Data Acquisition Parameters LIDAR System: DATIS II™ Data acquisition rate per hour: 40 sq. km (15.4 sq. mi.) (Amount of customer defined project area per hour excluding area under aircraft turns) Altitude (above ground level): 2,000 m (6,562 ft.) Ground speed: 67 m/s (130 knots) Laser pulse repetition rate: 35 KHz Scan pattern: Unidirectional linear Scan angle: +/- 13.5 degrees Scan rate: 25 Hz Laser footprint diameter on ground: 0.46 m (1.51 ft.) Number of returns per laser shot: <= 5 Minimum resolvable distance between returns: 0.75 m Swath width: 800 m (2,625 ft.) Swath centerline spacing: 400 meters (1,312 ft.) Overlap between adjacent swaths: 800 m (2,625 ft.) Average spacing of laser shots across swath: 1.0 m (3.3 ft.) Average spacing of laser shots along track: 2.0 m (6.6 ft.) X, Y Accuracy of laser shot (Root Mean Square Error - RMSE): <0.5 m (1.6 ft.) Z Accuracy of laser shot (RMSE): <0.15 m (0.49 ft.) Maximum recommended distance to a GPS base station: <75 km (47 miles) IMU angular accuracies: 0.005 - 0.01 degrees. Post-processed GPS data accuracy: <0.05 m. Dual-frequency L1/L2 GPS epoch: 0.5 seconds System Calibration The system calibration for this project was done over the Humboldt project area. Two flight lines where flown parallel to each other. The calibration was validated by checking the data against the GPS benchmark as well as the ground static survey. The data was processed and checked using the validated calibration file. Each flight line was checked against all other flight lines, which verified repeatability and calibration within the system.
3Di Technologies, Inc. ❖ 1770 Range Street, Suite B ❖ Boulder, Colorado 80301 ❖ 303.473.9100 ❖ FAX 303.473.9111 ❖ www.eaglescan.com
2
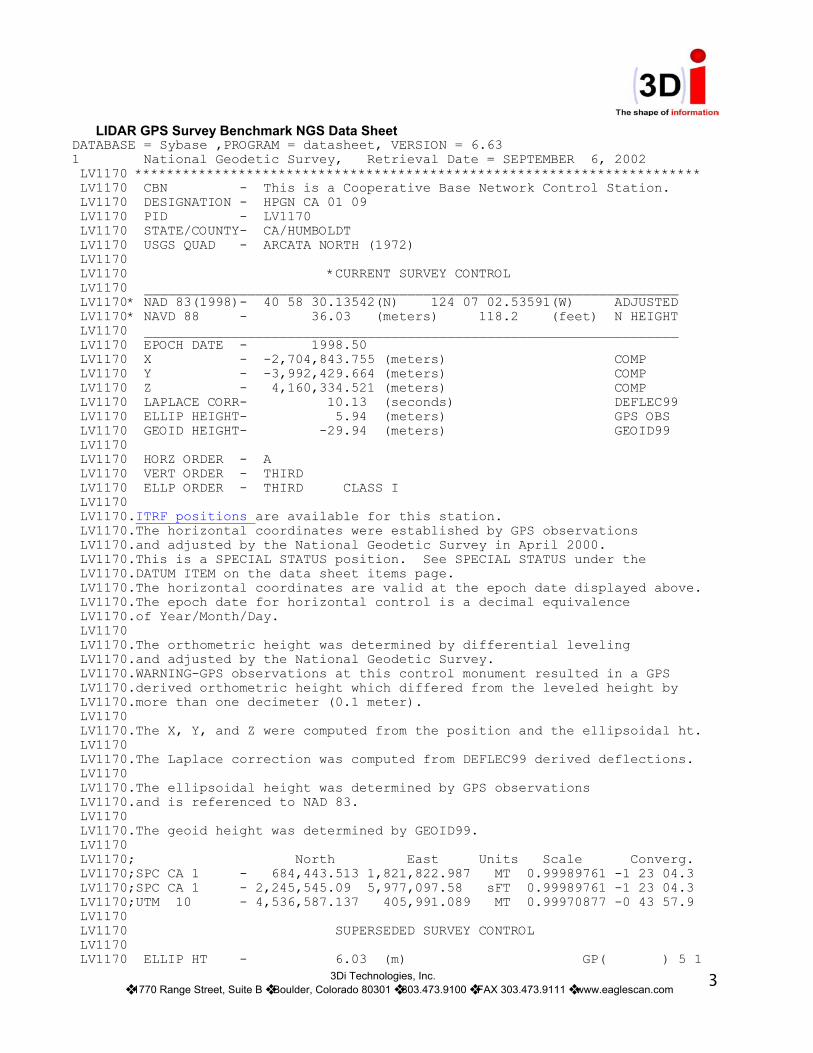
LIDAR GPS Survey Benchmark NGS Data Sheet
DATABASE = Sybase ,PROGRAM = datasheet, VERSION = 6.63 1 National Geodetic Survey, Retrieval Date = SEPTEMBER 6, 2002 LV1170 *********************************************************************** LV1170 CBN - This is a Cooperative Base Network Control Station. LV1170 DESIGNATION - HPGN CA 01 09 LV1170 PID - LV1170 LV1170 STATE/COUNTY- CA/HUMBOLDT LV1170 USGS QUAD - ARCATA NORTH (1972) LV1170 LV1170 *CURRENT SURVEY CONTROL LV1170 ___________________________________________________________________ LV1170* NAD 83(1998)- 40 58 30.13542(N) 124 07 02.53591(W) ADJUSTED LV1170* NAVD 88 - 36.03 (meters) 118.2 (feet) N HEIGHT LV1170 ___________________________________________________________________ LV1170 EPOCH DATE - 1998.50 LV1170 X - -2,704,843.755 (meters) COMP LV1170 Y - -3,992,429.664 (meters) COMP LV1170 Z - 4,160,334.521 (meters) COMP LV1170 LAPLACE CORR- 10.13 (seconds) DEFLEC99 LV1170 ELLIP HEIGHT- 5.94 (meters) GPS OBS LV1170 GEOID HEIGHT- -29.94 (meters) GEOID99 LV1170 LV1170 HORZ ORDER - A LV1170 VERT ORDER - THIRD LV1170 ELLP ORDER - THIRD CLASS I LV1170 LV1170.ITRF positions are available for this station. LV1170.The horizontal coordinates were established by GPS observations LV1170.and adjusted by the National Geodetic Survey in April 2000. LV1170.This is a SPECIAL STATUS position. See SPECIAL STATUS under the LV1170.DATUM ITEM on the data sheet items page. LV1170.The horizontal coordinates are valid at the epoch date displayed above. LV1170.The epoch date for horizontal control is a decimal equivalence LV1170.of Year/Month/Day. LV1170 LV1170.The orthometric height was determined by differential leveling LV1170.and adjusted by the National Geodetic Survey. LV1170.WARNING-GPS observations at this control monument resulted in a GPS LV1170.derived orthometric height which differed from the leveled height by LV1170.more than one decimeter (0.1 meter). LV1170 LV1170.The X, Y, and Z were computed from the position and the ellipsoidal ht. LV1170 LV1170.The Laplace correction was computed from DEFLEC99 derived deflections. LV1170 LV1170.The ellipsoidal height was determined by GPS observations LV1170.and is referenced to NAD 83. LV1170 LV1170.The geoid height was determined by GEOID99. LV1170 LV1170; North East Units Scale Converg. LV1170;SPC CA 1 - 684,443.513 1,821,822.987 MT 0.99989761 -1 23 04.3 LV1170;SPC CA 1 - 2,245,545.09 5,977,097.58 sFT 0.99989761 -1 23 04.3 LV1170;UTM 10 - 4,536,587.137 405,991.089 MT 0.99970877 -0 43 57.9 LV1170 LV1170 SUPERSEDED SURVEY CONTROL LV1170
3Di Technologies, Inc. ❖ 1770 Range Street, Suite B ❖ Boulder, Colorado 80301 ❖ 303.473.9100 ❖ FAX 303.473.9111 ❖ www.eaglescan.com
3 LV1170 ELLIP HT - 6.03 (m) GP( ) 5 1
LV1170 NAD 83(1986)- 40 58 30.12356(N) 124 07 02.54523(W) AD(1984.00) 1 LV1170 NAD 83(1992)- 40 58 30.13171(N) 124 07 02.53630(W) AD(1991.35) B LV1170 ELLIP HT - 6.03 (m) GP(1991.35) 4 2 LV1170 NGVD 29 - 35.0 (m) 115. (f) GPS OBS LV1170 LV1170.Superseded values are not recommended for survey control. LV1170.NGS no longer adjusts projects to the NAD 27 or NGVD 29 datums. LV1170.See file dsdata.txt to determine how the superseded data were derived. LV1170 LV1170_MARKER: DD = SURVEY DISK LV1170_SETTING: 50 = ALUMINUM ALLOY ROD W/O SLEEVE (10 FT.+) LV1170_STAMPING: HPGN-CALIF. STA.01-09 1991 LV1170_MARK LOGO: CADT LV1170_PROJECTION: FLUSH LV1170_MAGNETIC: N = NO MAGNETIC MATERIAL LV1170_STABILITY: B = PROBABLY HOLD POSITION/ELEVATION WELL LV1170_SATELLITE: THE SITE LOCATION WAS REPORTED AS SUITABLE FOR LV1170+SATELLITE: SATELLITE OBSERVATIONS - May 19, 1998 LV1170_ROD/PIPE-DEPTH: 5.49 meters LV1170 LV1170 HISTORY - Date Condition Report By LV1170 HISTORY - 1991 MONUMENTED CADT LV1170 HISTORY - 19910627 GOOD NGS LV1170 HISTORY - 19920504 GOOD NGS LV1170 HISTORY - 19931025 GOOD CADT LV1170 HISTORY - 19940429 GOOD NGS LV1170 HISTORY - 19970109 GOOD NGS LV1170 HISTORY - 19980519 GOOD NGS LV1170 LV1170 STATION DESCRIPTION LV1170 LV1170'DESCRIBED BY NATIONAL GEODETIC SURVEY 1991 LV1170'THE STATION IS LOCATED NORTH OF MCKINLEYVILLE IN A VISTA POINT ON U.S. LV1170'HIGHWAY 101 WESTERLY OF THE EUREKA/ARCATA AIRPORT. LV1170'TO REACH THE STATION FROM THE JUNCTION OF U.S. HIGHWAY 101 AND STATE LV1170'HIGHWAY 299, GO NORTH ON HIGHWAY 101 FOR 7.3 MI (11.7 KM) TO THE LV1170'NORTH CENTRAL AVENUE INTERCHANGE AT POST MILE 95.6. REVERSE LV1170'DIRECTION AT THE INTERCHANGE AND GO SOUTH ON HIGHWAY 1O1 FOR 1.3 MI LV1170'(2.1 KM) TO THE VISTA POINT AND THE STATION ON THE RIGHT AT POST MILE LV1170'94.3. LV1170'THE STATION IS A 2.5 INCH ALUMINUM DISK INSIDE A 6 INCH ALUMINUM LV1170'ACCESS COVER IN THE AREA BETWEEN THE OFF-RAMP TO THE VISTA POINT AND LV1170'THE PARKING AREA. LOCATED 155 FT (47.2 M) NORTH OF THE CENTERLINE OF LV1170'THE ENTRY ROAD TO THE VISTA POINT, 121 FT (36.9 M) SOUTH OF THE NORTH LV1170'END OF THE PARKING LOT, 51 FT (15.5 M) WEST OF THE CENTERLINE OF THE LV1170'OFF-RAMP TO THE VISTA POINT, 4 FT (1.2 M) EAST OF THE EAST EDGE OF LV1170'THE PARKING LOT AND 3 FT (0.9 M) WEST OF A FIBERGLASS WITNESS POST. LV1170 LV1170 STATION RECOVERY (1992) LV1170 LV1170'RECOVERY NOTE BY NATIONAL GEODETIC SURVEY 1992 LV1170'STATION IS LOCATED ABOUT 15 KM (9.3 MI) NORTH OF ARCATA, JUST LV1170'NORTHWEST OF MCKINLEYVILLE, ALONG SOUTHBOUND U.S. HIGHWAY 101, AT A LV1170'VISTA POINT, IN A GRASS STRIP BETWEEN THE PARKING LOT AND THE LV1170'ENTRANCE ROAD. OWNERSHIP--CALIFORNIA DEPARTMENT OF TRANSPORTATION. LV1170'TO REACH FROM THE OVERPASS AT THE JUNCTION OF U.S. HIGHWAY 101 AND LV1170'ROAD LEADING TO CLAM BEACH COUNTY PARK (ABOUT 13 KM (8.1 MI) NORTH OF LV1170'THE JUNCTION OF STATE HIGHWAYS 101 AND 299), GO SOUTH ON HIGHWAY 101
3Di Technologies, Inc. ❖ 1770 Range Street, Suite B ❖ Boulder, Colorado 80301 ❖ 303.473.9100 ❖ FAX 303.473.9111 ❖ www.eaglescan.com
4 LV1170'FOR 2.01 KM (1.25 MI) TO THE VISTA POINT ENTRANCE RAMP ON THE RIGHT.
LV1170'BEAR RIGHT ON RAMP FOR 0.21 KM (0.13 MI) TO THE PARKING LOT ON THE LV1170'RIGHT. TURN RIGHT INTO LOT FOR 0.06 KM (0.04 MI) TO THE STATION ON LV1170'THE RIGHT. LV1170'STATION MARK IS A DISK ON A ROD ENCASED IN A PVC PIPE WITH LOGO CAP LV1170'SET IN A CONCRETE POST FLUSH WITH THE GROUND. IT IS 11.9 M LV1170'(39.0 FT) WEST OF THE WEST CURB OF THE ENTRANCE ROAD, 0.9 M (3.0 FT) LV1170'EAST OF A FIBERGLASS WITNESS POST, 1.4 M (4.6 FT) EAST OF THE EAST LV1170'CURB OF THE PARKING LOT, 36.6 M (120.1 FT) SOUTH OF THE NORTHEAST LV1170'CORNER OF THE LOT, 30.9 M (101.4 FT) NORTH OF THE SOUTHEAST CORNER OF LV1170'THE LOT AND 14.2 M (46.6 FT) SOUTH OF A STEEL POST IN A 1.5 M LV1170'(4.9 FT) SQUARE CONCRETE PAD. LV1170 LV1170 STATION RECOVERY (1993) LV1170 LV1170'RECOVERY NOTE BY CALTRANS 1993 (DSC) LV1170'RECOVERED AS DESCRIBED. LV1170 LV1170 STATION RECOVERY (1994) LV1170 LV1170'RECOVERY NOTE BY NATIONAL GEODETIC SURVEY 1994 (AJL) LV1170'STATION IS LOCATED ABOUT 9.3 MI (15.0 KM) NORTH OF ARCATA, JUST LV1170'NORTHWEST OF MCKINLEYVILLE, ALONG SOUTHBOUND U.S. HIGHWAY 101, AT A LV1170'VISTA POINT, IN A GRASS STRIP BETWEEN THE PARKING LOT AND THE ENTRANCE LV1170'ROAD. OWNERSHIP--CALIFORNIA DEPARTMENT OF TRANSPORTATION. TO REACH LV1170'FROM THE OVERPASS AT THE JUNCTION OF U.S. HIGHWAY 101 AND A ROAD LV1170'LEADING TO CLAM BEACH COUNTY PARK (ABOUT 8.1 MI (13.0 KM) NORTH OF THE LV1170'JUNCTION OF STATE HIGHWAYS 101 AND 299), GO SOUTH ON HIGHWAY 101 FOR LV1170'1.25 MI (2.01 KM) TO THE VISTA POINT ENTRANCE RAMP ON THE RIGHT. BEAR LV1170'RIGHT ON RAMP FOR 0.13 MI (0.21 KM) TO THE PARKING LOT ON THE RIGHT. LV1170'TURN RIGHT INTO LOT FOR 0.04 MI (0.06 KM) TO THE STATION ON THE RIGHT. LV1170'STATION MARK IS A DISK ON A ROD ENCASED IN PVC PIPE WITH LOGO CAP LV1170'SURROUNDED BY CONCRETE AND FLUSH WITH THE GROUND. IT IS 11.9 M (39.0 LV1170'FT) WEST OF THE WEST CURB OF THE ENTRANCE ROAD, 0.9 M (3.0 FT) EAST OF LV1170'A FIBERGLASS WITNESS POST, 1.4 M (4.6 FT) EAST OF THE EAST CURB OF THE LV1170'PARKING LOT, 36.6 M (120.1 FT) SOUTH OF THE NORTHEAST CORNER OF THE LV1170'LOT, 30.9 M (101.4 FT) NORTH OF THE SOUTHEAST CORNER OF THE LOT AND LV1170'14.2 M (46.6 FT) SOUTH OF A STEEL POST IN A 1.5 M (4.9 FT) SQUARE LV1170'CONCRETE PAD. ROD DEPTH IS UNKNOWN. LV1170 LV1170 STATION RECOVERY (1997) LV1170 LV1170'RECOVERY NOTE BY NATIONAL GEODETIC SURVEY 1997 (JGF) LV1170'RECOVERED AS DESCRIBED. THE LID IS CONCAVED DUE TO APPARANT LV1170'HAMMERING. LV1170 LV1170 STATION RECOVERY (1998) LV1170 LV1170'RECOVERY NOTE BY NATIONAL GEODETIC SURVEY 1998 (CSM) LV1170'RECOVERED AS DESCRIBED. NOTE--THE LOGO CAP IS MISSING. *** retrieval complete. Elapsed Time = 00:00:05
3Di Technologies, Inc. ❖ 1770 Range Street, Suite B ❖ Boulder, Colorado 80301 ❖ 303.473.9100 ❖ FAX 303.473.9111 ❖ www.eaglescan.com
5
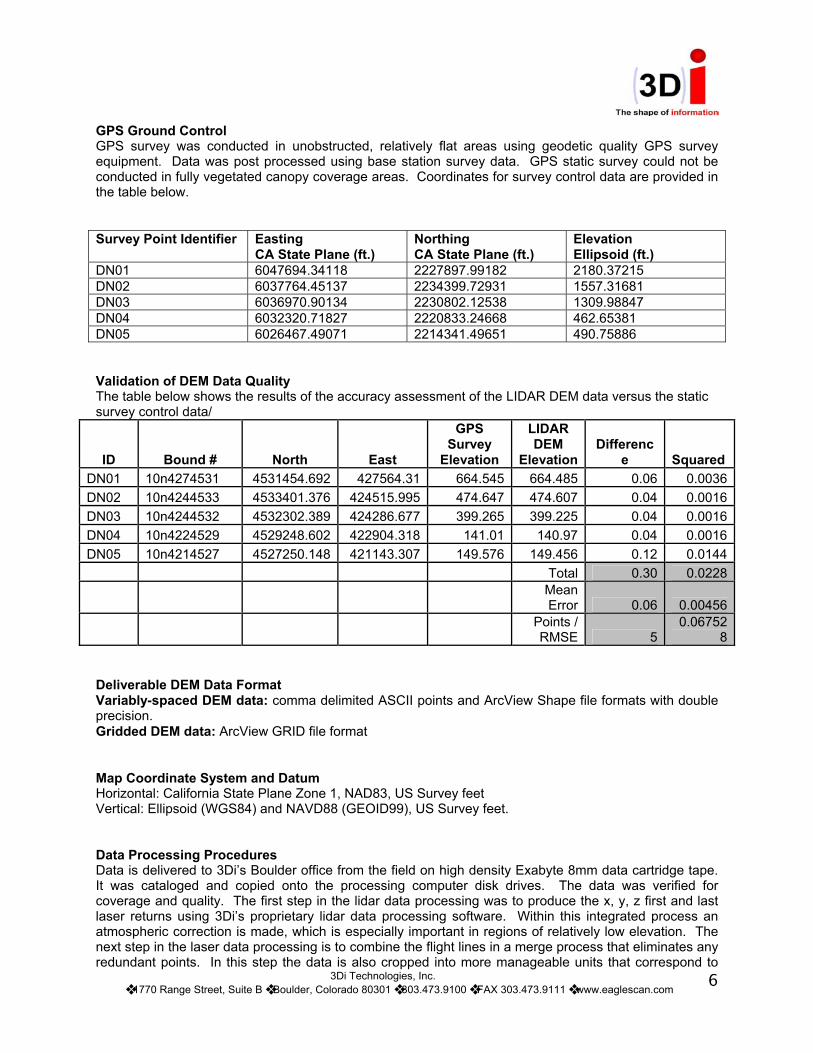
GPS Ground Control GPS survey was conducted in unobstructed, relatively flat areas using geodetic quality GPS survey equipment. Data was post processed using base station survey data. GPS static survey could not be conducted in fully vegetated canopy coverage areas. Coordinates for survey control data are provided in the table below. Survey Point Identifier
Easting CA State Plane (ft.)
Northing CA State Plane (ft.)
Elevation Ellipsoid (ft.)
DN01 6047694.34118 2227897.99182 2180.37215 DN02 6037764.45137 2234399.72931 1557.31681 DN03 6036970.90134 2230802.12538 1309.98847 DN04 6032320.71827 2220833.24668 462.65381 DN05 6026467.49071 2214341.49651 490.75886 Validation of DEM Data Quality The table below shows the results of the accuracy assessment of the LIDAR DEM data versus the static survey control data/
ID Bound # North East
GPS Survey
Elevation
LIDAR DEM
Elevation Differenc
e Squared DN01 10n4274531 4531454.692 427564.31 664.545 664.485 0.06 0.0036DN02 10n4244533 4533401.376 424515.995 474.647 474.607 0.04 0.0016DN03 10n4244532 4532302.389 424286.677 399.265 399.225 0.04 0.0016DN04 10n4224529 4529248.602 422904.318 141.01 140.97 0.04 0.0016DN05 10n4214527 4527250.148 421143.307 149.576 149.456 0.12 0.0144 Total 0.30 0.0228
Mean Error 0.06 0.00456
Points / RMSE 5
0.067528
Deliverable DEM Data Format Variably-spaced DEM data: comma delimited ASCII points and ArcView Shape file formats with double precision. Gridded DEM data: ArcView GRID file format Map Coordinate System and Datum Horizontal: California State Plane Zone 1, NAD83, US Survey feet Vertical: Ellipsoid (WGS84) and NAVD88 (GEOID99), US Survey feet. Data Processing Procedures
3Di Technologies, Inc. ❖ 1770 Range Street, Suite B ❖ Boulder, Colorado 80301 ❖ 303.473.9100 ❖ FAX 303.473.9111 ❖ www.eaglescan.com
6
Data is delivered to 3Di’s Boulder office from the field on high density Exabyte 8mm data cartridge tape. It was cataloged and copied onto the processing computer disk drives. The data was verified for coverage and quality. The first step in the lidar data processing was to produce the x, y, z first and last laser returns using 3Di’s proprietary lidar data processing software. Within this integrated process an atmospheric correction is made, which is especially important in regions of relatively low elevation. The next step in the laser data processing is to combine the flight lines in a merge process that eliminates any redundant points. In this step the data is also cropped into more manageable units that correspond to
customer’s specified data file boundaries or file size limitations. Noise or anomalous returns are filtered from all data during this processing. In order to produce the ground surface DEM’s, vegetation removal is performed on the last return elevation points data by identifying the laser returns from above ground vegetation. This proprietary algorithm is capable of removing between 90-95% of the trees and most other prominent above ground vegetation from the data. The data is then quality checked using commercial software, Spectra Precision TerraModel and TerraVista. At this stage, the data is triangulated into contours and any remaining vegetation or manmade structures and buildings are identified visually and interactively removed from the data. The data is then triangulated once again, contoured, and visualized to see the effect of the additional elevation point removal and for any final edits that may be necessary. The next step in the post-processing of the DEM data was to perform the ellipsoid to orthometric height conversion using the National Geodetic Survey (NGS) Geoid Model, GEOID99. All elevation data was processed in this way on a point by point basis. Datum and coordinate system conversion from WGS84 to the customer coordinate system is undertaken by using the US Army Corps of Engineers standard algorithm CorpsCon. The final step was to assemble the first and last return LIDAR elevation DEM data, ground surface DEM data, gridded DEM data, and shaded relief model data, into the correct customer specified delivery format. All the variably-spaced x, y, z DEM points data were converted to ASCII comma delimited point files and ArcView Shape file formats and the gridded DEM data to ArcView GRID file format.
3Di Technologies, Inc. ❖ 1770 Range Street, Suite B ❖ Boulder, Colorado 80301 ❖ 303.473.9100 ❖ FAX 303.473.9111 ❖ www.eaglescan.com
7