Embed Size (px)
Citation preview

University of Wollongong University of Wollongong
Research Online Research Online
Faculty of Engineering - Papers (Archive) Faculty of Engineering and Information Sciences
2010
Landslide Recognition using LiDAR derived Digital Elevation Models-Landslide Recognition using LiDAR derived Digital Elevation Models-
Lessons learnt from selected Australian examples Lessons learnt from selected Australian examples
Anthony Miner AS Miner Geotechnical, Australia, [email protected]
P. Flentje University of Wollongong, [email protected]
C. Mazengarb Mineral Resources Tasmania
D. J. Windle Department of Primary Industries, Victoria, Australia
Follow this and additional works at: https://ro.uow.edu.au/engpapers
Part of the Engineering Commons
https://ro.uow.edu.au/engpapers/556
Recommended Citation Recommended Citation Miner, Anthony; Flentje, P.; Mazengarb, C.; and Windle, D. J.: Landslide Recognition using LiDAR derived Digital Elevation Models-Lessons learnt from selected Australian examples 2010. https://ro.uow.edu.au/engpapers/556
Research Online is the open access institutional repository for the University of Wollongong. For further information contact the UOW Library: [email protected]
1 INTRODUCTION
The introduction of the Australian Geomechanics Society (AGS) 2007 Landslide Risk Man-
agement (LRM) Guidelines (especially AGS, 2007a; 2007b) presents strong arguments for the
development of landslide inventories to assist landslide investigations and research. As such, a
series of papers have been prepared by collaborating members of the AGS to discuss aspects of
the overall LRM process which include this paper on landside recognition and mapping, design-
ing landslide databases in which such data is stored (Mazengarb et al, 2010), the application of
monitored landslide performance data to aid in the assessment of landslide frequency (Flentje et
al, 2010) and the use of the application of landslide inventory data into landslide susceptibility
maps (Miner et al, 2010).
The visualization and interpretation of landform is a key component of any landslide inven-
tory study and as such, the acquisition of accurate topographical information is a vital element
in the overall geomorphic assessment process. Such information has traditionally been obtained
through terrestrial land survey and aerial photogrammetry. However over the past 15 years the
application of a new technique called Light Detection and Ranging (LiDAR) has been success-
fully used to generate precise and comprehensive topographical information in a wide range of
environments and settings.
Essentially, LiDAR measures the distance from an airborne vehicle to the surface of the earth
using the round-trip travel time of a short pulse of near infrared light (typical wavelength of 1 to
Landslide Recognition using LiDAR derived Digital Elevation Models-Lessons learnt from selected Australian examples.
A.S. Miner A.S. Miner Geotechnical, Geelong, Victoria, Australia
P. Flentje University of Wollongong, Wollongong, New South Wales, Australia
C. Mazengarb Mineral Resources Tasmania, Hobart, Tasmania, Australia
D.J. Windle Department of Primary Industries, Victoria, Australia
ABSTRACT: The increasing use of LiDAR or airborne laser scanning (ALS) data throughout
the world has facilitated widespread access to high resolution current digital elevation models
(DEM). Such high resolution DEM’s have proved to be particularly useful in the recognition of
landslides and erosion. This is an increasingly important issue in Australia given the publication
of the recent Australian Geomechanics Society’s guidelines for landslide risk management
which emphasizes the need for improved regional and local landslide inventories.
This paper presents recent examples of landslide recognition using such DEM’s from around
Australia. Insight is provided into the overall landslide recognition process using remotely ac-
quired data and how this has been enhanced using LiDAR based DEM’s and their derivative
data sets.
The advantages of using LiDAR-based DEM’s are identified as compared with conventional
regional derived DEM’s using photogrammetric techniques. Analytical and visualization advan-
tages associated with the use of GIS and derivative data sets are also discussed.
The paper sets out to provide practical guidance using techniques and lessons learnt from
many hours of work of detailed analysis by experienced landslide experts and comments on
scope for future enhancements. In addition, limitations and downfalls are also described and
recommendations made as to how this technique can best be applied to the landslide recognition
process.
1.5 µm). Through a range of on-board instruments (including an airborne Global Positioning
System and Inertial Navigation System), the elevation of the aircraft, the time of travel and the
speed of light are all known and it is possible to calculate the vertical distance from the aircraft
to the ground, and thus the elevation of the ground. As the LiDAR sensors are capable of receiv-
ing a vast number of return pulses every second, a dense coverage of widespread areas can be
achieved in a relatively short flight time.
After the initial raw data has been collected and analyzed to differentiate ground strikes from
other returns emanating from tops of trees, and buildings etc, this data can then be used to gen-
erate a digital elevation model (DEM). It is from this LiDAR-derived DEM that features such as
landslides can be interpreted using techniques which are discussed in the following sections.
2 LIDAR DERIVED DIGITAL ELEVATION MODELS
2.1 How DEMs are made from LiDAR
The Digital Elevation Model (DEM) is a grid-based three-dimensional representation of ter-
rain elevation and is a fundamental element of GIS datasets and GIS-based analyses. DEM’s
can be constructed from a variety of source data (primarily contours or point data) and by using
a range of techniques. Using high density airborne laser scanning (ALS) data points (subject to
the considerations in the following section 2.2) allows the production of a highly accurate, con-
temporary DEM.
Numerous methods across many different GIS platforms can produce DEM’s. The authors
have found that DEM’s generated using the ESRI ArcGISTM
3D Analyst Triangulated Irregular
Network (TIN) modeling, followed by conversion of the TIN to a raster, provides an excellent
technique of DEM production. A TIN surface is generated from a series of data points (each
having x, y and z values – where z is commonly elevation) producing continuous, non-
overlapping triangles whereby each node represents a z value point. In contrast to TIN model-
ing, one alternative technique, using ESRI ArcGISTM
TOPO2RASTER tool (based on the
ANUDEM program created by the Australian national University) produces a more hydrologi-
cally correct DEM, with fewer sinks.
2.2 DEM resolution and Accuracy
The resolution at which any DEM can be produced is directly related to the average point
spacing (aps) at which the raw data was collected on the ground. As an initial starting point, a
useful rule of thumb suggests that if the aps= x then the DEM grid or pixel size=2x. Hengl
(2006) suggests however, that a compromise may allow one to reduce this to 0.25 or 0.5 × the
aps, subject to various data constraints and target variables. However, horizontal and vertical
accuracies also play a significant role in setting DEM grid resolution and must also be under-
stood and considered when producing a suitable DEM grid. As the LiDAR datasets can be quite
large, it is often the case that computer resources will govern the pixel size.
LIDAR data provided by various agencies, with which the authors have been associated over
the past 10 years, have readily supported DEM’s at 1, 2 or 5m resolution. For example, the 5.0m
DEM in Corangamite region of Southwest Victoria, Australia has a vertical accuracy of V=+/-
0.50m, a horizontal accuracy of H=+/-0.50 m and an average point spacing 2.0 pts/m.
It is important that the DEM resolution be matched with the data quality. By necessity
DEM’s have generalizations built into them as a function of inaccuracies with the data and the
resolution of the modelled landscape will be governed by these limitations. Hence it must be
understood that LiDAR data is not perfect and includes spatial variations which rarely achieve
land survey type accuracies and may not even be completely repeatable. As an example, Pala-
mara et al (2006) report a mean absolute vertical error of 0.23 m between two ALS datasets
produced for the same landscape in the Illawarra Region of NSW, Australia although much
greater errors occurred at cliffs and in steep terrain. Horizontally, accuracies were determined to
be <0.5 m (pers com Flentje, 2010). The ability of ALS data to accurately represent a bare earth
DEM is affected by a number of factors such as flight configuration of the survey with respect
to the local topography (which may create shadow effects) and by vegetation cover.
Generally, DEM resolution will determine the minimum size of a landslide feature that can
be consistently interpreted. Based on the authors experience we believe the limiting threshold of
landslide feature recognition is of the order of 5-10 pixels. Hengl (2006) suggests at least 4 pix-
els are required to represent the smallest object and at least 2 pixels to represent the narrowest.
2.3 DEM Derivatives
Whilst the DEM is often the primary output from the raw LiDAR data, GIS applications al-
low a number of derivative datasets to be produced form the DEM which include: terrain hill-
shading, degree of slope and slope aspect, plan and profile curvature, flow accumulation, wet-
ness and surface roughness. These derivative datasets can be extremely useful in the landslide
recognition process with some limited discussion included in later sections.
3 APPLICATION OF LIDAR DEM’S TO THE LANDSLIDE RECOGNITION PROCESS
3.1 Previous techniques for Landslide recognition
A number of techniques are regularly used for the field recognition and identification of land-
slides. The most fundamental of these is field observation and geomorphic mapping. Traditional
survey techniques are commonly used to accurately map the extents of landslides whilst remote
sensing techniques can include aerial photo interpretation (usually stereoscopically), satellite
imagery and more recently, Interferometric Synthetic Aperture Radar (InSAR) techniques have
been used. Whatever the technique, all aim to distinguish geomorphic features which identify
and distinguish the landslide within the landscape and hence the accuracy with which they can
depict topographical information is critical in allowing accurate assessment of such features.
3.2 Use of LiDAR DEMs in landslide recognition
Recently, LiDAR data and the derived DEM’s have been increasingly used as a technique for
landslide recognition (e.g. McKean and Roering 2004,). The ability to readily detect landslide
morphology is well suited to the high resolution ground models produced by LiDAR. In addi-
tion the use of the derivative data sets can also help define extents of the feature such as changes
in slope aspect on an uneven hummocky disturbed surface of a landslide(i.e. variations in
roughness), or abrupt slope changes at the headscarp of a slide.
However, the principal data set used in landslide recognition is the hill-shaded DEM which
produces a pseudo 3-D image of the landscape. The inclination and direction of the sun provides
illumination and shadowing to the landscape and can be manipulated relative to the ground sur-
face aspect and slope to emphasize and highlight landslide features. Various aspects of landform
can change and become focused depending on the sun direction and height and the process of
recognition can often be an iterative one whereby identification of the feature is enhanced by a
series of different views and visualizations runs.
Based on the authors' recent experience using ESRITM
GIS applications, we would recom-
mend initial assessment using sun direction from 45º, 135º, 225º and 315º with an angle of sun
inclination of 45º but increasing to 70º in steep terrain. We also note that in many circumstances
the illumination from a bearing of 225º causes the image to invert whereby valleys appear as
ridges and vice versa. In addition shadows can be included or excluded when developing the
hill-shaded models. Our experience suggests that terrain with significant relief can be obscured
with shadowing and thus it is best to exclude shadowing in such landscape.
3.3 Field Calibration and Verification
Any remotely-sensed process must be recognized as having an inherent weakness of the absence
of real time, in-field, direct observation. As such, the process of field calibration at the start of a
LIDAR derived DEM landslide recognition program is highly recommended. This will allow
the assessor to gauge landscape features in context of local geology and landform. Our experi-
ence across a number of sites around Australia, suggest what works in one area may not neces-
sarily work in another. Hence, there is a need for early calibration through direct field observa-
tion and verification is essential to calibrate future data capture and limit misinterpretations
which will still occur to some extent given data inaccuracies and limitations in the overall proc-
ess. None-the-less, an annual desktop analysis of a LiDAR DEM can serve to target subsequent
field-based investigations.
3.4 Benefits and Limitations of LiDAR DEM’s
A good comparison between the LiDAR and photogrammetric techniques was conducted by
the US Army Corps of Engineers (USACE 2002) and highlights major differences in the tech-
nologies which makes direct comparison difficult. There is however no doubt that LiDAR has
gained increasingly more acceptance in the last 10 years. Its main advantages include rapid ac-
quisition of data over widespread areas, an ability to work in previously inaccessible environ-
ments, a capability of viewing “through” trees and vegetation, and cheaper production of
DEM’s when compared with those obtained from traditional photogrammetric techniques.
Major disadvantages include initial higher costs of obtaining data, mean point spacing dic-
tates the final DEM resolution, false sense of accuracy, processing artifacts such as trees and
buildings when bare earth models are produced, challenged by very steep terrain and cliffs due
to lack of clear shots. While there is open source software available to process ALS datasets, the
authors prefer to use proprietary GIS software that while it is expensive to purchase, has the ad-
vantage of ready integration with other core GIS activities.
In terms of LiDAR derived DEM’s for landslide recognition work, the major advantage is the
flexibility to visualize landscapes using multiple combinations of hill-shading and associated
second derivative data sets. The data layers are readily integrated into standard GIS applications
making the capture of new features very easy and time efficient. Comparisons over the past few
years indicate landslide recognition using LiDAR derived DEM’s is up to 5 to 10 times quicker
than traditional photogrametric techniques in the same landscape.
The main disadvantage lies with the limiting threshold the DEM resolution places on the size of
the features that can be identified. In addition other geological features such as interbedding and
layering can sometimes be mistaken for instability and as such field verification is always an es-
sential component of the process although many times may not be possible due to the expanse
of areas interpreted and/or the inaccessible nature of the landscape assessed.
4 EXAMPLES
The following are a series of specific examples taken from recent landslide inventory pro-
grams within Australia which highlights both the potential and limitations of this method.
4.1 Use of aerials and LIDAR based DEM derivatives for landslide recognition
The series of images shown in Figure 1 depict a landslide located on Lake Connewarre on the
Bellarine Peninsula in Victoria, Australia. The landslide was initially identified from low to
moderate resolution aerial photography (later upgraded to a 35 cm high resolution aerial photo-
graph) and confirmed by field inspection and review of a regional 1.0 m DEM. Mapping of the
feature was aided by reference to both DEM derivatives including contours, degree of slope and
slope aspect.
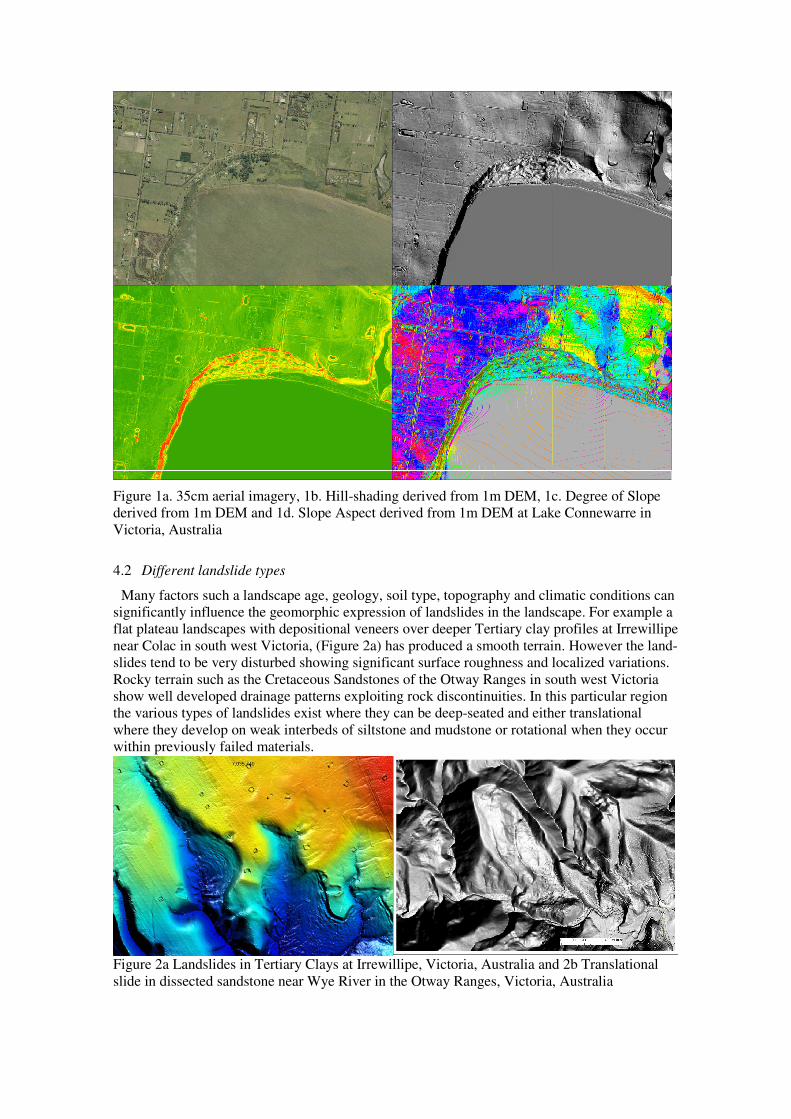
Figure 1a. 35cm aerial imagery, 1b. Hill-shading derived from 1m DEM, 1c. Degree of Slope
derived from 1m DEM and 1d. Slope Aspect derived from 1m DEM at Lake Connewarre in
Victoria, Australia
4.2 Different landslide types
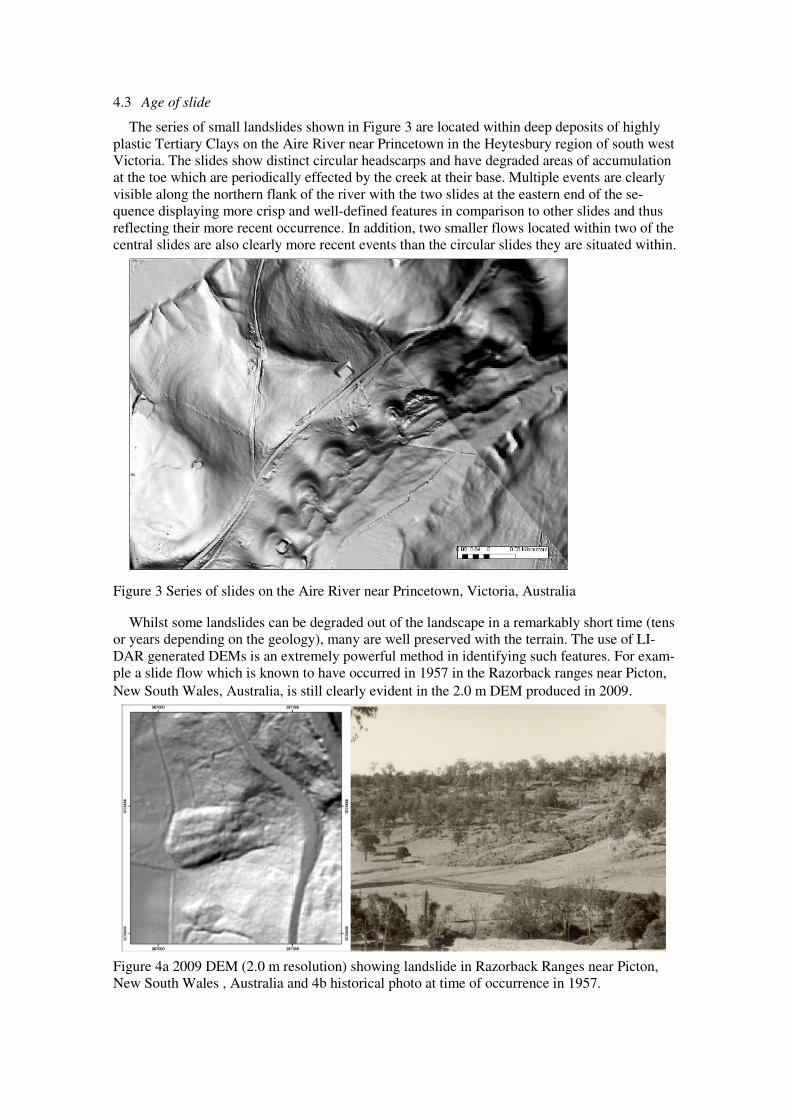
Many factors such a landscape age, geology, soil type, topography and climatic conditions can
significantly influence the geomorphic expression of landslides in the landscape. For example a
flat plateau landscapes with depositional veneers over deeper Tertiary clay profiles at Irrewillipe
near Colac in south west Victoria, (Figure 2a) has produced a smooth terrain. However the land-
slides tend to be very disturbed showing significant surface roughness and localized variations.
Rocky terrain such as the Cretaceous Sandstones of the Otway Ranges in south west Victoria
show well developed drainage patterns exploiting rock discontinuities. In this particular region
the various types of landslides exist where they can be deep-seated and either translational
where they develop on weak interbeds of siltstone and mudstone or rotational when they occur
within previously failed materials.
Figure 2a Landslides in Tertiary Clays at Irrewillipe, Victoria, Australia and 2b Translational
slide in dissected sandstone near Wye River in the Otway Ranges, Victoria, Australia
4.3 Age of slide
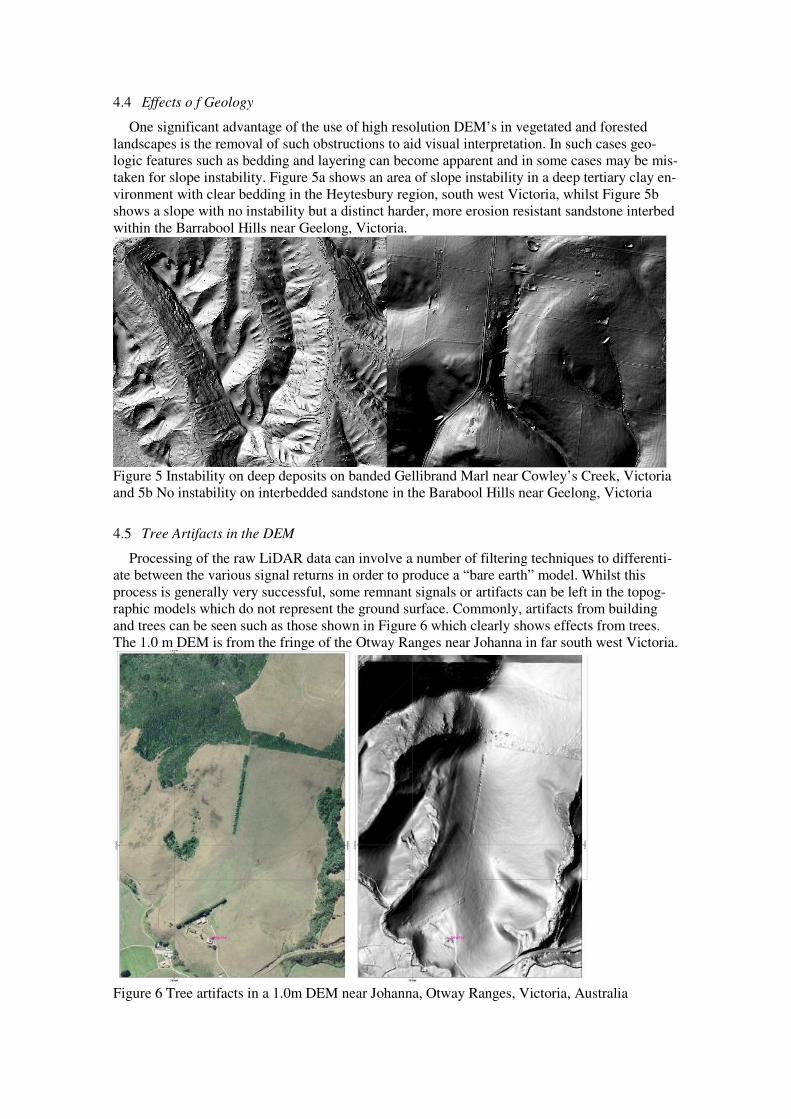
The series of small landslides shown in Figure 3 are located within deep deposits of highly
plastic Tertiary Clays on the Aire River near Princetown in the Heytesbury region of south west
Victoria. The slides show distinct circular headscarps and have degraded areas of accumulation
at the toe which are periodically effected by the creek at their base. Multiple events are clearly
visible along the northern flank of the river with the two slides at the eastern end of the se-
quence displaying more crisp and well-defined features in comparison to other slides and thus
reflecting their more recent occurrence. In addition, two smaller flows located within two of the
central slides are also clearly more recent events than the circular slides they are situated within.
Figure 3 Series of slides on the Aire River near Princetown, Victoria, Australia
Whilst some landslides can be degraded out of the landscape in a remarkably short time (tens
or years depending on the geology), many are well preserved with the terrain. The use of LI-
DAR generated DEMs is an extremely powerful method in identifying such features. For exam-
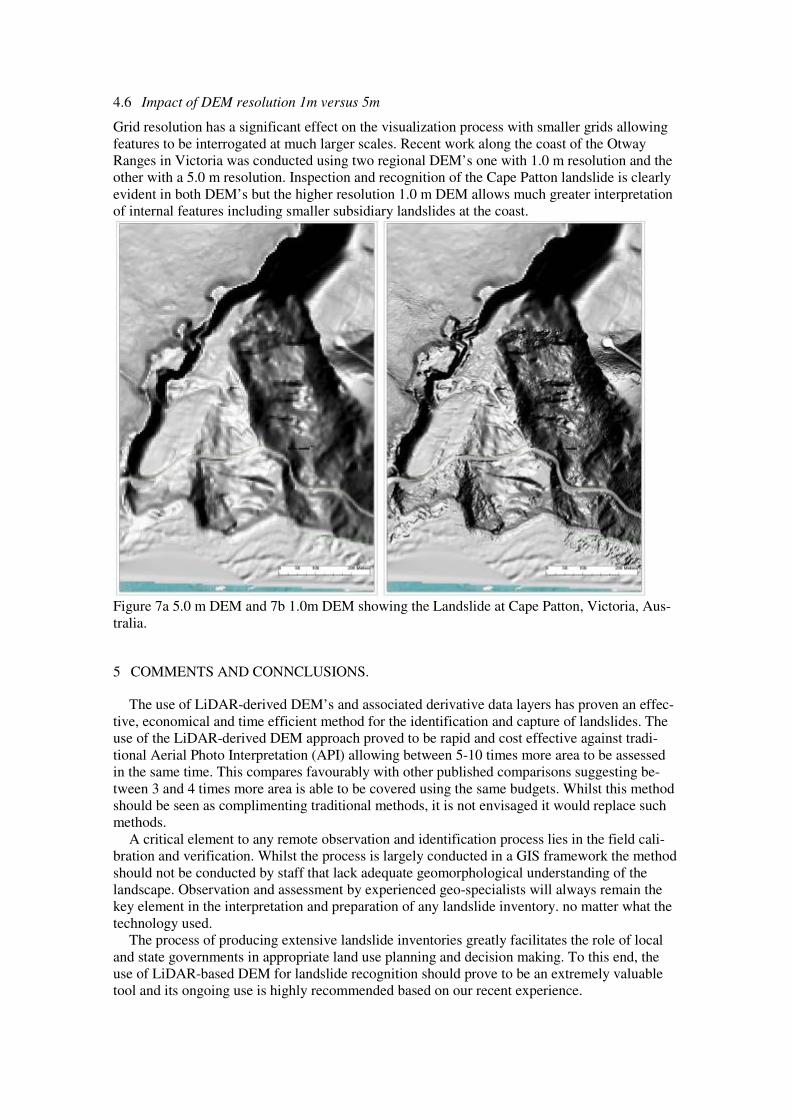
ple a slide flow which is known to have occurred in 1957 in the Razorback ranges near Picton,
New South Wales, Australia, is still clearly evident in the 2.0 m DEM produced in 2009.
Figure 4a 2009 DEM (2.0 m resolution) showing landslide in Razorback Ranges near Picton,
New South Wales , Australia and 4b historical photo at time of occurrence in 1957.
4.4 Effects o f Geology
One significant advantage of the use of high resolution DEM’s in vegetated and forested
landscapes is the removal of such obstructions to aid visual interpretation. In such cases geo-
logic features such as bedding and layering can become apparent and in some cases may be mis-
taken for slope instability. Figure 5a shows an area of slope instability in a deep tertiary clay en-
vironment with clear bedding in the Heytesbury region, south west Victoria, whilst Figure 5b
shows a slope with no instability but a distinct harder, more erosion resistant sandstone interbed
within the Barrabool Hills near Geelong, Victoria.
Figure 5 Instability on deep deposits on banded Gellibrand Marl near Cowley’s Creek, Victoria
and 5b No instability on interbedded sandstone in the Barabool Hills near Geelong, Victoria
4.5 Tree Artifacts in the DEM
Processing of the raw LiDAR data can involve a number of filtering techniques to differenti-
ate between the various signal returns in order to produce a “bare earth” model. Whilst this
process is generally very successful, some remnant signals or artifacts can be left in the topog-
raphic models which do not represent the ground surface. Commonly, artifacts from building
and trees can be seen such as those shown in Figure 6 which clearly shows effects from trees.
The 1.0 m DEM is from the fringe of the Otway Ranges near Johanna in far south west Victoria.
Figure 6 Tree artifacts in a 1.0m DEM near Johanna, Otway Ranges, Victoria, Australia
4.6 Impact of DEM resolution 1m versus 5m
Grid resolution has a significant effect on the visualization process with smaller grids allowing
features to be interrogated at much larger scales. Recent work along the coast of the Otway
Ranges in Victoria was conducted using two regional DEM’s one with 1.0 m resolution and the
other with a 5.0 m resolution. Inspection and recognition of the Cape Patton landslide is clearly
evident in both DEM’s but the higher resolution 1.0 m DEM allows much greater interpretation
of internal features including smaller subsidiary landslides at the coast.
Figure 7a 5.0 m DEM and 7b 1.0m DEM showing the Landslide at Cape Patton, Victoria, Aus-
tralia.
5 COMMENTS AND CONNCLUSIONS.
The use of LiDAR-derived DEM’s and associated derivative data layers has proven an effec-
tive, economical and time efficient method for the identification and capture of landslides. The
use of the LiDAR-derived DEM approach proved to be rapid and cost effective against tradi-
tional Aerial Photo Interpretation (API) allowing between 5-10 times more area to be assessed
in the same time. This compares favourably with other published comparisons suggesting be-
tween 3 and 4 times more area is able to be covered using the same budgets. Whilst this method
should be seen as complimenting traditional methods, it is not envisaged it would replace such
methods.
A critical element to any remote observation and identification process lies in the field cali-
bration and verification. Whilst the process is largely conducted in a GIS framework the method
should not be conducted by staff that lack adequate geomorphological understanding of the
landscape. Observation and assessment by experienced geo-specialists will always remain the
key element in the interpretation and preparation of any landslide inventory. no matter what the
technology used.
The process of producing extensive landslide inventories greatly facilitates the role of local
and state governments in appropriate land use planning and decision making. To this end, the
use of LiDAR-based DEM for landslide recognition should prove to be an extremely valuable
tool and its ongoing use is highly recommended based on our recent experience.
6 REFERENCES
AGS 2007a. Guideline for landslide susceptibility, hazard and risk zoning for land use planning.
Australian Geomechanics 42: 13-36. [www.australiangeomechanics.org].
AGS 2007b. Commentary on guideline for landslide susceptibility, hazard and risk zoning for
land use planning. Australian Geomechanics 42: 37-58. [www.australiangeomechanics.org].
AGS 2007c. Practice note guidelines for landslide risk management. Australian Geomechanics
42: 63-114. [ www.australiangeomechanics.org].
Flentje, P., Miner, A.S. and Mazengarb, C., 2010. Continuous landslide monitoring to assess
landslide frequency – selected Australian examples. IAEG Geology and the Environ-
ment Congress, Auckland, 5-10 September 2010. McKean, J and Roering J. 2004. Objective Landslide Detection and Surface Morphology Map-
ping using High Resolution Airborne Laser Altimetry. Geomorphology 70, 339-351.
Mazengarb ,C. Flentje, P., Miner, A.S. and Oscuchowski, M., 2010. Designing a Landslide Da-
tabase: lessons learnt from Australian Examples. IAEG Geology and the Environment Con-
gress, Auckland, 5-10 September 2010. Miner, A.S., Vamplew, , P, D.J. Windle, Flentje Dr. P. and D.J. Dr. P, Warner 2010. A com-
parative study of Various Data Mining techniques as applied to the modeling of Landslide sus-
ceptibility on the Bellarine Peninsula, Victoria, Australia. IAEG Geology and the Environ-
ment Congress, Auckland, 5-10 September 2010. Palamara, DR, Brassington, G, Flentje, P & Baafi,E, 2006. High-resolution topographic data for
subsidence impact assessment and SMP preparation :methods and considerations, Coal 2006:
7th Underground Coal Operators’ Conference, University of Wollongong, Australia, 5-7 July
2006, 276-292.
Hengl, T 2006. Finding the right pixel size. Computers and Geosciences, 32 pp. 1283-1298.
USACE 2002 US Army Corps of Engineers. Airborne LiDAR Topographic Surveying. In US
Army Copr of Engineers Eds. Engineering and Design-Photogrammetric Mapping EM 1110-1-
1-1000 Ed pp 11-1-11-12. USCAE, Washington.
Varnes, D.J. 1978. Slope Movement Types and Processes. In Special Report 1976 : Landslides:
Analysis and Control (R.L.Schuster and R.J. Krizek, eds), TRB, National Research Council,
Washington, D.C. pp. 11-33.