Embed Size (px)
Citation preview
Journal of Mining and Metallurgy, 52 A (1) (2016) 11 - 25
#Corresponding author: [email protected]
EVALUATION OF HPGR AND VRM FOR DRY COMMINUTION OF
MINERAL ORES
A. Jankovic1,#
, C. Ozer2, W. Valery
3, K. Duffy
1
1Metso Process Technology and Innovation, PO Box 221, Kenmore, QLD 4069, Australia 2Metso Process Technology and Innovation, P.O. Box 306, FI-33101, Tampere, Finland
3University of Queensland, St Lucia QLD 4072, Australia
(Received: February 2, 2016; Accepted: November 4, 2016)
Abstract
The mining industry is searching for more energy efficient and dry comminution equipment as an alternative to
conventional crushing followed by wet grinding circuits. This is a result of growing challenges associated with the
increasing energy cost, scarcity of water resources and stricter environmental legislation. Dry comminution
technologies, such as High Pressure Grinding Rolls (HPGR) and Vertical Roller Mills (VRM), have been successfully
used in other industries such as cement and coal for decades, and the literature claims that these technologies are
more energy efficient than conventional comminution practices. Pilot scale testing was conducted for each of these
technologies using rock with properties similar to many mineral ores to test the claims in the literature and evaluate
the applicability for hard rock mining operations. Whilst the test results for the HPGR and VRM are not directly
comparable (due to different degree of size reduction), both demonstrated the potential for considerable energy
savings compared to conventional ball milling. The HPGR and air classification circuit used 20 – 30 % less energy
than the HGPR, screen, ball mill circuit. While VRM was estimated to use 10 – 30 % less energy (depending on the
type of VRM) than a ball mill circuit for a similar degree of comminution.
Key words: comminution; HPGR; VRM; energy efficiency; air classification; ball mill.
1. Introduction
Traditionally, the comminution of mineral
ores involves dry crushing of moist ore
followed by wet grinding and classification
stages to reach a target grind size. However,
the mining industry is facing growing
challenges associated with the increasing cost
of energy, scarcity of water resources in
some locations and tighter environmental
legislation. Consequently, the mining industry
is searching for more energy efficient and dry
comminution equipment as an alternative to
conventional crushing and wet grinding
circuits. Dry comminution technologies, such
as High Pressure Grinding Rolls (HPGR) and
Vertical Roller Mills (VRM) have been
successfully used in other industries for
decades. However, there are only a few
examples of these technologies in mineral ore
applications to date.
HPGR in closed circuit with air
classification have been used in the cement
industry since 1985 for reliable pre-mill or
final product grind, reducing power and steel
usage cost, and increasing capacity, while
generating high quality product as fine as 25
µm [1, 2]. In recent times, studies and
applications of HPGR for mineral ores have
become more common. Several notable hard
rock installations include Cerro Verde
McMoRan Copper-Molybdenum in Peru,
Mogalakwena Anglo American Platinum in
South Africa, Boddington Newmont Copper-
J o u r n a l o f
M i n i n g a n d
M e t a l l u r g y

12 A. Jankovic et al. / JMM 52 A (1) (2016) 11 - 25
Gold in Australia, Grasberg McMoRan
Copper-Gold in Indonesia, CVRD Iron Ore in
Brazil, Kudremukh Iron Ore in India, El
Brocal Lead-Zinc and Copper in Peru, CAP
Minería Iron Ore in Chile, and SNIM Iron Ore
in Mauritania [3-5].
The current VRM design has been
available since the early 1900s, and is
accepted technology in the cement, power and
industrial minerals industries. VRMs are
recognised as one of the more efficient
comminution devices currently available and
are used today to simultaneously grind and
dry materials such as limestone, quick lime,
cement raw materials, talc, bauxite,
magnesite, phosphate, feldspar, barites,
graphite and coal [6]. The dominant use of the
VRM is in raw material for cement production
and coal grinding, but there are very few
examples of VRM usage within the broader
mining industry: Schaefer [7] describes VRM
grinding of phosphate, while Geroldet al. [8]
report applications in copper matte, steel slag
and tin slag grinding.
There is a growing interest in both HPGR
and VRM for application to mineral ores due
to the claimed benefits in energy efficiency as
well as the fact that they are dry processes.
They can also achieve a large reduction ratio
(from about -40 mm down to about 50 µm) in
a single process step. To test these claims
from the literature, pilot scale testing has been
conducted of both these technologies treating
a rock with properties comparable to that of
many mineral ores; a basalt rock obtained
from a local quarry. In each case the energy
efficiency was evaluated and compared with a
conventional ball mill for the grinding of this
relatively hard rock.
2. Description of the Technology
HPGR and VRM technologies are similar
in the fact that the main breakage mechanism
of both is compression breakage, they are both
dry processes, and they are applicable across a
similar size range. However, the machines
themselves are very different and the HPGR
operates at significantly higher pressures than
VRM. The two technologies are illustrated in
Figure 1.
Figure 1. (a)Schematic of HPGR and (b)Schematic of air-swept VRM
The HPGR comprises two motor driven
counter rotating rolls, one fixed, and one
acting against hydraulic cylinders connected
to pressurised nitrogen accumulators. Rock is
choke-fed to the roll gap, with nip and pre-
breakage occurring for particles larger than
the gap by single particle comminution, and
smaller particles forming a compressed bed
between the rolls enabling more efficient bed
breakage mechanics [3].
A. Jankovic et al. / JMM 52 A (1) (2016) 11 – 25 13
One of the main benefits of HPGR use is
comminution energy efficiency, with
researchers reporting energy savings of about
10-50% compared to grinding by
conventional ball and rod milling or semi-
autogenous grinding with ball milling [3, 9,
10].The reported energy savings depend on
the circuit arrangements, whether the grinding
is being carried out wet or dry, the hardness of
the ore, the amount of additional material
handling operations and the methods used to
define the energy savings. Other benefits
include reduced water and grinding media
use, further reducing operational costs [3].
In a VRM, material is fed to the grinding
table where it flows outward under the
influence of centrifugal force and is ground
between the grinding elements (rollers and
grinding table). They are available as two
types; air-swept and overflow. In air-swept
VRM the classification is fully internal, with
the fines and middlings transported
pneumatically from the grinding chamber to
the dynamic, high efficiency vane type
classifier at the top of the VRM. In overflow
VRM designs, material fed onto the grinding
table is allowed to overflow into the
recirculating stream from which it is
mechanically transported to an external air
classifier. In this mode, the required duty of
the fan is approximately halved, which
considerably reduces the total energy
requirement of the circuit. Feige [11] reports
a 41% decrease in specific energy
consumption in pilot scale testing of
magnesite in late 1970s due to external re-
circulation and classification. Ito et al. [12]
found that the Kawasaki CKP overflow VRM
is about 11% more efficient than conventional
VRMs in pilot-scale finish grinding of
cement.
There have been several recent studies of
the energy efficiency of VRMs. Pilot scale
results by Altunet al. [13] indicate a potential
decrease of 18% in energy consumption using
a VRM compared to an existing rod mill/ball
mill circuit when processing copper ore. Ito et
al. [12] report that at industrial scale, the roller
mill consumes at least 20% less specific
energy compared to the roll press & tube mill
or only tube mill circuits operating in the
same plant. Based on pilot tests and
simulations, van Drunicket al. [14] confirm
the energy efficiency of VRMs treating zinc
ore in comparison with other circuit options,
especially in overflow mode.
The benefits of VRMs in ore processing
circuits appear not to be limited to improved
energy consumption, but also better efficiency
in downstream operations. Crosbie et al. [15]
reported enhanced flotation kinetics and
grade-recovery curves for PGM and copper
ores. The VRM products had narrower size
distributions compared to the products
prepared by conventional comminution. The
VRM products also showed improved mineral
liberation and increased deportment of
valuable minerals to size classes that
responded better to flotation.
3. HPGR Experimental
Two HPGR flow sheet options were tested.
Option A comprised a HPGR closed with an
air classifier generating final product directly
from -10 mm feed. Option B comprised the
same HPGR closed with a 2.36 mm screen,
producing feed for a Bond mill test closed
with a 75 µm screen to generate the final
product. The power consumptions of the
HPGR, Bond mill and air classifier were
directly measured and recorded via inline
power meters, while the power consumption
of the Bond mill and a scaled-up mill were
also calculated using various methods for
comparison. Additional Bond index tests were
conducted on standard -3.35 mm Bond test
feed, -2.36 mm crushed feed, and HPGR
crushed -2.36 mm feed to aid in energy
comparison analysis.
14 A. Jankovic et al. / JMM 52 A (1) (2016) 11 - 25
The test material used in both the HPGR
and VRM pilot scale testing was basalt rock
obtained from a local quarry. Bond work
index testing conducted in these test programs
confirmed the sample was relatively hard and
comparable to many mineral ores.
The sample was pre-screened using a
“Russel” vibrating sieve with a 10 mm
aperture size, and the oversize was stage-
crushed using a laboratory jaw crusher to pass
10 mm. The resulting -10 mm sample was
homogenised and split into 32 portions of 15
kg using a 16-bin rotary splitter. A
representative sub-split was taken for size
analysis using a 12-bin rotary splitter, and a
further sub-split was taken using an eight-jar
rotary splitter to achieve a 500 g sample for
size analysis. The P80 of the -10 mm
aggregate feed was 7.4 mm. The feed for the
Bond tests was prepared by stage crushing
30 kg of the -10 mm sample to pass 3.35 mm.
Half of the -3.35 mm material was split out
and retained for the 3.35 mm Bond tests,
while the other half was screened at 2.36 mm
to produce the sample for the 2.36 mm Bond
tests.
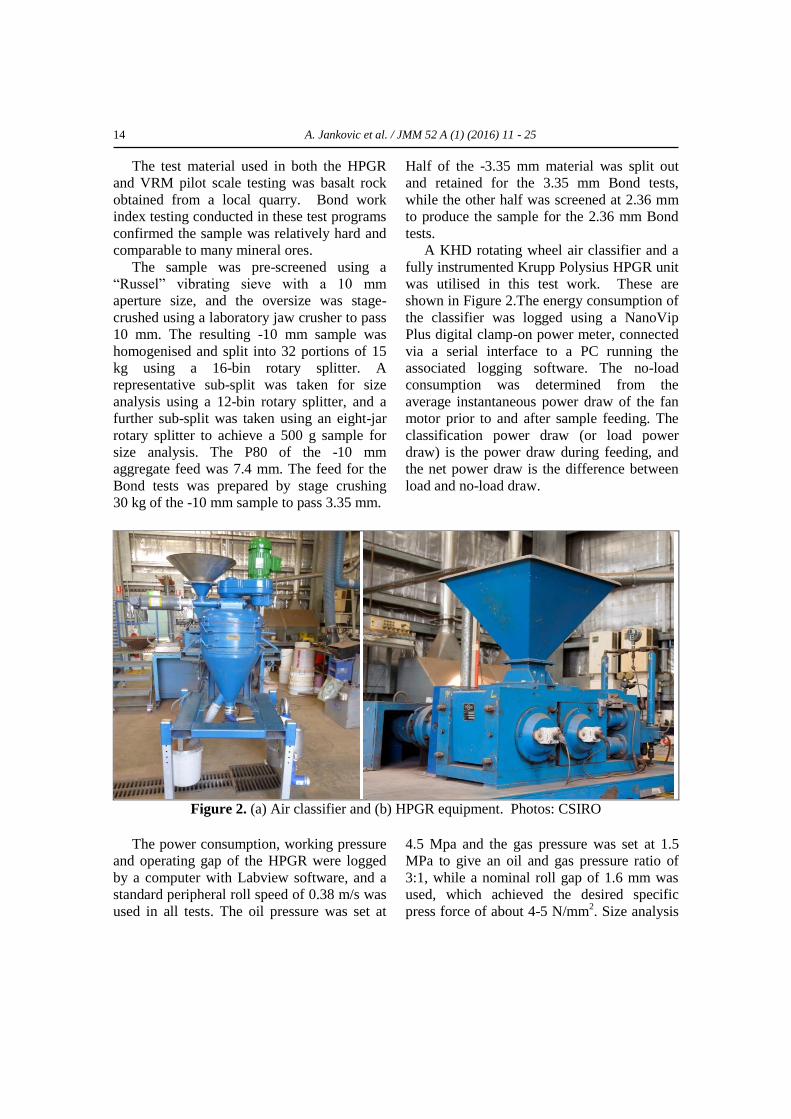
A KHD rotating wheel air classifier and a
fully instrumented Krupp Polysius HPGR unit
was utilised in this test work. These are
shown in Figure 2.The energy consumption of
the classifier was logged using a NanoVip
Plus digital clamp-on power meter, connected
via a serial interface to a PC running the
associated logging software. The no-load
consumption was determined from the
average instantaneous power draw of the fan
motor prior to and after sample feeding. The
classification power draw (or load power
draw) is the power draw during feeding, and
the net power draw is the difference between
load and no-load draw.
Figure 2. (a) Air classifier and (b) HPGR equipment. Photos: CSIRO
The power consumption, working pressure
and operating gap of the HPGR were logged
by a computer with Labview software, and a
standard peripheral roll speed of 0.38 m/s was
used in all tests. The oil pressure was set at
4.5 Mpa and the gas pressure was set at 1.5
MPa to give an oil and gas pressure ratio of
3:1, while a nominal roll gap of 1.6 mm was
used, which achieved the desired specific
press force of about 4-5 N/mm2. Size analysis
A. Jankovic et al. / JMM 52 A (1) (2016) 11 – 25 15
was carried out on all feed and product
samples by splitting to 300 g and wet
screening over a 38 µm screen, with the
oversize being dry screened using a standard
screen series from 9500 µm to 38 µm.
4. Test Procedure
Option A – HPGR in closed circuit with
air classifier:
For each grinding cycle, 20 kg of sample
was passed through the HPGR followed by air
classification. Fresh feed equivalent to the
quantity of removed fine product was added
to the coarse product of the air classifier,
homogenised by three passes through a 12-bin
rotary splitter, and utilised as feed for the next
cycle. Six locked cycles were completed at the
determined press force, with feed and product
samples taken for size analysis.
Option B – HPGR in closed circuit with
2.36 mm screen plus ball milling:
For each grinding cycle, 30 kg of sample was
passed through the HPGR followed by dry
screening at 2.36 mm. Feed for the next cycle
was produced by adding fresh feed equivalent
to the amount of removed screen undersize to
the screen oversize, followed by
homogenising by three passes through a 12-
bin rotary splitter. Six locked cycles were
performed, with all -2.36 mm products
combined, homogenised and split to produce a
10 kg sample of -2.36 mm for Bond testing
and size analysis.
Ball mill grindability tests:
Bond ball mill locked cycle tests were
carried out at a closing screen size of 75 µm
using a standard (305 mm diameter)
laboratory-scale Bond mill with a standard
Bond ball charge. Mill energy consumption
was logged to computer using the NanoVip
clamp-on power meter described earlier. No-
load power draw was determined by running
the mill empty for 1 hour while logging and
then averaging the instantaneous power
recorded in the 5 minutes prior to the test. The
power draw of the loaded mill was determined
by averaging the power draw recorded during
testing, with the net power draw being the
difference between the load and no-load
power draw.
5. HPGR Results
For Option A (HPGR in closed circuit with
air classifier) the average net specific energy
consumption was 6.1 ± 1.2 kWh/t for the air
classifier, 7.9 ± 1.0 kWh/t for the HPGR, and
14.0 ± 2.2 kWh/t overall. The circulating load
of the last two cycles was approximately
700% and produced a product with a P80 of
50 µm. Approximately 5% flake was
generated by the HPGR; however, it was of
low competency, decomposing when fed to
classification.
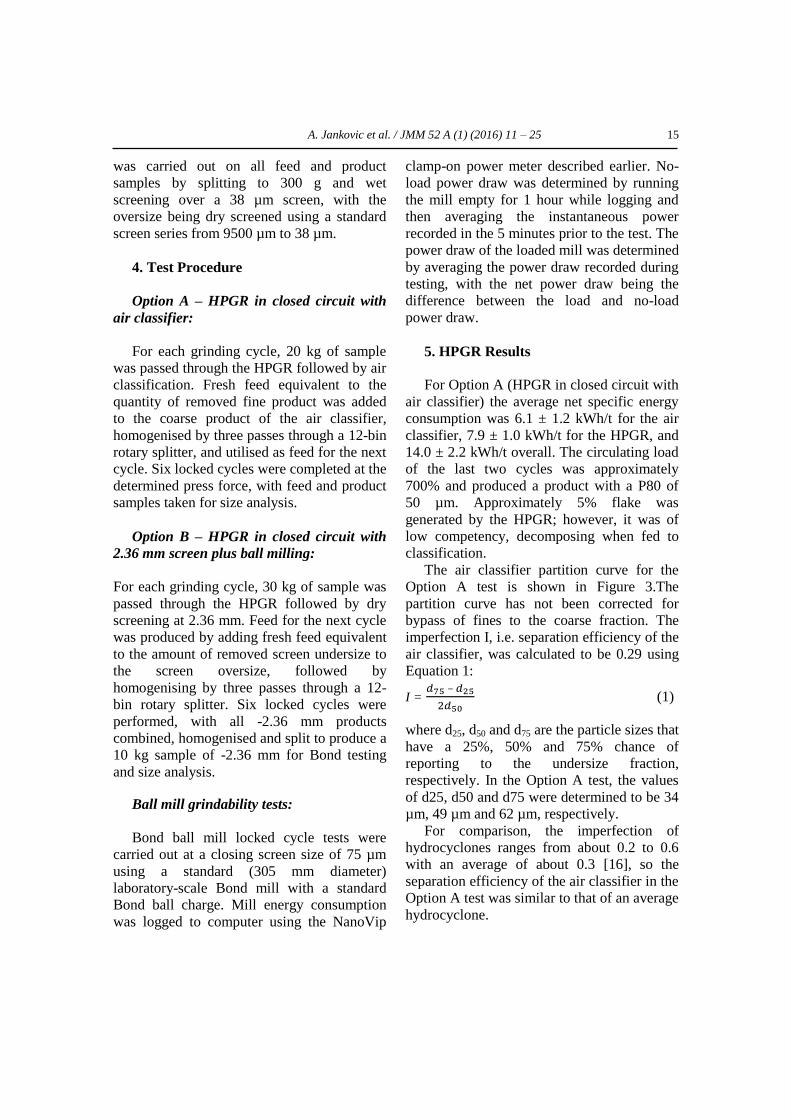
The air classifier partition curve for the
Option A test is shown in Figure 3.The
partition curve has not been corrected for
bypass of fines to the coarse fraction. The
imperfection I, i.e. separation efficiency of the
air classifier, was calculated to be 0.29 using
Equation 1:
I = 𝑑75 – 𝑑25
2𝑑50 (1)
where d25, d50 and d75 are the particle sizes that
have a 25%, 50% and 75% chance of
reporting to the undersize fraction,
respectively. In the Option A test, the values
of d25, d50 and d75 were determined to be 34
µm, 49 µm and 62 µm, respectively.
For comparison, the imperfection of
hydrocyclones ranges from about 0.2 to 0.6
with an average of about 0.3 [16], so the
separation efficiency of the air classifier in the
Option A test was similar to that of an average
hydrocyclone.
16 A. Jankovic et al. / JMM 52 A (1) (2016) 11 - 25
Figure 3. Air classifier partition/efficiency curve from the HPGR Option A test.
For Option B (locked cycle HPGR closed
with a 2.36mm screen and Bond test closed
with a 75 µm screen), the average net specific
energy consumption for the circuit was
2.8±0.4kWh/t for the HPGR, 17.1±1.8kWh/t
for the ball mill, and 19.9±2.3kWh/t overall.
The circulating load for the last two HPGR
cycles was approximately 150%.
Approximately 5% flake was generated by
the HPGR, but it was of low competency and
decomposed when fed to classification. The
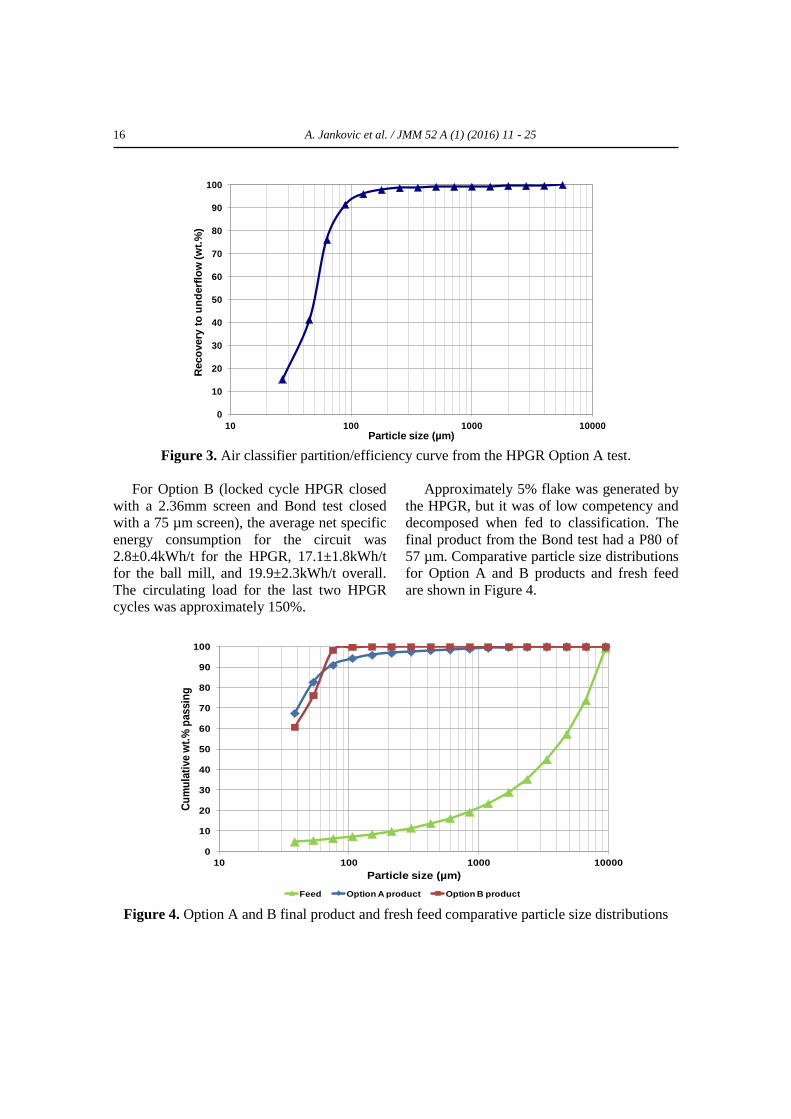
final product from the Bond test had a P80 of
57 µm. Comparative particle size distributions
for Option A and B products and fresh feed
are shown in Figure 4.
Figure 4. Option A and B final product and fresh feed comparative particle size distributions
0
10
20
30
40
50
60
70
80
90
100
10 100 1000 10000
Reco
very
to
un
derf
low
(w
t.%
)
Particle size (µm)
0
10
20
30
40
50
60
70
80
90
100
10 100 1000 10000
Cu
mu
lati
ve w
t.%
passin
g
Particle size (µm)
Feed Option A product Option B product
A. Jankovic et al. / JMM 52 A (1) (2016) 11 – 25 17
As can be seen in Figure 4, the air
classified fine product from Option A exhibits
a very wide size distribution; i.e., it contains
an unexpectedly large portion of coarse
particles (2.5% of 0.3-3.0 mm). Considering
the P80 of the fine product is approximately
50 µm, the presence of coarse particles is of
concern and an indication of coarse “by-pass”
to fines, which may create potential
downstream processing problems. Further
investigation is required to confirm if this
result is common for all similar air classifiers
or only for the particular unit and operating
conditions tested.
In addition to the Bond test described for
Option B above, which used -2.36 mm
HPGR-crushed feed, Bond tests were also
completed using 3.35mm standard Bond test
feed and -2.36mm jaw crushed feed, all closed
at 75 µm to produce a similar product to that
of Option A (P80= 50 µm) for comparison. It
should be noted that the product P80 of these
tests (57 µm) is larger than, but similar to, that
of Option A (50 µm). These tests showed that
the work indices of standard crushed -3.35mm
and -2.36mm feed were similar (15.0 and
15.3kWh/t, respectively) while the HPGR
crushed -2.36mm feed produced a lower work
index of 14.0kWh/t. This result agrees with
observations by Daniel [9] that HPGR renders
a sample more amenable to comminution by
introducing micro-cracks.
The aim of this test work was to
investigate the comparative energy use of
HPGR with air classification and HPGR with
screening and subsequent ball milling to
produce a relatively fine product from a 10
mm top size feed aggregate material. The
overall circuit energy consumptions are
summarised in Table 1.
Table 1. Overall circuit option specific energy input comparison results.
Stage Option A Option B Option B Units Method
HPGR from 10 mm to 50 µm 7.9 kWh/t Direct power
logging Air classifier 6.1 kWh/t Direct power
logging HPGR from 10 mm to 2.36 mm 2.8 2.8 kWh/t Direct power
logging Ball mill from 2.36 mm to 57
µm 17.1 kWh/t Direct power
logging Ball mill from 2.36 mm to 57
µm 14.9 kWh/t Bond’s third
law OVERALL 14.0 19.9 17.7 kWh/t
The specific energy input of the Option A
circuit (HPGR with air classification) was
14.0 kWh/t using direct power logging, while
it was 19.9 kWh/t for the Option B circuit
(HPGR with screening and ball milling) using
direct power logging. That is, the Option A
circuit consumed 29.5% less energy per tonne
of ore processed than the Option B
circuit when compared at laboratory-scale.
Alternatively, the specific energy input of the
Option B circuit was 17.7 kWh/t when the
ball mill specific grinding energy was
calculated using Bond’s third law. That is, the
Option A circuit consumes 20.8% less energy
per tonne of ore processed than the Option B
circuit when the ball mill in the latter circuit is
scaled up to a 2.44m industrial wet mill. This
second comparison, however, does not take
into account any potential efficiency increase
with up-scale of HPGR and air classifier
equipment. The calculation of specific energy
input for these tests is described in more detail
by Jankovic et al. [17]. The calculated energy
savings of Option A are considered
conservative because the P80of the product
was 50 µm while that of Option B was 57 µm.
On the other hand, this study has not taken
into account the power consumption of
18 A. Jankovic et al. / JMM 52 A (1) (2016) 11 - 25
ancillary material handling equipment that
would be required in industrial scale circuits,
or the capital cost of equipment and grinding
media. These findings are in line with other
published results [1, 2].
6. VRM Experimental
The VRM tests were conducted using the
same basalt rock as used in the HPGR test
program. A total of about six tonnes of rock
sample, having a top size of approximately 35
mm, was split in to thirty-two samples using a
rotary splitter. The sub-samples were crushed
using a jaw crusher with a 10 mm open-side
setting to suit the feed size requirements of the
pilot-scale VRM.A sub-sample was further
crushed to 100% minus 3.35 mm and the
Bond ball mill grindability index was
determined following the standard procedure.
The closing screen size was selected as 212
µm for the targeted P80 of around 150-160
µm. The Bond work index for the basalt rock
used as the VRM feed was found to be
15.5 kWh/t. This classifies it as relatively hard
rock and aligns well with the Bond work
index results from the HPGR test program
(15.0 and 15.3kWh/t).
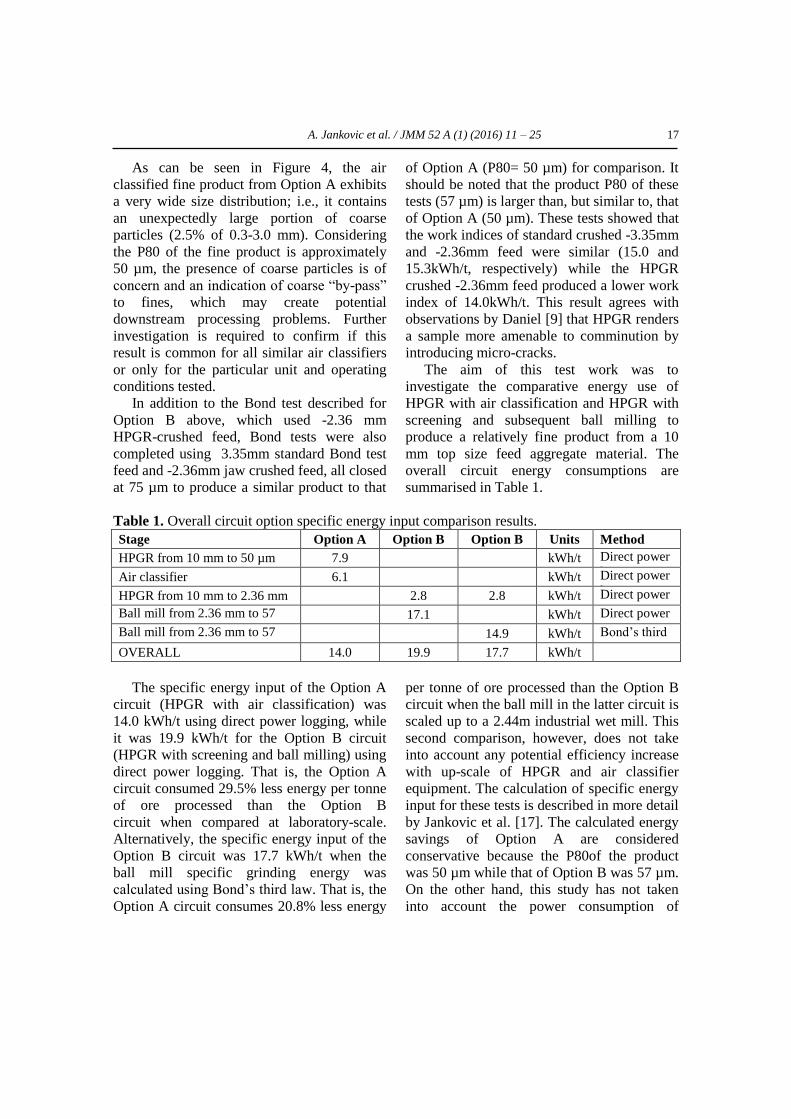
The VRM tests were carried out using a
Raymond Model RP153X bowl mill at the
ALS Coal Division laboratory in Brisbane,
Australia. The Raymond mill comprises a
rotating table (bowl) driven by a vertical shaft,
three grinding rollers and an integral double
cone classifier (see Figure 5).
The sample was fed to the centre of the
table at a rate controlled by a belt feeder. The
mill operated under negative air pressure and
material flowing over the side of the table was
pneumatically transported to the internal
classifier. Material that was insufficiently fine
to be picked up by the air flow dropped into
the rejects bin at the base of the mill.
Figure 5. Raymond Model RP153X VRM
test unit used for test work
At the classifier, fine particles were
transported out of the mill and collected in a
bag filter; coarse particles gravitated back to
the table. The mill outlet temperature (and
thus the mill inlet temperature) was
automatically controlled by regulating the
natural gas flow to the air heater. Four tests
were conducted with operational variable
settings as shown in Table 2.
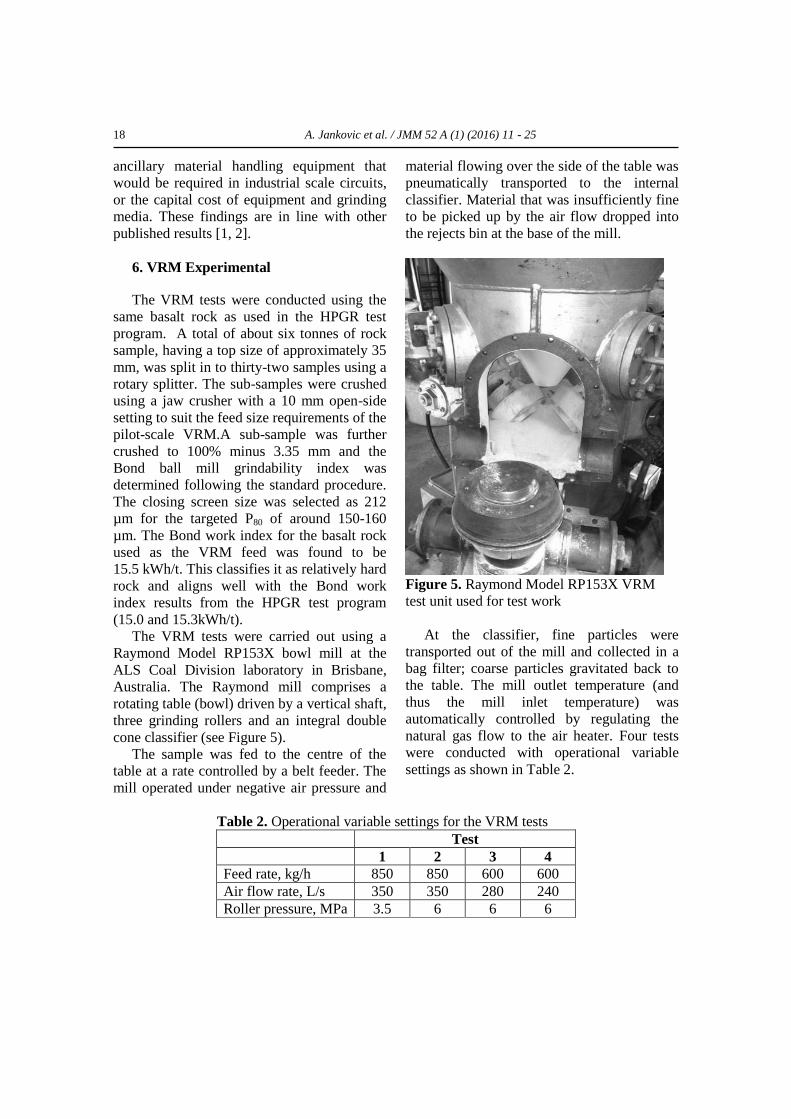
Table 2. Operational variable settings for the VRM tests
Test
1 2 3 4
Feed rate, kg/h 850 850 600 600
Air flow rate, L/s 350 350 280 240
Roller pressure, MPa 3.5 6 6 6
A. Jankovic et al. / JMM 52 A (1) (2016) 11 – 25 19
Тhe duration of each test was
approximately 30 minutes. A sub-sample of
100 g was split from the product of each test
for particle size analysis, by initial wet sieving
at 38 µm followed by dry sieving of the
oversize.
7. VRM Results
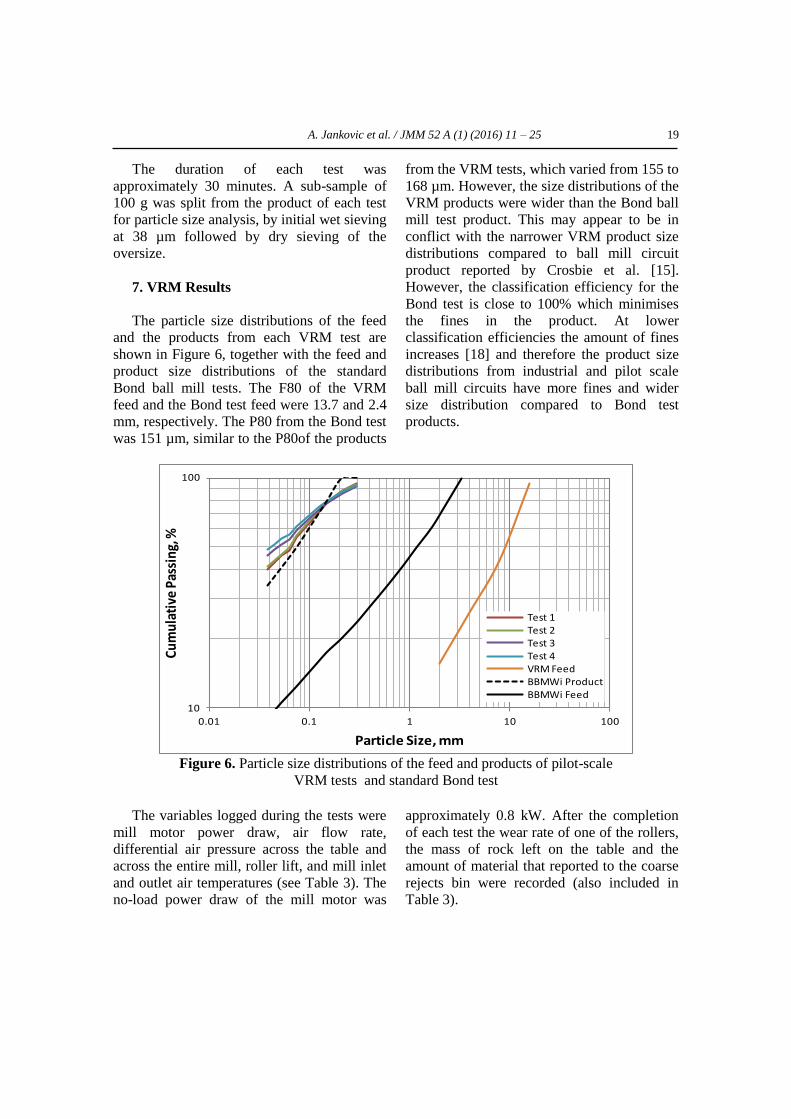
The particle size distributions of the feed
and the products from each VRM test are
shown in Figure 6, together with the feed and
product size distributions of the standard
Bond ball mill tests. The F80 of the VRM
feed and the Bond test feed were 13.7 and 2.4
mm, respectively. The P80 from the Bond test
was 151 µm, similar to the P80of the products
from the VRM tests, which varied from 155 to
168 µm. However, the size distributions of the
VRM products were wider than the Bond ball
mill test product. This may appear to be in
conflict with the narrower VRM product size
distributions compared to ball mill circuit
product reported by Crosbie et al. [15].
However, the classification efficiency for the
Bond test is close to 100% which minimises
the fines in the product. At lower
classification efficiencies the amount of fines
increases [18] and therefore the product size
distributions from industrial and pilot scale
ball mill circuits have more fines and wider
size distribution compared to Bond test
products.
Figure 6. Particle size distributions of the feed and products of pilot-scale
VRM tests and standard Bond test
The variables logged during the tests were
mill motor power draw, air flow rate,
differential air pressure across the table and
across the entire mill, roller lift, and mill inlet
and outlet air temperatures (see Table 3). The
no-load power draw of the mill motor was
approximately 0.8 kW. After the completion
of each test the wear rate of one of the rollers,
the mass of rock left on the table and the
amount of material that reported to the coarse
rejects bin were recorded (also included in
Table 3).
10
100
0.01 0.1 1 10 100
Cum
ulat
ive
Pass
ing,
%
Particle Size, mm
Test 1Test 2Test 3Test 4VRM FeedBBMWi ProductBBMWi Feed
20 A. Jankovic et al. / JMM 52 A (1) (2016) 11 - 25
Table 3. VRM test operating variables
Variable Test
1 2 3 4
Grinding table motor power, kW 5.6 6.6 6.2 6.3
Air flow rate, L/s 348 348 281 240
Roller pressure, MPa 3.4 6.0 6.0 6.1
Table differential pressure, kPa 1.0 0.8 0.8 0.6
Mill differential pressure, kPa 2. 2.2 1.8 1.5
Roller lift, mm 8.8 3.3 6 6.5
Inlet temperature, °C 160 171 139 148
Outlet temperature,°C 76 76 72 73
Rollerwear, g/t 20.4 24 28.2 29.6
Mass left, kg 10 7.5 6.3 4.6
Rejects (% of feed) 0.01 0.002 0.007 0.02
Pneumatic transportation of the grinding
table product to the classifier in air swept
VRMs is achieved with the pressurised air
supplied by a fan. The proportion of fan motor
specific energy consumption to the total of fan
and the mill motors of VRMs varies
considerably in the literature, from 18 to 61%,
with most falling between 40 and 50% [11-14,
19-21].
The power draw of the VRM mill motor
was continuously logged during the test
however the pilot scale VRM was not
instrumented to measure the fan motor power
draw. Fan motor power was estimated using
Equation 2 [22]. The mill differential pressure
was measured but the differential pressures
across the air damper and bag filter had to be
estimated in order to determine the overall
differential pressure. The fan motor efficiency
was assumed to be 60%. The measured flow
rates were corrected using the air temperatures
corresponding to each section.
𝑃 =𝑄∆𝑝
1000⁄ (2)
Where P is the fan power (kW), Q the flow
capacity (L/s), and ∆p the overall differential
pressure (kPa). The estimated fan motor
power draw for pneumatic transport is shown
in Table 4.
Table 4. Fan Motor Power Draw for Pneumatic Transport (kW) Stage Test
1 2 3 4
Inlet 3.5 3.6 2.7 2.3
Mill (Pneumatic transport) 1.9 1.7 1.1 0.9
Outlet 2.8 2.8 2.2 1.9
Total Fan (kW) 8.2 8.1 6.0 5.1
The estimated value for the energy
consumed by the fan motor was used along
with the direct logged mill motor (grinding
table) power to calculate the overall specific
energy consumption of the pilot-scale mill
(see Table 5). The fan energy estimates were
found to account for between 45 to 60% of the
overall VRM energy consumption, broadly in
agreement with the values reported in the
literature.
A. Jankovic et al. / JMM 52 A (1) (2016) 11 – 25 21
Table 5. Overall specific energy consumption and share of estimated fan energy
Test
1 2 3 4
Grinding table power, kW 5.6 6.6 6.2 6.3
Fan power, kW 8.2 8.1 6.0 5.1
Overall power, kW 13.7 14.7 12.2 11.4
Grinding table specific energy, kWh/t 6.5 7.8 10.3 10.6
Fan specific energy consumption, kWh/t 9.6 9.5 10.1 8.5
Overall specific energy, kWh/t 16.1 17.3 20.4 19.0
Fan specific energy as % of overall 59.4 55.0 49.6 44.5
The specific energy consumption estimates
in Table 5 includes the energy consumption
due to pressure losses at the mill inlet damper
and the product filter. These specific energy
estimates are related to material transport and
classification operations in the mill and may
not be as high in full scale operation as in
pilot scale tests. This is especially true for
overflow mode VRMs.
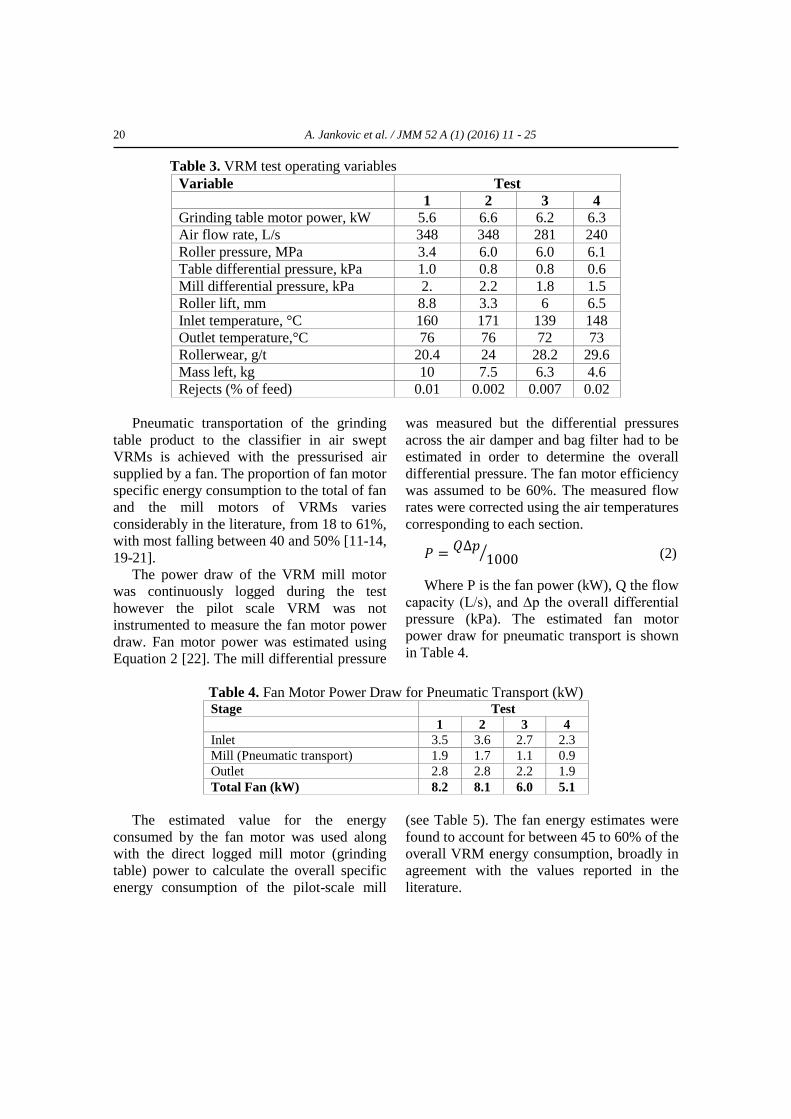
The differential pressure across a VRM is
an indicator of the size of the circulating load
that develops in the mill. Increased mill feed
and air flow rates result in increased material
recirculation and hence pressure loss, and this
effect is visible in Figure 7a. Increased
circulating load not only results in reduced
specific energy consumption (Figure 7b), but
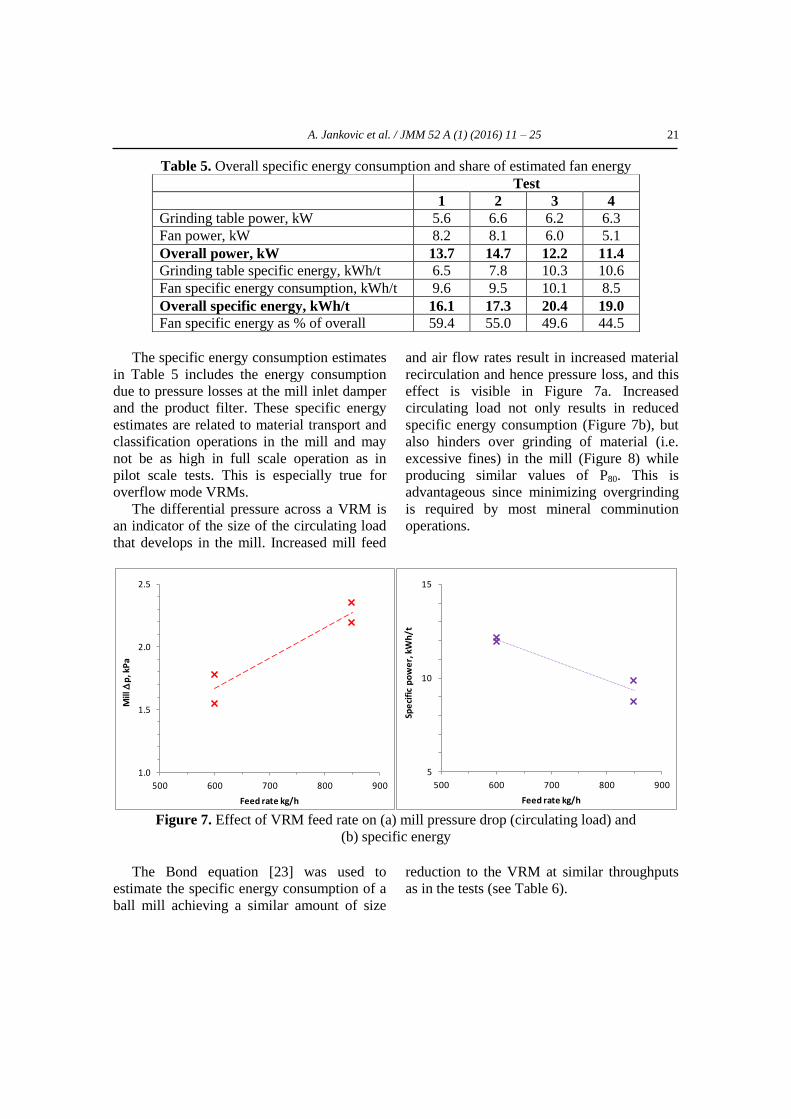
also hinders over grinding of material (i.e.
excessive fines) in the mill (Figure 8) while
producing similar values of P80. This is
advantageous since minimizing overgrinding
is required by most mineral comminution
operations.
Figure 7. Effect of VRM feed rate on (a) mill pressure drop (circulating load) and
(b) specific energy
The Bond equation [23] was used to
estimate the specific energy consumption of a
ball mill achieving a similar amount of size
reduction to the VRM at similar throughputs
as in the tests (see Table 6).
1.0
1.5
2.0
2.5
500 600 700 800 900
Mill
Dp
, kP
a
Feed rate kg/h
5
10
15
500 600 700 800 900
Spe
cifi
c p
ow
er,
kW
h/t
Feed rate kg/h
22 A. Jankovic et al. / JMM 52 A (1) (2016) 11 - 25
Figure 8. Effect of circulating load on
product fineness
Comparing the VRM overall kWh/t from
Table 5 and adding 10% to the Bond kWh/t
from Table 6 to account for slurry pump
power required for hydrocyclone
classification, one may conclude that VRM
and ball mill circuit are similar in energy
consumption. However, at industrial scale, it
is likely that VRM energy consumption by the
fan motor will be less than 50% of the total
and hence VRMs should provide better energy
efficiency. Moreover, it is known that
overflow mode of operation provides even
better energy efficiency for these mills besides
the additional advantages, e.g. no grinding
media and less wear, no water requirement,
smaller foot print, etc.
Table 6. Estimated ball mill specific energy consumptions
Test
1 2 3 4
F80, mm 13.7
P80, mm 0.159 0.158 0.168 0.155
Bond specific energy, kWh/t 15.5 15.6 16.1 16.8
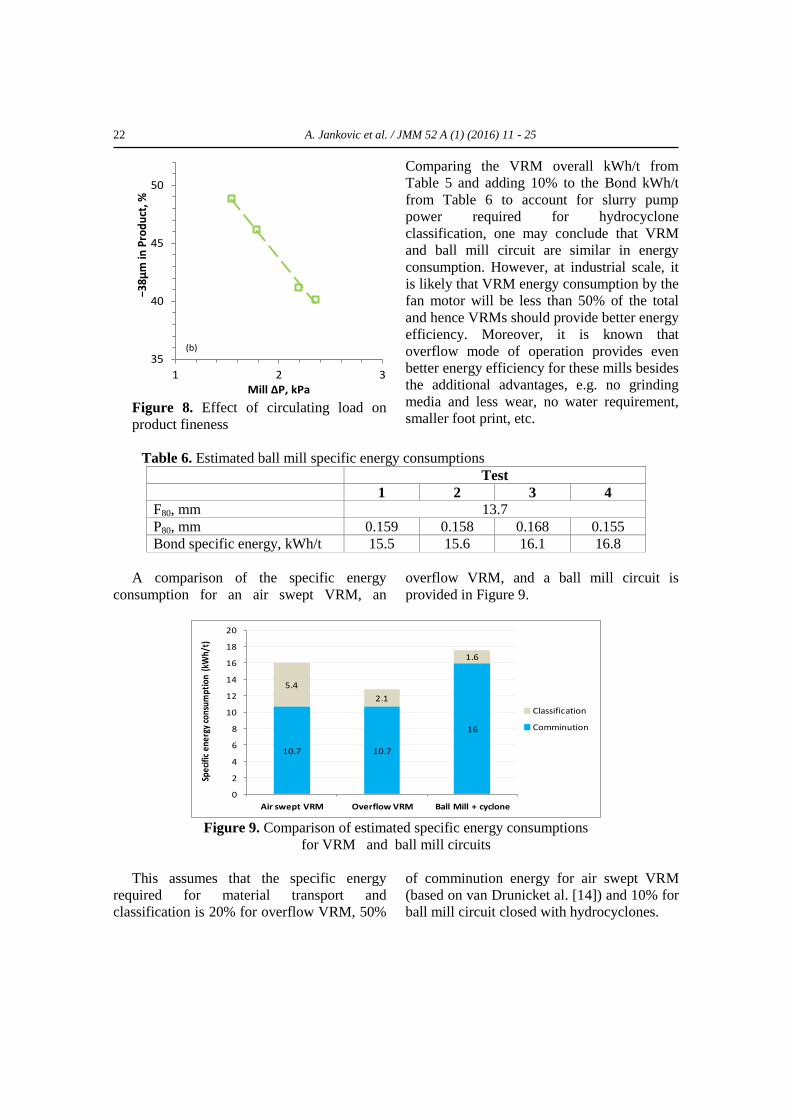
A comparison of the specific energy
consumption for an air swept VRM, an
overflow VRM, and a ball mill circuit is
provided in Figure 9.
Figure 9. Comparison of estimated specific energy consumptions
for VRM and ball mill circuits
This assumes that the specific energy
required for material transport and
classification is 20% for overflow VRM, 50%
of comminution energy for air swept VRM
(based on van Drunicket al. [14]) and 10% for
ball mill circuit closed with hydrocyclones.
35
40
45
50
1 2 3
−38µ
m in
Pro
du
ct, %
Mill ∆P, kPa
(b)
10.7 10.7
16
5.4
2.1
1.6
0
2
4
6
8
10
12
14
16
18
20
Air swept VRM Overflow VRM Ball Mill + cyclone
Spec
ific
ener
gy c
onsu
mpt
ion
(kW
h/t)
Classification
Comminution
A. Jankovic et al. / JMM 52 A (1) (2016) 11 – 25 23
The VRM comminution specific energy is
the average of the grinding table specific
energies from Table 5 and the Bond specific
energy data is from Table 6. This rather
simplified analysis confirms the literature
claims that VRMs with overflow design may
be 30% more energy efficient than
conventional wet ball mill circuits.There was
insufficient data to investigate the effect of
roller pressure. Studies in the literature
indicate that the relative increase in power
draw with pressure is often compensated for
by changes in the amount of product [24, 25].
8. Discussion
Pilot scale testing determined that a HPGR
in closed circuit with air classification
generating final product (P80 of 50 µm)
offered a power saving of about 20 to 30%
compared to a HPGR in closed circuit with a
2.36 mm screen followed by ball milling. The
specific energy consumption of the HPGR
with air classification was 14.0 kWh/t (from
direct power logging). For the HPGR in
closed circuit with a screen followed by ball
milling the specific energy consumption was
19.9 kWh/tusing direct power logging and
17.7 kWh/t when calculated using Bond’s
third law [16]. Further Bond tests showed that
the Bond work indicesof standard jaw crushed
feed to -3.35mm and -2.36mm were similar
(15.0 and 15.3 kWh/t, respectively), while the
HPGR crushed feed to -2.36mm produced a
lower Bond work index of 14.0 kWh/t. These
results agree with observations in literature
that HPGR renders a sample more amenable
to comminution, most likely due to the
introduction of micro-cracks.
Therefore, the use of HPGR and air
classification for energy efficient grinding in
the mining industry is promising. One concern
is that the air classifier product contained an
unexpectedly large proportion of coarse
particles, which may be due to deficiencies of
the actual laboratory unit or operating
conditions. However, verification of this
would require further investigation. Another
consideration is that the final product size
(P80 of 50 µm) used in this study is very fine
(similar to that used in the cement industry),
while the circulating load in the HPGR was
700%, which is quite high. The circulating
load in the HPGR would be expected to be
lower if the cut size of the air classifier was
coarser, but ball milling might be more energy
efficient at coarser grind sizes. It would
therefore be of interest in future work to
evaluate HPGR with air classification against
ball milling and screening for coarser product
sizes with P80 in the range of about 150-
300 µm.
Meanwhile, pilot scale testing of
conventional (i.e. air swept mode) VRM
treating the same material to a product size
with a P80of about 150 - 160 µm resulted in
overall specific energy consumption of 16.1 to
20.4 kWh/t. Comminution only specific
energy consumption during the tests was
found to be in the 8.7 – 12.2 kWh/t range.
Industrial scale VRM is likely to have less
energy consumption by the fan motor and
overflow type VRM are known to provide
even better energy efficiency.
For the material and size reduction in these
tests, the specific energy consumption for
industrial scale air swept VRM, overflow
VRM and a ball mill circuit closed with
hydrocyclones was estimated to be about 16,
13 and 18 kWh/t respectively. Therefore, this
preliminary comparison indicates that VRM,
particularly with overflow design, is likely to
be significantly more energy efficient than
ball milling to achieve similar degree of
comminution, justifying further investigation.
9. Conclusion
There is a growing interest in both HPGR
and VRM for application to mineral ores due
24 A. Jankovic et al. / JMM 52 A (1) (2016) 11 - 25
to the claimed benefits in energy efficiency as
well as the fact that they are dry processes.
These technologies have been successfully
used in other industries for decades, but there
are only a few examples in mineral ore
applications to date. They can both potentially
operate in similar roles, from final stages of
crushing through to grinding applications, and
can achieve a large reduction ratio in a single
step.
Pilot scale testing was conducted for each
of these technologies to test the claims in the
literature and evaluate their suitability for hard
rock mining operations. The VRM and HPGR
pilot scale tests conducted in this study are not
directly comparable (despite using the same
test material) due to the different size
reduction and final product size. However,
both demonstrated the potential for
considerable energy savings compared to
conventional ball milling.
Furthermore, the benefits of these
technologies appear not to be limited to
improved energy consumption. Both
technologies do not use grinding media
(further reducing operating costs) and are dry
processes. The HPGR crushed sample had a
lower Bond Work index than jaw crushed
material; i.e. more amenable to further
comminution, and VRM is reported to
improve downstream processing operations
due to narrower size distributions and
improved mineral liberation. Given the
potential energy savings and other benefits,
further investigation is warranted. HPGR and
VRM should be considered for new circuits or
expansions, and should be evaluated during
engineering studies.
10. Acknowledgements
The HPGR pilot scale test work was
conducted by Metso Process Technology and
Innovation in collaboration with the CSIRO
Minerals Down Under flagship. The authors
thank CSIRO staff for their contribution. We
are thankful to ALS Coal for the technical
support during the VRM testing and
contributions with their expertise.
11. References
[1] Van der Meer, F.P., Ӧnol, S. and
Strasser, S. (2012) Case Study of dry
HPGR grinding and classification in ore
processing . In: 9th International Mineral
Processing Conference (Procemin 2012),
Gecamin, Santiago, 32-34.
[2] Aydoğan, N.A., Ergün, L. and Benzer, H.
(2006) High pressure grinding rolls
(HPGR) applications in the cement
industry. Minerals Engineering. 19, 130-
139.
[3] Hilden, M. and Suthers, S.(2010)
Comparing energy efficiency of multi-
pass high pressure grinding roll (HPGR)
circuits. In: XXV International Mineral
Processing Congress (IMPC) 2010
Proceedings, The Australasian Institute
of Mining and Metallurgy, Brisbane,
801-811.
[4] International Mining (2012) Better
processing. International Mining.
September 2012, 128.
[5] Weir Minerals, (2011) Introduction to
High Pressure Grinding Roll Technology
in Mining, Weir Minerals, Madison,
USA.
[6] Brundiek, H. (1989) The roller grinding
mill – its history and current situation
part 1, Aufbereitungs-Technik, 30, 10,
609-619.
[7] Schaefer, H. V. (2001) Loesche vertical
roller mills for the comminution of ores
and minerals, Minerals Engineering, 14,
10, 1155-1160.
[8] Gerold, C., Schmitz, C., Stapelmann, M.
and Dardemann, F. (2012) Recent
installations and developments of
Loesche vertical - roller - mills in the ore

A. Jankovic et al. / JMM 52 A (1) (2016) 11 – 25 25
industry, Comminution ’12, Cape Town,
South Africa, 17 - 20 April 2012.
[9] Daniel, M.J. (2007) Energy efficient
mineral liberation using HPGR
technology. PhD Thesis, University of
Queensland, Brisbane, Australia.
[10] Rosario, P and Hall, R, (2008) Analyses
of the total required energy for
comminution of hard ores in SAG mill
and HPGR circuits. In: 5th International
Mineral Processing Seminar (Procemin
2008), University of Chile, Santiago,
129-138.
[11] Feige, F.(1993) The roller grinding mill -
current technical position and potential
for development, Zement-Kalk-Gips, 46,
10, E287-E292.
[12] Ito, M., Sato, K. and Naoi, Y. (1997)
Productivity increase of the vertical roller
mill for cement grinding, In: Cement
Industry Technical Conference. XXXIX
Conference Record. Hershey, PA, United
States, 20 - 24 April 1997, 177-194.
[13] Altun, D., Gerold, C., Benzer, H., Altun,
O., Aydogan, N. and Langel, J. (2013)
Ore grinding practices with Loesche
OGP (ore grinding plant) Mobile, 13th
European Symposium on Comminution
& Classification, Braunschweig,
Germany, 9 - 12 September 2013, 63-66.
[14] vanDrunick, W., Gerold, C. and Palm, N.
(2010) Implementation of an energy
efficient dry grinding technology into an
Anglo American zinc beneficiation
process, In: 25th Mineral Processing
Congress Proceedings, Brisbane,
Australia, 6-10 September 2010, 1333-
1341.
[15] Crosbie, R., Robertson, C., Smit, I. and
Ser, V.(2005) The benefits of inter-
particle comminution on flotation,
Centenary of Flotation Symposium,
Brisbane, QLD, Australia, 6 - 9 June
2005, 823-828.
[16] Gupta, A. and Yan, D.S. (2006) Mineral
Processing Design and Operation,
Elsevier, Oxford.
[17] Jankovic, A., Suthers, S., Wills, T.,
Valery, W. (2015) Evaluation of Dry
Grinding using HPGR in Closed Circuit
with an Air Classifier, Minerals
Engineering, 71, 133–138.
[18] Jankovic, A., Valery, W., Lee, D., Peres,
J. and Jeston, S. (2013) Validation of a
closed circuit ball mill model, Journal of
Mining and Metallurgy, Section A:
Mining, 49, 1, 37 – 43.
[19] Sherry, A., Beck, J. S., Cruddace, A. E.,
Fortune, H., Glendinning, J. W.,
Hodgkinson, A. J., Martin, W. L., Murfit,
R. H. and Myers, F. H. E. (eds.) (1971)
Modern Power Station Practice,
Hungary: Pergamon Press Ltd.
[20] Bernotat, S.(1991) Classifiers in roller
grinding mills, Zement-Kalk-Gips, 44, 2,
79-83 (English translation: 4, 73-75).
[21] Brugan, J. M. (1992) State of the art raw
grinding, Zement-Kalk-Gips, 45, 1, 9-13
(English translation: 3, 59-62).
[22] Karassik, I. J., Messina, J. P., Cooper, P.
and Heald, C. C. (eds.) (2001) Pump
Handbook, New York: McGraw-Hill.
[23] Bond, F.C.(1961) Crushing and grinding
calculations part 1, Br. Chem. Eng. 6,
378-385.
[24] Little, W. M., Mainza, A. N., Becker, M.,
Gerold, C., Langel, J. and Naik, S. (2015)
Assessing the performance of the vertical
roller mill for grinding Platreef ore, SAG
Conference 2015, Vancouver, Canada, 20
- 23 September 2015, Poster 19.
[25] Spero, C. (1989) The influence of coal
properties on the grinding and wear
characteristics of ring-and-ball
pulverisers, Master of Engineering
Thesis, Queensland University of
Technology.