Embed Size (px)
DESCRIPTION
This is a project topic on Evaluation of Electrical Energy usage in Ado-Ekiti Metropolis, Ekiti State, Nigeria By: Ogunlade Michael Opeyemi in partial fulfillment to the award of HND in Elect/Elect Engineering.
Citation preview
1
EEVVAALLUUAATTIIOONN OOFF EENNEERRGGYY UUSSAAGGEE IINN
AADDOO--EEKKIITTII MMEETTRROOPPOOLLIISS
((AA CCAASSEE SSTTUUDDYY OOFF RREESSIIDDEENNTTIIAALL BBUUIILLDDIINNGGSS))
BBYY
OOGGUUNNLLAADDEE MMIICCHHAAEELL OOPPEEYYEEMMII
FFPPAA//EEEE//1111//33--00002266
PPRROOJJEECCTT PPRREESSEENNTTEEDD TTOO TTHHEE DDEEPPAARRTTMMEENNTT OOFF
EELLEECCTTRRIICCAALL//EELLEECCTTRROONNIICC EENNGGIINNEEEERRIINNGG
TTHHEE FFEEDDEERRAALL PPOOLLYYTTEECCHHNNIICC
AADDOO--EEKKIITTII
IINN PPAARRTTIIAALL FFUULLFFIILLLLMMEENNTT OOFF TTHHEE RREEQQUUIIRREEMMEENNTTSS FFOORR TTHHEE
AAWWAARRDD OOFF HHIIGGHHEERR NNAATTIIOONNAALL DDIIPPLLOOMMAA((HHNNDD)) IINN
EELLEECCTTRRCCAALL//EELLEECCTTRROONNIICC EENNGGIINNEEEERRIINNGG..
MMAARRCCHH 22001144 AADD
2
ABSTRACT
Electrical energy is a major driver for industrial process, commercial services and
residential comfort. This project is about electrical energy management/efficiency
investigation among the consumers at residential area of Ado-Ekiti metropolis,
Ekiti state.
The main reasons of this study are to find out the characteristic of electrical
energy usage in daily life and investigating the habits of consumers due to usage of
common electrical appliances. Questionnaire, interviews and inspection are the
tools that were being used for data collection and for analysis purposes. Data for
the work were obtained through the use of structured questionnaires, personal
interview, inspection, textbooks and internet. The questionnaire consists of several
questions that provided information of the electrical energy usage among
consumers in their daily life. The finding of this study shows that most of the
consumers are unaware on how to use electrical energy efficiently in their daily
life. Therefore this project reveals the habits of electrical energy usage from the
consumers' side and the common characteristic of electrical appliances usage in
common domestic sector. From the findings obtained, the use of energy efficient
lamps, solar heater for heating, providing incentives for purchasing energy
efficient appliances, avoiding estimation of energy bills and developing energy
policy will help to reduce cost and wastage of energy.
Keywords: evaluation, energy usage, energy Efficiency, Ado-Ekiti
3
CHAPTER ONE
1.0 INTRODUCTION
Evaluation of energy usage is a structured process to determine if a
program produced the intended outcome. It is an inspection, survey and
analysis of energy flow for energy conservation in a building, process or
system to reduce the amount of energy input into the system without
negatively affecting the output. Evaluation of energy usage provide an
analysis of the form of electricity, gas, fuel, oil or steam. It is possible to list
how the energy was used according to the various process in a plant or at the
various outlets in a building. The next step in evaluation of energy usage
then is to identify the potential for savings accurately.
(Wikipedia.org/Evaluation)
All Evaluation of energy usage tend to follow the same pattern but
vary according to level of technological techniques used in the assessment
process so an energy evaluation can take the form of a simple checklists
which can be used to examine sources of energy, how they are used and how
much of energy is consumed.(http://www.energyaudit.com).
Whatever the case, the outcome should provide information on
method of reducing energy losses. The three common Evaluation of energy
4
are Preliminary, general and investment-grade evaluation. The preliminary is
the simplest and the fastest type of energy evaluation it involves minimal
interviews with site-operating personnel, a brief review of facility bill and
other operating data and a walk-through of the facility to become familiar
with site-operating technique and to identify any glaring areas of energy
waste and inefficiency.
General evaluation is also called mini-evaluation it is more detailed
compared to the preliminary evaluation. It involve collection of more
detailed information about facility operation and by performing a more
detailed evaluation of energy conservation measures. Utility bills are
collected for a long period of time to allow the auditors to evaluate the
facility’s energy demand structures and energy usage profiles. This type of
energy evaluation will be able to identify all energy-conservation measures
appropriate for the facility given its operating parameters. A detailed
financial analysis is performed for each measures based on detailed
information cost estimates, site inspection operating cost savings, and the
customer investment criteria. Sufficient details is provided to justify project
implementation. The evaluation of Cloud-based energy auditing software
platform is enabling the managers of commercial building to collaborate
with general and specialty trades contractors in performing general and
5
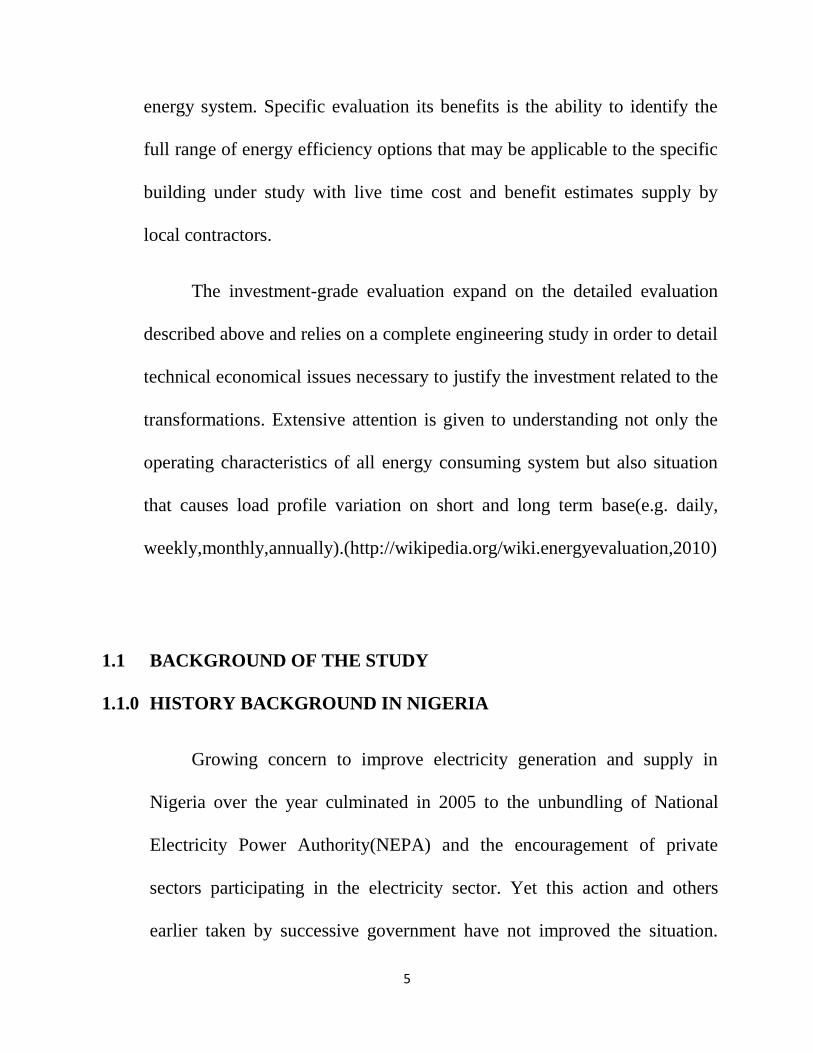
energy system. Specific evaluation its benefits is the ability to identify the
full range of energy efficiency options that may be applicable to the specific
building under study with live time cost and benefit estimates supply by
local contractors.
The investment-grade evaluation expand on the detailed evaluation
described above and relies on a complete engineering study in order to detail
technical economical issues necessary to justify the investment related to the
transformations. Extensive attention is given to understanding not only the
operating characteristics of all energy consuming system but also situation
that causes load profile variation on short and long term base(e.g. daily,
weekly,monthly,annually).(http://wikipedia.org/wiki.energyevaluation,2010)
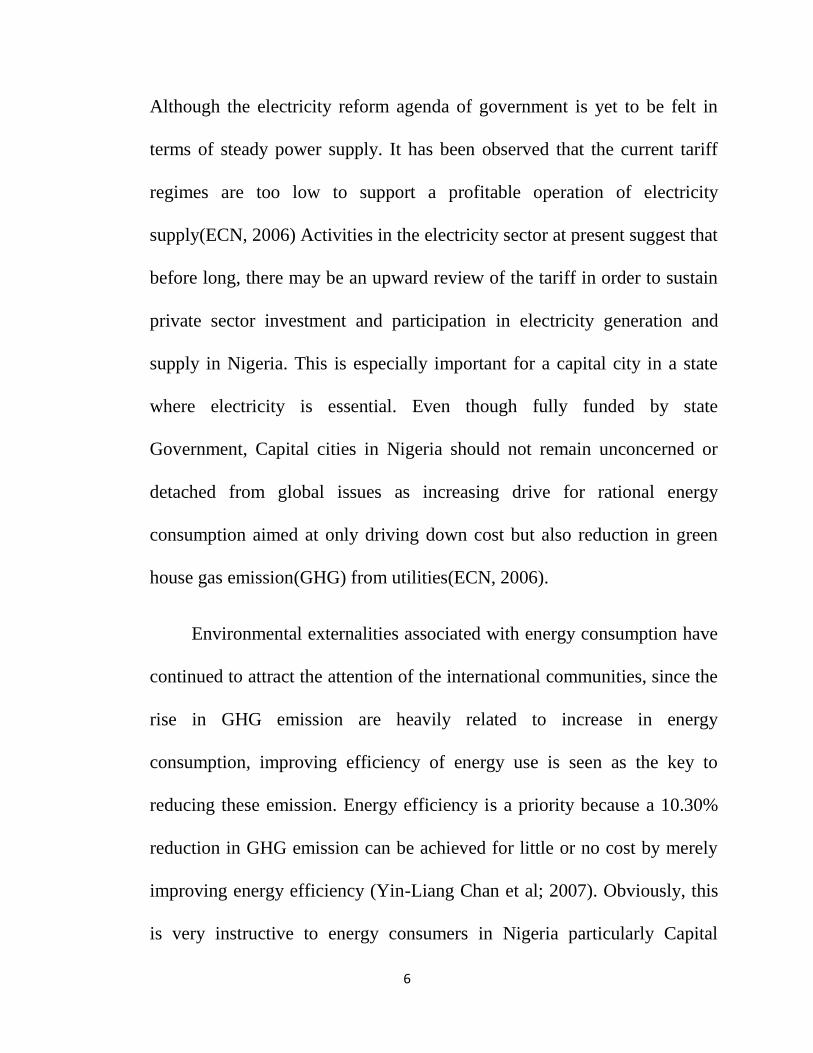
1.1 BACKGROUND OF THE STUDY
1.1.0 HISTORY BACKGROUND IN NIGERIA
Growing concern to improve electricity generation and supply in
Nigeria over the year culminated in 2005 to the unbundling of National
Electricity Power Authority(NEPA) and the encouragement of private
sectors participating in the electricity sector. Yet this action and others
earlier taken by successive government have not improved the situation.
6
Although the electricity reform agenda of government is yet to be felt in
terms of steady power supply. It has been observed that the current tariff
regimes are too low to support a profitable operation of electricity
supply(ECN, 2006) Activities in the electricity sector at present suggest that
before long, there may be an upward review of the tariff in order to sustain
private sector investment and participation in electricity generation and
supply in Nigeria. This is especially important for a capital city in a state
where electricity is essential. Even though fully funded by state
Government, Capital cities in Nigeria should not remain unconcerned or
detached from global issues as increasing drive for rational energy
consumption aimed at only driving down cost but also reduction in green
house gas emission(GHG) from utilities(ECN, 2006).
Environmental externalities associated with energy consumption have
continued to attract the attention of the international communities, since the
rise in GHG emission are heavily related to increase in energy
consumption, improving efficiency of energy use is seen as the key to
reducing these emission. Energy efficiency is a priority because a 10.30%
reduction in GHG emission can be achieved for little or no cost by merely
improving energy efficiency (Yin-Liang Chan et al; 2007). Obviously, this
is very instructive to energy consumers in Nigeria particularly Capital
7
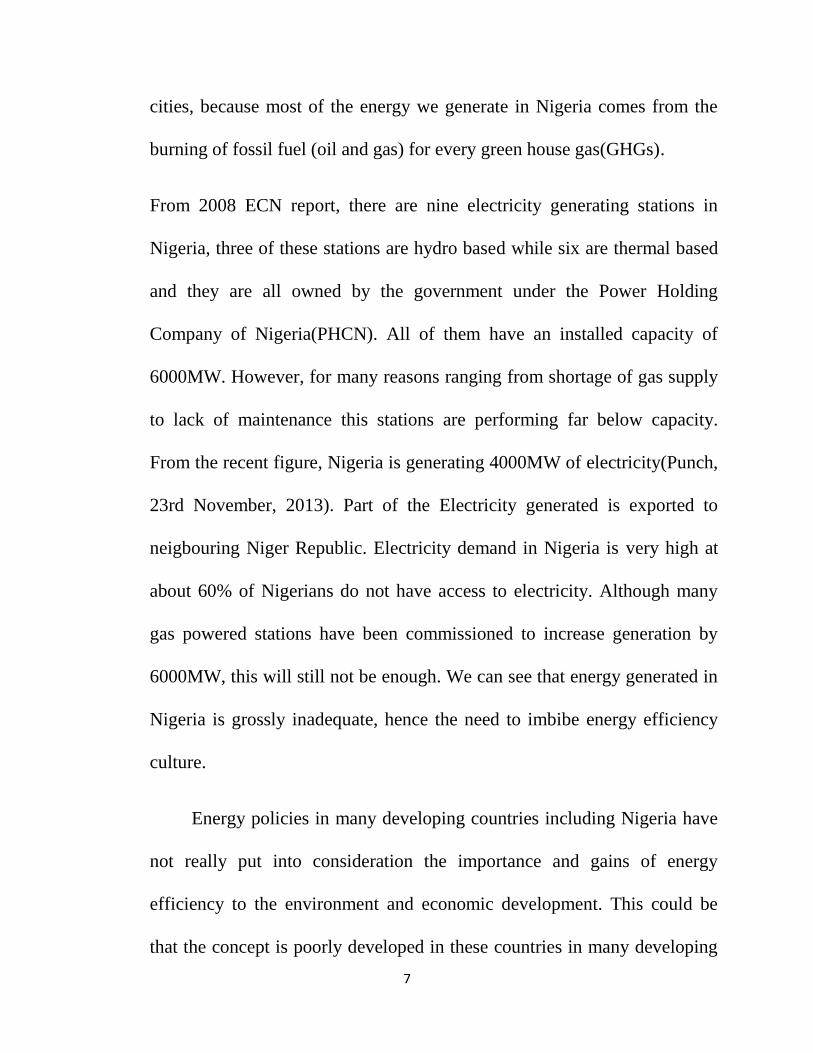
cities, because most of the energy we generate in Nigeria comes from the
burning of fossil fuel (oil and gas) for every green house gas(GHGs).
From 2008 ECN report, there are nine electricity generating stations in
Nigeria, three of these stations are hydro based while six are thermal based
and they are all owned by the government under the Power Holding
Company of Nigeria(PHCN). All of them have an installed capacity of
6000MW. However, for many reasons ranging from shortage of gas supply
to lack of maintenance this stations are performing far below capacity.
From the recent figure, Nigeria is generating 4000MW of electricity(Punch,
23rd November, 2013). Part of the Electricity generated is exported to
neigbouring Niger Republic. Electricity demand in Nigeria is very high at
about 60% of Nigerians do not have access to electricity. Although many
gas powered stations have been commissioned to increase generation by
6000MW, this will still not be enough. We can see that energy generated in
Nigeria is grossly inadequate, hence the need to imbibe energy efficiency
culture.
Energy policies in many developing countries including Nigeria have
not really put into consideration the importance and gains of energy
efficiency to the environment and economic development. This could be
that the concept is poorly developed in these countries in many developing
8
countries, there is inadequate data that will guide the development of policy
which will strengthen regulatory measures to use energy efficiently in
Nigeria.
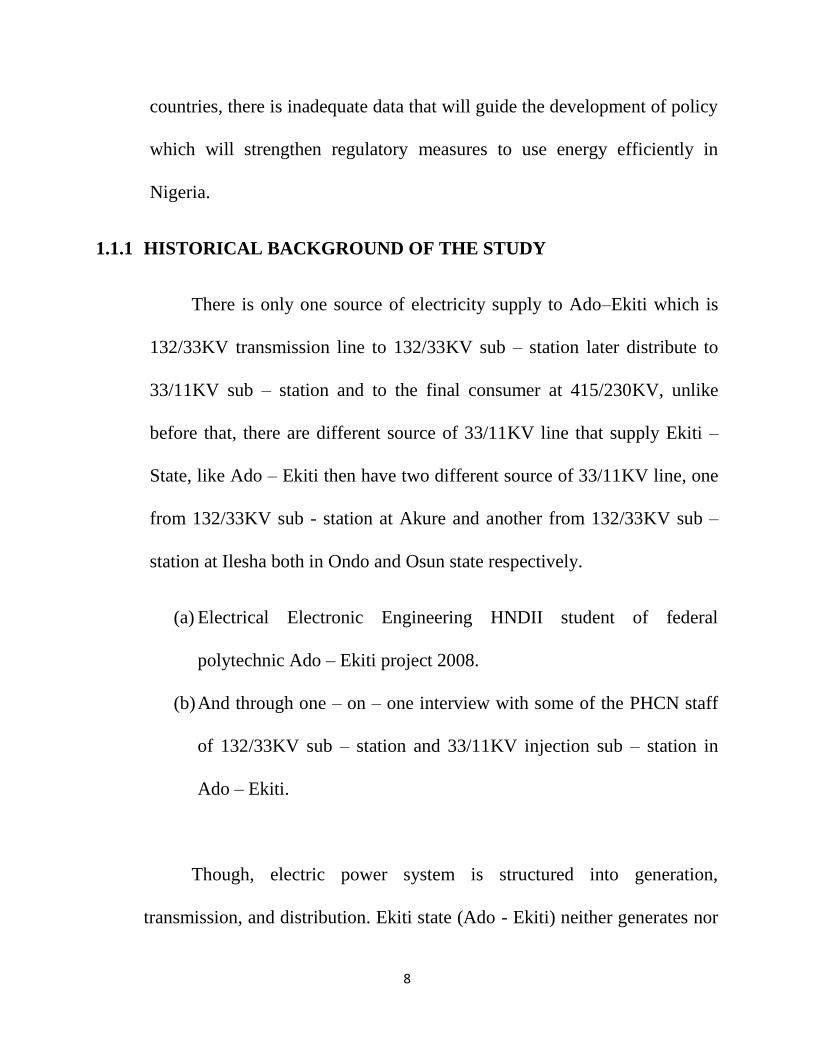
1.1.1 HISTORICAL BACKGROUND OF THE STUDY
There is only one source of electricity supply to Ado–Ekiti which is
132/33KV transmission line to 132/33KV sub – station later distribute to
33/11KV sub – station and to the final consumer at 415/230KV, unlike
before that, there are different source of 33/11KV line that supply Ekiti –
State, like Ado – Ekiti then have two different source of 33/11KV line, one
from 132/33KV sub - station at Akure and another from 132/33KV sub –
station at Ilesha both in Ondo and Osun state respectively.
(a) Electrical Electronic Engineering HNDII student of federal
polytechnic Ado – Ekiti project 2008.
(b) And through one – on – one interview with some of the PHCN staff
of 132/33KV sub – station and 33/11KV injection sub – station in
Ado – Ekiti.
Though, electric power system is structured into generation,
transmission, and distribution. Ekiti state (Ado - Ekiti) neither generates nor
9
transmit electricity, but deal only with distribution system alone. (Through
one – on – one interview with some of the PHCN staff of 132/33KV sub –
station Ado – Ekiti)
As stated earlier from the distribution types, the distribution system of
a supply through PHCN (132/33KV line) to Ado – Ekiti is sub – divided into
primary distribution, secondary distribution, and tertiary distribution. The
132/33KV feeders that pass through Ilaramokun to Akure the capital of
Ondo – State were conveyed through distribution cable to the 132/33KV sub
– station at omisanjana street, Ado – Ekiti the voltage stepped down to
33KV by the 132/33KV transformer sub – station at omisanjana street, Ado
– Ekiti. The voltage is further distributed to the 33/11KV injection sub –
station at textile street, Ado – Ekiti from there step down to the 11KV by
the 33/11KV transformer sub – station at textile, Ado – Ekiti and later the
voltage is further distributed in radial form to the load centre. The type of
distribution is known as primary distribution. The voltage is transformed by
the transformer in each sub – station from load centers to 415v line to line or
230v phase to neutral voltage. The transformed voltage is distributed to the
various point of usage. (Through one – on – one interview with some of the
staff of 132/33KV sub – station and 33/11KV injection sub – station in Ado
– Ekiti.)
10
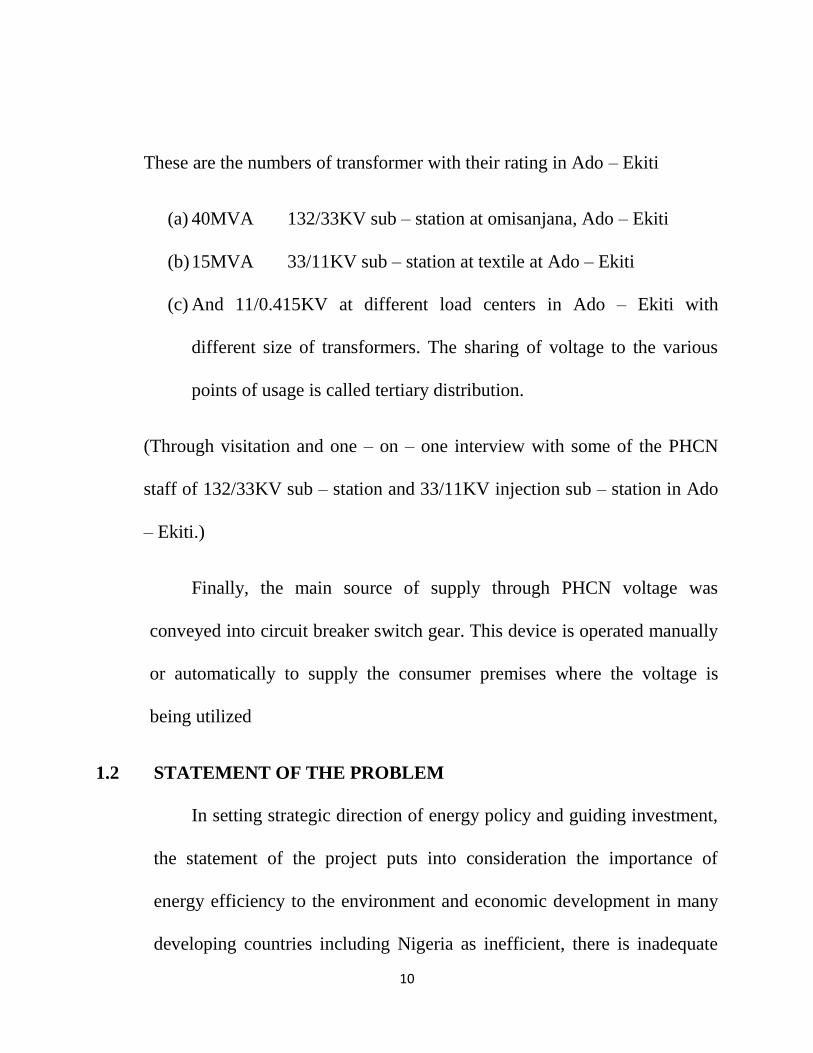
These are the numbers of transformer with their rating in Ado – Ekiti
(a) 40MVA 132/33KV sub – station at omisanjana, Ado – Ekiti
(b) 15MVA 33/11KV sub – station at textile at Ado – Ekiti
(c) And 11/0.415KV at different load centers in Ado – Ekiti with
different size of transformers. The sharing of voltage to the various
points of usage is called tertiary distribution.
(Through visitation and one – on – one interview with some of the PHCN
staff of 132/33KV sub – station and 33/11KV injection sub – station in Ado
– Ekiti.)
Finally, the main source of supply through PHCN voltage was
conveyed into circuit breaker switch gear. This device is operated manually
or automatically to supply the consumer premises where the voltage is
being utilized
1.2 STATEMENT OF THE PROBLEM
In setting strategic direction of energy policy and guiding investment,
the statement of the project puts into consideration the importance of
energy efficiency to the environment and economic development in many
developing countries including Nigeria as inefficient, there is inadequate
11
data that will strengthen regulatory measures to use energy efficiently in
Nigeria.
The statement is Spitted into two sections.
1. To elicit information that will serve as a guide to draft policy that
will strengthen regulatory measures to use energy efficiently in Ekiti
state (Ado- Ekiti)
2. To eliminate waste in the Usage of energy.
1.3 PURPOSE OF THE STUDY
Evaluation of energy usage is employed as a tool for determining
what measures can be and should be taken to save energy in facility.
Energy evaluation is the first step in determining how a facility uses energy
and how it could be saved in the facility.
The Purpose of Evaluation of energy usage is:
a) To reduce the cost of power generation to minimum and at
maximum efficiency
b) To relate the energy input and production output
c) To access the present pattern of energy consumption in different
centers of operation.
d) To Identify the source of waste.
12
e) To describe the prioritize cost saving measures relating energy use in
Ekiti state(Ado-Ekti).
1.4 SIGNIFICANCE OF THE STUDY
Energy policy in Nigeria have not really put into consideration the
importance of energy efficiency to the environment and economic
development. This could be deduce that the concept is inefficient in this
country. Hence there is need to:
a) Identify low cost ways of reducing energy consumption in the
residential building in Ekiti State(Ado-Ekiti)
b) Highlight information that will serve as a guide to draft policy that
will enhance energy efficiency in Ekiti State(Ado-Ekiti).
c) To Identify renewable energy potential in Ekiti State(Ado-Ekiti).
1.5 SCOPE OF THE STUDY
The scope of this project is focus on the analysis of electrical energy
and strategies for improving efficiency of electrical energy usage in Ado
Ekiti metropolis. The survey is conducted and involving 100 houses live
include category of family. The chosen of the houses have been picked
randomly and later classified for analysis.
13
1.6 RESEARCH QUESTION
The express audit will give us a calculation based on the average
household consumption of our family structure, home and users guide
I. Is your family type joint/Single Yes/No
II. Is your house floor area(m2) Standard Yes/No
III. Is your house painted? Yes/No
IV. Does your ceiling emit more heat Yes/No
V. Do you need additional light to see in your home? Yes/No
VI. Do you need additional air in your home? Yes/No
VII. Are you aware of the need to conserve energy? Yes/No
VIII. Are energy conservation measure taking in your home? Yes/No
IX. Is energy consumption monitored in your home? Yes/No
X. Are you aware of energy saving equipment? Yes/No
XI. Are you aware of energy efficient equipment? Yes/No
XII. Do you possess stabilizer Yes/No
XIII. Do your generators have environmental effect Yes/No.
14
1.7 ASSUMPTION OF THE STUDY
The fact of energy conservation remain unchanged that energy
produce and converted are used but this project research out that energy
available need to be managed to avoid huge losses of electrical power some
of the materials that were examined through auditing show that electrical
gadget consume more electricity. Due to the knowledge of electrical energy
management, the management of lighting in Residential building has
brought about introduction of Compact Florescent Lamp(CFLs) of lighting
point in the Residential Building
(a) It is also true that electrical energy management enhances and educate
the resident how to limit their expenditure on energy they consume.
(b) Electrical energy management knowledge enhance the establishment
of energy management structure and monitoring the target setting
system
(c) Electrical energy management enhance and boost the national stability
and quality of electrical supply into circulation.
(d) It also reduced the cost of energy consumption for those residential
buildings that can practice it
(e) It is true that electrical energy management publish cooperate energy
policy.
15
It is generally assumed that electrical energy management is the
strategy of adjusting and optimizing electrical energy using systems and
procedures so as to reduce energy requirements per unit of outputs while
holding constant or reducing total costs of expenditure of the Residential
Building.
Therefore there is need for the following:
1. Reduction in electrical energy losses.
2. Save energy and reduce running costs.
1.8 LIMITATION OF THE STUDY
Evaluation of energy usage in Ado-Ekiti (Residential buildings)
limitations include:
(a) Limited statistical information on the rating of the equipment being
used
(b) Difficulty in getting response from the respondent
(c) Unwillingness to give certain information pertaining to the financial
situation of managing and maintaining the generator
(d) Fear of exposing personal affairs/secret to outsider made information
to be restricted by some respondent
16
(e) Amount of information/data obtained was limited due to the
respondent level of exposure, education, communication skill and
availability of the owner of the dwelling being audited.
1.9 DEFINITION OF TERMS
EVALUATION: Is a systematic determination of a subject's merit, worth
and significance, using criteria governed by a set of standards. It can assist
an organization, program, project or any other intervention or initiative to
assess any aim, realisable concept/proposal, or any alternative, to help in
decision-making; or to ascertain the degree of achievement or value in
regard to the aim and objectives and results of any such action that has been
completed.
ENERGY:Is the ability or power to work or make an effort and work is the
transfer of energy from one form to another
METROPOLIS:Is a very large city or urban area which is a
significant economic, political, and cultural center for a country or region,
and an important hub for regional or international connections, commerce,
and communications. The term is Greek and means the "mother city" of
a colony (in the ancient sense), that is, the city which sent out settlers. This
17
was later generalized to a city regarded as a center of a specified activity, or
any large, important city in a nation.
ENERGY MANAGEMENT:Is the judicious and effective usage of energy
to maximize profits(minimize cost).
POWER FACTOR: Is the ratio between the active power(KW) and
apparent power(KVA)
ENERGY CHARGE: It’s a measured of the intensity or rate of energy use
multiplied by the length of time it’s used (KW X hours = KWH)
1.10 BRIEF HISTORY OF ADO EKITI
Ado Ekiti is a city in southwest Nigeria, the state capital and
headquarters of the Ekiti. It is also known as Ado. The population in 2004
was 446,749. The people of Ado Ekiti are mainly of the Ekiti sub-ethnic
group of the Yoruba. Ado Ekiti City has a State owned University – The
University of Ado Ekiti now Ekiti State University, Ado-Ekiti, a privately
owned University - The Afe Babalola University, Ado-Ekiti, a Polytechnic -
The Federal Polytechnic, Ado Ekiti, two local television and radio stations, -
18
NTA Ado Ekiti, Ekiti State Television (BSES), Radio Ekiti, Progress FM
Ado Ekiti. Various commercial enterprises operate in Ado Ekiti. The city is
the trade centre for a farming region where yams, cassava, grain,
and tobacco are grown. Cotton is also grown for weaving.
Where Ado-Ekiti is situated is a land that has been continuously
inhabited/occupied by human communities from time immemorial.
Available research shows that human societies of unknown antiquity
occupied this neighbourhood about (11,000) years ago. These ancient
inhabitants were probably the same or progenitors/ancestors of Igbon near
Ogotun, Erijiyan, Ijero, Ulesun and Asin (near Ikole) who were probably
autochthones because available traditions shows that they had lived in and
near their abodes from time immemorial.
Tremendous development took place in the cultivation of economic
crops, cultivation and collection of forest product such as kolanut and oil
palm produce, commerce and trade. Much of impetus of all these came
initially from Mr Isaac Ifamuboni. These men introduced the cultivation of
cocoa, maize brown cocoyam etc to Ekiti.
The progeess made in western education, cultivation of food crop and
of economic trees, as well as the establishment of commercial ventures
19
brought great profit to Ado-Ekiti in the early 1940s big time commercial
firms(Companies) such as UAC and in later year John Holt, U.T.C, C.F.A.O
establishes factories in the city. The Post and Telegraph now(NIPOST)
established a station in the city in 1947/48 causing posting and collection of
mail at the District Officer’s office at Ayoba to cease. In 1958, Pipe borne
water facility was provided making Ado-Ekiti the first town in the present
Ondo and Ekiti State to Enjoy the Facility. Two years later ECN(now
PHCN) extended electricity to the city. These facilities enhanced
commercial activities and brought immense social economic benefit and
improve standard of life of the people. From the 1950s commercial banks as
First and National Bank, The Union Bank for Africa opened there branch
offices in Ado-Ekiti. Ado Ekiti has a Stadium with the Capacity of 10,000
and a third division professional football league team.
(http://en.wikipedia.org/wiki/Ado_Ekiti).
20
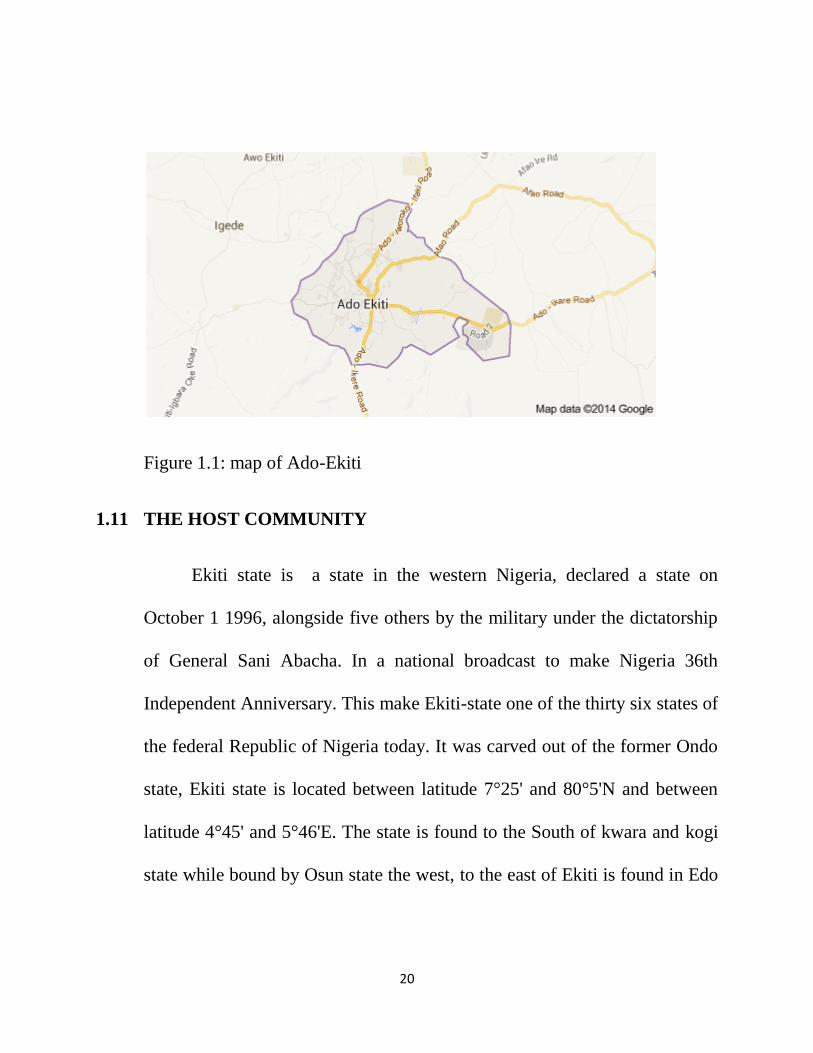
Figure 1.1: map of Ado-Ekiti
1.11 THE HOST COMMUNITY
Ekiti state is a state in the western Nigeria, declared a state on
October 1 1996, alongside five others by the military under the dictatorship
of General Sani Abacha. In a national broadcast to make Nigeria 36th
Independent Anniversary. This make Ekiti-state one of the thirty six states of
the federal Republic of Nigeria today. It was carved out of the former Ondo
state, Ekiti state is located between latitude 7°25' and 80°5'N and between
latitude 4°45' and 5°46'E. The state is found to the South of kwara and kogi
state while bound by Osun state the west, to the east of Ekiti is found in Edo
21
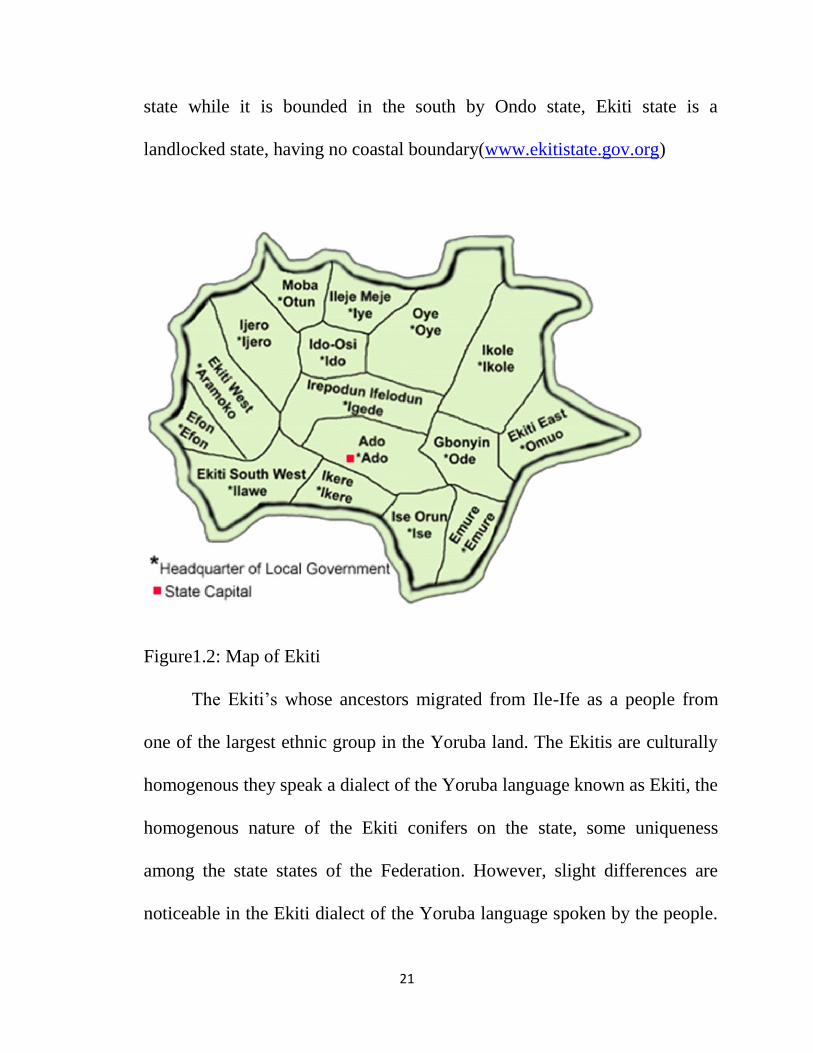
state while it is bounded in the south by Ondo state, Ekiti state is a
landlocked state, having no coastal boundary(www.ekitistate.gov.org)
Figure1.2: Map of Ekiti
The Ekiti’s whose ancestors migrated from Ile-Ife as a people from
one of the largest ethnic group in the Yoruba land. The Ekitis are culturally
homogenous they speak a dialect of the Yoruba language known as Ekiti, the
homogenous nature of the Ekiti conifers on the state, some uniqueness
among the state states of the Federation. However, slight differences are
noticeable in the Ekiti dialect of the Yoruba language spoken by the people.

22
This is informed and influenced by their spatial location especially the
boarder community of other state.(http://www.onlinenigeria.com)
Ekiti state is among the richest in the federation, in the variety and quality of
traditional arts, music, poetry and witty sayings. There are many as fifty
traditional festival in the state. Egungun, Ijesu and Ogun festival are
celebrated in all parts of the states but the latters associated in the particular
with ire Ekiti. The Ekiti are good wood carvers, blacksmiths and ornamental
potters, mat weavers and basket makers (http://www.onlinenigeria.com).
23
CHAPTER TWO
2.0 LITERATURE REVIEW
Reducing the impacts of the use of energy has been described as one
of the key technical, political and moral challenges facing the world today,
while the world works towards the use of cleaner energy, our priority should
be to use the energy we generated more efficiently. According to a
publication by the international Rivers, energy efficiency measures are
cheaper, cleaner and faster to install than any other energy options. Energy
efficiency measures have the potential to promote economic development
and can lead to job creation and saving of personal income. More also,
energy efficiency will play a pivotal role in the mitigation of climate change;
a large part of green house gases emitted into the atmosphere come from
energy generation. This assertion is contained in the Fourth Assessment
Report(AR4) of the intergovernmental panel on climate change (IPCC),
which has demonstrated that improved energy efficiency will play a key role
in our mitigation of climate change.
The dual benefit of money savings and environments are highlighted
in such an audit. Energy audits often address other issues too, such as indoor
air quality, lighting quality and ways to improve building occupant
satisfaction.(www.energystate.or.us)
24
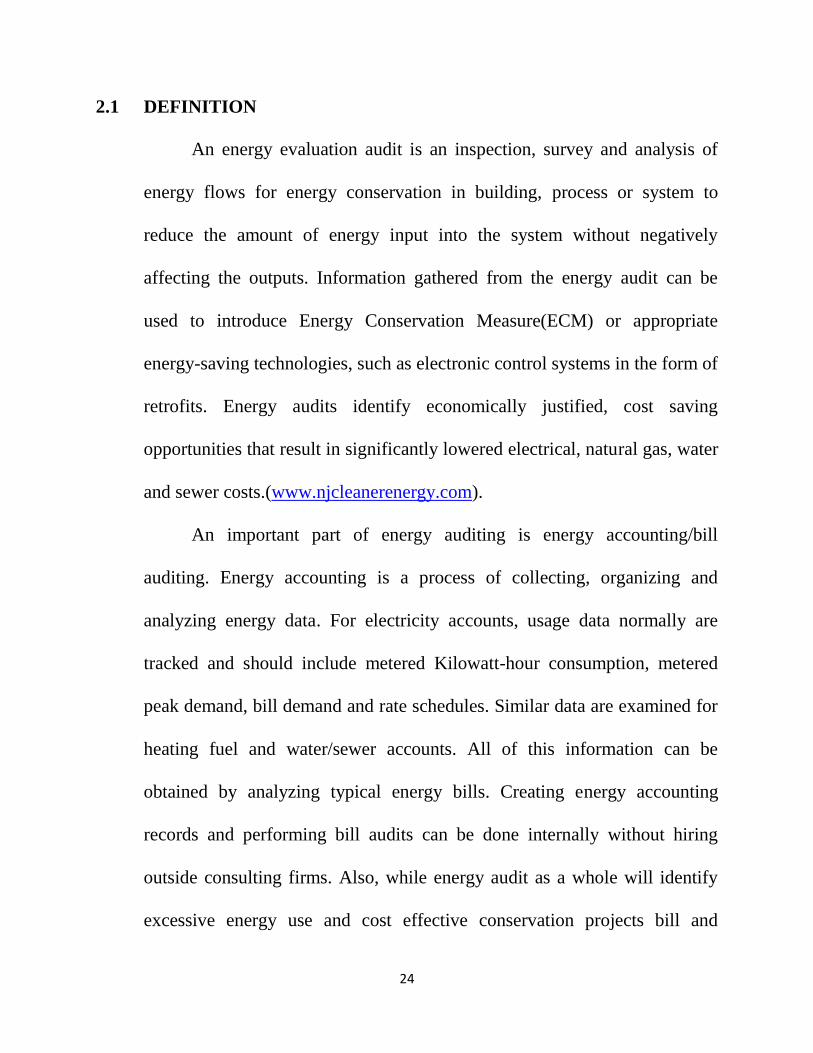
2.1 DEFINITION
An energy evaluation audit is an inspection, survey and analysis of
energy flows for energy conservation in building, process or system to
reduce the amount of energy input into the system without negatively
affecting the outputs. Information gathered from the energy audit can be
used to introduce Energy Conservation Measure(ECM) or appropriate
energy-saving technologies, such as electronic control systems in the form of
retrofits. Energy audits identify economically justified, cost saving
opportunities that result in significantly lowered electrical, natural gas, water
and sewer costs.(www.njcleanerenergy.com).
An important part of energy auditing is energy accounting/bill
auditing. Energy accounting is a process of collecting, organizing and
analyzing energy data. For electricity accounts, usage data normally are
tracked and should include metered Kilowatt-hour consumption, metered
peak demand, bill demand and rate schedules. Similar data are examined for
heating fuel and water/sewer accounts. All of this information can be
obtained by analyzing typical energy bills. Creating energy accounting
records and performing bill audits can be done internally without hiring
outside consulting firms. Also, while energy audit as a whole will identify
excessive energy use and cost effective conservation projects bill and
25
beneficial rate and service options. It could provide an excellent opportunity
to generate savings without any capital investment. In addition, accurate data
form energy accounting/bill auditing is crucial to making informed energy
purchasing decision in a energy market(www.energystate.org.us).
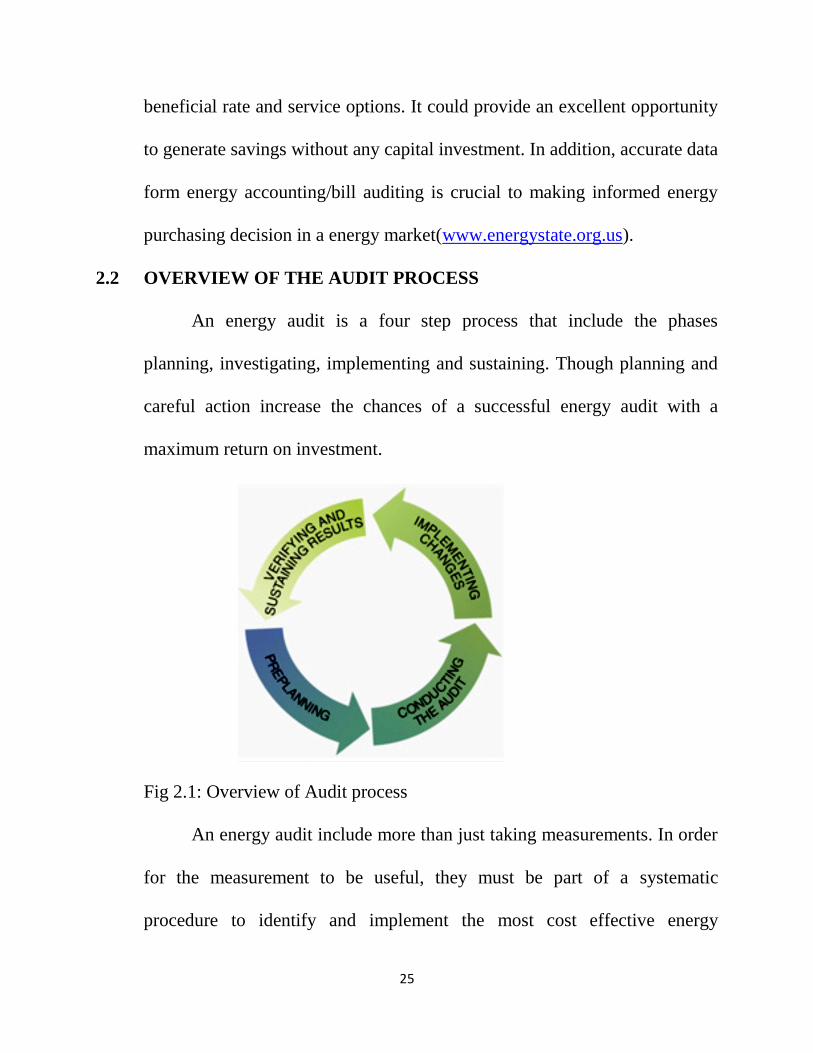
2.2 OVERVIEW OF THE AUDIT PROCESS
An energy audit is a four step process that include the phases
planning, investigating, implementing and sustaining. Though planning and
careful action increase the chances of a successful energy audit with a
maximum return on investment.
Fig 2.1: Overview of Audit process
An energy audit include more than just taking measurements. In order
for the measurement to be useful, they must be part of a systematic
procedure to identify and implement the most cost effective energy
26
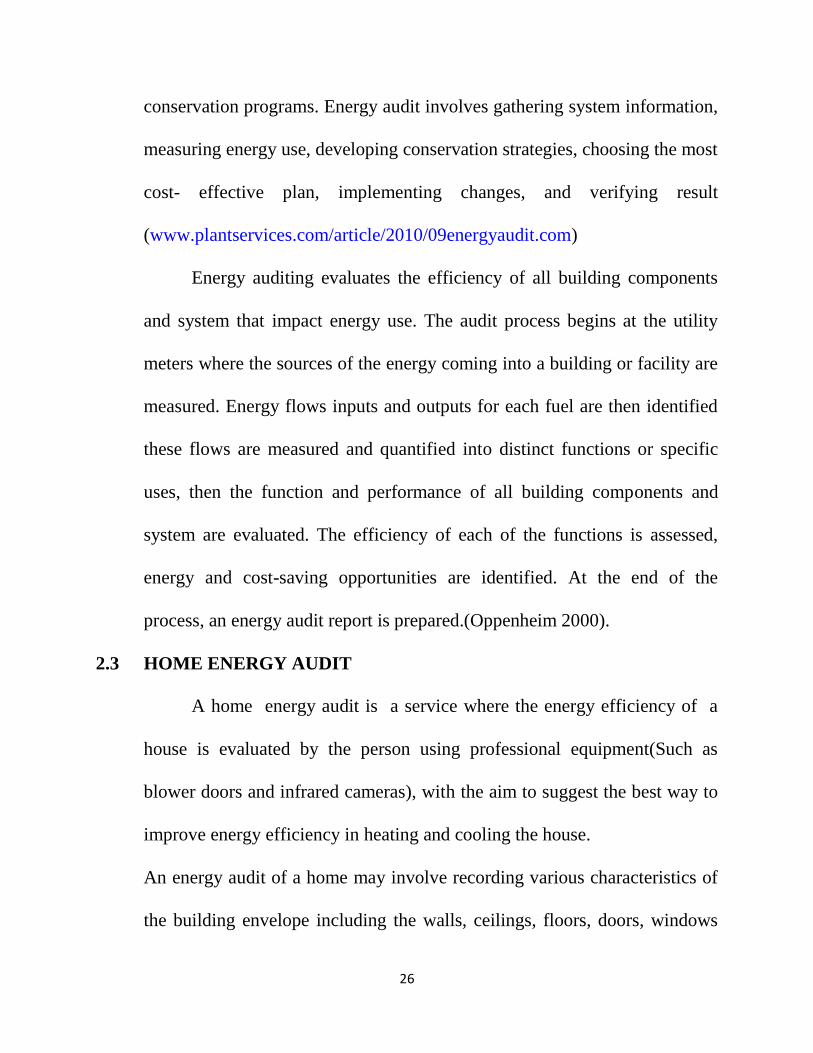
conservation programs. Energy audit involves gathering system information,
measuring energy use, developing conservation strategies, choosing the most
cost- effective plan, implementing changes, and verifying result
(www.plantservices.com/article/2010/09energyaudit.com)
Energy auditing evaluates the efficiency of all building components
and system that impact energy use. The audit process begins at the utility
meters where the sources of the energy coming into a building or facility are
measured. Energy flows inputs and outputs for each fuel are then identified
these flows are measured and quantified into distinct functions or specific
uses, then the function and performance of all building components and
system are evaluated. The efficiency of each of the functions is assessed,
energy and cost-saving opportunities are identified. At the end of the
process, an energy audit report is prepared.(Oppenheim 2000).
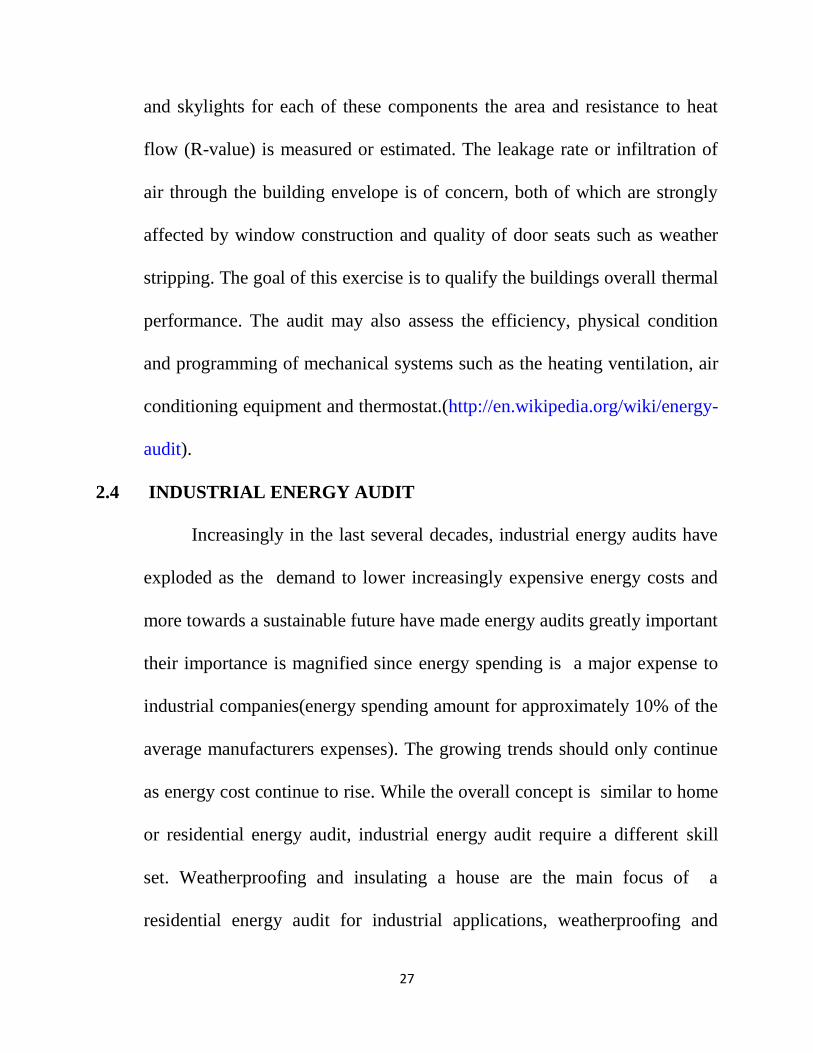
2.3 HOME ENERGY AUDIT
A home energy audit is a service where the energy efficiency of a
house is evaluated by the person using professional equipment(Such as
blower doors and infrared cameras), with the aim to suggest the best way to
improve energy efficiency in heating and cooling the house.
An energy audit of a home may involve recording various characteristics of
the building envelope including the walls, ceilings, floors, doors, windows
27
and skylights for each of these components the area and resistance to heat
flow (R-value) is measured or estimated. The leakage rate or infiltration of
air through the building envelope is of concern, both of which are strongly
affected by window construction and quality of door seats such as weather
stripping. The goal of this exercise is to qualify the buildings overall thermal
performance. The audit may also assess the efficiency, physical condition
and programming of mechanical systems such as the heating ventilation, air
conditioning equipment and thermostat.(http://en.wikipedia.org/wiki/energy-
audit).
2.4 INDUSTRIAL ENERGY AUDIT
Increasingly in the last several decades, industrial energy audits have
exploded as the demand to lower increasingly expensive energy costs and
more towards a sustainable future have made energy audits greatly important
their importance is magnified since energy spending is a major expense to
industrial companies(energy spending amount for approximately 10% of the
average manufacturers expenses). The growing trends should only continue
as energy cost continue to rise. While the overall concept is similar to home
or residential energy audit, industrial energy audit require a different skill
set. Weatherproofing and insulating a house are the main focus of a
residential energy audit for industrial applications, weatherproofing and
28
insulating often are minor concerns. In industrial energy audit, it is HVAC
lighting and production equipment that uses the highest amount of energy.
2.5 TYPES OF ENERGY AUDIT
The term energy audit is commonly use to describe a broad spectrum
of energy studies ranging from quick walk-through of a facility to identify
major problem areas to a comprehensive analysis of the implications of
alternative energy efficiency measures sufficient to satisfy the financial
criteria of sophisticated investors. Numerous audit procedure has been
developed for non residential /tertiary buildings(ASHRAE, kiarti 2000),
audit is required to identify the most efficient and cost effective energy
conservation opportunities(ECOs) or measures(ECMs). Energy conservation
opportunities (or measures) can convert in more efficient use of partial or
global replacement of the existing installation.
When looking into the existing audit methodologies developed in (IEA-
ECBCS Annex 11, by ASHRAE and by krati 2000), it appears that the main
issues of an audit process are:
i The analysis of building and utility data, including study of installed
equipment and analysis of energy bills;
ii The survey of real operating conditions
29
iii The understanding of the building behavior and of the interactions
with weather, occupancy and operating schedules;
iv The selection and the evaluation of energy conservation measures
v The estimation of energy saving potential
vi The identification of customer concern and needs.
2.5.1 BENCHMARKING
The impossibility of describing all possible situation that might be
encountered during an audit means that it is necessary to find a way of
describing what constitutes good, average and bad energy performance
across a range of situations. The aim of benchmarking is to answer the
question. Benchmarking mainly consist in comparing the measured
consumption which reference consumption of other similar building or
generated by simulation tool to identify excessive or unacceptable running
costs benchmarking is also necessary to identify building presenting
interesting energy saving potential. An important issue in benchmarking is
the use of performance index to characterize the building (ASHRAE, 2000).
These indexes can be
i. Comfort indexes, comparing the actual comfort condition to the
comfort requirement.
30
ii. Energy indexes consisting in energy demand divided by
heated/conditional area, allowing comparison with reference value of
the indexes coming from regulation or similar buildings;
iii. Energy demands, directly compared to reference energy demand
generated by means of simulation tools.
2.5.2 WALK THROUGH OR PRELIMINARY AUDIT
The preliminary audit (alternatively called a simple audit, screening
audit or walk-through audit) is the simplest and quickest type of audit. It
involves minimal interviews with site-operating personnel, a brief review of
facility utility bills and other operating data, and a walk-through of the
facility to become familiar with the building operation and to identify any
glaring areas of energy waste or inefficiency.
Typically, only major problem areas will be covered during this type
of audit. Corrective measures are briefly described, and quick estimates of
implementation cost, potential operating cost savings, and simple payback
periods are provided. A list of energy conservation measures(ECMs, or
energy conservation opportunities, ECOs) requiring further consideration is
also provided. This level of detail, while not sufficient for reaching a final
decision on implementing proposed measure, is adequate to prioritize
31
energy-efficiency projects and to determine the need for a more detailed
audit.(http://en.wikipedia.org)
2.5.3 GENERAL AUDIT
The general audit (alternatively called a mini-audit, site energy audit
or detailed energy audit or complete site energy audit) expands on the
preliminary audit described above by collecting more detailed information
about facility operation and by performing a more detailed evaluation of
energy conservation measures. Utility bills are collected for a 12 to 36
month period to allow the auditor to evaluate the facility's energy demand
rate structures and energy usage profiles. If interval meter data is available,
the detailed energy profiles that such data makes possible will typically be
analyzed for signs of energy waste. Additional metering of specific energy-
consuming systems is often performed to supplement utility data. In-depth
interviews with facility operating personnel are conducted to provide a better
understanding of major energy consuming systems and to gain insight into
short and longer term energy consumption patterns. This type of audit will
be able to identify all energy-conservation measures appropriate for the
facility, given its operating parameters. A detailed financial analysis is
performed for each measure based on detailed implementation cost
estimates, site-specific operating cost savings, and the customer's investment
32
criteria. Sufficient detail is provided to justify project implementation.
(ASHREA, 2000).
2.5.4 INVESTMENT-GRADE AUDIT
In most corporate settings, upgrades to a facility's energy
infrastructure must compete for capital funding with non-energy-related
investments. Both energy and non-energy investments are rated on a single
set of financial criteria that generally stress the expected return on
investment (ROI). The projected operating savings from the implementation
of energy projects must be developed such that they provide a high level of
confidence. In fact, investors often demand guaranteed savings. The
investment-grade audit expands on the detailed audit described above and
relies on a complete engineering study in order to detail technical and
economical issues necessary to justify the investment related to the
transformations.
2.5.5 COMPUTER SIMULATION AUDIT
The computer simulation audit is the most expensive and often is
recommended for more complicated systems, structures or facilities. This
involves using computer simulation software for prediction purpose(i.e.
Performance of buildings and systems) and consideration of effects of
external factors (e.g. changes in weather and other conditions with the
33
computer simulation audit, a baseline related to a facility’s actual energy use
is established, against which effects of system improvement are compared.
The audit often used for assessing energy performance of new buildings
based on different design configuration and equipment packages.
2.6 SPECIFIC AUDIT TECHNIQUES
INFRARED THERMOGRAPHY AUDIT
The advent of high resolution thermography has enabled inspectors to
identify potential issues within the building envelope by taking a thermal
image of the various surfaces of a building. For purposes of an energy audit,
the thermographer will analyze the patterns within the surface temperatures
to identify heat transfer through convection, radiation, or conduction. It is
important to note that the thermography ONLY identifies SURFACE
temperatures, and analysis must be applied to determine the reasons for the
patterns within the surface temperatures. Thermal analysis of a home
generally costs between 300 and 600 dollars
POLLUTION AUDIT
With increases in carbon dioxide emissions or other green house
gases, pollution audits are now a prominent factor in most energy audits.
34
Implementing energy efficient technologies help prevent utility generated
pollution.
Online pollution and emission calculators can help approximate the
emissions of other prominent air pollutants in addition to carbon dioxide.
Pollution audits generally take electricity and heating fuel consumption
numbers over a two-year period and provide approximations for carbon
dioxide, VOCs, nitrous oxides, carbon monoxide, sulfur dioxide, mercury,
cadmium, lead, mercury compounds, cadmium compounds and lead
compounds.(http://en.wikipedia.org/wiki/energy-audit)
2.7 ENERGY CONSERVATION
Energy conservation refer to effort made to reduce energy
consumption or refer to method of reducing energy through using less of an
energy service. Energy conservation differ from efficient energy use, which
refer to using less energy for a constant service. For example, driving less is
an example of energy conservation. Driving the same amount with a higher
milage vehicle is an example of energy efficiency. Energy conservation and
efficiency are both energy reduction techniques.
35
Even though conservation reduces energy services, it can result in
increased financial capital, environmental quality national security and
personal financial security. It is the top of the sustainable energy hierarchy.
2.8. ENERGY CONSERVATION BY COUNTRY
ENERGY POLICY OF THE EUROPEAN UNION
Although the European union has legislated in the area of energy
policy for many years and evolved out of the European coal and steel
community, the concept of introducing a mandatory and comprehensive
European energy policy was only approved at the meeting of the informal
European council on 27th October 2005 at Hampton court. The EU treaty of
Lisbon of 2007 legally includes solidarity in matters of energy supply and
changes to the energy policy within the EU prior to the treaty Lisbon EU
energy legislation has been based on the EU authority in the area of the
common market and environment. However, in practice many policy
competencies in relation to energy remain et national member state level,
and progress in policy at EU level requires voluntary cooperation by
members states.
The EU currently imports 82% of its oil and 57% of its gas, making it
the world’s leading importer of these fuels only 3% of the Uranium used in
European nuclear reactors was mined in Europe. Russia, Canada, Australia,
36
Niger and Kazakhstan were the five largest suppliers of nuclear materials to
the EU, supplying more than 75% of the total need in 2009
(hhtp://en.m.wikipedia.org/wiki/energy-policy-European-Union).
At the end of 2006, the European union EU pledged to cut its annual
consumption of primary energy by 20% by 2020. The European union
energy efficient action plan is long awaited. As part of the EU’s SAVE
program aimed at promoting energy efficiency and encouraging energy-
saving behavior, the Boiler Efficiency Directive specifies minimum levels of
efficiency for boilers fired with liquid or gaseous fuels. The European
commission is funding Large-scale research project to learn about success
factors for effective energy conservation programs.(http://ec.european.eu).
Under the requirement of the Directive on Electricity production from
renewable energy sources which entered into force in October 2011, the
member states are expected to meet “indicative” targets for renewable
energy production. Although there is significant variation in national targets.
The average is that 22% of electricity should be generated by renewable by
2020(compared to 13.9% in 1997). The European commission has proposed
in its Renewable Energy Roadmap 21 a binding target of increasing the level
of renewable Energy in the EU’s overall mix from less than 7% today to
20% by 2020(http://ec.european.eu).
37
The EU has also promoted electricity market liberation and security of
supply through the 2003 internal market in Electricity Directive, which
replaced early directives in this area. The directive 2003/54/EC has been
replaced by the Directive 2009/72/EC. The 2004/67/EC security directive
has been intended to improve security of supply in the natural gas sector.
2.8.1 UNITED KINGDOM
Energy conservation in the United Kingdom has been receiving
increased attention over recent years, key factors behind this are the
government commitment to reduce carbon emissions. The project “energy
gap” in the electricity generation, and the increasing reliance on imports to
meet national energy needs. Domestic housing and road transport are
currently the two biggest problem areas.
Responsibility for energy conservation fall between three government
although is led by the Department for Energy and climate change (DECC).
The department for Communities and Local Government (CLG) is still
responsible for energy standards in buildings and the Department for
Environment, Food and Rural Affairs (DEFRA) retains a residual interest in
energy in so far as it leads to emission of CO2 the main green house gas. The
department for transportation retains many responsibilities for energy
conservation in transport. At an operational level, there are two main non-
38
departmental , non-governmental bodies. The Energy saving trust, working
mainly in the domestic sector with some interest in transport and the carbon
trust, working with industry and innovative energy technologies in addition
there are many independent NGOs working in the sector such as the centre
for sustainable energy in Bristol or the National Foundation in Milton
Keynes, and directly helping consumers make informed choices on energy
efficiency. (Enerdata, 2012).
2.8.2 UNITED STATES
The United States is currently the second largest single consumer of
energy, following China. The US department of energy categorizes national
energy use in four broad sector transportation, residential, commercial, and
industrial Energy usage in transportation and residential sectors about half of
US energy consumption, is largely controlled by individual consumers,
commercial and industrial energy expenditures are determined by business
entities and other facility managers. National energy policy has a significant
effect on energy usage across all four sectors, and its strengthen is part of the
2010 presidential congressional legislative debate(http://en.wikipedia.org)
39
2.9 ECONOMIC FACTORS OF ENERGY CONSERVATION
Energy saving is important and effective in all level of human
organizations. In the whole world, as a nation, as companies, or individuals.
Energy conservation reduces the energy cost and improve the profitability.
Private companies are also sensitive to energy cost, which directly affects
their profitability and even their viability in many cases. Especially factories
in the industrial sectors are of much concern, because reduced cost by
Energy conservation means the more competitive product prices in the
world market and that is good for national trade balance (Total energy
management handbook,2005).
2.10 ENVIRONMENTAL IMPACT OF ENERGY CONSERVATION
Energy conservation is closely related also to environmental issues.
The problem of global warning or climate change is caused by emission of
carbon dioxide and other Green House Gas(GHG) Energy conservation,
especially saving use of fossils fuels, shall be the first among the various
countermeasures of the problem with due consideration of the
aforementioned economic factors.(Total Energy management Handbook,
2005).
40
2.11 BEST PRACTICES IN ENERGY EFFICIENCY
2.11.1 STANDARD AND LABEL (S & L)
In many countries of the world, especially the industrialize nations,
the use of standards and labels(S&L) are increasingly becoming common.
An energy label is attached to electrical appliance to display the accurate
energy consumption information on the product, such information will help
the buyer to take decision whether to buy the product or not. Energy label
will provide information on the amount of energy an appliance consumes
and will also tell the consumer how efficient the appliance is. In many of
the OECD countries, energy labeling is now fully operational and the
appliances that are commonly labeled include refrigerators, freezers and air
conditionals and a range of other appliances such as rice cookers, boilers,
lighting products and washing machine (Harrington and Damnics. 2004).
2.11.2 LIGHTING
With the use of incandescent bulbs, many households spend a lot of
energy for lighting. The energy we spend for lighting can be reduced by
over 60% if we replace them with energy saving bulbs such as compact
florescent lamps (CFLs). CFLs are much more efficient than incandescent
bulbs and they last six to ten times longer.
41
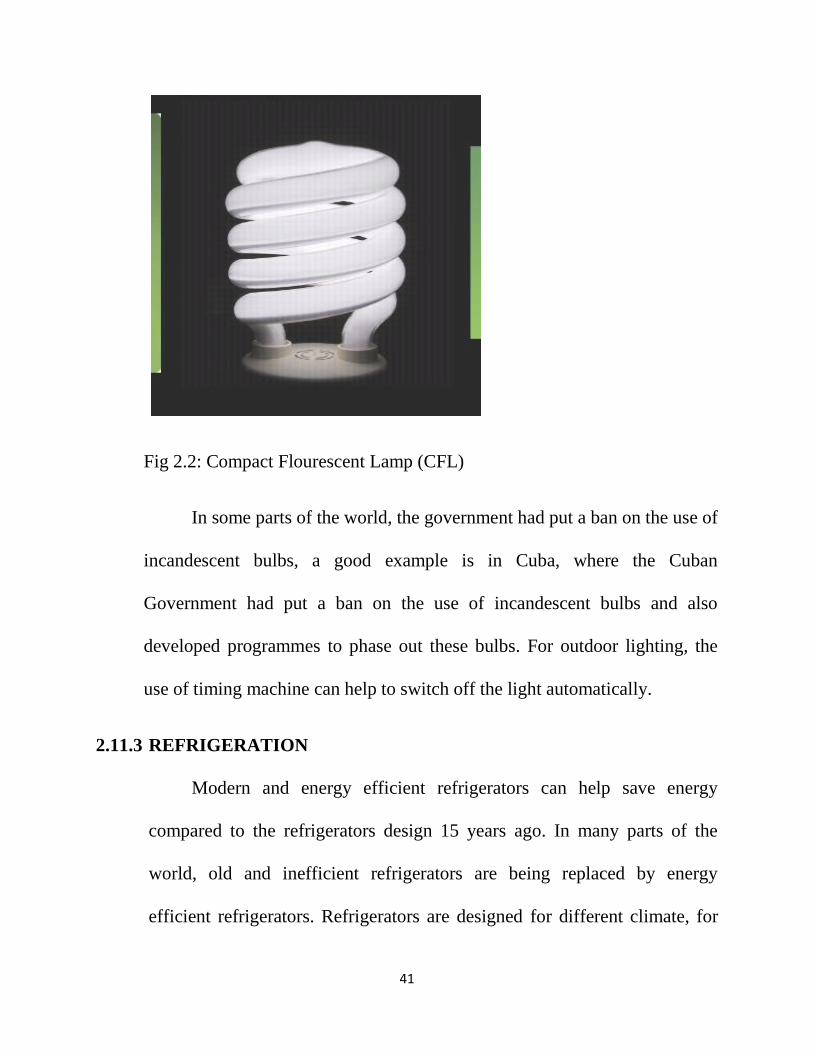
Fig 2.2: Compact Flourescent Lamp (CFL)
In some parts of the world, the government had put a ban on the use of
incandescent bulbs, a good example is in Cuba, where the Cuban
Government had put a ban on the use of incandescent bulbs and also
developed programmes to phase out these bulbs. For outdoor lighting, the
use of timing machine can help to switch off the light automatically.
2.11.3 REFRIGERATION
Modern and energy efficient refrigerators can help save energy
compared to the refrigerators design 15 years ago. In many parts of the
world, old and inefficient refrigerators are being replaced by energy
efficient refrigerators. Refrigerators are designed for different climate, for
42
example there are refrigerators designed for the temperate region while
others are designed for the tropical region. Using a refrigerator designed for
the temperate region in a tropical climate will lead to inefficient use of
energy. Refrigerators should be used in the climate where they are designed
to be used. In Nigeria, the use of secondhand refrigerators from Europe
should be discouraged, because these refrigerators are designed for the
European climate.(Lebot, B. 2009).
2.11.4 COOLING AND HEATING
In Nigeria, the appliances for heating and cooling account for a large
percentage of the energy we spend in our homes and offices. It has been
found that heating and cooling account for about 44% of utility bill. The
energy spent on heating and cooling can be reduced if households and
owners of houses invest money for the proper insulation and weathering of
their houses. Just by insulating walls and loft spaces you could reduce heat
loss by over 50% and prevent wasted of energy. Also, there are modern and
more efficient air conditioner and heating equipment. By combining proper
equipment maintenance and upgrades with insulation, weatherization and
thermostat setting, energy consumption can be reduced drastically.
43
2.11.5 USE OF RENEWABLE ENERGY TECHNOLOGY(RETS)
The use of solar heater to provide hot water in the house can help to
reduce the amount of electrical energy spent on heating water. Solar heaters
have been developed and used in other parts of the world to provide hot
water in residential houses.
2.11.6 PROVIDING INCENTIVES
Providing incentives for purchasing energy efficiency products have
been used to change the behavior of consumers to promote energy
efficiency. This has been operational in other parts of the world. Policy is
made to place a penalty on people using inefficient products and reward
those buying very efficient appliances.
2.11.7 LANDSCAPING
There are natural ways we can keep our homes comfortable and
reduce energy bill. A well placed tree, shrub or vine in our homes can
provide shade and act as windbreak. This can help to reduce the energy we
spend on cooling, since the shade from these trees can keep our home cool.
44
2.12 RENEWABLE ENERGY POTENTIAL IN NIGERIA
Renewable energies include wind, ocean wave and tides, solar,
biomass, rivers, geothermal (heat of the earth), etc. They are called
‘renewable’ because they are regularly replenished by natural processes and
are therefore in endless supply. They also can operate without polluting the
environment. Technologies that have been developed to harness these
energies are called renewable energy technologies (RETs) or sometime also
called “clean technologies” or “green energy”. Because renewable energies
are constantly being replenished from natural sources, they have security of
supply, unlike fossil fuels, which are negotiated on the international market
and subject to international competition, sometimes may even resulting in
wars and shortages. They have important advantages as follows:
i Their rate of use does not affect their availability in future, thus they
are inexhaustible.
ii The resources are generally well distributed all over the world, even
though wide spatial and temporal variations occur. Thus all regions
of the world have reasonable access to one or more forms of
renewable energy supply.
iii They are clean and pollution-free, and therefore are sustainable
natural form of energy.
45
iv They can be cheaply and continuously harvested and therefore
sustainable source of energy.
Renewable energy can be set up in small units and is therefore
suitable for community management and ownership. In this way, value
from renewable energy projects can be kept in the community. In Nigeria,
this has particular relevance since the electricity grid does not extend to
many rural areas and in some cases it is prohibitively expensive to extend
the grid to remote areas. This presents a unique opportunity to construct
power plants closer to where they are actually needed. In this way, much
needed income, skill transfer and manufacturing opportunities for small
businesses would be injected into rural communities. RETs have the
potential to produce more jobs than fossil fuel or nuclear industries. When
RETs are properly integrated into national development plans and
implemented, they can substantially reduce greenhouse gas emission and
simultaneously increase employment. Moreover, it can also enhance energy
security by reducing reliance on oil and promote energy sovereignty. With
the right approach, the interests of the economy and the environment can
come together when RE is properly integrated into development plans.
46
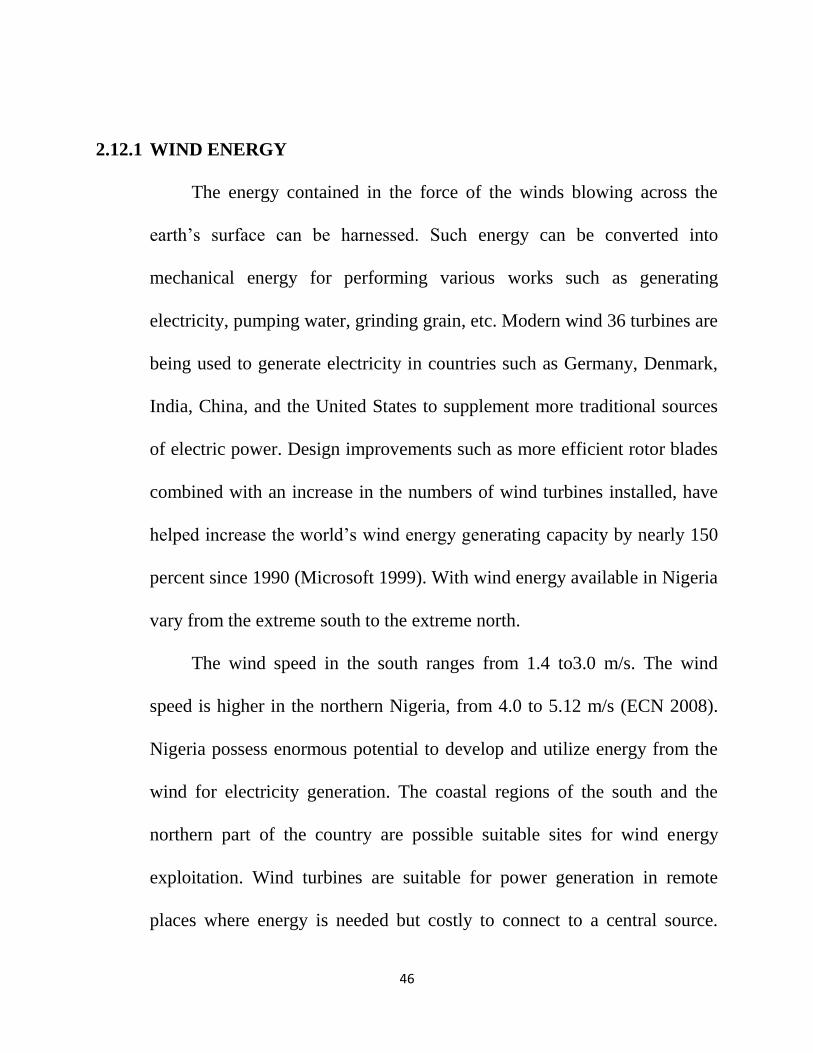
2.12.1 WIND ENERGY
The energy contained in the force of the winds blowing across the
earth’s surface can be harnessed. Such energy can be converted into
mechanical energy for performing various works such as generating
electricity, pumping water, grinding grain, etc. Modern wind 36 turbines are
being used to generate electricity in countries such as Germany, Denmark,
India, China, and the United States to supplement more traditional sources
of electric power. Design improvements such as more efficient rotor blades
combined with an increase in the numbers of wind turbines installed, have
helped increase the world’s wind energy generating capacity by nearly 150
percent since 1990 (Microsoft 1999). With wind energy available in Nigeria
vary from the extreme south to the extreme north.
The wind speed in the south ranges from 1.4 to3.0 m/s. The wind
speed is higher in the northern Nigeria, from 4.0 to 5.12 m/s (ECN 2008).
Nigeria possess enormous potential to develop and utilize energy from the
wind for electricity generation. The coastal regions of the south and the
northern part of the country are possible suitable sites for wind energy
exploitation. Wind turbines are suitable for power generation in remote
places where energy is needed but costly to connect to a central source.
47
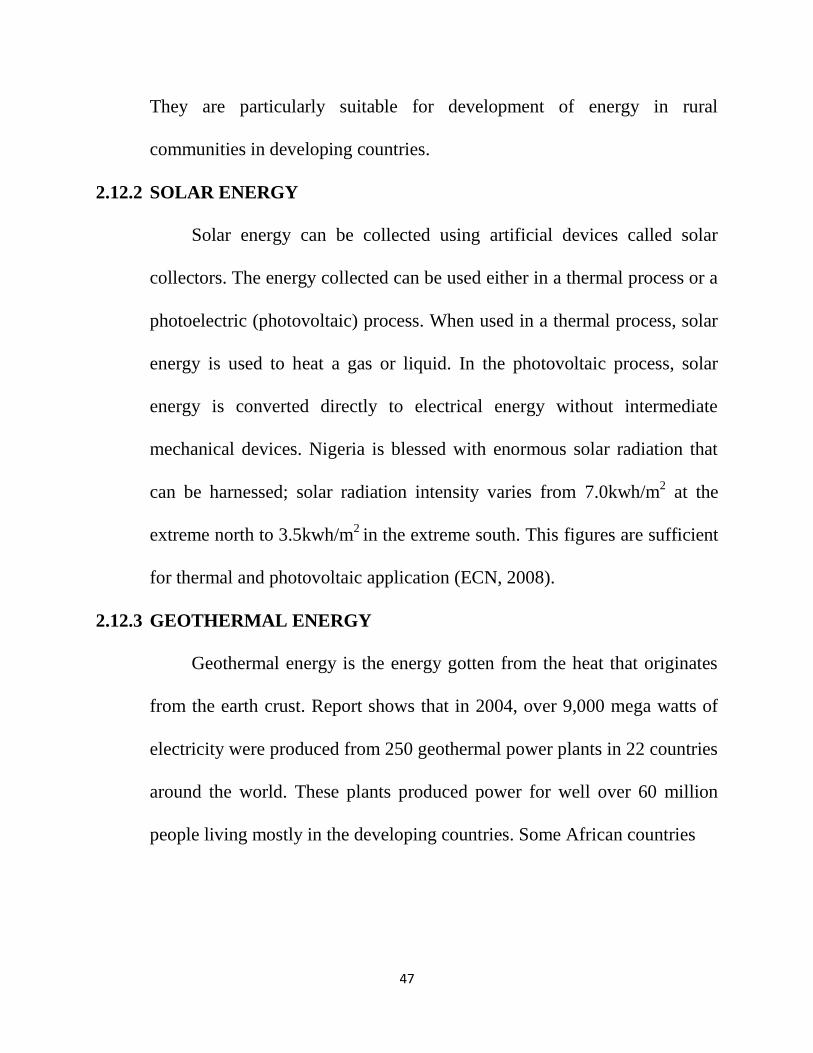
They are particularly suitable for development of energy in rural
communities in developing countries.
2.12.2 SOLAR ENERGY
Solar energy can be collected using artificial devices called solar
collectors. The energy collected can be used either in a thermal process or a
photoelectric (photovoltaic) process. When used in a thermal process, solar
energy is used to heat a gas or liquid. In the photovoltaic process, solar
energy is converted directly to electrical energy without intermediate
mechanical devices. Nigeria is blessed with enormous solar radiation that
can be harnessed; solar radiation intensity varies from 7.0kwh/m2 at the
extreme north to 3.5kwh/m2
in the extreme south. This figures are sufficient
for thermal and photovoltaic application (ECN, 2008).
2.12.3 GEOTHERMAL ENERGY
Geothermal energy is the energy gotten from the heat that originates
from the earth crust. Report shows that in 2004, over 9,000 mega watts of
electricity were produced from 250 geothermal power plants in 22 countries
around the world. These plants produced power for well over 60 million
people living mostly in the developing countries. Some African countries
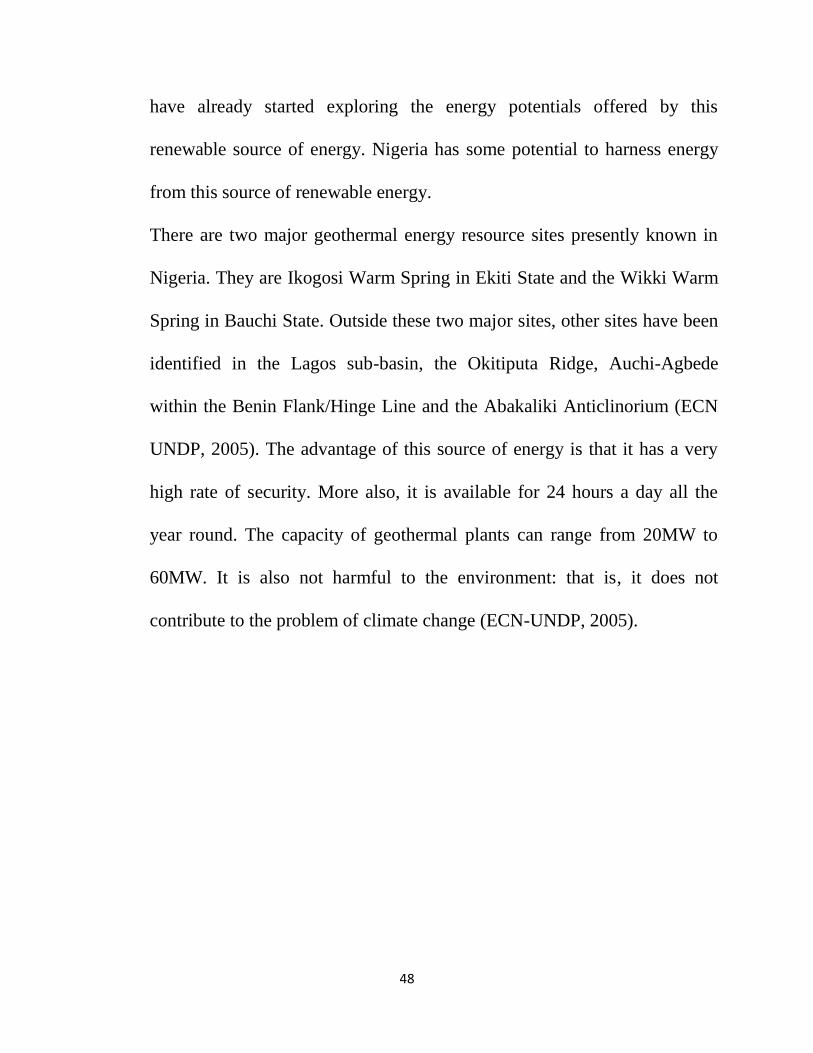
48
have already started exploring the energy potentials offered by this
renewable source of energy. Nigeria has some potential to harness energy
from this source of renewable energy.
There are two major geothermal energy resource sites presently known in
Nigeria. They are Ikogosi Warm Spring in Ekiti State and the Wikki Warm
Spring in Bauchi State. Outside these two major sites, other sites have been
identified in the Lagos sub-basin, the Okitiputa Ridge, Auchi-Agbede
within the Benin Flank/Hinge Line and the Abakaliki Anticlinorium (ECN
UNDP, 2005). The advantage of this source of energy is that it has a very
high rate of security. More also, it is available for 24 hours a day all the
year round. The capacity of geothermal plants can range from 20MW to
60MW. It is also not harmful to the environment: that is, it does not
contribute to the problem of climate change (ECN-UNDP, 2005).
49
CHAPTER THREE
3.0 METHODOLOGY
Methodology is the systematic, theoretical analysis of the methods
applied to a field of study, or the theoretical analysis of the body of methods
and principles associated with a branch of knowledge. It, typically,
encompasses concepts such as paradigm, theoretical model, phases and
quantitative or qualitative techniques.
A Methodology does not set out to provide solutions but offers the
theoretical underpinning for understanding which method, set of methods or
so called “best practices” can be applied to a specific case.
It has been defined also as follows:
i The analysis of the principles of methods, rules, and postulates
employed by a discipline.
ii The systematic study of methods that are, can be, or have been applied
within a discipline.
iii The study or description of methods.
(http://en.m.wiki.org/wiki/methodology)
50
3.1 WHAT IS DATA
Data can simply be defined as a fact or information used in deciding
or making something. (Collins Gem, English Dictionary 1991) Define data
as a series of observation or fact, number digits e.t.c. Operated on by a
computer
3.11 DATA COLLECTION INSTRUMENT
The method used in proffering solution to the study is through the
collection of
1. Primary Data.
(a) Questionnaire
(b) Personal Interview
(c) Inspection
2. Secondary Data
(a) Text books
(b) Journal
(c) Internet
51
3.1.2 PRIMARY DATA
The researcher may not have enough data even after using all
reasonable secondary source of information in this situation, they will turn to
primary source and get the information themselves.
Primary data consist of original information collected for the specific
purpose at hand. They are collected to satisfy a clearly defined purpose.
Though, primary data is more costly, yet is usually more relevant to the issue
at hand.
3.1.3 SECONDARY DATA
The oxford dictionary(2000) defined secondary data as data
information coming after derived from primary data. Some researcher
started their investigation by examining secondary data to see whether their
problem can be partly solved without going into primary data collection.
3.2 QUESTIONNAIRE DESIGN
Most Problem with questionnaire analysis can be traced back to the
design phase of the project. Well defined goals are the best way to assure a
good questionnaire design.
52
Some rules were properly followed in the building of a quality
questionnaire. The questions in the questionnaire can either be closed-ended
or open-ended type.
In a close-ended type, questionnaire were followed by kinds of
specified choice and the respondent answers were not recorded in full. The
quality of this is that it guides respondent in giving accurate information that
has close relation to the question under discussion.
The following factors served as guidance in building quality
questionnaire
1. The objectives of the research
2. Level of information available
3. The respondent level of education and exposure
4. The ease with which the content of the answer can be communicated
by the respondent or the extent to which the respondent are motivated
to communicate to the topic.
The questions asked in the questionnaire are based on the following
I. General Information about the respondent
II. Educational Structure and household membership status
III. Final energy consumption
53
IV. Life Style
V. General awareness about energy efficiency
The method that is used to obtain samples of data is by using
questionnaire. From the questionnaire, the data is analyzed to calculate the
power usage of each house. It consist of questions that provide information
of electric energy usage among consumers and also their habit in daily usage
of electric energy. Also the collection of outages statistics for one month
from the Benin Electricity Distribution Company(BEDC) which is the
distribution company of Nigeria(DISCO). The monthly power consumption
were obtained for proper assessment of power supply in the City.
One hundred questionnaire were distributed to residential load
consumers in Ado-Ekiti, Ninety percent (90%) out of the distributed
questionnaires were returned and analyzed. In each house, each electrical
appliance used by every house and average total of electricity consumption
for a period of one month are recorded.
The data collection only focused on the appliances that are often used by the
consumers. The average total of real power for each house is calculated by
summing the individual appliance. The knowledge of each consumer about
their knowledge of consumption of electricity efficiently were also recorded.
54
3.3 AREA OF STUDY
The scope of this project is focused on the analysis of electrical
energy and strategies for improving efficiency of electrical energy in Ado
Ekiti metropolis. In order to this, the area of study is on residential building
Since about 88% of the load demand in Ado Ekiti belong to residential
consumers(One-on-one interview with a staff of PHCN), hence, the
residential consumers in Ado Ekiti is distributed into four sections according
to the distribution of supply to the city.
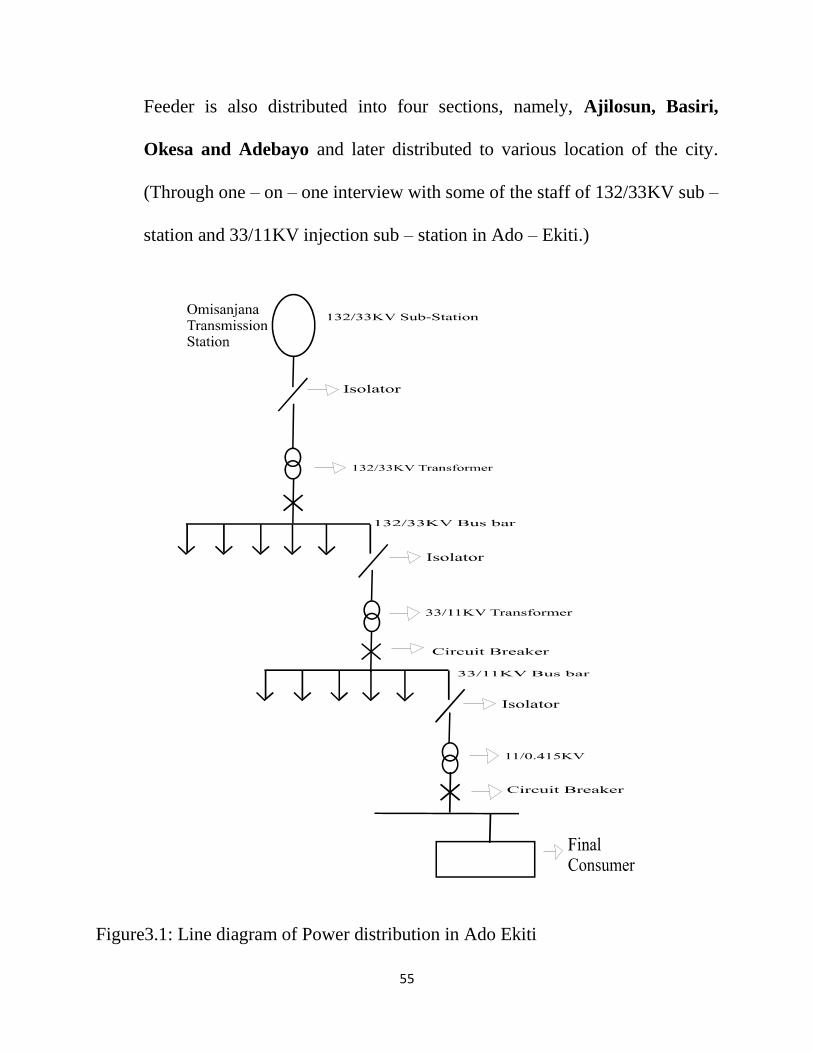
3.4 POWER DISTRIBUTION SYSTEM
The main supply from the Transmission Sub-station in Ado-Ekiti is
132KV that was stepped to 33KV, which is later distributed to four feeders
namely:
Ado Feeder
Ikere Feeder
Ikole Feeder and
Ilawe Feeder.
For the purpose of this study, Our Focus would be on Ado Feeder
which serve as the main distribution of electrical power in the city. Ado
55
Feeder is also distributed into four sections, namely, Ajilosun, Basiri,
Okesa and Adebayo and later distributed to various location of the city.
(Through one – on – one interview with some of the staff of 132/33KV sub –
station and 33/11KV injection sub – station in Ado – Ekiti.)
Figure3.1: Line diagram of Power distribution in Ado Ekiti
56
3.5 SAMPLING DESIGN AND PROCEDURE
It is usual for the researcher to clearly define target population, there
are no strict rule to follow and the researcher must rely on logic and
judgment. The population is defined in keeping with the objectives of the
study.
For the purpose of this project, the sampling chosen for collection of
data is simple random sampling and quota sampling.
SIMPLE RANDOM SAMPLING: Is a probability sampling technique in
which each element in the population has a known and equal probability of
selection. Every element is selected independently of every other element
and the sample is drawn by a random procedure from a sampling frame.
QUOTA SAMPLING: Involves the researcher first identifying the stratums
and their proportion and they are represented in population. Then judgment
is used to select the required number of subjects from energy meter and
generators.
3.6 VALIDATION OF INSTRUMENT
Data validity require that the data collection process really measures
what is suppose to measure.
57
However, the instrument used in this research work for collection of
data is valid, as it actually measured the characteristics of the process it was
designed to measure.
3.7 RELIABILITY OF THE INSTRUMENT
In the data collection process, the instrument used is reliable as it is
technically correct, unambiguous and effort were made to ensure that the
respondent were available to give the answer to the questions themselves.
3. ADMINISTRATION OF INSTRUMENT
In order to ensure good presentation of the data collected, tables
percentages, simple bar chart and pie chart were used to analyzed data
collected.
58
CHAPTER FOUR
4.0 ANALYSIS AND DISCUSSION
This Chapter is used for the discussion on the data collected, that is the
constraints encountered with the respondent.
The Following problems and constraint were encountered
a) Most respondent proved incompetent in answering the questionnaire
b) Nonchalant attitude behavior put up by some respondents
c) The collection of complete questionnaire proved difficult because some
of the respondent could not be found at home.
4.1 ENERGY AUDITS
An energy audit first identifies how energy is used in your home and
then recommend ways to improve energy efficiently and reduce energy
costs. In practice there is wide variance among the different level of energy
audit available. Or as Albert Thurman writes in the Handbook of Energy
Audit, “There is a direct relationship to the cost of the audit(amount of data
collected and analyzed) and the number of energy conservation opportunities
to be found”.
59
4.2 ENERGY WASTAGE
From our study, we found out that a lot of energy is wasted in Nigeria
because households, public and private offices and industries use more
energy than is actually necessary to fulfill their needs. One of the reasons is
that they use old and inefficient equipment and production processes. The
other reason, which we want to discuss in this chapter are unwholesome
practices that lead to energy wastage. In this chapter, we will enumerate
these practices.
4.2.1 DOMINANT USE OF INCANDESCENT LIGHT BULBS
The common type of lamp used is incandescent bulb and the name
for incandescent bulb in Nigeria generally is “yellow bulb” because of the
yellowish colour of the light rays from the bulbs. Many Nigerians are not
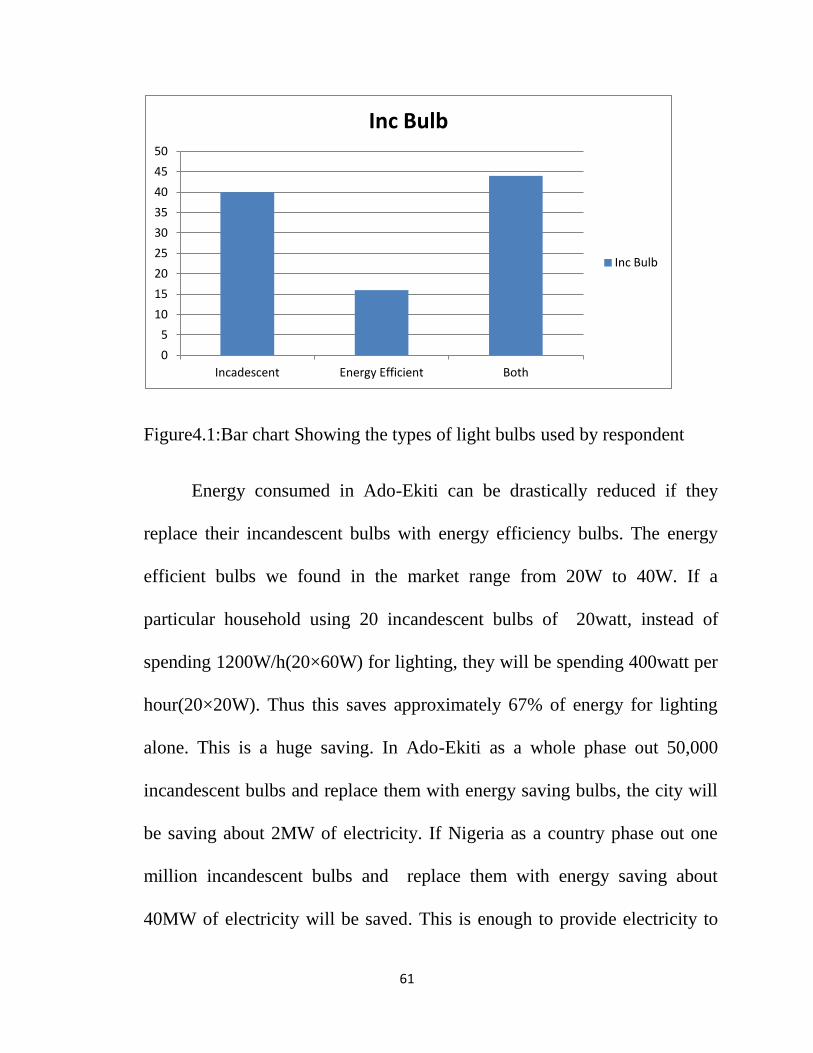
familiar with the name ‘Incandescent’. From our study 40% of our
respondent claim they use incandescent bulbs(Fig4.1). The use of
incandescent bulb for lighting is energy intensive. Only about 5% of total
energy used by an incandescent bulb is converted light energy, the
remaining 95% is converted to heat energy (Lebot, 2009). The energy rating
of the incandescent bulbs found in the Nigerian market range from 40W to
200W, thus we have the ones for 40W, 60W, 100W and 200W.
60
Our findings revealed that in many places where people experience
low voltage, people purchase the 100W and 200W in order to get a brighter
effect. Also, many people use the high rating incandescent bulbs for outdoor
lighting because they appear brighter. A major factor working against the
shift from incandescent bulbs to energy saving bulbs is the cost. Energy
saving bulbs are far more expensive than incandescent bulbs. The cost of
energy saving bulb in the Nigerian market ranges between N800 to N1000.
However, some substandard energy saving bulbs could be purchase for
about N200. On the other hand, the prices of incandescent bulbs range from
N30 to N100.
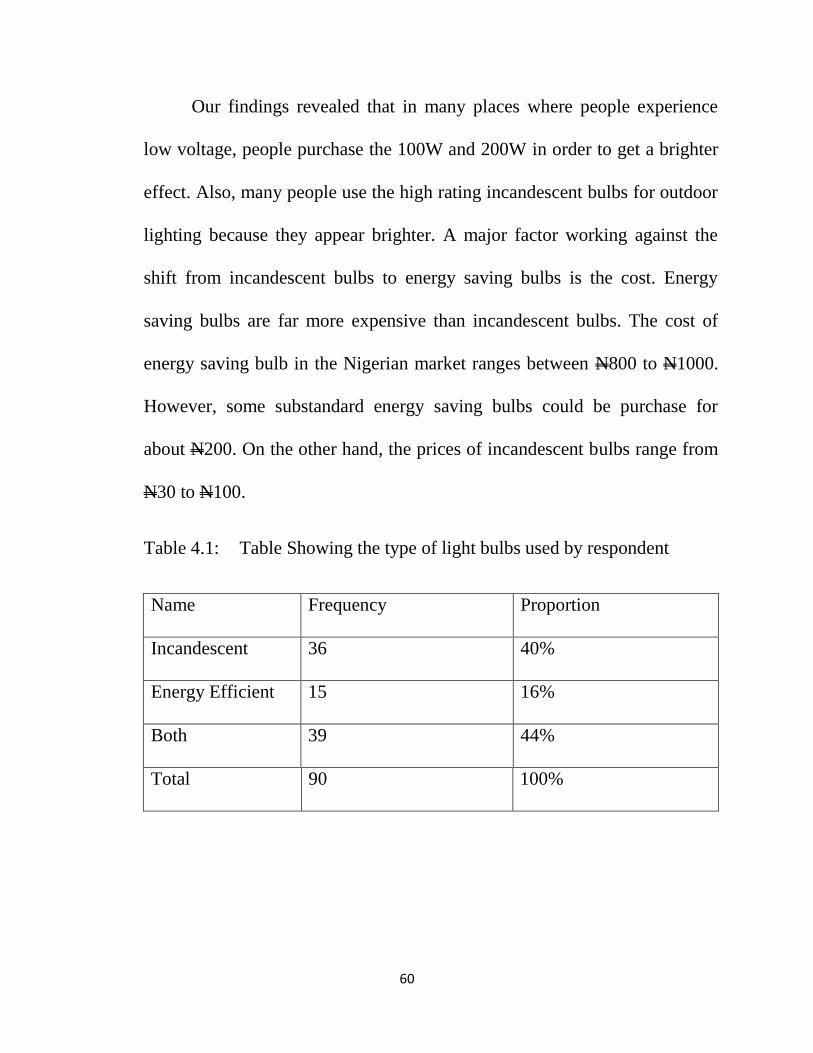
Table 4.1: Table Showing the type of light bulbs used by respondent
Name Frequency Proportion
Incandescent 36 40%
Energy Efficient 15 16%
Both 39 44%
Total 90 100%
61
Figure4.1:Bar chart Showing the types of light bulbs used by respondent
Energy consumed in Ado-Ekiti can be drastically reduced if they
replace their incandescent bulbs with energy efficiency bulbs. The energy
efficient bulbs we found in the market range from 20W to 40W. If a
particular household using 20 incandescent bulbs of 20watt, instead of
spending 1200W/h(20×60W) for lighting, they will be spending 400watt per
hour(20×20W). Thus this saves approximately 67% of energy for lighting
alone. This is a huge saving. In Ado-Ekiti as a whole phase out 50,000
incandescent bulbs and replace them with energy saving bulbs, the city will
be saving about 2MW of electricity. If Nigeria as a country phase out one
million incandescent bulbs and replace them with energy saving about
40MW of electricity will be saved. This is enough to provide electricity to
0
5
10
15
20
25
30
35
40
45
50
Incadescent Energy Efficient Both
Inc Bulb
Inc Bulb
62
many communities in Nigeria. If each of the 36 states and the FCT replace
one million incandescent bulbs each we can save up to 1480MW of
electricity.
Policy option for Ado-Ekiti will include phase out of incandescent
bulbs from the Nigerian system and putting a ban on the importation and
production of incandescent bulbs. Policy to encourage the importation and
production of energy efficiency light bulbs will enhance the efficient use of
energy. Government should put in place strategies to reduce the cost of
energy saving bulbs. Awareness creation is also needed to change the
attitude of Ado-Ekiti occupants on the need to save energy by using the right
technology.
4.2.2 SWITCHING ON OUTDOOR LIGHT DURING THE DAY
Our study revealed that many residential consumers do not put off
their outdoor lighting during the day. This is particularly very common in
residential buildings with joint families. Many respondents blame the PHCN
for this behavior. According to them, when there is power outage during the
dark hours of the day and it lingers into the day, they forget to put off their
outdoor lighting. A lot of energy can be saved if they cultivate the habit of
putting off their outdoor lighting in the day time. Energy saved from using
63
the natural light instead of light bulbs during the day can be made available
for use in offices and for industrial activities.
Policy should be made to make it mandatory for occupants of
residential, public and private buildings to put off their security light during
the day. There may be need to make legislations in order to penalize any
defaulter.
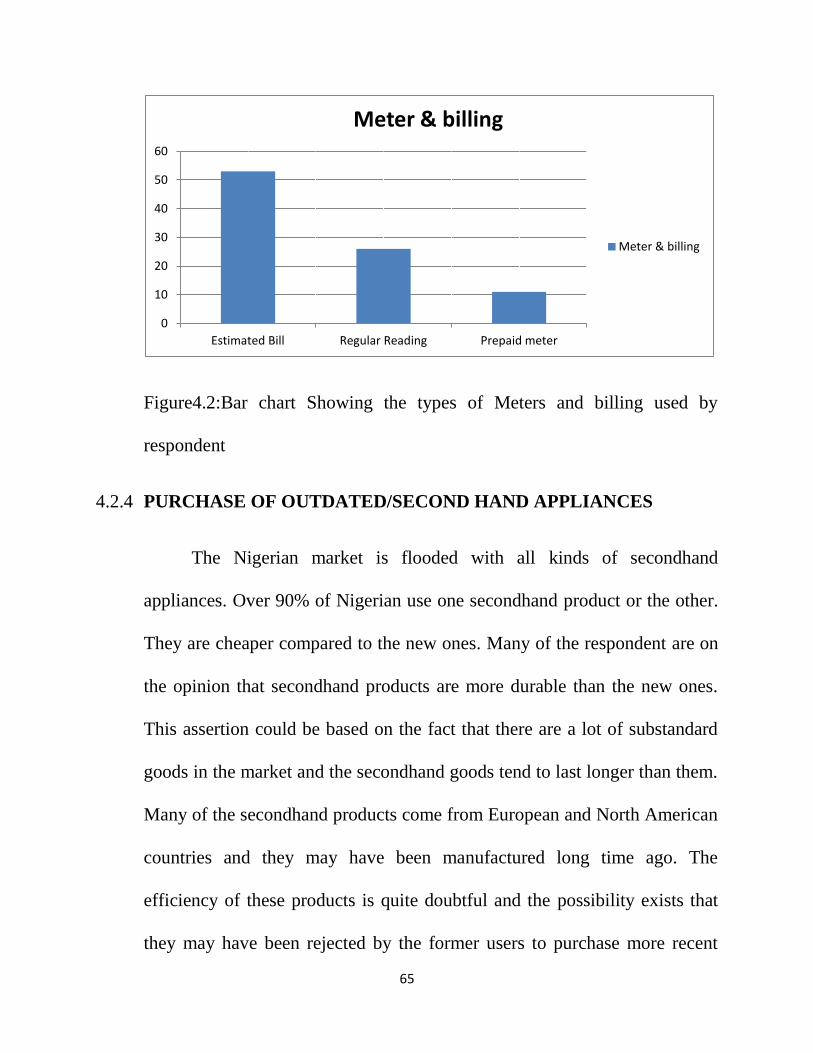
4.2.3 LEAVING APPLIANCE ON WHEN NOT IN USE
Our findings revealed that many residential consumers do not put off
their appliances when they are not in use. This practice can lead to
significant wastage of energy in residential, private and public buildings.
The reason for this could be that many Nigerians do not really pay for the
electricity they consume. In many houses, the meters installed by PHCN are
no longer functioning. What PHCN officials do is to place these houses on
estimated bill. This practice encourages the wastage of electricity, since they
do not really account for what they consume. When people are placed on
estimated bill as shown in (Fig 4.2), people are either overcharged or
undercharge. One of the respondents testified that before they were given the
new prepaid meter, PHCH was charging them over N3000 per month, but
when the new meter was installed, they spend about N500 per month apart
64
from fixed charges. This is a case of overcharged. Again, with estimated bill,
during protracted power outage, people still pay for what they do not
consume.
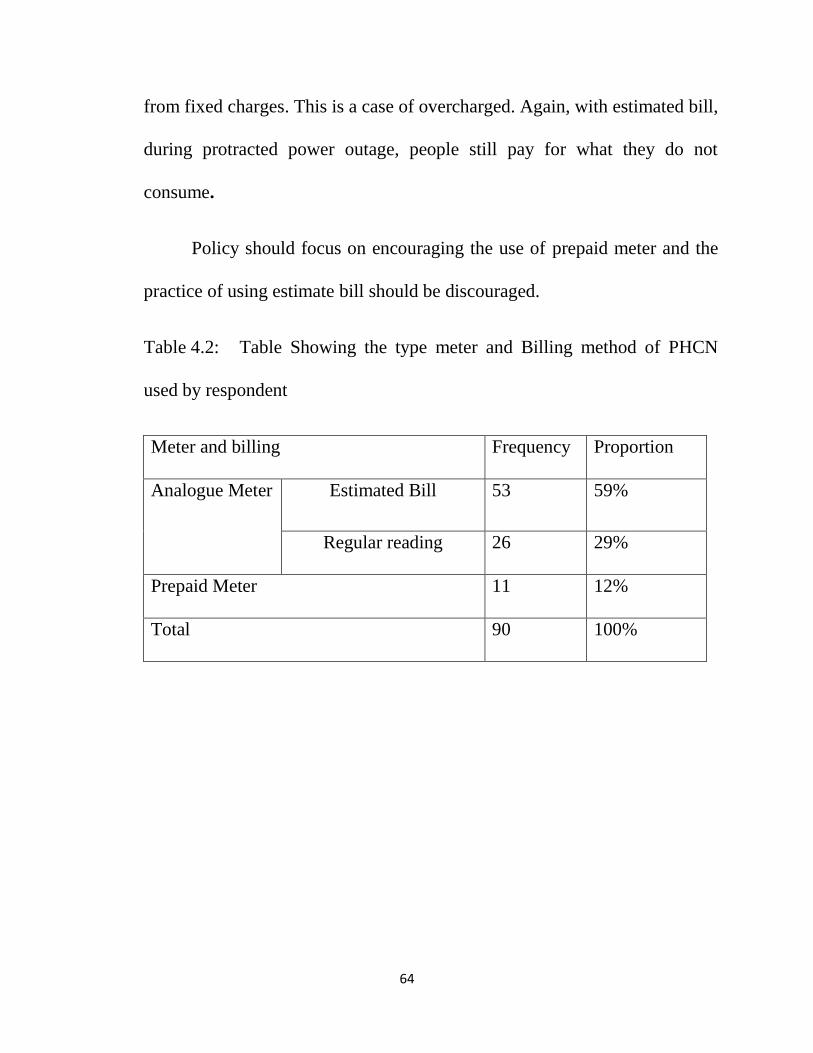
Policy should focus on encouraging the use of prepaid meter and the
practice of using estimate bill should be discouraged.
Table 4.2: Table Showing the type meter and Billing method of PHCN
used by respondent
Meter and billing Frequency Proportion
Analogue Meter Estimated Bill 53 59%
Regular reading 26 29%
Prepaid Meter 11 12%
Total 90 100%
65
Figure4.2:Bar chart Showing the types of Meters and billing used by
respondent
4.2.4 PURCHASE OF OUTDATED/SECOND HAND APPLIANCES
The Nigerian market is flooded with all kinds of secondhand
appliances. Over 90% of Nigerian use one secondhand product or the other.
They are cheaper compared to the new ones. Many of the respondent are on
the opinion that secondhand products are more durable than the new ones.
This assertion could be based on the fact that there are a lot of substandard
goods in the market and the secondhand goods tend to last longer than them.
Many of the secondhand products come from European and North American
countries and they may have been manufactured long time ago. The
efficiency of these products is quite doubtful and the possibility exists that
they may have been rejected by the former users to purchase more recent
0
10
20
30
40
50
60
Estimated Bill Regular Reading Prepaid meter
Meter & billing
Meter & billing
66
and efficient appliances. The secondhand market need to be further studied
to direct policy that will address the situation.
Policy to standardize the secondhand product imported into the
country is necessary. There is also need to make policy that will encourage
Nigerians to purchase new and modern appliances
4.2.5 MULTIPLE USE OF INEFFICIENT HEATING EQUIPMENT
The use of heating equipment for cooking and heating water should be
discouraged in the residential and private buildings. Government should
encourage the use of solar heaters. Heating equipment consume about 60%
of the energy used in houses. In private buildings whereby 5-6 or more
water heating equipment are installed, the use of solar heaters in these
buildings will help to save a lot of energy.
Government should make policy that will encourage residential
consumers to use solar heaters instead of electricity. This could be in the
form of tax reduction or compensation for being energy efficient. The less
energy efficient one can be penalized and made to pay certain fine which
will be used to encourage the more efficient ones.
67
4.3 BARRIERS TO ENERGY EFFICIENCY DEVELOPMENT IN EKITI
It was identified that the following are barriers to the development of
energy efficiency in Ado-Ekiti:
Lack of Policy and Legislation: Lack of policy and legislation to address
the inefficient use of energy is a very key barrier to the development of
energy efficiency. Policy and legislation will help to change behavior
towards an energy efficient economy. From our study, 79% of respondents
are not aware of any policy on energy efficiency made by government.
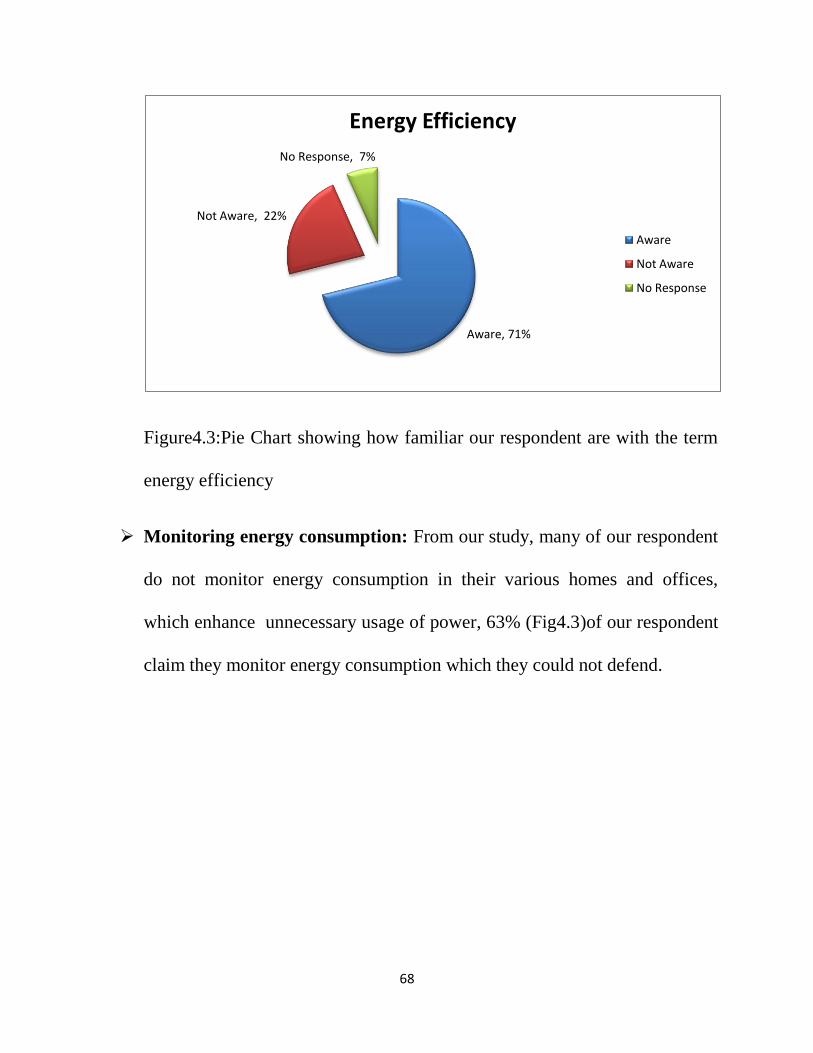
Lack of Awareness: From our study, many of our respondents are familiar
with the term “energy efficiency”, 71%(fig4.3) of respondents claimed that
they are familiar with the term. However, many of these one who claim they
are familiar with the term could not really define it properly. Awareness
creation will go a long way to help people understand the concept and
change their behavior.
68
Figure4.3:Pie Chart showing how familiar our respondent are with the term
energy efficiency
Monitoring energy consumption: From our study, many of our respondent
do not monitor energy consumption in their various homes and offices,
which enhance unnecessary usage of power, 63% (Fig4.3)of our respondent
claim they monitor energy consumption which they could not defend.
Aware, 71%
Not Aware, 22%
No Response, 7%
Energy Efficiency
Aware
Not Aware
No Response
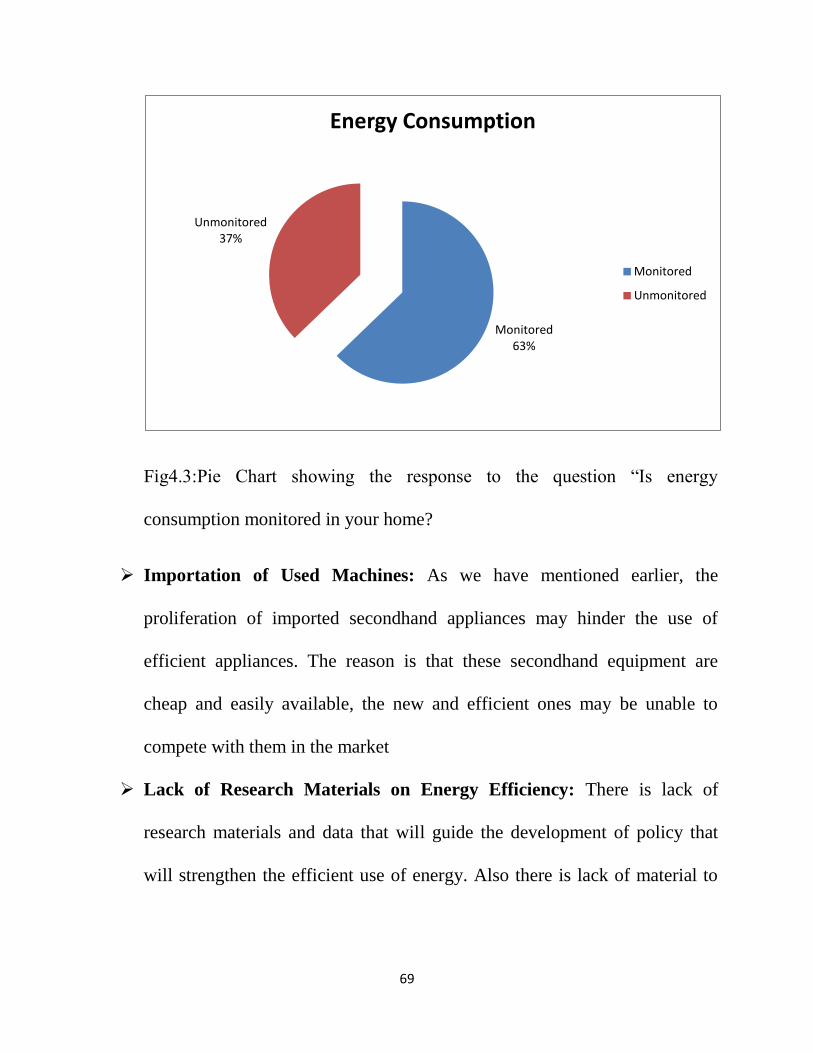
69
Fig4.3:Pie Chart showing the response to the question “Is energy
consumption monitored in your home?
Importation of Used Machines: As we have mentioned earlier, the
proliferation of imported secondhand appliances may hinder the use of
efficient appliances. The reason is that these secondhand equipment are
cheap and easily available, the new and efficient ones may be unable to
compete with them in the market
Lack of Research Materials on Energy Efficiency: There is lack of
research materials and data that will guide the development of policy that
will strengthen the efficient use of energy. Also there is lack of material to
Monitored 63%
Unmonitored 37%
Energy Consumption
Monitored
Unmonitored
70
conduct training on energy efficiency. These barriers are being addressed by
this study.
Inefficient Metering System and Low Electricity Pricing: The metering
system in Ado-Ekiti is very inefficient and does not encourage consumers to
pay the correct amount for the energy they consume. Many people that still
use the old meters are now on estimation since these meters are faulty. The
use of prepaid meters which was recently introduced by the PHCN will help
change the behavior of consumers to use energy efficiently.
Proliferation of Inefficient Equipment and Desire to Minimize Initial
Cost: The desire to minimize initial cost force many consumers to purchase
cheap and inefficient appliances. For example, the cost of energy saving
bulbs in the Ado-Ekit market is about N800 compared to an incandescent
bulb which cost about N40. Many consumers will prefer to go for the
cheaper ones not minding the long-term benefit of using efficiency bulbs.
Low income: Many are not able to afford the cost of efficiency appliances
which are sometime more expensive than the less efficient ones.
71
4.4 ANALYSIS OF ENERGY SITUATION IN ADO EKITI
Access to electricity is a problem in Nigeria, 99% of our respondents
do not get electricity supply for up to 24 hours. This is another important
factor that may affect the development of energy efficiency. “You are asking
us to save energy; we do not even have the energy to save”. This is one of
the comments we received during one of our focused group discussion.
Respondents are on the opinion that when the energy is made available, then
they will endeavor to save energy. Awareness creation and enlightenment
campaign is needed to erase this notion from the minds of Nigerians. People
should be made to understand that if they save energy, there will be enough
energy to go round everybody. This can help to solve the epileptic supply of
electricity.
4.5 POWER OUTAGES
Power interruption outage is a process whereby the source of electric
power that has been giving continuous supply for use in a particular area
suddenly fails to keep delivering the services. This usually leaves the
consumers that depend on the services handicapped. There are many causes
of power failures in an electricity network. Examples of these causes include
faults at power stations damage to electric transmission lines, substation or
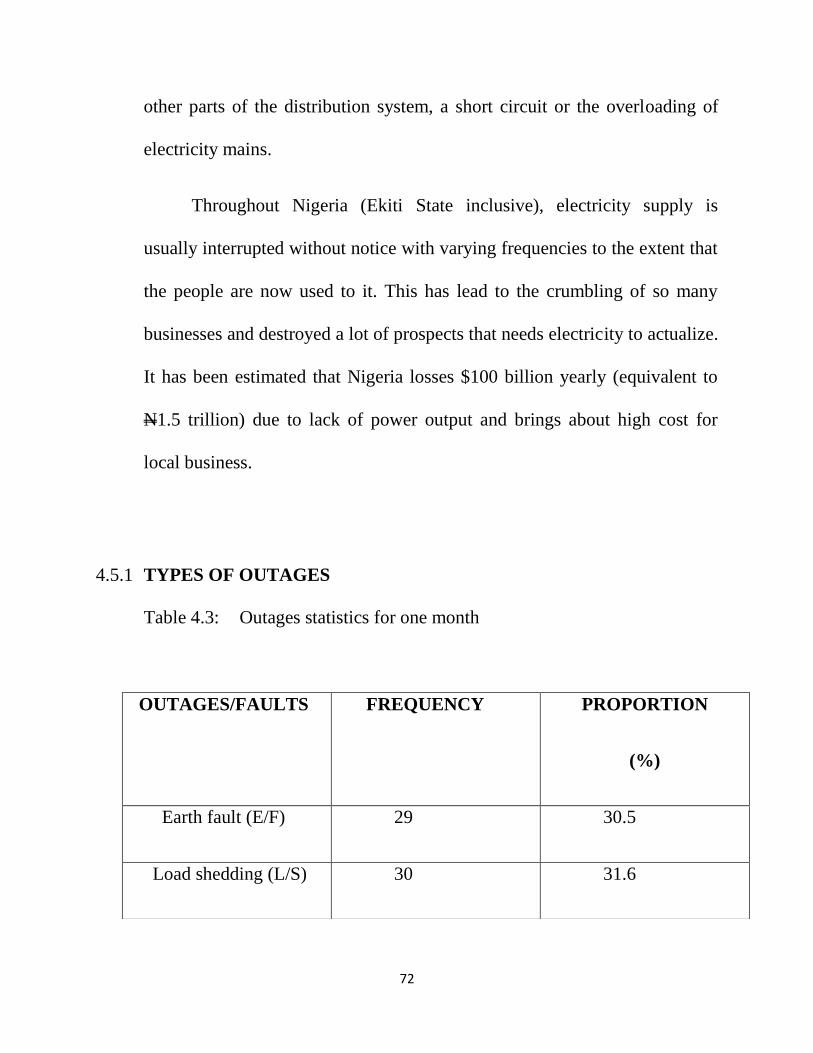
72
other parts of the distribution system, a short circuit or the overloading of
electricity mains.
Throughout Nigeria (Ekiti State inclusive), electricity supply is
usually interrupted without notice with varying frequencies to the extent that
the people are now used to it. This has lead to the crumbling of so many
businesses and destroyed a lot of prospects that needs electricity to actualize.
It has been estimated that Nigeria losses $100 billion yearly (equivalent to
N1.5 trillion) due to lack of power output and brings about high cost for
local business.
4.5.1 TYPES OF OUTAGES
Table 4.3: Outages statistics for one month
OUTAGES/FAULTS FREQUENCY PROPORTION
(%)
Earth fault (E/F) 29 30.5
Load shedding (L/S) 30 31.6
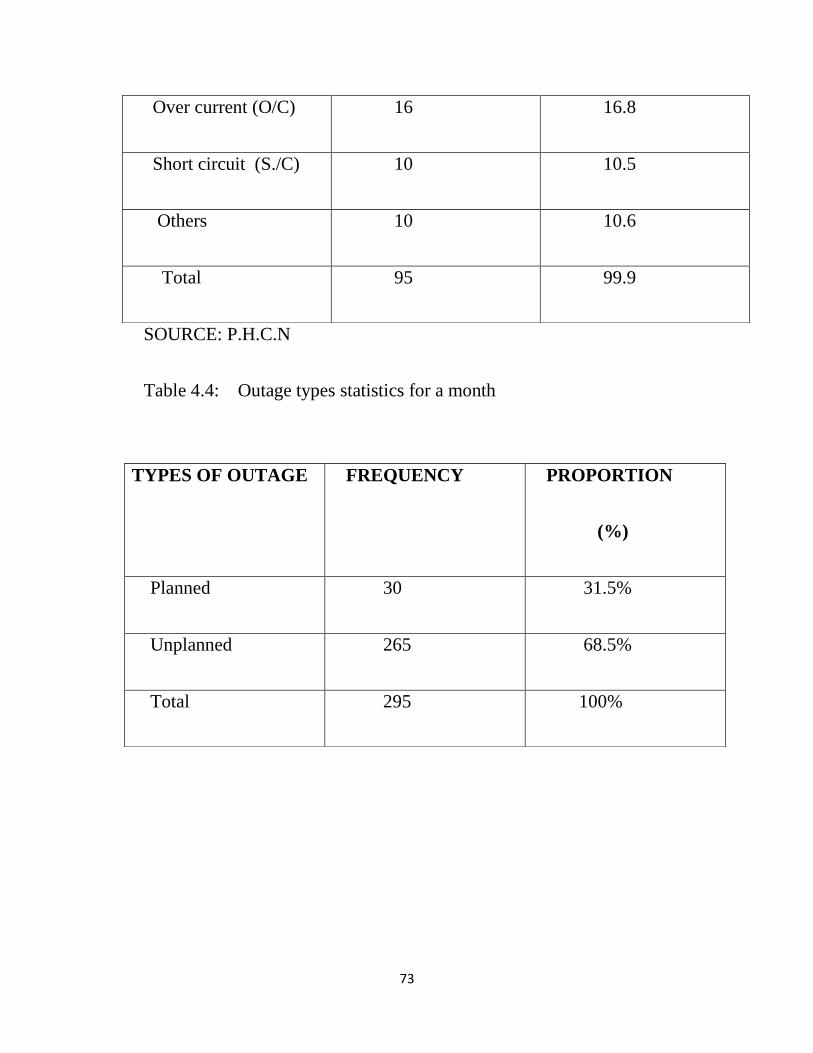
73
SOURCE: P.H.C.N
Table 4.4: Outage types statistics for a month
Over current (O/C) 16 16.8
Short circuit (S./C) 10 10.5
Others 10 10.6
Total 95 99.9
TYPES OF OUTAGE FREQUENCY PROPORTION
(%)
Planned 30 31.5%
Unplanned 265 68.5%
Total 295 100%
74
A sample of outages experienced over a period of one month as
tabulated above shows that load shedding is more prominent with a
percentage of 31.6% which is closely followed by earth fault tripping off
30.5%. Over current is next to the tune of 16.8% while short circuit and
other forms of outages take 10.5% and 10.52% respectively.
Furthermore, these forms of outages were further categorized under
planned and unplanned outages. Unplanned outages are more frequent with
overall percentage of 68.5% compared to 31.5% of that of planned outages.
The fact remains that the high percentage of unplanned outages
experienced is due to the encroachment to and interference with the
overhead line supplying electricity to the state in form of vandalization,
vegetation encroachment, lack of maintenance, neglect, obsolete equipment,
incompetence etc.
Most of these outages, which usually occur for more than six hours,
are being attributed to inexperience personnel, corruption, and vandalization
of equipment neglect of infrastructures, overloading of equipment,
insufficient in received compared to the required (demanded) power,
unexpected fault occurrences on the network and poor maintenance culture.
75
4.5.2 ANALYSIS OF VARIOUS TYPES OF FAULTS / OUTAGES THAT
ARE EXPERIENCED IN THE DISTRIBUTION NETWORK IN EKITI
STATE. (ADO - EKITI)
The statistical data achieved through a written record of the power
holding company of Nigeria, Ado Ekiti Business Unit revealed that among
the different types of faults occurring across the distribution network in the
state had been narrowed to four major types of which includes;
i Earth Fault (E/F)
ii Over Current (O/C)
iii Load Shedding (L/S)
iv Planned Outages
4.5.3 EARTH FAULT
The major type of fault that has the highest frequency of occurrence
across the distribution network is earth fault. It is caused mostly as a result
of link between the conductors and the earth or between any one of the three
phases to earth. This is mainly caused by vegetation encroachment, broken
cross arms, wire cut, etc.
76
4.5.4 OVER CURRENT
In Electricity supply, over current or excess current is a situation
where a larger than intended electric current exists through a conductor,
leading to excessive generation of heat and the risk of fire or damage to
equipment.
This is caused as a result of a link between two or more phase or
worse still is a fault called double line to ground which normally has an over
current co – occurring at a time. This type of fault is not very common.
Possible causes for over current include short circuits, excessive load,
incorrect design, flash over, broken cross – arms, fallen poles etc. Fuses,
circuit’s breakers, temperature sensors and current limiters are commonly
used protection mechanisms to control the risks of over
current.(en.wikipedia.org)
4.5.5 LOAD SHEDDING
When the supplying company receives more demand for electrical
power than its generating or transmission or installed capacity can deliver,
the company has to resort to rationing of the available electricity to its
customers this acts is called LOAD SHEDDING .
77
Load shedding can also be referred to as demand side management or load
management.
This is best described as an act that is employed in order to keep the
system running, by reducing the load on the generators and equipment. This
is usually done during the load peak period which is usually 7-9pm or in
case of emergency short fall on the generation or as a result of breakdown of
equipment and vandalization on the interconnectivity of the National Grid
on transmission links feeding such areas.
Load shedding is also employed in order to enable maintenance on
equipment and service lines.
4.5.6 PLANNED OUTAGE
It is carried out mainly to enable maintenance, in which the duration
depends on the type of maintenance that is to be carried out. Most times,
maintenance takes more time than other forms of outages.
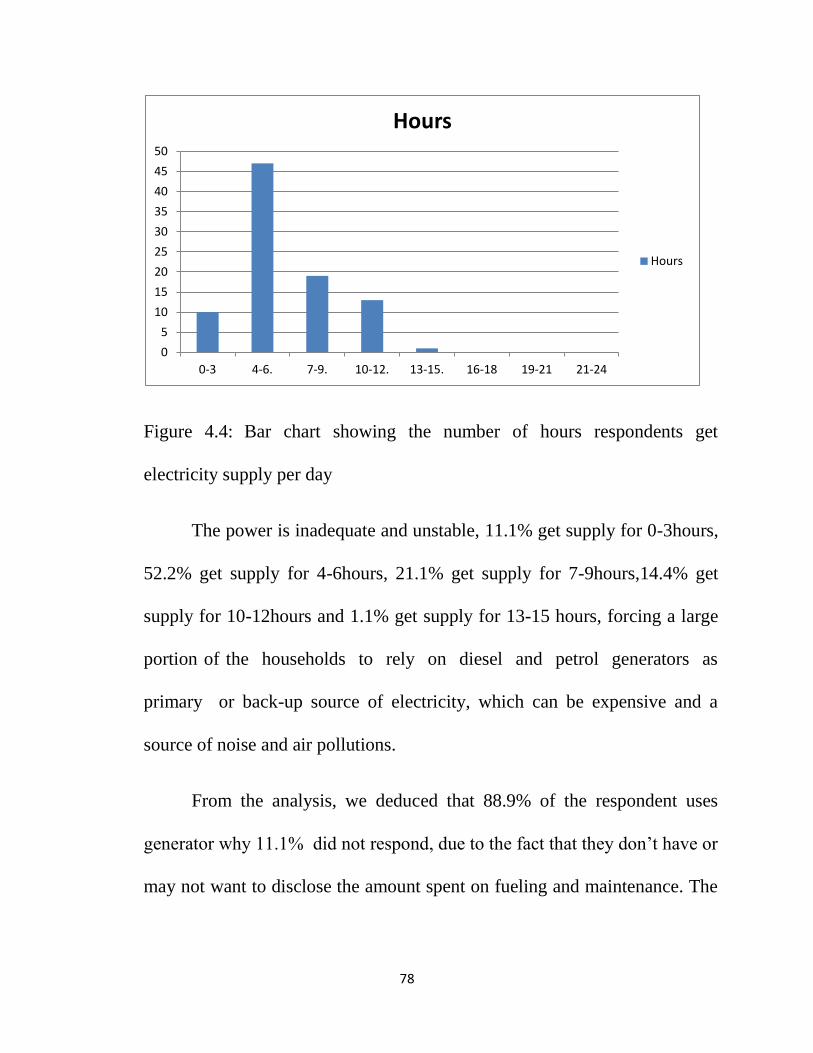
78
Figure 4.4: Bar chart showing the number of hours respondents get
electricity supply per day
The power is inadequate and unstable, 11.1% get supply for 0-3hours,
52.2% get supply for 4-6hours, 21.1% get supply for 7-9hours,14.4% get
supply for 10-12hours and 1.1% get supply for 13-15 hours, forcing a large
portion of the households to rely on diesel and petrol generators as
primary or back-up source of electricity, which can be expensive and a
source of noise and air pollutions.
From the analysis, we deduced that 88.9% of the respondent uses
generator why 11.1% did not respond, due to the fact that they don’t have or
may not want to disclose the amount spent on fueling and maintenance. The
0
5
10
15
20
25
30
35
40
45
50
0-3 4-6. 7-9. 10-12. 13-15. 16-18 19-21 21-24
Hours
Hours
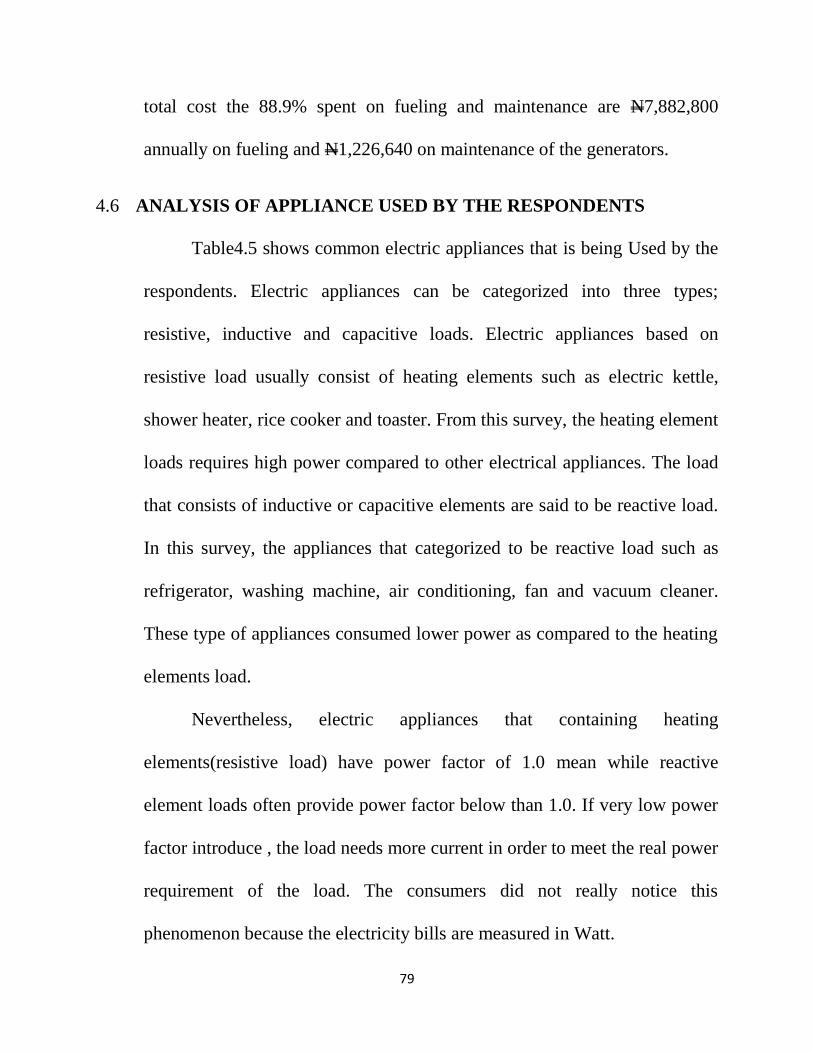
79
total cost the 88.9% spent on fueling and maintenance are N7,882,800
annually on fueling and N1,226,640 on maintenance of the generators.
4.6 ANALYSIS OF APPLIANCE USED BY THE RESPONDENTS
Table4.5 shows common electric appliances that is being Used by the
respondents. Electric appliances can be categorized into three types;
resistive, inductive and capacitive loads. Electric appliances based on
resistive load usually consist of heating elements such as electric kettle,
shower heater, rice cooker and toaster. From this survey, the heating element
loads requires high power compared to other electrical appliances. The load
that consists of inductive or capacitive elements are said to be reactive load.
In this survey, the appliances that categorized to be reactive load such as
refrigerator, washing machine, air conditioning, fan and vacuum cleaner.
These type of appliances consumed lower power as compared to the heating
elements load.
Nevertheless, electric appliances that containing heating
elements(resistive load) have power factor of 1.0 mean while reactive
element loads often provide power factor below than 1.0. If very low power
factor introduce , the load needs more current in order to meet the real power
requirement of the load. The consumers did not really notice this
phenomenon because the electricity bills are measured in Watt.
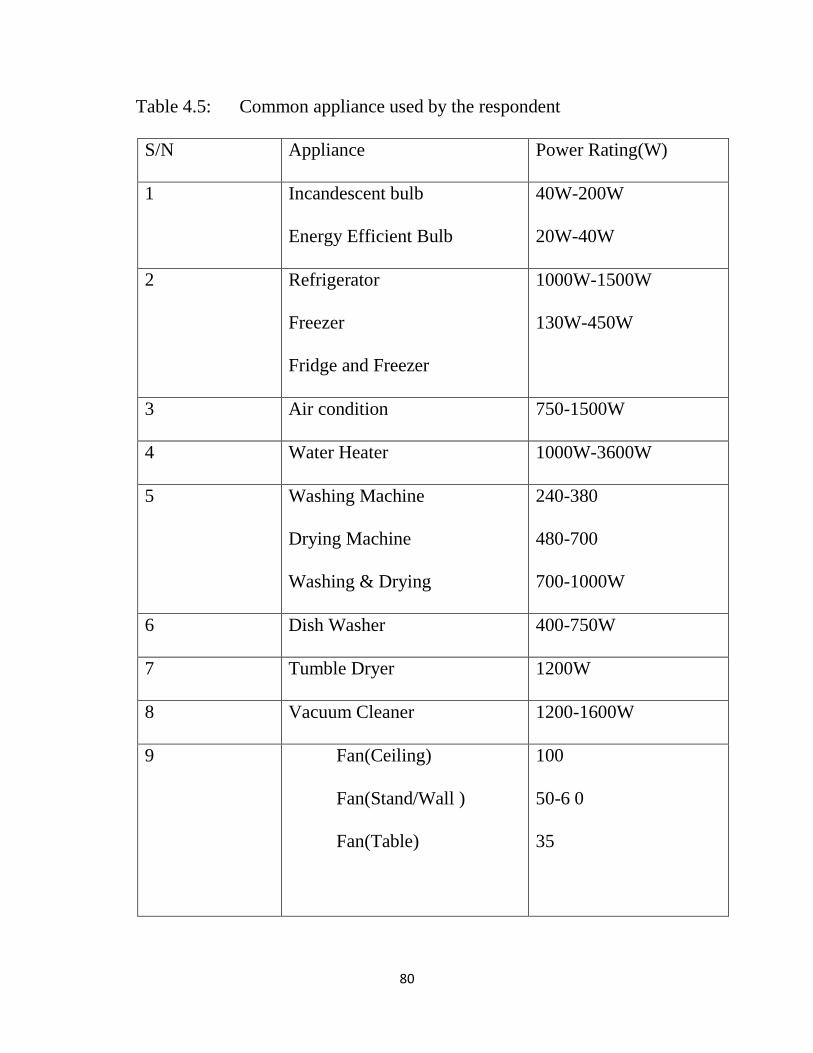
80
Table 4.5: Common appliance used by the respondent
S/N Appliance Power Rating(W)
1 Incandescent bulb
Energy Efficient Bulb
40W-200W
20W-40W
2 Refrigerator
Freezer
Fridge and Freezer
1000W-1500W
130W-450W
3 Air condition 750-1500W
4 Water Heater 1000W-3600W
5 Washing Machine
Drying Machine
Washing & Drying
240-380
480-700
700-1000W
6 Dish Washer 400-750W
7 Tumble Dryer 1200W
8 Vacuum Cleaner 1200-1600W
9 Fan(Ceiling)
Fan(Stand/Wall )
Fan(Table)
100
50-6 0
35
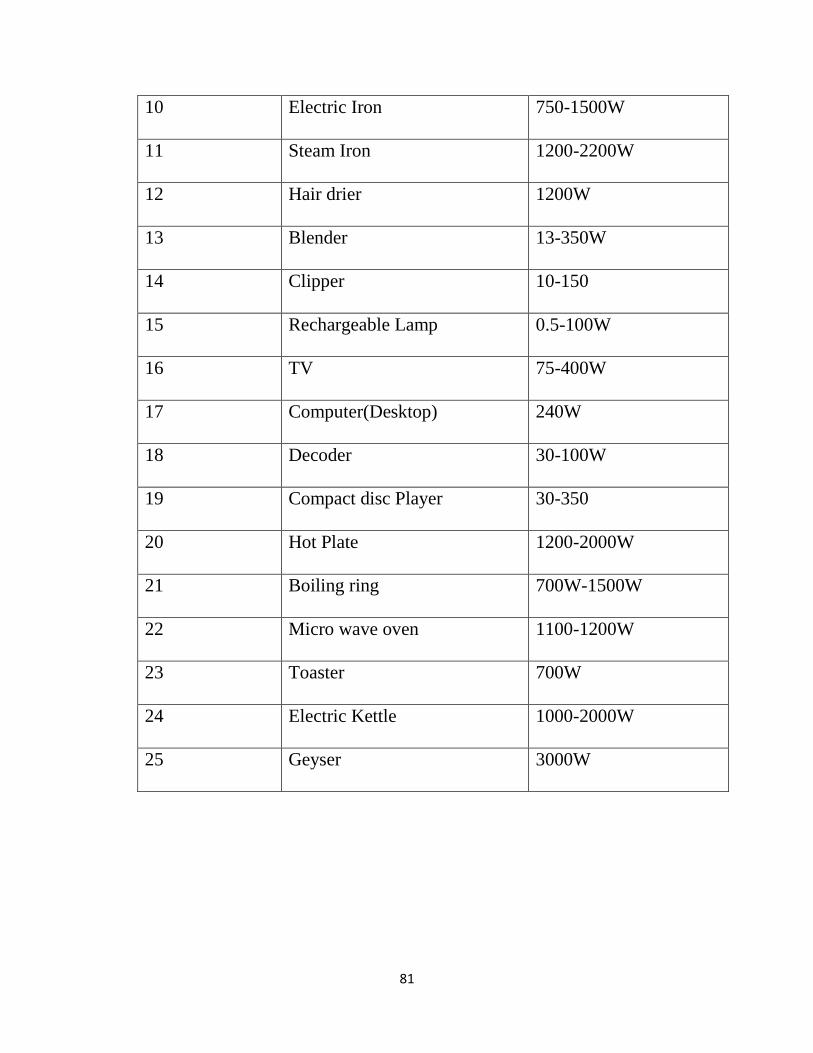
81
10 Electric Iron 750-1500W
11 Steam Iron 1200-2200W
12 Hair drier 1200W
13 Blender 13-350W
14 Clipper 10-150
15 Rechargeable Lamp 0.5-100W
16 TV 75-400W
17 Computer(Desktop) 240W
18 Decoder 30-100W
19 Compact disc Player 30-350
20 Hot Plate 1200-2000W
21 Boiling ring 700W-1500W
22 Micro wave oven 1100-1200W
23 Toaster 700W
24 Electric Kettle 1000-2000W
25 Geyser 3000W
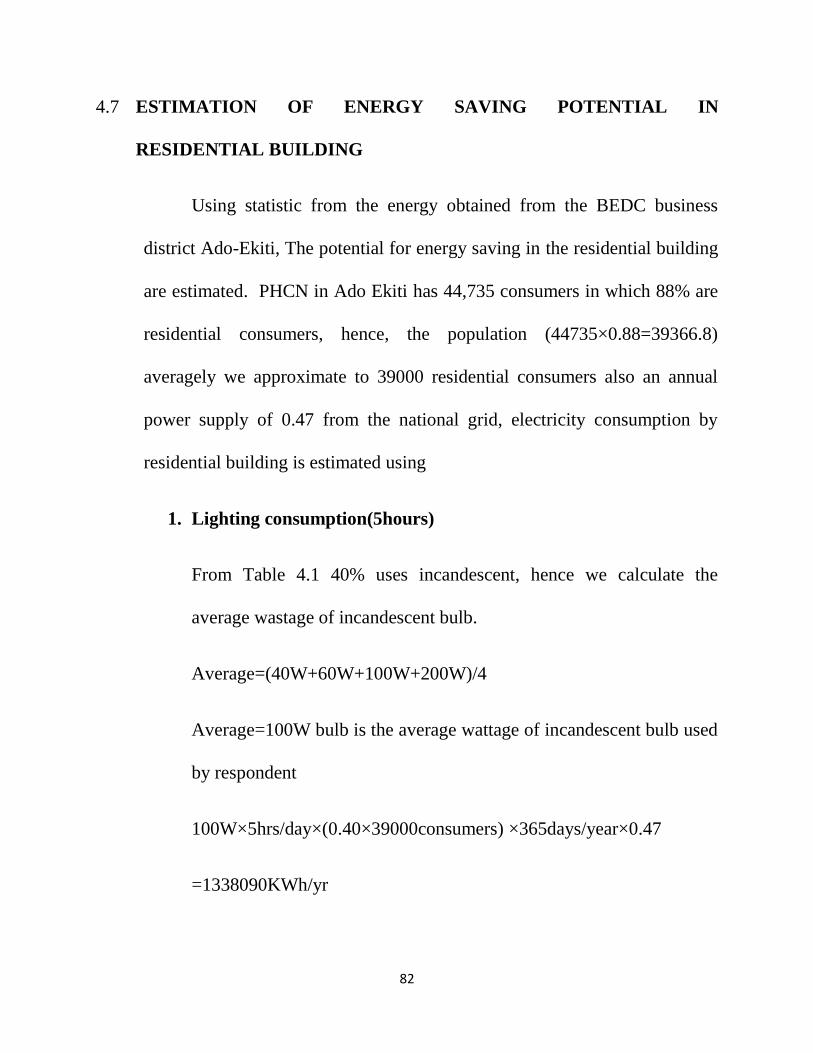
82
4.7 ESTIMATION OF ENERGY SAVING POTENTIAL IN
RESIDENTIAL BUILDING
Using statistic from the energy obtained from the BEDC business
district Ado-Ekiti, The potential for energy saving in the residential building
are estimated. PHCN in Ado Ekiti has 44,735 consumers in which 88% are
residential consumers, hence, the population (44735×0.88=39366.8)
averagely we approximate to 39000 residential consumers also an annual
power supply of 0.47 from the national grid, electricity consumption by
residential building is estimated using
1. Lighting consumption(5hours)
From Table 4.1 40% uses incandescent, hence we calculate the
average wastage of incandescent bulb.
Average=(40W+60W+100W+200W)/4
Average=100W bulb is the average wattage of incandescent bulb used
by respondent
100W×5hrs/day×(0.40×39000consumers) ×365days/year×0.47
=1338090KWh/yr
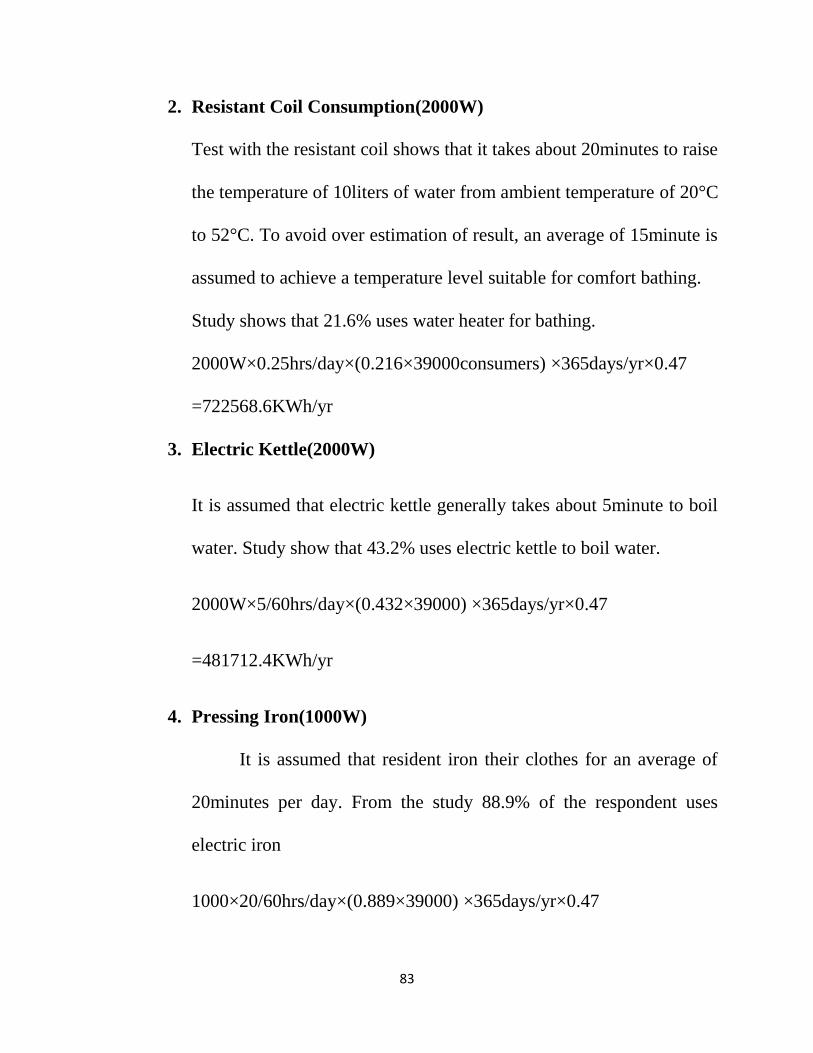
83
2. Resistant Coil Consumption(2000W)
Test with the resistant coil shows that it takes about 20minutes to raise
the temperature of 10liters of water from ambient temperature of 20°C
to 52°C. To avoid over estimation of result, an average of 15minute is
assumed to achieve a temperature level suitable for comfort bathing.
Study shows that 21.6% uses water heater for bathing.
2000W×0.25hrs/day×(0.216×39000consumers) ×365days/yr×0.47
=722568.6KWh/yr
3. Electric Kettle(2000W)
It is assumed that electric kettle generally takes about 5minute to boil
water. Study show that 43.2% uses electric kettle to boil water.
2000W×5/60hrs/day×(0.432×39000) ×365days/yr×0.47
=481712.4KWh/yr
4. Pressing Iron(1000W)
It is assumed that resident iron their clothes for an average of
20minutes per day. From the study 88.9% of the respondent uses
electric iron
1000×20/60hrs/day×(0.889×39000) ×365days/yr×0.47
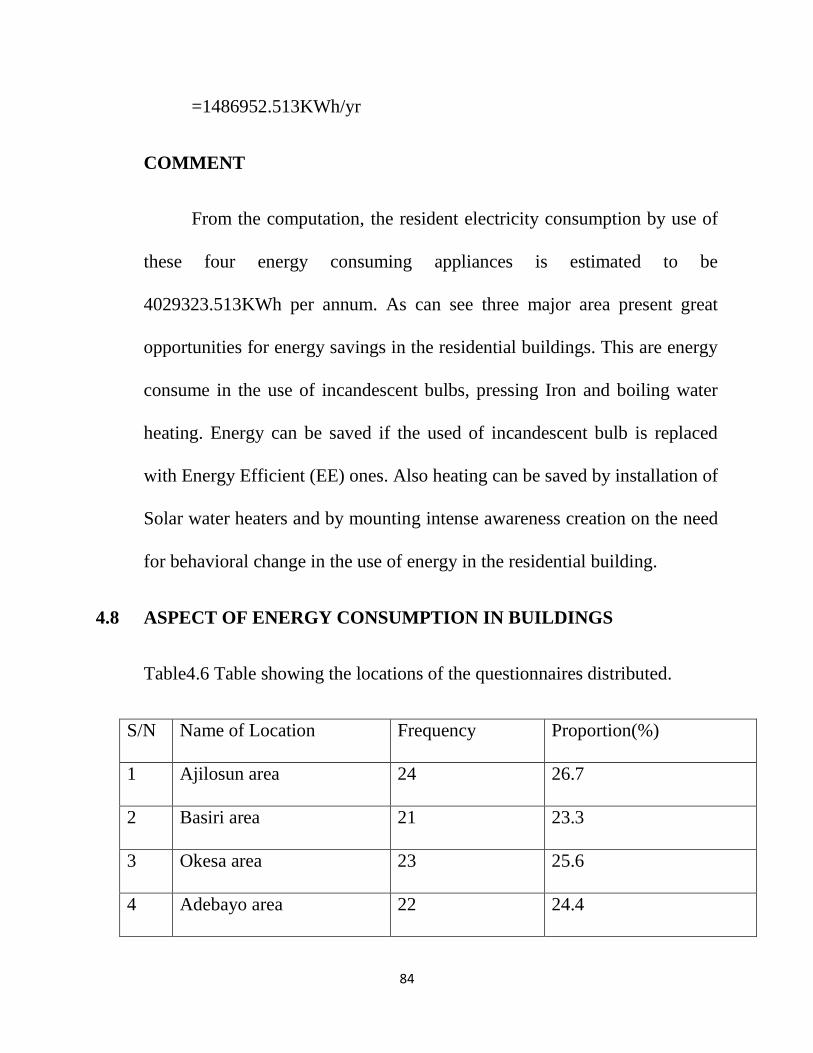
84
=1486952.513KWh/yr
COMMENT
From the computation, the resident electricity consumption by use of
these four energy consuming appliances is estimated to be
4029323.513KWh per annum. As can see three major area present great
opportunities for energy savings in the residential buildings. This are energy
consume in the use of incandescent bulbs, pressing Iron and boiling water
heating. Energy can be saved if the used of incandescent bulb is replaced
with Energy Efficient (EE) ones. Also heating can be saved by installation of
Solar water heaters and by mounting intense awareness creation on the need
for behavioral change in the use of energy in the residential building.
4.8 ASPECT OF ENERGY CONSUMPTION IN BUILDINGS
Table4.6 Table showing the locations of the questionnaires distributed.
S/N Name of Location Frequency Proportion(%)
1 Ajilosun area 24 26.7
2 Basiri area 21 23.3
3 Okesa area 23 25.6
4 Adebayo area 22 24.4
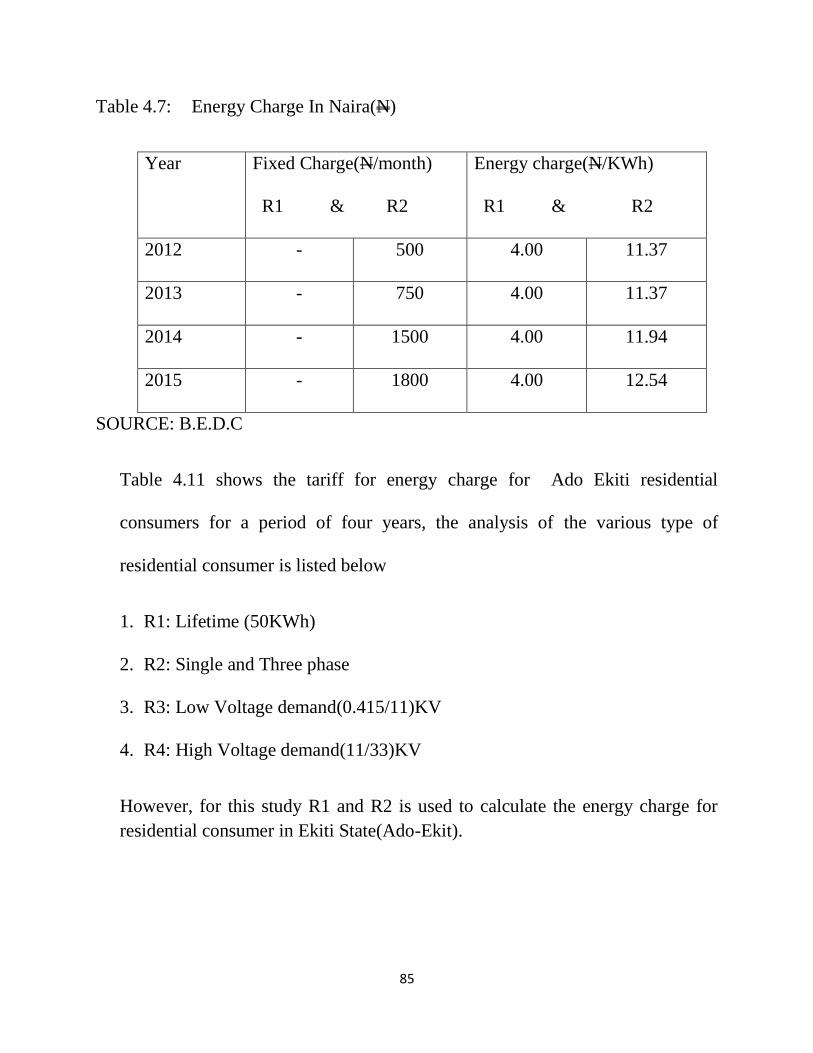
85
Table 4.7: Energy Charge In Naira(N)
Year Fixed Charge(N/month)
R1 & R2
Energy charge(N/KWh)
R1 & R2
2012 - 500 4.00 11.37
2013 - 750 4.00 11.37
2014 - 1500 4.00 11.94
2015 - 1800 4.00 12.54
SOURCE: B.E.D.C
Table 4.11 shows the tariff for energy charge for Ado Ekiti residential
consumers for a period of four years, the analysis of the various type of
residential consumer is listed below
1. R1: Lifetime (50KWh)
2. R2: Single and Three phase
3. R3: Low Voltage demand(0.415/11)KV
4. R4: High Voltage demand(11/33)KV
However, for this study R1 and R2 is used to calculate the energy charge for
residential consumer in Ekiti State(Ado-Ekit).
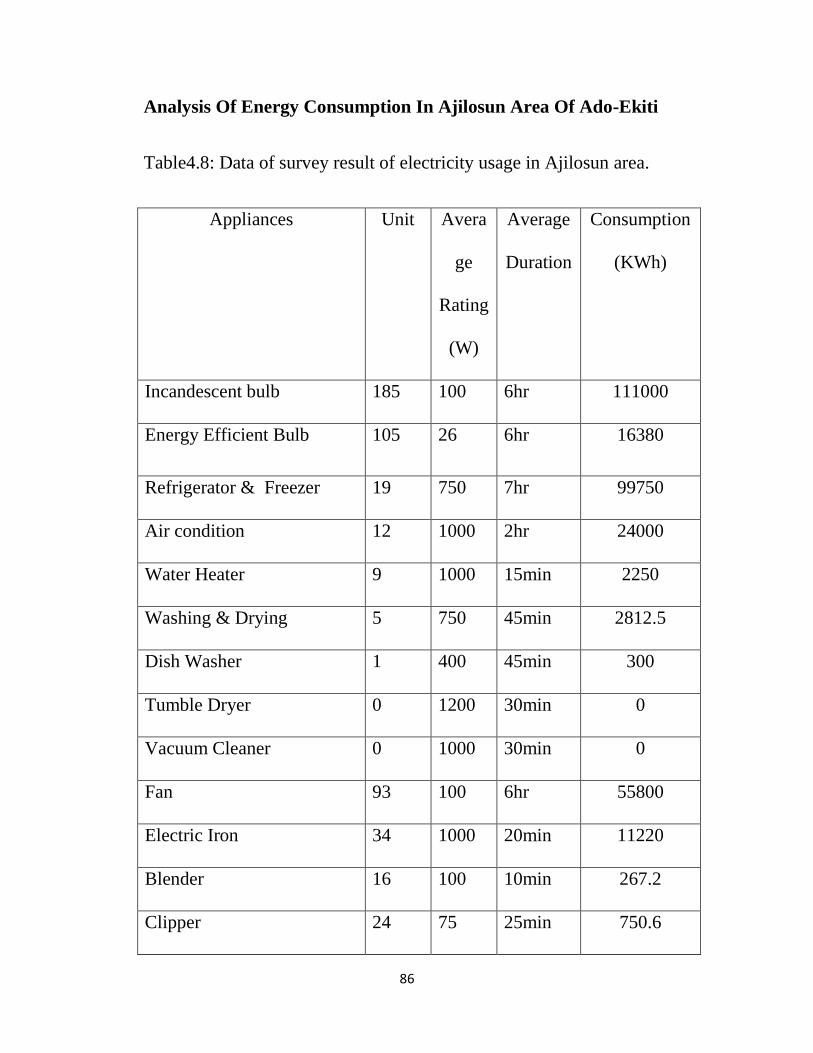
86
Analysis Of Energy Consumption In Ajilosun Area Of Ado-Ekiti
Table4.8: Data of survey result of electricity usage in Ajilosun area.
Appliances Unit Avera
ge
Rating
(W)
Average
Duration
Consumption
(KWh)
Incandescent bulb 185 100 6hr 111000
Energy Efficient Bulb 105 26 6hr 16380
Refrigerator & Freezer 19 750 7hr 99750
Air condition 12 1000 2hr 24000
Water Heater 9 1000 15min 2250
Washing & Drying 5 750 45min 2812.5
Dish Washer 1 400 45min 300
Tumble Dryer 0 1200 30min 0
Vacuum Cleaner 0 1000 30min 0
Fan 93 100 6hr 55800
Electric Iron 34 1000 20min 11220
Blender 16 100 10min 267.2
Clipper 24 75 25min 750.6
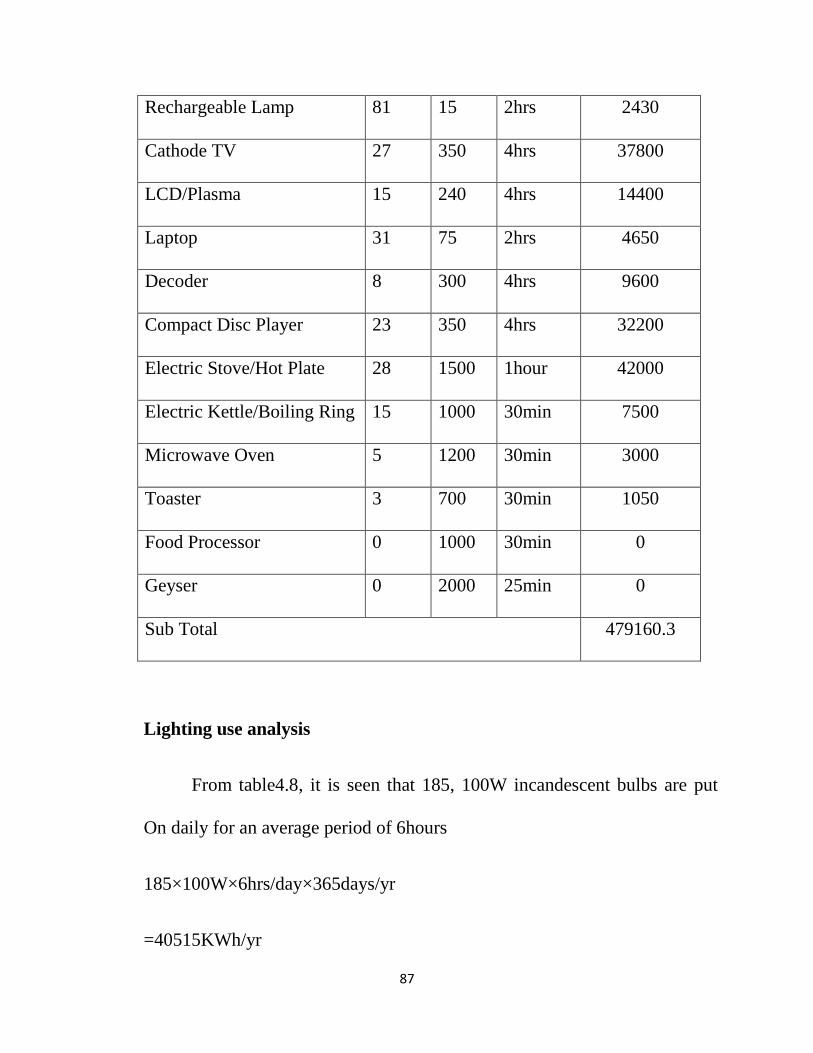
87
Rechargeable Lamp 81 15 2hrs 2430
Cathode TV 27 350 4hrs 37800
LCD/Plasma 15 240 4hrs 14400
Laptop 31 75 2hrs 4650
Decoder 8 300 4hrs 9600
Compact Disc Player 23 350 4hrs 32200
Electric Stove/Hot Plate 28 1500 1hour 42000
Electric Kettle/Boiling Ring 15 1000 30min 7500
Microwave Oven 5 1200 30min 3000
Toaster 3 700 30min 1050
Food Processor 0 1000 30min 0
Geyser 0 2000 25min 0
Sub Total 479160.3
Lighting use analysis
From table4.8, it is seen that 185, 100W incandescent bulbs are put
On daily for an average period of 6hours
185×100W×6hrs/day×365days/yr
=40515KWh/yr
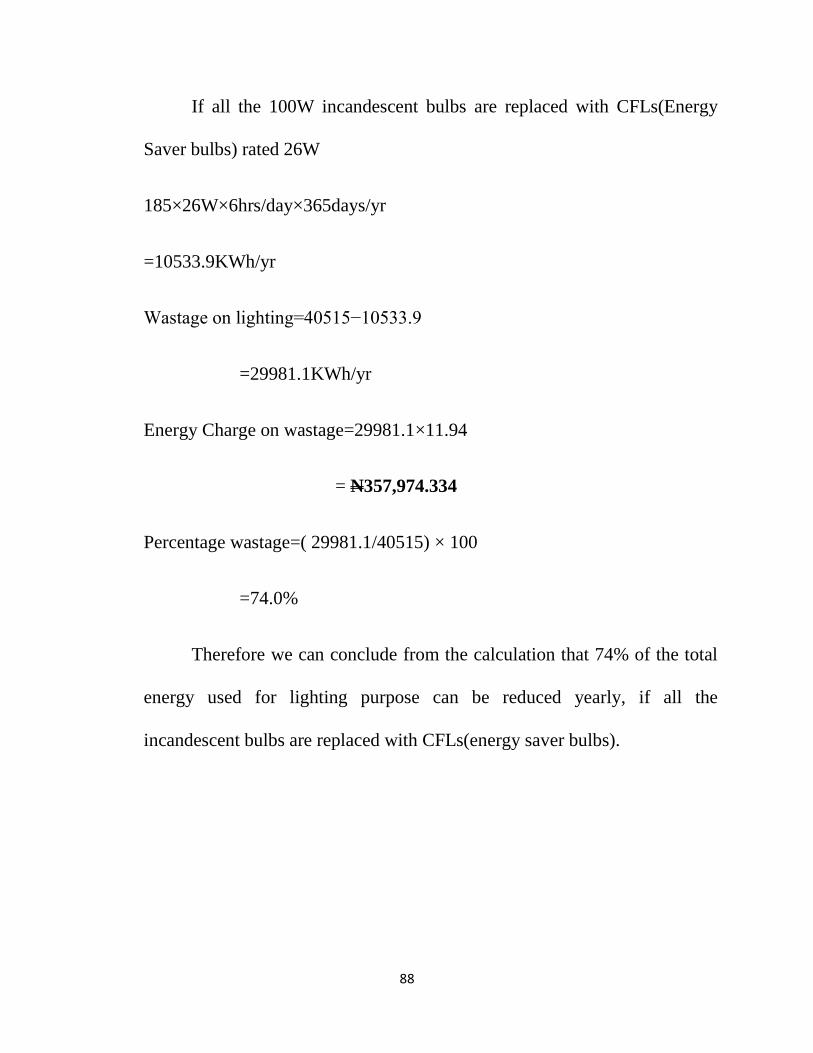
88
If all the 100W incandescent bulbs are replaced with CFLs(Energy
Saver bulbs) rated 26W
185×26W×6hrs/day×365days/yr
=10533.9KWh/yr
Wastage on lighting=40515−10533.9
=29981.1KWh/yr
Energy Charge on wastage=29981.1×11.94
= N357,974.334
Percentage wastage=( 29981.1/40515) × 100
=74.0%
Therefore we can conclude from the calculation that 74% of the total
energy used for lighting purpose can be reduced yearly, if all the
incandescent bulbs are replaced with CFLs(energy saver bulbs).
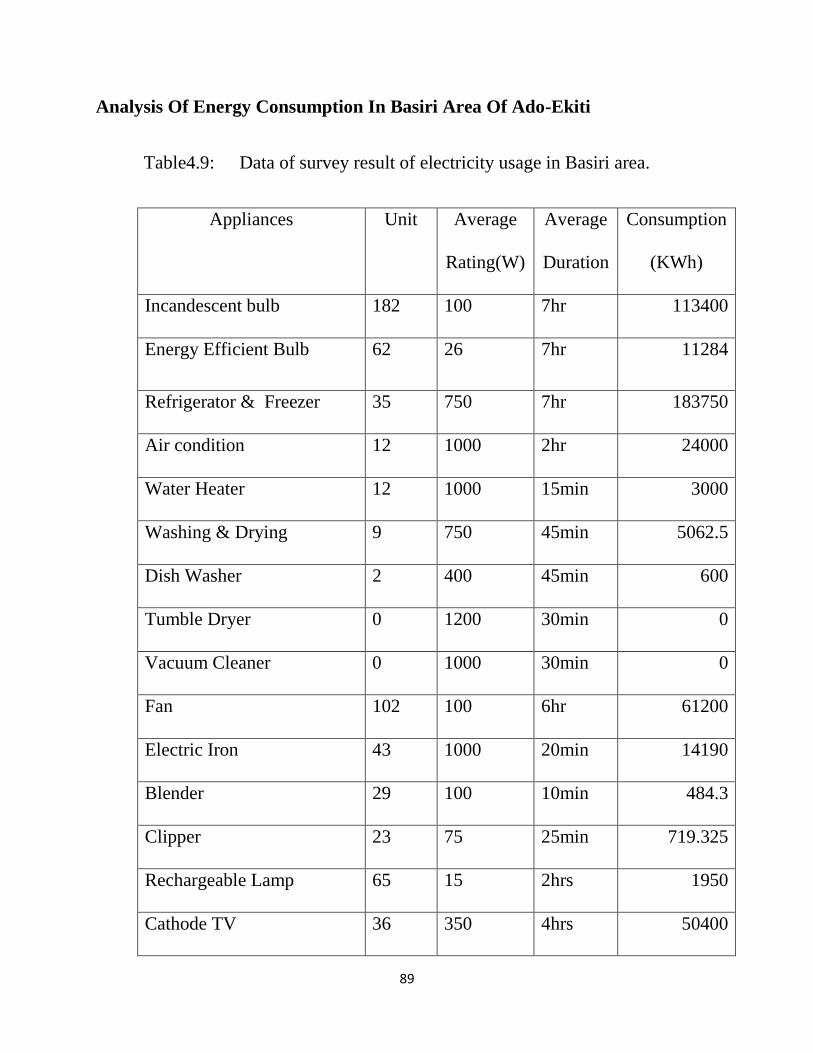
89
Analysis Of Energy Consumption In Basiri Area Of Ado-Ekiti
Table4.9: Data of survey result of electricity usage in Basiri area.
Appliances Unit Average
Rating(W)
Average
Duration
Consumption
(KWh)
Incandescent bulb 182 100 7hr 113400
Energy Efficient Bulb 62 26 7hr 11284
Refrigerator & Freezer 35 750 7hr 183750
Air condition 12 1000 2hr 24000
Water Heater 12 1000 15min 3000
Washing & Drying 9 750 45min 5062.5
Dish Washer 2 400 45min 600
Tumble Dryer 0 1200 30min 0
Vacuum Cleaner 0 1000 30min 0
Fan 102 100 6hr 61200
Electric Iron 43 1000 20min 14190
Blender 29 100 10min 484.3
Clipper 23 75 25min 719.325
Rechargeable Lamp 65 15 2hrs 1950
Cathode TV 36 350 4hrs 50400
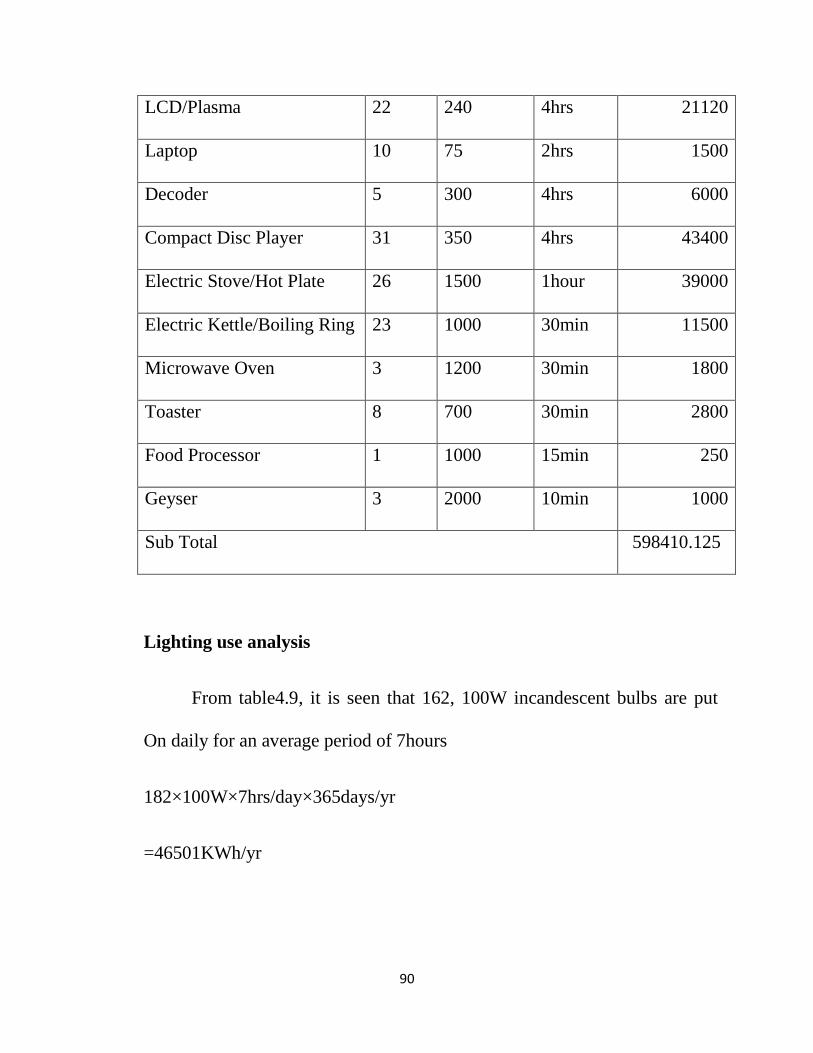
90
LCD/Plasma 22 240 4hrs 21120
Laptop 10 75 2hrs 1500
Decoder 5 300 4hrs 6000
Compact Disc Player 31 350 4hrs 43400
Electric Stove/Hot Plate 26 1500 1hour 39000
Electric Kettle/Boiling Ring 23 1000 30min 11500
Microwave Oven 3 1200 30min 1800
Toaster 8 700 30min 2800
Food Processor 1 1000 15min 250
Geyser 3 2000 10min 1000
Sub Total 598410.125
Lighting use analysis
From table4.9, it is seen that 162, 100W incandescent bulbs are put
On daily for an average period of 7hours
182×100W×7hrs/day×365days/yr
=46501KWh/yr

91
If all the 100W incandescent bulbs are replaced with CFLs(Energy
Saver bulbs) rated 26W
182×26W×7hrs/day×365days/yr
=12090.26KWh/yr
Wastage on lighting=46501−12090.26
=34410.74KWh/yr
Energy Charge on wastage=34410.74×11.94
= N410,864.2356
Percentage wastage=( 34410.74/46501) × 100
=74%
Therefore we can conclude from the calculation that 74% of the total
energy used for lighting purpose can be reduced yearly, if all the
incandescent bulbs are replaced with CFLs(energy saver bulbs).
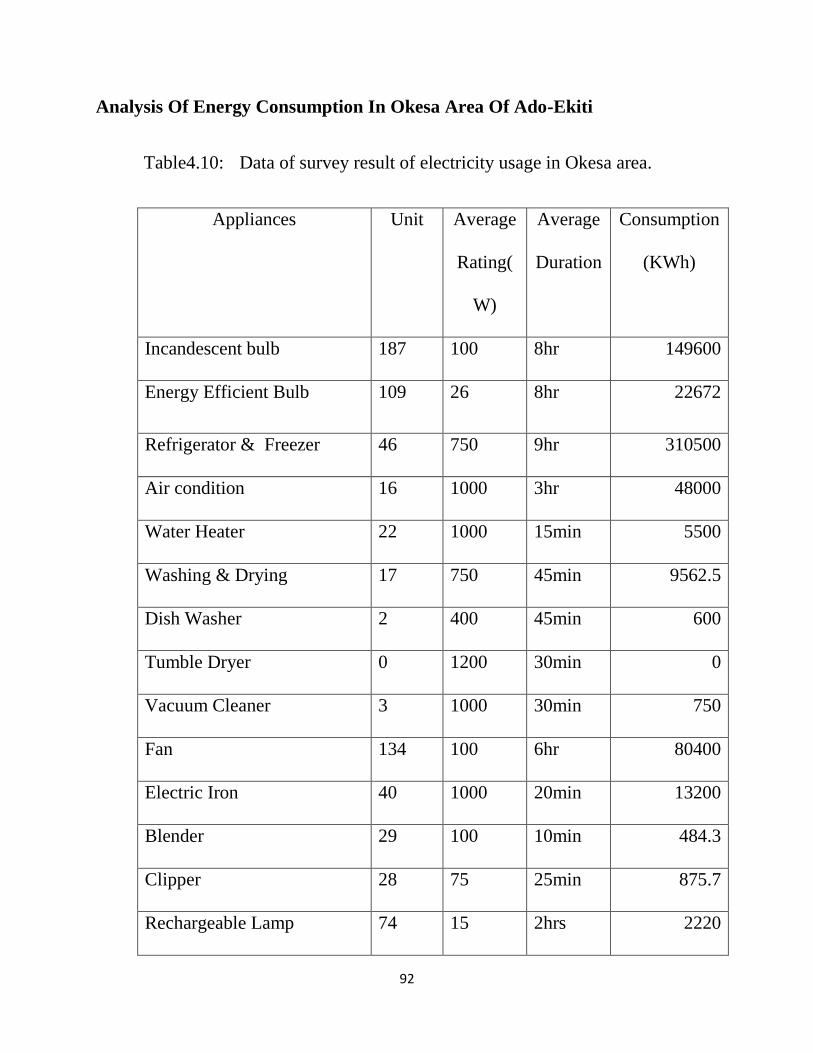
92
Analysis Of Energy Consumption In Okesa Area Of Ado-Ekiti
Table4.10: Data of survey result of electricity usage in Okesa area.
Appliances Unit Average
Rating(
W)
Average
Duration
Consumption
(KWh)
Incandescent bulb 187 100 8hr 149600
Energy Efficient Bulb 109 26 8hr 22672
Refrigerator & Freezer 46 750 9hr 310500
Air condition 16 1000 3hr 48000
Water Heater 22 1000 15min 5500
Washing & Drying 17 750 45min 9562.5
Dish Washer 2 400 45min 600
Tumble Dryer 0 1200 30min 0
Vacuum Cleaner 3 1000 30min 750
Fan 134 100 6hr 80400
Electric Iron 40 1000 20min 13200
Blender 29 100 10min 484.3
Clipper 28 75 25min 875.7
Rechargeable Lamp 74 15 2hrs 2220
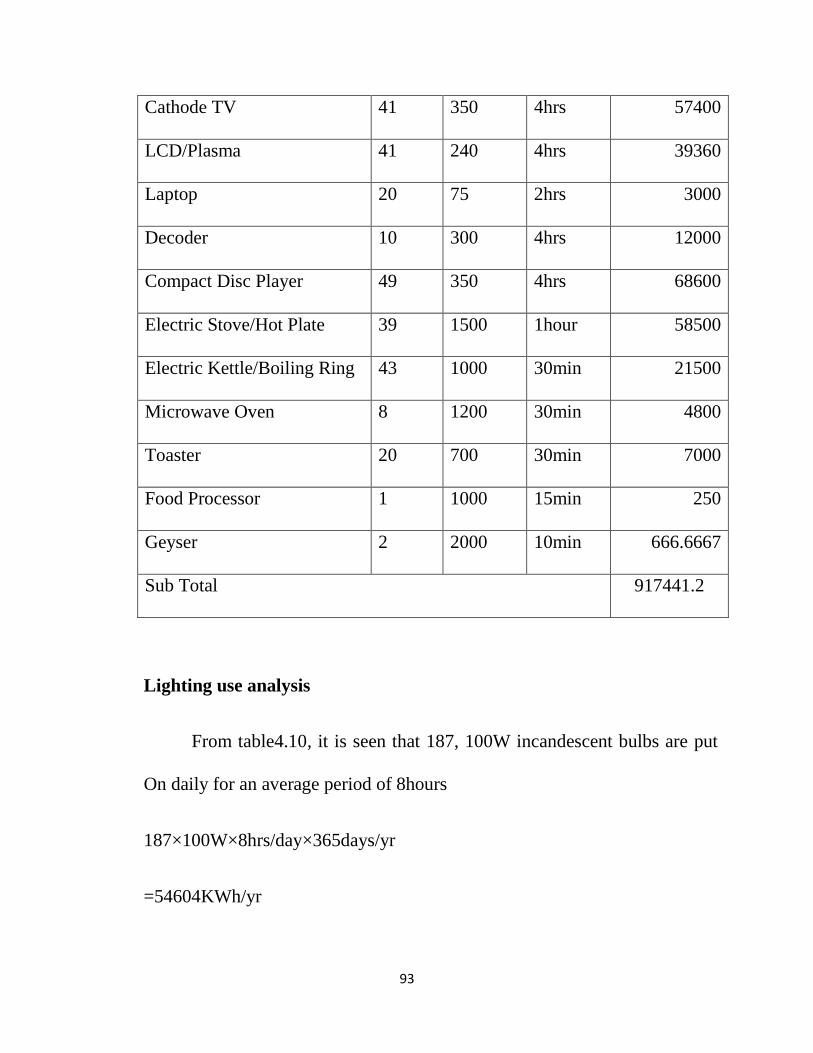
93
Cathode TV 41 350 4hrs 57400
LCD/Plasma 41 240 4hrs 39360
Laptop 20 75 2hrs 3000
Decoder 10 300 4hrs 12000
Compact Disc Player 49 350 4hrs 68600
Electric Stove/Hot Plate 39 1500 1hour 58500
Electric Kettle/Boiling Ring 43 1000 30min 21500
Microwave Oven 8 1200 30min 4800
Toaster 20 700 30min 7000
Food Processor 1 1000 15min 250
Geyser 2 2000 10min 666.6667
Sub Total 917441.2
Lighting use analysis
From table4.10, it is seen that 187, 100W incandescent bulbs are put
On daily for an average period of 8hours
187×100W×8hrs/day×365days/yr
=54604KWh/yr
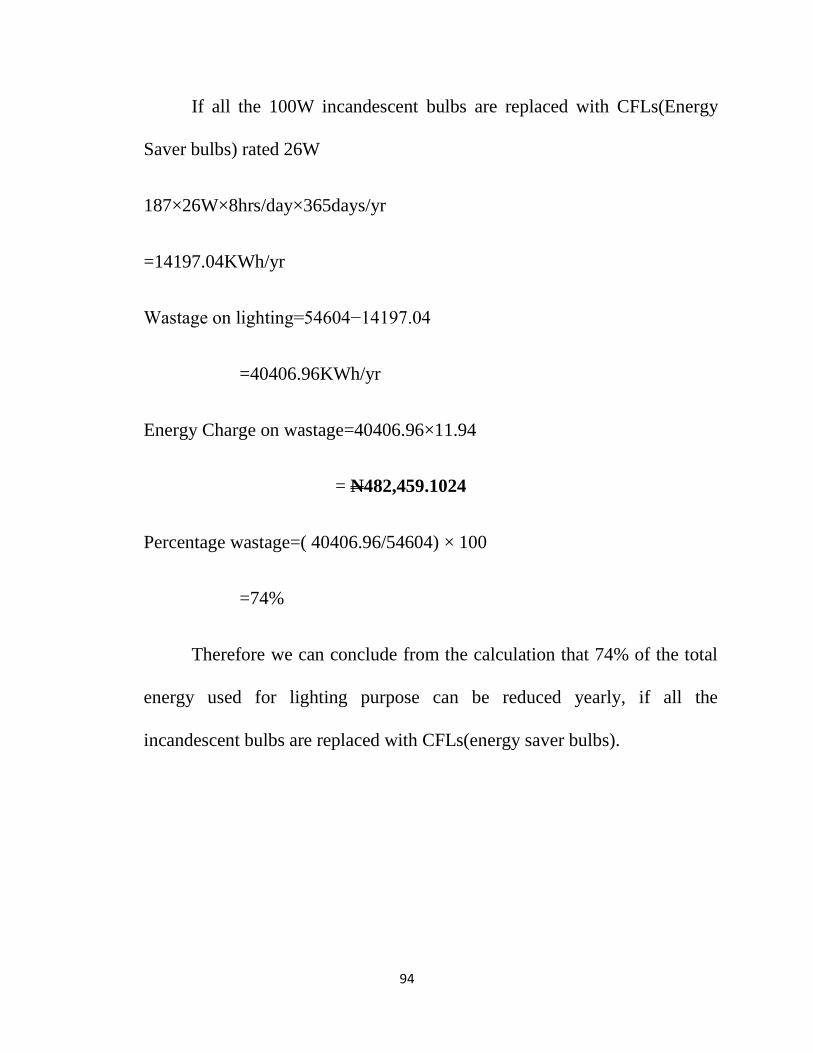
94
If all the 100W incandescent bulbs are replaced with CFLs(Energy
Saver bulbs) rated 26W
187×26W×8hrs/day×365days/yr
=14197.04KWh/yr
Wastage on lighting=54604−14197.04
=40406.96KWh/yr
Energy Charge on wastage=40406.96×11.94
= N482,459.1024
Percentage wastage=( 40406.96/54604) × 100
=74%
Therefore we can conclude from the calculation that 74% of the total
energy used for lighting purpose can be reduced yearly, if all the
incandescent bulbs are replaced with CFLs(energy saver bulbs).
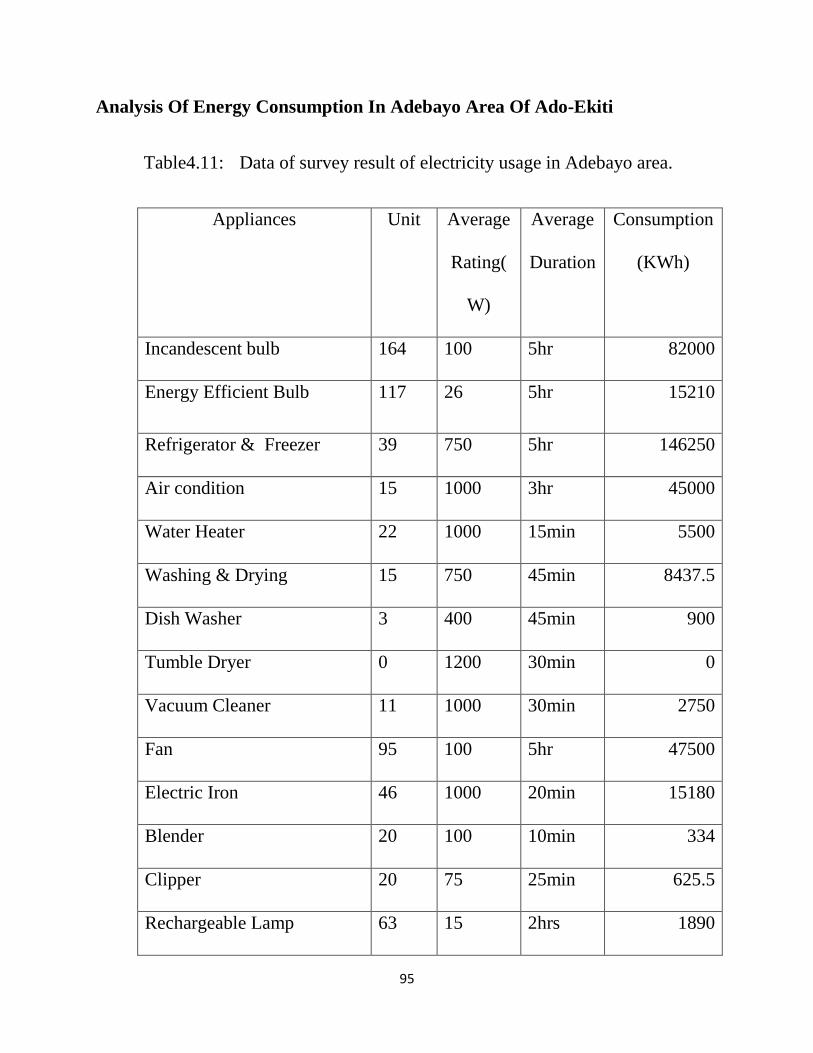
95
Analysis Of Energy Consumption In Adebayo Area Of Ado-Ekiti
Table4.11: Data of survey result of electricity usage in Adebayo area.
Appliances Unit Average
Rating(
W)
Average
Duration
Consumption
(KWh)
Incandescent bulb 164 100 5hr 82000
Energy Efficient Bulb 117 26 5hr 15210
Refrigerator & Freezer 39 750 5hr 146250
Air condition 15 1000 3hr 45000
Water Heater 22 1000 15min 5500
Washing & Drying 15 750 45min 8437.5
Dish Washer 3 400 45min 900
Tumble Dryer 0 1200 30min 0
Vacuum Cleaner 11 1000 30min 2750
Fan 95 100 5hr 47500
Electric Iron 46 1000 20min 15180
Blender 20 100 10min 334
Clipper 20 75 25min 625.5
Rechargeable Lamp 63 15 2hrs 1890

96
Cathode TV 17 350 4hrs 23800
LCD/Plasma 25 240 4hrs 24000
Laptop 16 75 2hrs 2400
Decoder 5 300 4hrs 6000
Compact Disc Player 15 350 4hrs 21000
Electric Stove/Hot Plate 32 1500 1hour 48000
Electric Kettle/Boiling Ring 12 1000 30min 6000
Microwave Oven 5 1200 30min 3000
Toaster 6 700 30min 2100
Food Processor 1 1000 15min 250
Geyser 4 2000 10min 1333.333
Sub Total 509460.3
Lighting use analysis
From table4.11, it is seen that 164, 100W incandescent bulbs are put
On daily for an average period of 8hours
164×100W×5hrs/day×365days/yr
=29930KWh/yr
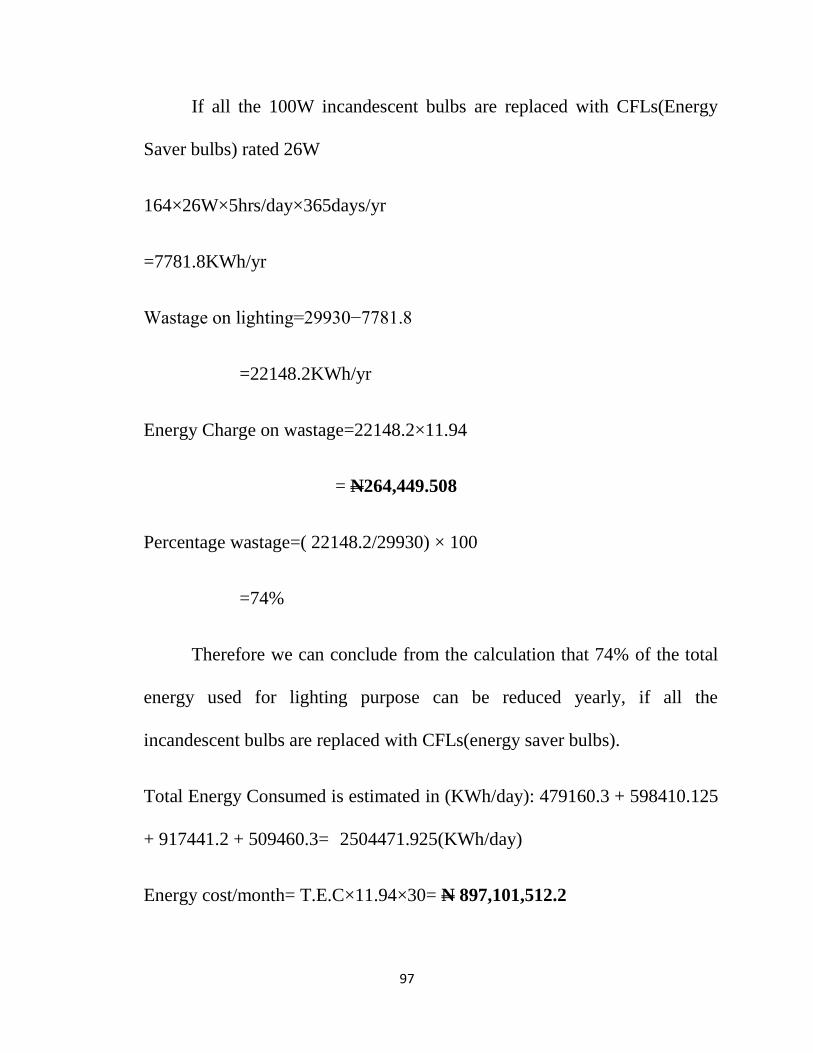
97
If all the 100W incandescent bulbs are replaced with CFLs(Energy
Saver bulbs) rated 26W
164×26W×5hrs/day×365days/yr
=7781.8KWh/yr
Wastage on lighting=29930−7781.8
=22148.2KWh/yr
Energy Charge on wastage=22148.2×11.94
= N264,449.508
Percentage wastage=( 22148.2/29930) × 100
=74%
Therefore we can conclude from the calculation that 74% of the total
energy used for lighting purpose can be reduced yearly, if all the
incandescent bulbs are replaced with CFLs(energy saver bulbs).
Total Energy Consumed is estimated in (KWh/day): 479160.3 + 598410.125
+ 917441.2 + 509460.3= 2504471.925(KWh/day)
Energy cost/month= T.E.C×11.94×30= N 897,101,512.2
98
CHAPTER FIVE
5.0 CONCLUSION AND RECOMMENDATION
5.1 CONCLUSION
From this study, characteristic of electric power usage among the
consumers in their daily life are obtained and analyzed. Some of them know
how to save electrical energy in term of individual behavior. But most of the
respondents do not know the available energy efficient electric appliances in
the market. They only buy the electric appliances if the price is very cheap
without knowing about the efficiency of the appliances. Therefore several
programme about the usage of efficient electric appliances and how to use
electrical appliances efficiently need to be organized and disseminated to the
society. Consequently, society will know and become smart in usage of
electrical energy in their daily life.
A meaningful energy efficiency and conservation program depends on
the determination of end-users to implement recommendations and
opportunities identified by energy audit. Energy audit is not the solution, but
a prelude to effective energy efficiency and conservation programs.
99
5.2 RECOMMENDATION
Base on the discussion and data from the audit report, the following
can be recommended as measures to use energy efficiently:
i Retrofit of inefficient lamps(incandescent) with compact fluorescent lamp
CFLs
ii Awareness on efficient use of energy
iii Energy saving policy should be developed and implemented.
iv Proper billing and efficient metering system(Prepaid-meter) to avoid
estimation of bills.
v Monitoring of the electrical appliances to ensure efficiency;
Refrigerator
Refrigerator is used throughout the year and is considered as the most
expensive item. Therefore, the energy saving potential is high for these
appliances. The lower energy costs of the more efficient, newer refrigerators
can often justify replacement even if existing ones are still in good service.
Recommendation for smart usage:
Keep the condenser coils at the rear of the refrigerator clean. Dust and dirt
on the condenser coils will reduce the working efficiency of the refrigerator.
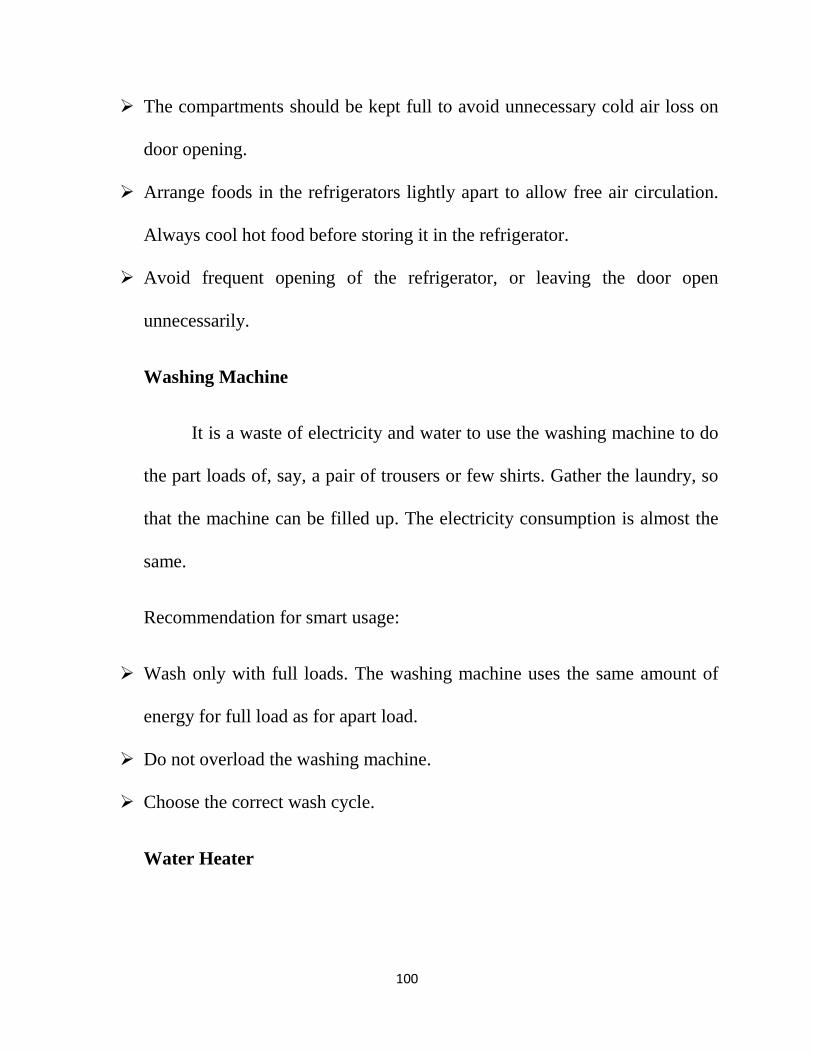
100
The compartments should be kept full to avoid unnecessary cold air loss on
door opening.
Arrange foods in the refrigerators lightly apart to allow free air circulation.
Always cool hot food before storing it in the refrigerator.
Avoid frequent opening of the refrigerator, or leaving the door open
unnecessarily.
Washing Machine
It is a waste of electricity and water to use the washing machine to do
the part loads of, say, a pair of trousers or few shirts. Gather the laundry, so
that the machine can be filled up. The electricity consumption is almost the
same.
Recommendation for smart usage:
Wash only with full loads. The washing machine uses the same amount of
energy for full load as for apart load.
Do not overload the washing machine.
Choose the correct wash cycle.
Water Heater
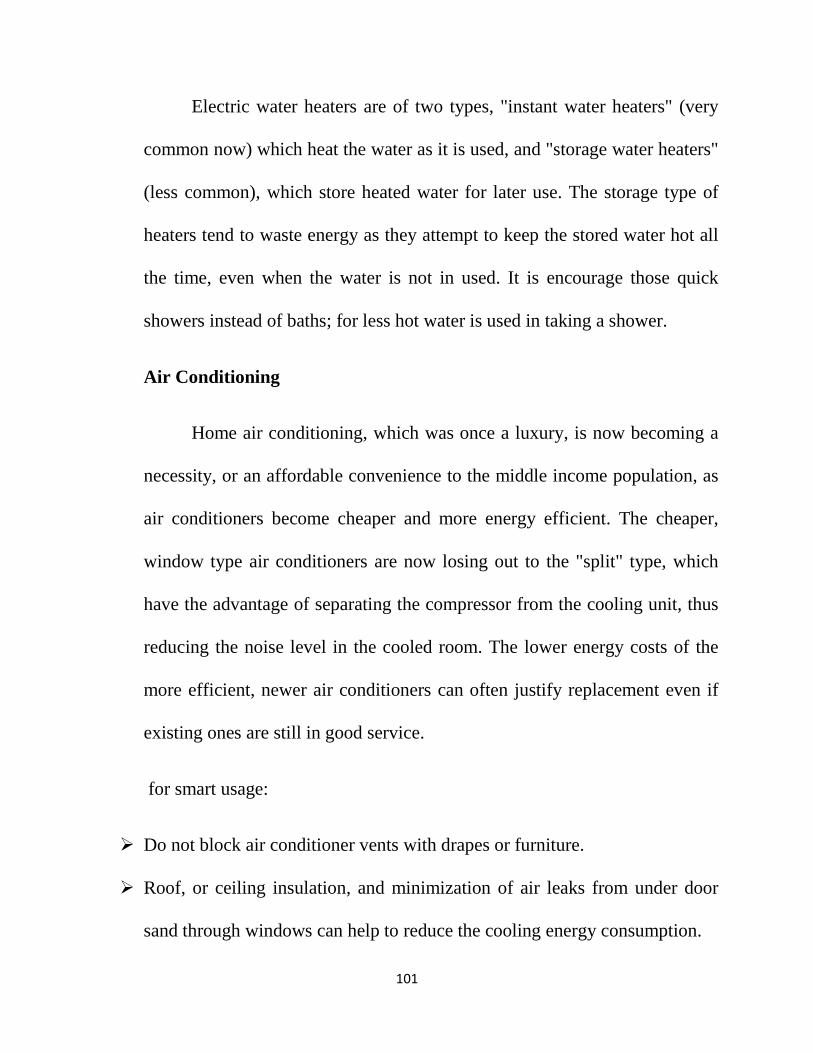
101
Electric water heaters are of two types, "instant water heaters" (very
common now) which heat the water as it is used, and "storage water heaters"
(less common), which store heated water for later use. The storage type of
heaters tend to waste energy as they attempt to keep the stored water hot all
the time, even when the water is not in used. It is encourage those quick
showers instead of baths; for less hot water is used in taking a shower.
Air Conditioning
Home air conditioning, which was once a luxury, is now becoming a
necessity, or an affordable convenience to the middle income population, as
air conditioners become cheaper and more energy efficient. The cheaper,
window type air conditioners are now losing out to the "split" type, which
have the advantage of separating the compressor from the cooling unit, thus
reducing the noise level in the cooled room. The lower energy costs of the
more efficient, newer air conditioners can often justify replacement even if
existing ones are still in good service.
for smart usage:
Do not block air conditioner vents with drapes or furniture.
Roof, or ceiling insulation, and minimization of air leaks from under door
sand through windows can help to reduce the cooling energy consumption.
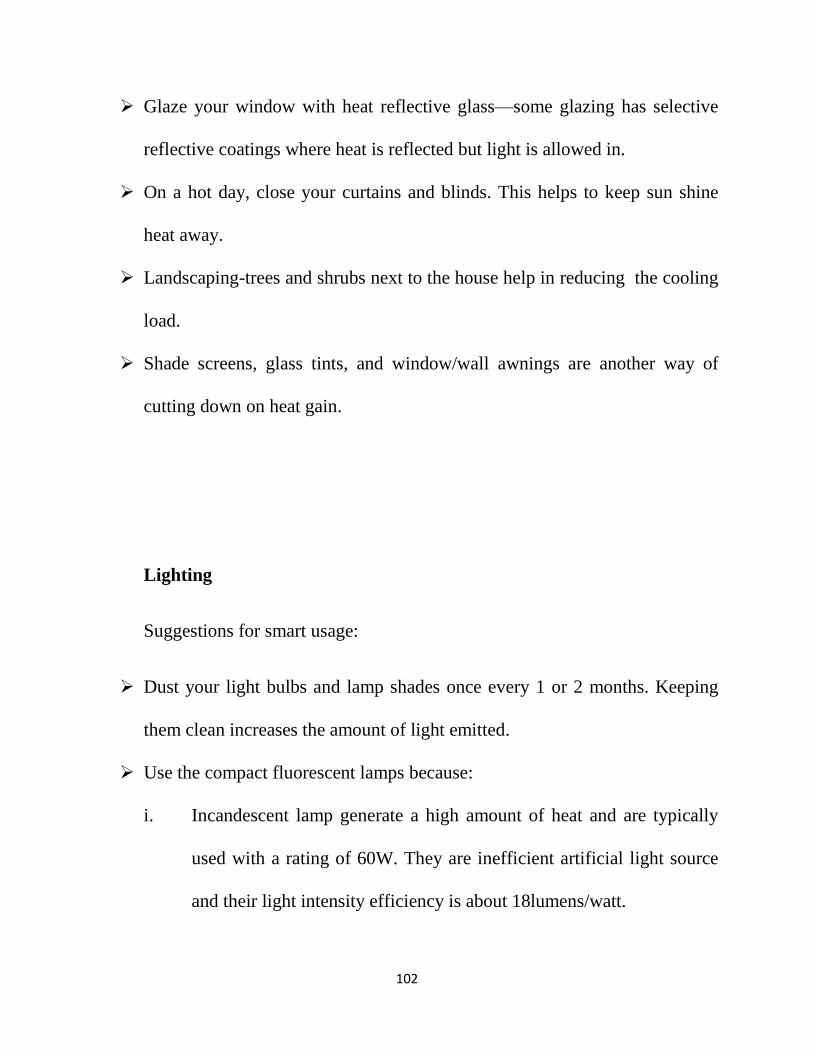
102
Glaze your window with heat reflective glass—some glazing has selective
reflective coatings where heat is reflected but light is allowed in.
On a hot day, close your curtains and blinds. This helps to keep sun shine
heat away.
Landscaping-trees and shrubs next to the house help in reducing the cooling
load.
Shade screens, glass tints, and window/wall awnings are another way of
cutting down on heat gain.
Lighting
Suggestions for smart usage:
Dust your light bulbs and lamp shades once every 1 or 2 months. Keeping
them clean increases the amount of light emitted.
Use the compact fluorescent lamps because:
i. Incandescent lamp generate a high amount of heat and are typically
used with a rating of 60W. They are inefficient artificial light source
and their light intensity efficiency is about 18lumens/watt.
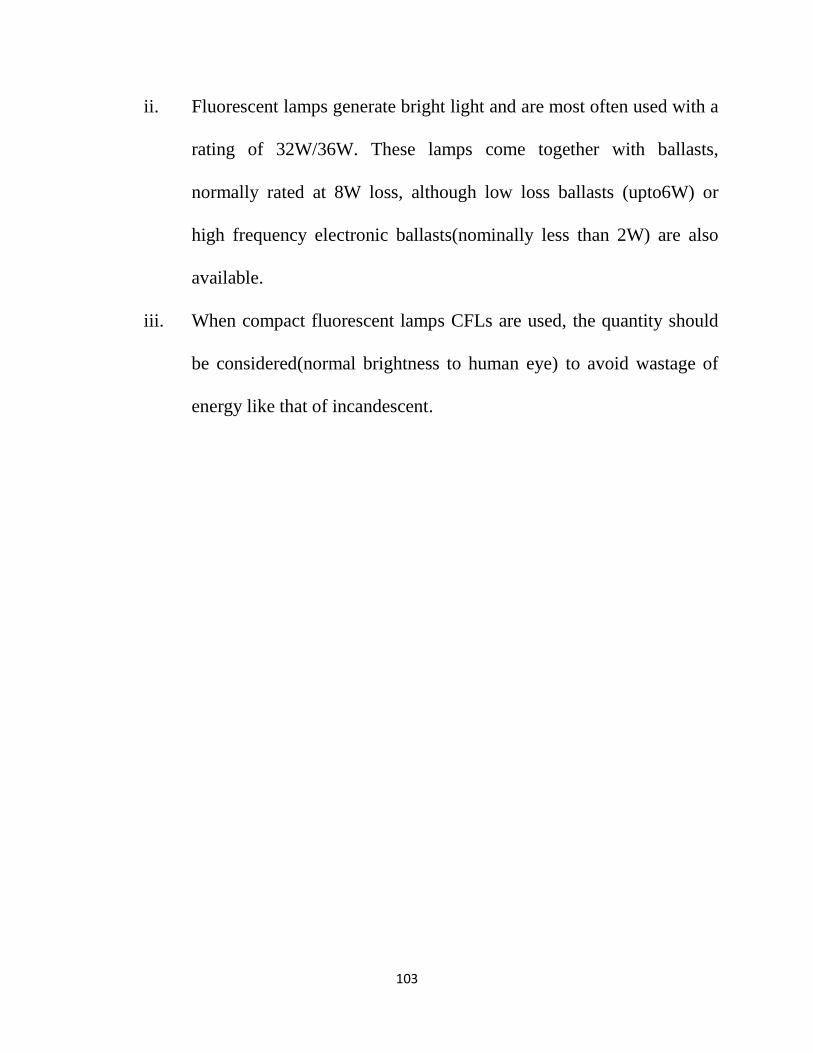
103
ii. Fluorescent lamps generate bright light and are most often used with a
rating of 32W/36W. These lamps come together with ballasts,
normally rated at 8W loss, although low loss ballasts (upto6W) or
high frequency electronic ballasts(nominally less than 2W) are also
available.
iii. When compact fluorescent lamps CFLs are used, the quantity should
be considered(normal brightness to human eye) to avoid wastage of
energy like that of incandescent.
104
RREEFFEERREENNCCEESS
Akinsanya O.A (2013):“Assessment of Coping Strategies for Residential
Electrical Energy Usage in Ekiti State” International Journal of Scientific &
Engineering Research, Volume 4, Issue 11, November-2013. ISSN 2229-
5518.
Lebot, B. (2009). Energy Efficiency and Market Transformation: A
Short Overview of Best Practices. A paper presented during the
Inception Workshop of the UNDP-GEF Project to Promote Energy
Efficiency in Residential and Public Building in Nigeria, 14th July 2009.
Harrington L. and Damnics M. (2004). Energy Labeling and Standards
Programme Throughout the World. A publication of the National
Appliance and Equipment Energy Efficiency Committee, Australia.
NAEEEC Report 2004/04.
ECN-UNDP (2005). Federal Republic of Nigeria Renewable Energy Master
Plan. Published by the Energy Commission of Nigeria and the United
Nations Development Programme
Punch News Paper, (November 23rd 2013).
Asmarashid Ponniran(2007). A study on electric energy usage at the
residential area. 1st Engineering Conference on Energy & Environment
December 27-28, 2007, Kuching, Sarawak, Malaysia ENCQN2007-038.

105
Wikipedia contributors, "Energy audit, Evaluation and Ado-Ekiti "
Wikipedia, The Free Encyclopedia, (accessed August 15, 2013).
Extract of relevant document from the customer service and marketing
sections, Ado Business District, BEDC.
Extract of relevant information from PHCN dispatch office and 11KV
control room, Ado-Ekiti.
Extract of relevant information from 132/33KV substation, Ado-Ekiti.


![SUNDAY OLUSANYA OLATUNJI [Aadam] (B.Sc., …...Nigeria Ondo State University, Ado-Ekiti (Now University of Ado-Ekiti), Nigeria PhD, Master or Fellowship Research Title: (Academic Honors](https://img.pdfslide.us/doc/110x75/5e731eab15bd2a6e85668038/sunday-olusanya-olatunji-aadam-bsc-nigeria-ondo-state-university-ado-ekiti.jpg)