Embed Size (px)
Citation preview
Report No. K-TRAN: KSU-08-2 FINAL REPORT
Joseph R. Holste Robert J. Peterman, Ph.D., P.E.
Asad Esmaeily, Ph.D., P.E. Kansas State University Transportation Center
July 2011
A COOPERATIVE TRANSPORTATION RESEARCH PROGRAM BETWEEN: KANSAS DEPARTMENT OF TRANSPORTATION KANSAS STATE UNIVERSITY TRANSPORTATION CENTER THE UNIVERSITY OF KANSAS
EVALUATING THE TIME-DEPENDENT AND BOND CHARACTERISTICS OF LIGHTWEIGHT
CONCRETE MIXES FOR KANSAS PRESTRESSED CONCRETE BRIDGES

1 Report No. K-TRAN: KSU-08-2
2 Government Accession No.
3 Recipient Catalog No.
4 Title and Subtitle EVALUATING THE TIME-DEPENDENT AND BOND CHARACTERISTCS OF LIGHTWEIGHT CONCRETE MIXES FOR KANSAS PRESTRESSED CONCRETE BRIDGES
5 Report Date July 2011
6 Performing Organization Code
7 Author(s) Joseph R. Holste, Robert J. Peterman, Ph.D. P.E., and Asad Esmaeily, Ph.D., P.E.
8 Performing Organization Report No.
9 Performing Organization Name and Address Kansas State University Transportation Center Department of Civil Engineering 2118 Fiedler Hall Manhattan, KS 66506
10 Work Unit No. (TRAIS)
11 Contract or Grant No. C1797
12 Sponsoring Agency Name and Address Kansas Department of Transportation Bureau of Materials and Research 700 SW Harrison Street Topeka, Kansas 66603-3745
13 Type of Report and Period Covered Final Report September 2008 – May 2011
14 Sponsoring Agency Code RE-0461-01
15 Supplementary Notes For more information write to address in block 9. Project Title: Experimental Validation of Post-Tensioning Procedure for Improved Durability and Increased Span-To-Depth Ratio of the Inverted-T Bridge System
16 Abstract
This report details results from testing that was conducted to determine the bond and time-dependent characteristics of two lightweight concrete mixes. The lightweight mixes were evaluated to possibly provide a more cost-effective solution to replacing some of Kansas’ older bridges. Testing included use of a conventional lightweight mix and a self-consolidating lightweight mix. Sixteen Inverted T-beams were cast at a prestress plant to determine prestress losses that had occurred in the two lightweight mixes. These losses were compared to ACI, PCI, and AASHTO code equations. Creep and shrinkage prisms were also cast and measured to accurately determine creep and shrinkage variables for the two lightweight mixes. Twelve flexural beams were cast at the prestress plant and tested at Kansas State University’s Civil Engineering Structural Mechanics Laboratory to experimentally evaluate the development lengths of the lightweight mixes and to compare results with the ACI code equations.
This study found the compressive strengths of the plant-cast lightweight concrete mixes varied greatly from similar mixes in laboratory testing. Low concrete strengths caused the prestress losses to be greater than the predicted code values. Flexural beam testing revealed that several of the pretensioned beams failed suddenly due to strand slip, even though this was not the predicted failure mode.
17 Key Words Bridges, Creep, Lightweight Concrete, Mix Design, Shrinkage, and Structures
18 Distribution Statement No restrictions. This document is available to the public through the National Technical Information Service, Springfield, Virginia 22161
19 Security Classification (of this report)
Unclassified
20 Security Classification (of this page) Unclassified
21 No. of pages 130
22 Price
Form DOT F 1700.7 (8-72)


EVALUATING THE TIME-DEPENDENT AND
BOND CHARACTERISTICS OF LIGHTWEIGHT
CONCRETE MIXES FOR KANSAS PRESTRESSED
CONCRETE BRIDGES
Final Report
Prepared by
Joseph R. Holste Robert J. Peterman, Ph.D., P.E.
Asad Esmaeily, Ph.D., P.E.
A Report on Research Sponsored By
THE KANSAS DEPARTMENT OF TRANSPORTATION TOPEKA, KANSAS
and
KANSAS STATE UNIVERSITY TRANSPORTATION CENTER
MANHATTAN, KANSAS
July 2011
© Copyright 2011, Kansas Department of Transportation

ii
PREFACE The Kansas Department of Transportation’s (KDOT) Kansas Transportation Research and New-Developments (K-TRAN) Research Program funded this research project. It is an ongoing, cooperative and comprehensive research program addressing transportation needs of the state of Kansas utilizing academic and research resources from KDOT, Kansas State University and the University of Kansas. Transportation professionals in KDOT and the universities jointly develop the projects included in the research program.
NOTICE The authors and the state of Kansas do not endorse products or manufacturers. Trade and manufacturers names appear herein solely because they are considered essential to the object of this report. This information is available in alternative accessible formats. To obtain an alternative format, contact the Office of Transportation Information, Kansas Department of Transportation, 700 SW Harrison, Topeka, Kansas 66603-3745 or phone (785) 296-3585 (Voice) (TDD).
DISCLAIMER The contents of this report reflect the views of the authors who are responsible for the facts and accuracy of the data presented herein. The contents do not necessarily reflect the views or the policies of the state of Kansas. This report does not constitute a standard, specification or regulation.

iii
ACKNOWLEDGEMENTS
The authors would like to thank the Kansas Department of Transportation for funding
this project. In particular Stephen Burnett, Bridge Design Engineer, and David Meggers,
Research Development Engineer, both with KDOT, were helpful in the design and completion of
the project.
The authors would also like to thank Tom Bergquist and the employees of Prestressed
Concrete Inc., Newton, Kansas. They were always very helpful in coordinating and performing
the test specimen fabrication and were willing to work around the authors’ schedules.

iv
ABSTRACT
This report details results from testing that was conducted to determine the bond and
time-dependent characteristics of two lightweight concrete mixes. The lightweight mixes were
evaluated to possibly provide a more cost-effective solution to replacing some of Kansas’ older
bridges. Testing included use of a conventional lightweight mix and a self-consolidating
lightweight mix. Sixteen Inverted T-beams were cast at a prestress plant to determine prestress
losses that had occurred in the two lightweight mixes. These losses were compared to ACI, PCI,
and AASHTO code equations. Creep and shrinkage prisms were also cast and measured to
accurately determine creep and shrinkage variables for the two lightweight mixes. Twelve
flexural beams were cast at the prestress plant and tested at Kansas State University’s Civil
Engineering Structural Mechanics Laboratory to experimentally evaluate the development
lengths of the lightweight mixes and to compare results with the ACI code equations.
This study found the compressive strengths of the plant-cast lightweight concrete mixes
varied greatly from similar mixes in laboratory testing. Low concrete strengths caused the
prestress losses to be greater than the predicted code values. Flexural beam testing revealed that
several of the pretensioned beams failed suddenly due to strand slip, even though this was not the
predicted failure mode.

v
TABLE OF CONTENTS
ACKNOWLEDGEMENTS ........................................................................................................... iii
LIST OF FIGURES ...................................................................................................................... vii
LIST OF TABLES ......................................................................................................................... xi
CHAPTER 1 - Introduction ............................................................................................................ 1
1.1 Background ..................................................................................................................... 1
1.2 Objectives ....................................................................................................................... 2
1.2.1 Inverted Tee Beams ................................................................................................ 2
1.2.2 Creep and Shrinkage ............................................................................................... 2
1.2.3 Development Length of Flexure Beams ................................................................. 3
1.3 Scope ............................................................................................................................... 3
CHAPTER 2 - Literature Review ................................................................................................... 4
CHAPTER 3 - IT Design and Fabrication .................................................................................... 16
3.1 IT Design ............................................................................................................................ 16
3.2 IT Fabrication ..................................................................................................................... 18
3.3 Mix Properties ..................................................................................................................... 24
3.4 Additional Mix Testing ....................................................................................................... 28
CHAPTER 4 - IT Results ............................................................................................................. 29
4.1 Transfer Length Results ................................................................................................ 29
4.2 Prestress Loss Results ................................................................................................... 33
CHAPTER 5 - Creep and Shrinkage Prisms................................................................................. 40
5.1 Creep ............................................................................................................................. 40
5.2 Shrinkage ...................................................................................................................... 43
CHAPTER 6 - Creep and Shrinkage Results ................................................................................ 45
6.1 Creep Results ................................................................................................................ 45
6.2 Shrinkage Results ......................................................................................................... 49
6.3 Summary of Creep and Shrinkage Findings ................................................................. 54
6.4 ACI 209 Prestress Loss Summary ................................................................................ 54
CHAPTER 7 - Flexure Beam Design and Fabrication ................................................................. 56
7.1 Rectangular Section Design .......................................................................................... 56
7.2 T-Beam Section Design ................................................................................................ 57

vi
7.3 Flexure Beam Fabrication ............................................................................................. 58
CHAPTER 8 - Flexure Beam Testing and Results ....................................................................... 65
8.1 Flexure Beam Test Setup .............................................................................................. 65
8.1.1 100% Ld Test Setup ..................................................................................................... 66
8.1.2 80% Ld Test Setup ....................................................................................................... 66
8.1.3 T-Beam Test Setup ...................................................................................................... 66
8.2 100% Ld Beam Test Results ......................................................................................... 67
8.3 80% Ld Test Results ...................................................................................................... 72
8.4 T-Beam Test Results ..................................................................................................... 78
CHAPTER 9 - Conclusions and Recommendations ..................................................................... 85
9.1 Conclusions ................................................................................................................... 85
9.2 Recommendations & Areas of Further Investigation Before Implementation ............. 86
REFERENCES ............................................................................................................................. 87
Appendix A - Supplementary Table, Figures, and Calculations .................................................. 92
A.1 IT Beams’ Transfer Length Graphs .............................................................................. 93
A.2 IT Beams’ VWSG Graphs ............................................................................................ 95
A.3 Prestress Loss Equations ............................................................................................... 99
A.4 Prestress Loss Calculations for IT Beams .................................................................. 101
A.5 Creep Coefficient Graphs ........................................................................................... 104
A.6 Shrinkage Prism Graphs ............................................................................................. 106
A.7 ACI 209 Prestress Loss Equations and Calculations .................................................. 107
A.8 Shear Calculations for Single-Strand Flexure Beams ................................................. 110
A.9 Nominal Moment Calculations for Single-Strand Flexure Beams ............................. 111
A.10 Prestress Loss Calculations for Flexural Beams ..................................................... 111
A.11 Nominal Moment Calculations for T-Beam Specimens ......................................... 115

vii
LIST OF FIGURES
Figure 3.1 Cross Section of IT 600 ............................................................................................... 17
Figure 3.2 Tensioned Beams’ Forms ............................................................................................ 18
Figure 3.3 Untensioned Beams’ Forms ........................................................................................ 19
Figure 3.4 SCC Beam being Poured ............................................................................................. 19
Figure 3.5 Whittemore Points Attached to IT Forms ................................................................... 20
Figure 3.6 Steel Bar Attached to Whittemore Points .................................................................... 21
Figure 3.7 Whittemore Points Cast into ITs ................................................................................. 22
Figure 3.8 VWSG Mounted to Top Strands ................................................................................. 23
Figure 3.9 Location of VWSGs in Beam ...................................................................................... 24
Figure 3.10 Performing J-ring and L-box Tests............................................................................ 25
Figure 3.11 Workers Simultaneously Flame-Cutting the Prestress Strand ................................... 27
Figure 3.12 SCC IT Beams at KSU .............................................................................................. 28
Figure 4.1 Whittemore Strain Gage .............................................................................................. 29
Figure 4.2 First Set CT #1 Transfer Length .................................................................................. 31
Figure 4.3 First Set ST #1 Transfer Length .................................................................................. 31
Figure 4.4 Second Set CT #1 Transfer Length ............................................................................. 32
Figure 4.5 Second Set ST #1 Transfer Length .............................................................................. 32
Figure 4.6 First Set CT #1 Strains (Due to Creep, Shrinkage, and Elastic Shortening Losses) ... 34
Figure 4.7 First Set ST#1 Strains (Due to Creep, Shrinkage, and Elastic Shortening Losses) ..... 34
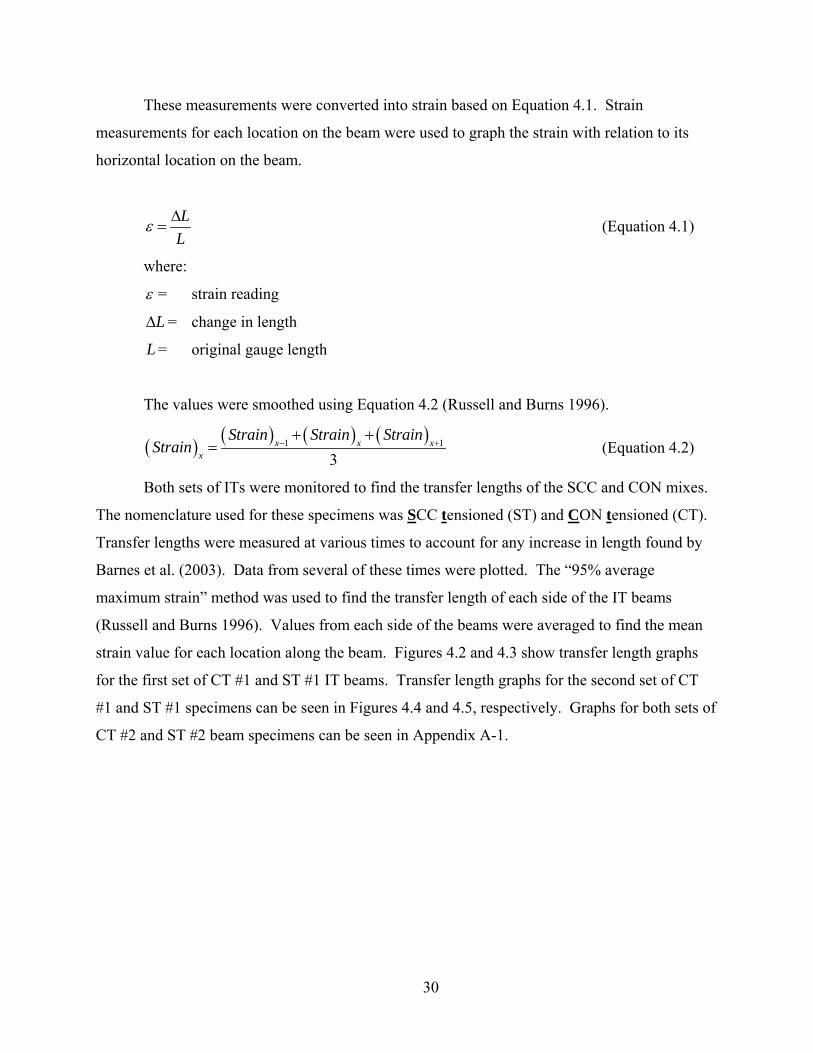
Figure 4.8 Second Set CT #1 Strains (Due to Creep, Shrinkage, and Elastic Shortening Losses)35
Figure 4.9 Second Set ST #1 Strains (Due to Creep, Shrinkage, and Elastic Shortening Losses) 35
Figure 4.10 First Set CUT #1 Concrete Strains (Change Due to Shrinkage Losses) ................... 36
Figure 4.11 First Set SUT #1 Concrete Strains (Change Due to Shrinkage Losses) .................... 36
Figure 4.12 Second Set CUT #1 Concrete Strains (Change Due to Shrinkage Losses) ............... 37
Figure 4.13 Second Set SUT #1 Concrete Strains (Change Due to Shrinkage Losses) ............... 37
Figure 5.1 Sulfur-Capping Creep and Shrinkage Prisms .............................................................. 41
Figure 5.2 Creep Prism in Load Frame ......................................................................................... 42
Figure 5.3 Casting of Creep and Shrinkage Prisms ...................................................................... 43
Figure 5.4 Second Set of Creep and Shrinkage Prisms in Environmental Chamber .................... 44

viii
Figure 6.1 Creep Coefficient of First Set CON #1 ....................................................................... 46
Figure 6.2 Creep Coefficient of First Set SCC #1 ........................................................................ 46
Figure 6.3 Creep Coefficient of Second Set Transfer Day CON #1 ............................................. 47
Figure 6.4 Creep Coefficient of Second Set Transfer Day SCC #1 .............................................. 47
Figure 6.5 Creep Coefficient of Second Set 28-day CON #1 ....................................................... 48
Figure 6.6 Creep Coefficient of Second Set 28-day SCC #1 ........................................................ 48
Figure 6.7 Summary of Creep Ratios ........................................................................................... 49
Figure 6.8 Shrinkage Strains for First Set CON #1 Specimen ..................................................... 50
Figure 6.9 Shrinkage Strains for First Set SCC #1 Specimen ...................................................... 51
Figure 6.10 Shrinkage Strains for Second Set Transfer Day CON #1 Specimen ......................... 51
Figure 6.11 Shrinkage Strains for Second Set Transfer Day SCC #1 Specimen .......................... 52
Figure 6.12 Shrinkage Strains for Second Set 28-day CON #1 Specimen ................................... 52
Figure 6.13 Shrinkage Strains for Second Set 28-day SCC #1..................................................... 53
Figure 6.14 Summary of Shrinkage Strains .................................................................................. 53
Figure 7.1 Rectangular Beam Cross Section ................................................................................ 57
Figure 7.2 T-beam Cross Section .................................................................................................. 58
Figure 7.3 Crack Formers in Rectangular Beams’ Form .............................................................. 59
Figure 7.4 T-beams’ Form with Reinforcement ........................................................................... 59
Figure 7.5 Rectangular Beams’ Forms ......................................................................................... 60
Figure 7.6 Casting of the T-beam Specimens ............................................................................... 61
Figure 7.7 Casting of T-beam Specimen ...................................................................................... 61
Figure 7.8 Casting of Rectangular Beam ...................................................................................... 62
Figure 7.9 Finished T-beam Specimens ........................................................................................ 63
Figure 7.10 Finished Rectangular Beams ..................................................................................... 64
Figure 8.1 Loading Conditions for 80% Ld Beams....................................................................... 65
Figure 8.2 Loading Conditions for 100% Ld Beams .................................................................... 66
Figure 8.3 Loading Conditions for T-beams................................................................................. 66
Figure 8.4 Moment versus Deflection for CON #1 100% Ld Specimen ...................................... 68
Figure 8.5 Failure of CON #1 100% Ld Specimen ....................................................................... 68
Figure 8.6 Moment versus Deflection for CON #2 100% Ld Specimen ...................................... 69
Figure 8.7 Failure of CON #2 100% Ld Specimen ....................................................................... 69

ix
Figure 8.8 Moment versus Deflection for SCC #1 100% Ld Specimen ....................................... 70
Figure 8.9 Failure of SCC #1 100% Ld Specimen ........................................................................ 70
Figure 8.10 Moment versus Deflection for SCC #2 100% Ld Specimen ..................................... 71
Figure 8.11 Failure of SCC #2 100% Ld Specimen ...................................................................... 71
Figure 8.12 Summary of 100% Ld Specimens’ Moment versus Deflection ................................. 72
Figure 8.13 Moment versus Deflection for CON #1 80% Ld Specimen ...................................... 74
Figure 8.14 Failure of CON #1 80% Ld Specimen ....................................................................... 74
Figure 8.15 Moment versus Deflection for CON #2 80% Ld Specimen ...................................... 75
Figure 8.16 Failure of CON #2 80% Ld Specimen ....................................................................... 75
Figure 8.17 Moment versus Deflection for SCC #1 80% Ld Specimen ....................................... 76
Figure 8.18 Failure of SCC #1 80% Ld Specimen ........................................................................ 76
Figure 8.19 Moment versus Deflection for SCC #2 80% Ld Specimen ....................................... 77
Figure 8.20 Failure of SCC #2 80% Ld Specimen ........................................................................ 77
Figure 8.21 Summary of 80% Ld Specimens’ Moment versus Deflection .................................. 78
Figure 8.22 Moment versus Deflection for CON #1 T-beam Specimen ...................................... 79
Figure 8.23 Failure of CON #1 T-beam Specimen ....................................................................... 79
Figure 8.24 Moment versus Deflection for CON #2 T-beam Specimen ...................................... 80
Figure 8.25 Failure of CON #2 T-beam Specimen ....................................................................... 80
Figure 8.26 Moment versus Deflection for SCC #1 T-beam Specimen ....................................... 81
Figure 8.27 Failure of SCC #1 T-beam Specimen ........................................................................ 81
Figure 8.28 Moment versus Deflection for SCC #2 T-beam Specimen ....................................... 82
Figure 8.29 Failure of SCC #2 T-beam Specimen ........................................................................ 82
Figure 8.30 Summary of T-beam Specimens' Moment versus Deflection ................................... 83
Figure 8.31 Discoloration of T-Beam ends................................................................................... 84
Figure 8.32 T-beam End after Bond Failure ................................................................................. 84
Figure A.1 Transfer Length for First Set ST #2 ............................................................................ 93
Figure A.2 Transfer length of Second Set CT #2 ......................................................................... 94
Figure A.3 Transfer Length of Second Set ST #2 ........................................................................ 94
Figure A.4 VWSG for First Set CT #2 (Creep, Shrinkage, and Elastic Shortening Losses) ........ 95
Figure A.5 VWSG for First Set ST #2 (Creep, Shrinkage, and Elastic Shortening Losses) ........ 95
Figure A.6 VWSG for First Set CUT #2 (Change Due to Shrinkage Losses) .............................. 96

x
Figure A.7 VWSG for First Set SUT #2 (Change Due to Shrinkage Losses) .............................. 96
Figure A.8 VWSG for Second Set CT #2 (Creep, Shrinkage, and Elastic Shortening ................ 97
Figure A.9 VWSG for Second Set ST #2 (Creep, Shrinkage, and Elastic Shortening Losses) .... 97
Figure A.10 VWSG for Second Set CUT #2 (Change Due to Shrinkage Losses) ....................... 98
Figure A.11 VWSG for Second Set SUT #2 (Change Due to Shrinkage Losses) ........................ 98
Figure A.12 First Set SCC #2 Creep Ratio ................................................................................. 104
Figure A.13 Second Set SCC #2 Creep Ratio for Transfer Day ................................................. 105
Figure A.14 Second Set SCC #2 Creep Ratio for 28-day ........................................................... 105
Figure A.15 First Set SCC #2 Shrinkage Strains ........................................................................ 106
Figure A.16 Second Set SCC #2 Shrinkage Strains for Transfer Day ........................................ 106
Figure A.17 Second Set SCC #2 Shrinkage Strains for 28-day .................................................. 107

xi
LIST OF TABLES
Table 3.1 Design Assumptions of IT 600 ..................................................................................... 18
Table 3.2 Buildex Aggregate Properties ....................................................................................... 25
Table 3.3 Mix Designs of ITs ....................................................................................................... 26
Table 3.4 Pour Properties of Both Sets of ITs .............................................................................. 26
Table 3.5 Additional Trial Mix Results ........................................................................................ 28
Table 4.1 Summary of IT Transfer Lengths ................................................................................. 33
Table 4.2 Experimental Prestress Losses vs. Code Losses ........................................................... 38
Table 4.3 Effective Prestress by Day for First Set of ITs ............................................................. 39
Table 4.4 Effective Prestress by Day for Second Set of ITs ......................................................... 39
Table 6.1 Summary of Creep Parameters ..................................................................................... 49
Table 6.2 Summary of Shrinkage Parameters ............................................................................... 54
Table 6.3 Summary of Average Experimental Creep and Shrinkage Parameters ........................ 54
Table 6.4 Comparison between ACI 209 Prestress Losses vs. Experimental Losses ................... 55
Table 7.1 Mix Proportions of Flexure Beams ............................................................................... 62
Table 7.2 Batch Properties of Flexure Beams .............................................................................. 63
Table 7.3 Summary of Specimens Cast with each mix ................................................................ 63
Table 8.1 Summary of Flexure Beam Breaks ............................................................................... 73

1
CHAPTER 1 - Introduction
1.1 Background
The majority of the bridges in Kansas are in rural areas. Many of these are becoming
structurally deficient, and are in need of replacement. Due to the location of these bridges, cost
of transporting prestressed girders to these areas often makes use of cast-in-place bridges more
economical. Use of lightweight aggregate in these bridge girders would reduce the total weight
and could allow multiple girders to be shipped on one semi-truck. This would reduce
transportation costs and allow the more economical prestressed girders to be used in rural areas.
Lightweight prestressed girders could be put in place using a lower capacity crane due to the
lower self-weight of the beam. The construction process would be quicker without the need of
form work associated with cast-in-place girders. The lighter self-weight would also increase
allowable live loads the bridges would be able to carry.
The Kansas Department of Transportation first published a report on the availability and
suggested usage of lightweight aggregates and their uses in lightweight concrete in the 1950s
(Research Department 1953). Since then, several projects have been involved with use of
lightweight concrete, but mass production of lightweight concrete bridge members has yet to
take hold in the state of Kansas. Various tests have been done on lightweight concrete mixes in
the Kansas State University structural testing laboratory. These tests included large block
pullout tests, transfer length tests, and flexural beam tests to determine development lengths.
Additional testing was also done to determine creep and shrinkage coefficients. Testing results
showed lightweight concrete mixes were adequate for testing and were capable of reaching 5,000
psi compressive strength in only 16 hours with a 28-day compressive strength of 7,000 psi
(Perkins 2008). Ten of the 12 flexural beams tested reached nominal-moment capacity and the
two that failed below nominal failed in compression without strand end-slip (Perkins 2008).
Testing on beams cast at a precast/prestress plant would be needed as the next step in
development and use of lightweight concrete mixes.
Self-consolidating concrete has become a more widely used product. Self-consolidating
concrete (SCC) is defined as a highly workable concrete that can flow through densely
reinforced or complex structural elements under its own weight, and adequately fill voids
without segregation or excessive bleeding, without the need for vibration (PCI, 2003). Its

2
properties decrease the need of vibration during casting and create a better surface finish without
the presence of “bugholes.”
Testing was done by Kansas State University to examine use of SCC normal-weight
concrete. The process included creep and shrinkage testing along with transfer length tests.
Prestress losses were calculated using beams cast at Prestressed Concrete Incorporated (PCI) in
Newton, Kan. Testing showed prestress losses, creep coefficients and ultimate shrinkage strains
were all in general accordance with ACI code equations (Larson 2006). Research showed SCC
mixes could be accurately designed and would not require any special design considerations.
The combination of lightweight aggregate and self-compacting concrete would allow for a
lighter, more durable, and aesthetically pleasing product that could be used for bridges in
Kansas.
1.2 Objectives
The lightweight mix developed by Perkins (2008) was used to cast creep and shrinkage
prisms and beams at a precast plant. The beams cast had properties and dimensions based on
research done by Larson (2006). The beams were tested and monitored to determine if the
lightweight concrete mix could be mass produced and keep the same properties as the laboratory
mix.
1.2.1 Inverted Tee Beams
Eight inverted tee (IT) beams were cast to analyze prestress losses and transfer lengths of
the lightweight mixes used in this project. The beams were instrumented and monitored to
determine prestress losses due to elastic shortening, creep, and shrinkage, and these results were
compared to current ACI, PCI, and AASHTO code equations. Designs of the beams were
chosen to be similar to the ones used by Larson (Larson 2006). Due to low concrete strengths
during the initial casting, a second set of IT beams were fabricated, which resulted in a total of
16 IT beams being monitored.
1.2.2 Creep and Shrinkage
Creep and shrinkage prisms were cast to determine the time-dependent characteristics of
the lightweight mixes used in this project. These prisms were cast at the same time as the IT
beams and used the same mix to accurately correlate results from the two tests. Two sets of

3
prisms were cast, since two sets of IT beams were cast due to low concrete strengths. Results
from these prisms were compared to ACI 209 code equations.
1.2.3 Development Length of Flexure Beams
Twelve flexure beams were cast and tested to examine development lengths of the
lightweight mixes used in this project. The beams included four T-beams, four rectangular
beams with 100% development lengths (Ld), and four rectangular beams with 80% Ld. Cross
sections of the beams were based on research beams that Larson had tested in determining
properties of normal-weight SCC concrete mixes (Larson 2006). Results from these beams were
compared to ACI code equations.
1.3 Scope
Chapter 2 reviews research that has been done on lightweight concrete, as well as various
testing methods used to determine transfer and development lengths of prestressed concrete
members.
Chapter 3 describes design and fabrication of the inverted tee (IT) beams that were used
to determine transfer length and prestress losses of the lightweight mixes involved in this study.
Chapter 4 describes findings from the IT beams that were cast. These results were the
transfer length and prestress losses that were compared to code equations.
Chapter 5 discusses the theory and equations that have been developed for creep and
shrinkage, along with the fabrication of creep and shrinkage prisms used in this project.
Chapter 6 describes findings from the creep and shrinkages prisms and compares them to
ACI 209 code equations.
Chapter 7 describes design and fabrication of the lightweight flexure beams that were
cast and tested to verify the transfer and development length equations for lightweight concrete
mixes.
Chapter 8 describes findings from the flexure beam tests and methods of failure of the
beams with relation to the mixes that were used. Experimental moment capacities of the beams
were compared with the theoretical nominal moment capacities.
Chapter 9 discusses conclusions and recommendations developed from this project.

4
CHAPTER 2 - Literature Review
Shing et al. (2000) reviewed the ACI and AASHTO transfer and development length
equations for high-strength concrete box girders. The authors constructed three test specimens to
verify the ACI and AASHTO formulas for transfer and development lengths when using high-
strength concrete. The experiment consisted of three, 15-inch-wide and 21.75-inch-tall girders
with a span of 33.4 feet. Nine-grade 270 low-relaxation 0.6-inch-diameter, seven-wire
prestressing strands were used for flexural reinforcement, and #3 rebar stirrups were used as
shear reinforcement. The girders were fabricated at Rocky Mountain Prestress in Boulder, Colo.,
using a mix with a transfer strength of 6,500 psi and 56-day strength of 10,000 psi. The girders
had embedded points at the level of the 0.6-inch-diameter strand and were measured with a
Whittemore gauge before and after detensioning to accurately measure the transfer lengths. End-
slip measurements were also used to verify the transfer lengths. The specimens were then tested
to determine development lengths and were monitored for end-slip using linear voltage
differential transducers (LVDT) attached to the strands at each end of the beam. The authors
discovered the ACI and AASHTO formulas had overestimated the transfer and development
lengths when using high-performance concrete. The transfer length equations were
overestimated by 18% and the development lengths were overestimated by 53%. Bond
characteristics of the prestress strand were also investigated in the project. The strand came from
Insteel Wire Products and had a small amount of rust on it. It was tested for bond strength using
the Moustafa pullout block method. Average strength of the pullout tests was 48.3 kips, which
was greater than the 36 kips advised by Logan (1997) for 0.5-inch-diameter strand.
Buckner (1995) reviewed various equations that had been developed by other researchers
in regard to transfer and development lengths for prestressed members. He explained that code
equations needed to be changed due to the fact that most precasters use grade 270 instead of the
earlier version grade 250 seven-wire strand. The older equations were developed based on the
area of the grade 250 strand, with the grade 270 strand is six percent larger. Buckner
recommended increasing transfer lengths by 20% due to the higher jacking force the grade 270
strand experiences and the variation in the perimeters of the two grades of strand. Development
length was also recommended to be increased by at least 1.7 times to allow for strength and
ductility in the prestressed members.

5
Ouchi (2001) discussed the theory and use of self-compacting concrete in Japan. Self-
compacting concrete (SCC) was developed to reduce the amount of skilled laborers needed to
pour concrete for high-performance, durable structures. Ouchi explained how use of super-
plasticizer could allow for a lower water-to-cement ratio and still allow the concrete mix to have
a high workability. The super-plasticizer enables the mortar and the course aggregate to “flow”
between the reinforcement bars but prevents segregation of the two. The SCC mixture requires
little or no vibration due to its self compaction through use of gravity. The author describes a
project in Japan using SCC that decreased the number of skilled workers by 67% and completed
the construction in 80% of the time required to finish the same project using non SCC.
Weerasekera et al. (2008) summarized various methods used to measure bond and strains
in concrete and steel due to prestressing. Various tests included beam tests, pullout tests, x-ray
techniques, and the photo-elastic method. The authors developed an experiment to test the use of
strain gages mounted to the prestressing strand vs. use of demountable mechanical strain
(DEMEC) gage measurements to determine the strain in the concrete. The two methods varied
largely throughout the transfer length due to strand slip, but overall results for the entire beam
were comparable for the two methods. The strain gage method required skilled techniques to
attach the strain gages to the strand, and the gages were subject to damage during the testing
process. The strain gages also change the surface condition of the strand by being glued to it.
The DEMEC gage required a longer amount of time to take the required measurements and
could become misleading at the point of a developing crack. The authors concluded that either
technique could be used to determine transfer length, and use of either technique would provide
verification of the results from the testing.
Kamel and Tadros (1996) developed an improved cross section of prestressed girder that
could be used for construction in rural areas. The authors explained that from 1950 to 1990,
95% of the bridges built in the United States were less than 100 feet in length. These bridges are
becoming structurally deficient or need strengthening. The authors explained the majority of
these bridges are in rural areas and have limitations on the clearance allowed for bridges. A
prestressed inverted tee (IT) beam was chosen as the main cross section to be used to replace
these bridges. The IT section that was chosen consisted of a 600-mm flange width and a varying
height from 300 mm to 900 mm, depending on clearance and span length required. The IT could
be placed in its final location without use of false work and would reduce the number of piers

6
that current cast-in-place design use. The IT could be produced quickly and the construction
process would only require a small crane to place the ITs into their final position. The authors
concluded the IT cross section would be an economical design to be used for repair and
replacement of structurally deficient bridges in the rural United States.
Grace (2000) investigated the transfer length of strands made out of carbon fiber-
reinforced polymers (CFRP) and carbon fiber composite cable (CFCC). The carbon fiber strand
had a tensile strength of 328 ksi as opposed to steel strand, which had a tensile strength of 270
ksi. Along with having a higher tensile strength, carbon fiber is noncorrosive, making it a
possible replacement for steel strand. Double-T girders were cast and used to measure transfer
length. Sudden and gradual methods were used for releasing prestress force, and transfer lengths
of the carbon fiber were compared to steel strand. The CFRPs transfer lengths were 66 to 73
times the diameter of the strand for a gradual release and varied from 47 to 59 times the diameter
of the strand for a sudden release. The CFCC showed the same types of results by having a
transfer length of 33 to 47 times the diameter of the strand for gradual release and 27 to 38 times
the diameter of the strand for sudden release. The author concluded the results conflicted with
the steel strand’s transfer length, which had been found to be six to 30 percent higher for sudden
release vs. gradual release.
Kahn and Lopez (2005) tested time-dependent characteristics of high-performance
lightweight concrete (HPLC), and the prestress losses in prestressed bridge girders made for
HPLC. The authors developed two different high-performance mixes to test; both used ½-inch
expanded-slate lightweight aggregate and had design strengths of 8,000 and 10,000 psi,
respectively, and unit weights below 120 lb/ft3. The two mixes were used to cast three AASHTO
Type II girders, with two having a length of 39 feet, and one at 43 feet, for each of the mixes.
Laboratory tests were used to cast creep, shrinkage, and compressive strength specimens along
with the coefficient of thermal expansion specimens. The girders’ reinforcement consisted of
eight 0.6-inch-diameter low-relaxation strands in the bottom flange, two 0.6-inch-diameter low-
relaxation strands in the top flange and no. 4 rebar stirrups. Vibrating wire strain gages were
imbedded in the girders to measure prestress losses. The authors compared the prestress losses
using four different models: the PCI method, ACI method, and AASHTO lump sum and refined
methods. The authors concluded all four methods were conservative when estimating prestress

7
losses for both of the HPLC mixes and recommended future research to develop improved
prestress loss equations for HPLC.
Steinberg et al. (2001) monitored concrete strains that had developed from the cutting of
the prestressing strand in pretensioned concrete beams. The study consisted of three rectangular
prestressed concrete beams, 32 feet long and a cross section of 5 ½ x 23 inches. The
reinforcement of the beams consisted of four ½-inch-diameter, seven-wire, grade 270,
prestressed strand and #3 stirrups. Two of the prestressing strands were located 6 1/8 inches
from the bottom of the beam and the other two were located two inches above that. The stirrups
were spaced at 16-inch centers to provide the required shear capacity. The authors instrumented
the beams with internal and external strain gages, external DEMEC points mounted to the beam,
and linear variable differential transformers were mounted to the ends of the strands so that end-
slip measurements could also be taken. The authors found that transfer lengths were all longer
than the recommended amount of 25 inches. Internal strain gages were used to monitor the
strain during release of the strands. Data acquisition used to monitor the internal strain gages
used a sample rate of 7,500 readings per second to insure accurate readings from the gages. The
authors found that longitudinal tensile strains had developed during the cutting of the
prestressing strand. These strains were found to range from 50 to 150 microstrain, which could
cause cracking in the member near its ends. The authors concluded that DEMEC points and end-
slip measurements were comparable methods of measuring the transfer length and that the strain
gage results supported these two methods. The authors recommended future research should be
done to verify the tensile strain results and to develop a more accurate transfer-length formula.
Logan (1997) reviewed the testing procedure for determining the bond quality of various
½-inch-diameter prestressing strand samples from precast manufacturers across North America.
The author tested the samples in four separate bond characteristic tests: the pullout test
(Moustafa) method, end-slip measurements at release and 21 days, and development-length tests.
The pullout test consisted of embedding 18 inches of each of the 34-inch strand samples
vertically and placing concrete around the strand. The concrete was then heat-cured overnight to
a compressive strength of 4,350 psi. The strands were then pulled out of the concrete at a rate of
20 kips per minute until the strand load could not be kept constant. All but two of the groups of
strand reached a maximum load of 36 kips. The two groups of strand that failed to reach 36 kips
pulled out at 12 kips. The end-slip and development-length tests were done using prestressed

8
rectangular beams. The beams had a cross section of 6 ½ inches x 12 inches, with the
reinforcement consisting of one ½-inch-diameter low-relaxation grade 270 strand. The beams
were cast using each of the samples of strand from the manufacturers, and were released using
flame cutting and saw cutting. The beams were cast as 90-foot specimens and were then saw-cut
to various lengths. Lengths of the beams varied based on the desired embedment length that was
going to be tested. Overnight end-slip measurements were taken at the ends of the beam that
were flame-cut and also at the saw-cut ends of the beams. These lengths varied, but all but one
group of strand exceeded the ACI predicted length. End-slip measurements were also taken at 7,
14, and 21 days after detensioning. The two groups of strand that failed the pullout test
experienced a continually increasing transfer length by an average of 15 inches. These increased
lengths were both longer than the predicted 29 inches by the ACI equation. The beams were
then tested in flexure to determine the development lengths and to compare them with the end-
slip and pullout results. The author discovered that higher pullout loads were in direct
relationship to lower transfer and development lengths. Beams from the groups of strand with a
lower pullout load failed suddenly and without any warning at a lower-than-calculated load. The
author concluded that the pullout test developed by Moustafa (1974) was an acceptable method
for determining bond characteristics of ½-inch-diameter prestressing strand. Beams from the
strands that reached 36 kips on the pullout test, mainly failed from strand failure instead of strand
slip. The author also concluded that immediate end-slip measurements failed to determine the
final transfer- and development-length qualities on the strands and that 21-day, end-slip
measurements more accurately predicted these qualities. The author recommended that future
research should be done on the pullout method using high-range water reducers and pretensioned
strand to test the effect that HRWR have on pullout capacity.
Cousins et al. (1992) developed a more realistic test method for determining bond
parameters of various-sized prestressing strand. The test consisted of a concrete block with a
single prestressing strand in the middle. The concrete block was pushed off of the strand after
the concrete had cured. This method was developed to be a more realistic representation of the
actual behavior of the strand than the direct pullout method. Strands that were tested included
3/8-, ½-, and 0.6-inch-diameter grade 270 low-relaxation strand. The ½-inch strand included
lightly rusted, clean, and epoxy-coated strand with impregnated grit, whereas the 3/8- and 0.6-
inch-diameter strands only included clean and epoxy-coated with impregnated grit. The authors
9
tested various concrete dimensions and chose an 8-inch x 8-inch block with an embedment
length along the strand of 12 inches. The concrete was cast so that the prestressed strand was in
the center of the block and was allowed to moist-cure for three days to reach an average
compressive strength of about 4,000 psi. The authors discovered the newly developed method
produced results similar to the direct pullout tests. The authors also concluded the varying
standard deviation of the results could be attributed to grit density and rust variations of the
strand. The authors finished by stating the bond stresses found by the new test method were
higher and more practical than the direct-tension pullout method.
Martin and Scott (1976) developed a proposed new code equation for prestressing
members whose span length is shorter than the calculated development length. The authors used
previous research done by other researchers to develop a bi-linear curve to model the behavior of
undeveloped members. The bi-linear curve allowed for an accurate method of predicting the
design capacity of the shorter span members that would be more accurate than the current code
equations. The authors concluded that the bi-linear curve was dependent on the diameter of the
strand and embedment lengths, so the model could be used in all applications.
Khayat et al. (2004) analyzed various test methods available to test the performance of
self-consolidating concrete (SCC). SCC has been increasing in popularity due to its flow able
nature and reduced need for vibratory compaction. The authors tested various methods used to
rate SCC mixes and compared the results. The test consisted of 16 SCC mixes whose water-to-
cement ratios ranged from 0.32 to 0.47. The ratio of sand to course aggregate was kept the same
for all mixes. High-range water-reducing admixture was used in all of the mixes and its amount
was varied to produce the targeted slump. A set-retarding agent was used to maintain the
targeted slump during testing. Each mix was tested with and without a viscosity-modifying
admixture to test the changes in the mix. Each mixture was tested using the slump-cone,
concrete rheometer, V-funnel, J-ring, L-box, U-box, and pressure-bleed tests, and all were given
a visual stability index (VSI) rating. After comparing results from the tests, the authors had
several conclusions. They found the slump and L-box or the slump and J-ring tests were both
adequate to test the passing nature and deformability of the SCC mixes. The authors also
concluded the VSI rating could be used along with the other tests to greatly improve the
evaluation of the SCC mixtures.

10
Peterman (2007) tested the relationship of strand depth in relation to strand bond, and the
effect of strand bond with relation to fluidity of the concrete. Three main tests were performed
to determine these characteristics. The first consisted of casting beams at six different precast
plants across the United States. Two different rectangular cross sections were cast, including 10
inches x 15 inches, 8 inches x 6 inches. The 8-inch x 6-inch beam had a strand at a depth of 4 ½
inches from the top of the beam. The 10-inch x 15-inch beams consisted of half with a strand
two inches from the top of the beam and the other half with the strand 13 inches from the top of
the beam. The strand used for all the beams was ½-inch in diameter, unweathered strand, from
the same roll of strand. The strand was delivered to each plant prior to testing. Mixes from each
plant varied, but the author recorded the rheological properties for each mix and found no
correlation between them and the measured transfer lengths. Transfer lengths were measured on
all of the beams using end-slip measurements after release by flame-cutting. The author
discovered from the first test that transfer length decreased as distance from the top of the beam
increased. The second test consisted of improved cross sections to reduce confinement of the
strand. The cross sections were four-inch-wide rectangular beams, two with a height of 16
inches and two with a height of 28 inches. The strand location consisted of a bottom strand two
inches from the bottom of the beam and a strand every six inches above that. This caused the 16-
inch beam to have three strands and the 28-inch beam to have five strands, enabling a
relationship between the strand location to the top and bottom of each beam. The author found
the relationship between the transfer lengths and distance of the strand from the top surface had a
coefficient of determination of 0.83. The author also found no relation between the column
segregation test results and transfer length values. The third test consisted of casting four-inch
panels and testing them while monitoring the end-slip measurement of the panels. The panels
had a width of 24 inches and two ½-inch diameter strands 2 ½ inches from the top and 6 inches
in from each side of the beam. Lengths of the panels were varied to test embedment lengths of
30, 45, and 60 inches. The panels were cast using conventional and SCC mixes. The
compressive strengths at 28 days were 6,850 psi and 6,985 psi for the SCC and conventional
mixes, respectively. They were loaded to failure using a point load, and the SCC panels
averaged a 30% lower nominal moment capacity than the conventional mix. Transfer lengths
were also measured using end-slip measurements, and the SCC panels averaged a 30% longer
transfer length than the conventional panels. The author concluded that location of the strand
11
with regard to the top of the beam was more influential than the amount of concrete below the
strand. The author also concluded that as fluidity of the concrete increases, transfer length also
increases.
Mitchell et al. (1993) tested the relationship concrete strength and strand diameter on
transfer and development lengths of the prestressing strand. The test program consisted of 22
pretensioned concrete beams made using varying strand diameters and concrete mixes with
different compressive strengths. The strand diameters tested were 3/8, ½, and 0.62 inches strand,
and concrete compressive strengths ranged from 4,500 to 12,900 at 28 days. Tests showed the
higher compressive strength concrete beams had lower transfer lengths. The increased strength
provided a higher modulus and better bond characteristics, which decreased losses due to elastic
shortening. Testing also confirmed previous research showing smaller strand diameters result in
smaller transfer lengths. Testing showed that development length decreased in relation to the
increase in concrete compressive strength. The authors concluded compressive strength of the
concrete at release and long term has a large effect on embedment length and greatly changes the
capacity of the beam.
Peterman et al. (2000) investigated transfer and development lengths of semi-lightweight
concrete beams. Semi-lightweight concrete averaged a density on 130 lb/ft3 and was achieved
by replacing part of the course aggregate with expanded shale, which has a lower density. The
investigation consisted of casting and testing 14 concrete beams that had rectangular and T-
shaped cross sections. The entire prestressing strand used in this study was ½-inch-diameter
special strand from two different manufacturers. The mix used for all tests in this investigation
was designed to have a compressive strength of 7000 psi. Rectangular sections used for transfer-
length equations were 4 inches x 6 inches and had two prestressing strands evenly placed in the
beam. Two transfer-length beams were cast to test the transfer lengths of the two different
manufacturers. The beams were mounted with stainless steel points to measure the transfer
lengths with a Whittemore gage. Testing showed that all but one of the transfer lengths was
found to be lower than the 50 times the strand diameter advised to be used by AASHTO and
ACI. The transfer length 70 times the strand diameter was on the end of the beam that had
experienced some cracking in the concrete. Rectangular beams used for development tests
consisted of an 8-inch x 12-inch cross section, with one strand centered in the beam 10 inches
from the top of the beam. Six 8-inch x 12-inch beams were fabricated to be used for 12 different
12
tests by making the length of the beams longer so that each end could be tested separately. Three
of the beams used strand from manufacturer “A” and the other three used strand from
manufacturer “B.” The beams were loaded with a point load at the critical section of the
member, which was the distance of the embedment length from the end to be tested. Flexure
tests from the development lengths showed all the beams reached nominal moment capacity.
Results showed the prescribed AASHTO and ACI equations were adequate to be used on semi-
lightweight concrete prestressed beams. The final part of the investigation consisted of testing
multiple-strand T-beam sections. The T-beam section used had a total height of 21 inches and a
flange height of six inches. The flange had a width of 36 inches and the web had a width of 16
inches. Five prestressing strand were located two inches from the bottom and were centered and
spaced two inches on center. Two of the beams had strand from manufacturer “A” and the other
beam had strand from manufacturer “B.” No. 4 stirrups were placed every six inches, which was
more than twice the 15 inches recommended by AASHTO and ACI. The beams’ lengths were
twice the calculated embedment length plus six inches to account for the spreader beam that was
to be used during testing. The T-beams were loaded to failure using a hydraulic actuator while
load and deflection readings were taken. The two beams using strand from manufacturer “A”
failed in a ductile mode after reaching the calculated nominal moment. The third beam, using
strand from manufacture “B,” failed suddenly by strand slip but it also reached the calculated
nominal moment. Three additional beams were made using strand from manufacturer “B” to test
the effect of shear reinforcement on the failure mode of the beams. Spacing at the center of the
beams was varied to be three inches, six inches, and 15 inches for each of the three beams,
respectively, with ends of all the beams having spacing of six inches. The beam with 3-inch
spacing failed in strand rupture, with the other two failed by bond failure. The authors concluded
that flexure-shear cracks developed prior to the bond failure of the three “B” beams. The
flexure-shear crack caused the amount of tension force required to increase at the point of the
crack and to cause the strand to slip, even though the T-beams reached nominal capacity and an
increase in transverse reinforcement would increase the ductile nature of the failure. The authors
also concluded code equations for transverse reinforcement should be multiplied by 2.5 to 5
times to effectively cause the beam to fail in flexure and not bond failure.
Mitchell and Marzouk (2007) tested high-strength lightweight concrete’s bonding
properties. The testing procedure was used to determine if the 30% increase in development
13
length for the ACI code equation was justified. The program consisted of 72 pullout and push-in
specimens being fabricated using high-strength lightweight concrete. Each of the specimens had
a #8 or #11 bar cast in its center. The concrete mix had a water-to-cement ratio of 0.30, and a
high-range water-reducing agent was used to increase the fluidity of the mix. A ¾-inch max-
sized lightweight aggregate was used and average compressive strength achieved by the different
mixes was 12,049 psi. The authors discovered that the relationship of bond strength of the
concrete was closer in comparison to the European-used cubic root of the concrete strength, than
the square root used by ACI. The authors also concluded that bond strength of the lightweight
concrete was only 6 to 10% below the code equations for normal weight, instead of the 30%
recommended by ACI for lightweight aggregates.
Russell and Burns (1996) investigated the transfer lengths that are present in 0.5-and-0.6
inch-diameter prestressing strand. The authors tested the transfer lengths of specimens while
changing several variables: strand size and number per specimen, shape of the specimen, amount
of mild steel reinforcement causing confinement, spacing of the strand, and presence of
debonding strand. The test was used to compare results with the equations given by ACI and
AASHTO. Transfer lengths were measured using end-slip readings and DEMEC points. The
authors used a smoothed-line technique to create the strain profile along the beam, using
DEMEC measurements. The authors explained that transfer length was 95% of the average max
strain value on the strain profile. The research showed the amount of confinement on the strands
did not increase the transfer lengths. The 0.6-inch-diameter strand was found to produce reliable
and repeatable transfer lengths; however, these lengths were on average 36% longer than the 0.5-
inch-diameter strand. The authors concluded the code equations should be amended for 0.6-
inch-diameter strand to enable it to be used with at least a spacing of two inches. The amended
code equation could also be used for the 0.5-inch-diameter strand to be a more conservative
estimate of the transfer length.
Barnes et al. (2003) tested factors that cause transfer length to vary, including concrete
strength, strand surface condition, method of prestress release, and time at which the transfer
length is recorded. The authors tested the transfer length of 36 AASHTO Type I girders during
this investigation. Testing showed that rusted strand experienced a shorter transfer length then
brighter strand. Transfer lengths were also found to increase over time, with the average
increase being between 10 to 20 percent. This increase was found to happen within the first 28

14
days after transfer of the prestress force. The authors concluded that sudden release of prestress
force increased transfer lengths of rusted prestressing strand by as much as 50% but had little
effect on concrete with strengths higher than 7,000 psi.
Girgis and Tuan (2005) researched bond characteristics of self-consolidating concrete.
Testing included measuring transfer length of three girders each poured using a specially
designed mix. Two of the girders were cast using two specially designed SCC mixtures. The
third girder, to be used as a control, was cast using a regular conventional mixture. The mixtures
were tested for bond strength using a 0.6-inch-diameter strand with the Moustafa (1974) pullout
test. Testing showed all three mixes had pullout strengths greater than the 36 kips recommended
by Moustafa (1974). The girders were mounted with DEMEC points to measure transfer lengths
of the three mixtures. The two SCC mixtures had transfer lengths, at 36 and 43 inches, that
averaged longer than the ACI-recommended 30 inches. The control mix girder had an average
transfer length of 20 inches. Compressive strength of the control mix was higher than the SCC
mixes, which could account for shorter transfer lengths. The authors concluded that SCC mixes
may have longer transfer lengths than conventional mixes and that future research is needed to
verify these results.
Larson et al. (2007) tested bond properties of self-consolidating concrete. Transfer and
development-length equations were tested by casting SCC beams that had been monitored for
transfer and development length. Various cross sections were used to test the development
length, and one cross section tested the effect of a top strand and its bonding characteristics. The
strand used for these beams was tested using the pullout method recommended by Moustafa
(1974) to verify the bonding quality of the SCC mixture. Pullout tests showed the recommended
values by Moustafa (1974) should only be used for conventional mixes, and a higher value
should be expected for SCC mixtures. Transfer-length results showed that equations proposed
by AASHTO and ACI were acceptable for determining the transfer lengths of SCC mixtures.
Transfer lengths were found to increase over the first 21 days after detensioning. This increase
was more pronounced in the top strand, which increased on average, 40% to 45%. Bottom
strand transfer lengths were found to increase 10% to 20%. Flexural testing on the SCC beams
showed that equations for 100% and 80% embedment lengths were conservative in predicting
the nominal moment capacity of the SCC flexure beams. The 100% embedment lengths held
10% to 20% more than predicted, and the 80% beams held 25% to 35% more load than

15
predicted. The authors concluded that the SCC mixture performed adequately well and the
AASHTO and ACI equations, while conservative, can be used dependably to predict behavior of
SCC mixes and beams.

16
CHAPTER 3 - IT Design and Fabrication
This section discusses design and fabrication of inverted tee beams (ITs). ITs were cast
to determine the transfer length and prestress losses of lightweight self-consolidating concrete
(SCC) and conventional concrete (CON) mixes. Two sets of ITs were cast due to low concrete
strengths on the first set. Both sets of ITs were cast in Newton, Kan., at Prestressed Concrete
Incorporated (PCI). The first set of beams was cast on December 3, 2008, and the second set on
September 29, 2009.
3.1 IT Design
The IT 600s selected were eight feet in length and the cross-sectional dimensions are
shown in Figure 3.1. The beams were chosen to be able to provide enough length to fully
transfer the prestress force into the concrete. Design assumptions of the IT 600 can be seen in
Table 3.1. There were eight beams in each set poured—four conventional mix beams, along
with four SCC beams. Two of the beams were prestressed, and the other two included the same
amount and location of prestressing steel but were not stressed.

17
Figure 3.1 Cross Section of IT 600

18
Table 3.1 Design Assumptions of IT 600
fci= 3,500 psi L= 96 in
Eci= 2,250 ksi V/S= 2.87 in
A= 256 in2fpj= 198 ksi
I= 12,822 in4Eps= 28,500 ksi
Ybot= 8.45 in RH= 65 %
e= 3.86 in Aps= 2.448 in2
H= 23.5 in f'c= 5,000 psi
3.2 IT Fabrication
SCC IT specimens were poured in two different batches (SCC #1 and SCC #2) based on
the capacity of the pan mixer at PCI. One tensioned beam was poured along with one
untensioned beam for each batch to ensure the specimens would be companion specimens. All
four CON IT specimens were poured using the same mix. Figures 3.2 and 3.3 show the forms
for the tensioned and untensioned beams, respectively. Figure 3.4 shows one of the SCC IT
beams being cast.
Figure 3.2 Tensioned Beams’ Forms

19
Figure 3.3 Untensioned Beams’ Forms
Figure 3.4 SCC Beam being Poured

20
Whittemore points were cast on each side of the tensioned ITs at the same height as the
centroid of the prestressed strand. These points were used to measure the transfer length of the
ITs. The points were brass inserts mounted to a steel bar that was attached to the forms prior to
pouring the specimens, as can be seen in Figure 3.5.
Figure 3.5 Whittemore Points Attached to IT Forms

21
When the beams were ready to be removed from the forms, the steel bars were unbolted
from the forms. Once the forms were removed, screws attaching the brass inserts to the steel bar
were removed and the steel bar was pulled away from the side of the specimens. Figure 3.6
shows the steel bar attached to the IT after the forms were removed, and Figure 3.7 shows the
brass inserts left after the steel bar was removed from the side of the specimen.
Figure 3.6 Steel Bar Attached to Whittemore Points

22
Figure 3.7 Whittemore Points Cast into ITs
The untensioned beams were cast to measure shrinkage in the beams and subtract it from
the tensioned beams to isolate creep in the ITs. All the beams were instrumented with vibrating
wire strain gages (VWSGs) to measure internal strains in the beams. The VWSGs were Model
VCE-4200’s manufactured by Geokon Inc., Lebanon, New Hampshire. Three VWSGs were cast
at the mid-span of each beam; the location of each can be seen in Figure 3.1. The VWSGs were
mounted prior to pouring the specimens and were attached to the strand or stirrups, depending on
their location, using foam and zip ties. This was done to insure the VWSGs stayed in place
during the pour and to ensure they were not damaged. Figure 3.8 shows a VWSG mounted to
one of the bottom strands, and Figure 3.9 shows all three VWSGs mounted prior to casting of the
specimens.

23
Figure 3.8 VWSG Mounted to Top Strands

24
Figure 3.9 Location of VWSGs in Beam
3.3 Mix Properties
Test cylinders were made for each set of beams to be able to determine the concrete
strength at release following ASTM C31 and C192 (2009). The compressive and splitting tensile
strength testing followed ASTM C39 and C496 (2009). Along with test cylinders, creep and
shrinkages specimens were also cast with each set of beams. All testing of the lightweight mixes
was done according to ASTM C330 (2009). Slump, air, and unit weight of each conventional

25
mix was measured according to ATSM C143, C173, and C138 (2009), respectively. For the
SCC mixes, spread, air, unit weight, J-ring, L-box, and VSI were measured. The spread and J-
ring were measured according to ASTM C1611 and C1621 (2009). J-ring testing showed
minimal blocking of the aggregate. No visible bleeding was seen by the author during testing of
any of the SCC mixes. Figure 3.10 shows the J-ring and L-box being tested for one of the SCC
mixes. The lightweight aggregate was from Buildex in Marquette, Kan. The properties of the
lightweight aggregate can be seen in Table 3.2. The sand that was used in this study had a
specific gravity of 2.62. The sand and lightweight aggregate batch weights were adjusted for
tested surface moisture.
Figure 3.10 Performing J-ring and L-box Tests
Table 3.2 Buildex Aggregate Properties
Blend Used 3/8" x No. 8Dry Specific Gravity 1.3Absorbtion after 24 hours 20%S.G. with 15% moisture absorbed 1.45*
Buildex Marquette Aggregate
*value used in mix design

26
Mix designs for the two sets of beams can be seen in Table 3.3. The pour properties can
be seen in Table 3.4 along with compressive and splitting tensile strengths of the IT beams. The
beams were detensioned by flame-cutting the strand. Each strand was cut at the same time on
each side of the beams. Figure 3.11 shows workers flame-cutting the strands simultaneously.
Table 3.3 Mix Designs of ITs
Dry Sand (lbs)
Surface Dry
Marquette (lbs)
Type III Cement
(lbs)
Water (lbs)
Adva Cast 530 (oz)
Adva Flow 555 (oz)
Air Entrainer
(oz)
Theoretical unit weight
(pcf)
Theoretical water to cement
ratio
SCC #1 1350 807 697 231 125 0 5.8 117.9 0.331
SCC #2 1358 800 702 231 116 0 5.8 117.7 0.329
CON #1 1667 693 656 217 0 91 6 121.9 0.331
SCC #1 1396 827 661 214 109 0 5.5 118.8 0.323
SCC #2 1398 828 662 212 110 0 6.4 118.4 0.32
CON #1 1667 693 656 217 0 91 6 121.9 0.331
Batch (per yd3)
First ITs Cast on December 3,
2008
Second ITs Cast on
September 29, 2009
Table 3.4 Pour Properties of Both Sets of ITs
Spread/Slump
(in)Air (%)
Unit Weight
(pcf)
1-Day Compressive Strength (psi)
4-Day Release Strength
(psi)
28-Day Compressive Strength (psi)
28-Day Split-
Tensile Strength
(psi)
SCC #1 26 4.5 116.5 1765 2315 3275 318
SCC #2 25.5 5 115.2 1845 2438 3365 310
CON 6.5 4.5 114.5 3524 3994 5124 424
SCC #1 17 7 108.07 3382 3541 4294 350
SCC #2 20.5 8 104.6 2505 2881 3418 312
CON 7 9 109.5 2984 3661 5190 435
Batch
First ITs Cast on December 3,
2008
Second ITs Cast on
September 29, 2009

27
Figure 3.11 Workers Simultaneously Flame-Cutting the Prestress Strand
The ITs were transported to Kansas State University (KSU) after being removed from the
forms. There they were monitored outside to measure time-dependent losses, creep, and
shrinkage of the specimens. Figure 3.12 shows the specimens blocked off the ground at each end
to be able to take measurements at KSU. Readings were taken every day until a week after
transfer; then the readings were taken every week until a month after transfer. The remaining
readings were taken monthly.

28
Figure 3.12 SCC IT Beams at KSU
3.4 Additional Mix Testing
After low concrete strengths on both sets of IT beams, addition SCC mixes were batched
at PCI. The mixes had the same design as the mixes used in the IT specimens. Table 3.5 shows
the results from these trial batches. The trial mixes showed consistency in the one day
compressive strengths.
Table 3.5 Additional Trial Mix Results
DateSpread
(in)Air (%)
Unit Weight
(pcf)
1 Day Compressive
Strength (psi)
7/23/2009 26 3 122.6 53718/6/2009 22 4 121.7 5491
8/19/2009 23 4.5 116.6 5239

29
CHAPTER 4 - IT Results
This section discusses results from the ITs instrumented with Whittemore points and
VWSGs. Measurements were taken before and after detensioning. The readings were also taken
at KSU to determine long-term results.
4.1 Transfer Length Results
The ITs were monitored using Whittemore points cast into the sides of the beams. These
reading were taken before and after detensioning. They were also taken for several months at
KSU. These readings were used to calculate the amount of surface strain each IT developed and
at what location of the beam these strains became constant. As the prestress force is transferred
to the beam, the concrete will develop strain. The prestress force is transferred over a certain
length dependent on the strand and the concrete mix, which is called the transfer length. When
the surface strains become constant, the strand force is considered to be transferred. Distance
between the Whittemore points was measured using a Whittemore strain gage shown in Figure
4.1.
Figure 4.1 Whittemore Strain Gage
30
These measurements were converted into strain based on Equation 4.1. Strain
measurements for each location on the beam were used to graph the strain with relation to its
horizontal location on the beam.
L
L (Equation 4.1)
where:
= strain reading
L = change in length
L = original gauge length
The values were smoothed using Equation 4.2 (Russell and Burns 1996).
1 1
3x x x
x
Strain Strain StrainStrain
(Equation 4.2)
Both sets of ITs were monitored to find the transfer lengths of the SCC and CON mixes.
The nomenclature used for these specimens was SCC tensioned (ST) and CON tensioned (CT).
Transfer lengths were measured at various times to account for any increase in length found by
Barnes et al. (2003). Data from several of these times were plotted. The “95% average
maximum strain” method was used to find the transfer length of each side of the IT beams
(Russell and Burns 1996). Values from each side of the beams were averaged to find the mean
strain value for each location along the beam. Figures 4.2 and 4.3 show transfer length graphs
for the first set of CT #1 and ST #1 IT beams. Transfer length graphs for the second set of CT
#1 and ST #1 specimens can be seen in Figures 4.4 and 4.5, respectively. Graphs for both sets of
CT #2 and ST #2 beam specimens can be seen in Appendix A-1.

31
-2200
-2000
-1800
-1600
-1400
-1200
-1000
-800
-600
-400
-200
0
0 12 24 36 48 60 72 84 96
Distance along beam (in)
Mic
ros
trai
n
At Release
1 Week
1 Month
2/3 Year
2/3 Year 95% Average Maximum
Lt=36 in.Lt=34.5 in.
Figure 4.2 First Set CT #1 Transfer Length
-2200
-2000
-1800
-1600
-1400
-1200
-1000
-800
-600
-400
-200
0
0 12 24 36 48 60 72 84 96
Distance along beam (in)
Mic
ros
trai
n
At Release
1 Week
1 Month
2/3 Year
2/3 Year 95% Average Maximum
Lt=32 in.Lt=31 in.
Figure 4.3 First Set ST #1 Transfer Length

32
-2500
-2250
-2000
-1750
-1500
-1250
-1000
-750
-500
-250
0
0 12 24 36 48 60 72 84 96
Distance along beam (in)
Mic
ros
trai
n
At Release
1 Week
1 Month
1 Year
1 Year 95% Average Maximum
Lt=40 in. Lt=38 in.
Figure 4.4 Second Set CT #1 Transfer Length
-2500
-2250
-2000
-1750
-1500
-1250
-1000
-750
-500
-250
0
0 12 24 36 48 60 72 84 96
Distance along beam (in)
Mic
ros
trai
n
At Release
1 Week
1 Month
1 Year
1 Year 95% Average Maximum
Lt=36 in.
Lt= 36.5 in.
Figure 4.5 Second Set ST #1 Transfer Length

33
A summary of transfer lengths from both sets of the IT beams can be seen in Table 4.1.
All of the IT beams failed to have transfer lengths below the AASHTO recommended 60 times
the strand diameter or 30 inches (2004). The transfer lengths were all found to be greater than 35
inches at one year for all of the beams tested. The low concrete strengths at transfer could cause
the increase in transfer lengths. The long term transfer lengths were found to be 19 to 30 percent
higher than the recommended AASHTO value. Use of longer IT specimens could produce better
plateau in transfer length graphs instead of a peaked graph.
Table 4.1 Summary of IT Transfer Lengths
Beam Left Right Left Right Left Right Left Right1st SetCT #1 34 36 34 39 28.5 34 34.5 36 35.25 1.18CT #2 30 33 30 36 27 31 31.5 33 32.25 1.08ST #1 31 30 33 34.5 29.5 25 31 32 31.5 1.05ST #2 30 29 31 29 24 27.5 33 32 32.5 1.08
2nd SetCT #1 40 37 40 39 40 38 40 38 39 1.30CT #2 34 36 35 38.5 33 38 33.5 38 35.75 1.19ST #1 34 36 35 36 36 36 36 36.5 36.25 1.21ST #2 36 34 41 38 41 38 41 36.5 38.75 1.29
Exp. Lt/
AASHTO Lt
Transfer Lengths
At Release 1 Week 1 Month 2/3 or 1 Year 2/3 or 1 Year Average
4.2 Prestress Loss Results
All 16 IT beams were internally instrumented with VWSGs. These gages were installed
to monitor time-dependent losses of prestress force. Strains recorded by the VWSGs were
plotted, along with the location in the beam at which each gage was mounted. Figures 4.6 and
4.7 show the graphs for the first set of CT #1 and ST #1 specimens. The second set of tensioned
beams can be seen in Figures 4.8 and 4.9. The untensioned specimen results were used to
subtract shrinkage strains from creep strains. The nomenclature used for these beams was CON
untensioned (CUT) and SCC untensioned (SUT). Figures 4.10 and 4.11 show the VWSG
strains for the first set of untensioned IT beams, CUT #1 and SUT #1, respectively. The second
set of control beams are shown in Figures 4.12 and 4.13. Graphs for the remaining eight beams
can be seen in Appendix A.2.

34
First Set CT#1 VWSG
0
4
8
12
16
20
-2000 -1600 -1200 -800 -400 0 400 800 1200
Microstrain
He
igh
t (i
n)
Transfer
Day 1
Day 2
Day 3
Day 21
Day 49
Day 185
Figure 4.6 First Set CT #1 Strains (Due to Creep, Shrinkage, and Elastic Shortening Losses)
First Set ST#1 VWSG
0
4
8
12
16
20
-2000 -1600 -1200 -800 -400 0 400 800 1200
Microstrain
He
igh
t (i
n)
Transfer
Day 1
Day 2
Day 3
Day 21
Day 49
Day 185
Figure 4.7 First Set ST#1 Strains (Due to Creep, Shrinkage, and Elastic Shortening Losses)
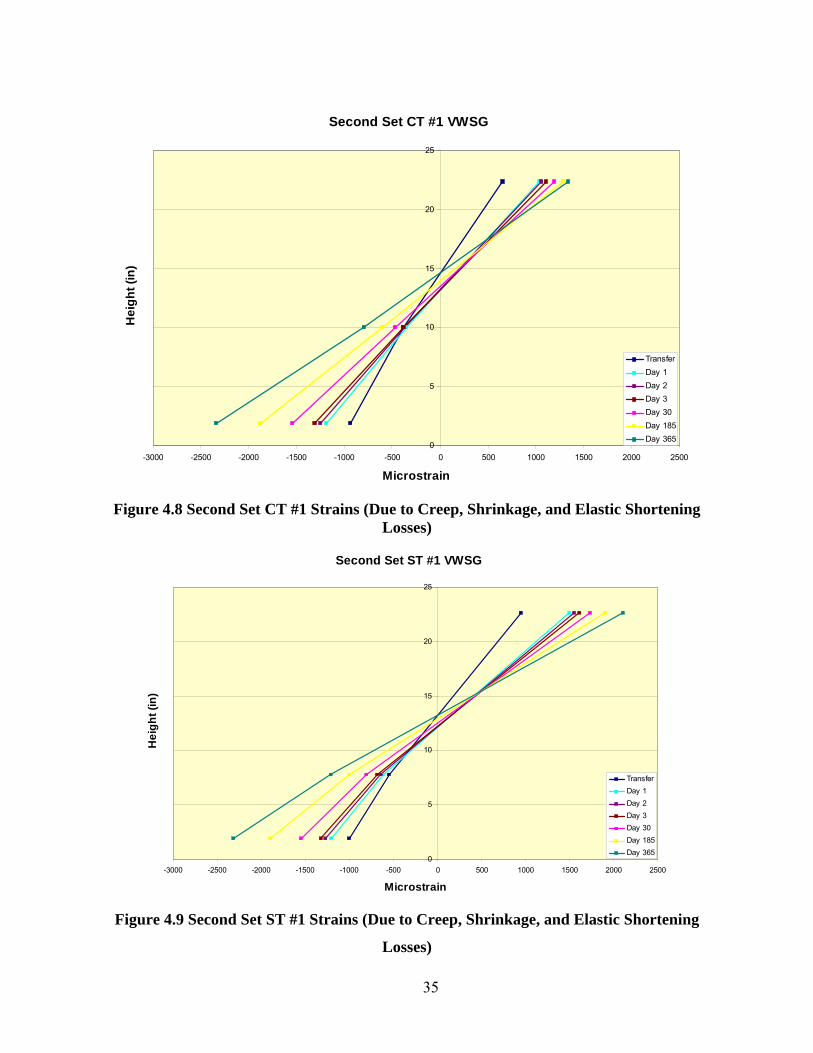
35
Second Set CT #1 VWSG
0
5
10
15
20
25
-3000 -2500 -2000 -1500 -1000 -500 0 500 1000 1500 2000 2500
Microstrain
He
igh
t (i
n)
Transfer
Day 1
Day 2
Day 3
Day 30
Day 185
Day 365
Figure 4.8 Second Set CT #1 Strains (Due to Creep, Shrinkage, and Elastic Shortening Losses)
Second Set ST #1 VWSG
0
5
10
15
20
25
-3000 -2500 -2000 -1500 -1000 -500 0 500 1000 1500 2000 2500
Microstrain
He
igh
t (i
n)
Transfer
Day 1
Day 2
Day 3
Day 30
Day 185
Day 365
Figure 4.9 Second Set ST #1 Strains (Due to Creep, Shrinkage, and Elastic Shortening
Losses)

36
First Set CUT #1 VWSG
0
4
8
12
16
20
-30 -15 0 15 30 45 60 75 90
Microstrain
He
igh
t (i
n)
Transfer
Day 1
Day 2
Day 3
Day 21
Day 49
Day 185
Figure 4.10 First Set CUT #1 Concrete Strains (Change Due to Shrinkage Losses)
First Set SUT #1 VWSG
0
4
8
12
16
20
-30 -15 0 15 30 45 60 75 90
Microstrain
He
igh
t (i
n)
Transfer
Day 1
Day 2
Day 3
Day 21
Day 49
Day 185
Figure 4.11 First Set SUT #1 Concrete Strains (Change Due to Shrinkage Losses)
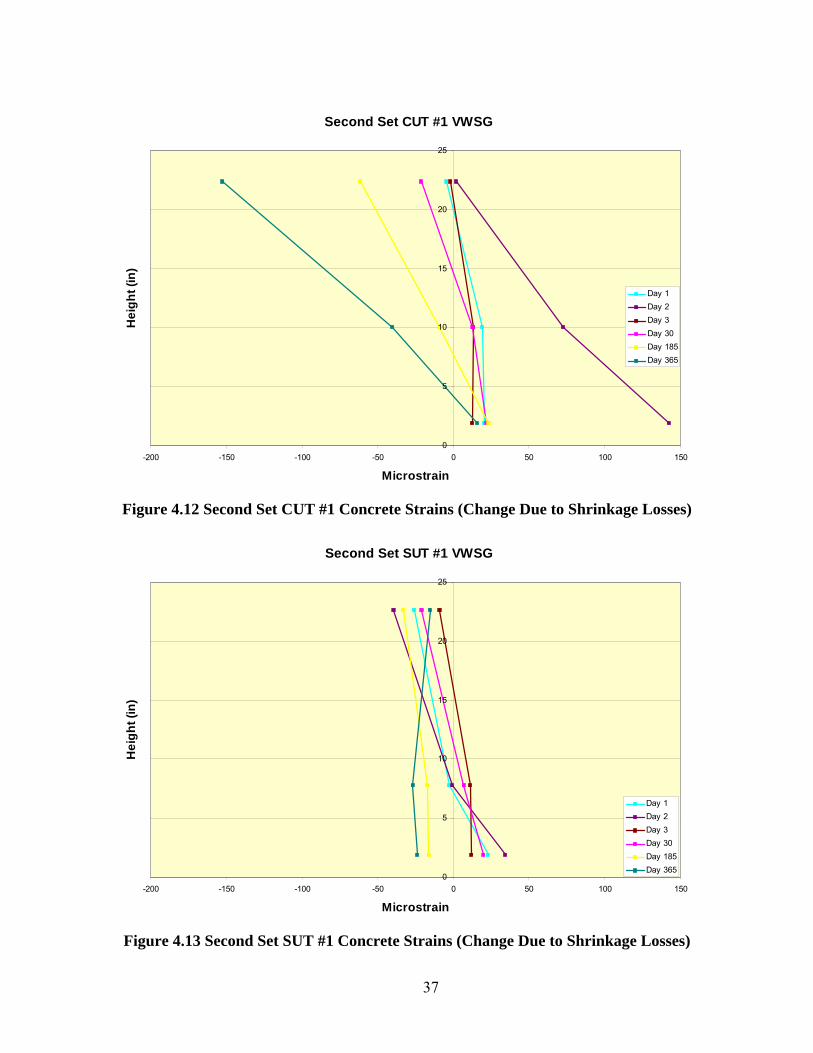
37
Second Set CUT #1 VWSG
0
5
10
15
20
25
-200 -150 -100 -50 0 50 100 150
Microstrain
He
igh
t (i
n)
Day 1
Day 2
Day 3
Day 30
Day 185
Day 365
Figure 4.12 Second Set CUT #1 Concrete Strains (Change Due to Shrinkage Losses)
Second Set SUT #1 VWSG
0
5
10
15
20
25
-200 -150 -100 -50 0 50 100 150
Microstrain
He
igh
t (i
n)
Day 1
Day 2
Day 3
Day 30
Day 185
Day 365
Figure 4.13 Second Set SUT #1 Concrete Strains (Change Due to Shrinkage Losses)

38
Strains from the VWSGs were used to determine experimental prestress losses in the IT
beams. Elastic shortening was the strain present in the bottom VWSG immediately after
detensioning. Creep was the value from the tensioned IT specimens after elastic shortening and
shrinkage readings were subtracted. Equation 4.3 was used to convert the VWSG strain into
prestress loss.
E (Equation 4.3)
where:
= prestress loss
E = modulus of elasticity of prestress strand (28,500 ksi)
= strain reading
Experimental prestress losses were compared with ACI, PCI, and AASHTO code
equations. The equations used can be seen in Appendix A.3. ACI and PCI results were the
same, so they are placed together. Calculation of the prestress losses for the ACI, PCI, and
AASHTO methods can be seen in Appendix A.4. Long-term losses can be seen in Table 4.2.
Intermediate losses were also calculated for each set of beams, and the comparison between the
experimental and theoretical effective prestress can be seen in Tables 4.3 and 4.4 for the first and
second set of beams, respectively.
Table 4.2 Experimental Prestress Losses vs. Code Losses
MethodElastic
ShorteningCreep Shrinkage Relaxation
Effective Prestress at 1 Year
ACI/PCI 27.86 37.26 6.8 2.12 124AASHTO 30.99 29.3 7.25 0.09 130
1st Set SCC 22.88 23.19 0 - 152*2nd Set SCC 29.64 39.78 1.36 - 1271st Set CON 27.53 25.29 0.18 - 145*2nd Set CON 26.91 44.55 1.28 - 125
all values in ksi, *values at 6 months

39
Table 4.3 Effective Prestress by Day for First Set of ITs
Day ACI/PCI AASHTO SCC CONTransfer 170 167 175 170
21 152 152 167 16049 147 148 166 157
185 139 142 152 145 all values in ksi
Table 4.4 Effective Prestress by Day for Second Set of ITs
Day ACI/PCI AASHTO SCC CONTransfer 170 167 168 171
30 150 151 151 155185 139 142 136 135365 135 139 127 125
all values in ksi
Shrinkage strain values are lower than predicted due to the fact that the first readings
were taken right before detensioning. This was four days after the beams were cast. During this
time the beams would have experienced a large amount of shrinkage that wasn’t recorded. The
beams also could have been internally curing causing there to be less shrinkage. Shrinkage strain
values on the untensioned specimens were found to be erratic. This irregularity could have
caused shrinkage strains in the tensioned beams to possibly be recorded as creep strains values.
Losses for the first set of beams were less than predicted code losses. This can be explained by
the fact that the code equations for long-term losses are for five years. Experimental losses of
prestress were lower than the predicted long-term values for the specimens monitored for one
year. Specimens were only monitored for one year, and the intermediate effective stresses are
lower than the predicted code values. Results show that the lightweight beams in this study
experienced larger prestress losses than predicted by the code equations. These losses at 1-year
were 73 ksi for the CON specimens and 71 ksi for the SCC specimens, compared with AASHTO
predicted value of 59 ksi. The main difference between the experimental values and the
AASHTO values can be seen in the losses from creep. Both sets of 1-year specimens
experienced creep losses of over 10 ksi more than the predicted AASHTO values.

40
CHAPTER 5 - Creep and Shrinkage Prisms
This section discusses theory and equations developed for creep and shrinkage. The ACI
209 Committee has formulated equations that predict the amount of creep and shrinkage a
prestressed beam will undergo. These equations and their meaning will be discussed in this
section.
5.1 Creep
Creep is defined as “the time-dependent increase of strain in hardened concrete subjected
to sustained stress” (ACI Committee 209 2005). Prestressed beams experience a large amount of
creep due to the prestressing force. It is important to know the amount of creep in a beam so that
prestress losses due to creep can be estimated correctly. ACI Committee 209 (2005) has
developed the following equation for predicting the amount of creep over time in a prestress
beam:
t u
tv v
d t
(Equation 5.1)
where:
vt= creep coefficient at time t
d= constant (6 to 30 days)
ψ= constant (0.40 to 0.80)
t= time in days after loading
vu= ultimate creep coefficient (1.30 to 4.15)
The procedure from ATSM C512 (2009) was followed in testing the creep specimens.
Six creep specimens were cast for each set of IT beams that had been cast. These specimens
were 4 in. x 4 in. square with a height of 24 inches. Three of the specimens were loaded at the
time of detensioning the IT specimens and the remaining three were loaded at 28 days. During
handling, several of the first set of prisms were damaged so the prisms for the first set of beams
were only loaded on the detension day. The specimens were mounted with Whittemore points to
measure the strain. The top and bottom of each prism was sulfur-capped to provide an even
surface to load the prisms on without causing any irregularities. Figure 5.1 shows the prisms

41
being sulfur-capped at the Kansas State University laboratory. The prisms were loaded to 40%
of their compressive strength in load frames that can be seen in Figure 5.2.
Figure 5.1 Sulfur-Capping Creep and Shrinkage Prisms

42
Figure 5.2 Creep Prism in Load Frame
Whittemore readings were taken at the appropriate interval as prescribed by ASTM C512
(2009). Prisms for the first set of ITs were housed in an uncontrolled room, but the second set of
prisms were housed in an environmental chamber. Humidity was maintained at 50 4% and
temperature was maintained at 73.4 2.0 degrees Fahrenheit as stated in ASTM C512 (2009).

43
5.2 Shrinkage
ACI Committee 209 (2005) states, “Shrinkage, after hardening of concrete, is the
decrease with time of the concrete volume.” There are three types of shrinkage: “drying
shrinkage due to moisture loss in the concrete, autogenous shrinkage caused by the hydration of
cement, and carbonation shrinkage resulting as the various cement hydration products are
carbonated in the presence of CO” (ACI Committee 209 2005). ACI Committee 209 (2005)
developed Equation 5.2 to predict the amount of shrinkage over time in a concrete beam. The
amount of shrinkage can decrease the prestress force in a prestressed beam and is an important
parameter to estimate. Shrinkage prisms were cast at the same time as the creep prisms as seen
in Figure 5.3.
sh sht u
t
f t
(Equation 5.2)
where:
(єsh)t= shrinkage strain at time t
t= time after loading
f= constant (20 to 130 days)
α= constant (0.90 to 1.10)
(єsh)u= ultimate shrinkage strain (415 x 10-6 to 1070 x 10-6)
Figure 5.3 Casting of Creep and Shrinkage Prisms
44
Since each creep prism experienced shrinkage, a shrinkage prism was cast for each creep
prism to be able to subtract the shrinkage from the creep values. The shrinkage prisms were
mounted with Whittemore points and were measured at the same time as the creep prisms. The
top and bottom of each prism was sulfur-capped to maintain the same volume-to-surface ratio as
the creep prisms. The shrinkage prisms were housed in the same location as the creep prisms to
prevent a variation in environmental changes. Figure 5.4 shows the second set of creep and
shrinkage prisms in the environmental chamber.
Figure 5.4 Second Set of Creep and Shrinkage Prisms in Environmental Chamber

45
CHAPTER 6 - Creep and Shrinkage Results
6.1 Creep Results
Readings were taken from the creep specimens for one year. The creep readings included
elastic shortening, creep strain, and shrinkage. The creep strains were calculated by subtracting
the elastic shortening and shrinkage of the companion specimens from the total strain readings.
ACI Committee 209 (2005) stated that the creep coefficient can be found by graphing Equation
5.1 and changing the variables ψ, d, and vu until the values fit the actual data. The experimental
creep coefficient is the ratio found by dividing creep strains by the elastic shortening strain. The
variables in Equation 5.1 can be varied until the data fits the graph of the experimental data. The
creep coefficient variables were found using a trial-and-error method for both sets of specimens.
Since two SCC specimens were loaded for each case, graphs for all of the SCC #2 creep
specimens can be seen in Appendix A.5. The first set of specimens were only loaded at
detensioning, and the second set included specimens that were loaded at detensioning and at 28
days. Figures 6.1 and 6.2 show results from the first set of CON and SCC #1, respectively.
Figures 6.3 and 6.4 show results from the second set of CON and SCC #1 specimens that were
loaded at detensioning, respectively. Results from the CON and SCC #1 specimens from the
second set that were loaded at 28 days can be seen in Figures 6.5 and 6.6, respectively. Figure
6.7 shows a summary of the creep ratios. Creep parameters for all of the specimens are
summarized in Table 6.1. The CON specimens were loaded to a higher load since the mix had a
higher compressive strength. This may be one reason why the CON creep coefficients are larger
on average vs. the SCC specimens.

46
First Set CON #1 Creep Ratio
0
0.2
0.4
0.6
0.8
1
1.2
1.4
1.6
1.8
2
0 40 80 120 160 200
Time (days)
Cre
ep
Co
eff
cie
nt
ACI 209
Measured
Creep Constants Ψ=0.5 d=11 vu=3.2
Figure 6.1 Creep Coefficient of First Set CON #1
First Set SCC #1 Creep Ratio
0
0.2
0.4
0.6
0.8
1
1.2
1.4
1.6
1.8
2
0 40 80 120 160 200
Time (days)
Cre
ep
Co
eff
cie
nt
ACI 209
Measured
Creep Constants
Ψ=0.39 d=20 vu=3.2
Figure 6.2 Creep Coefficient of First Set SCC #1
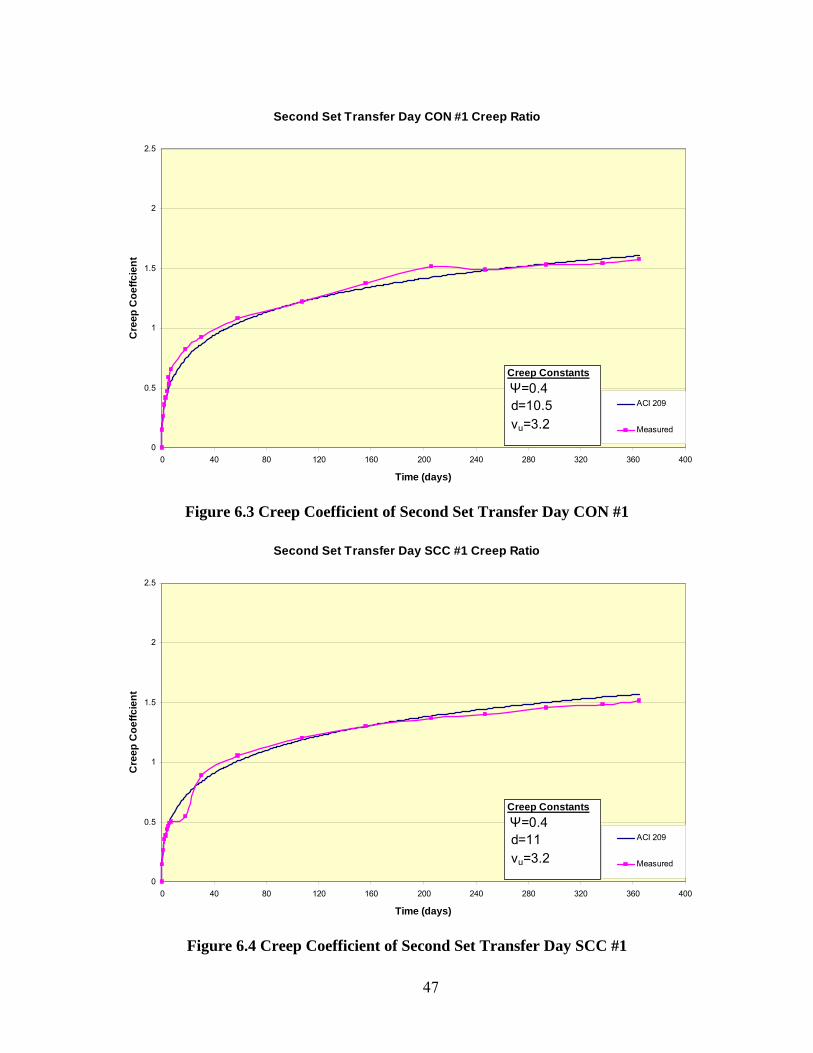
47
Second Set Transfer Day CON #1 Creep Ratio
0
0.5
1
1.5
2
2.5
0 40 80 120 160 200 240 280 320 360 400
Time (days)
Cre
ep
Co
eff
cie
nt
ACI 209
Measured
Creep Constants
Ψ=0.4 d=10.5 vu=3.2
Figure 6.3 Creep Coefficient of Second Set Transfer Day CON #1
Second Set Transfer Day SCC #1 Creep Ratio
0
0.5
1
1.5
2
2.5
0 40 80 120 160 200 240 280 320 360 400
Time (days)
Cre
ep
Co
eff
cie
nt
ACI 209
Measured
Creep Constants
Ψ=0.4 d=11 vu=3.2
Figure 6.4 Creep Coefficient of Second Set Transfer Day SCC #1
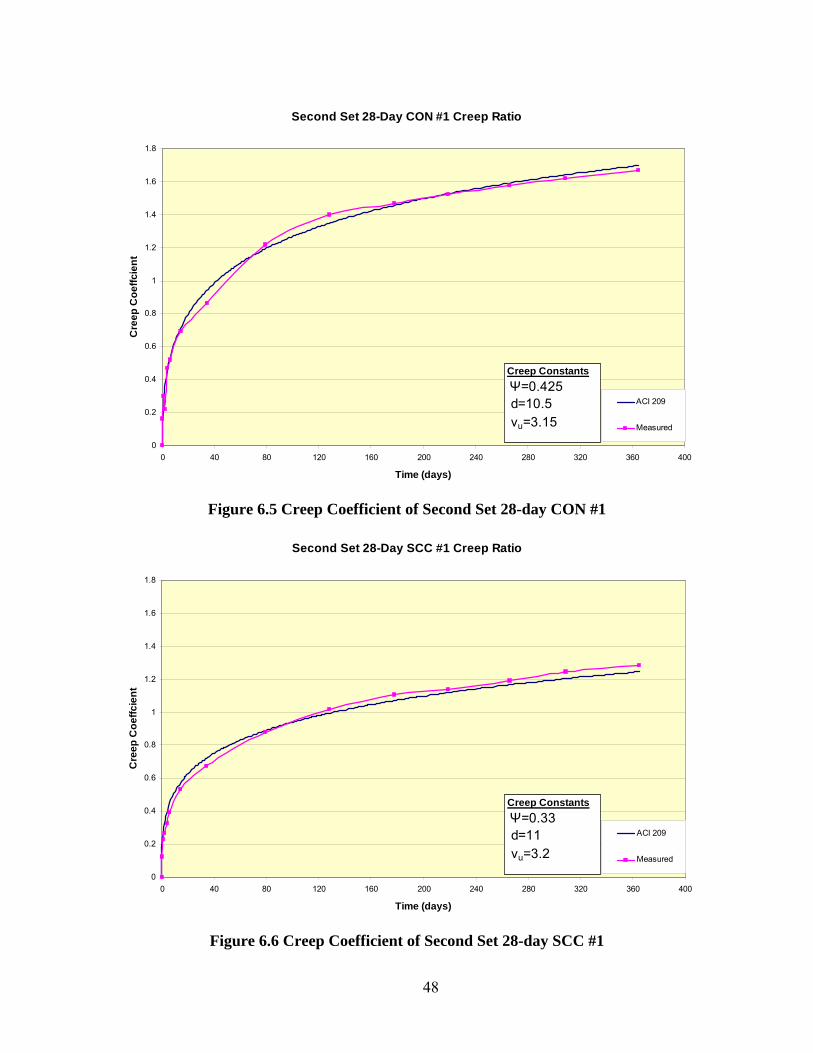
48
Second Set 28-Day CON #1 Creep Ratio
0
0.2
0.4
0.6
0.8
1
1.2
1.4
1.6
1.8
0 40 80 120 160 200 240 280 320 360 400
Time (days)
Cre
ep
Co
eff
cie
nt
ACI 209
Measured
Creep Constants
Ψ=0.425 d=10.5 vu=3.15
Figure 6.5 Creep Coefficient of Second Set 28-day CON #1
Second Set 28-Day SCC #1 Creep Ratio
0
0.2
0.4
0.6
0.8
1
1.2
1.4
1.6
1.8
0 40 80 120 160 200 240 280 320 360 400
Time (days)
Cre
ep
Co
eff
cie
nt
ACI 209
Measured
Creep Constants
Ψ=0.33 d=11 vu=3.2
Figure 6.6 Creep Coefficient of Second Set 28-day SCC #1

49
Figure 6.7 Summary of Creep Ratios
Table 6.1 Summary of Creep Parameters
CON #1 Transfer
Day
SCC #1 Transfer
Day
SCC #2 Transfer
Day
CON #1 28-Day
SCC #1 28-Day
SCC #2 28-Day
ψ 0.5 0.39 0.51 - - -d 11 20 22 - - -
vu 3.2 3.2 3.15 - - -ψ 0.4 0.4 0.51 0.425 0.33 0.4d 10.5 11 10.25 10.5 11 11
vu 3.2 3.2 3.15 3.15 3.2 3.125
Creep Set
First
Second
6.2 Shrinkage Results
Shrinkage readings were taken at the same time as the creep readings. Like the creep
specimens, two SCC specimens were cast and measured for each set of specimens. Graphs for all
SCC #2 shrinkage specimens can be seen in Appendix A.6. The measured strain readings were
Summary of Creep Ratios
0
0.2
0.4
0.6
0.8
1
1.2
1.4
1.6
1.8
2
0 40 80 120 160 200 240 280 320 360 400
Time (days)
Cre
ep C
oe
ffci
ent
CON #1-First Set-Transfer Day
SCC #1-First Set-Transfer Day
CON #1-Second Set-Transfer Day
SCC #1-Second Set-Transfer Day
CON #1-Second Set-28 Day
SCC #1-Second Set-28 Day
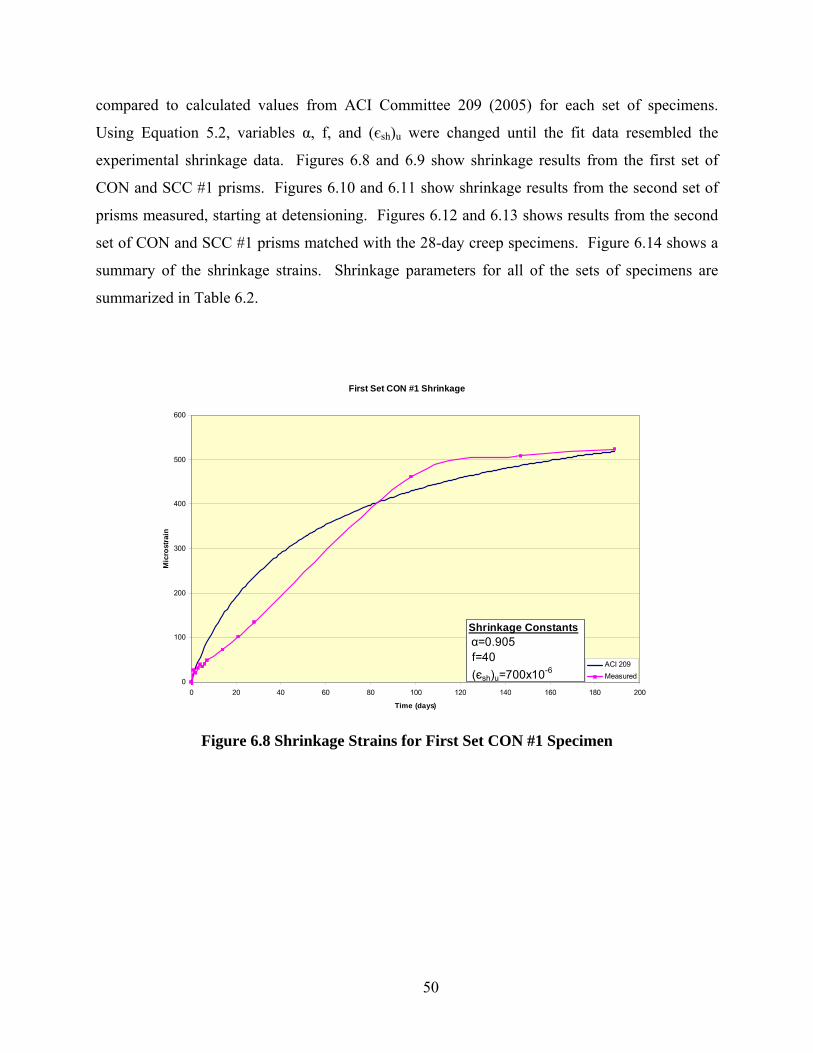
50
compared to calculated values from ACI Committee 209 (2005) for each set of specimens.
Using Equation 5.2, variables α, f, and (єsh)u were changed until the fit data resembled the
experimental shrinkage data. Figures 6.8 and 6.9 show shrinkage results from the first set of
CON and SCC #1 prisms. Figures 6.10 and 6.11 show shrinkage results from the second set of
prisms measured, starting at detensioning. Figures 6.12 and 6.13 shows results from the second
set of CON and SCC #1 prisms matched with the 28-day creep specimens. Figure 6.14 shows a
summary of the shrinkage strains. Shrinkage parameters for all of the sets of specimens are
summarized in Table 6.2.
First Set CON #1 Shrinkage
0
100
200
300
400
500
600
0 20 40 60 80 100 120 140 160 180 200
Time (days)
Mic
rost
rain
ACI 209
Measured
Shrinkage Constants α=0.905 f=40
(єsh)u=700x10-6
Figure 6.8 Shrinkage Strains for First Set CON #1 Specimen

51
First Set SCC #1 Shrinkage
0
100
200
300
400
500
600
0 20 40 60 80 100 120 140 160 180 200
Time (days)
Mic
rost
rain
ACI 209
Measured
Shrinkage Constants α=1.025 f=130
(єsh)u=515x10-6
Figure 6.9 Shrinkage Strains for First Set SCC #1 Specimen
Second Set Transfer Day CON #1 Shrinkage
0
100
200
300
400
500
600
700
0 50 100 150 200 250 300 350 400
Time (days)
Mic
rost
rain
ACI 209
Measured
Shrinkage Constants α=1.05 f=50
(єsh)u=700x10-6
Figure 6.10 Shrinkage Strains for Second Set Transfer Day CON #1 Specimen

52
Second Set Transfer Day SCC #1 Shrinkage
0
100
200
300
400
500
600
700
0 50 100 150 200 250 300 350 400
Time (days)
Mic
rost
rain
ACI 209
Measured
Shrinkage Constants α=1.05 f=100
(єsh)u=690x10-6
Figure 6.11 Shrinkage Strains for Second Set Transfer Day SCC #1 Specimen
Second Set 28 Day CON #1 Shrinkage
0
100
200
300
400
500
600
0 50 100 150 200 250 300 350 400
Time (days)
Mic
rost
rain
ACI 209
Measured
Shrinkage Constants α=1.1 f=80
(єsh)u=570x10-6
Figure 6.12 Shrinkage Strains for Second Set 28-day CON #1 Specimen

53
Second Set 28 Day SCC #1 Shrinkage
0
100
200
300
400
500
600
0 50 100 150 200 250 300 350 400
Time (days)
Mic
rost
rain
ACI 209
Measured
Shrinkage Constants α=0.993 f=93
(єsh)u=598x10-6
Figure 6.13 Shrinkage Strains for Second Set 28-day SCC #1
Figure 6.14 Summary of Shrinkage Strains
0
100
200
300
400
500
600
700
0 40 80 120 160 200 240 280 320 360 400
Mic
rost
rain
Time (days)
Summary of Shrinkage
CON #1-First Set-Transfer Day
SCC #1-First Set-Transfer Day
CON #1-Second Set-Transfer Day
SCC #1-Second Set-Transfer Day
CON #1-Second Set-28 Day
SCC #1-Second Set-28 Day

54
Table 6.2 Summary of Shrinkage Parameters
CON #1 Transfer
Day
SCC #1 Transfer
Day
SCC #2 Transfer
Day
CON #1 28-Day
SCC #1 28-Day
SCC #2 28-Day
f 40 130 125 - - -α 0.905 1.025 1.05 - - -
(єsh)u 700 515 550 - - -f 50 100 20* 80 93 95α 1.05 1.05 0.995* 1.1 0.993 1.1
(єsh)u 700 690 650* 570 598 525
Shrinkage Set
First
Second
*values omitted in summary calculations
6.3 Summary of Creep and Shrinkage Findings
Average values for creep and shrinkage parameters were found during this study. Creep
coefficients over time can be modeled with Equation 5.1 using the experimentally determined
average values of ψ, d, and vu for each of the two lightweight mixes. Shrinkage behavior of the
two lightweight mixes can be estimated with Equation 5.2 using the experimentally determined
average values of α, f, and (єsh)u. These values can be seen in Table 6.3 along with the values for
the creep parameters. The shrinkage values for the second set transfer day SCC #2 specimen
were not used since they varied from the other three specimens.
Table 6.3 Summary of Average Experimental Creep and Shrinkage Parameters
CON Transfer
Day
SCC Transfer
Day
CON 28-Day
SCC 28-Day
f 45 118 80 94α 0.98 1.04 1.1 1.05
(єsh)u 700 587 570 562
ψ 0.45 0.45 0.43 0.37d 10.75 15.81 10.5 11
vu 3.2 3.18 3.15 3.16
Average of Experimental Values
Shrinkage
Creep
6.4 ACI 209 Prestress Loss Summary
ACI Committee 209 has a method for predicting prestress losses based on parameters
found from creep and shrinkage prisms. The equations used for these losses use the creep
coefficient and the ultimate shrinkage strains to predict the long term losses. The calculations of
these losses can be seen in Appendix A.7. Table 6.4 shows a comparison between the ACI 209
predicted losses and the experimental losses from the second set of beams. The values from the

55
second set of ITs were used because they were measured for a longer period of time. The ACI
209 predicted losses due to elastic shortening were close to the experimental results. The creep
and shrinkage losses predicted by ACI 209 were highly conservative when compared to the
experimental findings. The experimental results were based on one year losses where as the ACI
209 losses are based on long term losses (five years). The experimental losses may increase
overtime to become closer to the ACI 209 predicted values.
Table 6.4 Comparison between ACI 209 Prestress Losses vs. Experimental Losses
MethodElastic
ShorteningCreep Shrinkage Relaxation
Effective Prestress
ACI 209 SCC 31 55.65 11.07 5 952nd Set SCC 29.64 39.78 1.36 - 127ACI 209 CON 31 56.18 13.24 5 932nd Set CON 26.91 44.55 1.28 - 125

56
CHAPTER 7 - Flexure Beam Design and Fabrication
This section discusses design and fabrication of the flexure beams tested for this project
at KSU. Twelve total beams were fabricated, including four with a T-beam cross section and
eight with a rectangular cross section. These beams were later tested to verify the transfer length
and development length of the SCC mix. The beams were cast at Prestressed Concrete, Inc. in
Newton, Kan., on the afternoon of January 20, 2010.
7.1 Rectangular Section Design
Eight beams having a rectangular cross section were cast and tested. Four of these had a
100% development length and the remaining four had an 80% development length. For each
length of beam, there were two SCC and two CON beams cast. The various specimens will be
referred to as SCC #1 100% Ld, CON #2 80% Ld, etc. The beams were designed to have a
minimum of 3.5% strain in the prestressing steel at nominal capacity. The cross section of the
rectangular cross section was 8 inches x 12 inches with a single ½-inch-diameter prestressed
strand 10 inches from the top of the beam. Dimensions of the beams are shown in Figure 7.1.
The rectangular cross section beams didn’t have any shear reinforcement. Shear capacity of the
beams was found to be greater than the amount of shear present when the beam was loaded to
nominal moment and the calculations can be seen in Appendix A.8. The nominal moment
capacities of each beam can be seen in Appendix A.9. The prestress loss calculations used to
find the effective prestress force, which was used for the nominal moment calculations for the
rectangular beams, can be seen in Appendix A.10. Transfer and development lengths were
calculated using ACI code equations and can be seen in Appendix A.10.
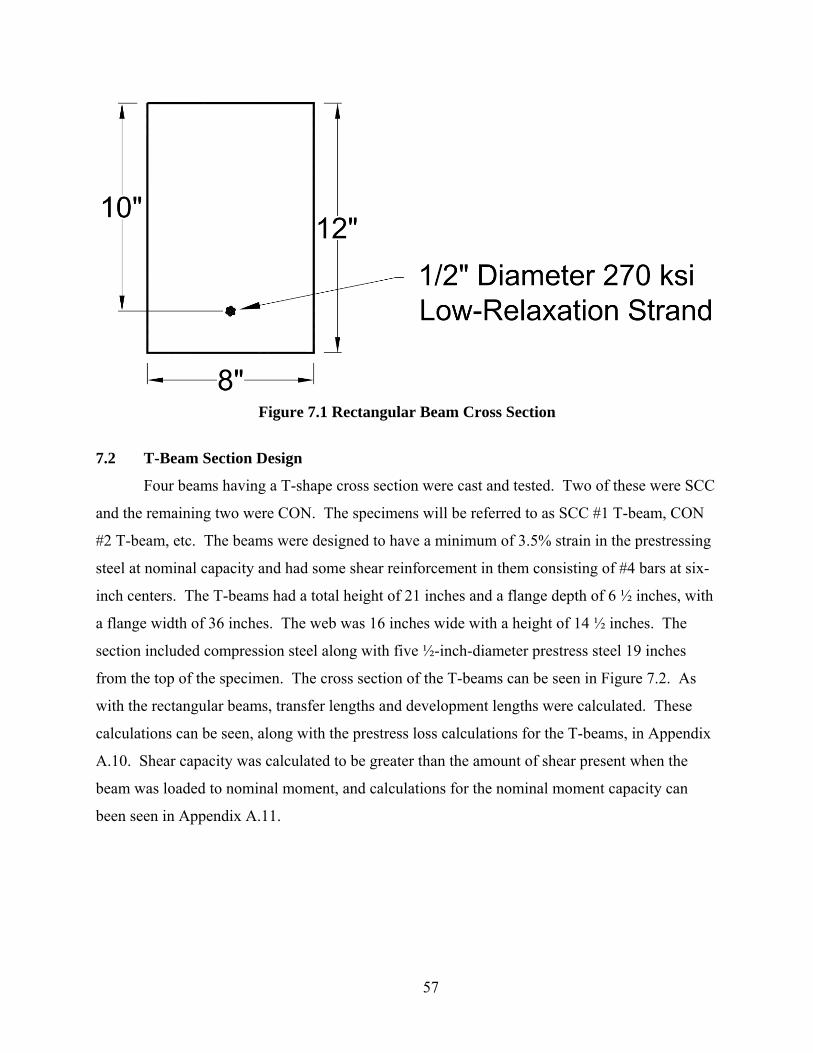
57
Figure 7.1 Rectangular Beam Cross Section
7.2 T-Beam Section Design
Four beams having a T-shape cross section were cast and tested. Two of these were SCC
and the remaining two were CON. The specimens will be referred to as SCC #1 T-beam, CON
#2 T-beam, etc. The beams were designed to have a minimum of 3.5% strain in the prestressing
steel at nominal capacity and had some shear reinforcement in them consisting of #4 bars at six-
inch centers. The T-beams had a total height of 21 inches and a flange depth of 6 ½ inches, with
a flange width of 36 inches. The web was 16 inches wide with a height of 14 ½ inches. The
section included compression steel along with five ½-inch-diameter prestress steel 19 inches
from the top of the specimen. The cross section of the T-beams can be seen in Figure 7.2. As
with the rectangular beams, transfer lengths and development lengths were calculated. These
calculations can be seen, along with the prestress loss calculations for the T-beams, in Appendix
A.10. Shear capacity was calculated to be greater than the amount of shear present when the
beam was loaded to nominal moment, and calculations for the nominal moment capacity can
been seen in Appendix A.11.

58
Figure 7.2 T-beam Cross Section
7.3 Flexure Beam Fabrication
The 12 flexure beams were cast at PCI on January 20, 2010. They were cast in steel
prestress forms that were fitted with wood inserts to provide the correct dimensions. Crack
formers were placed in each set of beams at the loading locations to cause a crack at each edge of
the constant moment region. The crack formers can be seen in the rectangular beams’ forms in
Figure 7.3. The forms were heated with steam before and after casting the specimens. The
forms used to cast the T-beams can be seen in Figure 7.4, and the forms used for the rectangular
beams can be seen in Figure 7.5.

59
Figure 7.3 Crack Formers in Rectangular Beams’ Form
Figure 7.4 T-beams’ Form with Reinforcement

60
Figure 7.5 Rectangular Beams’ Forms
The SCC beams were cast first and the CON beams were cast second. Figures 7.6
through 7.8 show the casting of the flexural beams. Each mix was tested for slump/spread, air,
and unit weight. Compressive cylinders were also made for each set of beams. Testing was
done following the ASTMs used in Chapter 3 of this study. Mix proportions of the flexure
beams can be seen in Table 7.1. The properties of the mixes used for the flexure beams can be
seen in Table 7.2.
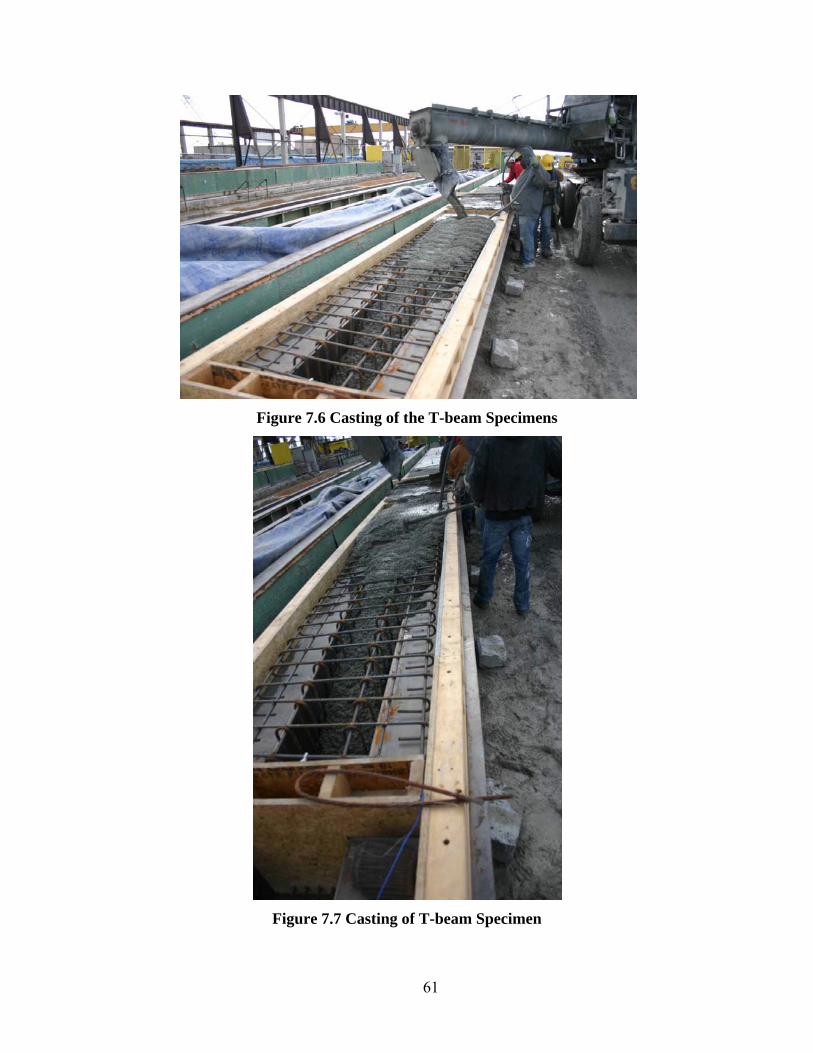
61
Figure 7.6 Casting of the T-beam Specimens
Figure 7.7 Casting of T-beam Specimen

62
Figure 7.8 Casting of Rectangular Beam
Table 7.1 Mix Proportions of Flexure Beams
Dry Sand (lbs)
Surface Dry
Marquette (lbs)
Type III Cement
(lbs)
Water (lbs)
Adva Cast 530 (oz)
Adva Flow 555 (oz)
Air Entrainer
(oz)
Theoritical unit weight
(pcf)
Theoretical water to cement
ratio
SCC #1 1337 829 632 203 113 0 5.2 113.5 0.32
SCC #2 1349 816 640 202 106 0 5.3 113.6 0.315
SCC #3 1352 819 640 202 115 0 4.4 113.6 0.315
CON #1 1671 694 657 218 0 91 6 122.1 0.331
CON #2 1675 695 657 214 0 91 6.1 122.3 0.325
Batch (per yd3)
Flexure Beams Cast on January 20, 2010

63
Table 7.2 Batch Properties of Flexure Beams
Spread/Slump
(in)Air (%)
Unit Weight
(pcf)
1-Day Compressive Strength (psi)
4-Day Release Strength
(psi)
28-Day Compressive Strength (psi)
SCC #1 24 4.5 114.1 3264 4325 4744
SCC #2 24.5 - 110.2 3310 4456 5246
SCC #3 20.5 5 111.5 3208 4425 5053
CON #1 7.5 6.5 112.3 2415 3575 5128
CON #2 7.5 7 109.8 2348 3508 4818
Batch
Flexure Beams Cast on
January 20, 2010
There were five total pours since the capacity of the pan mixer at PCI was four cubic
yards. There were three SCC batches and two CON batches. Beams cast from each batch can be
seen in Table 7.3. The finished beams can be seen in Figures 7.9 and 7.10. The beams were
finished and the forms were covered with heavy tarps to insulate them as they steam-cured.
Table 7.3 Summary of Specimens Cast with each mix
Mix Design Specimens CastSCC #1 SCC T-Beam #1SCC #2 SCC T-Beam #2SCC #3 All SCC Rectangular BeamsCON #1 All CON T-BeamsCON #2 All CON Rectangular Beams
Figure 7.9 Finished T-beam Specimens

64
Figure 7.10 Finished Rectangular Beams
Compressive strength of the beams was tested after one day. The concrete compressive
strength was too low to detension, so the forms continued to be heated until the beam strand were
detensioned after four days. The one-day and release-compressive strengths can be seen in Table
7.1, along with the release and 28-day strengths. The beams were delivered to Kansas State
University via flatbed semi truck. They were unloaded and stored inside the Civil Engineering
Structures Lab to prevent freezing of the specimens, which would disrupt the curing process.

65
CHAPTER 8 - Flexure Beam Testing and Results
This section explains the testing procedure used to test the flexure beams poured at PCI
in Newton, Kan. The beams were tested in the Civil Engineering Structural Lab at Kansas State
University using MTS servo hydraulic testing equipment. Each set of flexure beams were tested
using a different test setup but same loading condition, due to the difference in the beams’
lengths and nominal moment capacities.
8.1 Flexure Beam Test Setup
The rectangular beams were tested using a computer-controlled servo hydraulic cylinder
with a maximum capacity of 22 kips, which was twice the nominal capacity of the beams. The
rectangular beams were set up with a three-foot spreader beam to create a constant moment
region in the beam. The beams were supported by a roller on each end to prevent adding
addition horizontal forces due to friction. The roller support was located two inches from the
end of the beams. Figure 8.1 shows the test setup for the rectangular beams with 80%
development length (Ld) while the test setup for the rectangular beams with 100% Ld is shown in
Figure 8.2. The T-beams were loaded with a hydraulic cylinder that was computer-controlled, as
was the 22-kip cylinder, but had a capacity of 150 kips, which was 50% more than the nominal
capacity of the T-beams. The T-beams were loaded with a 26 inch spreader beam and had roller
supports two inches from the end, just as the rectangular beams did. Figure 8.3 shows the testing
diagram for the T-beams.
Figure 8.1 Loading Conditions for 80% Ld Beams
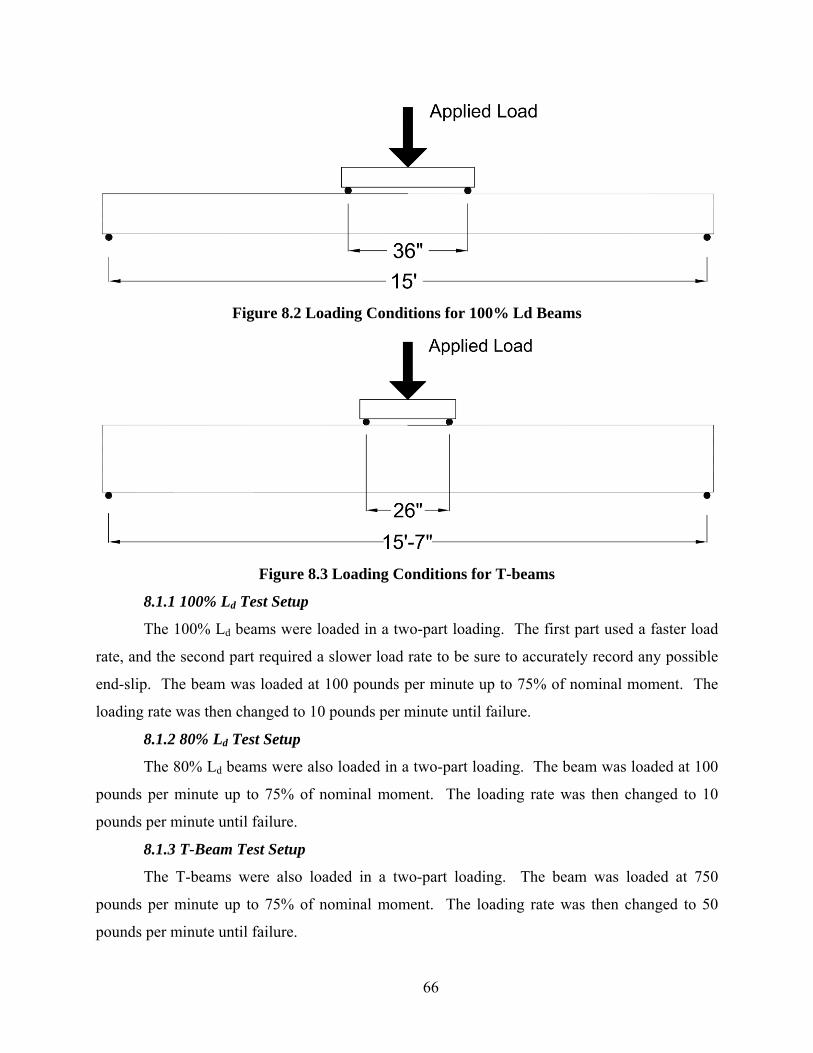
66
Figure 8.2 Loading Conditions for 100% Ld Beams
Figure 8.3 Loading Conditions for T-beams
8.1.1 100% Ld Test Setup
The 100% Ld beams were loaded in a two-part loading. The first part used a faster load
rate, and the second part required a slower load rate to be sure to accurately record any possible
end-slip. The beam was loaded at 100 pounds per minute up to 75% of nominal moment. The
loading rate was then changed to 10 pounds per minute until failure.
8.1.2 80% Ld Test Setup
The 80% Ld beams were also loaded in a two-part loading. The beam was loaded at 100
pounds per minute up to 75% of nominal moment. The loading rate was then changed to 10
pounds per minute until failure.
8.1.3 T-Beam Test Setup
The T-beams were also loaded in a two-part loading. The beam was loaded at 750
pounds per minute up to 75% of nominal moment. The loading rate was then changed to 50
pounds per minute until failure.

67
8.2 100% Ld Beam Test Results
After loading the 100% Ld beams to failure, data from the beams was exported to Excel
to be able to graph results from the tests. A graph of the experimental moment vs. mid-span
deflection was produced for each beam. The end-slip for each end was also plotted on the same
graph to show any end-slip that may have occurred. The mid-span deflection was calculated by
taking the average of the two linear variable differential transformers (LVDTs) that were placed
at the center of each beam. The experimental moment was in the constant moment region of the
beam, which was half of the force applied multiplied by the moment arm. The calculated
nominal moment of each beam was also plotted on the same graph. The nominal moment of
each of the beams was calculated using strain compatibility, and the calculations can be seen in
Appendix A.9. Figures 8.4 and 8.6 show results for the two CON 100% Ld beams. CON 100%
Ld was unloaded and reloaded due to malfunction of the testing equipment. Figures 8.5 and 8.7
show the two CON 100% Ld beams after failure. The two Con 100% Ld beams reached 98% and
97% of nominal, respectively. Con #1 100% Ld failed due to a shear crack developing and can
be seen in Figure 8.5. Con #2 100% Ld failed in the compression block and its failure can be
seen in Figure 8.7. Figures 8.8 and 8.10 show the moment vs. deflection graphs for the two SCC
100% Ld beams. SCC #1 100% Ld was cracked during handling which decreased the initial
stiffness of the specimen. The two SCC 100% Ld beams reached 96% and 99% of nominal,
respectively. SCC #1 100% Ld failed in the compression block and its failure can be seen in
Figure 8.9. SCC #2 100% Ld failed when a flexure crack developed into a shear, causing failure
which can be seen in Figure 8.11. The comparison between nominal and experimental results
can be seen in Table 8.1, along with the other flexure beams. Figure 8.12 shows a summary of
the 100% Ld specimens’ moment versus deflection.

68
Figure 8.4 Moment versus Deflection for CON #1 100% Ld Specimen
Figure 8.5 Failure of CON #1 100% Ld Specimen

69
Figure 8.6 Moment versus Deflection for CON #2 100% Ld Specimen
Figure 8.7 Failure of CON #2 100% Ld Specimen

70
Figure 8.8 Moment versus Deflection for SCC #1 100% Ld Specimen
Figure 8.9 Failure of SCC #1 100% Ld Specimen

71
Figure 8.10 Moment versus Deflection for SCC #2 100% Ld Specimen
Figure 8.11 Failure of SCC #2 100% Ld Specimen
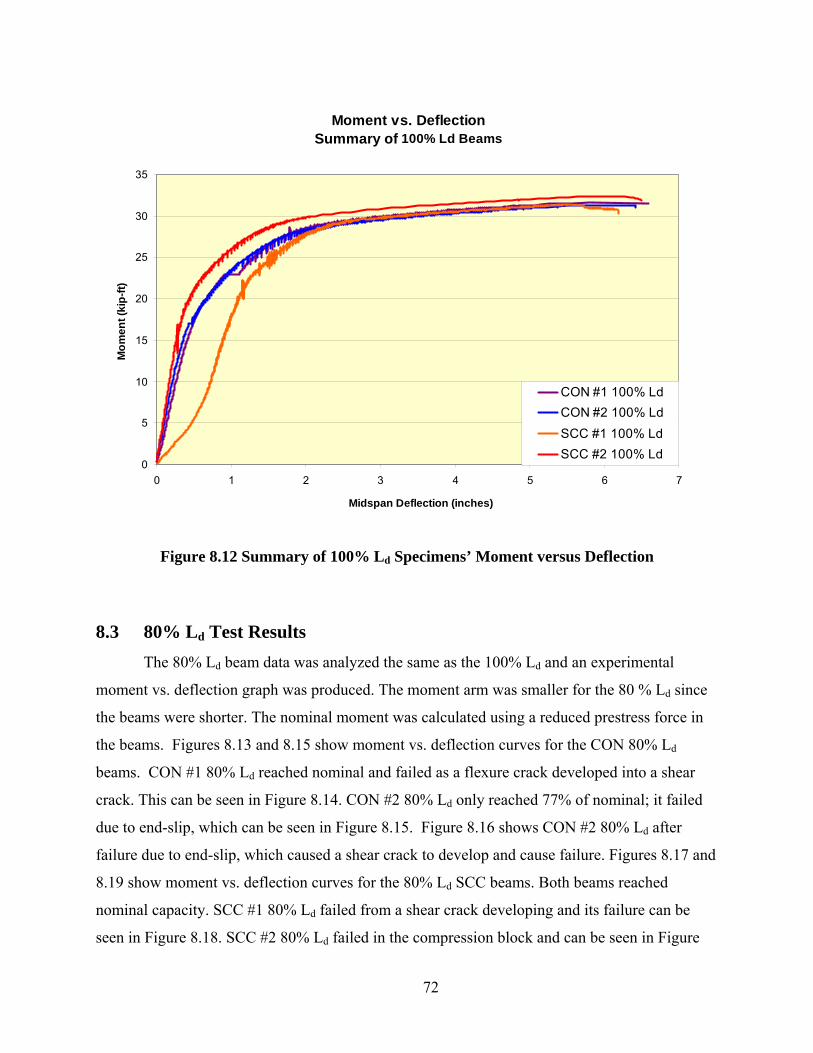
72
Moment vs. DeflectionSummary of 100% Ld Beams
0
5
10
15
20
25
30
35
0 1 2 3 4 5 6 7
Midspan Deflection (inches)
Mo
me
nt
(kip
-ft)
CON #1 100% Ld
CON #2 100% Ld
SCC #1 100% Ld
SCC #2 100% Ld
Figure 8.12 Summary of 100% Ld Specimens’ Moment versus Deflection
8.3 80% Ld Test Results
The 80% Ld beam data was analyzed the same as the 100% Ld and an experimental
moment vs. deflection graph was produced. The moment arm was smaller for the 80 % Ld since
the beams were shorter. The nominal moment was calculated using a reduced prestress force in
the beams. Figures 8.13 and 8.15 show moment vs. deflection curves for the CON 80% Ld
beams. CON #1 80% Ld reached nominal and failed as a flexure crack developed into a shear
crack. This can be seen in Figure 8.14. CON #2 80% Ld only reached 77% of nominal; it failed
due to end-slip, which can be seen in Figure 8.15. Figure 8.16 shows CON #2 80% Ld after
failure due to end-slip, which caused a shear crack to develop and cause failure. Figures 8.17 and
8.19 show moment vs. deflection curves for the 80% Ld SCC beams. Both beams reached
nominal capacity. SCC #1 80% Ld failed from a shear crack developing and its failure can be
seen in Figure 8.18. SCC #2 80% Ld failed in the compression block and can be seen in Figure

73
8.20. Table 8.1 shows the comparison of experimental versus nominal moments for each of the
beams, along with failure modes of each beam. Figure 8.21 shows a summary of the 80% Ld
specimens’ moment versus deflection.
Table 8.1 Summary of Flexure Beam Breaks
SpecimenBatch
NumberDate Tested
Compressive Strength at break
(psi)
Nominal Moment (kip-ft)
Max Experimental Moment (kip-ft)
Exp. / Nominal Failure Type
SCC #1 80% Ld
SCC #3 April 16, 2010 5645 28.84 32.02 1.11 Shear
SCC #2 80% Ld
SCC #3 May 3, 2010 5681 28.85 31.52 1.09 Compression
CON #1 80% Ld
CON #2 April 20, 2010 4501 28.46 30.31 1.07 Shear
CON #2 80% Ld
CON #2 May 4, 2010 4724 28.55 21.94 0.77 Bond
SCC #1 100% Ld
SCC #3 February 17, 2010 5019 32.14 30.97 0.96 Compression
SCC #2 100% Ld
SCC #3 February 24, 2010 5238 32.23 32.00 0.99 Comp / Shear
CON #1 100% Ld
CON #2 February 20, 2010 4738 31.97 31.18 0.98 Comp / Shear
CON #2 100% Ld
CON #2 February 25, 2010 4752 32.01 30.93 0.97 Compression
SCC #1 T-Beam
SCC #1 April 21, 2010 5922 315.84 249.10 0.79 Bond
SCC #2 T-Beam
SCC #2 May 7, 2010 5634 315.30 281.80 0.89 Bond
CON #1 T-Beam
CON #1 May 6, 2010 4917 313.66 212.20 0.68 Bond
CON #2 T-Beam
CON #1 May 11, 2010 4966 313.79 233.00 0.74 Bond

74
Figure 8.13 Moment versus Deflection for CON #1 80% Ld Specimen
Figure 8.14 Failure of CON #1 80% Ld Specimen

75
Figure 8.15 Moment versus Deflection for CON #2 80% Ld Specimen
Figure 8.16 Failure of CON #2 80% Ld Specimen

76
Figure 8.17 Moment versus Deflection for SCC #1 80% Ld Specimen
Figure 8.18 Failure of SCC #1 80% Ld Specimen

77
Figure 8.19 Moment versus Deflection for SCC #2 80% Ld Specimen
Figure 8.20 Failure of SCC #2 80% Ld Specimen

78
Moment vs. DeflectionSummary of 80% Ld Beams
0
5
10
15
20
25
30
35
0 0.5 1 1.5 2 2.5 3 3.5 4 4.5
Midspan deflection (in)
Mo
me
nt
(kip
-ft)
CON #1 80% Ld
CON #2 80% Ld
SCC #1 80% Ld
SCC #2 80% Ld
Figure 8.21 Summary of 80% Ld Specimens’ Moment versus Deflection
8.4 T-Beam Test Results
T-beam data was analyzed just like the rectangular beams, except there were five end-slip
LVDTs graphed for each end of the beam. Figures 8.22 and 8.24 show moment vs. deflection
curves for the two CON T-beams. Both beams failed due to the strands slipping, which caused
the prestress force to be lost causing shear failure. Both beams failed to reach nominal capacity,
with CON #1 reaching 68% and CON #2 reaching 74% of nominal capacity. In CON #1, one
end of the beam had strand slip and in Con #2, both ends experienced strand slip, which can be
seen in Figures 8.22 and 8.24, respectively. Figures 8.23 and 8.25 show the CON T-beams after
failure. Figures 8.26 and 8.28 show moment vs. deflection curves for the two SCC T-beams.
Like the CON T-beams, both SCC T-beams failed due to strand slip. SCC #1 reached 79% and
SCC #2 reached 89% of nominal capacity. Both SCC T-beams had one end experience strand
slip. Their failures can be seen in Figures 8.27 and 8.29. Table 8.1 shows a summary of results
from the T-beam tests, along with results from the rectangular beam tests. Figure 8.30 shows a
summary of the T-beam specimens’ moment versus deflection.
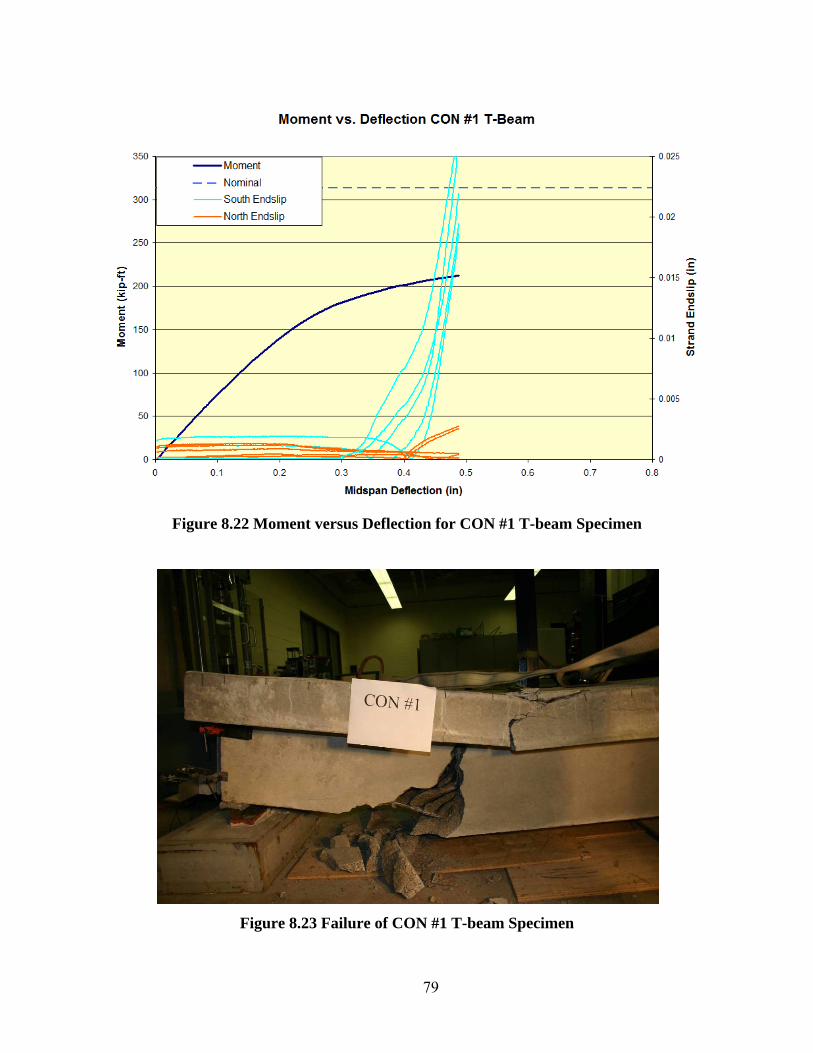
79
Figure 8.22 Moment versus Deflection for CON #1 T-beam Specimen
Figure 8.23 Failure of CON #1 T-beam Specimen
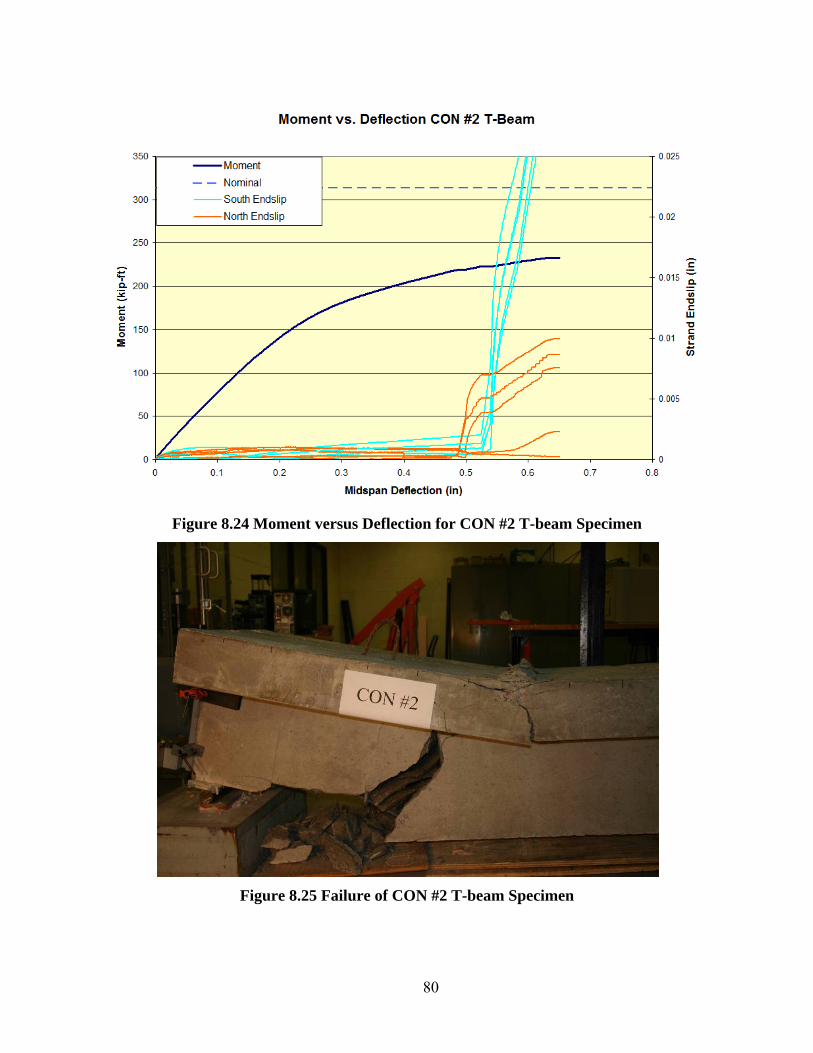
80
Figure 8.24 Moment versus Deflection for CON #2 T-beam Specimen
Figure 8.25 Failure of CON #2 T-beam Specimen
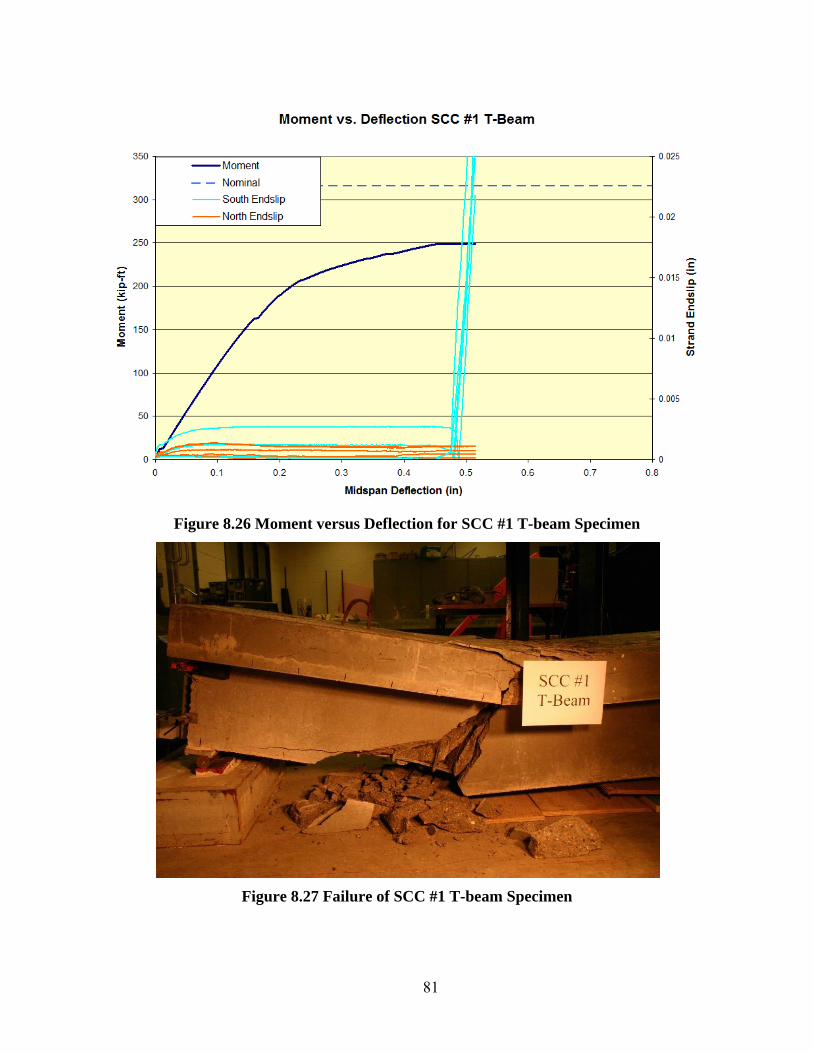
81
Figure 8.26 Moment versus Deflection for SCC #1 T-beam Specimen
Figure 8.27 Failure of SCC #1 T-beam Specimen

82
Figure 8.28 Moment versus Deflection for SCC #2 T-beam Specimen
Figure 8.29 Failure of SCC #2 T-beam Specimen

83
Moment vs. DeflectionSummary of T-Beams
0
50
100
150
200
250
300
350
0 0.1 0.2 0.3 0.4 0.5 0.6 0.7 0.8
Midspan Deflection (in)
Mo
men
t (k
ip-f
t)
CON #1 T-beam
CON #2 T-beam
SCC #1 T-beam
SCC #2 T-beam
Figure 8.30 Summary of T-beam Specimens' Moment versus Deflection
Ends of the T-beams showed possible signs of excessive moisture in the mixes. Water
being released from the aggregate could cause this increase in moisture since excess moisture
wasn’t observed during the casting of the beams. This moisture caused the beams to be
discolored around the strand at each end which is shown in Figure 8.31. The movement of water
could cause an increase in the water-to-cement ratio around the strand causing the strength of the
concrete to decrease. Decrease in concrete strength near the strand could cause a decrease in the
bond capacity of the concrete with the strand causing the specimen to failure prematurely
through bond failure. Figure 8.32 shows the T-beam end with the end-slip LVDTs after bond
failure.

84
Figure 8.31 Discoloration of T-Beam ends
Figure 8.32 T-beam End after Bond Failure
85
CHAPTER 9 - Conclusions and Recommendations
9.1 Conclusions
This test program revealed many interesting results and led to development of several
conclusions as listed below. The IT specimens provided beneficial results on transfer length and
prestress losses associated with lightweight concrete mixes. Creep and shrinkage prisms
provided data to accurately predict long term creep and shrinkage of the lightweight mixes in this
study. Flexure beam tests determined the bond characteristics of the lightweight mixes.
1. IT specimens showed code equations used for transfer length and prestress losses
were not conservative in predicting the behavior of the lightweight concrete mixes
in this study. The experimental transfer lengths were found to be 19% to 30%
longer than the recommended value of 60db or 30 inches by AASHTO (2004).
Low concrete strengths at release could provide one reason for the increased
transfer lengths.
2. VWSG results were used to determine the experimental prestress losses. The
shrinkage losses were found to be much lower than the predicted code values.
Reasons for this difference would include the timeline at which initial readings
were taken and the presence of internal curing. The initial shrinkage readings
may have been taken after a majority of the shrinkage had taken place. Elastic
shortening losses were found to be close to the predicted code equations but the
losses due to creep were over 10 ksi larger than the values predicted. The one
year experimental losses for the SCC and CON mixes were found to be 71 ksi and
73 ksi, respectively. AASHTO code equation losses for one year were calculated
to be 59 ksi.
3. Creep and shrinkage prisms supplied information about the long term
characteristics of the lightweight concrete mixes. The data from the prisms were
used with ACI 209 equations to determine the creep and shrinkage parameters.
These parameters conservatively predicted the long term prestress losses of the
lightweight mixes used in this study.
4. Flexure beam results showed that the development length equations were not
conservative in predicting the behavior of the lightweight concrete and mixes

86
evaluated in this study. All of the T-beams tested in this study exhibited bond
failures. Excess moisture released by the aggregate after placement in the forms
may have caused a higher water-to-cement ratio in the paste near the prestress
strand. The additional water may have caused the bond strength to decrease,
causing premature failure.
9.2 Recommendations & Areas of Further Investigation Before Implementation
Flexural tests revealed that the lightweight concrete mixes in this study performed poorly
when compared to AASHTO, ACI and PCI code predictions. The findings from this study can
be a benchmark for future research projects but several items require further research before
lightweight concrete mixes can be implemented in Kansas pretensioned concrete bridges.
1. The lightweight mixes used in this study should not be used for Kansas bridges.
2. The issue with low concrete strengths must be resolved before lightweight
concrete girders can be implemented on Kansas roads. Additional trial runs
should be performed at precast plant before casting more test samples. Time
between trial test mixes and test sample cast dates should be minimized.
3. Additional transfer and development length test specimens should be tested to
determine if a new, higher-strength, mix will result in acceptable bond
performance.
4. The source of excess moisture that appeared in the T-beams needs be determined
to prevent girders from having a sudden bond failure.
5. Use of dry-lightweight aggregate should be investigated to decrease excess
moisture in the mix.

87
REFERENCES
AASHTO. (2004). LRFD bridge design specifications. Washington, DC: American Association
of State Highway and Transportation Officials.
ACI Committee 209. (2005). Report on factors affecting shrinkage and creep of hardened
concrete (ACI 209.1R-05). Farmington Hills, MI: American Concrete Institute.
ACI Committee 318. (2008). Building code requirements for structural concrete (ACI 318-08).
Farmington Hills, MI: American Concrete Institute.
ASTM C31. (2009). Standard Practice for Making and Curing Concrete Test Specimens in the
Field. West Conshohocken, PA: ASTM International.
ASTM C39. (2009). Standard Test Method for Compressive Strength of Cylindrical Concrete
Specimens. West Conshohocken, PA: ASTM International.
ASTM C138. (2009). Standard Test Method for Density, Yield, and Air Content (Gravimetric)
of Concrete. West Conshohocken, PA: ASTM International.
ASTM C143. (2009). Standard Test Method for Slump of Hydraulic-Cement Concrete. West
Conshohocken, PA: ASTM International.
ASTM C173. (2009). Standard Test Method for Air Content of Freshly Mixed Concrete by the
Volumetric Method. West Conshohocken, PA: ASTM International.
ASTM C192. (2009). Standard Practice for Making and Curing Concrete Test Specimens in the
Laboratory. West Conshohocken, PA: ASTM International.
ASTM C330. (2009). Standard Specification for Lightweight Aggregates for Structural
Concrete. West Conshohocken, PA: ASTM International.

88
ASTM C496. (2009). Standard Test Method for Splitting Tensile Strength of Cylindrical
Concrete Specimens. West Conshohocken, PA: ASTM International.
ASTM C512. (2009). Standard Test Method for Creep of Concrete in Compression. West
Conshohocken, PA: ASTM International.
ASTM C1611. (2009). Standard Test Method for Slump Flow of Self-Consolidating Concrete.
West Conshohocken, PA: ASTM International.
ASTM C1621. (2009). Standard Test Method for Passing Ability of Self-Consolidating Concrete
by J-Ring. West Conshohocken, PA: ASTM International.
Barnes, R. W., Grove, J. W., & Burns, N. H. (2003). Experimental assessment factors affecting
transfer length. ACI Structural Journal, 100 (6), 740-748.
Buckner, D. (1995). A review of strand development length for pretensioned concrete members.
PCI Journal, 40 (2), 84-105.
Cousins, T.E., Badaux, M. H., & Moustafa, S. (1992). Proposed test for determining bond
characteristics of prestressing strand. PCI Journal, 37 (1), 66-73.
Girgis, A. F. M., & Tuan, C. Y. (2005). Bond strength and transfer length of pretensioned bridge
girders cast with self-consolidating concrete. PCI Journal, 50 (6), 72-87.
Grace, N. F. (2000). Transfer length of CFRP/CFCC strands for double-T girders. PCI Journal,
45 (5), 110-126.
Kahn, L. F., & Lopez, M. (2005). Prestress losses in high-performance lightweight concrete
pretensioned bridge girders. PCI Journal, 50 (5), 84-95.

89
Kamel, M. R., & Tadros, M. K. (1996). The inverted-tee shallow bridge system for rural areas.
PCI Journal, 41 (5), 28-43.
Khayat, K. H., Assaad, J., & Daczko, J. (2004). Comparison of field-oriented test methods to
assess dynamic stability of self-consolidating concrete. ACI Materials Journal, 101 (2), 2004:
168-176.
Larson, K. H. (2006). Evaluating the time-dependent deformations and bond characteristics of a
self-consolidating concrete mix and the implication for pretensioned bridge applications.
Manhattan, KS: Kansas State University.
Larson, K. H., Peterman, R. J., & Esmaeily, A. (2007). Bond characteristics of self-consolidating
concrete for prestressed bridge girders. PCI Journal, 52 (4), 44-57.
Logan, D. R. (1997). Acceptance criteria for bond quality of strand for pretensioned prestressed
concrete applications. PCI Journal, 42 (2), 52-90.
Martin, L., & Scott, N. (1976). Development of prestressing strand in pretensioned members.
ACI Journal, 73 (8), 453-456.
Mitchell, D., Cook, W. D., Khan, A. A. , & Tham, T. (1993). Influence of high-strength concrete
on transfer and development length of pretensioning strand. PCI Journal, 38 (3), 52-66.
Mitchell, D. W., & Marzouk, H. (2007). Bond characteristics of high-strength lightweight
concrete. ACI Structural Journal, 104 (1), 22-29.
Moustafa, S. (1974). Pull-out strength of strand and lifting loops. Concrete Technology
Associates Technical Bulletin, 74-B5.

90
Ouchi, M. (2001). Self-compacting concrete development, applications and investigations. In
Proceedings of the Fourth International Conference on Materials Engineering for Resources
(volume 1, pp. 53-58). Akita, Japan: ICMR2001.
PCI. (2003). Interim guidelines for the use of self-consolidating concrete in Precast/
Prestressed Concrete Institute member plants. Chicago, IL: Precast/Prestressed
Concrete Institute.
PCI Industry Handbook Committee. (2004). PCI design handbook (6th ed.). Chicago, IL:
Precast/Prestressed Concrete Institute.
Perkins, J. (2008). Concrete fluidity effects on bond of prestress tendons for lightweight bridge
girders. Manhattan, KS: Kansas State University.
Peterman, R. J. (2007). Effects of as-cast depth and concrete fluidity on strand bond. PCI
Journal, 52 (3), 72-101.
Peterman, R. J., Ramirez, J. A., & Olek, J. (2000). Influence of flexure-shear cracking on strand
development length in prestressed concrete members. PCI Journal, 45 (5), 76-94.
Research Department, State Highway Commission of Kansas. (1953). Availability and suggested
usage of lightweight aggregate concrete for Kansas highway construction. Topeka, KS: State
Highway Commission of Kansas.
Russell, B. W., & Burns, N. H. (1996). Measured transfer lengths of 0.5-in. and 0.6-in. strands in
pretensioned concrete. PCI Journal, 41 (5), 44-65.
Shing, P. B., Frangopol, D. M., McMullen, M. L., Hutter, W., Cooke, D. E., & Leonard, M. A.
(2000). Strand development and transfer length tests on high-performance concrete box girders.
PCI Journal, 45 (5), 96-109.

91
Steinberg, E., Beier, J. T., & Sargand, S. (2001). Effects of sudden prestress force transfer in
pretensioned concrete beams. PCI Journal, 46 (1), 64-75.
Weerasekera, I. R. A., Sabesh, A., & Loov, R. E. (2008). Reliability of bond measuring devices
in pretensioned prestressed concrete. In Y. M. Xie & I. Patnaikuni (Eds.), Innovations in
structural engineering and construction: Proceedings of the 4th International Structural
Engineering and Construction Conference (volume 1, pp. 333-338). London, England: Taylor &
Francis.

92
Appendix A - Supplementary Table, Figures, and Calculations
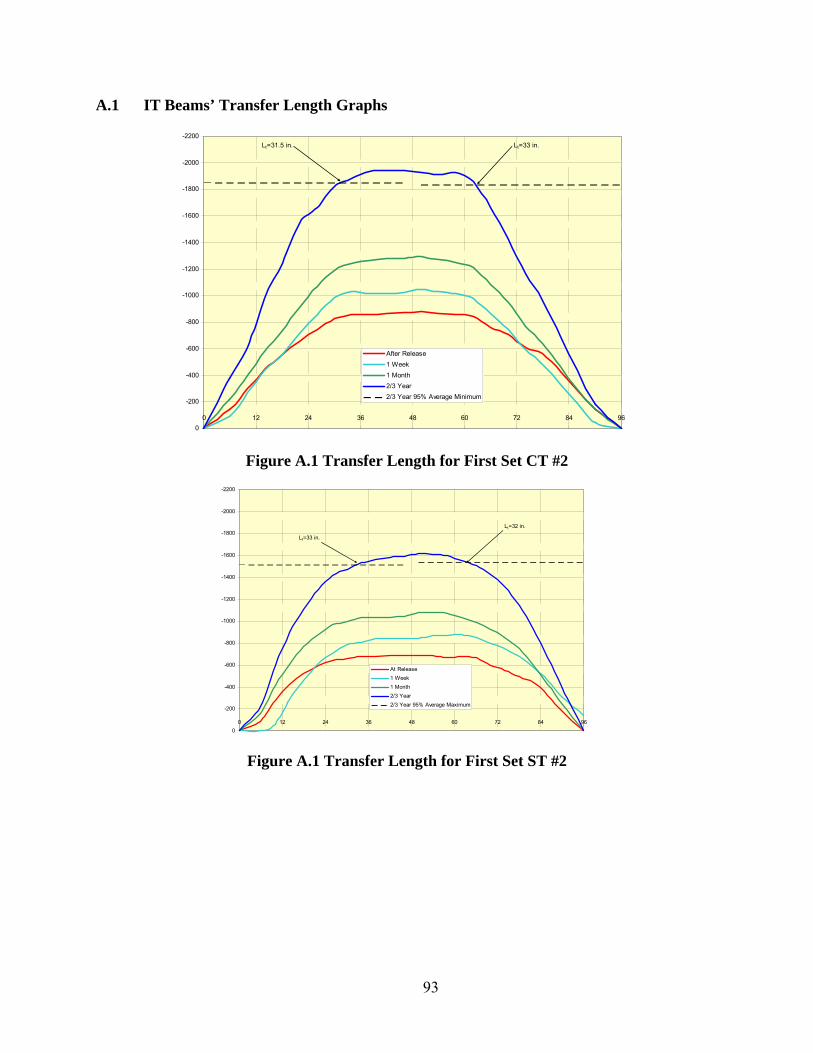
93
A.1 IT Beams’ Transfer Length Graphs
-2200
-2000
-1800
-1600
-1400
-1200
-1000
-800
-600
-400
-200
0
0 12 24 36 48 60 72 84 96
After Release
1 Week
1 Month
2/3 Year
2/3 Year 95% Average Minimum
Lt=33 in.Lt=31.5 in.
Figure A.1 Transfer Length for First Set CT #2
-2200
-2000
-1800
-1600
-1400
-1200
-1000
-800
-600
-400
-200
0
0 12 24 36 48 60 72 84 96
At Release
1 Week
1 Month
2/3 Year
2/3 Year 95% Average Maximum
Lt=32 in.
Lt=33 in.
Figure A.1 Transfer Length for First Set ST #2

94
-2500
-2250
-2000
-1750
-1500
-1250
-1000
-750
-500
-250
0
0 12 24 36 48 60 72 84 96
At Release
Week 1
1 Month
1 Year
1 Year 95% Average Maximum
Lt=33.5 in. Lt= 38 in.
Figure A.2 Transfer length of Second Set CT #2
-2500
-2250
-2000
-1750
-1500
-1250
-1000
-750
-500
-250
0
0 12 24 36 48 60 72 84 96
At Release
1 Week
1 Month
1 Year
1Year 95% Average Maximum
Lt=41 in.Lt= 36.5 in.
Figure A.3 Transfer Length of Second Set ST #2

95
A.2 IT Beams’ VWSG Graphs
Figure A.4 VWSG for First Set CT #2 (Creep, Shrinkage, and Elastic Shortening Losses)
Figure A.5 VWSG for First Set ST #2 (Creep, Shrinkage, and Elastic Shortening Losses)
First Set CT#2 VWSG
0
4
8
12
16
20
-2000 -1600 -1200 -800 -400 0 400 800 1200
Microstrain
He
igh
t (i
n)
Transfer
Day 1
Day 2
Day 3
Day 21
Day 49
Day 185
First Set ST#2 VWSG
0
4
8
12
16
20
-2000 -1600 -1200 -800 -400 0 400 800 1200
Microstrain
He
igh
t (i
n)
Transfer
Day 1
Day 2
Day 3
Day 21
Day 49
Day 185

96
Figure A.6 VWSG for First Set CUT #2 (Change Due to Shrinkage Losses)
Figure A.7 VWSG for First Set SUT #2 (Change Due to Shrinkage Losses)
First Set CUT #2
0
4
8
12
16
20
-30 -15 0 15 30 45 60 75 90
Microstrain
He
igh
t (i
n)
Transfer
Day 1
Day 2
Day 3
Day 21
Day 49
Day 185
First Set SUT #2
0
4
8
12
16
20
-30 -15 0 15 30 45 60 75 90
Microstrain
He
igh
t (i
n)
Transfer
Day 1
Day 2
Day 3
Day 21
Day 49
Day 185

97
Figure A.8 VWSG for Second Set CT #2 (Creep, Shrinkage, and Elastic Shortening
Losses)
Figure A.9 VWSG for Second Set ST #2 (Creep, Shrinkage, and Elastic Shortening Losses)
Second Set CT #2 VWSG
0
5
10
15
20
25
-3000 -2500 -2000 -1500 -1000 -500 0 500 1000 1500 2000 2500
Microstrain
He
igh
t (i
n)
Transfer
Day 1
Day 2
Day 3
Day 30
Day 185
Day 365
Second Set ST #2 VWSG
0
5
10
15
20
25
-3000 -2500 -2000 -1500 -1000 -500 0 500 1000 1500 2000 2500
Microstrain
He
igh
t (i
n)
Transfer
Day 1
Day 2
Day 3
Day 30
Day 185
Day 365
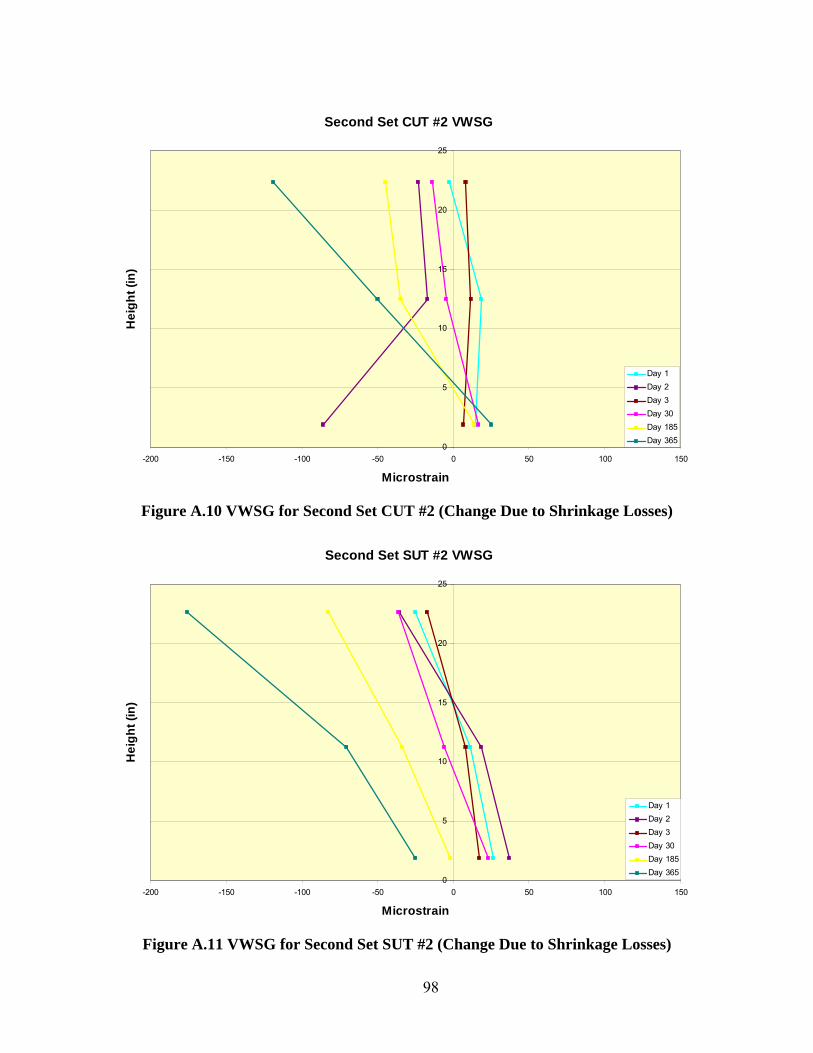
98
Figure A.10 VWSG for Second Set CUT #2 (Change Due to Shrinkage Losses)
Figure A.11 VWSG for Second Set SUT #2 (Change Due to Shrinkage Losses)
Second Set CUT #2 VWSG
0
5
10
15
20
25
-200 -150 -100 -50 0 50 100 150
Microstrain
He
igh
t (i
n)
Day 1
Day 2
Day 3
Day 30
Day 185
Day 365
Second Set SUT #2 VWSG
0
5
10
15
20
25
-200 -150 -100 -50 0 50 100 150
Microstrain
He
igh
t (i
n)
Day 1
Day 2
Day 3
Day 30
Day 185
Day 365

99
A.3 Prestress Loss Equations
ACI and PCI Methods
(ACI Committee 318, 2005 and PCI Design Handbook, 2004)
Elastic Shortening of Concrete (ES):
cires s
ci
fES K E
E
where:
Kes= 1.0 for pretensioned members
Eci= modulus of elasticity of concrete at time prestress is applied
Es= modulus of elasticity of prestressing tendons
cir cir cpi gf K f f
where:
Kcir= 0.9 for pretensioned members
Creep of Concrete (CR):
Members with bonded tendons:
scr cir cds
c
ECR K f f
E
where:
Kcr= 1.6 for lightweight concrete
Shrinkage of Concrete (SH):
68.2 10 1 0.06 100sh ps
VSH K E RH
S
where:
Ksh= 1.0 for pretensioned members
V/S= volume-to-surface ratio
RH= average ambient relative humidity
Relaxation of Tendons (RE):

100
reRE K J SH CR ES C
where:
Kre, J, and C are taken from tables in PCI Handbook (2004)
AASHTO Method
From Third Edition AASHTO (2004)
2pT pES pSR pCR pRf f f f f
where:
∆fpT= total loss (ksi)
∆fpES= loss due to elastic shortening (ksi)
∆fpSR= loss due to shrinkage (ksi)
∆fpCR=loss due to creep of concrete (ksi)
∆fpR2= loss due to relaxation of steel after transfer (ksi)
Elastic Shortening (∆fpES):
ppES cgp
ci
Ef f
E
where:
fcpg= sum of stresses in concrete at the center of gravity of the prestressing tendons due
to the prestressing force at transfer and the self weight of the member at the section of
maximum moment (ksi)
Ep= modulus of elasticity of prestressing steel (ksi)
Eci= modulus of elasticity of concrete at transfer (ksi)
Shrinkage (∆fpSR):
17.0 0.150pSRf H
where:
H= average annual ambient relative humidity
Creep (∆fpCR):

101
12.0 7.0 0cdppCR cgpf f f
where:
fcgp= concrete stress at center of gravity of prestressing steel at transfer
∆fcdp= change in concrete stress at center of gravity of prestressing steel due to
permanent loads with the exception of the load acting at the time the prestressing force is
applied. Values of ∆fcdp should be calculated at the same section or at sections at which
fcgp is calculated (ksi)
Relaxation (∆fpR2):
2 20.0 0.4 0.2pR pES pSR pCRf f f f
where:
∆fpES= loss due to elastic shortening (ksi)
∆fpSR= loss due to shrinkage (ksi)
∆fpCR= loss due to creep of concrete (ksi)
A.4 Prestress Loss Calculations for IT Beams
Elastic Shortening of Concrete (ES):
cires s
ci
fES K E
E
Kes= 1.0 for pretensioned members
1.5 ' 1.533 33 110 3500 2250ci cE w f ksi (ACI 318 2008)
Es= 28,500 ksi
cir cir cpi gf K f f
Kcir= 0.9 for pretensioned members
2484 484 3.86 1.7 12 3.860.9 2.20
256 12822 12822
2.201 28500 27.86
2250
cirf ksi
ES ksi
Creep of Concrete (CR):

102
scr cir cds
c
ECR K f f
E
Kcr= 1.6 for lightweight concrete
0
285001.6 2.2 0 37.26
2692
cdsf ksi
CR ksi
Shrinkage of Concrete (SH):
68.2 10 1 0.06 100sh ps
VSH K E RH
S
Ksh= 1.0 for pretensioned members
V/S= 2.87
RH= 65%
68.2 10 1 28500 1 0.06 2.87 100 65 6.8SH ksi
Relaxation of Tendons (RE):
5.0
0.04
1.0
5 0.04 6.8 37.26 27.86 1 2.12
re
re
L
RE K J SH CR ES C
K
J
C
RE ksi
Total Losses:
27.86 37.26 6.8 2.12 74.04
202.5 74.04 128se pj
TL
f f TL ksi
AASHTO Method
2pT pES pSR pCR pRf f f f f
Elastic Shortening (∆fpES):

103
2484 484 3.86 1.7 12 3.862.44
256 12822 12822
285002.44 30.99
2250
ppES cgp
ci
cgp
pES
Ef f
E
f ksi
f ksi
Shrinkage (∆fpSR):
17.0 0.150 0.65 7.25pSRf ksi
Creep (∆fpCR):
12.0 2.44 7.0 0 0
29.3
pCR
pCR
f
f ksi
Relaxation (∆fpR2):
2 20.0 0.4 30.99 0.2 7.25 29.3 0.3 0.09pRf ksi
Total Losses
30.99 7.25 29.3 0.09 67.63
198 67.63 130.37
pT
se
f ksi
f ksi
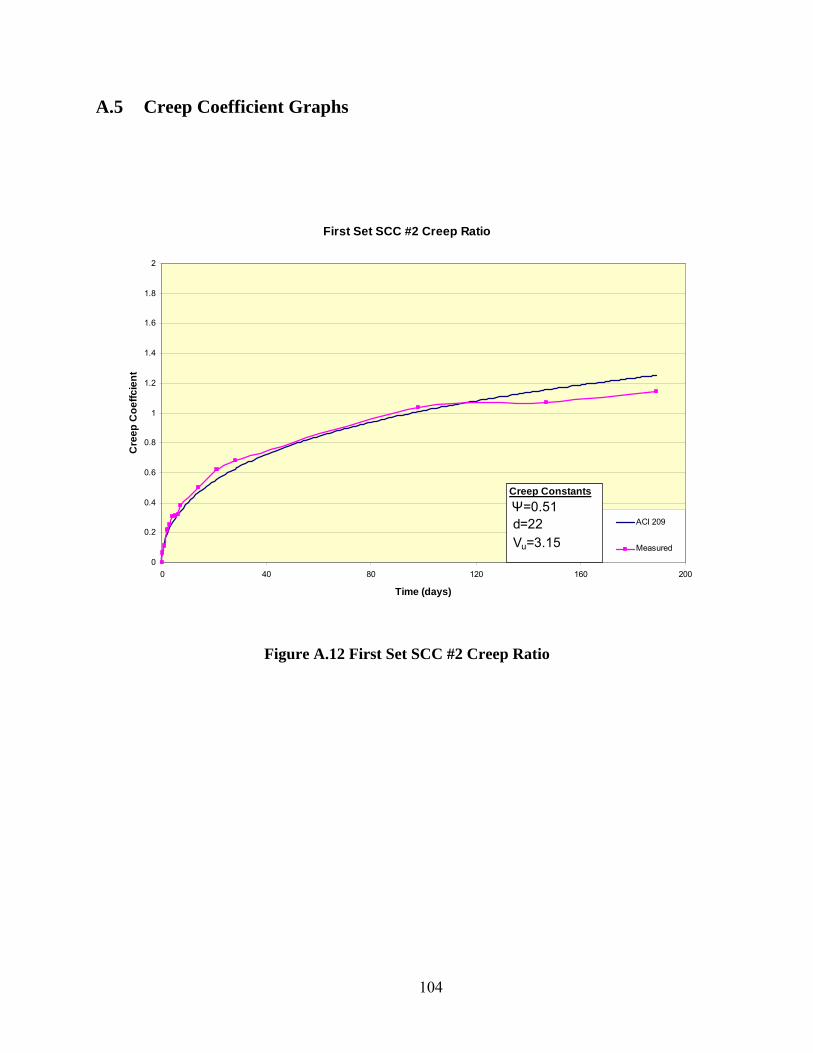
104
A.5 Creep Coefficient Graphs
First Set SCC #2 Creep Ratio
0
0.2
0.4
0.6
0.8
1
1.2
1.4
1.6
1.8
2
0 40 80 120 160 200
Time (days)
Cre
ep
Co
eff
cie
nt
ACI 209
Measured
Creep Constants
Ψ=0.51 d=22 Vu=3.15
Figure A.12 First Set SCC #2 Creep Ratio

105
Second Set Transfer Day SCC #2 Creep Ratio
0
0.5
1
1.5
2
2.5
0 40 80 120 160 200 240 280 320 360 400
Time (days)
Cre
ep
Co
eff
cie
nt
ACI 209
Measured
Creep Constants
Ψ=0.51 d=10.25 Vu=3.15
Figure A.13 Second Set SCC #2 Creep Ratio for Transfer Day
Second Set 28-Day SCC #2 Creep Ratio
0
0.2
0.4
0.6
0.8
1
1.2
1.4
1.6
1.8
0 40 80 120 160 200 240 280 320 360 400
Time (days)
Cre
ep
Co
eff
cie
nt
ACI 209
Measured
Creep Constants
Ψ=0.4 d=11 Vu=3.125
Figure A.14 Second Set SCC #2 Creep Ratio for 28-day
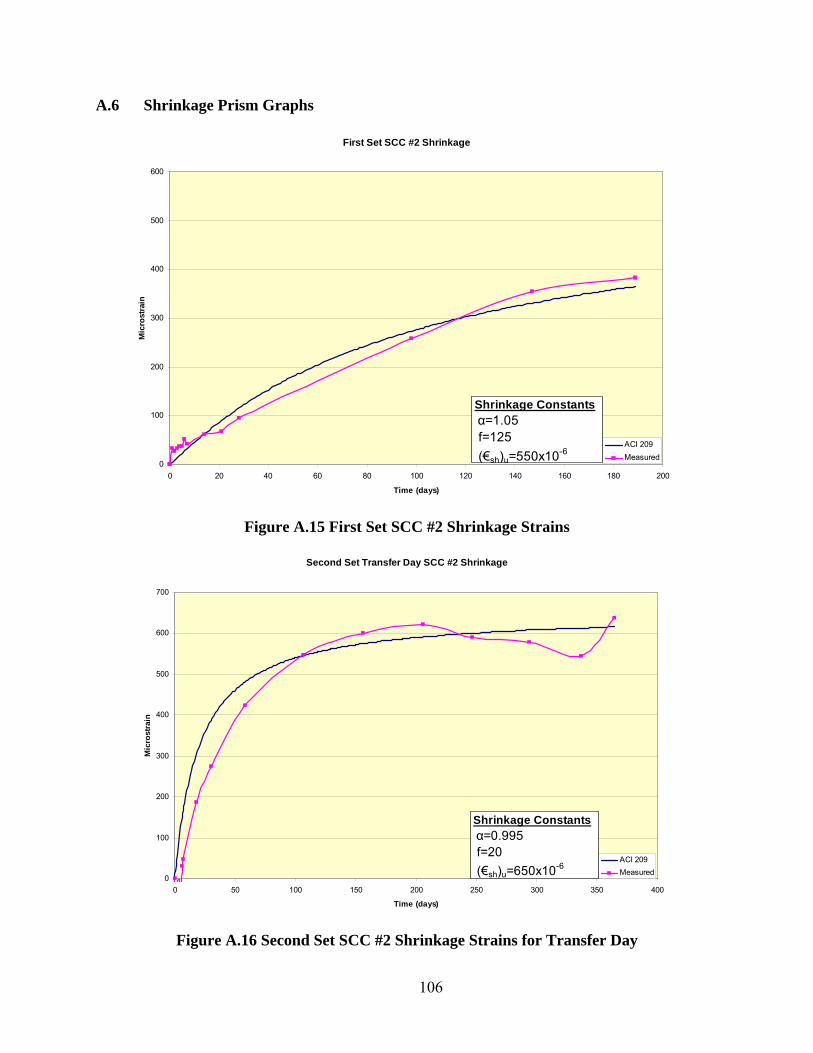
106
A.6 Shrinkage Prism Graphs
First Set SCC #2 Shrinkage
0
100
200
300
400
500
600
0 20 40 60 80 100 120 140 160 180 200
Time (days)
Mic
rost
rain
ACI 209
Measured
Shrinkage Constants α=1.05 f=125
(€sh)u=550x10-6
Figure A.15 First Set SCC #2 Shrinkage Strains
Second Set Transfer Day SCC #2 Shrinkage
0
100
200
300
400
500
600
700
0 50 100 150 200 250 300 350 400
Time (days)
Mic
rost
rain
ACI 209
Measured
Shrinkage Constants α=0.995 f=20
(€sh)u=650x10-6
Figure A.16 Second Set SCC #2 Shrinkage Strains for Transfer Day

107
Second Set 28-Day SCC #2 Shrinkage
0
100
200
300
400
500
600
0 50 100 150 200 250 300 350 400
Time (days)
Mic
rost
rain
ACI 209
Measured
Shrinkage Constants α=1.1 f=95
(€sh)u=525x10-6
Figure A.17 Second Set SCC #2 Shrinkage Strains for 28-day
A.7 ACI 209 Prestress Loss Equations and Calculations
1
2 1SH su u
u c c u sr uo s
EFnf nf v f
F n
where:
u total losses in ksi
n modular ratio, Es/Eci, at the time of loading
cf concrete stress such as at steel c.g.s due to prestress and precast beam dead load
uv ultimate creep coefficient
uF total ultimate (in time) loss of prestress minus the initial elastic loss
oF prestress force at transfer, after elastic loss
SH u ultimate (in time) shrinkage strain in (in./in.)

108
sE modulus of elasticity of steel
reinforcement ratio
s cross section shape coefficient
sr uf ultimate (in time) stress loss due to steel relaxation on prestressed members
Elastic shortening:
2
2
2850012.67
2250
484 484 3.86 1.7 12 3.862.44
256 12822 1282212.67 2.44 31.0
c
i i Dc
t t t
c
ES nf
n
F Fe M ef
A I I
f ksi
ES ksi
Creep:
12
2850010.58
26922.44
uc u
o
c
FCR nf v
F
n
f ksi
uiv 3.2 for CON and 3.17 for SCC
volume to surface correction:
Prisms: v/s=1 inch
v
s
prism =correction factor for v/s ratio from Table 2.5.5.2 (ACI Committee 209)
Beams: v/s=2.87 inch
v
s
beam =correction factor for v/s ratio from Table 2.5.5.2 (ACI Committee 209)
Creep 0.83
0.761.09
v
sv
vss
beam
prism
u v ui
s
v Creep v 2.432 for CON and 2.40 for SCC
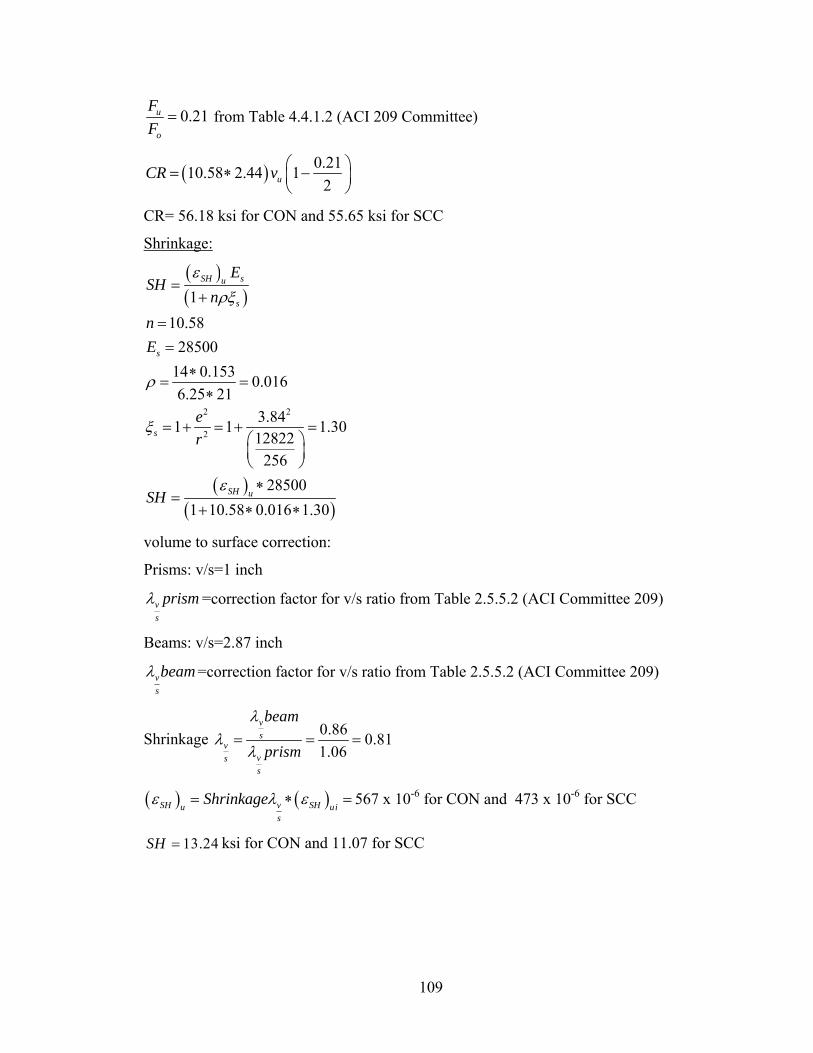
109
0.21u
o
F
F from Table 4.4.1.2 (ACI 209 Committee)
0.2110.58 2.44 1
2uCR v
CR= 56.18 ksi for CON and 55.65 ksi for SCC
Shrinkage:
2 2
2
1
10.58
28500
14 0.1530.016
6.25 21
3.841 1 1.30
12822256
28500
1 10.58 0.016 1.30
SH su
s
s
s
SH u
ESH
n
n
E
e
r
SH
volume to surface correction:
Prisms: v/s=1 inch
v
s
prism =correction factor for v/s ratio from Table 2.5.5.2 (ACI Committee 209)
Beams: v/s=2.87 inch
v
s
beam =correction factor for v/s ratio from Table 2.5.5.2 (ACI Committee 209)
Shrinkage 0.86
0.811.06
v
sv
vss
beam
prism
SH v SHu uis
Shrinkage 567 x 10-6 for CON and 473 x 10-6 for SCC
13.24SH ksi for CON and 11.07 for SCC

110
Relaxation:
sr uRE f
0.025sr siuf f from Table 4.4.1.3 (ACI 209 Committee)
0.025 198 4.95RE ksi
Total Losses:
CON:
31.0 56.18 13.24 4.95 105.37u ksi
SCC:
31.0 55.65 11.07 4.95 102.67u ksi
A.8 Shear Calculations for Single-Strand Flexure Beams
2
2
max
'
max
15
6
32.06
8 2
60.08 1532.06
8 29.94
9.940.08 6 5.45
2 2
2 2 0.85 5000 8 10 9.61
( )
test
test
D L N
FN
F
F
F
c c
c
L ft
a ft
M M M kip ft
P aw lM
P
P kips
PV w a kips
V f b d kips
V V OK

111
A.9 Nominal Moment Calculations for Single-Strand Flexure Beams
1
2 2
2
2
'
1
1750.00614
28,500
175 0.153 26.775
1 1 26.775 26.775 4
4074 96 1152
0.00016
: 267.5
0.153 267.51.20
0.85 0.85 5 8
1.21
0.8
se
p
e se ps
e e
c
ps
ps ps
c
f
E
P f A kips
P P e
E A I
Assume f ksi
A fa
f b
ac
3
.50
10 1.50.003 0.017
1.50.00614 0.00016 0.017 0.0233
pc
ps
d c
c
From curve in PCI Handbook (2004)
0.04270 267.5
0.007psps
f ksi
Equaled assumed value:
1.20.153 267.5 10 384.7 32.06
2 2n ps ps p
aM A f d kip in kip ft
A.10 Prestress Loss Calculations for Flexural Beams
Single-strand beams: PCI Method
Elastic Shortening of Concrete (ES):
cires s
ci
fES K E
E
Kes= 1.0 for pretensioned members
1.5 ' 1.533 33 110 3500 2250ci cE w f ksi (ACI 318 2008)
Es= 28,500 ksi
cir cir cpi gf K f f

112
Kcir= 0.9 for pretensioned members
231 31 4 1.32 12 40.9 0.623
96 1152 1152
0.6231 28500 7.89
2250
cirf ksi
ES ksi
Creep of Concrete (CR):
scr cir cds
c
ECR K f f
E
Kcr= 1.6 for lightweight concrete
0
285001.6 0.623 0 10.552
2692
cdsf ksi
CR ksi
Shrinkage of Concrete (SH):
68.2 10 1 0.06 100sh ps
VSH K E RH
S
Ksh= 1.0 for pretensioned members
V/S= 2.4
RH= 65%
68.2 10 1 28500 1 0.06 2.4 100 65 7SH ksi
Relaxation of Tendons (RE):
1
5.0
0.04
1.0
5 0.04 7 10.55 7.89 1 3.98
log 24 log 240.55 1.60
45
re
re
L
sti st
py
RE K J SH CR ES C
K
J
C
RE ksi
ft tRE f ksi
f
Total Losses:
@
202.5 7.89 1.6 193
202.5 7.89 10.55 7.0 3.98 173.03
175
si pj i
se pj L
se test
f f ES RE ksi
f f ES CR SH RE ksi
f ksi
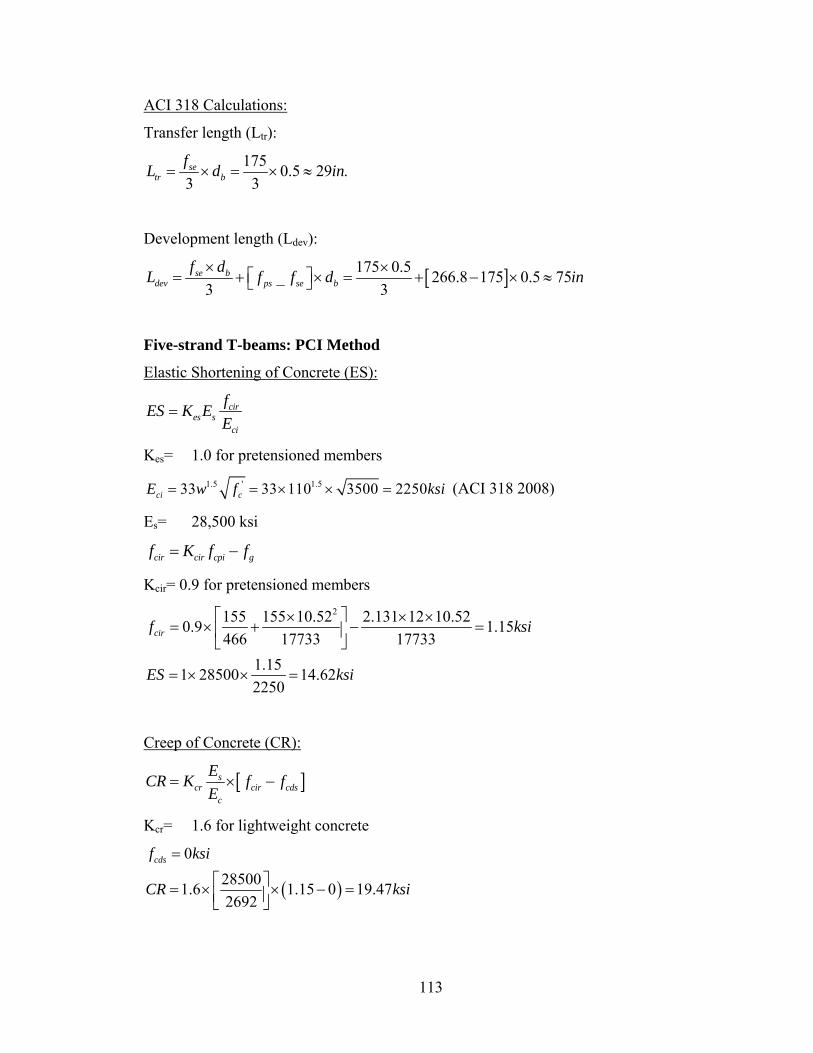
113
ACI 318 Calculations:
Transfer length (Ltr):
1750.5 29 .
3 3se
tr b
fL d in
Development length (Ldev):
175 0.5_ 266.8 175 0.5 75
3 3se b
dev ps se b
f dL f f d in
Five-strand T-beams: PCI Method
Elastic Shortening of Concrete (ES):
cires s
ci
fES K E
E
Kes= 1.0 for pretensioned members
1.5 ' 1.533 33 110 3500 2250ci cE w f ksi (ACI 318 2008)
Es= 28,500 ksi
cir cir cpi gf K f f
Kcir= 0.9 for pretensioned members
2155 155 10.52 2.131 12 10.520.9 1.15
466 17733 17733
1.151 28500 14.62
2250
cirf ksi
ES ksi
Creep of Concrete (CR):
scr cir cds
c
ECR K f f
E
Kcr= 1.6 for lightweight concrete
0
285001.6 1.15 0 19.47
2692
cdsf ksi
CR ksi
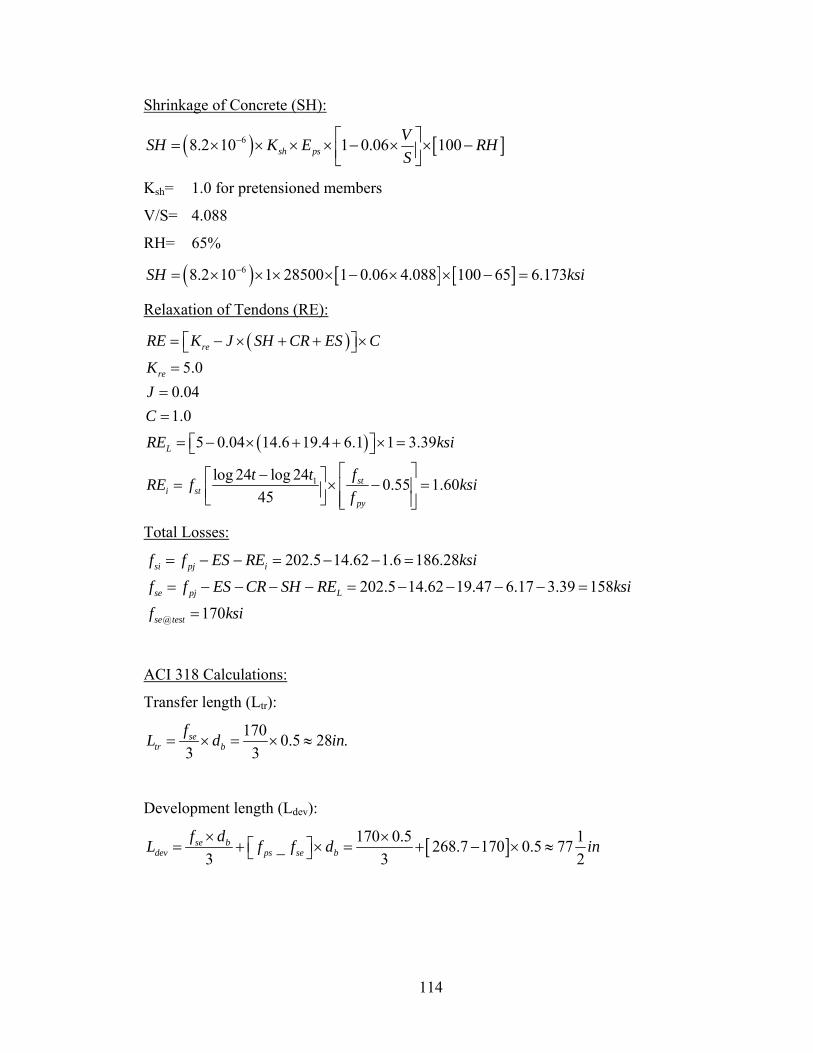
114
Shrinkage of Concrete (SH):
68.2 10 1 0.06 100sh ps
VSH K E RH
S
Ksh= 1.0 for pretensioned members
V/S= 4.088
RH= 65%
68.2 10 1 28500 1 0.06 4.088 100 65 6.173SH ksi
Relaxation of Tendons (RE):
1
5.0
0.04
1.0
5 0.04 14.6 19.4 6.1 1 3.39
log 24 log 240.55 1.60
45
re
re
L
sti st
py
RE K J SH CR ES C
K
J
C
RE ksi
ft tRE f ksi
f
Total Losses:
@
202.5 14.62 1.6 186.28
202.5 14.62 19.47 6.17 3.39 158
170
si pj i
se pj L
se test
f f ES RE ksi
f f ES CR SH RE ksi
f ksi
ACI 318 Calculations:
Transfer length (Ltr):
1700.5 28 .
3 3se
tr b
fL d in
Development length (Ldev):
170 0.5 1_ 268.7 170 0.5 77
3 3 2se b
dev ps se b
f dL f f d in

115
A.11 Nominal Moment Calculations for T-Beam Specimens
1
2 2
2
2
'
1700.005965
28,500
170 0.153 5 130.05
1 1 130.05 130.05 10.52
4074 466 17733
0.000268
: 268.7
0.153 5 268.71.34
0.85 0.85 5 36
se
p
e se ps
e e
c
ps
ps ps
c
f
E
P f A kips
P P e
E A I
Assume f ksi
A fa
f b
c
1
3
1.341.68
0.8
10 1.680.003 0.0309
1.680.005965 0.000268 0.0309 0.0371
pc
ps
a
d c
c
From curve in PCI Handbook (2004)
0.04270 268.7
0.007psps
f ksi
Equaled assumed value:
1.340.153 5 268.7 19 3767 313.9
2 2n ps ps p
aM A f d kip in kip ft