Embed Size (px)
Citation preview
Dartmouth CollegeDartmouth Digital Commons
ENGS 86 Independent Projects (AB Students) Thayer School of Engineering Project Class Reports
Spring 6-4-2019
Evaluating the Potential for Renewable EnergyTechnology at US Ski ResortsTyler [email protected]
Follow this and additional works at: https://digitalcommons.dartmouth.edu/engs86
Part of the Other Engineering Commons
This Report is brought to you for free and open access by the Thayer School of Engineering Project Class Reports at Dartmouth Digital Commons. Ithas been accepted for inclusion in ENGS 86 Independent Projects (AB Students) by an authorized administrator of Dartmouth Digital Commons. Formore information, please contact [email protected].
Recommended CitationFarrell, Tyler, "Evaluating the Potential for Renewable Energy Technology at US Ski Resorts" (2019). ENGS 86 Independent Projects(AB Students). 2.https://digitalcommons.dartmouth.edu/engs86/2
Evaluating the Potential for Renewable Energy Technology at US Ski Resorts
by
Tyler Farrell
Bachelor of Engineering Independent Project
Thayer School of Engineering Dartmouth College
Hanover, New Hampshire
Date_____________________________ Approved:__________________________ Advisor’s Signature _________________________________
Signature of Author
Final PaperSubmitted in partial fulfillment of the requirements for
ENGS 86: Independent Project
Evaluating the Potential for Renewable Energy Technology atUS Ski Resorts
June 4, 2019
Tyler Farrell
Thayer School of Engineering at Dartmouth
Project Advisor
Professor Mark Laser
1
ENGS 86 Tyler Farrell
Abstract
The ski industry is one of the most at risk industries as a result of climate change.
Warming temperatures and decreasing snowfall are contributing to a decline in skier
visitations, shorter seasons, and higher energy costs. Currently, only 3 of 478 ski re-
sorts in the United States rely on 100% renewable energy sources. The intent of this
paper is to understand what the issues and barriers are to renewable energy develop-
ment at ski resorts, and what technologies are feasible and appropriate for this industry
to develop. While the renewable energy industry faces many issues and barriers, the
ski industry faces its own unique set of financial, land, and community barriers to
implementing renewable alternatives. However, this study finds that three renewable
technologies (solar, wind, and hydropower) are feasible and appropriate for ski resorts
to implement with considerations to be taken in context of the environment, state poli-
cies, and natural resources. Renewable energy development is an option for every ski
resort; however there is not a one-size-fits-all solution. Overall, there is an opportu-
nity for ski resorts or a third party to take the lead on renewable development. The ski
industry can show that it is possible and that nationally we all must transition.
Page i

ENGS 86 Tyler Farrell
Acknowledgements
I would like to thank Professor Mark Laser for being an amazing advisor to this project
and a teacher who has inspired me throughout the year in coursework and beyond. His depth
of knowledge in renewable energy and encouragement throughout the process has been invalu-
able. I would also like to thank my family and friends for their help and support.
Furthermore, I would like to thank Jim Farrell at Berkshire East and Jim Van Dyke at
Jiminy Peak for their time and ideas for this project. Both of them and their ski resorts are
inspiring for being so far ahead of the curve in renewable energy development and helping
make our future a greener one.
Page ii
ENGS 86 Tyler Farrell
ContentsI Overview 1
I.1 Background . . . . . . . . . . . . . . . . . . . . . . . . . . . . . . . . . . . . . . 1I.2 Ski Industry Overview . . . . . . . . . . . . . . . . . . . . . . . . . . . . . . . . 2I.3 Ski Industry Energy Consumption . . . . . . . . . . . . . . . . . . . . . . . . . . 3I.4 Problem Statement . . . . . . . . . . . . . . . . . . . . . . . . . . . . . . . . . . 4
II Issues and Barriers 5II.1 Land Use Issues . . . . . . . . . . . . . . . . . . . . . . . . . . . . . . . . . . . . 5
II.1.A Federal National Forest Service Land . . . . . . . . . . . . . . . . . . . . 5II.1.B State Land . . . . . . . . . . . . . . . . . . . . . . . . . . . . . . . . . . 6II.1.C Private Land . . . . . . . . . . . . . . . . . . . . . . . . . . . . . . . . . 6
II.2 Financing Issues . . . . . . . . . . . . . . . . . . . . . . . . . . . . . . . . . . . . 7II.2.A Ski Resort Business Climate . . . . . . . . . . . . . . . . . . . . . . . . . 7II.2.B Ski Resort PPAs . . . . . . . . . . . . . . . . . . . . . . . . . . . . . . . 8II.2.C Ski Resort Self-Financing . . . . . . . . . . . . . . . . . . . . . . . . . . 8II.2.D Self Financing Compared to PPAs . . . . . . . . . . . . . . . . . . . . . . 9II.2.E Ski Resort Community Financing . . . . . . . . . . . . . . . . . . . . . . 9
II.3 Social and Community Issues . . . . . . . . . . . . . . . . . . . . . . . . . . . . . 10II.4 State and Federal Renewable Energy Policy . . . . . . . . . . . . . . . . . . . . . 10
III Technology and Resources 12III.1 Solar . . . . . . . . . . . . . . . . . . . . . . . . . . . . . . . . . . . . . . . . . . 12
III.1.A Current Technology . . . . . . . . . . . . . . . . . . . . . . . . . . . . . 12III.1.B Tracking Considerations . . . . . . . . . . . . . . . . . . . . . . . . . . . 13III.1.C Future Technology . . . . . . . . . . . . . . . . . . . . . . . . . . . . . . 14III.1.D Resources . . . . . . . . . . . . . . . . . . . . . . . . . . . . . . . . . . . 15III.1.E Issues and Considerations . . . . . . . . . . . . . . . . . . . . . . . . . . 16III.1.F Generation-Consumption Match . . . . . . . . . . . . . . . . . . . . . . . 17III.1.G Economics . . . . . . . . . . . . . . . . . . . . . . . . . . . . . . . . . . 19
III.2 Wind . . . . . . . . . . . . . . . . . . . . . . . . . . . . . . . . . . . . . . . . . . 19III.2.A Current Technology . . . . . . . . . . . . . . . . . . . . . . . . . . . . . 19III.2.B Future Technology . . . . . . . . . . . . . . . . . . . . . . . . . . . . . . 21III.2.C Resource . . . . . . . . . . . . . . . . . . . . . . . . . . . . . . . . . . . 21III.2.D Issues and Considerations . . . . . . . . . . . . . . . . . . . . . . . . . . 22III.2.E Economics . . . . . . . . . . . . . . . . . . . . . . . . . . . . . . . . . . 23
Page iii
ENGS 86 Tyler Farrell
III.3 Hydro . . . . . . . . . . . . . . . . . . . . . . . . . . . . . . . . . . . . . . . . . 23III.3.A Current Technology . . . . . . . . . . . . . . . . . . . . . . . . . . . . . 24III.3.B Future Technology . . . . . . . . . . . . . . . . . . . . . . . . . . . . . . 25III.3.C Resources . . . . . . . . . . . . . . . . . . . . . . . . . . . . . . . . . . . 25III.3.D Issues and Considerations . . . . . . . . . . . . . . . . . . . . . . . . . . 25III.3.E Generation-Consumption Match . . . . . . . . . . . . . . . . . . . . . . . 26III.3.F Economics . . . . . . . . . . . . . . . . . . . . . . . . . . . . . . . . . . 28
IV Economics and Market Analysis 30IV.1 East Coast Example: Cranmore Mountain Resort NH . . . . . . . . . . . . . . . . 31IV.2 West Coast Example: Big Sky Resort MT . . . . . . . . . . . . . . . . . . . . . . 33
V Conclusion 38V.1 Conclusion for Ski Resorts . . . . . . . . . . . . . . . . . . . . . . . . . . . . . . 38V.2 Conclusion for Skiers and Snowboarders . . . . . . . . . . . . . . . . . . . . . . . 38
Appendices 45Appendix A Financing Calculations . . . . . . . . . . . . . . . . . . . . . . . . . . . 45Appendix B LCOE Calculations . . . . . . . . . . . . . . . . . . . . . . . . . . . . 46B.1 Solar . . . . . . . . . . . . . . . . . . . . . . . . . . . . . . . . . . . . . . . . . . 46B.2 Wind . . . . . . . . . . . . . . . . . . . . . . . . . . . . . . . . . . . . . . . . . . 46B.3 Hydro . . . . . . . . . . . . . . . . . . . . . . . . . . . . . . . . . . . . . . . . . 47
Page iv
ENGS 86 Tyler Farrell
I Overview
I.1 Background
The ski industry is at a crossroads. Ski lifts and the accompanying infrastructure primarilyrely on fossil fuels and electricity generated from fossil fuels. A study by the National Ski AreasAssociation found that 24 of the most environmentally conscious ski resorts1 emitted 167,251MTCO2e in the 2018 [1], equivalent to the emissions for 20,000 American homes. These emissionsare part of the overarching problem of climate change which is undermining the industry’s future[2].
However, ski resorts have the opportunity to implement renewable energy solutions. To-day, three resorts are 100% renewable; Jiminy Peak in Hancock, MA runs on a 1.5 MW windturbine and a handful of solar farms; Berkshire East in Charlemont, MA runs on a 900 kW windturbine and a 500 kW solar farm; Wolf Creek Ski Area in Pagosa Springs, CO runs on a 2.75 MWcommunity solar farm. Furthermore, there are many reasons for ski resorts to implement renewabletechnology.
First, Ski resorts are susceptible to the cost of energy and are bulk buyers of electricity. Ininterviews with Jiminy Peak and Berkshire East, the primary reason why they developed renewableresources was to hedge against rising utility costs and have better control of their operating costs.Energy costs are typically the second biggest operating expense after labor [3], traditionally 10%to 30% of the total operating budget. Snow making greatly increases these costs with operatingcosts ballooning from $2,000 a day to $30,000 to $40,000 a day for a mid size resort [4]. Warmingtemperatures will require resorts to rely more heavily on snow making. Already 91% of ski resortsrely on snow making at some point in the season [5]. Renewable energy help control operatingcosts for ski resorts in a warmer future.
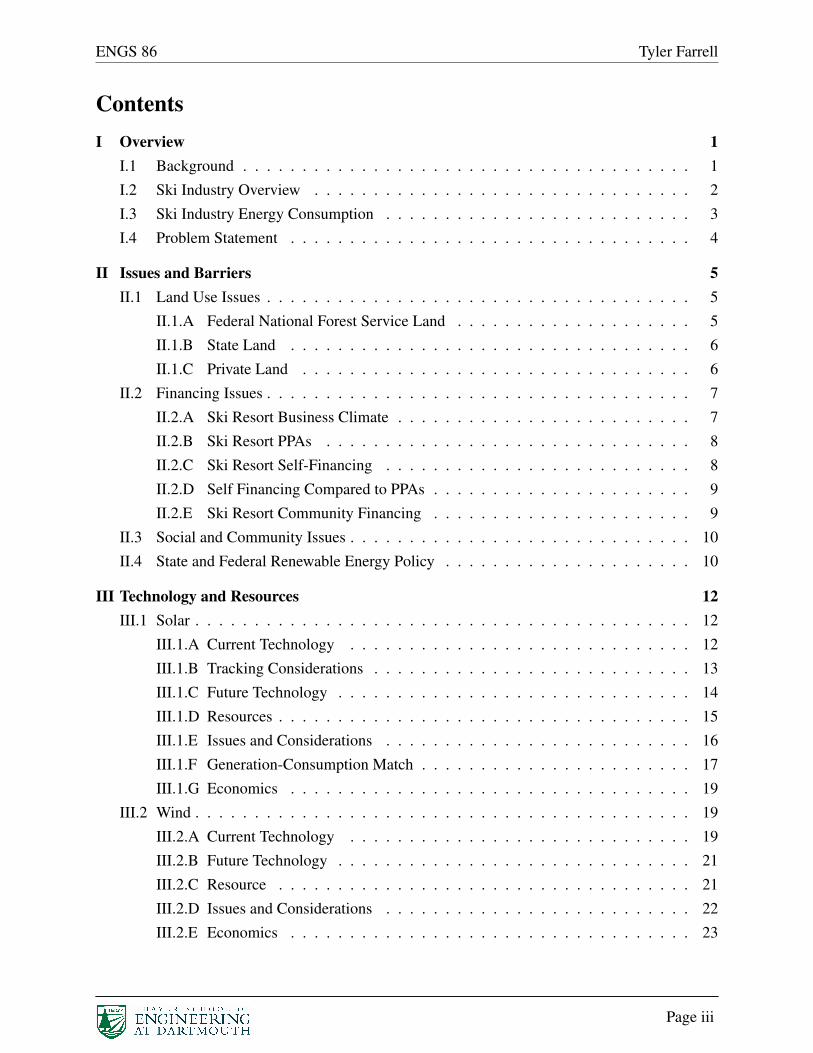
Second, ski resorts are on the front line of climate change. Warmer winter temperaturesand reduced snowfall will shorten ski seasons and reduce skier visitations. These impacts will beacute by 2050; in Figure 1, the percent change in ski season length can be found for selected resortsacross the country. An economics study by Protect our Winters, a non-profit organization climateadvocacy group for winter sports, found that changes in the winter season caused by climate changewere costing the ski industry approximately $1.07 billion in aggregated revenue over high and lowsnow years in the past decade [6]. It stand to be one of the most highly impacted industries in theworld. This makes the shift towards green energy ever more important.
Third, ski resort customers value green renewable energy. Jiminy Peak saw this in cus-tomer satisfaction surveys in the seasons after building their wind turbine. Additionally, a compre-
1These 24 environmentally conscious resorts are part of the sustainable slopes initiative by the NSAA which helpsski resorts pursue energy efficiency and carbon reduction.
Page 1
ENGS 86 Tyler Farrell
hensive study in Europe found that skiers react positively towards renewable energy and environ-mental projects at ski resorts [7]. A similar study in Oregon found that skiers were more likely toreturn to a ski resort if they knew about the environmental programs going on at the resort [8].
Finally, ski resorts suffer from power reliability issues resulting from severe winter storms,which renewable energy plus storage can solve through grid islanding. Although there is no quan-titative data on power outages for ski resorts, it is a costly problem [9]. Most ski resorts are locatedin remote areas where it could take hours to repair transmission lines. These are valuable hoursand wasted days for a ski resort operating on a short 100- to 200-day season. Storage may notbe a cost-effective solution now; however, Berkshire East and Squaw Valley are both set to installTesla Power Packs for their respective resorts in the next two years. This will both optimize theirrenewable off take and increase resilience.
Figure 1: This figure illustrates the impacts of the IPCC RCP 4.5 scenario on ski season length in2050. [10].
I.2 Ski Industry Overview
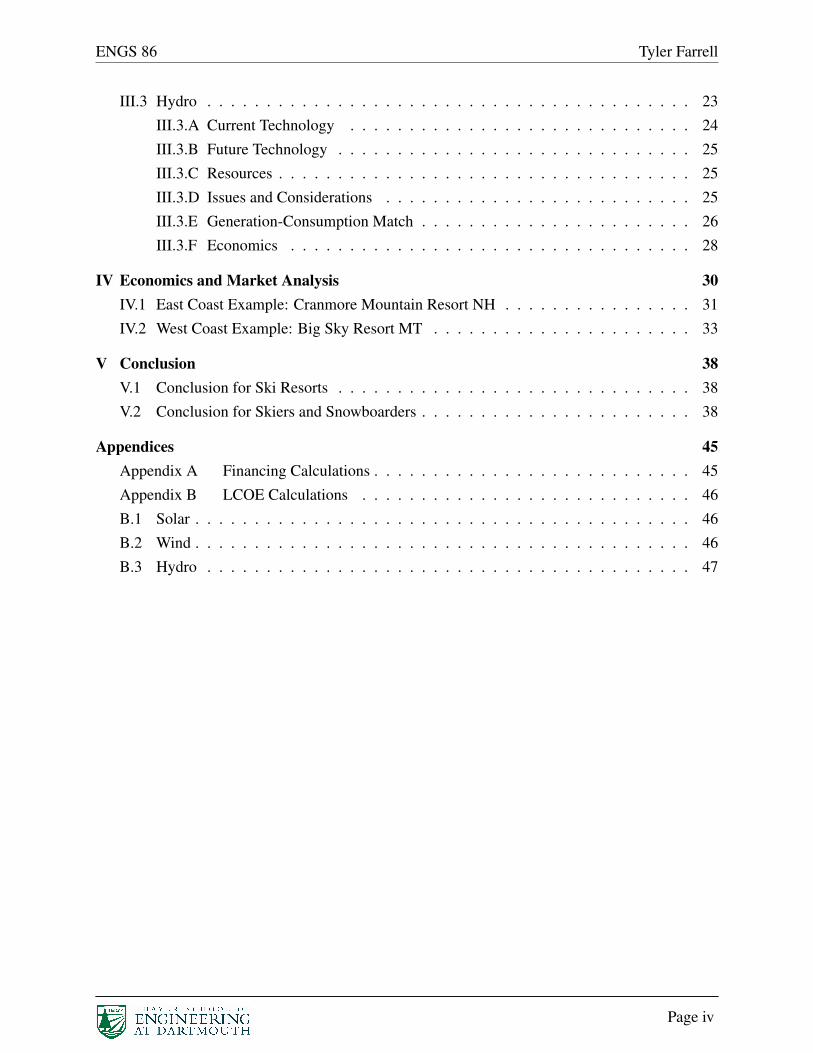
In the US, the ski industry is made up of 478 ski resorts spread across 40 states, seeFigure 2. In 2015-2016, skiers participated in a total of 52.8 million skiing and snowboarding days
Page 2
ENGS 86 Tyler Farrell
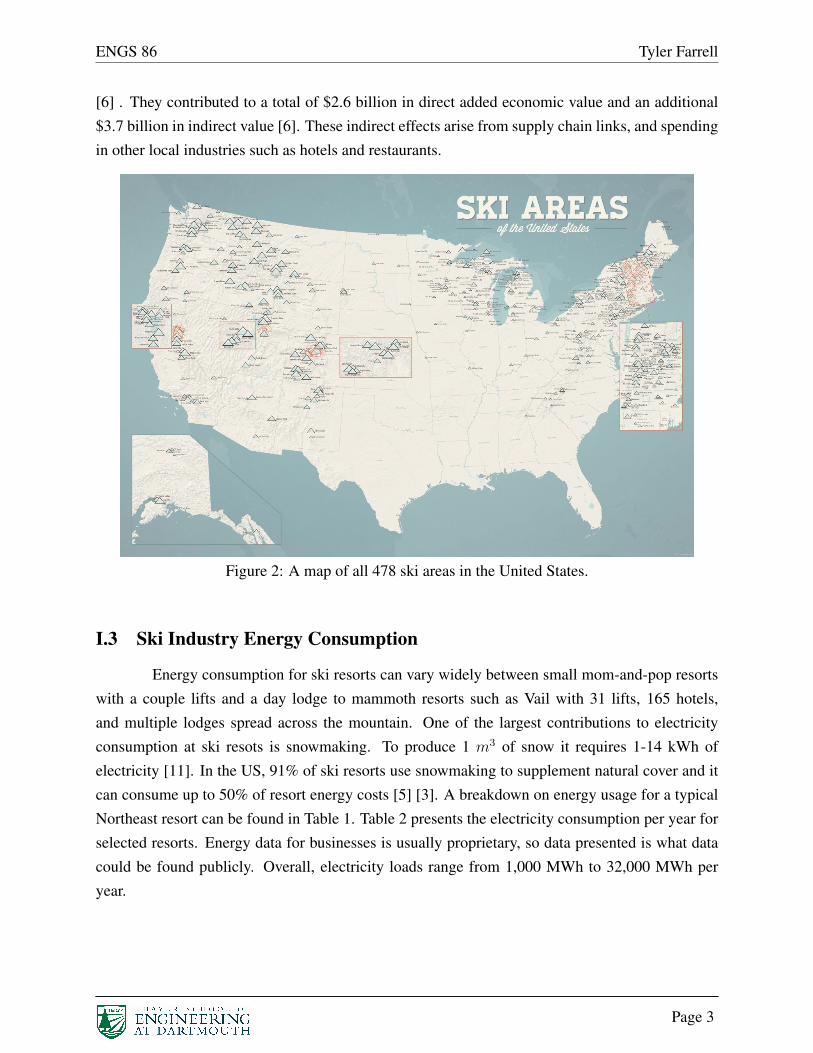
[6] . They contributed to a total of $2.6 billion in direct added economic value and an additional$3.7 billion in indirect value [6]. These indirect effects arise from supply chain links, and spendingin other local industries such as hotels and restaurants.
Figure 2: A map of all 478 ski areas in the United States.
I.3 Ski Industry Energy Consumption
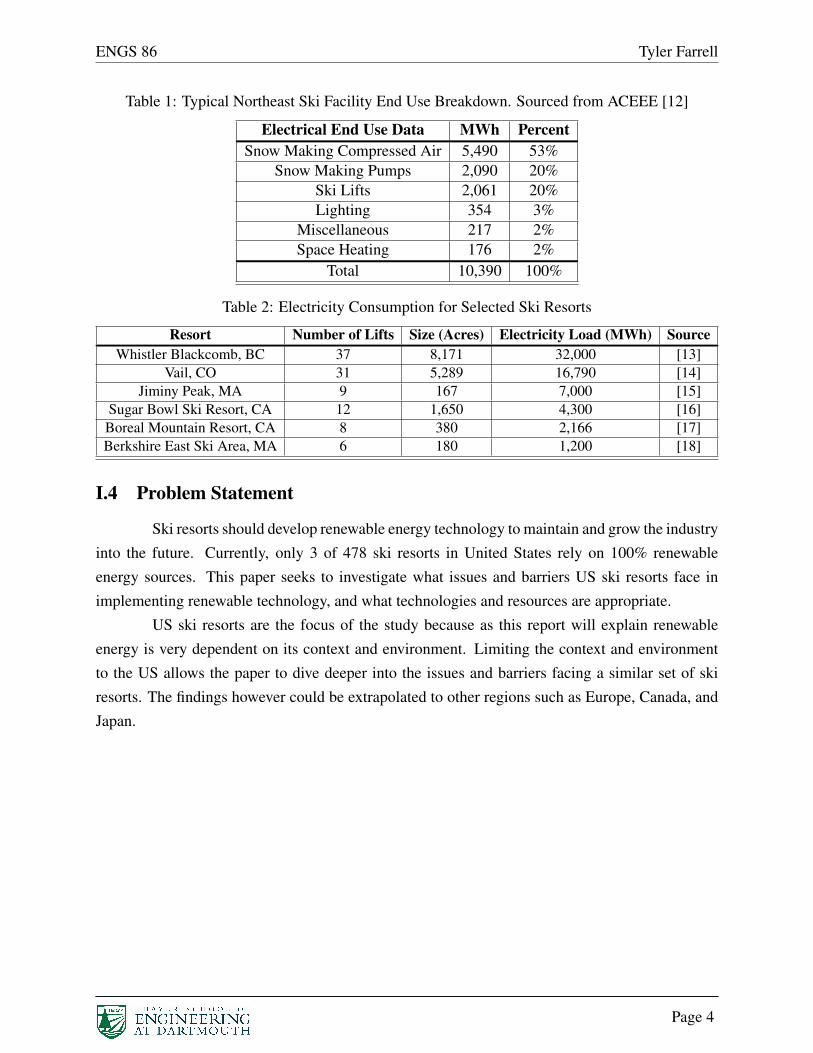
Energy consumption for ski resorts can vary widely between small mom-and-pop resortswith a couple lifts and a day lodge to mammoth resorts such as Vail with 31 lifts, 165 hotels,and multiple lodges spread across the mountain. One of the largest contributions to electricityconsumption at ski resots is snowmaking. To produce 1 m3 of snow it requires 1-14 kWh ofelectricity [11]. In the US, 91% of ski resorts use snowmaking to supplement natural cover and itcan consume up to 50% of resort energy costs [5] [3]. A breakdown on energy usage for a typicalNortheast resort can be found in Table 1. Table 2 presents the electricity consumption per year forselected resorts. Energy data for businesses is usually proprietary, so data presented is what datacould be found publicly. Overall, electricity loads range from 1,000 MWh to 32,000 MWh peryear.
Page 3
ENGS 86 Tyler Farrell
Table 1: Typical Northeast Ski Facility End Use Breakdown. Sourced from ACEEE [12]
Electrical End Use Data MWh PercentSnow Making Compressed Air 5,490 53%
Snow Making Pumps 2,090 20%Ski Lifts 2,061 20%Lighting 354 3%
Miscellaneous 217 2%Space Heating 176 2%
Total 10,390 100%
Table 2: Electricity Consumption for Selected Ski Resorts
Resort Number of Lifts Size (Acres) Electricity Load (MWh) SourceWhistler Blackcomb, BC 37 8,171 32,000 [13]
Vail, CO 31 5,289 16,790 [14]Jiminy Peak, MA 9 167 7,000 [15]
Sugar Bowl Ski Resort, CA 12 1,650 4,300 [16]Boreal Mountain Resort, CA 8 380 2,166 [17]Berkshire East Ski Area, MA 6 180 1,200 [18]
I.4 Problem Statement
Ski resorts should develop renewable energy technology to maintain and grow the industryinto the future. Currently, only 3 of 478 ski resorts in United States rely on 100% renewableenergy sources. This paper seeks to investigate what issues and barriers US ski resorts face inimplementing renewable technology, and what technologies and resources are appropriate.
US ski resorts are the focus of the study because as this report will explain renewableenergy is very dependent on its context and environment. Limiting the context and environmentto the US allows the paper to dive deeper into the issues and barriers facing a similar set of skiresorts. The findings however could be extrapolated to other regions such as Europe, Canada, andJapan.
Page 4
ENGS 86 Tyler Farrell
II Issues and Barriers
This section will discuss the unique issues and barriers to ski resorts considering renew-able energy development including land use issues, financing issues, social and community issues,and state and federal renewable energy policy.
II.1 Land Use Issues
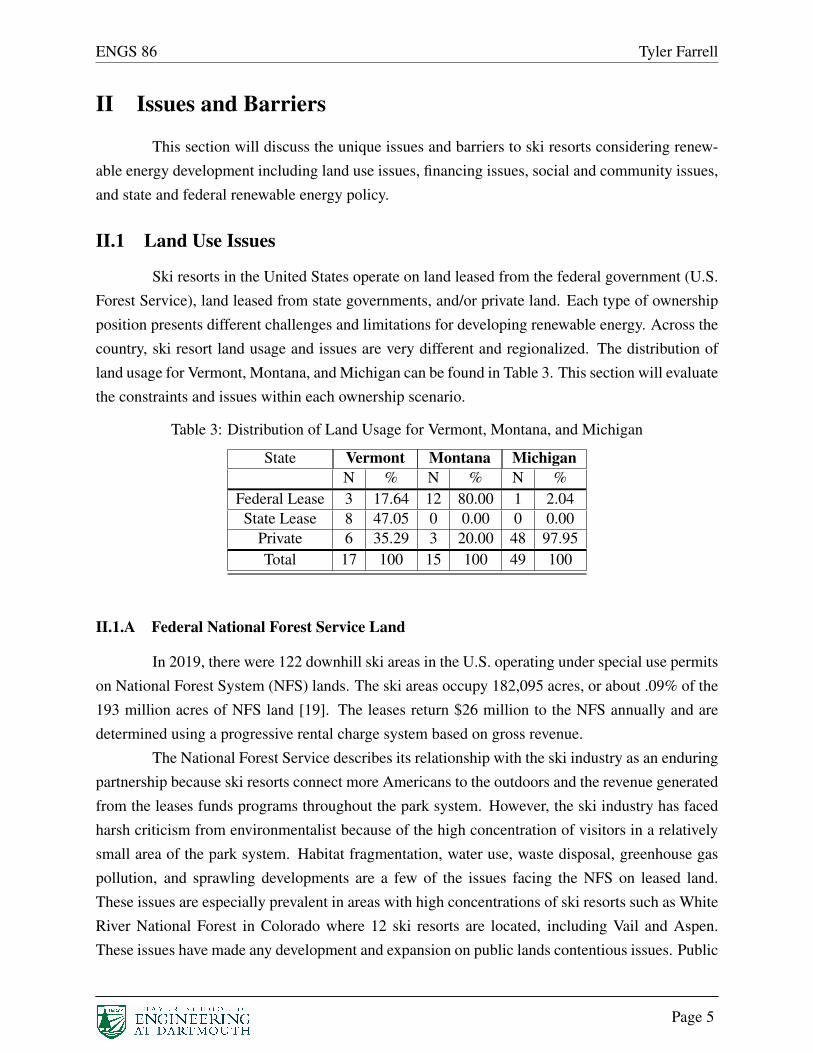
Ski resorts in the United States operate on land leased from the federal government (U.S.Forest Service), land leased from state governments, and/or private land. Each type of ownershipposition presents different challenges and limitations for developing renewable energy. Across thecountry, ski resort land usage and issues are very different and regionalized. The distribution ofland usage for Vermont, Montana, and Michigan can be found in Table 3. This section will evaluatethe constraints and issues within each ownership scenario.
Table 3: Distribution of Land Usage for Vermont, Montana, and Michigan
State Vermont Montana MichiganN % N % N %
Federal Lease 3 17.64 12 80.00 1 2.04State Lease 8 47.05 0 0.00 0 0.00
Private 6 35.29 3 20.00 48 97.95Total 17 100 15 100 49 100
II.1.A Federal National Forest Service Land
In 2019, there were 122 downhill ski areas in the U.S. operating under special use permitson National Forest System (NFS) lands. The ski areas occupy 182,095 acres, or about .09% of the193 million acres of NFS land [19]. The leases return $26 million to the NFS annually and aredetermined using a progressive rental charge system based on gross revenue.
The National Forest Service describes its relationship with the ski industry as an enduringpartnership because ski resorts connect more Americans to the outdoors and the revenue generatedfrom the leases funds programs throughout the park system. However, the ski industry has facedharsh criticism from environmentalist because of the high concentration of visitors in a relativelysmall area of the park system. Habitat fragmentation, water use, waste disposal, greenhouse gaspollution, and sprawling developments are a few of the issues facing the NFS on leased land.These issues are especially prevalent in areas with high concentrations of ski resorts such as WhiteRiver National Forest in Colorado where 12 ski resorts are located, including Vail and Aspen.These issues have made any development and expansion on public lands contentious issues. Public
Page 5
ENGS 86 Tyler Farrell
criticism and extensive litigation has defined most development of ski resorts since the 1990s [20]and would most likely face ski resorts in developing renewable energy.
So far no ski area located on NFS land has developed on-site renewable energy. Aftertalking with the NFS, there would be regulatory and permitting barriers similar to other ski areadevelopment projects. However, there is no steadfast barrier to implementing renewables on leasedland. In fact, the NFS, in conjunction with NREL, has extensively studied the renewable potentialon National Forest and Grassland units [21]. Their findings were that 119 National Forest unitshave high potential for solar and wind power production. This includes units with high concen-trations of ski resorts such as Arapaho-Roosevelt National Forest (8,245 MW) and White RiverNational Forest (318 MW).
Overall, on NFS leased land there are high barriers to on site development due to publiccriticism, regulatory issues, and extensive litigation. However, the NFS is interested in the potentialfor renewables on their land. The development of each project will have to weigh the risks andlimitations of the development process with the gains of renewable energy for on-site development.
II.1.B State Land
In some states, ski resorts lease state-owned land through a department of parks and recre-ation. A notable example of this is Vermont where almost half of all ski resorts lease land fromthe state of Vermont. The leases are structured similarly to federal leases with a portion of thegross revenue going towards the state. State land endures similar environmental consequences toland leased by the NFS and subsequently any development is highly critiqued by the state and thepublic. Overall, barriers to renewable energy development are likely to be similar to developmentson federal land; however, this will vary from state to state.
II.1.C Private Land
Ski areas operating on private land have lower barriers for development. Depending on thestate, and municipality development requires a building permits and other red tape but otherwiseis a fairly simple process. Both Jiminy Peak and Berkshire East developed on private land, hadsimilar experiences with permits. Some issues with the permitting process and the community andsocial barriers will be discussed in section Section II.3.
It is also important to understand that there are a number of resorts where the resort’s landis partially on private land and partially on state or federal land. In this case, it is common that thebase area is privately owned and the runs are on state or federal land.
Page 6
ENGS 86 Tyler Farrell
II.2 Financing IssuesII.2.A Ski Resort Business Climate
The ski industry is facing major challenges including an aging and declining customerbase, a infrastructure, and climate change. Furthermore, it is undergoing a transition away fromlocal small and medium ski resorts towards mega conglomerates such as Vail’s Epic Pass andAlterra’s Ikon Pass [22]. Bill Jensen, a former Vail execuitive and CEO of Intrawest, categorizedthe US’s 470 resorts into 5 tiers:1. Uber (10)2. Alpha (35)3. Status Quo (125)4. Survivor (150)5. Sunset (150)The Vail and Alterra conglomerates make up a majority of the uber and alpha tier. These resortscombine for less than 10% of ski resorts but generate over 40% of all ski business. The status quoand survivor resorts are small and medium independent resorts. Jensen predicts that these resortswill continue on for the next few decade but have flat revenue. Additionally, he says that sunsetresorts are expected to close in the coming years due to declining revenue, reliance on naturalsnow, and limited tourist traffic [23]. Small resorts have been in this predicament for a very longtime with 76 resorts closing since 1991.
All of this echos what I heard from people in the industry. Most small- and medium-sizedski resorts in the Status Quo and lower tiers do not have the financial capital to spend money andwill continue to operate as ”status quo”.
On the other hand, Uber and Alpha resorts are primed for large investment. In the pastdecade the Vail Resorts corporation has invested $1.2 billion into their ski resorts and will invest$175 to $180 million in the 2019/2020 ski season alone [24]. These investments include chairlifts,snowmaking infrastructure, restaurants, and lodging.
Resorts in each tier will require different financing models to develop commercial scaleprojects depending on their financial considerations. Commercial scale projects are projects whereelectricity off take is going to a commercial consumer. There are two predominate financing strate-gies used in the US renewable energy industry, Power Purchase Agreements (PPAs) and self pur-chase. A third strategy for developing renewable energy is community scale projects, which arerenewable facilities shared by multiple community subscribers. Many of the insights below weredrawn from discussions with ski industry experts and a technical report from the National Renew-able Energy Laboratory [25]. A full quantitative analysis of financing for ski resorts would requireproprietary data and therefore this analysis was limited to insights gathered.
Page 7
ENGS 86 Tyler Farrell
II.2.B Ski Resort PPAs
A Power Purchase Agreement (PPA) is a contract for the purchase of power and associ-ated renewable energy certificates from a specific renewable energy generator to a purchaser ofrenewable electricity. The agreements typically spans 10 to 20 years and can carry many terms.It allows the developer to secure long-term financing and build the project. The customer agreesto purchase the power at a set price over the span of the contract with a price escalator. Today,both the price and price escalator are typically below the default utility supplier [26]. The physicalrenewable energy generation can be located on or off site with the electricity being delivered bythe grid to the buyer. At the end of the contract, the buyer can either sign a new agreement withthe seller or purchase the system [27]. PPAs with corporations are widely used in the renewableenergy industry. In 2018, 6.43 GW of PPAs were signed by non-utility buyers [26]. Many of thesebuyers are similar to ski resorts in that they are energy-intensive customers switching their loadsfrom fossil fuels and the grid to renewables.
For ski resorts, especially ”status quo” tier and below, PPAs enable them to clear potentialfinancial hurdles involved with self-financing. Unlike purchases of renewable energy systems,PPAs are off-balance sheet transactions which suits ski resorts with low capital and high debtto equity ratios, as it allows them to circumvent the liability of a loan on their balance sheet.The biggest challenge is guaranteeing the off-take of the power for 10 to 20 years. For manysunset resorts, this may not be possible to arrange with a developer because of bad credit and highrisk. Further benefits from PPAS include reducing exposure to risks related to under-performance,unanticipated O&M costs, and delays in the project and incentives.
II.2.C Ski Resort Self-Financing
Corporations that can assume more risk often self-finance their own renewable energyprojects [25]. By taking this risk, it enables companies to reap the benefits of a long-term, highquality asset and cut out the 3rd party developer [25]. This way, the owner can capture more of thesavings. Additional benefits include lower project cost and administrative costs due to the extrasensors and measuring devices required for a PPA.
Jiminy Peak and Berkshire East both chose to self-finance wind turbines, decisions theymade because of their respective financial positions at the time. Jiminy Peak had a couple ofsuccessful years reducing their debt to capital ratio, which allowed them to get favorable termsfor a loan. Berkshire East ownership team had experience in renewable energy development andtheir expertise lead them to pursue self-financing. Overall for any ski resort, the motivations forself-financing come down to their risk-tolerance and financial well-being.
For alpha and uber tier ski resorts, self-financing will be more favorable as they have a
Page 8
ENGS 86 Tyler Farrell
higher risk-tolerance and better financial well-being because they have a large financial backing.Furthermore, they are able to look at 20 to 30 year time horizons with more certainty, while ”statusquo”, survivor, and sunset resorts are only trying to stay afloat.
II.2.D Self Financing Compared to PPAs
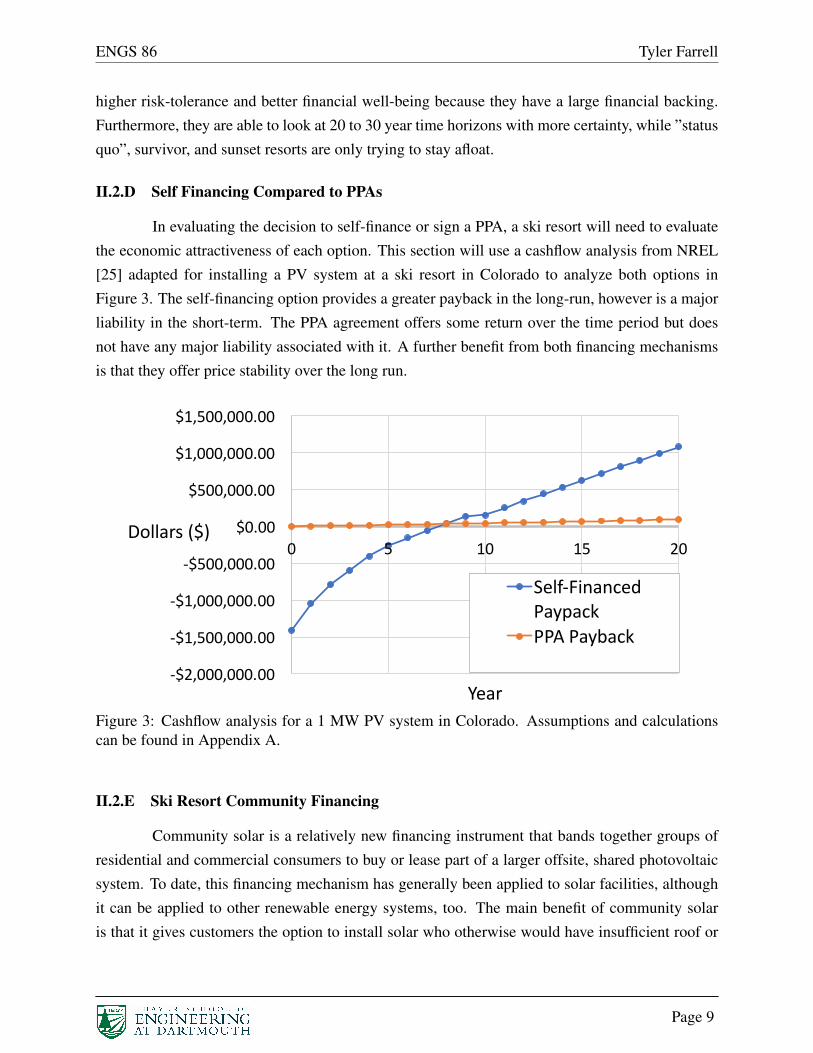
In evaluating the decision to self-finance or sign a PPA, a ski resort will need to evaluatethe economic attractiveness of each option. This section will use a cashflow analysis from NREL[25] adapted for installing a PV system at a ski resort in Colorado to analyze both options inFigure 3. The self-financing option provides a greater payback in the long-run, however is a majorliability in the short-term. The PPA agreement offers some return over the time period but doesnot have any major liability associated with it. A further benefit from both financing mechanismsis that they offer price stability over the long run.
-$2,000,000.00
-$1,500,000.00
-$1,000,000.00
-$500,000.00
$0.00
$500,000.00
$1,000,000.00
$1,500,000.00
0 5 10 15 20Dollars($)
Year
Self-FinancedPaypackPPAPayback
Figure 3: Cashflow analysis for a 1 MW PV system in Colorado. Assumptions and calculationscan be found in Appendix A.
II.2.E Ski Resort Community Financing
Community solar is a relatively new financing instrument that bands together groups ofresidential and commercial consumers to buy or lease part of a larger offsite, shared photovoltaicsystem. To date, this financing mechanism has generally been applied to solar facilities, althoughit can be applied to other renewable energy systems, too. The main benefit of community solaris that it gives customers the option to install solar who otherwise would have insufficient roof or
Page 9
ENGS 86 Tyler Farrell
land space, who do not own their land, who are located in an area of insufficient solar resources,or who would be unable to finance solar. All four are barriers pertaining to ski, as well.
Jiminy Peak and Wolf Creek Ski area are two ski resorts that participate in larger off-sitecommunity solar projects. Jiminy Peak buys power through a PPA with a 2.3 MW facility locatedon its property but developed by a special purpose entity. Wolf Creek ski area operates under asimilar PPA agreement where they purchase 1,000 MWh per year of the 7,000 MWh generatedfrom the Penitente Solar Project. The 1,000 MWh generated offsets 100% of Wolf Creek’s energyneeds through virtual net metering.
II.3 Social and Community Issues
Ski resorts have always been central aspects to mountain communities, but have recentlybecome more controversial due to conglomeration and corporatization. Renewables have the po-tential to add to this contention if the community is left out of the planning process. Recent projectssuch as the Lowell Mountains Wind Project in Vermont, renewable projects in San BernardinoCounty, and many others have felt the negative backlash of communities against renewables intheir backyards [28][29].
When Berkshire East developed its wind turbine, the town was apprehensive about theturbine and its effect on the community. However, growing discussions between the communityand the resort lead to a close partnership between the two. The ski resort provides season passesand ski rentals for all the students and teachers in the community. When Hurricane Irene hit thetown on August 27 and 28, 2011, it flooded Hawlemont Elementary School, closing it for multipleweeks [30]. The ski resort allowed the school to use the day lodge for classes and provided lunchfor the students at no cost to the school board. Furthermore, the ski resort encourages groupsand schools in the area to visit the turbine and solar field to learn about renewable energy. Thesetypes of connections to the community are essential to developing renewable energy effectivelyand allowing the company to proceed through the permitting process in a conscientious way.
An important message for ski resorts interested in developing renewables is that theproject is not just about economics, and the community needs to be involved with the process,as well.
II.4 State and Federal Renewable Energy Policy
This section will highlight important state and federal policy. State policy varies widelyand this report will discuss important policies relevant to ski resorts looking to develop renewableinfrastructure. A summary of state by state policies can be found in Appendix D of NREL’sAssessing the Potential for Renewable Energy on National Forest System Lands [21].
Page 10
ENGS 86 Tyler Farrell
Federal policies of interest for ski resorts include the Business Energy Investment TaxCredit (ITC),the Modified Accelerated Cost Recovery System (MACRs), the renewable electricityproduction tax credit, and the solar and geothermal business energy tax credit. All of which canbe claimed for solar and wind projects but not hydropower. Furthermore, the production creditand the energy credit cannot both be claimed by one project. The ITC is an investment credit forrenewable energy projects based on a percentage of the total investment that declines by year into2022. MACRS allows for depreciation deductions for the investment over 5 years. The productiontax credit provides a tax credit of 1.8 cents/ kWh for 10 years for wind and 5 years for solar. Theenergy tax credit provides a 10% credit to be carried back to the 3 preceding years and forward for15 years. More details on these policies can be found in NREL’s report [21].
The most important state policies for ski resorts are net metering, renewable energy cer-tificates (RECs), and state tax credits. Other policies exist and should be understood on a stateby state basis. Net metering is a billing mechanism that credit renewable energy owners for theelectricity they add to the grid on a ’net’ basis. This values each kWh of electricity generated at ahigher retail rate in comparison to a wholesale rate. State legislation on net metering varies withsome state not requiring utilities to net meter and other states impose capacity limits and enroll-ment limits. RECs are a instrument that represents property rights to environmental, social, andother non-power attributes of renewable energy generation. RECs are issued when one MWh isgenerated by a renewable source and it allows the owner to sell the property right to a third party.States can either have voluntary or compliance REC markets. States with compliance marketsgenerally have Renewable Portfolio Standards that utilities need to obeyed by. State tax credits onrenewable generation are set up in a similar manner to the federal system and apply on a per energybasis.
Page 11
ENGS 86 Tyler Farrell
III Technology and Resources
This section will evaluate alternative renewable energy technologies appropriate for skiresorts. It will provide an overview of current and future technology, the availability of naturalresources near ski areas, issues and considerations for a particular technology, how well that tech-nology matches seasonal and daily consumption and provide the basis for an economic analysis ofthat technologies.
III.1 Solar
Solar power is currently in use at multiple ski resorts around the United States throughPPAs and self-financed investments. Notably, Wolf Creek supplies 100% of their electricity throughan offsite solar PPA that provides 1,000 MWh [31]. Using offsite solar helps Wolf Creek maximizetheir investment as although the ski resort and the solar facility are only 50 miles away apart WolfCreek is among Colorado’s snowiest areas averaging 391 inches a year, while the San Luis Valleyis one of the driest only receiving 26 inches. This has large impacts on the solar resources receivedwith Wolf Creek averaging 4.822 kWh/m2 per day and San Luis valley averaging 5.433 kWh/m2
per day.
III.1.A Current Technology
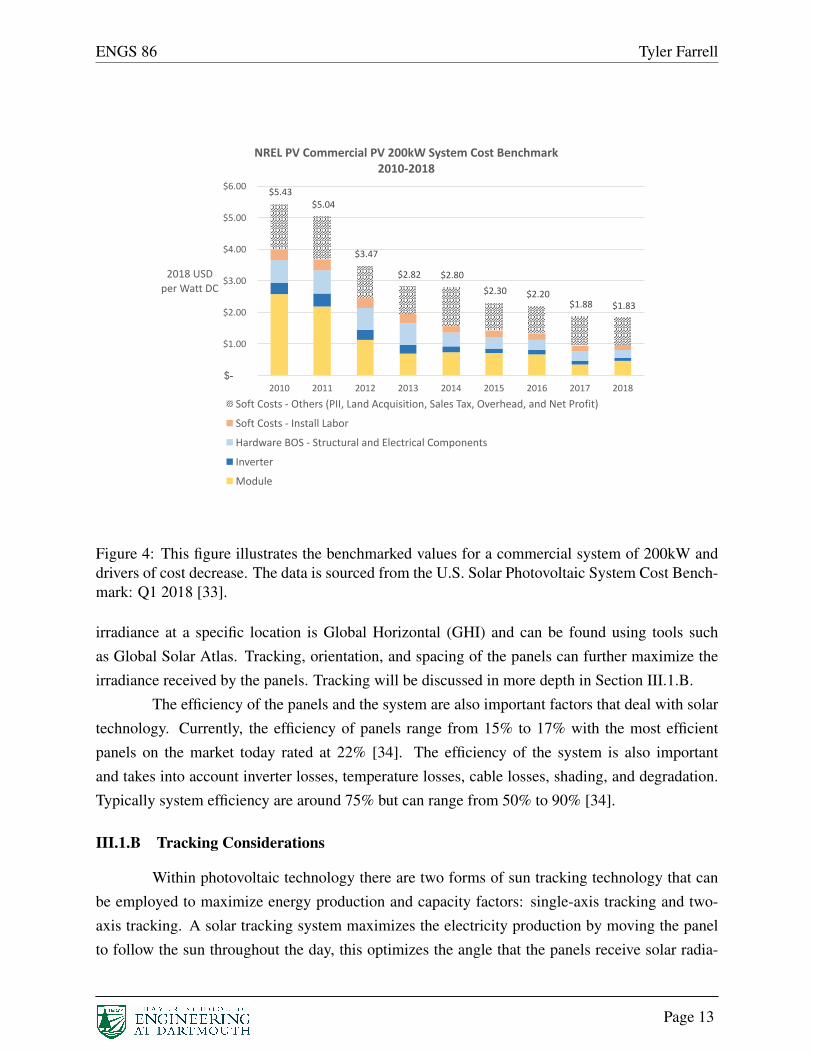
In recent years, photovoltaic solar technology has drastically decreased in price as seenin Figure 4, driven by a decrease in the price of modules and inverters. This has allowed solarto grow exponentially in the commercial and residential sector. Costs vary across the country butsolar is generally cost-effective with payback periods of 5 to 10 years [32]. In general, photovoltaiccommercial system vary from 10kW to 2MW [33]. There are a number of factors and limitationsto consider when determining system size which will be discussed in Section III.1.E.
The energy conversion process of photovoltaic panels is defined by Equation (1):
P = APanel ⇤ ⌘Panel ⇤ I ⇤ ⌘System. (1)
Where APanel is the surface area of the solar panels , ⌘Panel is the efficiency of the panels,I is the irradiance of the sun,and ⌘System is the efficiency of the system.
The most important factor for generating solar energy is irradiance from the sun. Over thecourse of the day it depends on a number of factors including time of day, weather, and shading.A developer can control some of these factors by choosing a location that maximizes irradiance.For instance, Wolf Creek uses offsite solar from the San Luis Valley to maximize irradiance sincethe weather is drier in the valley and the area is clear of trees. The most common indicator of
Page 12
ENGS 86 Tyler Farrell
$5.43$5.04
$3.47
$2.82 $2.80$2.30 $2.20
$1.88 $1.83
$-
$1.00
$2.00
$3.00
$4.00
$5.00
$6.00
2010 2011 2012 2013 2014 2015 2016 2017 2018
2018USDperWattDC
NRELPVCommercialPV200kWSystemCostBenchmark2010-2018
SoftCosts- Others(PII,LandAcquisition,SalesTax,Overhead,andNetProfit)SoftCosts- InstallLaborHardwareBOS- StructuralandElectricalComponentsInverterModule
Figure 4: This figure illustrates the benchmarked values for a commercial system of 200kW anddrivers of cost decrease. The data is sourced from the U.S. Solar Photovoltaic System Cost Bench-mark: Q1 2018 [33].
irradiance at a specific location is Global Horizontal (GHI) and can be found using tools suchas Global Solar Atlas. Tracking, orientation, and spacing of the panels can further maximize theirradiance received by the panels. Tracking will be discussed in more depth in Section III.1.B.
The efficiency of the panels and the system are also important factors that deal with solartechnology. Currently, the efficiency of panels range from 15% to 17% with the most efficientpanels on the market today rated at 22% [34]. The efficiency of the system is also importantand takes into account inverter losses, temperature losses, cable losses, shading, and degradation.Typically system efficiency are around 75% but can range from 50% to 90% [34].
III.1.B Tracking Considerations
Within photovoltaic technology there are two forms of sun tracking technology that canbe employed to maximize energy production and capacity factors: single-axis tracking and two-axis tracking. A solar tracking system maximizes the electricity production by moving the panelto follow the sun throughout the day, this optimizes the angle that the panels receive solar radia-
Page 13
ENGS 86 Tyler Farrell
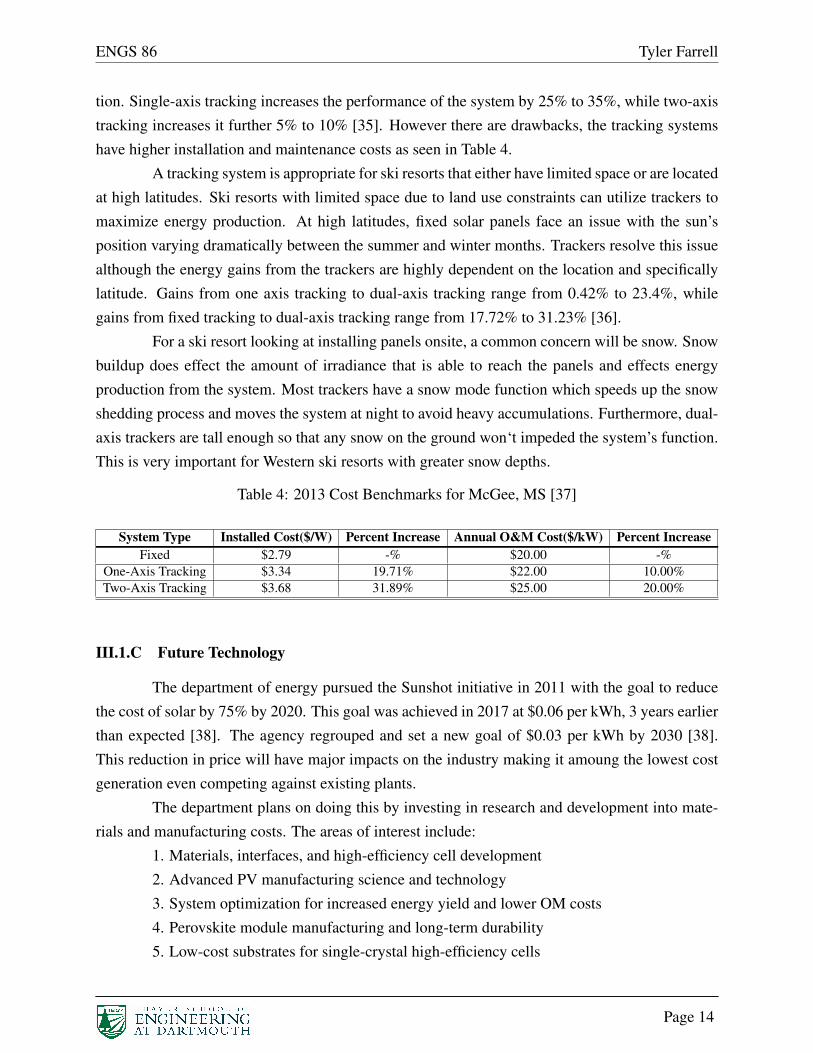
tion. Single-axis tracking increases the performance of the system by 25% to 35%, while two-axistracking increases it further 5% to 10% [35]. However there are drawbacks, the tracking systemshave higher installation and maintenance costs as seen in Table 4.
A tracking system is appropriate for ski resorts that either have limited space or are locatedat high latitudes. Ski resorts with limited space due to land use constraints can utilize trackers tomaximize energy production. At high latitudes, fixed solar panels face an issue with the sun’sposition varying dramatically between the summer and winter months. Trackers resolve this issuealthough the energy gains from the trackers are highly dependent on the location and specificallylatitude. Gains from one axis tracking to dual-axis tracking range from 0.42% to 23.4%, whilegains from fixed tracking to dual-axis tracking range from 17.72% to 31.23% [36].
For a ski resort looking at installing panels onsite, a common concern will be snow. Snowbuildup does effect the amount of irradiance that is able to reach the panels and effects energyproduction from the system. Most trackers have a snow mode function which speeds up the snowshedding process and moves the system at night to avoid heavy accumulations. Furthermore, dual-axis trackers are tall enough so that any snow on the ground won‘t impeded the system’s function.This is very important for Western ski resorts with greater snow depths.
Table 4: 2013 Cost Benchmarks for McGee, MS [37]
System Type Installed Cost($/W) Percent Increase Annual O&M Cost($/kW) Percent IncreaseFixed $2.79 -% $20.00 -%
One-Axis Tracking $3.34 19.71% $22.00 10.00%Two-Axis Tracking $3.68 31.89% $25.00 20.00%
III.1.C Future Technology
The department of energy pursued the Sunshot initiative in 2011 with the goal to reducethe cost of solar by 75% by 2020. This goal was achieved in 2017 at $0.06 per kWh, 3 years earlierthan expected [38]. The agency regrouped and set a new goal of $0.03 per kWh by 2030 [38].This reduction in price will have major impacts on the industry making it amoung the lowest costgeneration even competing against existing plants.
The department plans on doing this by investing in research and development into mate-rials and manufacturing costs. The areas of interest include:
1. Materials, interfaces, and high-efficiency cell development2. Advanced PV manufacturing science and technology3. System optimization for increased energy yield and lower OM costs4. Perovskite module manufacturing and long-term durability5. Low-cost substrates for single-crystal high-efficiency cells
Page 14
ENGS 86 Tyler Farrell
6. PV system recycling and end-of-life managementOne of the most exciting area for solar development lies within the perovskite module which aresemi-transparent PV modules that could be used on windows or stacked with silicone modules.
III.1.D Resources
The application of solar technology at ski resorts will depend on the solar resources avail-able in the area. As mentioned in Section III.1.A, the power produced by a solar panel is primarilya function of irradiance from the sun. The location of the array is crucial to maximizing the irradi-ance. There are a number of tools including globalsolaratlas.info, pvwatts.nrel.gov, and NOAA’sclimate dataset to gather irradiance data for a specific location.
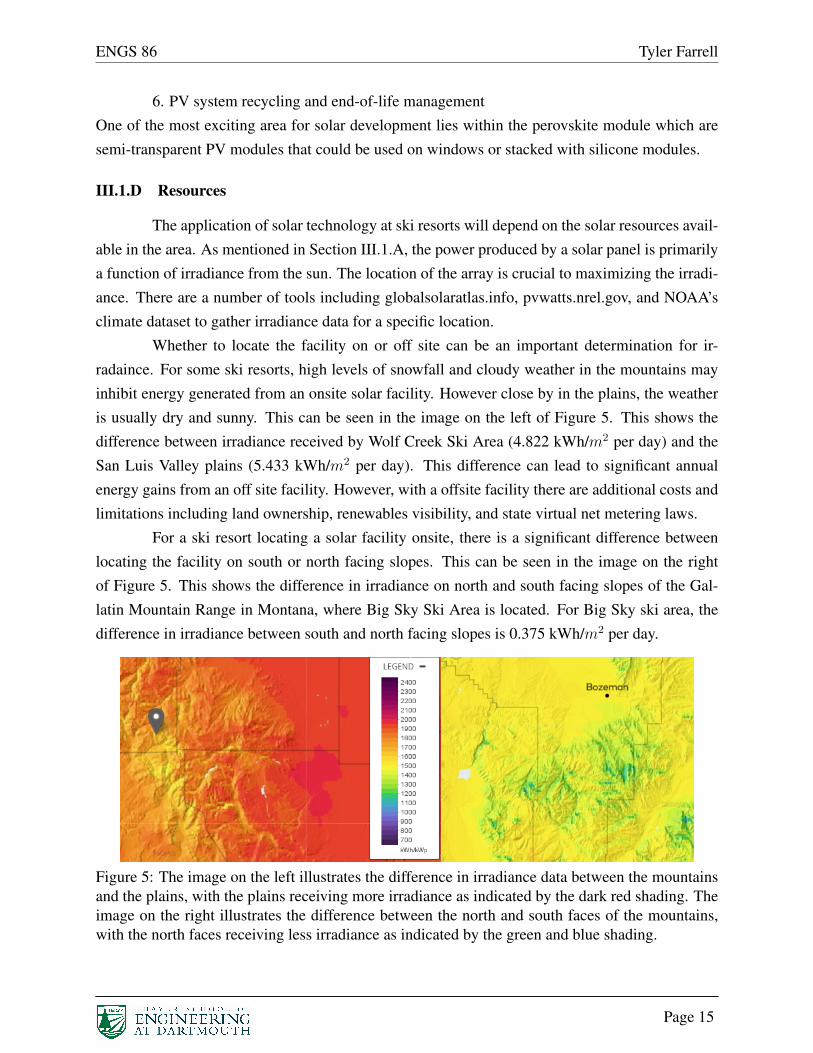
Whether to locate the facility on or off site can be an important determination for ir-radaince. For some ski resorts, high levels of snowfall and cloudy weather in the mountains mayinhibit energy generated from an onsite solar facility. However close by in the plains, the weatheris usually dry and sunny. This can be seen in the image on the left of Figure 5. This shows thedifference between irradiance received by Wolf Creek Ski Area (4.822 kWh/m2 per day) and theSan Luis Valley plains (5.433 kWh/m2 per day). This difference can lead to significant annualenergy gains from an off site facility. However, with a offsite facility there are additional costs andlimitations including land ownership, renewables visibility, and state virtual net metering laws.
For a ski resort locating a solar facility onsite, there is a significant difference betweenlocating the facility on south or north facing slopes. This can be seen in the image on the rightof Figure 5. This shows the difference in irradiance on north and south facing slopes of the Gal-latin Mountain Range in Montana, where Big Sky Ski Area is located. For Big Sky ski area, thedifference in irradiance between south and north facing slopes is 0.375 kWh/m2 per day.
Figure 5: The image on the left illustrates the difference in irradiance data between the mountainsand the plains, with the plains receiving more irradiance as indicated by the dark red shading. Theimage on the right illustrates the difference between the north and south faces of the mountains,with the north faces receiving less irradiance as indicated by the green and blue shading.
Page 15
ENGS 86 Tyler Farrell
III.1.E Issues and Considerations
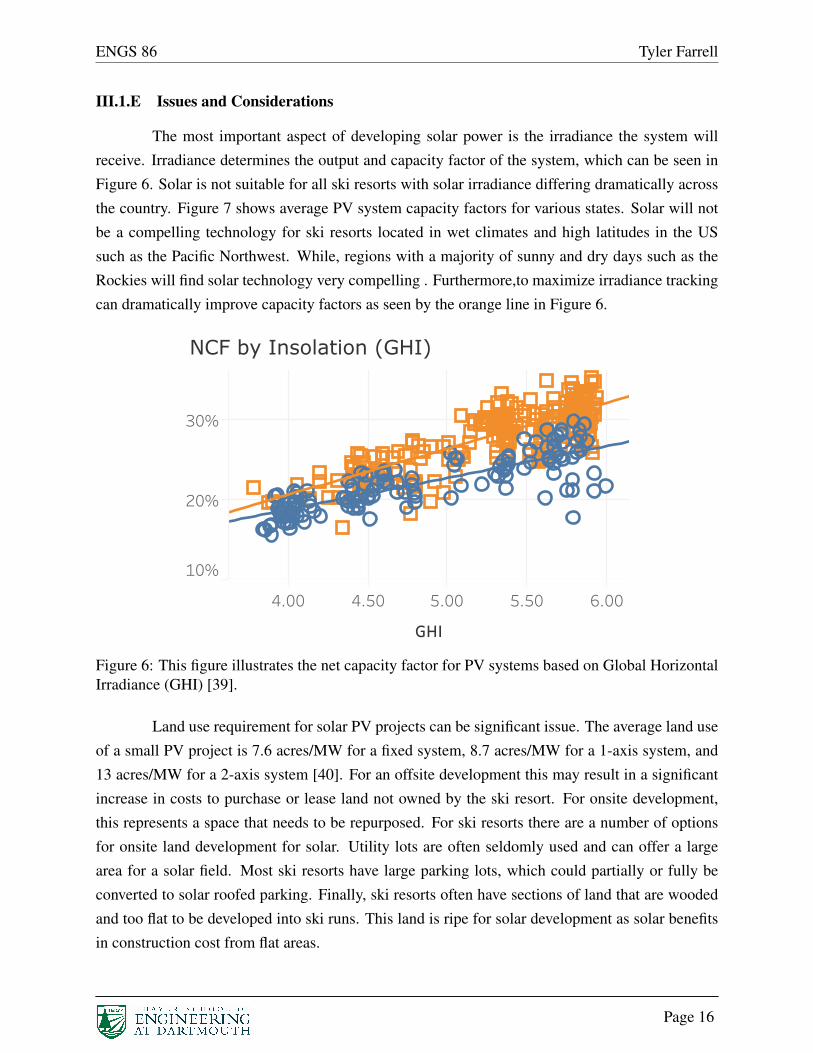
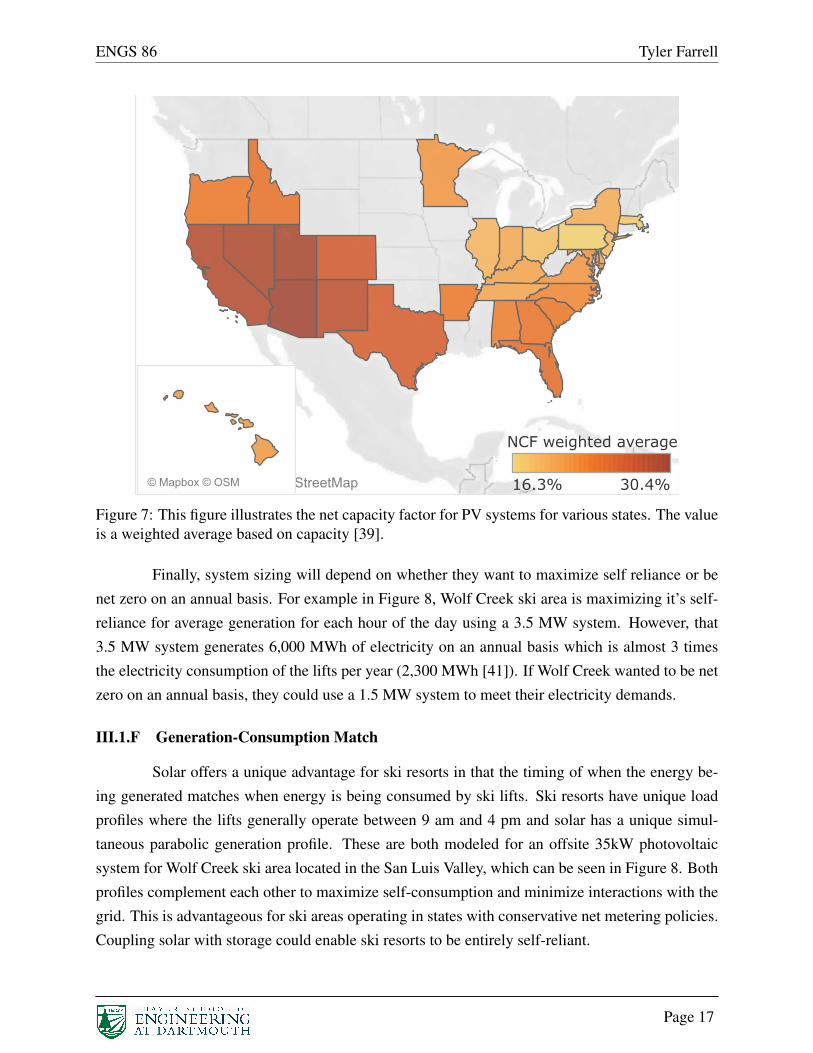
The most important aspect of developing solar power is the irradiance the system willreceive. Irradiance determines the output and capacity factor of the system, which can be seen inFigure 6. Solar is not suitable for all ski resorts with solar irradiance differing dramatically acrossthe country. Figure 7 shows average PV system capacity factors for various states. Solar will notbe a compelling technology for ski resorts located in wet climates and high latitudes in the USsuch as the Pacific Northwest. While, regions with a majority of sunny and dry days such as theRockies will find solar technology very compelling . Furthermore,to maximize irradiance trackingcan dramatically improve capacity factors as seen by the orange line in Figure 6.
Utility-ScaleSolar:Project-levelPerformanceCumulativenetcapacityfactor(NCF)in2017forprojectsover5MW-ACincapacity
Source:UtilityScaleSolar2018,fromBerkeleyLab,athttp://utilityscalesolar.lbl.gov
Anumberoffactorscanaffecttheperformance(NCF)ofutility-scale
solarsystems:
•Thechiefdriversareinsolation(GHI)andtheuseoftrackers.ThehighestinsolationlevelsareintheSouthwestandCalifornia.Thechoiceofmounttypedependsonanumberofspecificfactors,buttrackingsystemshavebecomepredominantinrecentyears.
•Inverterloadingratios(ILRs,theratiooftheDCoutputofthesolarpanelstotheACoutputoftheinverters)areasmallercontributortoperformanceimprovements.
•Othervariables,suchasweatheranddegradationofmodules,canaffectperformanceovertimeandinagivenyear.(NCFinthisanalysisisfortheyear2017only.)
•Projectsizedoesnotdirectlyaffectperformance.
Foramoredetailedstatisticalanalysisofutility-scalesystemperformanceseeour"Maximizi..
Notes:
•NCFdatanotavailableyetformostprojectsbuiltin2017.
•OnehybridmountprojectinColoradowasexcludedfromthedatatosimplifypresentation.
•NCFisbasedonACcapacity.StateNCFisweightedbyACcapacity.
•GHIisGlobalHorizontalIrradiance,thetotalamountofshortwaveradiationreceivedfromabovebyahorizontalsurface.
1.10 1.20 1.30 1.40 1.50 1.60
ILR
10%
20%
30%
NCFbyInverterLoadingRatio(ILR)
2006 2008 2010 2012 2014 2016 2018
YearofCOD
10%
20%
30%
NCFbyOnlineDate
4.00 4.50 5.00 5.50 6.00
GHI
10%
20%
30%
NCFbyInsolation(GHI)
2007
2008
2009
2010
2011
2012
2013
2014
2015
2016
2017
0
1,000
2,000
3,000
4,000
5,000
6,000
7,000
MW
(A
C)
MWinstalledbyyearandmounttype
Usethesefilterstoadjust
parameters.
CumulativeNCF
14.3%to35.2%
YearOnline
2007to2017
andNullvalues
Insolation(GHI)
3.70to5.99
andNullvalues
Projectsize(MWAC)
5to586
andNullvalues
ILR
1.01to1.67
MountType
All
No.ofInstallations
TotalMW(AC)
MedianCum.NCF
MedianGHI
MedianILR 1.28
5.35
26.4%
15,962
389
©2019Mapbox©OpenStreetMap ©2019Mapbox©OpenStreetMap©Mapbox©OSM
FixedTilt
Tracking
Nocleartrendbydate
©Mapbox©OSM 16.3% 30.4%
NCFweightedaverage
15.7% 35.2%
CumulativeNCFbyPr..
Figure 6: This figure illustrates the net capacity factor for PV systems based on Global HorizontalIrradiance (GHI) [39].
Land use requirement for solar PV projects can be significant issue. The average land useof a small PV project is 7.6 acres/MW for a fixed system, 8.7 acres/MW for a 1-axis system, and13 acres/MW for a 2-axis system [40]. For an offsite development this may result in a significantincrease in costs to purchase or lease land not owned by the ski resort. For onsite development,this represents a space that needs to be repurposed. For ski resorts there are a number of optionsfor onsite land development for solar. Utility lots are often seldomly used and can offer a largearea for a solar field. Most ski resorts have large parking lots, which could partially or fully beconverted to solar roofed parking. Finally, ski resorts often have sections of land that are woodedand too flat to be developed into ski runs. This land is ripe for solar development as solar benefitsin construction cost from flat areas.
Page 16
ENGS 86 Tyler Farrell
Utility-ScaleSolar:Project-levelPerformanceCumulativenetcapacityfactor(NCF)in2017forprojectsover5MW-ACincapacity
Source:UtilityScaleSolar2018,fromBerkeleyLab,athttp://utilityscalesolar.lbl.gov
Anumberoffactorscanaffecttheperformance(NCF)ofutility-scale
solarsystems:
•Thechiefdriversareinsolation(GHI)andtheuseoftrackers.ThehighestinsolationlevelsareintheSouthwestandCalifornia.Thechoiceofmounttypedependsonanumberofspecificfactors,buttrackingsystemshavebecomepredominantinrecentyears.
•Inverterloadingratios(ILRs,theratiooftheDCoutputofthesolarpanelstotheACoutputoftheinverters)areasmallercontributortoperformanceimprovements.
•Othervariables,suchasweatheranddegradationofmodules,canaffectperformanceovertimeandinagivenyear.(NCFinthisanalysisisfortheyear2017only.)
•Projectsizedoesnotdirectlyaffectperformance.
Foramoredetailedstatisticalanalysisofutility-scalesystemperformanceseeour"Maximizi..
Notes:
•NCFdatanotavailableyetformostprojectsbuiltin2017.
•OnehybridmountprojectinColoradowasexcludedfromthedatatosimplifypresentation.
•NCFisbasedonACcapacity.StateNCFisweightedbyACcapacity.
•GHIisGlobalHorizontalIrradiance,thetotalamountofshortwaveradiationreceivedfromabovebyahorizontalsurface.
1.10 1.20 1.30 1.40 1.50 1.60
ILR
10%
20%
30%
NCFbyInverterLoadingRatio(ILR)
2006 2008 2010 2012 2014 2016 2018
YearofCOD
10%
20%
30%
NCFbyOnlineDate
4.00 4.50 5.00 5.50 6.00
GHI
10%
20%
30%
NCFbyInsolation(GHI)
2007
2008
2009
2010
2011
2012
2013
2014
2015
2016
2017
0
1,000
2,000
3,000
4,000
5,000
6,000
7,000
MW
(A
C)
MWinstalledbyyearandmounttype
Usethesefilterstoadjust
parameters.
CumulativeNCF
14.3%to35.2%
YearOnline
2007to2017
andNullvalues
Insolation(GHI)
3.70to5.99
andNullvalues
Projectsize(MWAC)
5to586
andNullvalues
ILR
1.01to1.67
MountType
All
No.ofInstallations
TotalMW(AC)
MedianCum.NCF
MedianGHI
MedianILR 1.28
5.35
26.4%
15,962
389
©2019Mapbox©OpenStreetMap ©2019Mapbox©OpenStreetMap©Mapbox©OSM
FixedTilt
Tracking
Nocleartrendbydate
©Mapbox©OSM 16.3% 30.4%
NCFweightedaverage
15.7% 35.2%
CumulativeNCFbyPr..
Figure 7: This figure illustrates the net capacity factor for PV systems for various states. The valueis a weighted average based on capacity [39].
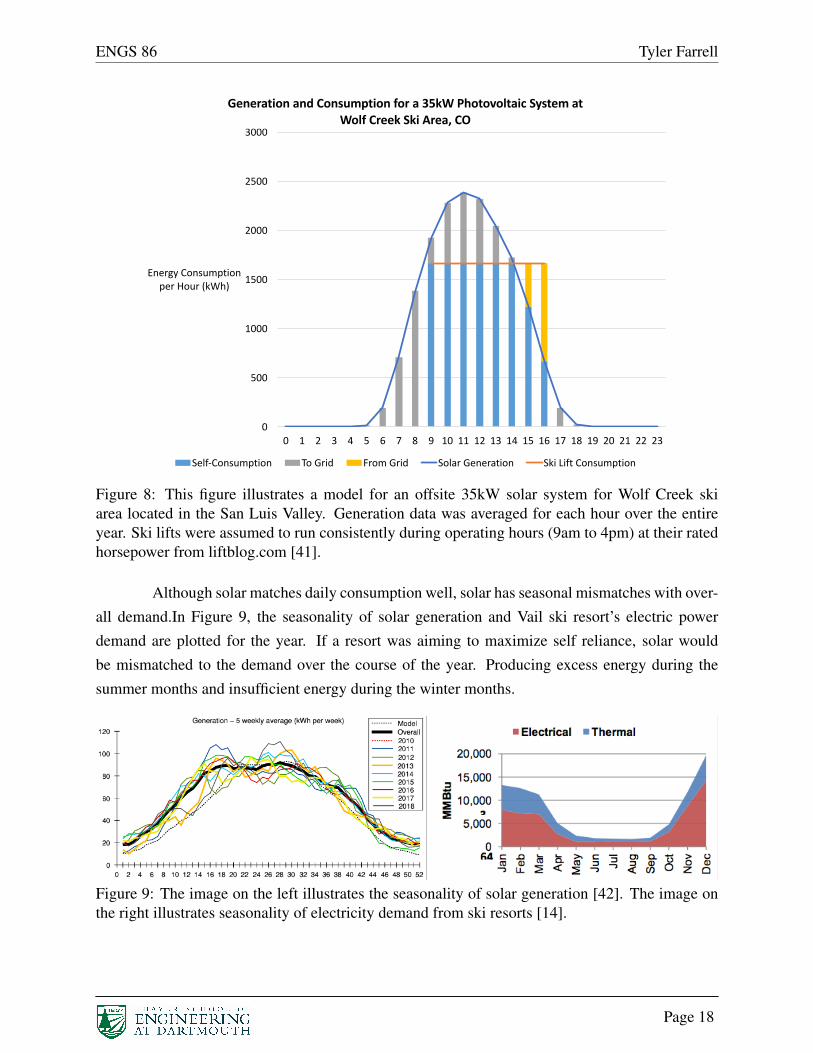
Finally, system sizing will depend on whether they want to maximize self reliance or benet zero on an annual basis. For example in Figure 8, Wolf Creek ski area is maximizing it’s self-reliance for average generation for each hour of the day using a 3.5 MW system. However, that3.5 MW system generates 6,000 MWh of electricity on an annual basis which is almost 3 timesthe electricity consumption of the lifts per year (2,300 MWh [41]). If Wolf Creek wanted to be netzero on an annual basis, they could use a 1.5 MW system to meet their electricity demands.
III.1.F Generation-Consumption Match
Solar offers a unique advantage for ski resorts in that the timing of when the energy be-ing generated matches when energy is being consumed by ski lifts. Ski resorts have unique loadprofiles where the lifts generally operate between 9 am and 4 pm and solar has a unique simul-taneous parabolic generation profile. These are both modeled for an offsite 35kW photovoltaicsystem for Wolf Creek ski area located in the San Luis Valley, which can be seen in Figure 8. Bothprofiles complement each other to maximize self-consumption and minimize interactions with thegrid. This is advantageous for ski areas operating in states with conservative net metering policies.Coupling solar with storage could enable ski resorts to be entirely self-reliant.
Page 17
ENGS 86 Tyler Farrell
0
500
1000
1500
2000
2500
3000
0 1 2 3 4 5 6 7 8 9 10 11 12 13 14 15 16 17 18 19 20 21 22 23
EnergyConsumptionperHour(kWh)
GenerationandConsumptionfora35kWPhotovoltaicSystematWolfCreekSkiArea,CO
Self-Consumption ToGrid FromGrid SolarGeneration SkiLiftConsumption
Figure 8: This figure illustrates a model for an offsite 35kW solar system for Wolf Creek skiarea located in the San Luis Valley. Generation data was averaged for each hour over the entireyear. Ski lifts were assumed to run consistently during operating hours (9am to 4pm) at their ratedhorsepower from liftblog.com [41].
Although solar matches daily consumption well, solar has seasonal mismatches with over-all demand.In Figure 9, the seasonality of solar generation and Vail ski resort’s electric powerdemand are plotted for the year. If a resort was aiming to maximize self reliance, solar wouldbe mismatched to the demand over the course of the year. Producing excess energy during thesummer months and insufficient energy during the winter months.
Figure 9: The image on the left illustrates the seasonality of solar generation [42]. The image onthe right illustrates seasonality of electricity demand from ski resorts [14].
Page 18
ENGS 86 Tyler Farrell
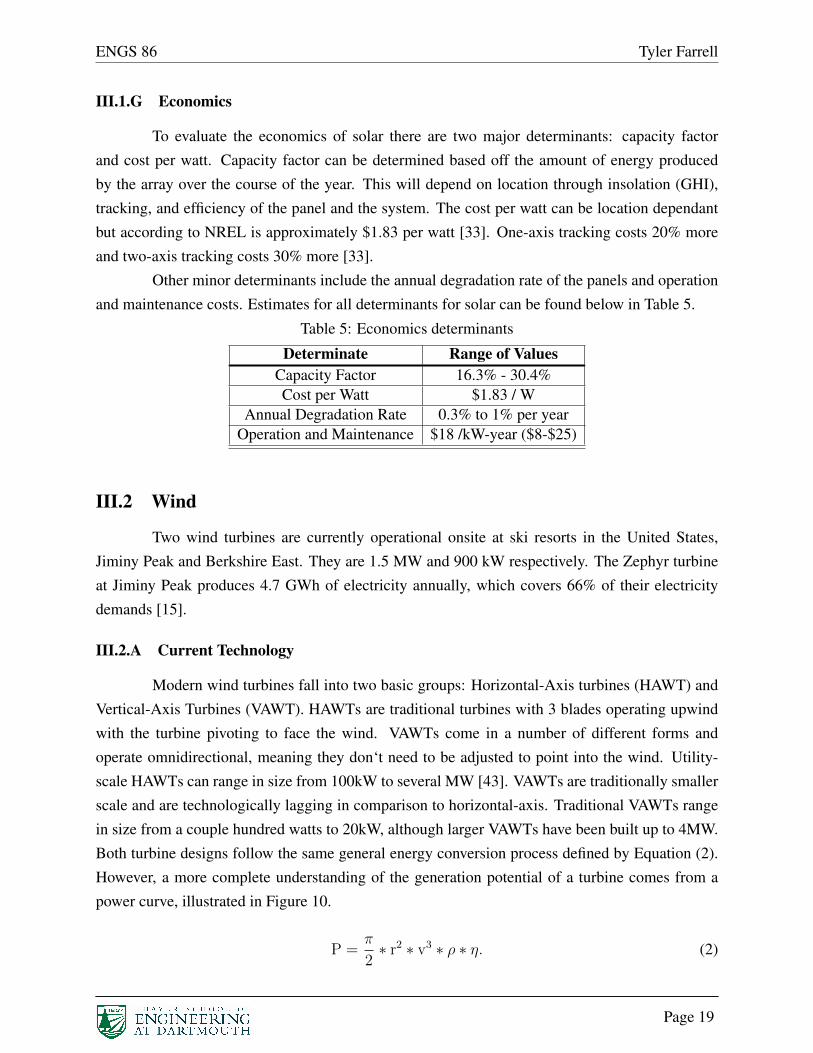
III.1.G Economics
To evaluate the economics of solar there are two major determinants: capacity factorand cost per watt. Capacity factor can be determined based off the amount of energy producedby the array over the course of the year. This will depend on location through insolation (GHI),tracking, and efficiency of the panel and the system. The cost per watt can be location dependantbut according to NREL is approximately $1.83 per watt [33]. One-axis tracking costs 20% moreand two-axis tracking costs 30% more [33].
Other minor determinants include the annual degradation rate of the panels and operationand maintenance costs. Estimates for all determinants for solar can be found below in Table 5.
Table 5: Economics determinantsDeterminate Range of Values
Capacity Factor 16.3% - 30.4%Cost per Watt $1.83 / W
Annual Degradation Rate 0.3% to 1% per yearOperation and Maintenance $18 /kW-year ($8-$25)
III.2 Wind
Two wind turbines are currently operational onsite at ski resorts in the United States,Jiminy Peak and Berkshire East. They are 1.5 MW and 900 kW respectively. The Zephyr turbineat Jiminy Peak produces 4.7 GWh of electricity annually, which covers 66% of their electricitydemands [15].
III.2.A Current Technology
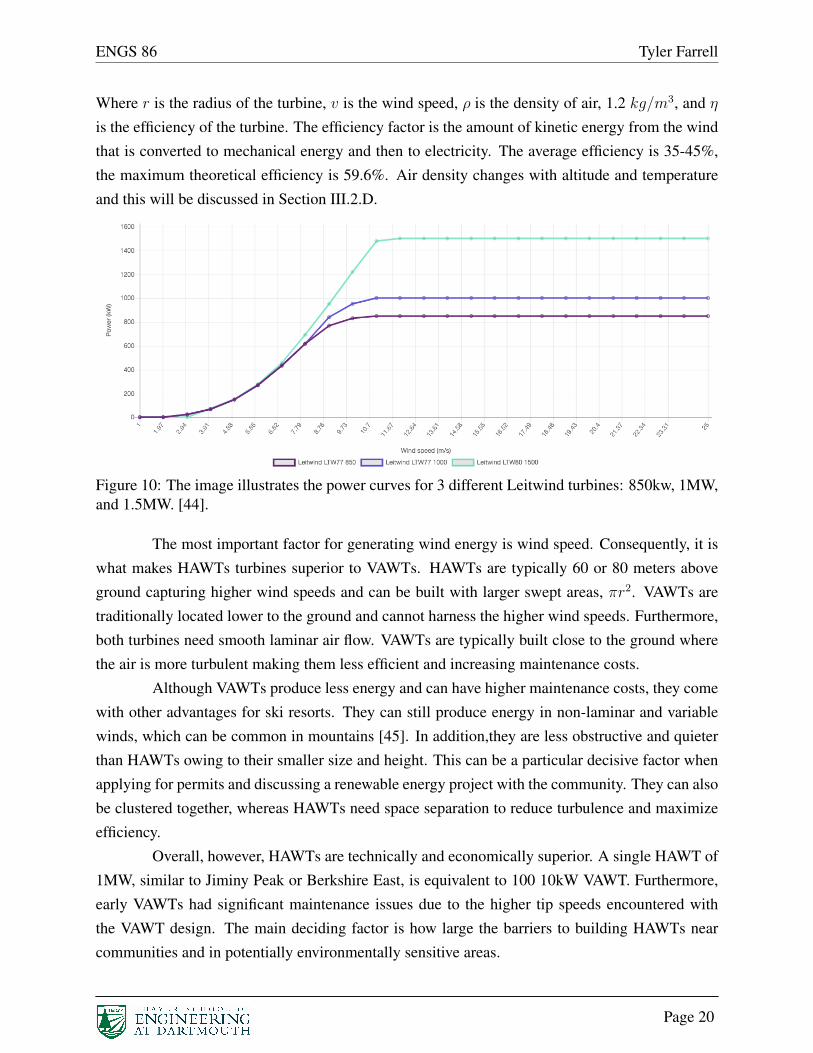
Modern wind turbines fall into two basic groups: Horizontal-Axis turbines (HAWT) andVertical-Axis Turbines (VAWT). HAWTs are traditional turbines with 3 blades operating upwindwith the turbine pivoting to face the wind. VAWTs come in a number of different forms andoperate omnidirectional, meaning they don‘t need to be adjusted to point into the wind. Utility-scale HAWTs can range in size from 100kW to several MW [43]. VAWTs are traditionally smallerscale and are technologically lagging in comparison to horizontal-axis. Traditional VAWTs rangein size from a couple hundred watts to 20kW, although larger VAWTs have been built up to 4MW.Both turbine designs follow the same general energy conversion process defined by Equation (2).However, a more complete understanding of the generation potential of a turbine comes from apower curve, illustrated in Figure 10.
P =⇡
2⇤ r2 ⇤ v3 ⇤ ⇢ ⇤ ⌘. (2)
Page 19
ENGS 86 Tyler Farrell
Where r is the radius of the turbine, v is the wind speed, ⇢ is the density of air, 1.2 kg/m3, and ⌘
is the efficiency of the turbine. The efficiency factor is the amount of kinetic energy from the windthat is converted to mechanical energy and then to electricity. The average efficiency is 35-45%,the maximum theoretical efficiency is 59.6%. Air density changes with altitude and temperatureand this will be discussed in Section III.2.D.
Figure 10: The image illustrates the power curves for 3 different Leitwind turbines: 850kw, 1MW,and 1.5MW. [44].
The most important factor for generating wind energy is wind speed. Consequently, it iswhat makes HAWTs turbines superior to VAWTs. HAWTs are typically 60 or 80 meters aboveground capturing higher wind speeds and can be built with larger swept areas, ⇡r2. VAWTs aretraditionally located lower to the ground and cannot harness the higher wind speeds. Furthermore,both turbines need smooth laminar air flow. VAWTs are typically built close to the ground wherethe air is more turbulent making them less efficient and increasing maintenance costs.
Although VAWTs produce less energy and can have higher maintenance costs, they comewith other advantages for ski resorts. They can still produce energy in non-laminar and variablewinds, which can be common in mountains [45]. In addition,they are less obstructive and quieterthan HAWTs owing to their smaller size and height. This can be a particular decisive factor whenapplying for permits and discussing a renewable energy project with the community. They can alsobe clustered together, whereas HAWTs need space separation to reduce turbulence and maximizeefficiency.
Overall, however, HAWTs are technically and economically superior. A single HAWT of1MW, similar to Jiminy Peak or Berkshire East, is equivalent to 100 10kW VAWT. Furthermore,early VAWTs had significant maintenance issues due to the higher tip speeds encountered withthe VAWT design. The main deciding factor is how large the barriers to building HAWTs nearcommunities and in potentially environmentally sensitive areas.
Page 20
ENGS 86 Tyler Farrell
III.2.B Future Technology
The Wind Energy Technologies Office within the Department of Energy have worked onlowering the cost of wind power. They have done this by working with turbine developers to createlonger, lighter rotor blades, taller towers, more reliable drivetrains, and performance-optimizingcontrol systems. All this has increased efficiency from 22% in 1998 to 35% today and lowered thecost of wind from over 55 cents per kWh in 1980 to under 3 cents per kWh today [46]. This workcontinues today making wind power one of the cheapest sources of energy available.
Icing is a major issue for wind turbines located in harsh winter weather. In Section III.2.D,icing problems will be investigated in more detail. Many companies are researching new technolo-gies to fix the issue and expand into Northern markets. Vestas has an inhouse solution which usesan electro-thermal heating elements embedded in the laminate directly below the blade’s surface.The control system has different operational modes that allow the heating elements to separatelycreate the optimal heating level, increasing effectiveness and minimizing energy consumption [47].The system will reduce energy production losses by 90% [47].
III.2.C Resource
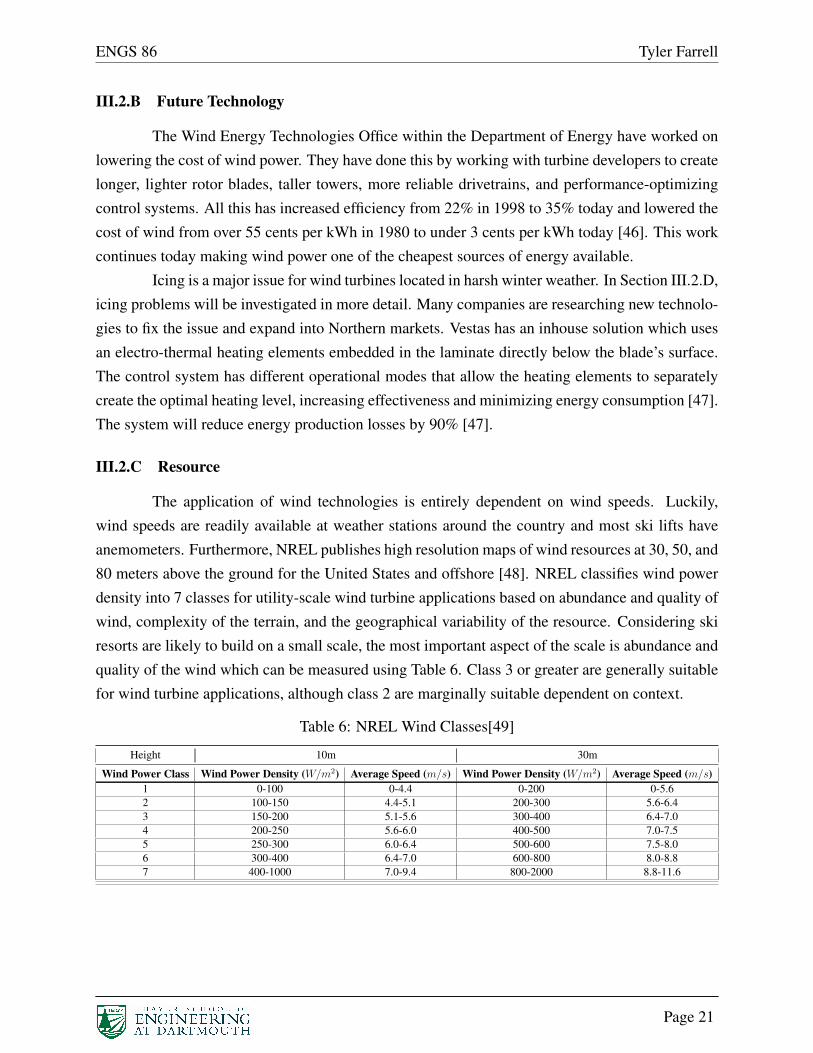
The application of wind technologies is entirely dependent on wind speeds. Luckily,wind speeds are readily available at weather stations around the country and most ski lifts haveanemometers. Furthermore, NREL publishes high resolution maps of wind resources at 30, 50, and80 meters above the ground for the United States and offshore [48]. NREL classifies wind powerdensity into 7 classes for utility-scale wind turbine applications based on abundance and quality ofwind, complexity of the terrain, and the geographical variability of the resource. Considering skiresorts are likely to build on a small scale, the most important aspect of the scale is abundance andquality of the wind which can be measured using Table 6. Class 3 or greater are generally suitablefor wind turbine applications, although class 2 are marginally suitable dependent on context.
Table 6: NREL Wind Classes[49]
Height 10m 30m
Wind Power Class Wind Power Density (W/m2) Average Speed (m/s) Wind Power Density (W/m2) Average Speed (m/s)1 0-100 0-4.4 0-200 0-5.62 100-150 4.4-5.1 200-300 5.6-6.43 150-200 5.1-5.6 300-400 6.4-7.04 200-250 5.6-6.0 400-500 7.0-7.55 250-300 6.0-6.4 500-600 7.5-8.06 300-400 6.4-7.0 600-800 8.0-8.87 400-1000 7.0-9.4 800-2000 8.8-11.6
Page 21
ENGS 86 Tyler Farrell
III.2.D Issues and Considerations
The biggest barrier to overcome when developing wind power is permitting and red tape.Wind turbines are inherently obstructive especially HAWTs and communities are hesitant to allowthem. These social and community issues can be dealt with if ski resorts engage with the com-munity early and openly. Both Jiminy Peak and Berkshire East contended with these issues andwere successful in implementing their respective turbines. Albeit, Berkshire East limited the sizeof their turbine to 900kW in response to community input. VAWTs are less obstructive and mayhave an easier time in navigating these complex legal and social pathways.
Turbine icing is a major consideration for ski resorts in areas with harsh winter weather.The reason why Jiminy Peak and Berkshire East are both practical locations for wind turbines isbecause they lie on the southern end of the Green Mountains where the weather is more suitablefor turbines. Both resorts stated that they had minimal down time, 3 to 5 days per season, for icingissues. However, for locations on the higher peaks of the Green Mountains, the Rockies and theWest Coast, we would expect more down times over the course of a season. These downtimes cancontribute to significant energy loss over the course of a season. A study on a wind farm in Norwayfound that icing events contribute to a production loss of 14% to 22% [50]. The actual loss will bea function of how harsh the weather is onsite, however these losses can be significant. To mitigatethe impact of icing there are a number of solutions. When locating the project, icing should be aconsideration in the locating process. Maximizing wind speeds on a high elevation ridge may notresult in maximizing energy production if the weather is too harsh. Rather locating the turbine on alower ridge or plain with lower wind speeds may result in higher energy production. Addtionally,there are technologies for deicing. Wicetec WIPS blade-heating elements provide a 0.5mm heateralong the outside of the blade that sheds any build up of ice. The heater can acheive 70% to 80%energy recover of icing losses.
Balancing the height of the turbine between energy production and visual obstruction canbe difficult to balance. The most typical turbine today is a 1.5 MW GE turbine which sits on a 212feet tower with a 116 feet blade. This makes the turbine a total of 328 feet high with a blade sweepof almost an acre. Overall, this is great for energy production, however it needs to be weightedwith the community input in mind. Berkshire East originally wanted to install a 1.5 MW turbinebut settled for a 900kW turbine to minimize the visual obstruction for the town.
The power produced by wind turbines is reduced when the density of air drops; this occursat high elevation and cold temperatures where many ski resorts are located. For every percentdecrease in density of air, there is an equal percent decrease in the power produced for a givenwind speed. For every 5�C drop in temperature there is approximately a 1.5% decrease in thedensity of the air. For every 1000ft of elevation gained there is approximately a 4% decrease in
Page 22
ENGS 86 Tyler Farrell
the density of air. These are significant factors, however the impact of wind speed is much greater.Where these factors may make a difference is deciding to locate a turbine onsite or offsite at alower elevation. The combination of elevation and temperature differences could impact powerproduction by 11% if you consider a 2,000 foot elevation and 10�C difference, which would bequite usual for a ski resort in the West region.
Wind turbines suffer from a bad reputation about killing birds. However, the myth thatturbines kill millions of birds is often overblown [51][52][53]. Only 150,000 to 500,000 birdsare killed each year by turbines which is significantly less than other causes such as cats (3.7billion), tower collisions (6.5 million), window collisions (300 million),and power line collisions(25 million) [51]. If the ski resort is located in an area with specific bird migration routes orendangered species, specific mitigation techniques can be employed to minimize bird collisions[54] including temporary shutdowns, night lighting, and radar bird and bat monitoring.
The footprint of a wind project is not significant. The average land use of a wind turbineis 1.5 acres/MW for the permament base and clearing [55]. The average ski resort will only requirea couple MW of power which means that the footprint of the site is quite small. Furthermore, thesite is just cleared of shrubs and trees so it can still be used for skiing and other activities.
III.2.E Economics
To evaluate the economic of wind there are two major determinants: capacity factor andcost per kilowatt. Capacity factor can be determined based off the amount of energy produced bythe array over the course of the year. It will depend on the considerations made and location of thesystem but is usually between 26% to 52%; the average capacity factor in 2015 was 42% [56]. In-stallation costs for land-based wind power projects are broken down to 67.3% turbine costs, 22.9%soft costs, and 9.7% financial costs. The actual cost will vary but HAWTs are between $1,500and $2,000 per kW in capital expenditure and $20 to $30 per kW per year in operational expenses[43]. VAWTs tend to have higher capital costs 2,742$/kW and similar operational expenses [57].However, VAWTs tend to have lower capacity factors.
III.3 Hydro
While not in the US, Whistler Blackcomb Ski Resort in British Columbia, Canada is agreat example to demonstrate hydropower. The Fitzsimmons hydro project is a 7.5 MW run-of-river power plant located on site between the resorts two mountains. The plant produces 32 GWhof electricity annually [13] covering the resorts annual energy consumption for it’s 38 lifts, 17restaurants, snow-making, and other buildings and services.
Page 23
ENGS 86 Tyler Farrell
III.3.A Current Technology
There are two types of hydropower facilities: impoundment and run-of-river. Impound-ment facilities are typical large power plants with dams that store river water in a reservoir. Whilerun-of-river facilities channel a portion of the river through a penstock and may not require a dam.Both types of facilities could be used in the context of ski resorts and follow the same energyconversion process defined by Equation (3).
P = ⇢Water ⇤ g ⇤ H ⇤ ⌘ ⇤Q. (3)
Where ⇢ is the density of water, 1000 kg/m3 , g is the acceleration of gravity, 9.8 m/s2,H is the head of the dam, the height between the intake and the generator, ⌘ is the efficiency of thesystem, and Q is the flow rate of the intake.
The deciding factor between the two types of facilities is maximizing the amount of head.Since head is a multiplier for factors of nature like density, flow rate, and efficiency, developers ofhydro projects will try to maximize the head of the facility by using a dam. Furthermore, a damallows for more control of power because it allows energy to be stored and released for the opera-tor. Although dams provide improve head and control, they come with controversial environmentaleffects such as degraded water quality, restricting fish passage, and destroying riparian ecosystems[58]. These environmental effects may not be palatable to mountain communities and lead to de-lays and permitting issues with state and federal fish and wildlife agencies. Overall, impoundmentfacilities may only be feasible in a select number of cases such as rivers with existing non-powereddams or snow making reservoirs.
Diversion hydropower minimizes environmental damage because they stores little or nowater and can allow for fish passage [59]. This makes it more appealing for ski communities andregions concerned about watershed health. For this paper we will look at micro and small scalediversion hydro. Micro-scale hydro is defined as < 500kW and small scale hydro is defined as500kW to 10MW . Both sizes are capable of meeting ski resort load.
Capacity depends on the flow rate and head. For diversion facilities, both depend on theengineering design of the dam. The flow rate will depend on the water resources available from theriver but will also depend on the percent of water diverted from the river’s flow rate. The percentof water diverted would be determined based on environmental limitations from state regulators orthe engineering design. The head will be dependant on the limitations of the topology and amountof land available for a penstock.
Page 24
ENGS 86 Tyler Farrell
III.3.B Future Technology
One of the Department of Energy’s areas of hydropower technology development is inlow-head hydropower and run-of-river technology. The DOE has targeted this area as an opportu-nity for simple, robust and economical development[60]. An example of innovation in this area isthe U.S’s first Archimedes Hydrodynamic Screw System seen in [60].
There are also a growing number of companies looking into micro and small scale hydrosuch as Turbulent, a Belgian hydropower developer. The company develops 5kW to 150kW tur-bines that use a vortex to produce power for low head environments (1.5 to 3.5m). Their design isfish friendly, low maintenance, easy and cheap to install, and has a long operating life (30+ years).Currently, they have 3 turbines operating in low head off grid conditions one might find at a skiresort [61].
III.3.C Resources
The application of hydro technology at ski resorts will depend on the water resourcesavailable in the area. As mentioned earlier, the power produced from a run-of-river facility is afunction of two factors of nature: head and flow rate. Head can be designed around topology andthe type of technology employed. Although dams are traditionally the method to maximize head,run-of-river plants can also maximize head using piping and topology, such as Whistler’s projectwhich gains 250 meters of head. On the other hand, flow rate is dependent on nature and how muchof the river can be diverted into a turbine. The percentage of the river diverted can be designedbased on the capacity of the turbine but also environmental regulations at the state and federallevel. To predict generation potential Equation (3) can be used in conjuncture with flow data fromthe USGS and topology data from a GIS source.
III.3.D Issues and Considerations
Many ski resorts are located in mountain range watersheds near rivers and streams. Thismakes hydro a compelling technology to deploy for the industry. However, there are a number ofthings to consider when addressing the water resources.
Variations in flow rate can cause low capacity factors for the facility if the turbine isdesigned for higher flow rates. Therefore, to maximize the utility of the facility, one should designthe turbine to operate at a mean flow rate for the year.
There are many water resources, especially at high altitude, that have no flow during thewinter. The Fitzsimmons project can be shut down for periods at a time when flow rates drop.To maintain power production over the course of the year, a ski area could locate the facility at alower elevation in the watershed. The example below shows the flow rates for various locations,
Page 25
ENGS 86 Tyler Farrell
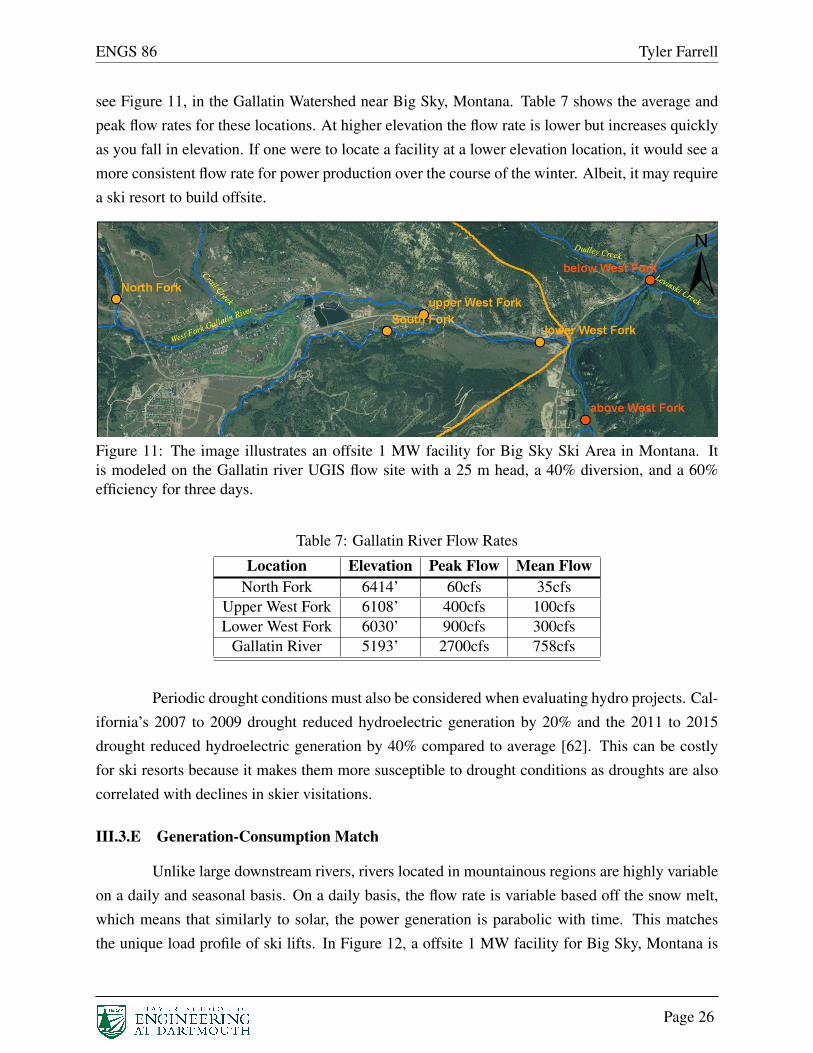
see Figure 11, in the Gallatin Watershed near Big Sky, Montana. Table 7 shows the average andpeak flow rates for these locations. At higher elevation the flow rate is lower but increases quicklyas you fall in elevation. If one were to locate a facility at a lower elevation location, it would see amore consistent flow rate for power production over the course of the winter. Albeit, it may requirea ski resort to build offsite.
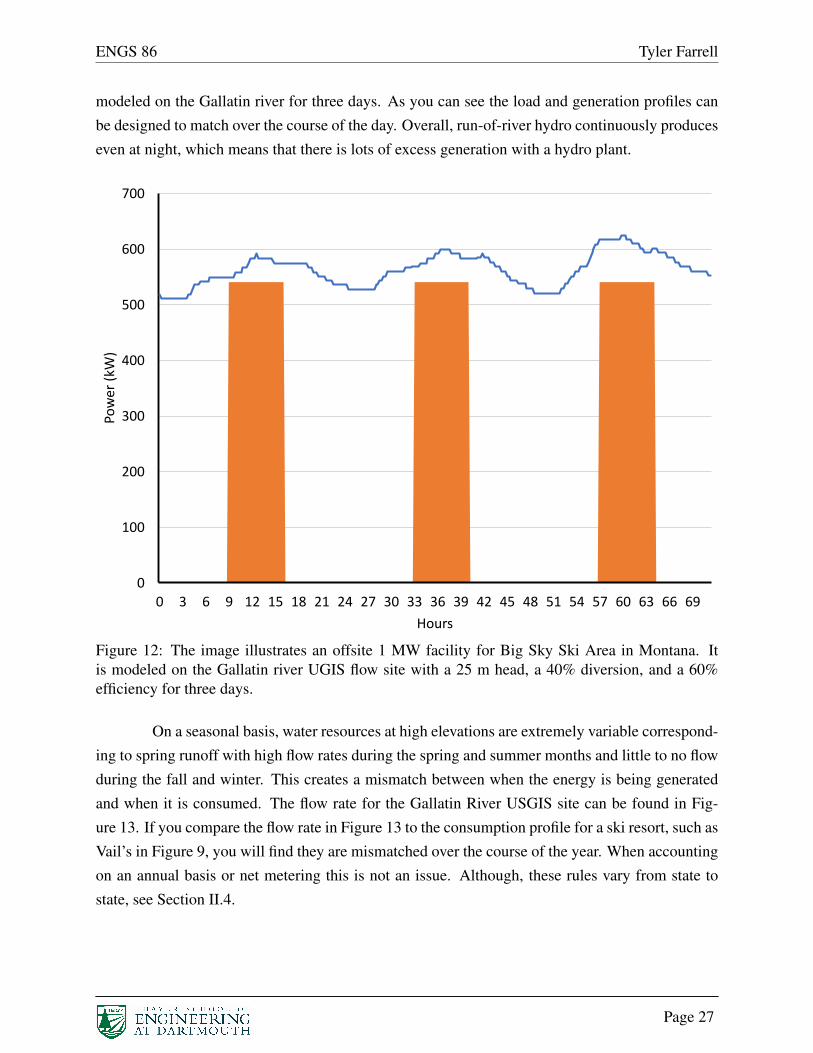
Figure 11: The image illustrates an offsite 1 MW facility for Big Sky Ski Area in Montana. Itis modeled on the Gallatin river UGIS flow site with a 25 m head, a 40% diversion, and a 60%efficiency for three days.
Table 7: Gallatin River Flow RatesLocation Elevation Peak Flow Mean Flow
North Fork 6414’ 60cfs 35cfsUpper West Fork 6108’ 400cfs 100cfsLower West Fork 6030’ 900cfs 300cfs
Gallatin River 5193’ 2700cfs 758cfs
Periodic drought conditions must also be considered when evaluating hydro projects. Cal-ifornia’s 2007 to 2009 drought reduced hydroelectric generation by 20% and the 2011 to 2015drought reduced hydroelectric generation by 40% compared to average [62]. This can be costlyfor ski resorts because it makes them more susceptible to drought conditions as droughts are alsocorrelated with declines in skier visitations.
III.3.E Generation-Consumption Match
Unlike large downstream rivers, rivers located in mountainous regions are highly variableon a daily and seasonal basis. On a daily basis, the flow rate is variable based off the snow melt,which means that similarly to solar, the power generation is parabolic with time. This matchesthe unique load profile of ski lifts. In Figure 12, a offsite 1 MW facility for Big Sky, Montana is
Page 26
ENGS 86 Tyler Farrell
modeled on the Gallatin river for three days. As you can see the load and generation profiles canbe designed to match over the course of the day. Overall, run-of-river hydro continuously produceseven at night, which means that there is lots of excess generation with a hydro plant.
0
100
200
300
400
500
600
700
0 3 6 9 12 15 18 21 24 27 30 33 36 39 42 45 48 51 54 57 60 63 66 69
Power(kW)
Hours
Figure 12: The image illustrates an offsite 1 MW facility for Big Sky Ski Area in Montana. Itis modeled on the Gallatin river UGIS flow site with a 25 m head, a 40% diversion, and a 60%efficiency for three days.
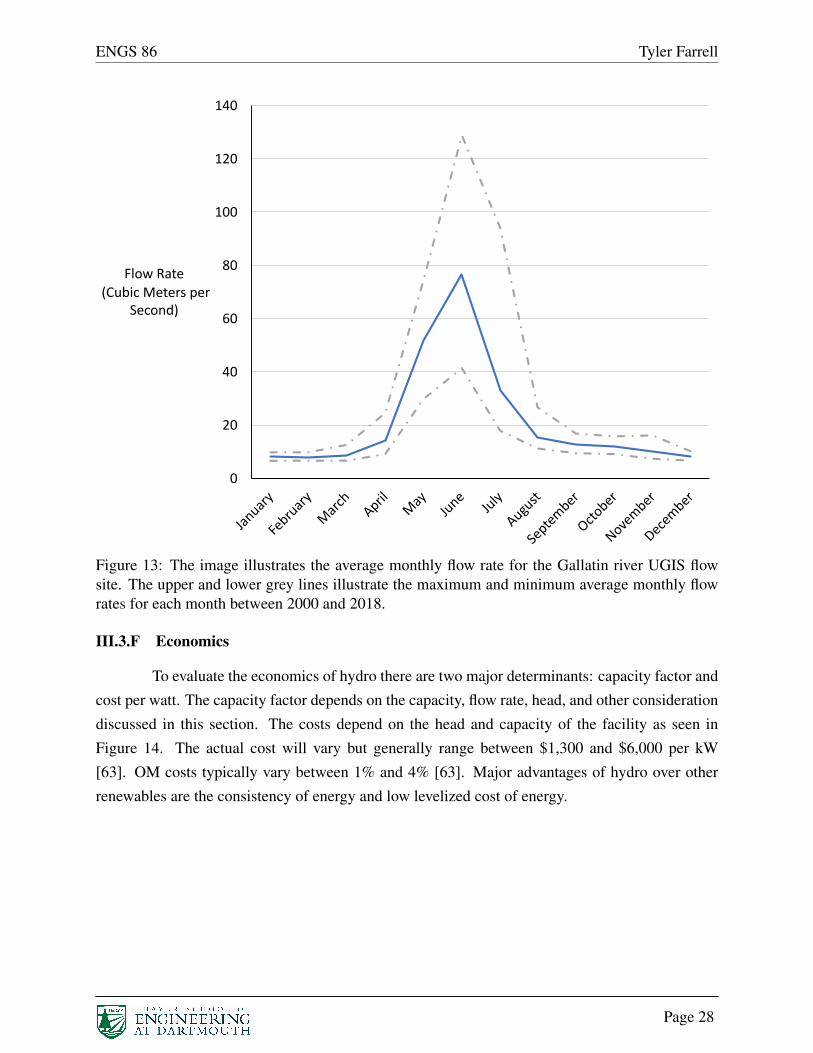
On a seasonal basis, water resources at high elevations are extremely variable correspond-ing to spring runoff with high flow rates during the spring and summer months and little to no flowduring the fall and winter. This creates a mismatch between when the energy is being generatedand when it is consumed. The flow rate for the Gallatin River USGIS site can be found in Fig-ure 13. If you compare the flow rate in Figure 13 to the consumption profile for a ski resort, such asVail’s in Figure 9, you will find they are mismatched over the course of the year. When accountingon an annual basis or net metering this is not an issue. Although, these rules vary from state tostate, see Section II.4.
Page 27
ENGS 86 Tyler Farrell
0
20
40
60
80
100
120
140
FlowRate(CubicMetersper
Second)
Figure 13: The image illustrates the average monthly flow rate for the Gallatin river UGIS flowsite. The upper and lower grey lines illustrate the maximum and minimum average monthly flowrates for each month between 2000 and 2018.
III.3.F Economics
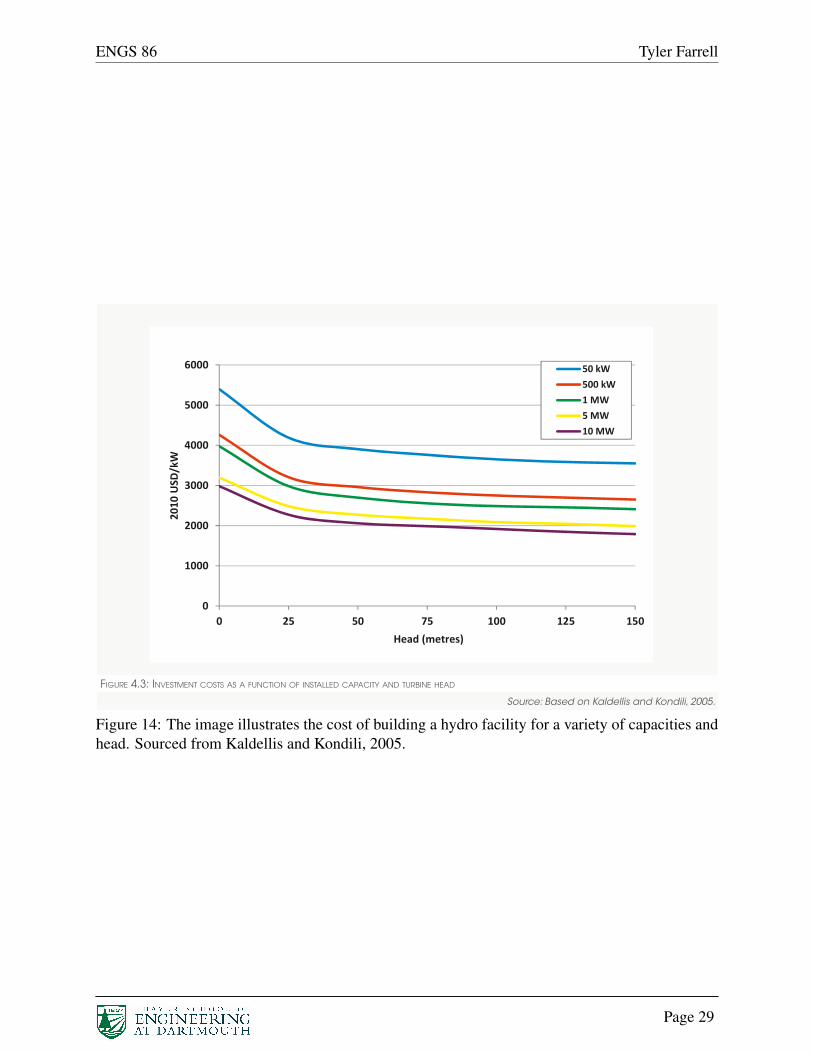
To evaluate the economics of hydro there are two major determinants: capacity factor andcost per watt. The capacity factor depends on the capacity, flow rate, head, and other considerationdiscussed in this section. The costs depend on the head and capacity of the facility as seen inFigure 14. The actual cost will vary but generally range between $1,300 and $6,000 per kW[63]. OM costs typically vary between 1% and 4% [63]. Major advantages of hydro over otherrenewables are the consistency of energy and low levelized cost of energy.
Page 28
ENGS 86 Tyler Farrell
19Cost Analysis of Hydropower
FIGURE 4.2: TOTAL INSTALLED HYDROPOWER COST RANGES BY COUNTRY
0
1000
2000
3000
4000
5000
6000
7000
8000
9000
Large Small Small tolarge
Large Small
European Union United States Canada Brazil China India OtherAsia
Africa
2010
USD
/kW
FIGURE 4.3: INVESTMENT COSTS AS A FUNCTION OF INSTALLED CAPACITY AND TURBINE HEAD
0
1000
2000
3000
4000
5000
6000
0 25 50 75 100 125 150
2010
USD
/kW
Head (metres)
50 kW500 kW1 MW5 MW10 MW
Sources: IRENA, 2011; IEA, 2010b; Black & Veatch, 2012; and IRENA/GIZ.
Source: Based on Kaldellis and Kondili, 2005.
Figure 14: The image illustrates the cost of building a hydro facility for a variety of capacities andhead. Sourced from Kaldellis and Kondili, 2005.
Page 29
ENGS 86 Tyler Farrell
IV Economics and Market Analysis
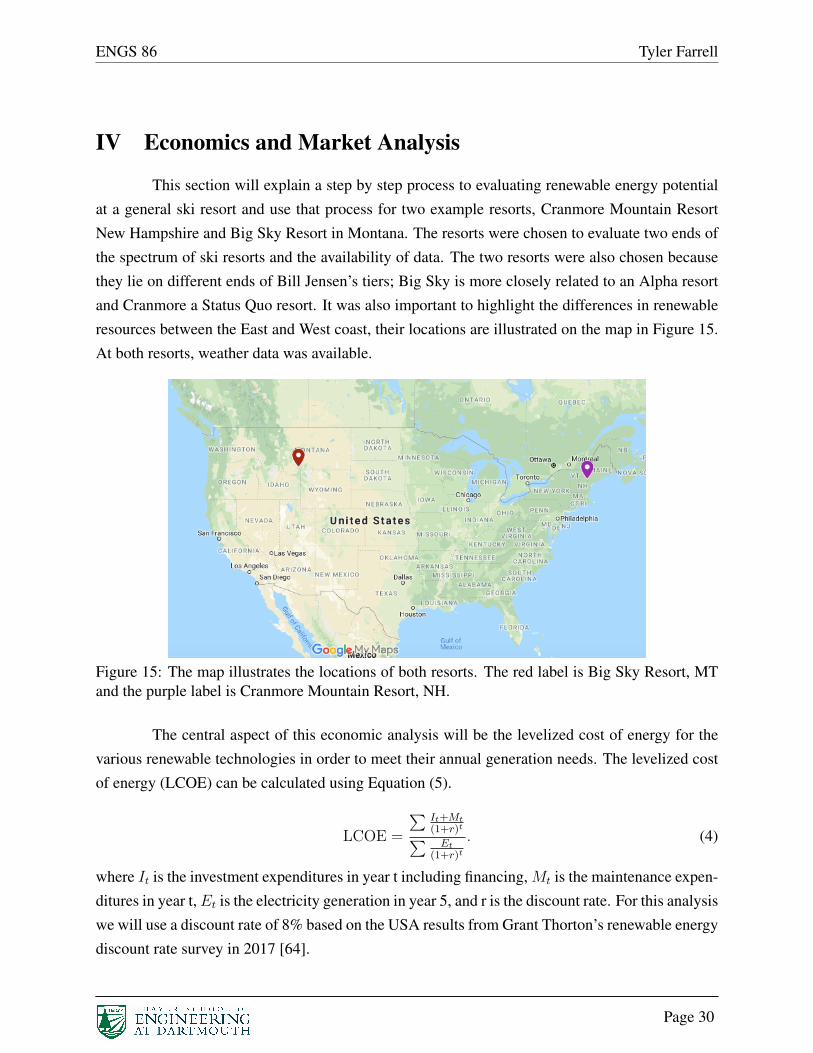
This section will explain a step by step process to evaluating renewable energy potentialat a general ski resort and use that process for two example resorts, Cranmore Mountain ResortNew Hampshire and Big Sky Resort in Montana. The resorts were chosen to evaluate two ends ofthe spectrum of ski resorts and the availability of data. The two resorts were also chosen becausethey lie on different ends of Bill Jensen’s tiers; Big Sky is more closely related to an Alpha resortand Cranmore a Status Quo resort. It was also important to highlight the differences in renewableresources between the East and West coast, their locations are illustrated on the map in Figure 15.At both resorts, weather data was available.
Figure 15: The map illustrates the locations of both resorts. The red label is Big Sky Resort, MTand the purple label is Cranmore Mountain Resort, NH.
The central aspect of this economic analysis will be the levelized cost of energy for thevarious renewable technologies in order to meet their annual generation needs. The levelized costof energy (LCOE) can be calculated using Equation (5).
LCOE =
PIt+Mt(1+r)tPEt
(1+r)t
. (4)
where It is the investment expenditures in year t including financing, Mt is the maintenance expen-ditures in year t, Et is the electricity generation in year 5, and r is the discount rate. For this analysiswe will use a discount rate of 8% based on the USA results from Grant Thorton’s renewable energydiscount rate survey in 2017 [64].
Page 30
ENGS 86 Tyler Farrell
IV.1 East Coast Example: Cranmore Mountain Resort NH
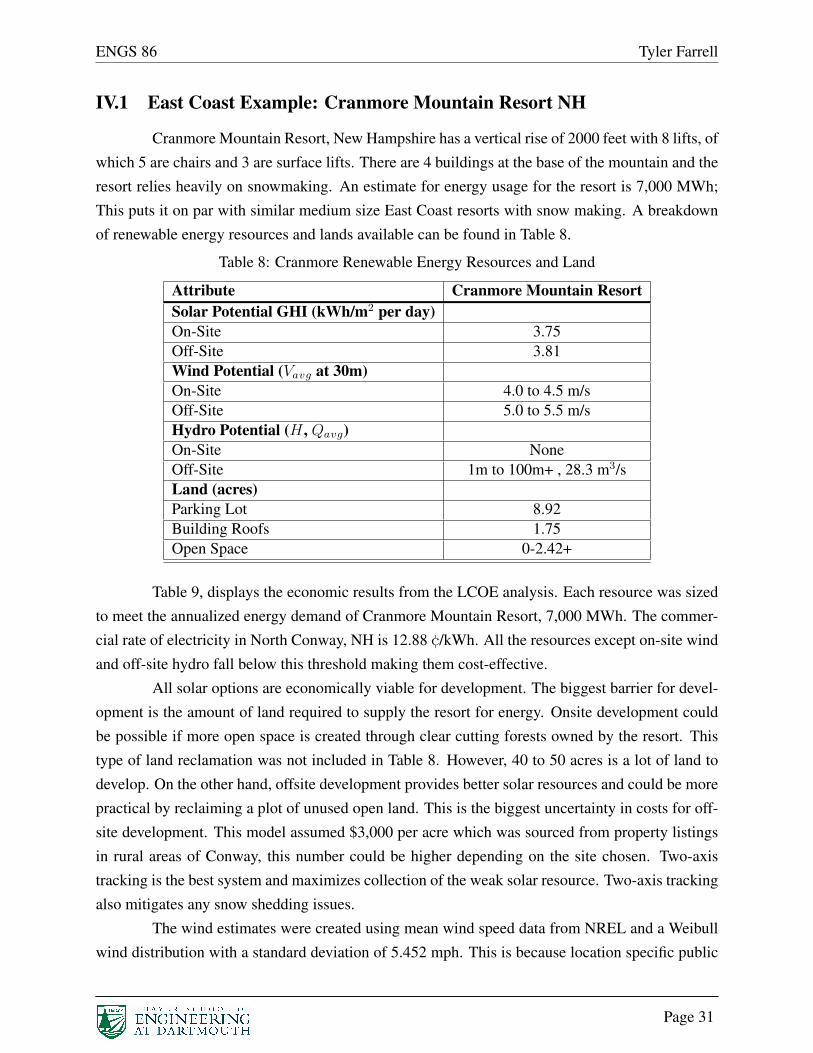
Cranmore Mountain Resort, New Hampshire has a vertical rise of 2000 feet with 8 lifts, ofwhich 5 are chairs and 3 are surface lifts. There are 4 buildings at the base of the mountain and theresort relies heavily on snowmaking. An estimate for energy usage for the resort is 7,000 MWh;This puts it on par with similar medium size East Coast resorts with snow making. A breakdownof renewable energy resources and lands available can be found in Table 8.
Table 8: Cranmore Renewable Energy Resources and Land
Attribute Cranmore Mountain ResortSolar Potential GHI (kWh/m2 per day)On-Site 3.75Off-Site 3.81Wind Potential (Vavg at 30m)On-Site 4.0 to 4.5 m/sOff-Site 5.0 to 5.5 m/sHydro Potential (H , Qavg)On-Site NoneOff-Site 1m to 100m+ , 28.3 m3/sLand (acres)Parking Lot 8.92Building Roofs 1.75Open Space 0-2.42+
Table 9, displays the economic results from the LCOE analysis. Each resource was sizedto meet the annualized energy demand of Cranmore Mountain Resort, 7,000 MWh. The commer-cial rate of electricity in North Conway, NH is 12.88 ¢/kWh. All the resources except on-site windand off-site hydro fall below this threshold making them cost-effective.
All solar options are economically viable for development. The biggest barrier for devel-opment is the amount of land required to supply the resort for energy. Onsite development couldbe possible if more open space is created through clear cutting forests owned by the resort. Thistype of land reclamation was not included in Table 8. However, 40 to 50 acres is a lot of land todevelop. On the other hand, offsite development provides better solar resources and could be morepractical by reclaiming a plot of unused open land. This is the biggest uncertainty in costs for off-site development. This model assumed $3,000 per acre which was sourced from property listingsin rural areas of Conway, this number could be higher depending on the site chosen. Two-axistracking is the best system and maximizes collection of the weak solar resource. Two-axis trackingalso mitigates any snow shedding issues.
The wind estimates were created using mean wind speed data from NREL and a Weibullwind distribution with a standard deviation of 5.452 mph. This is because location specific public
Page 31
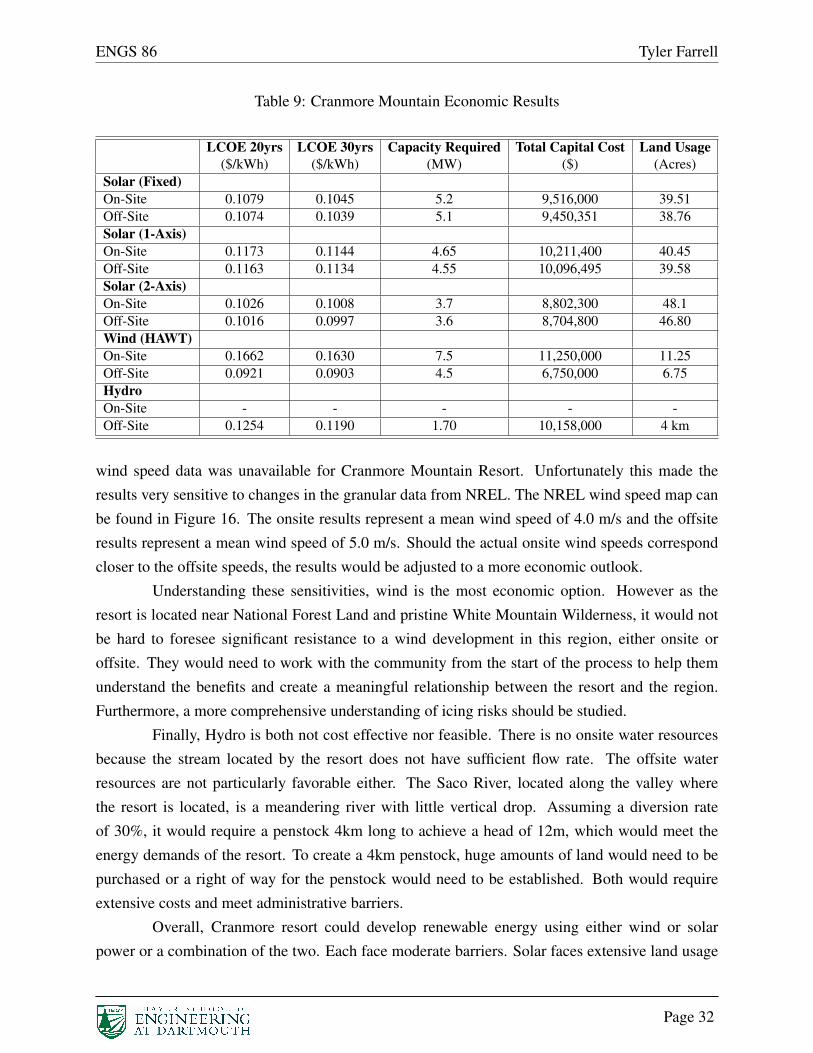
ENGS 86 Tyler Farrell
Table 9: Cranmore Mountain Economic Results
LCOE 20yrs LCOE 30yrs Capacity Required Total Capital Cost Land Usage($/kWh) ($/kWh) (MW) ($) (Acres)
Solar (Fixed)On-Site 0.1079 0.1045 5.2 9,516,000 39.51Off-Site 0.1074 0.1039 5.1 9,450,351 38.76Solar (1-Axis)On-Site 0.1173 0.1144 4.65 10,211,400 40.45Off-Site 0.1163 0.1134 4.55 10,096,495 39.58Solar (2-Axis)On-Site 0.1026 0.1008 3.7 8,802,300 48.1Off-Site 0.1016 0.0997 3.6 8,704,800 46.80Wind (HAWT)On-Site 0.1662 0.1630 7.5 11,250,000 11.25Off-Site 0.0921 0.0903 4.5 6,750,000 6.75HydroOn-Site - - - - -Off-Site 0.1254 0.1190 1.70 10,158,000 4 km
wind speed data was unavailable for Cranmore Mountain Resort. Unfortunately this made theresults very sensitive to changes in the granular data from NREL. The NREL wind speed map canbe found in Figure 16. The onsite results represent a mean wind speed of 4.0 m/s and the offsiteresults represent a mean wind speed of 5.0 m/s. Should the actual onsite wind speeds correspondcloser to the offsite speeds, the results would be adjusted to a more economic outlook.
Understanding these sensitivities, wind is the most economic option. However as theresort is located near National Forest Land and pristine White Mountain Wilderness, it would notbe hard to foresee significant resistance to a wind development in this region, either onsite oroffsite. They would need to work with the community from the start of the process to help themunderstand the benefits and create a meaningful relationship between the resort and the region.Furthermore, a more comprehensive understanding of icing risks should be studied.
Finally, Hydro is both not cost effective nor feasible. There is no onsite water resourcesbecause the stream located by the resort does not have sufficient flow rate. The offsite waterresources are not particularly favorable either. The Saco River, located along the valley wherethe resort is located, is a meandering river with little vertical drop. Assuming a diversion rateof 30%, it would require a penstock 4km long to achieve a head of 12m, which would meet theenergy demands of the resort. To create a 4km penstock, huge amounts of land would need to bepurchased or a right of way for the penstock would need to be established. Both would requireextensive costs and meet administrative barriers.
Overall, Cranmore resort could develop renewable energy using either wind or solarpower or a combination of the two. Each face moderate barriers. Solar faces extensive land usage
Page 32
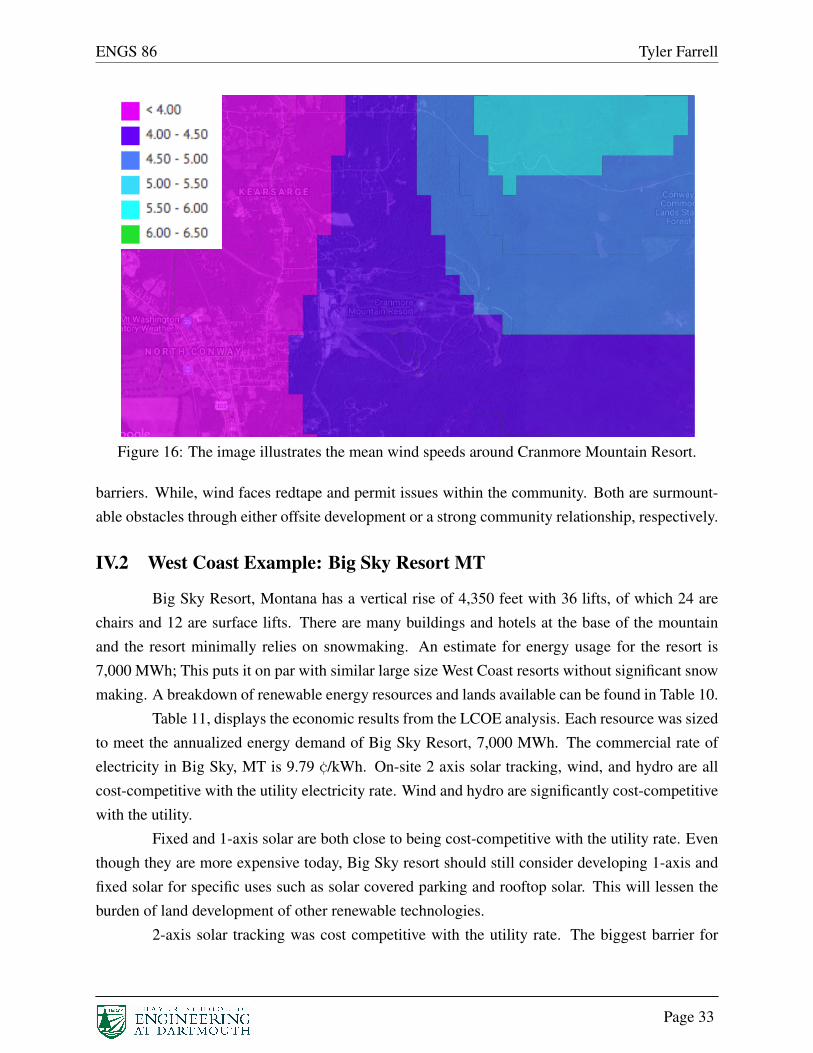
ENGS 86 Tyler Farrell
Figure 16: The image illustrates the mean wind speeds around Cranmore Mountain Resort.
barriers. While, wind faces redtape and permit issues within the community. Both are surmount-able obstacles through either offsite development or a strong community relationship, respectively.
IV.2 West Coast Example: Big Sky Resort MT
Big Sky Resort, Montana has a vertical rise of 4,350 feet with 36 lifts, of which 24 arechairs and 12 are surface lifts. There are many buildings and hotels at the base of the mountainand the resort minimally relies on snowmaking. An estimate for energy usage for the resort is7,000 MWh; This puts it on par with similar large size West Coast resorts without significant snowmaking. A breakdown of renewable energy resources and lands available can be found in Table 10.
Table 11, displays the economic results from the LCOE analysis. Each resource was sizedto meet the annualized energy demand of Big Sky Resort, 7,000 MWh. The commercial rate ofelectricity in Big Sky, MT is 9.79 ¢/kWh. On-site 2 axis solar tracking, wind, and hydro are allcost-competitive with the utility electricity rate. Wind and hydro are significantly cost-competitivewith the utility.
Fixed and 1-axis solar are both close to being cost-competitive with the utility rate. Eventhough they are more expensive today, Big Sky resort should still consider developing 1-axis andfixed solar for specific uses such as solar covered parking and rooftop solar. This will lessen theburden of land development of other renewable technologies.
2-axis solar tracking was cost competitive with the utility rate. The biggest barrier for
Page 33
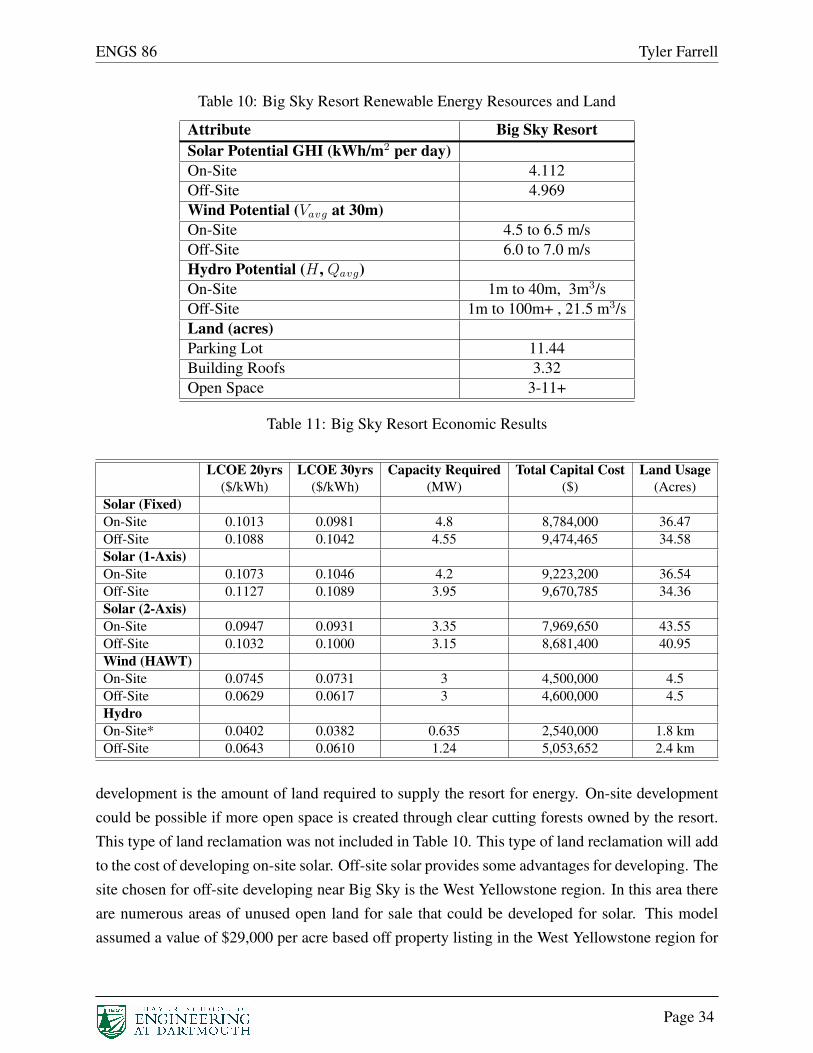
ENGS 86 Tyler Farrell
Table 10: Big Sky Resort Renewable Energy Resources and Land
Attribute Big Sky ResortSolar Potential GHI (kWh/m2 per day)On-Site 4.112Off-Site 4.969Wind Potential (Vavg at 30m)On-Site 4.5 to 6.5 m/sOff-Site 6.0 to 7.0 m/sHydro Potential (H , Qavg)On-Site 1m to 40m, 3m3/sOff-Site 1m to 100m+ , 21.5 m3/sLand (acres)Parking Lot 11.44Building Roofs 3.32Open Space 3-11+
Table 11: Big Sky Resort Economic Results
LCOE 20yrs LCOE 30yrs Capacity Required Total Capital Cost Land Usage($/kWh) ($/kWh) (MW) ($) (Acres)
Solar (Fixed)On-Site 0.1013 0.0981 4.8 8,784,000 36.47Off-Site 0.1088 0.1042 4.55 9,474,465 34.58Solar (1-Axis)On-Site 0.1073 0.1046 4.2 9,223,200 36.54Off-Site 0.1127 0.1089 3.95 9,670,785 34.36Solar (2-Axis)On-Site 0.0947 0.0931 3.35 7,969,650 43.55Off-Site 0.1032 0.1000 3.15 8,681,400 40.95Wind (HAWT)On-Site 0.0745 0.0731 3 4,500,000 4.5Off-Site 0.0629 0.0617 3 4,600,000 4.5HydroOn-Site* 0.0402 0.0382 0.635 2,540,000 1.8 kmOff-Site 0.0643 0.0610 1.24 5,053,652 2.4 km
development is the amount of land required to supply the resort for energy. On-site developmentcould be possible if more open space is created through clear cutting forests owned by the resort.This type of land reclamation was not included in Table 10. This type of land reclamation will addto the cost of developing on-site solar. Off-site solar provides some advantages for developing. Thesite chosen for off-site developing near Big Sky is the West Yellowstone region. In this area thereare numerous areas of unused open land for sale that could be developed for solar. This modelassumed a value of $29,000 per acre based off property listing in the West Yellowstone region for
Page 34
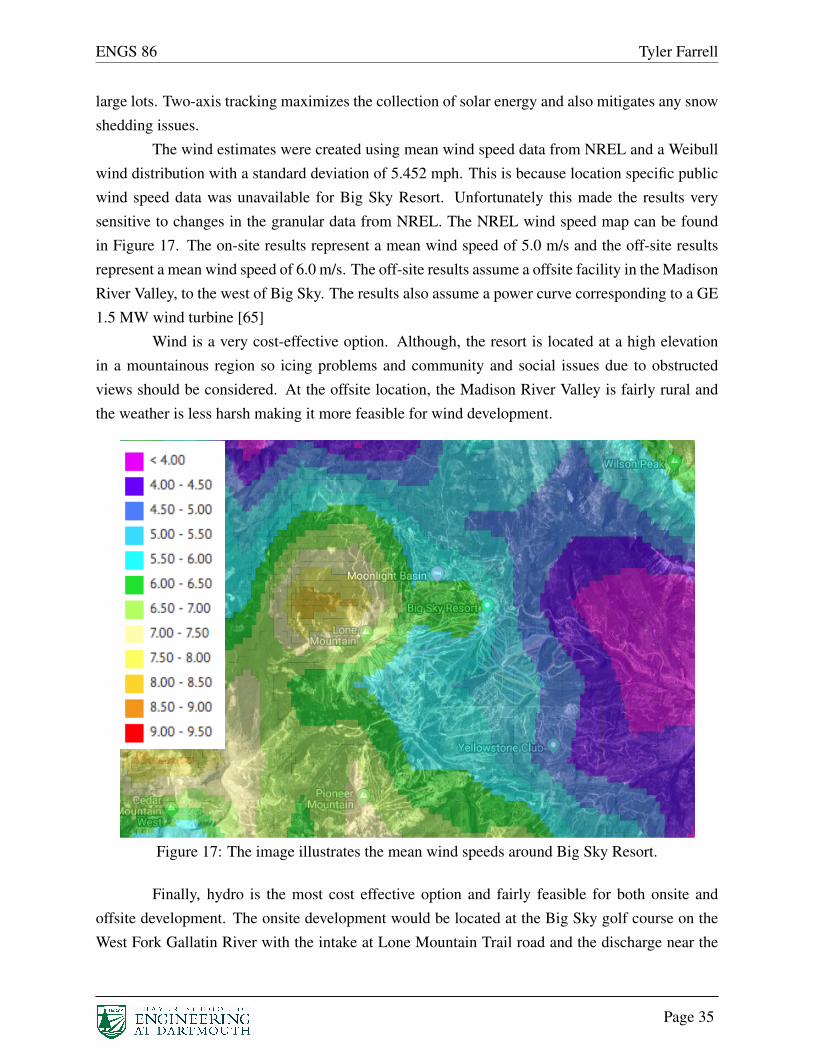
ENGS 86 Tyler Farrell
large lots. Two-axis tracking maximizes the collection of solar energy and also mitigates any snowshedding issues.
The wind estimates were created using mean wind speed data from NREL and a Weibullwind distribution with a standard deviation of 5.452 mph. This is because location specific publicwind speed data was unavailable for Big Sky Resort. Unfortunately this made the results verysensitive to changes in the granular data from NREL. The NREL wind speed map can be foundin Figure 17. The on-site results represent a mean wind speed of 5.0 m/s and the off-site resultsrepresent a mean wind speed of 6.0 m/s. The off-site results assume a offsite facility in the MadisonRiver Valley, to the west of Big Sky. The results also assume a power curve corresponding to a GE1.5 MW wind turbine [65]
Wind is a very cost-effective option. Although, the resort is located at a high elevationin a mountainous region so icing problems and community and social issues due to obstructedviews should be considered. At the offsite location, the Madison River Valley is fairly rural andthe weather is less harsh making it more feasible for wind development.
Figure 17: The image illustrates the mean wind speeds around Big Sky Resort.
Finally, hydro is the most cost effective option and fairly feasible for both onsite andoffsite development. The onsite development would be located at the Big Sky golf course on theWest Fork Gallatin River with the intake at Lone Mountain Trail road and the discharge near the
Page 35
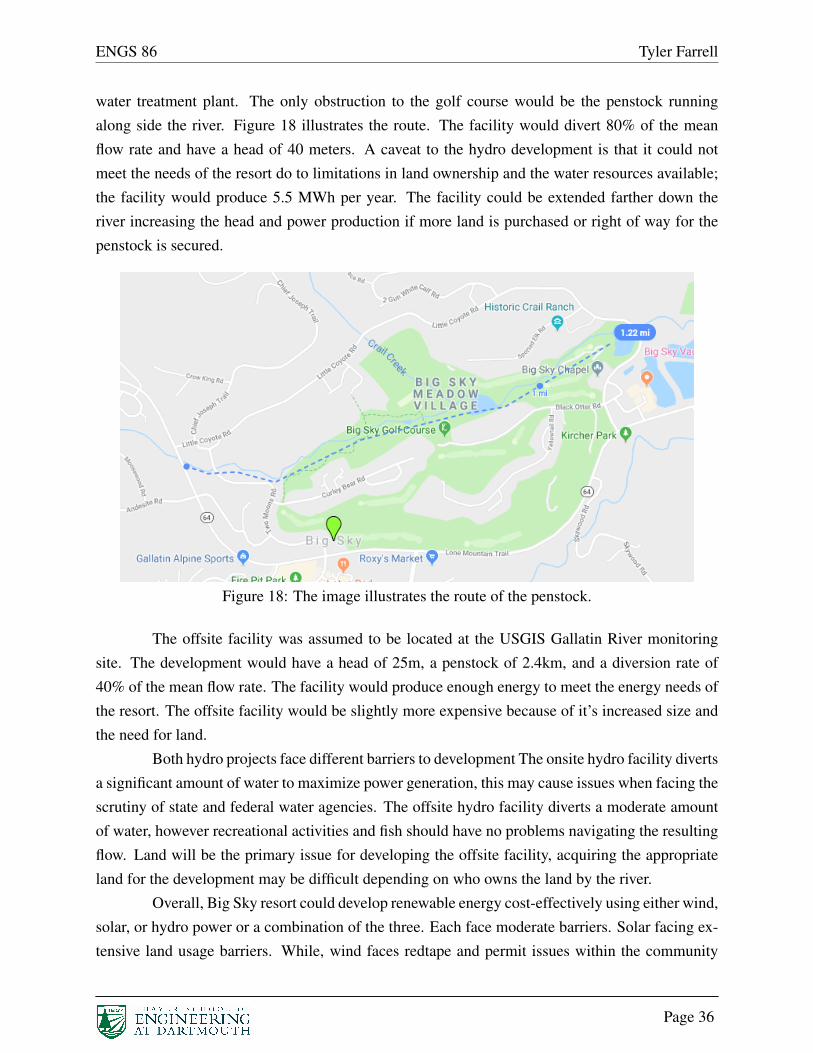
ENGS 86 Tyler Farrell
water treatment plant. The only obstruction to the golf course would be the penstock runningalong side the river. Figure 18 illustrates the route. The facility would divert 80% of the meanflow rate and have a head of 40 meters. A caveat to the hydro development is that it could notmeet the needs of the resort do to limitations in land ownership and the water resources available;the facility would produce 5.5 MWh per year. The facility could be extended farther down theriver increasing the head and power production if more land is purchased or right of way for thepenstock is secured.
Figure 18: The image illustrates the route of the penstock.
The offsite facility was assumed to be located at the USGIS Gallatin River monitoringsite. The development would have a head of 25m, a penstock of 2.4km, and a diversion rate of40% of the mean flow rate. The facility would produce enough energy to meet the energy needs ofthe resort. The offsite facility would be slightly more expensive because of it’s increased size andthe need for land.
Both hydro projects face different barriers to development The onsite hydro facility divertsa significant amount of water to maximize power generation, this may cause issues when facing thescrutiny of state and federal water agencies. The offsite hydro facility diverts a moderate amountof water, however recreational activities and fish should have no problems navigating the resultingflow. Land will be the primary issue for developing the offsite facility, acquiring the appropriateland for the development may be difficult depending on who owns the land by the river.
Overall, Big Sky resort could develop renewable energy cost-effectively using either wind,solar, or hydro power or a combination of the three. Each face moderate barriers. Solar facing ex-tensive land usage barriers. While, wind faces redtape and permit issues within the community
Page 36

ENGS 86 Tyler Farrell
for onsite and offsite development and icing problems for onsite development. Hydro seems tohave little barriers, however state and federal regulations and land usage issues may delay or pre-vent development. All are surmountable obstacles through either offsite development or a strongcommunity business relationship.
Page 37
ENGS 86 Tyler Farrell
V Conclusion
Renewable energy is important for ski resorts to maintain and grow the industry into thefuture. There is a great opportunity for ski resorts to lead the way to a green future. The reportfinds that all three renewable technologies (Solar, Wind, and Hydro) are feasible and appropriatefor implementation at ski resorts with individual considerations to be taken in context. There is arenewable energy option for every ski resort, however there is not a single solution for all in thecontext of barriers and technologies. Overall, there is an opportunity for ski resorts or a third partyto take the lead on renewable development.
V.1 Conclusion for Ski Resorts
The majority of ski resorts may not feel the brunt of climate change today, however theywill in the future. Both Berkshire East and Jiminy Peak have demonstrated that renewable energycan not only help in the fight against climate change but when the effects of it come renewableenergy will be the key for survival. Both resorts stand alone in Western Massachusetts as successstories as resorts around them fall to shorter seasons, higher snow making costs, and the lackof energy security. Every ski resort has the potential to implement renewable energy and manyare in prime regions for development. It takes foresight but the benefits far out weight a newchairlift,lodge, or groomer in the long run.
V.2 Conclusion for Skiers and Snowboarders
Ski resorts need to take action on their emissions, however we too as skiers are responsiblefor our actions. A report from the French NGO Mountain Riders found that your mode of trans-portation is responsible for 73% of your carbon emissions for a day of skiing [66]. This study wasdone in France and assumed many of the visitors were flying from places like Paris, Germany, andEngland. Albeit, our actions on how to get to the resort is a big piece of the puzzle. There are manyalternatives including carpooling, electric cars, and public transportation that bring down your car-bon footprint and help protect our winters. To learn more about the effects of climate change onthe ski and snowboard industry please read the POW annual report and join the organization atwww.protectourwinters.org. There is also a responsibility for skiers to support the ski resort’s inthe process of developing renewable technologies by helping convince the community to go green,sign ”petitions” to support development, and learn about green energies through education.
Page 38
ENGS 86 Tyler Farrell
References
[1] NSAA, “Sustainable Slopes 2018 Annual Report.” [Online]. Available: http://www.nsaa.org/media/340465/AR2018FINAL.pdf
[2] M. Popejoy, “The Contradiction of Fossil Fuel-Powered Ski Resorts,” May 2018. [Online].Available: https://kahtoola.com/the-contradiction-of-fossil-fuel-powered-ski-resorts/
[3] NSAA, “Skiing: Not as Expensive as You Might Think.” [Online]. Available:http://www.nsaa.org/media/186201/ticketpricearticle.pdf
[4] “So You Want to Buy a Small Ski Resort? | STEEZ MAGAZINE R� - INFLU-ENTIAL CULTURE.” [Online]. Available: http://www.steezminimag.com/2015/10/22/so-you-want-to-buy-a-small-ski-resort/
[5] “Why Snowmaking Has Become a Paradox to Ski Resorts,” Aug. 2017. [Online]. Available:https://www.powder.com/stories/news/like-not-snowmaking-future/
[6] P. O. Winters, “Protect Our Winters 2018 Annual Report.”
[7] U. Probstl, A. Jiricka, and F. Hindinger, “Renewable energy in winter sports destinations –desired, ignored or rejected?” p. 10.
[8] C. M. Little and M. D. Needham, “Skier and Snowboarder Motivations and KnowledgeRelated to Voluntary Environmental Programs at an Alpine Ski Area,” Environmental
Management, vol. 48, no. 5, pp. 895–909, Nov. 2011. [Online]. Available: http://link.springer.com/10.1007/s00267-011-9734-0
[9] A. Olivero, “Xcel Energy outage results in numerous closures at Sum-mit County ski resorts.” [Online]. Available: https://www.summitdaily.com/news/xcel-energy-outage-results-in-morning-closures-at-summit-county-ski-resorts/
[10] C. Wobus, E. E. Small, H. Hosterman, D. Mills, J. Stein, M. Rissing, R. Jones,M. Duckworth, R. Hall, M. Kolian, J. Creason, and J. Martinich, “Projected climatechange impacts on skiing and snowmobiling: A case study of the United States,”Global Environmental Change, vol. 45, pp. 1–14, Jul. 2017. [Online]. Available:https://linkinghub.elsevier.com/retrieve/pii/S0959378016305556
[11] J. Rogstam and M. Dahlberg, “Energy usage for snowmaking,” p. 101.
[12] G. Epstein, R. Dixon, and B. McCowan, “Energy Efficiency Opportunities for Ski IndustrySnowmaking Processes,” p. 14.
Page 39
ENGS 86 Tyler Farrell
[13] “Energy.” [Online]. Available: https://www.whistlerblackcomb.com/explore-the-resort/about-the-resort/environment/energy.aspx
[14] M. Krarti, “Feasibility Study of Distributed Energy Generation at a Colorado Ski Resort,”in Volume 2: Photovoltaics; Renewable-Non-Renewable Hybrid Power System; Smart Grid,
Micro-Grid Concepts; Energy Storage; Solar Chemistry; Solar Heating and Cooling;
Sustainable Cities and Communities, Transportation; Symposium on Integrated/Sustainable
Building Equipment and Systems; Thermofluid Analysis of Energy Systems Including
Exergy and Thermoeconomics; Wind Energy Systems and Technologies. San Diego,California, USA: ASME, Jun. 2015, p. V002T16A002. [Online]. Available: http://proceedings.asmedigitalcollection.asme.org/proceeding.aspx?doi=10.1115/ES2015-49129
[15] “Green Initiatives.” [Online]. Available: https://www.jiminypeak.com/green
[16] “Snowmaking Capital Project.” [Online]. Available: https://www.sugarbowl.com/snowmaking
[17] “Boreal Mountain Resort.” [Online]. Available: https://www.rideboreal.com/press-solar-1
[18] “Berkshire Renewable Energy | Renewable Energy.” [Online]. Available: https://berkshireeast.com/berkshire-renewable-energy/
[19] U. F. Service, “U.S. Forest Service: Ski Area Program.” [Online]. Available: https://www.fs.fed.us/recreation/programs/ski water rights/documents/ski area program info.pdf
[20] J. Brooke, “Environmentalists Battle Growth of Ski Resorts,” The New York
Times, Jan. 1999. [Online]. Available: https://www.nytimes.com/1999/01/19/us/environmentalists-battle-growth-of-ski-resorts.html
[21] R. Karsteadt, D. Dahle, D. Heimiller, and T. Nealon, “Assessing the Potential for RenewableEnergy on National Forest System Lands,” p. 123.
[22] L. Glendenning, “In Denver, ski industry experts ponder busi-ness uncertainties.” [Online]. Available: https://www.vaildaily.com/news/in-denver-ski-industry-experts-ponder-business-uncertainties/
[23] ameliatraynor, “Industry Expert: 32% of Ski Resorts Won’t Last,” Feb. 2015. [Online].Available: https://snowbrains.com/industry-experts-32-ski-resorts-wont-last/
[24] “Vail Resorts Commits to $175 Million to $180 Million in Capital Investments to Reimaginethe Guest Experience for the 2019-20 Season | Vail Resorts Corporate.” [Online]. Available:http://news.vailresorts.com/corporate/vailresorts/201920capital.htm
Page 40
ENGS 86 Tyler Farrell
[25] D. Feldman and R. Margolis, “To Own or Lease Solar: Understanding CommercialRetailers’ Decisions to Use Alternative Financing Models,” Tech. Rep. NREL/TP–6A20-63216, 1167054, Dec. 2014. [Online]. Available: http://www.osti.gov/servlets/purl/1167054/
[26] “Virtual contracts drive a boom in corporate renew-ables procurement.” [Online]. Available: https://www.utilitydive.com/news/virtual-contracts-drive-a-boom-in-corporate-renewables-procurement/540181/
[27] O. US EPA, “Physical Power Purchase Agreements (PhysicalPPAs),” Jul. 2018. [Online]. Available: https://www.epa.gov/greenpower/physical-power-purchase-agreements-physical-ppas
[28] r. S. Jul 4 2013February 2 and . |. . R. Footnotes, “Lowell Mountains wind project:The great divider,” Jul. 2013. [Online]. Available: https://vtdigger.org/2013/07/04/lowell-mountains-wind-project-the-great-divider/
[29] S. Roth, “California’s San Bernardino County slams the brakes onbig solar projects.” [Online]. Available: https://www.latimes.com/business/la-fi-san-bernardino-solar-renewable-energy-20190228-story.html
[30] J. DeForge, “Hurricane Irene recovery begins in Western Massachusetts,” Aug. 2011.[Online]. Available: https://www.masslive.com/news/2011/08/recovery begins in the wakeof.html
[31] “Colorado ski area becomes nation’s first solar powered,” May 2018. [Online]. Available:http://mountaintownnews.net/2018/05/11/nations-first-solar-powered-ski-area-6047/
[32] “Calculate Your Solar Panel Payback Period | EnergySage,” Oct. 2018. [Online]. Available:https://news.energysage.com/understanding-your-solar-panel-payback-period/
[33] R. Fu, D. Feldman, and R. Margolis, “U.S. Solar Photovoltaic System Cost Benchmark: Q12018,” Renewable Energy, p. 63, 2018.
[34] “Solar Panel Efficiency: What Panels Are Most Efficient? | En-ergySage,” Mar. 2019. [Online]. Available: https://news.energysage.com/what-are-the-most-efficient-solar-panels-on-the-market/
[35] “Are Solar Trackers Worth It in 2019? | EnergySage,” Jan. 2018. [Online]. Available:https://news.energysage.com/solar-trackers-everything-need-know/
Page 41
ENGS 86 Tyler Farrell
[36] A. Bahrami, C. O. Okoye, and U. Atikol, “The effect of latitude on the performance ofdifferent solar trackers in Europe and Africa,” Applied Energy, vol. 177, pp. 896–906, Sep.2016. [Online]. Available: https://linkinghub.elsevier.com/retrieve/pii/S0306261916307085
[37] J. Simon and G. Mosey, “Feasibility Study of Economics and Performance of SolarPhotovoltaics at the Kerr McGee Site in Columbus, Mississippi. A Study Prepared inPartnership with the Environmental Protection Agency for the RE-Powering America’sLand Initiative: Siting Renewable Energy on Potentially Contaminated Land and MineSites,” Tech. Rep. NREL/TP-7A30-57251, 1068606, Jan. 2013. [Online]. Available:http://www.osti.gov/servlets/purl/1068606/
[38] “The SunShot Initiative.” [Online]. Available: https://www.energy.gov/eere/solar/sunshot-initiative
[39] “PV Capacity Factors | Electricity Markets and Policy Group.” [Online]. Available:https://emp.lbl.gov/pv-capacity-factors
[40] S. Ong, C. Campbell, P. Denholm, R. Margolis, and G. Heath, “Land-Use Requirements forSolar Power Plants in the United States,” Tech. Rep. NREL/TP-6A20-56290, 1086349, Jun.2013. [Online]. Available: http://www.osti.gov/servlets/purl/1086349/
[41] “United States – Lift Blog.” [Online]. Available: https://liftblog.com/united-states/
[42] “Seasonal Solar power.” [Online]. Available: http://jaharrison.me.uk/Misc/Solar/index.html
[43] R. Wiser and M. Bolinger, “DOE 2017 Wind Technologies Market Re-port,” 2017. [Online]. Available: https://www.energy.gov/sites/prod/files/2018/08/f54/2017 wind technologies market report 8.15.18.v2.pdf
[44] “Wind turbines database.” [Online]. Available: https://en.wind-turbine-models.com/turbines
[45] R. Whittlesey, “Chapter 10 - Vertical Axis Wind Turbines: Farm and TurbineDesign,” in Wind Energy Engineering, T. M. Letcher, Ed. Academic Press, Jan.2017, pp. 185–202. [Online]. Available: http://www.sciencedirect.com/science/article/pii/B9780128094518000102
[46] “Next-Generation Wind Technology.” [Online]. Available: https://www.energy.gov/eere/next-generation-wind-technology
[47] “Anti-icing system for cold-climate wind turbine markets debuts,” Feb.2018. [Online]. Available: http://www.digitaljournal.com/tech-and-science/technology/anti-icing-system-for-cold-climate-wind-turbine-markets-debuts/article/514156
Page 42

ENGS 86 Tyler Farrell
[48] “The Wind Prospector.” [Online]. Available: https://maps.nrel.gov/wind-prospector/?aL=Rh9Ekq%255Bv%255D%3Dt%26qCw3hR%255Bv%255D%3Dt%26qCw3hR%255Bd%255D%3D1&bL=swOlI &cE=0&lR=0&mC=44.06202549399981%2C-71.09763622283936&zL=14
[49] “Wind Energy Resource Atlas of the United States.” [Online]. Available: https://rredc.nrel.gov/wind/pubs/atlas/tables/1-1T.html
[50] [U+FFFD] Byrkjedal, K. V. As, and P. O. Box, “Estimating wind power production loss dueto icing,” p. 5, 2009.
[51] “Wind turbines and birds and bats,” Jun. 2015. [Online]. Available: https://www.sierraclub.org/michigan/wind-turbines-and-birds-and-bats
[52] “Understanding the Threat Wind Energy Poses to Birds,” Apr. 2017. [Online]. Available:https://abcbirds.org/wind-energy-threatens-birds/
[53] “Wind farms are hardly the bird slayers they’re made out to be—here’s why.” [Online].Available: https://phys.org/news/2017-06-farms-bird-slayers-theyre-behere.html
[54] D. R. V. Patraca, “Wildlife Mitigation Tools of Wind Power Generation Impact in Birds &Bat Collisions in Isthmus of Tehuantepec, Mexico,” p. 39.
[55] P. Denholm, M. Hand, M. Jackson, and S. Ong, “Land Use Requirements of Modern WindPower Plants in the United States,” Tech. Rep. NREL/TP-6A2-45834, 964608, Aug. 2009.[Online]. Available: http://www.osti.gov/servlets/purl/964608-LaTU8c/
[56] “Wind Energy Factsheet | Center for Sustainable Systems.” [Online]. Available:http://css.umich.edu/factsheets/wind-energy-factsheet
[57] AEOLOS, “Aeolos-V-10kw-Brochure.” [Online]. Available: http://www.nexosonline.com/web/categorias/Energia%20Renovable/Aeolos%20-%20Wind%20Turbine/Aeolos-V-10kw-Brochure.pdf
[58] “The Downside of Dams: Is the Environmental Price of Hydroelectric Power Too High?”[Online]. Available: https://www.scientificamerican.com/article/how-do-dams-hurt-rivers/
[59] C. Modal, M. Solomon, B. Tew, C. Gerhman, and C. Lehner, “Analysis of Reser-voir[U+2010]Based Hydroelectric versus Run[U+2010]of[U+2010]River Hydroelec-tric Energy Production,” p. 13.
Page 43
ENGS 86 Tyler Farrell
[60] “Hydropower Technology Development.” [Online]. Available: https://www.energy.gov/eere/water/hydropower-technology-development
[61] “A Revolution for Hydropower | Turbulent.” [Online]. Available: https://www.turbulent.be/
[62] P. Gleick, “Impacts of California’s Ongoing Drought: Hydroelectricity Generation 2015Update,” Feb. 2016. [Online]. Available: http://large.stanford.edu/courses/2016/ph240/goodwin2/docs/gleick.pdf
[63] IRENA, “Renewable Energy Technologies: Cost Analysis Series : Hydropower,” Tech. Rep.,Jun. 2012. [Online]. Available: https://www.irena.org/documentdownloads/publications/re technologies cost analysis-hydropower.pdf
[64] A. G. Thornton, “Renewable energy discount rate survey results – 2017,” p. 28.
[65] G. Energy, “GE Energy 1.5mw Wind Turbine.” [Online]. Available: https://geosci.uchicago.edu/⇠moyer/GEOS24705/Readings/GEA14954C15-MW-Broch.pdf
[66] K. Coplan, “What is the Carbon Impact of a day of Downhill Ski-ing?” Feb. 2017. [Online]. Available: https://livesustainablynow.com/2017/02/20/what-is-the-carbon-impact-of-a-day-of-downhill-skiing/
Page 44
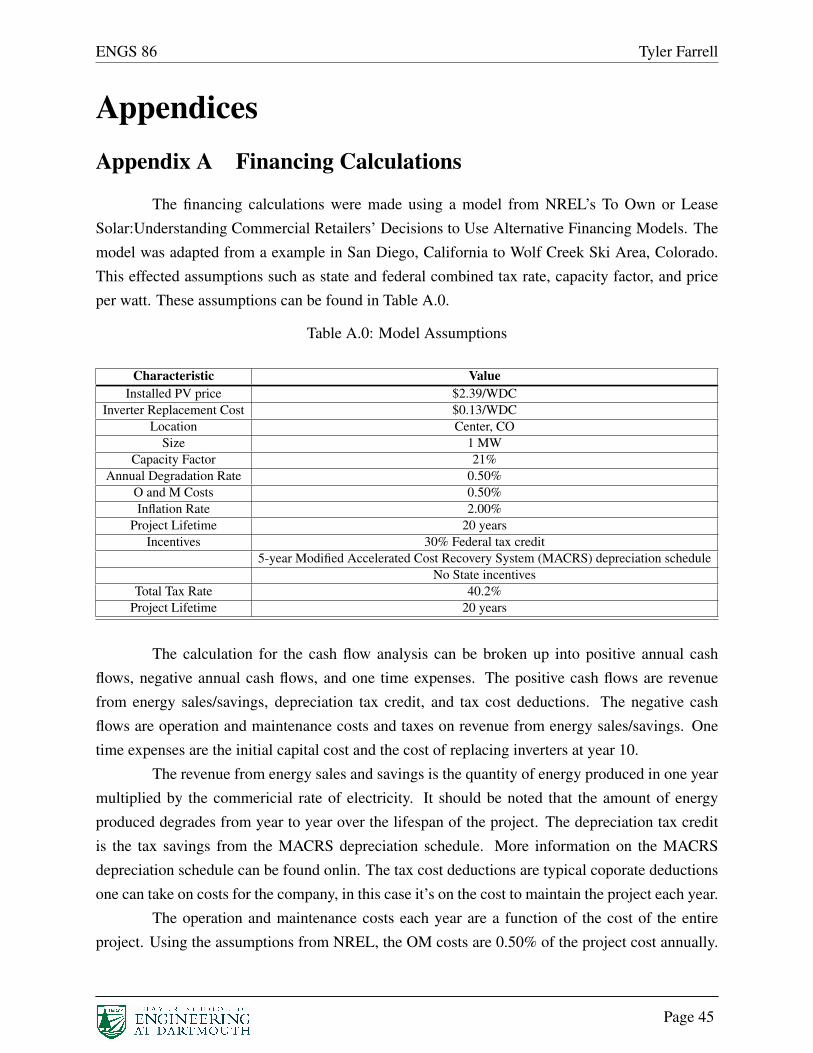
ENGS 86 Tyler Farrell
AppendicesAppendix A Financing Calculations
The financing calculations were made using a model from NREL’s To Own or LeaseSolar:Understanding Commercial Retailers’ Decisions to Use Alternative Financing Models. Themodel was adapted from a example in San Diego, California to Wolf Creek Ski Area, Colorado.This effected assumptions such as state and federal combined tax rate, capacity factor, and priceper watt. These assumptions can be found in Table A.0.
Table A.0: Model Assumptions
Characteristic ValueInstalled PV price $2.39/WDC
Inverter Replacement Cost $0.13/WDCLocation Center, CO
Size 1 MWCapacity Factor 21%
Annual Degradation Rate 0.50%O and M Costs 0.50%Inflation Rate 2.00%
Project Lifetime 20 yearsIncentives 30% Federal tax credit
5-year Modified Accelerated Cost Recovery System (MACRS) depreciation scheduleNo State incentives
Total Tax Rate 40.2%Project Lifetime 20 years
The calculation for the cash flow analysis can be broken up into positive annual cashflows, negative annual cash flows, and one time expenses. The positive cash flows are revenuefrom energy sales/savings, depreciation tax credit, and tax cost deductions. The negative cashflows are operation and maintenance costs and taxes on revenue from energy sales/savings. Onetime expenses are the initial capital cost and the cost of replacing inverters at year 10.
The revenue from energy sales and savings is the quantity of energy produced in one yearmultiplied by the commericial rate of electricity. It should be noted that the amount of energyproduced degrades from year to year over the lifespan of the project. The depreciation tax creditis the tax savings from the MACRS depreciation schedule. More information on the MACRSdepreciation schedule can be found onlin. The tax cost deductions are typical coporate deductionsone can take on costs for the company, in this case it’s on the cost to maintain the project each year.
The operation and maintenance costs each year are a function of the cost of the entireproject. Using the assumptions from NREL, the OM costs are 0.50% of the project cost annually.
Page 45
ENGS 86 Tyler Farrell
The taxes on revenue of the energy sold or saved are simply taxes you would pay on any revenue.It should be noted that energy savings are treated in the same manner as energy sales because bysavings energy you are not entitled to the tax deduction if you were to buy that energy.
The initial capital cost is the cost of the project minus the savings from the federal taxincentive. The federal tax incentive savings are tax deductions on 30% of the value of the project.The inverter replacement occurs in year 10 and is a one time cost in year 10.
Appendix B LCOE Calculations
The levelized cost of energy calculations were made using Equation (5). The assumptionsfor cost of each component of I and M were made dependent on the type of technology from theeconomics section of Section III. This section will evaluate how the calculations for expenses andenergy were made for each technology.
LCOE =
PIt+Mt(1+r)tPEt
(1+r)t
. (5)
B.1 Solar
The investment cost calculations were made using NREL’s commericial benchmark report[33]. The cost per watt was $1.83 for fixed, $2.20 for one-axis tracking, and $2.38 for two-axistracking. The maintenance cost were simplified to 0.5% of the systems cost [25]. The offsiteproperty costs were estimated using zillow.com to find the average property cost for lots and landin the location of interest. For Cranmore Mountain Resort the location of interest was south ofConway,NH and for Big Sky Resort this was the West Yellowstone region.
The energy calculations were made using globalsolaratlas.com and finding the averageenergy production per day. For one-axis and two-axis tracking options, we used PV watts toestimate a percentage increase for the area. The reason why global solar atlas was used for thecalculations in comparison to PV watts is because global solar atlas can more accurately modellarge facilities.
B.2 Wind
The investment cost calculations were made using the Department of Energy’s 2017 WindTechnologies Market Report [43]. The cost per kW was estimated at $1,500. The maintenancecosts were estimated at $20 per kW. The offsite property costs used the same methdology as thesolar resourcees. For Cranmore Mountain Resort the location of interest was in the North Conway,NH area. For Big Sky Resort, the location of interest was Ennis, MT in the Madison River Valley.
Page 46
ENGS 86 Tyler Farrell
The energy calculations were made using NREL’s wind prospector [48]. Find averagewind values for where turbines could be built. The average wind values were distributed into aWeibullwind distribution with a standard deviation of 5.452 mph. This distribution outputted afrequency distribution which was scaled to the number of hours per year for each wind speed. Thiswas then imposed onto the power curve of a GE 1.5 MW turbine to generate energy potential.
B.3 Hydro
The investment cost calculations were made using the Kaldellis and Kondili 2005 costcurves Figure 14. For Big Sky resort, since the penstock and facility was shorter and more feasiblea lower installation cost of $4,000 per kW was used. While for Cranmore Mountain Resort, thelong penstock and less feasible outlook meant that a higher estimate was needed of $6,000 per kW.The maintenance for both facilities was estimated at 1% of the system cost.
The energy calculations were made using the average flow rate and topological limitationsto size the facility to meet the ski resort load. For onsite developments, the diversion rate wasallowed to be a maximum of 80% of the flow rate. For offsite developments, the diversion rate waslimited at 40% because these were larger public waters. The flow rate data was gathered from theUSGIS or independent flow rate studies online. The topology data was gathered from caltopo.comand using property lines to map out the limitations on how long a penstock could be and thereforehow much head could be gained.
Page 47

ENGS 86 Tyler Farrell
Page 48