Embed Size (px)
Citation preview
Songklanakarin J. Sci. Technol.
43 (1), 259-268, Jan. - Feb. 2021
Original Article
Evaluating the engineering properties of loess soil
using seismic methods
Rungroj Arjwech* and Pakawat Sriwangpon
Department of Geotechnology, Faculty of Technology,
Khon Kaen University, Mueang, Khon Kaen, 40002 Thailand
Received: 5 August 2019; Revised: 11 December 2019; Accepted: 15 December 2019
Abstract
Loess covers most areas of Khon Kaen University campus, northeastern Thailand. It is identified as a collapsible soil.
This study aims to find the engineering properties of loess using multi-channel analysis of surface wave (MASW) and downhole
seismic methods. MASW results show that the shear wave velocity varies from 242 to 329 m/s while the compressional wave
velocity is 371 to 740 m/s. The results of downhole method show that shear wave velocity ranges between 210 and 323 m/s, while
the compressional wave velocity varies from 420 to 771 m/s. The derived body wave velocity from MASW method varies by 25%
from that obtained using the downhole method. Young's modulus calculated from these results was validated with information
from previous research and larger than those of determining via static geotechnical tests. The MASW method is a relatively cost-
effective method, so it can be applied as an alternative to geotechnical testing when determining soil elastic properties.
Keywords: Multi-channel Analysis of Surface Wave (MASW), shear wave, downhole seismic method, Khon Kaen University,
loess
1. Introduction
Loess covers most of the northeastern region of
Thailand including Khon Kaen university campus (Phien-wej,
Pientong, & Balasubramaniam, 1992). It is a predominantly a
silty sediment, sometimes with minor sand and clay fractions,
which is transported by wind and often found as deposits in
Quaternary semi-arid environments (Boonsaner, 1977, 2002;
Chong, 1988). Loess is classified as slightly to moderately dis-
persive (Gasaluck, Luthisungnoen, Angsuwotai, Muktabhant,
& Mobkhuntod, 2000) that recognized as a collapsible soil as
its load capacity can be reduced abruptly with increasing
moisture content (Terzaghi & Peck, 1948).
Loess deposits can be classified into two types, red
and yellow that are similar in lithology and mineralogy but
different oxidation states causes different colors (Phien-wej et
al., 1992). Khon Kaen red loess is non-plastic red sandy silt or
silty sand (SM-SC), 65% sand, 30% silt and 5% clay. Most of
the soil particles are 0.005 to 0.042 mm in size with poorly
sorted particles. Loess is unconsolidated and has a loose to
medium density. When moisture content increases, it causes to
decrease the shear strength parameters (Punrattanasin, Sub-
jarassang, Kusakabe, & Nishimura, 2002; Sinchai, 2002;
Udomchoke, 1991). Natural dry density is 1,500 kg/m3 (Chong,
1988). From plate load test, Young’s modulus is 22.6 and 6.4
MPa under wet and soaked conditions, respectively. Young’s
modulus is between 29.0 and 19.6 MPa from triaxial tests when
the moisture content is between 6% and 12% (Sinchai, 2002)
and between 69.2 and 83.2 MPa studied by Phien-wej et al.
(1992). Poisson ratio is between 0.38 and 0.42 (Udomchoke,
1991).
There are 277 buildings on the Khon Kaen University
campus (in 2009), and almost all of buildings are employed by
shallow foundations to support the building structures. How-
ever, subsidence of some of the buildings occurred due to
instability of the underlying red loess (Juntarasom, 2015). The
loss of structural integrity is attributed to increases in moisture
content (Kesawadkorn, 2000; Prohmriang, Lerthanasangtum,
Suriyavanagul, & Pukdekssem, 1997). Moreover, severe
problems with settlements and low-rise buildings were caused
by leakings from drains and sewers (Sarujikumjonwattana,
*Corresponding author
Email address: [email protected]
260 R. Arjwech & P. Sriwangpon / Songklanakarin J. Sci. Technol. 43 (1), 259-268, 2021
Malapet, & Sertwicha, 1987). Consequently, foundation sys-
tems on campus often needed to be rebuilt, causing construction
costs to increase. For this reason, soil property testing is
necessary to be carried out before construction projects begin.
The testing of soil properties can be separated into
two main approaches. The first one is a wide-area survey
without soil sampling consisting of geophysical methods (e.g.
seismic or electrical techniques) and geotechnical engineering
methods (e.g. SPT and FVT techniques). The second approach
involves soil sampling in which samples are collected to
identify their properties in the laboratory (e.g. tri-axial and plate
load tests). Most geophysical methods can be operated as non-
destructive techniques; furthermore, they are less time-con-
suming and relatively cost-effective compared to conventional
geotechnical testing (Anderson, Croxton, Hookver, & Sirles,
2008; Arjwech et al., 2013). The applicability of a non-destruc-
tive geophysical method to ascertain engineering properties of
collapsible loess soils is investigated in this research.
Herein, the non-destructive multi-channel analysis of
surface wave (MASW) technique was used to measure the
spatially-averaged elastic moduli of loess based on body wave
velocities extracted from seismic records. The minimally
destructive downhole seismic method was conducted to
compare its determination of the elastic moduli with the
corresponding results obtained with the MASW method. This
paper is considered an attempt to understand the static soil
parameters determined by dynamic soil parameters and
measured by geophysics methods.
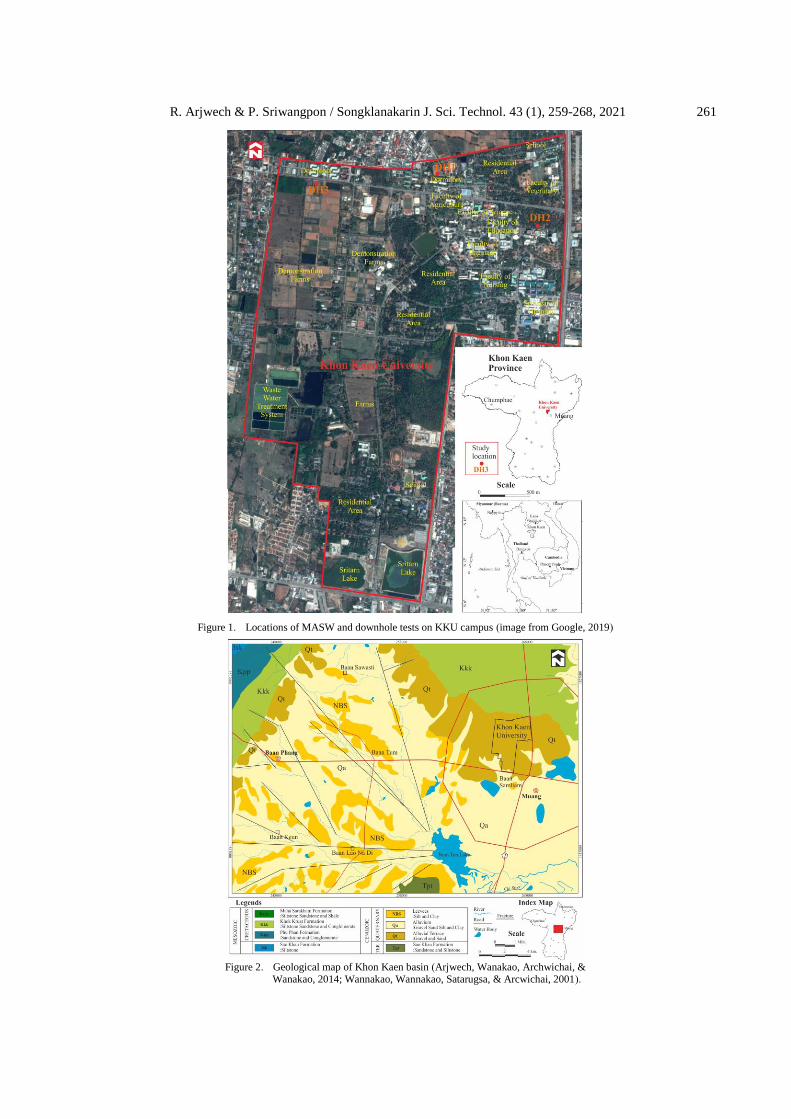
2. Study Area and Geology
The study area is located in the northern part of Khon
Kaen University campus, Khon Kaen province, northeastern
Thailand. The near surface is composed of unconsolidated
sediments categorized as Quaternary alluvial and Quaternary
terrace soils. Loess and gravel deposits were found locally on
the terrace with thicknesses that varied from a few meters to
more than 5 m (Arjwech, Wanakao, & Everett, 2019). Shear
wave studies were conducted at three locations where thick
loess deposit was previously studied (Sinchai, 2002) and
subsidence of nearby buildings was reported (Juntarasom,
2015). Three boreholes were drilled and prepared for the
measurement. They are located on the highest part on the
campus. The first area (DH1) is located beside a baseball field,
the second area (DH2) is located adjacent to the Institute of
Administration Development and the third area (DH3) is
located on a demonstration field of the Faculty of Agriculture
(Figure 1). The boreholes penetrated to depths ranging from 15
to 33 m. They were identified to be dry during the downhole
test.
The terrain morphology of the study area is charac-
terized as middle to high river terrace, covered with the gravel
lithofacies (Qt) of middle Pleistocene age shown in Figure 2
(Wannakao et al., 2001). This sedimentary unit consists of sand
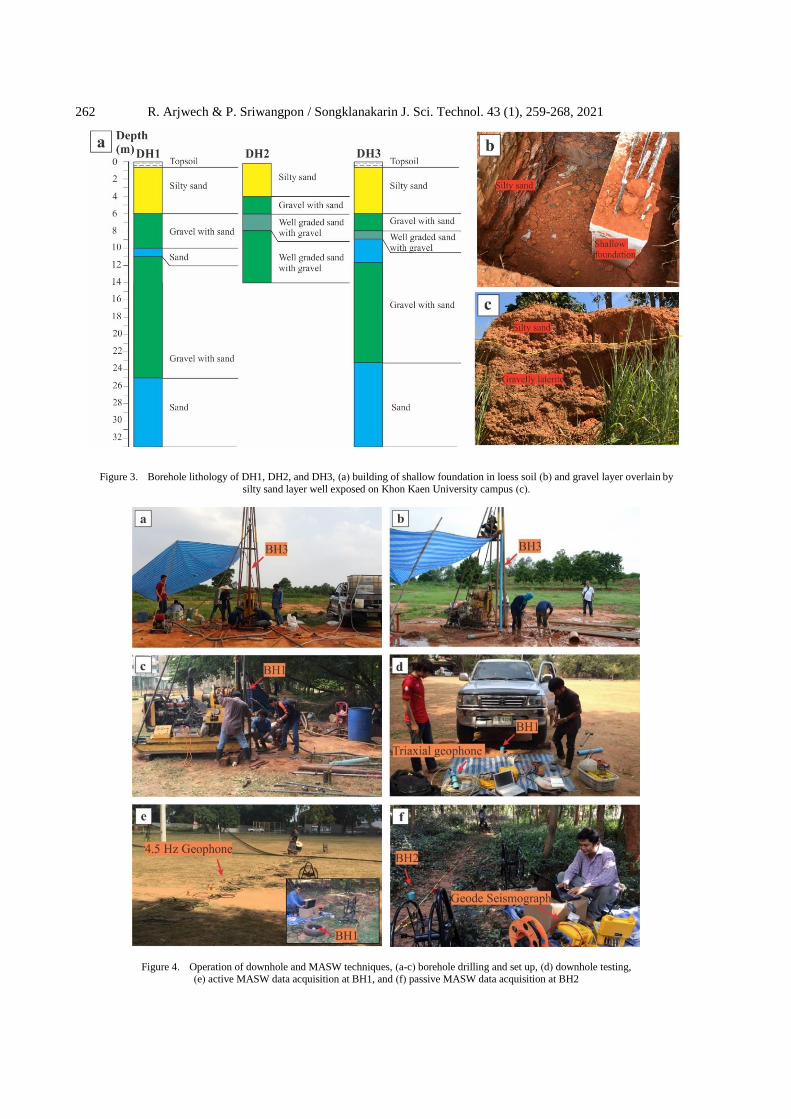
and gravel beds which can be separated into three distinct layers
as can be seen in Figure 3. The top layer consists of particles of
the small grain sizes of low to medium dense red sand (SM) and
thickness is between 2.5 and 10 m. The middle layer is
identified as relatively younger gravel. It is comprised of
gravelly laterite on top of the layer and dense to very dense
gravel with fragment of petrified wood. Its thickness is between
gravel. It contains dense gravel with petrified wood. Its thick-
ness is between 3 and 30 m (Boonsaner, 1977; Boonsaner &
Tassanasorn, 1983; Sinchai, 2002).
3. Methodology
In this research, Multi-Channel Analysis of Surface
Wave (MASW) and downhole (surface-to-borehole) seismic
tests were conducted on outcrops of loess (Figure 4).
3.1 Multi-channel Analysis of Surface Wave
MASW is a seismic technique executed on the
ground surface to characterize the near-surface (e.g., ≤30 m) VS
distribution. It is designed to investigate utilizing the Rayleigh
surface wave that is identified as the strongest seismic wave.
The technique is determination of the wave dispersion curve
(different frequencies travel at different velocities), which in
turn is inverted for the shear wave velocities of the soil layers
(Park, Miller, Ryden, Xia, & Ivanov, 2005; Park, Miller, & Xia,
1999).
The MASW data were recorded using an array of 24
single-component 4.5-Hz geophones with 1 m spacing. The
data were gathered by laptop via a 24-channel Geometrics
Geode. The MASW data acquisition included both active and
passive measurements. All six lines were surveyed for the 2D
Vs evaluation that generated 2D Vs maps showing both lateral
and vertical change. At BH1 and BH2, the two profiles intersect
and the location of borehole is about the middle of the lines. At
BH3, the two profiles were not intersected due to restriction of
geophone deployment. Surveys were performed in April 2017.
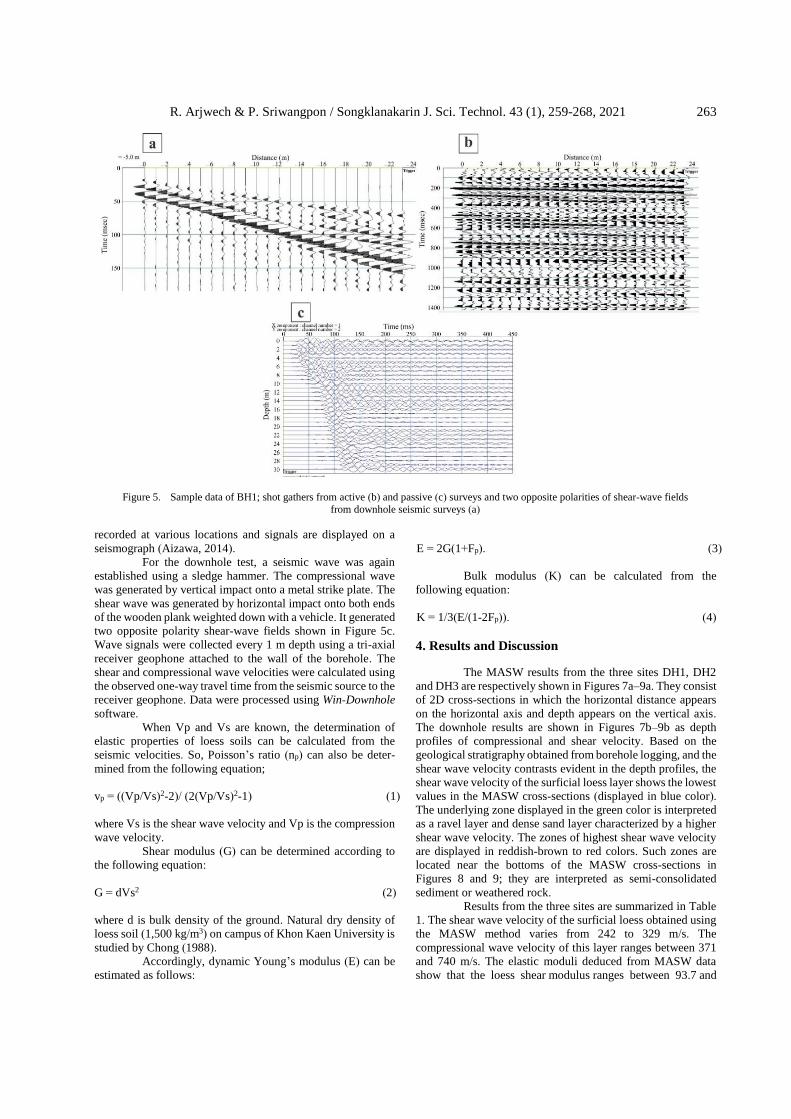
For the active method, a seismic signal (Figure 5a)
was generated by a sledgehammer struck vertically onto a metal
plate at 5 m offset from the closest receiver geophone. The total
length of a survey line is 23 m, which generates less than 12 m
depth of investigation (Aizawa, 2014). The passive method
involves an analysis of lower frequency (1-30 Hz) surface
waves recorded by the same receiver array. The signals from
the surface waves are generated by ambient noise (e.g. traffic)
(Figure 5b) and they penetrate deeper than the hammer-
generated waves of the active method (Park, Miller, Xia, &
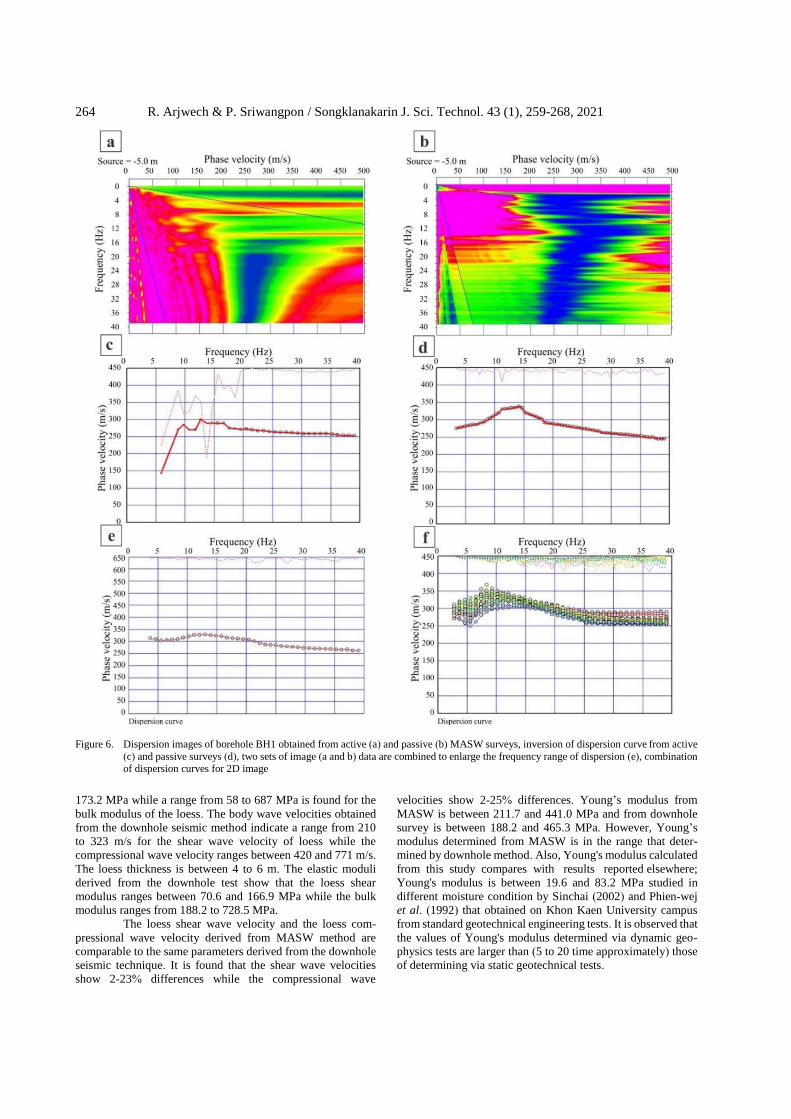
Ivanov, 2007). Data were processed using Seisimager/SW
software. The shear wave velocity profile of the near-surface
layers was derived by inversion of the surface wave dispersion
curve shown in Figure 6 (Park et al., 1999). The latter was
extracted from information gathered from both the active and
passive acquisition (Figure 6e and 6f). Meanwhile, the
compressional wave velocity was computed from the travel
time of the direct wave generated by the hammer used to
conduct the active method (shot records) and analyzed using
the software program SeisImager/2D. Seismic tomograms are
displayed herein using a fence diagram format by Sketchup
software.
3.2 Downhole seismic method
The downhole seismic test makes direct measure-
ments of compressional (Vp) and shear wave velocities (Vs) in
a single borehole. A seismic source is used to generate a seismic
wave train at the ground surface offset horizontally from the top
of a cased borehole. The arrival of the seismic waves is detected
by downhole geophone. The waves propagate in the direction
perpendicular to the source towards the geophone and are
R. Arjwech & P. Sriwangpon / Songklanakarin J. Sci. Technol. 43 (1), 259-268, 2021 261
Figure 1. Locations of MASW and downhole tests on KKU campus (image from Google, 2019)
Figure 2. Geological map of Khon Kaen basin (Arjwech, Wanakao, Archwichai, & Wanakao, 2014; Wannakao, Wannakao, Satarugsa, & Arcwichai, 2001).
262 R. Arjwech & P. Sriwangpon / Songklanakarin J. Sci. Technol. 43 (1), 259-268, 2021
Figure 3. Borehole lithology of DH1, DH2, and DH3, (a) building of shallow foundation in loess soil (b) and gravel layer overlain by
silty sand layer well exposed on Khon Kaen University campus (c).
Figure 4. Operation of downhole and MASW techniques, (a-c) borehole drilling and set up, (d) downhole testing, (e) active MASW data acquisition at BH1, and (f) passive MASW data acquisition at BH2
R. Arjwech & P. Sriwangpon / Songklanakarin J. Sci. Technol. 43 (1), 259-268, 2021 263
Figure 5. Sample data of BH1; shot gathers from active (b) and passive (c) surveys and two opposite polarities of shear-wave fields
from downhole seismic surveys (a)
recorded at various locations and signals are displayed on a
seismograph (Aizawa, 2014).
For the downhole test, a seismic wave was again
established using a sledge hammer. The compressional wave
was generated by vertical impact onto a metal strike plate. The
shear wave was generated by horizontal impact onto both ends
of the wooden plank weighted down with a vehicle. It generated
two opposite polarity shear-wave fields shown in Figure 5c.
Wave signals were collected every 1 m depth using a tri-axial
receiver geophone attached to the wall of the borehole. The
shear and compressional wave velocities were calculated using
the observed one-way travel time from the seismic source to the
receiver geophone. Data were processed using Win-Downhole
software.
When Vp and Vs are known, the determination of
elastic properties of loess soils can be calculated from the
seismic velocities. So, Poisson’s ratio (np) can also be deter-
mined from the following equation;
vp = ((Vp/Vs)2-2)/ (2(Vp/Vs)2-1) (1)
where Vs is the shear wave velocity and Vp is the compression
wave velocity.
Shear modulus (G) can be determined according to
the following equation:
G = dVs2 (2)
where d is bulk density of the ground. Natural dry density of
loess soil (1,500 kg/m3) on campus of Khon Kaen University is
studied by Chong (1988).
Accordingly, dynamic Young’s modulus (E) can be
estimated as follows:
E = 2G(1+Fp). (3)
Bulk modulus (K) can be calculated from the
following equation:
K = 1/3(E/(1-2Fp)). (4)
4. Results and Discussion
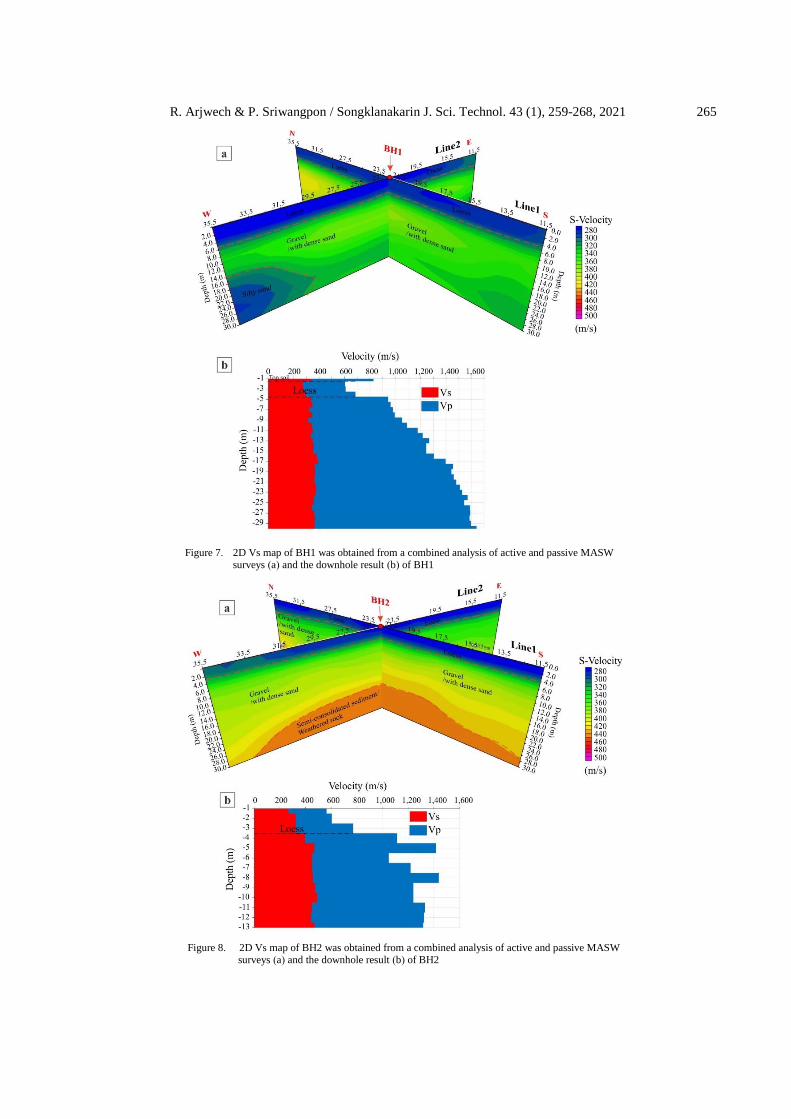
The MASW results from the three sites DH1, DH2
and DH3 are respectively shown in Figures 7a–9a. They consist
of 2D cross-sections in which the horizontal distance appears
on the horizontal axis and depth appears on the vertical axis.
The downhole results are shown in Figures 7b–9b as depth
profiles of compressional and shear velocity. Based on the
geological stratigraphy obtained from borehole logging, and the
shear wave velocity contrasts evident in the depth profiles, the
shear wave velocity of the surficial loess layer shows the lowest
values in the MASW cross-sections (displayed in blue color).
The underlying zone displayed in the green color is interpreted
as a ravel layer and dense sand layer characterized by a higher
shear wave velocity. The zones of highest shear wave velocity
are displayed in reddish-brown to red colors. Such zones are
located near the bottoms of the MASW cross-sections in
Figures 8 and 9; they are interpreted as semi-consolidated
sediment or weathered rock.
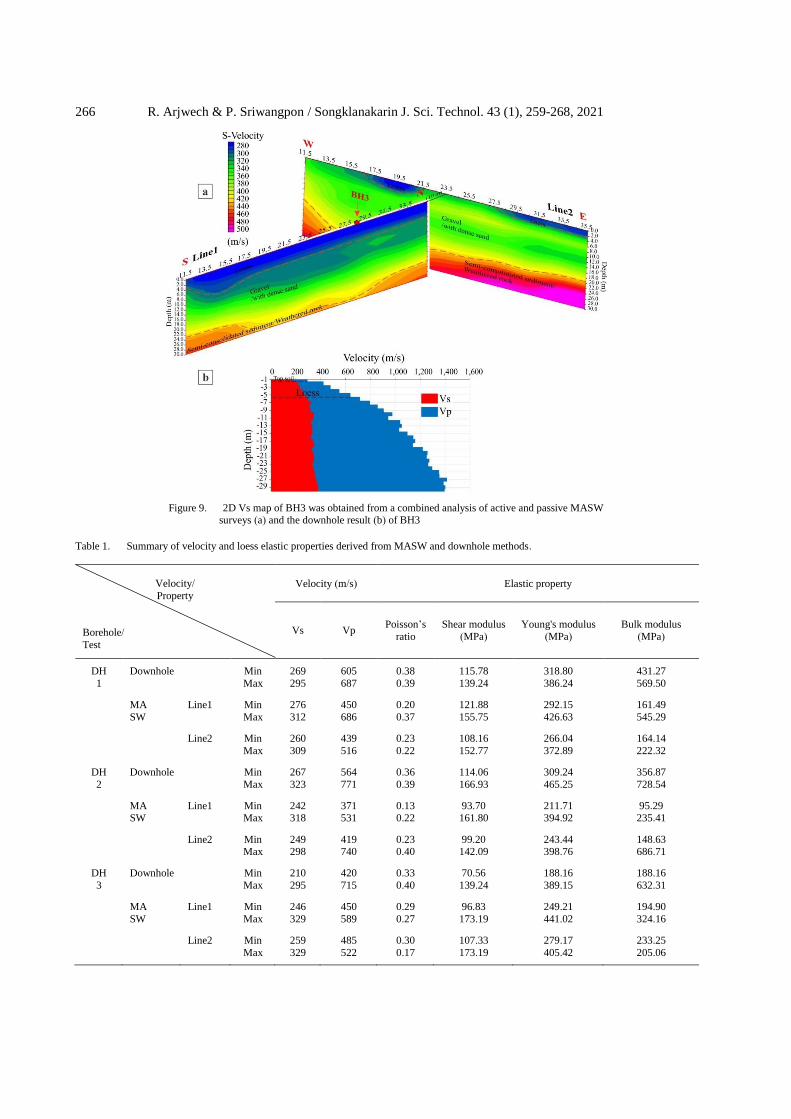
Results from the three sites are summarized in Table
1. The shear wave velocity of the surficial loess obtained using
the MASW method varies from 242 to 329 m/s. The
compressional wave velocity of this layer ranges between 371
and 740 m/s. The elastic moduli deduced from MASW data
show that the loess shear modulus ranges between 93.7 and
264 R. Arjwech & P. Sriwangpon / Songklanakarin J. Sci. Technol. 43 (1), 259-268, 2021
Figure 6. Dispersion images of borehole BH1 obtained from active (a) and passive (b) MASW surveys, inversion of dispersion curve from active
(c) and passive surveys (d), two sets of image (a and b) data are combined to enlarge the frequency range of dispersion (e), combination of dispersion curves for 2D image
173.2 MPa while a range from 58 to 687 MPa is found for the
bulk modulus of the loess. The body wave velocities obtained
from the downhole seismic method indicate a range from 210
to 323 m/s for the shear wave velocity of loess while the
compressional wave velocity ranges between 420 and 771 m/s.
The loess thickness is between 4 to 6 m. The elastic moduli
derived from the downhole test show that the loess shear
modulus ranges between 70.6 and 166.9 MPa while the bulk
modulus ranges from 188.2 to 728.5 MPa.
The loess shear wave velocity and the loess com-
pressional wave velocity derived from MASW method are
comparable to the same parameters derived from the downhole
seismic technique. It is found that the shear wave velocities
show 2-23% differences while the compressional wave
velocities show 2-25% differences. Young’s modulus from
MASW is between 211.7 and 441.0 MPa and from downhole
survey is between 188.2 and 465.3 MPa. However, Young’s
modulus determined from MASW is in the range that deter-
mined by downhole method. Also, Young's modulus calculated
from this study compares with results reported elsewhere;
Young's modulus is between 19.6 and 83.2 MPa studied in
different moisture condition by Sinchai (2002) and Phien-wej
et al. (1992) that obtained on Khon Kaen University campus
from standard geotechnical engineering tests. It is observed that
the values of Young's modulus determined via dynamic geo-
physics tests are larger than (5 to 20 time approximately) those
of determining via static geotechnical tests.
R. Arjwech & P. Sriwangpon / Songklanakarin J. Sci. Technol. 43 (1), 259-268, 2021 265
Figure 7. 2D Vs map of BH1 was obtained from a combined analysis of active and passive MASW surveys (a) and the downhole result (b) of BH1
Figure 8. 2D Vs map of BH2 was obtained from a combined analysis of active and passive MASW surveys (a) and the downhole result (b) of BH2
266 R. Arjwech & P. Sriwangpon / Songklanakarin J. Sci. Technol. 43 (1), 259-268, 2021
Figure 9. 2D Vs map of BH3 was obtained from a combined analysis of active and passive MASW surveys (a) and the downhole result (b) of BH3
Table 1. Summary of velocity and loess elastic properties derived from MASW and downhole methods.
Velocity/
Property
Borehole/
Test
Velocity (m/s) Elastic property
Vs Vp Poisson’s
ratio
Shear modulus
(MPa)
Young's modulus
(MPa)
Bulk modulus
(MPa)
DH
1
Downhole Min 269 605 0.38 115.78 318.80 431.27
Max 295 687 0.39 139.24 386.24 569.50
MA
SW
Line1 Min 276 450 0.20 121.88 292.15 161.49
Max 312 686 0.37 155.75 426.63 545.29
Line2 Min 260 439 0.23 108.16 266.04 164.14
Max 309 516 0.22 152.77 372.89 222.32
DH
2
Downhole Min 267 564 0.36 114.06 309.24 356.87
Max 323 771 0.39 166.93 465.25 728.54
MA SW
Line1 Min 242 371 0.13 93.70 211.71 95.29 Max 318 531 0.22 161.80 394.92 235.41
Line2 Min 249 419 0.23 99.20 243.44 148.63 Max 298 740 0.40 142.09 398.76 686.71
DH
3
Downhole Min 210 420 0.33 70.56 188.16 188.16
Max 295 715 0.40 139.24 389.15 632.31
MA
SW
Line1 Min 246 450 0.29 96.83 249.21 194.90
Max 329 589 0.27 173.19 441.02 324.16
Line2 Min 259 485 0.30 107.33 279.17 233.25
Max 329 522 0.17 173.19 405.42 205.06
R. Arjwech & P. Sriwangpon / Songklanakarin J. Sci. Technol. 43 (1), 259-268, 2021 267
Downhole and crosshole seismic tests are popular
geophysics methods for determining engineering properties of
subsurface materials. However, they are classified as destruct-
tive methods that borehole is required for these tests. Therefore,
the Vs wave velocity maps (Vs vs. depth) derived from MASW
survey were compared to Vs wave velocity profiles measured
in boreholes. An overall difference is lesser than 25%. The
MASW survey from this study can provide reliable Vs wave
velocity profiles. The accuracy of Vs profle obtained by
MASW technique primarily depends upon the resolution of the
dispersion curve. Therefore, cross survey lines and 2D survey
are required to develop standard guidelines for data acquisition.
The MASW can be considered as an alternative method for
determining soil elastic properties.
5. Conclusions and Recommendations
The MASW method is a rapid, wide-area non-
invasive and cost-effective geophysical method for evaluating
engineering properties of loess soil. The elastic moduli can be
computed from the shear wave and the compressional wave
velocities obtained from the MASW inversion process. The
body-wave velocities derived using the MASW method varies
from the velocities obtained using the downhole method by
roughly 25%. Correlating the velocity profiles from both
methods shows that the velocity values compare fairly well and
demonstrate that the MASW is a reliable and acceptable
method to measure shear wave velocity of the subsurface
materials.
Comparing the results using the geophysics approach
with previous geotechnical test results from the study area
shows 10 to 20 times difference in values. The MASW is a non-
invasive surface geophysical technique with the advantage over
the borehole measurements. Although the MASW cannot
replace the conventional drilling method in determining soil
elastic properties, its advantages are such that it can be
considered as an alternative method.
This study was carried out in summer season when
soil seemed to appear low moisture content. It is suggested that
geophysics tests in other seasons are recommended since
moisture can effect on engineering properties of soil. For a
given project, the dynamic geophysics test should be calibrated
by at least one static test.
Density and velocity are important parameter for
calculating elastic properties of soil that can be obtained from
geophysics and laboratory tests. For MASW survey,
compressional wave can be determined directly from active
survey data that can process using refraction technique.
Acknowledgements
We gratefully acknowledge Department of Geo-
technology, Faculty of Technology, and Graduate School,
Khon Kaen University for funding and encouragement. We are
also grateful Prof. M. Everett for proofreading the manuscript.
References
Aizawa, T. (2014). Application manual of geophysical methods
to engineering and environmental problems. Houten,
Netherlands: The European Association of Geo-
scientists and Engineers.
Anderson, N., Croxton, N., Hookver, R., & Sirles, P. (2008).
Geophysical methods commonly 157 employed for
geotechnical site characterization. Washington, DC:
Transportation Research Board.
Arjwech, R., Everett, M. E., Briaud, J. L., Hurlebaus, S.,
Medina-Cetina, Z., Tucker, S., & Yosefpour, N.
(2013). Electrical resistivity imaging of unknown
bridge foundations. Near Surface Geophysics, 11,
591–598. doi:10.3997/1873-0604.2013023
Arjwech, R., Wanakao, P., Archwichai, L., & Wanakao, L.
(2014). The relationship between geological struc-
tures and the distribution of saline soil in downstream
impacted area of Ubon Ratana dam, Khon Kaen
province (in Thai). Khon Kaen University Research
Journal, 19, 834–842.
Arjwech, R., Wanakao, P., & Everett, M. (2019). The relation-
ship between geological factors and the distribution
of saline soil: A case study in the Khon Kaen Basin
of Thailand. Songklanakarin Journal of Science and
Technology, 41(5), 974-983.
Boonsaner, M. (1977). Engineering geology of the town of
Khon Kaen Northeastern Thailand (Master Thesis,
Asian Institute of Technology, Bangkok, Thailand).
Boonsaner, M. (2002). Quaternary geology of the northeast
Thailand, loess: The risk soils. Khon Kaen, Thailand:
Khon Kaen university.
Boonsaner, M., & Tassanasorn, A. (1983). The morphology of
quaternary deposits in Khon Kaen Province, North-
eastern Thailand. 1st Symposium on Geomorpholo-
gy and Quaternary Geology of Thailand, Bangkok,
Thailand.
Chong, K. Y. (1988). Geohydrology of the town of Khon Kaen
Northeastern Thailand (Master Thesis, Asian
Institute of Technology, Bangkok, Thailand).
Gasaluck, W., Luthisungnoen, P., Angsuwotai, P., Muktabhant,
C., & Mobkhuntod, S. (2000). On the design of
foundation in collapsible Khon Kaen Loess. Inter-
national Conference on Geotechnical and Geolo-
gical Engineering. Melbourne, Australia.
Google. (2019). Map of Khon Kaen University. Retrieved from
https://www.google.co.th/maps/@16.4556375,102.8
077712,5683m/data=!3m1!1e3!5m1!1e4?hl=th
Juntarasom, C. (2015). Ploblem of building subsidence on
Khon Kaen University (in Thai). KKU Institutional
Research Journal, 3(2), 143–150.
Kesawadkorn, P. (2000). The study of effect of moisture content
on the bearing capacity of silty sand (Master Thesis,
Khon Kaen University, Khon Kaen, Thailand).
Park, C., Miller, R., & Xia, J. (1999). Multichannel analysis of
surface waves. Geophysics, 64(3), 800–808. doi:10.
1190/1.1444590
Park, C., Miller, R. D., Ryden, N., Xia, J., & Ivanov, J. (2005).
Combined use of active and passive surface waves.
Journal of Engineering and Environmental Geo-
physics, 10(3), 323–334. doi:10.2113/JEEG10.3.323
Park, C., Miller, R., Xia, J., & Ivanov, J. (2007). Multichannel
analysis of surface waves (MASW) active and
passive methods. The Leading Edge, 26(1), 60–64.
doi:10.1190/1.2431832
Phien-wej, N., Pientong, N., & Balasubramaniam, A. (1992).
Collapse and strength 167 characteristics of loess in
Thailand. Engineering Geology, 32(1-2), 59–72.
268 R. Arjwech & P. Sriwangpon / Songklanakarin J. Sci. Technol. 43 (1), 259-268, 2021
Prohmriang, K., Lerthanasangtum,K., Suriyavanagul, P., &
Pukdekssem, P. (1997). Investigation of settlement of
building foundation at Mordinndaeng village in
Khon Kaen University stage 1. The fourth year
project assignment report of civil engineering. Khon
Kaen, Thailand: Khon Kaen University.
Punrattanasin, P., Subjarassang, A., Kusakabe, O., & Nishi-
mura, T. (2002). Collapse and erosion of Khon Kaen
Loess with treatment option. 1st International Con-
ference on Scoure of Foundations, College Station,
TX.
Sarujikumjonwattana, P., Malapet, M., & Sertwicha, S. (1987).
Settlement of spread footings in Khon Kaen
University Campus caused by moisture increase at
constant load. Khon Kaen, Thailand: Khon Kean
University.
Sinchai, S. (2002). Engineering properties of Mho-Dindang
Loess, Khon Kaen (Master thesis, Khon Kaen
University, Khon Kaen, Thailand).
Terzaghi, K., & Peck, R. B. (1948). Soil mechanics in
engineering practice. New York, NY: John Wiley
and Sons.
Udomchoke, V. (1991). Origin and engineering characteristic
of problem soils in Khorat Basin, Northeastern
Thailand (Doctoral thesis, Asian Institute of
Technology, Bangkok, Thailand).
Wannakao, L., Wannakao, P., Satarugsa, P., & Arcwichai, L.
(2001). The natural resources inventory system of the
Khorat Basin, Northeast Thailand. Khon Kaen,
Thailand: Khon Kaen University.