Embed Size (px)
Citation preview
Journal of Structural Engineering and Geotechnics, 1 (1), 1-5, Spring 2011
29
Journal of Structural Engineering and Geotechnics, 2(1), 29-41, Winter 2012
QIAU
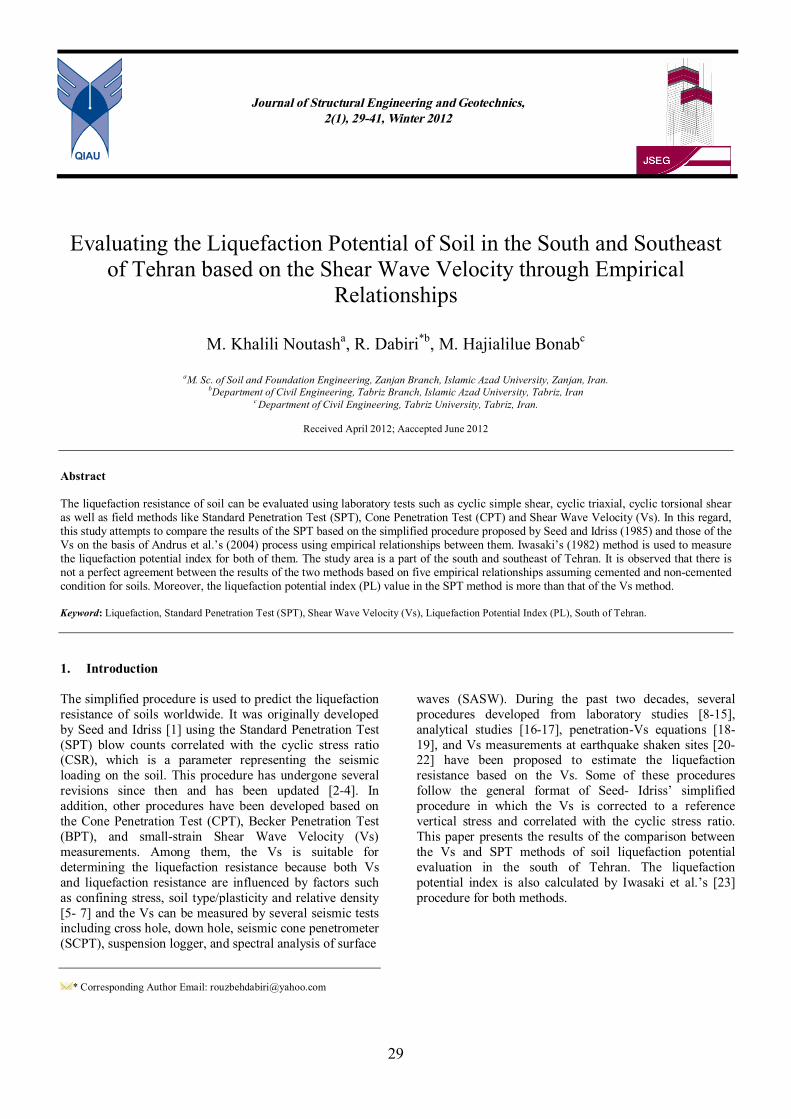
Evaluating the Liquefaction Potential of Soil in the South and Southeast
of Tehran based on the Shear Wave Velocity through Empirical Relationships
M. Khalili Noutasha, R. Dabiri*b, M. Hajialilue Bonabc
aM. Sc. of Soil and Foundation Engineering, Zanjan Branch, Islamic Azad University, Zanjan, Iran.
bDepartment of Civil Engineering, Tabriz Branch, Islamic Azad University, Tabriz, Iran c Department of Civil Engineering, Tabriz University, Tabriz, Iran.
Received April 2012; Aaccepted June 2012
Abstract The liquefaction resistance of soil can be evaluated using laboratory tests such as cyclic simple shear, cyclic triaxial, cyclic torsional shear as well as field methods like Standard Penetration Test (SPT), Cone Penetration Test (CPT) and Shear Wave Velocity (Vs). In this regard, this study attempts to compare the results of the SPT based on the simplified procedure proposed by Seed and Idriss (1985) and those of the Vs on the basis of Andrus et al.’s (2004) process using empirical relationships between them. Iwasaki’s (1982) method is used to measure the liquefaction potential index for both of them. The study area is a part of the south and southeast of Tehran. It is observed that there is not a perfect agreement between the results of the two methods based on five empirical relationships assuming cemented and non-cemented condition for soils. Moreover, the liquefaction potential index (PL) value in the SPT method is more than that of the Vs method. Keyword: Liquefaction, Standard Penetration Test (SPT), Shear Wave Velocity (Vs), Liquefaction Potential Index (PL), South of Tehran. 1. Introduction The simplified procedure is used to predict the liquefaction resistance of soils worldwide. It was originally developed by Seed and Idriss [1] using the Standard Penetration Test (SPT) blow counts correlated with the cyclic stress ratio (CSR), which is a parameter representing the seismic loading on the soil. This procedure has undergone several revisions since then and has been updated [2-4]. In addition, other procedures have been developed based on the Cone Penetration Test (CPT), Becker Penetration Test (BPT), and small-strain Shear Wave Velocity (Vs) measurements. Among them, the Vs is suitable for determining the liquefaction resistance because both Vs and liquefaction resistance are influenced by factors such as confining stress, soil type/plasticity and relative density [5- 7] and the Vs can be measured by several seismic tests including cross hole, down hole, seismic cone penetrometer (SCPT), suspension logger, and spectral analysis of surface
* Corresponding Author Email: [email protected]
waves (SASW). During the past two decades, several procedures developed from laboratory studies [8-15], analytical studies [16-17], penetration-Vs equations [18-19], and Vs measurements at earthquake shaken sites [20-22] have been proposed to estimate the liquefaction resistance based on the Vs. Some of these procedures follow the general format of Seed- Idriss’ simplified procedure in which the Vs is corrected to a reference vertical stress and correlated with the cyclic stress ratio. This paper presents the results of the comparison between the Vs and SPT methods of soil liquefaction potential evaluation in the south of Tehran. The liquefaction potential index is also calculated by Iwasaki et al.’s [23] procedure for both methods.
Rouzbeh Dabiri et al.
30
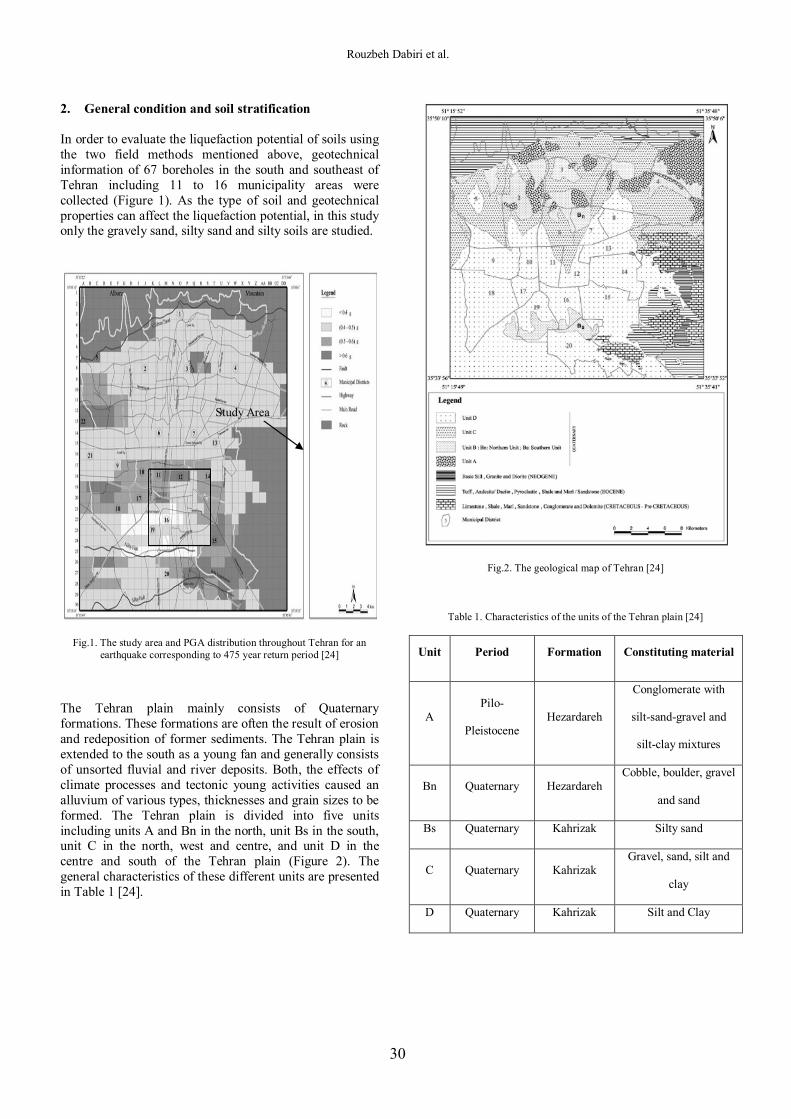
2. General condition and soil stratification In order to evaluate the liquefaction potential of soils using the two field methods mentioned above, geotechnical information of 67 boreholes in the south and southeast of Tehran including 11 to 16 municipality areas were collected (Figure 1). As the type of soil and geotechnical properties can affect the liquefaction potential, in this study only the gravely sand, silty sand and silty soils are studied.
Fig.1. The study area and PGA distribution throughout Tehran for an earthquake corresponding to 475 year return period [24]
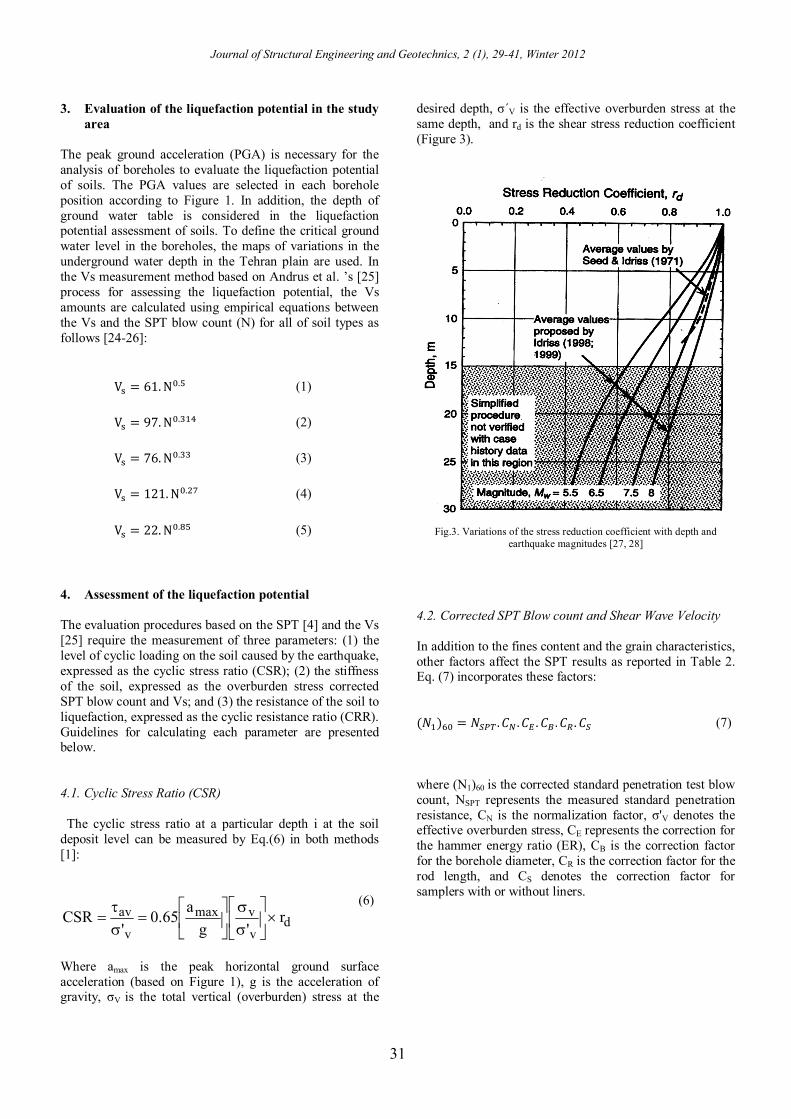
The Tehran plain mainly consists of Quaternary formations. These formations are often the result of erosion and redeposition of former sediments. The Tehran plain is extended to the south as a young fan and generally consists of unsorted fluvial and river deposits. Both, the effects of climate processes and tectonic young activities caused an alluvium of various types, thicknesses and grain sizes to be formed. The Tehran plain is divided into five units including units A and Bn in the north, unit Bs in the south, unit C in the north, west and centre, and unit D in the centre and south of the Tehran plain (Figure 2). The general characteristics of these different units are presented in Table 1 [24].
Fig.2. The geological map of Tehran [24]
Table 1. Characteristics of the units of the Tehran plain [24]
Unit Period Formation Constituting material
A Pilo-
Pleistocene Hezardareh
Conglomerate with
silt-sand-gravel and
silt-clay mixtures
Bn Quaternary Hezardareh Cobble, boulder, gravel
and sand
Bs Quaternary Kahrizak Silty sand
C Quaternary Kahrizak Gravel, sand, silt and
clay
D Quaternary Kahrizak Silt and Clay
Study Area
Journal of Structural Engineering and Geotechnics, 2 (1), 29-41, Winter 2012
31
3. Evaluation of the liquefaction potential in the study area
The peak ground acceleration (PGA) is necessary for the analysis of boreholes to evaluate the liquefaction potential of soils. The PGA values are selected in each borehole position according to Figure 1. In addition, the depth of ground water table is considered in the liquefaction potential assessment of soils. To define the critical ground water level in the boreholes, the maps of variations in the underground water depth in the Tehran plain are used. In the Vs measurement method based on Andrus et al. ’s [25] process for assessing the liquefaction potential, the Vs amounts are calculated using empirical equations between the Vs and the SPT blow count (N) for all of soil types as follows [24-26]:
V = 61.N . (1)
V = 97.N . (2)
V = 76.N . (3)
V = 121.N . (4)
V = 22.N . (5)
4. Assessment of the liquefaction potential The evaluation procedures based on the SPT [4] and the Vs [25] require the measurement of three parameters: (1) the level of cyclic loading on the soil caused by the earthquake, expressed as the cyclic stress ratio (CSR); (2) the stiffness of the soil, expressed as the overburden stress corrected SPT blow count and Vs; and (3) the resistance of the soil to liquefaction, expressed as the cyclic resistance ratio (CRR). Guidelines for calculating each parameter are presented below. 4.1. Cyclic Stress Ratio (CSR) The cyclic stress ratio at a particular depth i at the soil deposit level can be measured by Eq.(6) in both methods [1]:
dv
vmax
v
av r'g
a65.0'
CSR
(6)
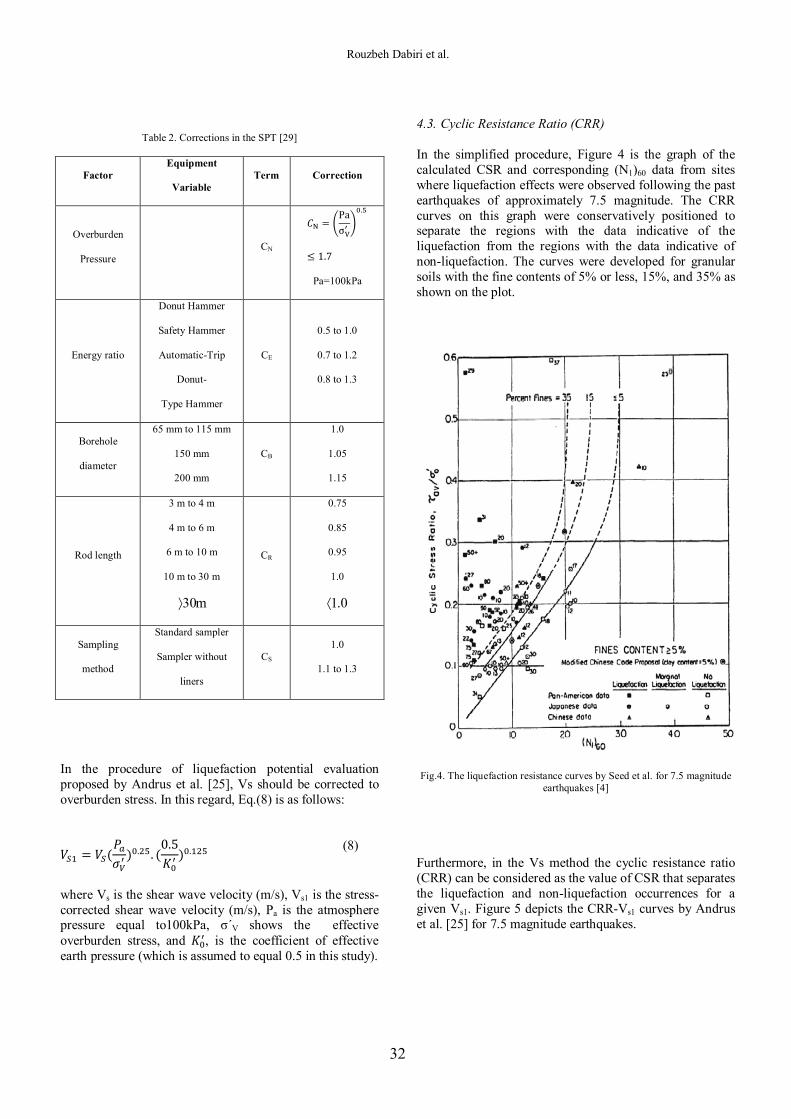
Where amax is the peak horizontal ground surface acceleration (based on Figure 1), g is the acceleration of gravity, σV is the total vertical (overburden) stress at the
desired depth, σ΄V is the effective overburden stress at the same depth, and rd is the shear stress reduction coefficient (Figure 3).
Fig.3. Variations of the stress reduction coefficient with depth and earthquake magnitudes [27, 28]
4.2. Corrected SPT Blow count and Shear Wave Velocity In addition to the fines content and the grain characteristics, other factors affect the SPT results as reported in Table 2. Eq. (7) incorporates these factors: (푁 ) = 푁 .퐶 .퐶 . 퐶 .퐶 . 퐶 (7)
where (N1)60 is the corrected standard penetration test blow count, NSPT represents the measured standard penetration resistance, CN is the normalization factor, σ'V denotes the effective overburden stress, CE represents the correction for the hammer energy ratio (ER), CB is the correction factor for the borehole diameter, CR is the correction factor for the rod length, and CS denotes the correction factor for samplers with or without liners.
Rouzbeh Dabiri et al.
32
Table 2. Corrections in the SPT [29]
Correction Term Equipment
Variable Factor
퐶 =Paσ
.
≤ 1.7
Pa=100kPa
CN Overburden
Pressure
0.5 to 1.0
0.7 to 1.2
0.8 to 1.3
CE
Donut Hammer
Safety Hammer
Automatic-Trip
Donut-
Type Hammer
Energy ratio
1.0
1.05
1.15
CB
65 mm to 115 mm
150 mm
200 mm
Borehole
diameter
0.75
0.85
0.95
1.0
0.1
CR
3 m to 4 m
4 m to 6 m
6 m to 10 m
10 m to 30 m
m30
Rod length
1.0
1.1 to 1.3 CS
Standard sampler
Sampler without
liners
Sampling
method
In the procedure of liquefaction potential evaluation proposed by Andrus et al. [25], Vs should be corrected to overburden stress. In this regard, Eq.(8) is as follows:
푉 = 푉 (푃휎 ) . . (
0.5퐾 ) .
(8)
where Vs is the shear wave velocity (m/s), Vs1 is the stress-corrected shear wave velocity (m/s), Pa is the atmosphere pressure equal to100kPa, σ΄V shows the effective overburden stress, and 퐾 , is the coefficient of effective earth pressure (which is assumed to equal 0.5 in this study).
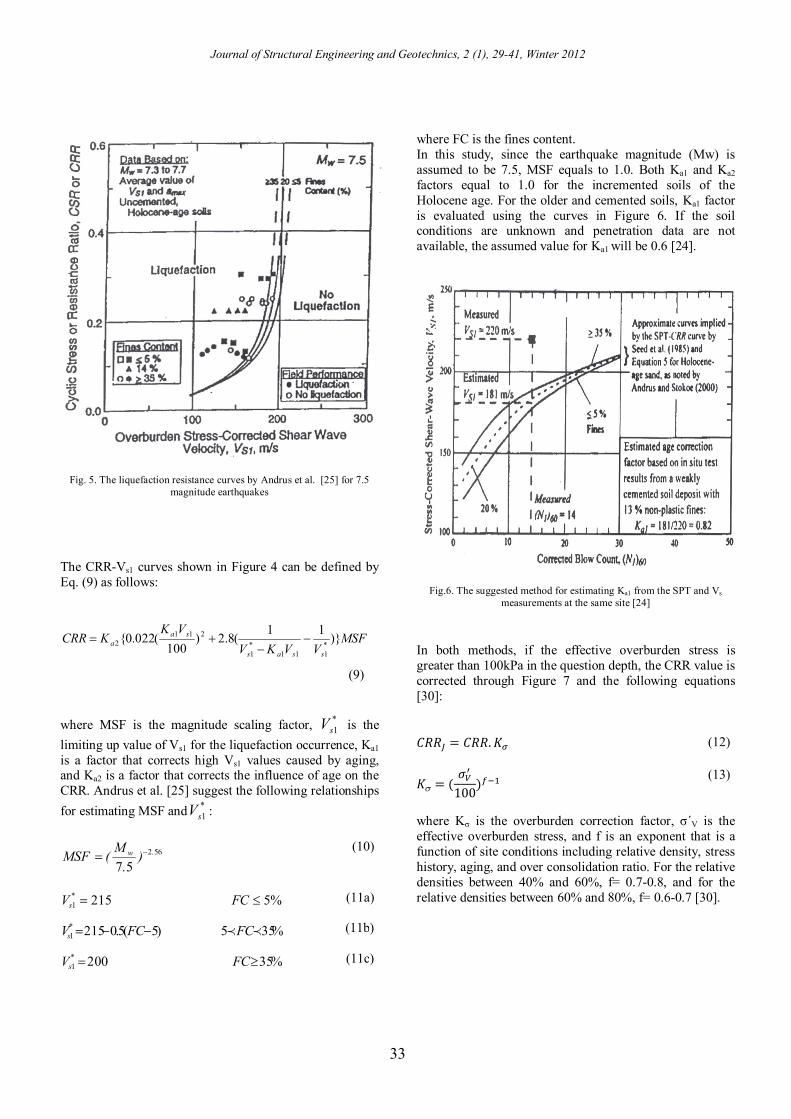
4.3. Cyclic Resistance Ratio (CRR) In the simplified procedure, Figure 4 is the graph of the calculated CSR and corresponding (N1)60 data from sites where liquefaction effects were observed following the past earthquakes of approximately 7.5 magnitude. The CRR curves on this graph were conservatively positioned to separate the regions with the data indicative of the liquefaction from the regions with the data indicative of non-liquefaction. The curves were developed for granular soils with the fine contents of 5% or less, 15%, and 35% as shown on the plot.
Fig.4. The liquefaction resistance curves by Seed et al. for 7.5 magnitude earthquakes [4]
Furthermore, in the Vs method the cyclic resistance ratio (CRR) can be considered as the value of CSR that separates the liquefaction and non-liquefaction occurrences for a given Vs1. Figure 5 depicts the CRR-Vs1 curves by Andrus et al. [25] for 7.5 magnitude earthquakes.
Journal of Structural Engineering and Geotechnics, 2 (1), 29-41, Winter 2012
33
Fig. 5. The liquefaction resistance curves by Andrus et al. [25] for 7.5 magnitude earthquakes
The CRR-Vs1 curves shown in Figure 4 can be defined by Eq. (9) as follows:
MSFVVKV
VKKCRR
ssas
saa )}11(8.2)
100(022.0{ *
111*1
2112
(9)
where MSF is the magnitude scaling factor, *
sV 1 is the limiting up value of Vs1 for the liquefaction occurrence, Ka1 is a factor that corrects high Vs1 values caused by aging, and Ka2 is a factor that corrects the influence of age on the CRR. Andrus et al. [25] suggest the following relationships for estimating MSF and *
sV 1 :
562
57.w )
.M(MSF (10)
%5215*1 FCVs (11a)
%355)5(5.0215*1 FCFCVs (11b)
%35200*1 FCVs (11c)
where FC is the fines content. In this study, since the earthquake magnitude (Mw) is assumed to be 7.5, MSF equals to 1.0. Both Ka1 and Ka2 factors equal to 1.0 for the incremented soils of the Holocene age. For the older and cemented soils, Ka1 factor is evaluated using the curves in Figure 6. If the soil conditions are unknown and penetration data are not available, the assumed value for Ka1 will be 0.6 [24].
Fig.6. The suggested method for estimating Ka1 from the SPT and Vs measurements at the same site [24]
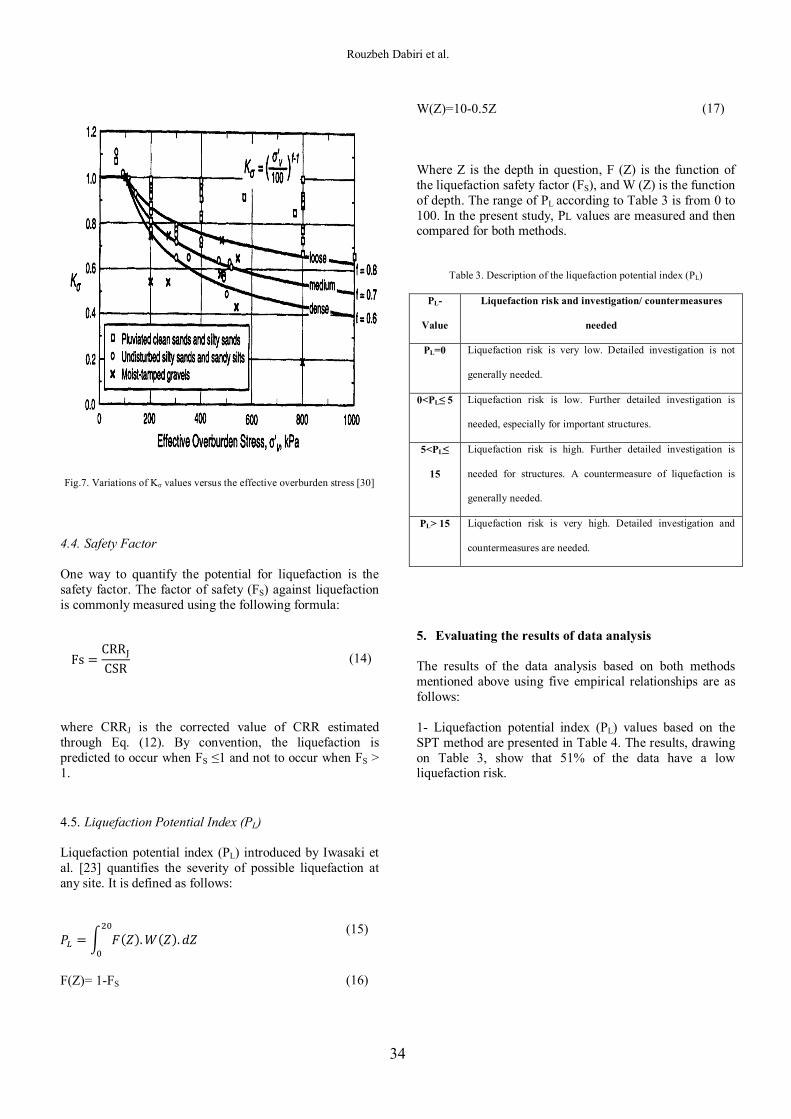
In both methods, if the effective overburden stress is greater than 100kPa in the question depth, the CRR value is corrected through Figure 7 and the following equations [30]: 퐶푅푅 = 퐶푅푅. 퐾 (12)
퐾 = (휎100)
(13)
where Kσ is the overburden correction factor, σ΄V is the effective overburden stress, and f is an exponent that is a function of site conditions including relative density, stress history, aging, and over consolidation ratio. For the relative densities between 40% and 60%, f= 0.7-0.8, and for the relative densities between 60% and 80%, f= 0.6-0.7 [30].
Rouzbeh Dabiri et al.
34
Fig.7. Variations of Kσ values versus the effective overburden stress [30]
4.4. Safety Factor One way to quantify the potential for liquefaction is the safety factor. The factor of safety (FS) against liquefaction is commonly measured using the following formula:
Fs =CRRCSR (14)
where CRRJ is the corrected value of CRR estimated through Eq. (12). By convention, the liquefaction is predicted to occur when FS ≤1 and not to occur when FS > 1.
4.5. Liquefaction Potential Index (PL) Liquefaction potential index (PL) introduced by Iwasaki et al. [23] quantifies the severity of possible liquefaction at any site. It is defined as follows:
푃 = 퐹(푍).푊(푍). 푑푍 (15)
F(Z)= 1-FS
(16)
W(Z)=10-0.5Z
(17)
Where Z is the depth in question, F (Z) is the function of the liquefaction safety factor (FS), and W (Z) is the function of depth. The range of PL according to Table 3 is from 0 to 100. In the present study, PL values are measured and then compared for both methods.
Table 3. Description of the liquefaction potential index (PL)
PL-
Value
Liquefaction risk and investigation/ countermeasures
needed
PL=0 Liquefaction risk is very low. Detailed investigation is not
generally needed.
0<PL≤ 5 Liquefaction risk is low. Further detailed investigation is
needed, especially for important structures.
5<PL≤
15
Liquefaction risk is high. Further detailed investigation is
needed for structures. A countermeasure of liquefaction is
generally needed.
PL> 15 Liquefaction risk is very high. Detailed investigation and
countermeasures are needed.
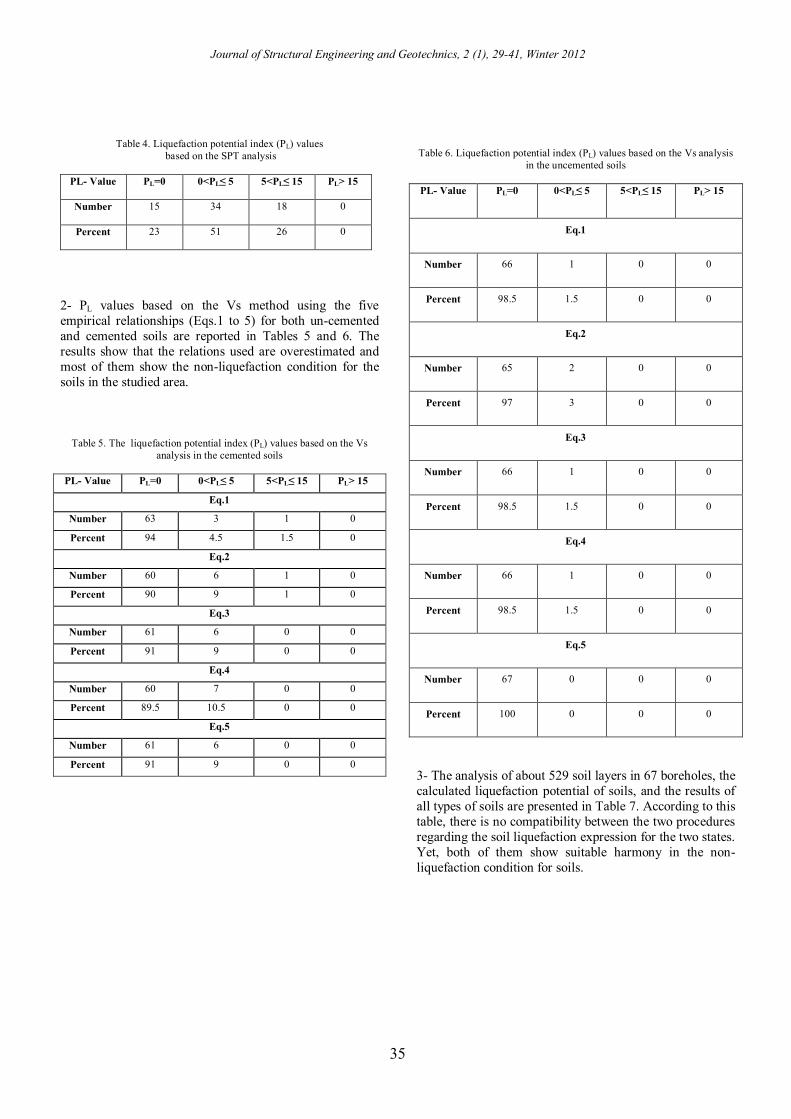
5. Evaluating the results of data analysis The results of the data analysis based on both methods mentioned above using five empirical relationships are as follows: 1- Liquefaction potential index (PL) values based on the SPT method are presented in Table 4. The results, drawing on Table 3, show that 51% of the data have a low liquefaction risk.
Journal of Structural Engineering and Geotechnics, 2 (1), 29-41, Winter 2012
35
Table 4. Liquefaction potential index (PL) values based on the SPT analysis
PL- Value PL=0 0<PL≤ 5 5<PL≤ 15 PL> 15
Number 15 34 18 0
Percent 23 51 26 0
2- PL values based on the Vs method using the five empirical relationships (Eqs.1 to 5) for both un-cemented and cemented soils are reported in Tables 5 and 6. The results show that the relations used are overestimated and most of them show the non-liquefaction condition for the soils in the studied area.
Table 5. The liquefaction potential index (PL) values based on the Vs analysis in the cemented soils
PL- Value PL=0 0<PL≤ 5 5<PL≤ 15 PL> 15
Eq.1
Number 63 3 1 0
Percent 94 4.5 1.5 0
Eq.2
Number 60 6 1 0
Percent 90 9 1 0
Eq.3
Number 61 6 0 0
Percent 91 9 0 0
Eq.4
Number 60 7 0 0
Percent 89.5 10.5 0 0
Eq.5
Number 61 6 0 0
Percent 91 9 0 0
Table 6. Liquefaction potential index (PL) values based on the Vs analysis in the uncemented soils
PL- Value PL=0 0<PL≤ 5 5<PL≤ 15 PL> 15
Eq.1
Number 66 1 0 0
Percent 98.5 1.5 0 0
Eq.2
Number 65 2 0 0
Percent 97 3 0 0
Eq.3
Number 66 1 0 0
Percent 98.5 1.5 0 0
Eq.4
Number 66 1 0 0
Percent 98.5 1.5 0 0
Eq.5
Number 67 0 0 0
Percent 100 0 0 0
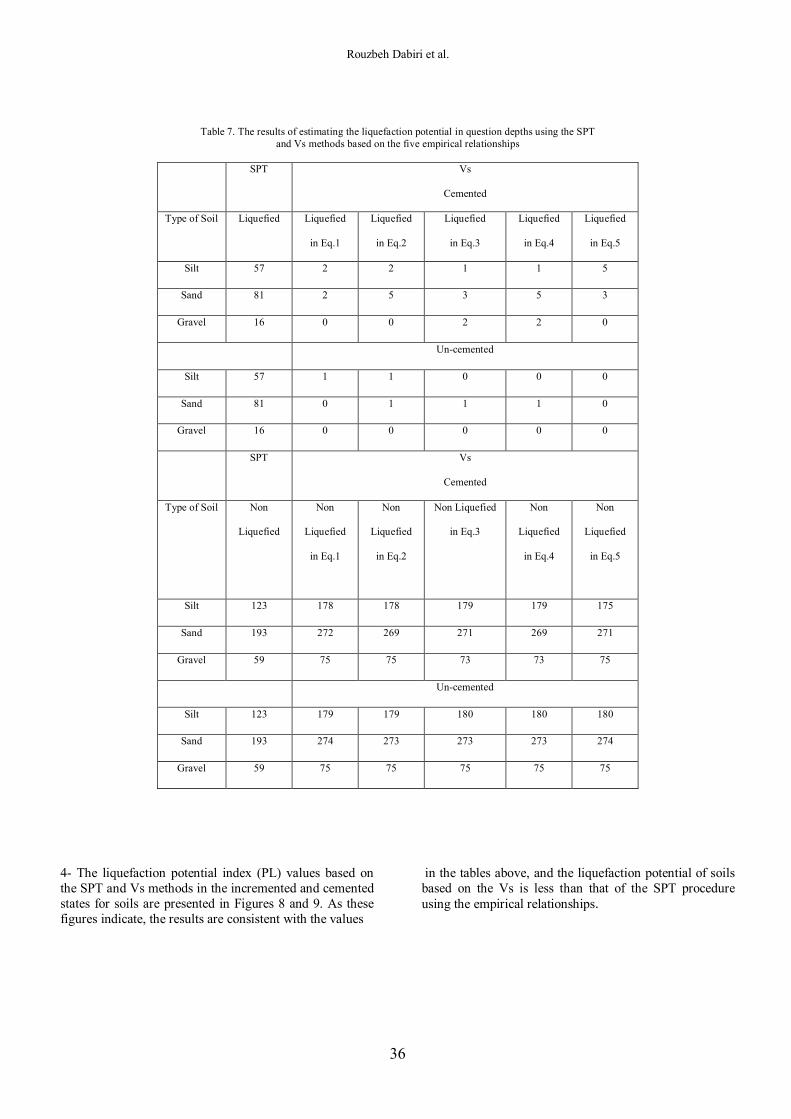
3- The analysis of about 529 soil layers in 67 boreholes, the calculated liquefaction potential of soils, and the results of all types of soils are presented in Table 7. According to this table, there is no compatibility between the two procedures regarding the soil liquefaction expression for the two states. Yet, both of them show suitable harmony in the non-liquefaction condition for soils.
Rouzbeh Dabiri et al.
36
Table 7. The results of estimating the liquefaction potential in question depths using the SPT and Vs methods based on the five empirical relationships
SPT Vs
Cemented
Type of Soil Liquefied
Liquefied
in Eq.1
Liquefied
in Eq.2
Liquefied
in Eq.3
Liquefied
in Eq.4
Liquefied
in Eq.5
Silt 57 2 2 1 1 5
Sand 81 2 5 3 5 3
Gravel 16 0 0 2 2 0
Un-cemented
Silt 57 1 1 0 0 0
Sand 81 0 1 1 1 0
Gravel 16 0 0 0 0 0
SPT Vs
Cemented
Type of Soil Non
Liquefied
Non
Liquefied
in Eq.1
Non
Liquefied
in Eq.2
Non Liquefied
in Eq.3
Non
Liquefied
in Eq.4
Non
Liquefied
in Eq.5
Silt 123 178 178 179 179 175
Sand 193 272 269 271 269 271
Gravel 59 75 75 73 73 75
Un-cemented
Silt 123 179 179 180 180 180
Sand 193 274 273 273 273 274
Gravel 59 75 75 75 75 75
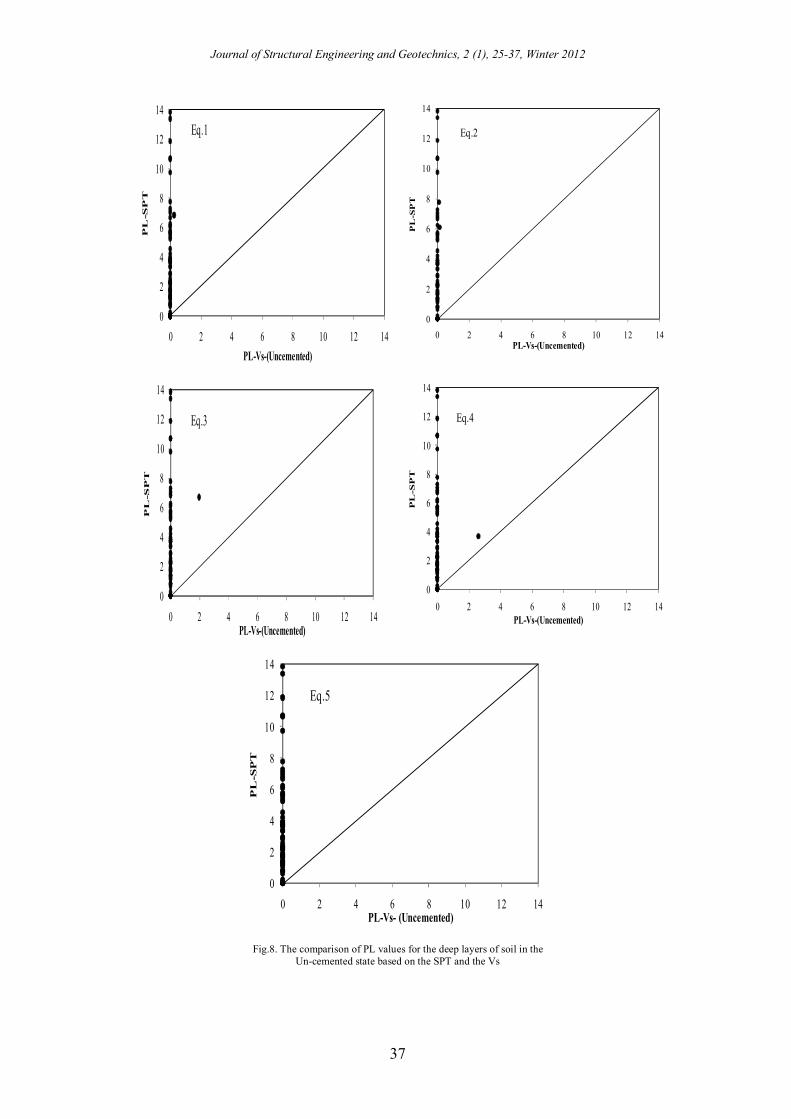
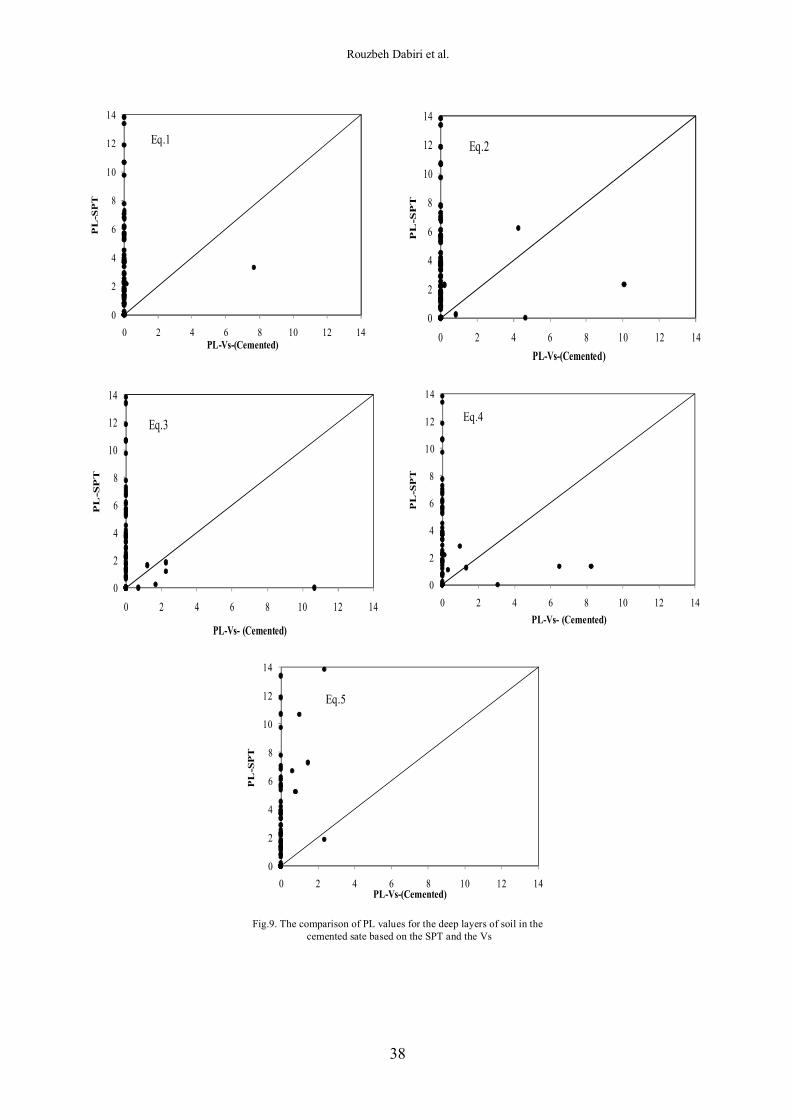
4- The liquefaction potential index (PL) values based on the SPT and Vs methods in the incremented and cemented states for soils are presented in Figures 8 and 9. As these figures indicate, the results are consistent with the values
in the tables above, and the liquefaction potential of soils based on the Vs is less than that of the SPT procedure using the empirical relationships.
Journal of Structural Engineering and Geotechnics, 2 (1), 25-37, Winter 2012
37
Fig.8. The comparison of PL values for the deep layers of soil in the Un-cemented state based on the SPT and the Vs
0
2
4
6
8
10
12
14
0 2 4 6 8 10 12 14
PL
-SP
T
PL-Vs-(Uncemented)
Eq.1
0
2
4
6
8
10
12
14
0 2 4 6 8 10 12 14
PL
-SP
T
PL-Vs-(Uncemented)
Eq.2
0
2
4
6
8
10
12
14
0 2 4 6 8 10 12 14
PL
-SP
T
PL-Vs-(Uncemented)
Eq.3
0
2
4
6
8
10
12
14
0 2 4 6 8 10 12 14
PL
-SP
T
PL-Vs-(Uncemented)
Eq.4
0
2
4
6
8
10
12
14
0 2 4 6 8 10 12 14
PL
-SP
T
PL-Vs- (Uncemented)
Eq.5
Rouzbeh Dabiri et al.
38
Fig.9. The comparison of PL values for the deep layers of soil in the cemented sate based on the SPT and the Vs
0
2
4
6
8
10
12
14
0 2 4 6 8 10 12 14
PL
-SP
T
PL-Vs-(Cemented)
Eq.1
0
2
4
6
8
10
12
14
0 2 4 6 8 10 12 14
PL
-SP
T
PL-Vs-(Cemented)
Eq.2
0
2
4
6
8
10
12
14
0 2 4 6 8 10 12 14
PL
-SP
T
PL-Vs- (Cemented)
Eq.3
0
2
4
6
8
10
12
14
0 2 4 6 8 10 12 14
PL
-SP
T
PL-Vs- (Cemented)
Eq.4
0
2
4
6
8
10
12
14
0 2 4 6 8 10 12 14
PL
-SP
T
PL-Vs-(Cemented)
Eq.5
Journal of Structural Engineering and Geotechnics, 2 (1), 25-37, Winter 2012
39
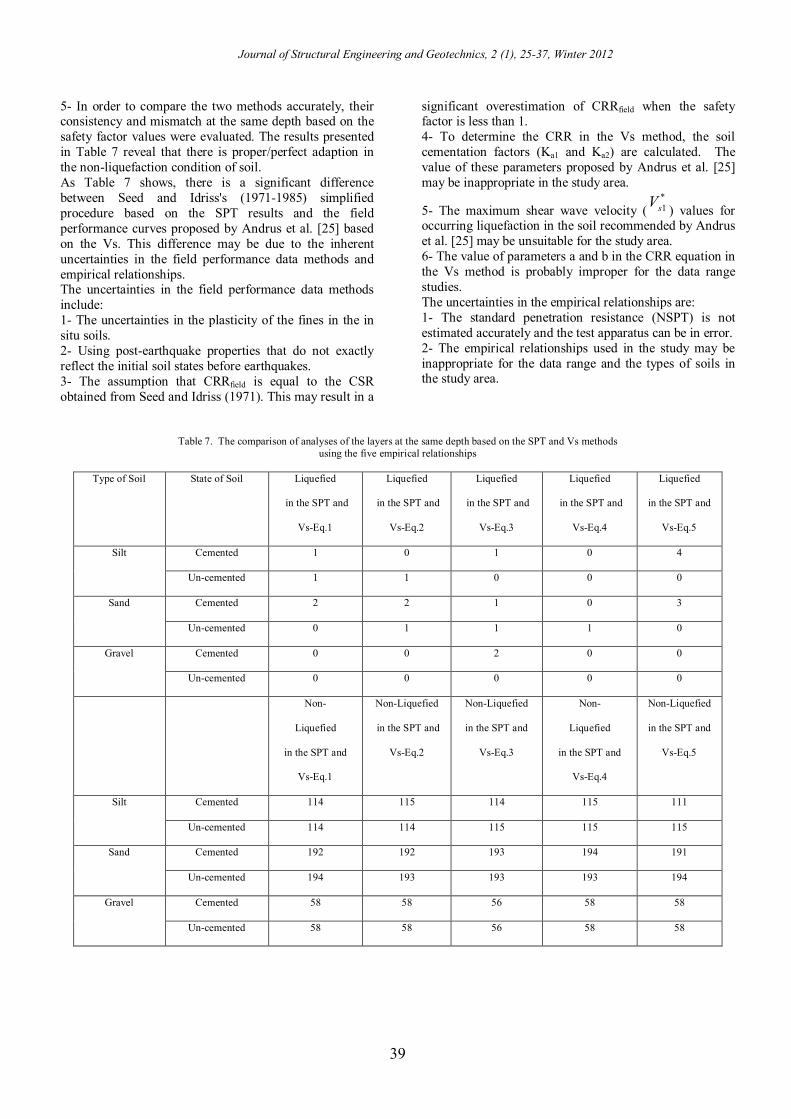
5- In order to compare the two methods accurately, their consistency and mismatch at the same depth based on the safety factor values were evaluated. The results presented in Table 7 reveal that there is proper/perfect adaption in the non-liquefaction condition of soil. As Table 7 shows, there is a significant difference between Seed and Idriss's (1971-1985) simplified procedure based on the SPT results and the field performance curves proposed by Andrus et al. [25] based on the Vs. This difference may be due to the inherent uncertainties in the field performance data methods and empirical relationships. The uncertainties in the field performance data methods include: 1- The uncertainties in the plasticity of the fines in the in situ soils. 2- Using post-earthquake properties that do not exactly reflect the initial soil states before earthquakes. 3- The assumption that CRRfield is equal to the CSR obtained from Seed and Idriss (1971). This may result in a
significant overestimation of CRRfield when the safety factor is less than 1. 4- To determine the CRR in the Vs method, the soil cementation factors (Ka1 and Ka2) are calculated. The value of these parameters proposed by Andrus et al. [25] may be inappropriate in the study area.
5- The maximum shear wave velocity (*sV 1 ) values for
occurring liquefaction in the soil recommended by Andrus et al. [25] may be unsuitable for the study area. 6- The value of parameters a and b in the CRR equation in the Vs method is probably improper for the data range studies. The uncertainties in the empirical relationships are: 1- The standard penetration resistance (NSPT) is not estimated accurately and the test apparatus can be in error. 2- The empirical relationships used in the study may be inappropriate for the data range and the types of soils in the study area.
Table 7. The comparison of analyses of the layers at the same depth based on the SPT and Vs methods using the five empirical relationships
Type of Soil State of Soil Liquefied
in the SPT and
Vs-Eq.1
Liquefied
in the SPT and
Vs-Eq.2
Liquefied
in the SPT and
Vs-Eq.3
Liquefied
in the SPT and
Vs-Eq.4
Liquefied
in the SPT and
Vs-Eq.5
Silt Cemented 1 0 1 0 4
Un-cemented 1 1 0 0 0
Sand Cemented 2 2 1 0 3
Un-cemented 0 1 1 1 0
Gravel Cemented 0 0 2 0 0
Un-cemented 0 0 0 0 0
Non-
Liquefied
in the SPT and
Vs-Eq.1
Non-Liquefied
in the SPT and
Vs-Eq.2
Non-Liquefied
in the SPT and
Vs-Eq.3
Non-
Liquefied
in the SPT and
Vs-Eq.4
Non-Liquefied
in the SPT and
Vs-Eq.5
Silt Cemented 114 115 114 115 111
Un-cemented 114 114 115 115 115
Sand Cemented 192 192 193 194 191
Un-cemented 194 193 193 193 194
Gravel Cemented 58 58 56 58 58
Un-cemented 58 58 56 58 58
Rouzbeh Dabiri et al.
40
6. Conclusion The present study was an attempt to investigate the two field methods of SPT and Vs used to evaluate the liquefaction potential of soils based on the empirical relationships between them. The comparison of the safety factor values and the liquefaction potential indexes shows that the severity/seriousness of liquefaction occurrence in the studied area based on the Vs method is lower than that based on the SPT method. Furthermore, it is observed that the relationships between the SPT and the Vs are not appropriate. As the relationships used in the present study are dependent on the soil type, fines content (clay and silt), type of tests and their accuracy, it would be much safer to perform both methods for the same place and then compare the results in order to evaluate the liquefaction potential. For the future research, more studies may be conducted to obtain better relationships based on the types of soils within the area of the study. References [1] Seed H B, Idriss I M (1971).Simplified Procedure for
Evaluating Soil Liquefaction Potential.Journal of the Soil Mechanics and Foundations Division, ASCE , Vol .97 ,SM9, pp 1249-1273.
[2] Seed H B, Idriss I M (1982).Ground Motion and Soil Liquefaction During Earthquakes. EERI, ASCE, Vol.109, No.3, pp 458-482
[3] Seed H B, Idriss I M, Arongo I (1983). Evaluation of Liquefaction Potential Using Field Performance Data.journal of Geotchnical Engineering, ASCE,Vol.109,NO.3,pp 458-482.
[4] Seed H B, Tokimatso k, Harder L F (1985). The influence of SPT procedures in soil liquefaction resistance evaluation. Geotech engrg ,ASCE,111(12)
[5] Hardin B O, Drnevich V P (1972).Shear Modulus and Damping in Soils: Design Equation and Curves. Journal of Soil Mechanics and Foundation, Division, ASCE, Vol. 98,SM7.pp 667-692
[6] Kramer S (1996). Geotechnical Earthquake Engineering. Prentice Hall, New Jersey
[7] Ishihara K (1996). Soil Behaviour in Earthquake Geotechnics. Oxford Engineering Science Series.Oxford University Press.
[8]. Rauch A F, Duffy M, Stokoe K H (2000). Laboratory correlation of liquefaction resistance with shear wave velocity. Geotech. Spec. Publ., 110,pp 66–80.
[9] Huang Y T, Huang A B, Kuo Y C, Tsai M D (2004). A laboratory study on the undrained strength of a silty sand from Central Western Taiwan. Soil Dyn. Earthquake Eng., 24,pp 733–743.
[10] Chen Y M, Ke H, Chen R P (2005). Correlation of shear wave velocity with liquefaction resistance based on laboratory tests. Soil Dyn. Earthquake Eng., 25_6_,pp 461–469.
[11] Zhou Y G, Chen Y M, Huang B (2005). Experimental study of seismic cyclic loading effects on small strain shear modulus of saturated sands. Journal of Zhejiang University SCIENCE, 6A(3),pp 229-236.
[12] Ning Liu S M, Mitchell J K, Hon M (2006). Influence of
non plastic fines on shear wave velocity-based assessment of liquefaction. Journal of Geotechnical and Geoenviromental Engineering, Vol. 132, No. 8, pp 1091-1097.
[13] Zhou Y G, Chen Y M (2007). Laboratory investigation on assessing liquefaction resistance of sandy soils by shear wave velocity.J Geotech.Geoenviron. Eng., ASCE,133(8),pp 959-972.
[14] Baxter C D P, Bradshaw A S, Green R A, Wang J (2008). Correlation Between Cyclic Resistance and Shear Wave Velocity for providence silts. Journal of Geotechnical and Geoenviromental Engineering, Vol. 134, No. 1, pp 37-46.
[15] Askari F, Dabiri R, Shafiee A and Jafari M K (2011). Liquefaction Resistance of Sand-Silt Mixtures using Laboratory based Shear Wave Velocity. International Journal of Civil Engineering ,Vol.9, No.2, pp. 135-144.
[16] Andrus R D (1994). In-situ characterization of gravelly soils that liquefied in the 1983 Borah Peak Earthquake. Unpublished Ph.D. Thesis, University of Texas.
[17] Dabiri R, Askari F, Shafiee A and Jafari M K (2011). Shear Wave Velocity-based Liquefaction Resistance of Sand-Silt Mixtures: Deterministic versus Probabilistic Approuch, Iranian Journal of Science and Technology- Transaction of Civil Engineering, Vol.35, No.C2, pp.199-215.
[18] Lodge A L (1994). Shear Wave Velocity Measurements for Subsurface Characterization. Ph.d Dissertation, University of California at Berkeley.
[19] Kayabali K (1996). Soil Liquefaction Evaluation Using Shear Wave Velocity .Engineering Geology,ElsevierPublisher,NewYork,NY,Vol.44,NO.4,pp 121-127.
[20] Andrus R D, Stokoe K H (1997). Liquefaction Resistance Based on Shear Wave Velocity. NCEER Workshop on Evaluation of Liquefaction Resistance of Soils, Technical Report NCEER-97-0022,T.L.Youd and I.M. Idriss, Eds., held 4-5January 1996, Salt lake City, UT, National Center for Earthquake engineering Research,Buffalo,NY,pp 89-128.
[21] Juang C H, C J Chen (2000). CPT-based liquefaction analysis, Part 1: Determination of limit state function. Geotechnique, Vol. 50, No. 5, pp 583-592.
[22] Andrus R D, Stokoe K H (2000). Liquefaction resistance of soils from shear wave velocity. ASCE, 126 (11),pp 1015 – 1025
[23] Iwasaki T., Tatsuoka F., Tokida K. and Yasuda S. (1978). A Practical Method for Assessing Soil Liquefaction Potential Based on Case Studies at Various Sites in Japan. Proc. of 5th Japan Earthquake Engineering Symposium, pp.641-648. ( in Japanese)
[24] Shafiee A, Kamalian M, Jafari M K and Hamzehloo H (2011). Ground Motion Studies for Microzonation in Iran, Natural Hazard, pp.1-25.
[25] Andrus R.D., Piratheepan P., Ellis B.S., Zhang J., Juang H.C (2004). Comparing Liquefaction Evaluation Methods Using Penetration Vs Relationship. Journal of Soil Dynamics and Earthquake Engineering, Vol. 24.,pp. 713-721
[26] Jafari M. K., Shafiee A. and Razmkhah A. (2002). Dynamic Properties of Fine Grained Soils in South of Tehran, Journal of Seismology and Earthquake Engineering, Vol.4, No.1., pp.25-36.
Journal of Structural Engineering and Geotechnics, 2 (1), 29-41, Winter 2012
41
[27] Idriss I M (1998). Evaluation of Liquefaction Potential, Consequences and Mitigation—An Update, Presentation Notes for Geotechnical Society Meeting, Held 17 Feb. 1998, Vancover, Canada.
[28] Idriss I M (1999). An Update of the Seed-Idriss Simplified Procedure For Evaluation Liquefaction Potential, Presentation Notes for Transportation Research Board Workshop on New Approaches to Liquefaction Analysis, Held 10 Jan. 1999, Washington D.C.
[29] Skempton A. K.,(1986)"Standard Penetration Test Procedures and the Effects in Sands of Overburden Pressure, Relative Density, Particle Size, Aging and Overconsolidation", Journal of Geotechnique,Vol.36,No.3,pp.425-447.
[30] Hynes M E, Olsen R S (1999). Influence of Confining Stress on Liquefaction Resistnce.Proc.Int.Workshop on Phys .And Mech. Of Soil Liquefaction, Balkema, Rotterdom, The Netherlands,pp 145-152.