Embed Size (px)
Citation preview
University of Nebraska - LincolnDigitalCommons@University of Nebraska - Lincoln
Sociology Department, Faculty Publications Sociology, Department of
2017
Evaluating data quality in reports of sales in a retailestablishment surveyKristen OlsonUniversity of Nebraska-Lincoln, [email protected]
Xiaoyu LinData Science, Nielsen
Timothy BanksData Science, Nielsen
Follow this and additional works at: http://digitalcommons.unl.edu/sociologyfacpub
Part of the Advertising and Promotion Management Commons, Business Administration,Management, and Operations Commons, Business Intelligence Commons, Family, Life Course, andSociety Commons, and the Social Psychology and Interaction Commons
This Article is brought to you for free and open access by the Sociology, Department of at DigitalCommons@University of Nebraska - Lincoln. It hasbeen accepted for inclusion in Sociology Department, Faculty Publications by an authorized administrator of DigitalCommons@University ofNebraska - Lincoln.
Olson, Kristen; Lin, Xiaoyu; and Banks, Timothy, "Evaluating data quality in reports of sales in a retail establishment survey" (2017).Sociology Department, Faculty Publications. 491.http://digitalcommons.unl.edu/sociologyfacpub/491
301
Published in International Journal of Market Research 59:3 (2017), pp. 301-319. doi: 10.2501/IJMR-2017-000Copyright © 2017 The Market Research Society. Used by permission.
Evaluating data quality in reports of sales in a retail establishment survey
Kristen Olson University of Nebraska-Lincoln
Xiaoyu Lin Data Science, Nielsen
Timothy Banks Data Science, Nielsen
Abstract This paper examines failure to use records in sales reporting across about 12,000 store owners participating in a retail measurement panel in a Southeast Asian coun-try. Reported sales based on the storekeeper’s memory (oral reports) were lower than those from records, as expected. More surprisingly, oral reports acted as a sup-plement to record-based reports at the same store, such that stores that had oral reports had higher total sales than those with invoices. Although stores were ex-pected to either have or not have a reliable record system, many stores used both. Findings varied over individual categories of products. Little research has exam-ined the quality of reports of retail (consumer) sales from store owners in non-west-ern countries. The paper suggests that improving data collection tools, rather than a single statistical adjustment approach, may be a more fruitful avenue for reduc-ing measurement error in sales reports.
Introduction
Market research into which products consumers buy at individual retail outlets where consumers exchange money for goods (that is, retail estab-lishments) requires understanding what products are at which stores at any given time, their prices, and the sales of each product (Dhar, Hoch & Ku-mar 2001; Ailawadi & Keller 2004). In developed countries this informa-tion is easily obtained from electronic records (e.g. point of sale and inven-tory control systems), but in developing countries the information may be
digitalcommons.unl.edu
302 olson, l in, & banks in intnl jrnl of market res 59 (2017)
more readily obtained from the owners of the retail establishments. In par-ticular, in developing markets the levels of computerization can be low, with data from retail establishments obtained through a combination of records (e.g. invoices, delivery receipts) and recall of store purchases from the store-keeper’s memory – also called oral purchase (OP) reports. Although much cross-cultural market research focuses on identifying constructs that are consistently understood by consumers across countries (Malhotra, Agar-wal & Peterson 1996; Cavusgil & Das 1997), the issue of obtaining equiv-alent sales information from store owners cross-nationally has received less attention.
Surveys of retail store behavior pose different challenges for collecting in-formation compared to surveys of people (Harlesden et al. 2013; Willi Mack 2013). Capacity to respond varies by establishment size (Harlesden 2013), especially in a non-western context in which retail establishments may be small, may not have electronic or other record-keeping systems, and may not have experience in completing surveys (McKenzie & Woodruff 2013). Data quality may then suffer in these contexts when records for monthly sales are not available because of memory lapses or errors (Banda 2010; Willi Mack 2013; Willi Mack & Snickers 2013).
Using reports from owners of retail establishments about sales and pur-chases rather than records of these sales and purchases is not a problem if the reported values are indistinguishable in quality from the record values for a given type of establishment. It is well established in household and es-tablishment surveys in western countries that respondent reports either are missing (item non-response) or disagree with values found in records (e.g. Rodgers, Brown & Duncan 1993; Tomaskovic-Devey, Leiter & Thompson, 1995; Bergmann et al. 1998; Lorenc 2007). In particular, consumer expen-ditures are systematically under-reported, especially for expenditures re-lated to socially undesirable products (National Research Council 2013). In establishment surveys in the United States, differences exist between purely record-based estimates and recall-based estimates, with records generally yielding larger estimates of employees and hours worked than memory-based reports (e.g. Goldenberg 1994; Groen 2012). Whether this discrep-ancy holds in non-western contexts is less well studied.
Survey reports in establishment surveys in non-western countries
Record maintenance is fundamental to business operations for large com-panies, and thus fundamental to the quality of reports in business surveys
data quality in reports of sales in a retail survey 303
(Haraldsen 2013; Willimack & Snijkers 2013). In smaller companies formal record systems are less central to business operations, and smaller busi-nesses ‘hence need to rely more on answers provided from memory rather than collected from records’ (Haraldsen 2013, p. 111). Although, in west-ern countries, smaller organizations may be less important to understand-ing business dynamics, in developing countries micro and small businesses are major economic drivers (Mead & Liedholm 1998; Nichter & Goldmark 2009). In particular, information about retailing activity in a developing country is highly important because retailing is a critical market channel. We expect that retail establishments in a developing context will be more likely to have ‘inadequate’ (written) record-keeping systems than those in western countries. Additionally, much of what is known about records for survey purposes comes from official statistics (Snijkers et al. 2013); less is known about use of records in market research interviews.
The response process for establishments reporting in a survey can be broken into seven steps: record formation and encoding; selecting the cor-rect respondent(s) to complete the survey request; comprehending the sur-vey question; retrieving information from records or memory; judgement that the retrieved information is sufficient; completing the response task; and providing the data back to the survey organization (Banda 2006; Wil-limack 2013; Willimack & Snijkers 2013, p. 61). When records are unavail-able or incomplete, a failure at the first step, recalled information is orally reported. In developing countries, reasons for oral reports vary across mar-kets, including inconsistent access to electricity for computers, differences in records between restaurants and retail store fronts, illiteracy, sales tax avoidance, and influence from some wholesalers not to record sales. We anticipate that reports based on memory will omit or forget sales com-pared to record-based reports; thus we hypothesize that sales from oral reports will be lower than sales from invoice-based reports. A store might use oral reporting for only a selection of categories, such as those with high sales tax, or for all products through it. As such, we evaluate correlates of whether or not a store provides an oral purchase report for any category and for specific high-tax categories (e.g. cigarettes and beer).
The key question is whether reported levels of sales differ for oral re-ports versus invoice-based reports. Because retail establishments that pro-vide oral reports might differ in a variety of characteristics compared to those with invoices, we need to account for the differences in business characteristics. To do this, we employ propensity score stratification and matching methods (Rosenbaum & Rubin 1984, 1985). Propensity scores provide a way to balance between two groups on characteristics that may be related to non-random ‘treatment’ assignment, similar to those used
304 olson, l in, & banks in intnl jrnl of market res 59 (2017)
for non-response adjustment weights (Olson 2006). Because we do not have a measure of ‘truth’ for the reported levels of sales for stores without records, we evaluate whether the sales level reported for stores that have records is statistically equivalent to the sales level reported for stores that use oral reports. Propensity scores have been used to address issues of se-lection effects when studying mode measurement differences in household surveys (e.g. Lugtig et al. 2011); here, we apply propensity score analyses to address the two ‘modes’ of orally reported data versus data from invoices in a Nielsen retail measurement panel.
To summarize, we evaluate the quality of data reported by store owners to interviewers about purchases (called oral purchase reports) compared to data recorded in records (invoices) at stores in a Southeast Asian country. The key research questions are:
RQ1: To what extent do reports on sales differ when report-ing orally by store owners compared to coming from records?
RQ2: Can these differences be attributed to characteristics of the stores themselves?
RQ3: Are these differences replicated in particular catego-ries of sales or products?
The Southeast Asian country has one of the highest levels of oral pur-chase reporting in Nielsen’s international retail purchase measurement. In addition, this country was selected because data are collected on a wide range of product categories and types of establishment that are found in other countries in this region. Propensity score adjustment methods are applied to account for differences in store characteristics between those with and without oral purchase (OP) reporting. We look at sales overall and at two of the largest categories of sales (beer and cigarettes).
Data and methods
The Nielsen Company monitors consumer product flows through the re-tail channels of more than 100 countries, obtaining information about ab-solute volumes, relative shares, price and distributions of consumer prod-ucts stocked, sold and purchased by retail stores. This paper concentrates on statistical panels built of cooperating retail outlets selected from the an-
data quality in reports of sales in a retail survey 305
nual Nielsen retail establishment surveys (RES). Outlets in the retail panel have contractually agreed to provide Nielsen with information about their purchasing activity, stock levels and consumer sales.
We use two data sources: data reported on purchases by stores from Au-gust 2013 (response rate = 100.0%) and the RES conducted from March to November 2013 (response rate = 100.0%; information is obtained on stores through observation if an interview is not obtained). The RES survey is a separate data collection effort to understand the overall retail universe in a country, and is the frame for stores recruited for the second survey cover-ing a wide geography and a greater number of stores. A rotating panel de-sign is used, with an overlap of around 75% across years. Stores recruited for the panel are monitored carefully, and newly selected stores come from updated RES store listings.
For a stratified random sample of the establishments identified in the RES, Nielsen first attempts to obtain electronic records from the retail outlet panel members. Data are then extracted from any inventory, outlet purchase and consumer point-of-sale systems. Where such computer systems are ei-ther not available or not accessible to Nielsen, the company uses interview-ers (‘auditors’) to record the quantity of relevant items bought, stocked and sold by the outlet. Stocks are physically counted by the auditors (both in the front or public selling space, and in the back or storage rooms) monthly. This stock count by auditors (often called a pantry check) is valuable in checking that all invoices are collected because all items in stock should have a pur-chase record by the store. Where possible Nielsen tries to obtain written re-cords (e.g. invoices) of the purchases.
Ideally, Nielsen auditors would not need to interview the store owner as the data are collected directly by the auditor (stock counts) or from physical records such as invoices. When invoices are lacking or incomplete, Nielsen asks the store to orally report its purchases via an interview, relying on the storekeeper’s memory. This is frequently true in developing countries, where records are less likely to be present or made available. Alternative data col-lection modes were considered, such as direct observation, but these were impractical given the large size of the panels and the need for continual mon-itoring of the store activity. In sum, the purchase data involve an in-person interview (audit) at the panel store in which sales purchase, inventory and sales information are acquired, first from records and, if lacking, then re-ported by the storekeeper as an oral report.
The purchase data contain 1.17 million total items reported by a panel sample of 12,048 stores in the study country. An average of almost 98
306 olson, l in, & banks in intnl jrnl of market res 59 (2017)
items were reported per store (SD=164.6), with a median of 27 items. The RES data contained store characteristics for a total of 12,343 unique stores. Overall, when the two data sources were merged, there were 12,413 stores: 365 of these stores are uniquely in the RES data, 70 stores appear only in the purchase data (selected during earlier RES years), leaving 11,978 stores that are in both data files. The analyses reported here will focus on those 11,978 stores.
There is substantial heterogeneity within stores in record keeping. In many stores, some items have records available while other items do not. The key independent variable is whether the store has any of their sales re-ported via oral purchase (OP). We group the stores into two categories: those with no oral purchase (no OP) reports (56.6% of stores) and those with at least some of their sales being reported via oral purchase (i.e. OP reports) (43.4% of stores). Stores in the ‘0% oral purchases’ category rep-resent stores that have records of all transactions and inventories for items sold in the store, or if they had no revenue (3.9% of stores). We examined stores with no revenue separately and found few meaningful differences; they are excluded here. We also examine category-specific oral purchase re-ports for beer and cigarettes, two of the most frequent types of items sold. In this country, 18.4% of the 5,118 stores that reported having any beer sales had OP reports for beer, and 27.5% of the 6,910 stores that reported having any cigarette sales had OP reports for cigarettes. We look at overall sales, beer sales, and cigarette sales for the primary set of dependent variables. Because of the non-normal distribution of sales, all of the analyses of total sales are log-transformed.
We examine a variety of store characteristics as predictors of OP reports. These include geographic location, anticipating differences in urbanicity to affect record keeping. We also examine store location on main (81%) or alley (19%) streets as an indicator of the surrounding area for the establishment. We examined whether stores have an exclusive agency agreement with par-ticular companies (only 3% of stores), anticipating these stores may have fewer items to manage. The RES contained indicators of different equip-ment types at the store. Store with an air conditioner, fan, scanner, refriger-ator, freezer or cash machine were coded as having electricity present on the premises (50.4%). There are 60 product categories for items in these data. The number of product categories each store sells was calculated as a mea-sure of the complexity of the reporting and record-keeping task. The overall mean number of categories a store sells was 10.74 (SD=11.80, minimum=1, maximum=57). Only 9% of stores had any indication of wholesaling activ-
data quality in reports of sales in a retail survey 307
ity; 91% of the stores sold only to the ultimate consumer, having no sales to other stores or sub-wholesalers. In many developing markets, it is not un-usual for stores to have a mix of retail and wholesale sales.
The RES also asked auditors to make qualitative evaluations of the stores. Auditors were asked ‘How is the quality of the goods displayed in the store?’, with rating categories of good (56.3%), average (42.4%) or bad (1.4%). Auditors also provided ratings of the store’s willingness to cooper-ate on a scale ranging from Excellent (20.2%), via Good (70.2%) and Fair (8.3%), to Bad (1.3%).
The next set of variables indicates how establishment record purchases (from the question ‘How do you record the purchase?’), with response cat-egories of printed invoice (28.0%), handwritten invoice (35.7%), store own-er’s book (4.0%), Nielsen purchase diary (64.3%), oral purchase (25.7%) or computer (0.27%). Respondents could indicate that they recorded pur-chases in multiple ways and, as such, the percentages do not total to 100%. The Nielsen purchase diary was a form developed by Nielsen to assist estab-lishments that did not have written or printed invoices to record purchases made during the month. Internal research demonstrated that this record-keeping system helped with increasing the reliability of reports from panel stores, in that the reported volumes increased along with the number of re-ported packs (stock-keeping units).
Propensity score analysis
A logistic regression model predicting the probability of being a store with any OP reports as a function of store characteristics from the RES (the x variables) is an OP propensity model: logit(Any OP = Yes) = β0 + β1x1 + …+ βpxp. We examine the coefficients from this logistic regression model to understand differences in the characteristics of stores that do and do not have any OP reports.
Predicted probabilities from a propensity model are the best single num-ber summary of the covariates in the model (Rosenbaum & Rubin 1984, 1985; Lugtig et al. 2011). This allows a multivariate evaluation of whether the stores with and without OP reports differ in the distribution of all of the variables in the model. This summary measure is the OP propensity score, calculated as p̂ = [exp(xβ)]/[1 + exp(xβ)] for each store in the dataset, where x is the vector of covariates and β is the vector of regression coefficients from the logistic regression described above. Each store, whether or not it had any OP reports, has a probability of having OP reports.
308 olson, l in, & banks in intnl jrnl of market res 59 (2017)
One question of interest is whether the distribution of the OP propensity scores overlaps for the two groups (Rosenbaum & Rubin 1984, 1985). Lack of overlap in the distribution of the OP propensity scores indicates that there are substantially different types of store that have OP reports and those that do not. Matching stores with OP reports to a store with similar characteris-tics that does not have OP reports requires having overlapping OP propen-sity scores. If the distributions overlap, but have different shapes, then this indicates that matches can be identified, and that the characteristics of the stores with and without OP reports differ.
To evaluate whether we can account for differences in sales based on char-acteristics of those with and without OP reports, we divide the OP propen-sity scores into deciles, known as propensity strata. Within OP propensity strata, stores are homogeneous on propensity scores, and thus similar on the multivariate distribution of characteristics that were used to estimate the propensity scores, identifying ‘matched’ stores within propensity strata. We also use propensity score matching methods to find a direct one-to-one store match using the teffects psmatch commands in Stata 13.1. This propensity score matching routine searches through the list of stores with no OP reports for stores that have the closest propensity score (nearest neighbor), with a maximal distance of 0.03, to a given store with OP reports. For the cate-gory-specific OP report models, we expand the maximal distance to 0.06.
Findings
To what extent do reports on sales differ when reporting orally by store owners compared to coming from records?
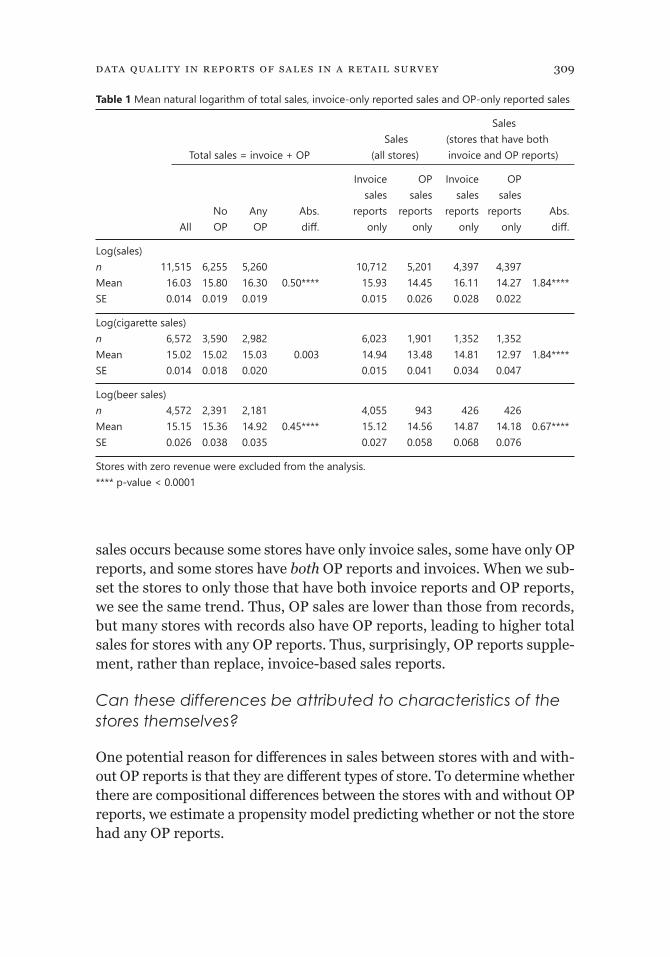
Table 1 shows the average natural logarithm of total (reported and oral pur-chase) sales, sales reported only via invoice, and sales reported only via OP. The total sales for each store is the sum of their invoice sales and OP sales reports. Invoice sales only are those sales reported on invoices, and OP sales reports only are those sales reported to an interviewer. Surprisingly, the av-erage log(total sales) are higher for stores that have any OP reports than for stores that do not have any OP reports. However, when looking only at the amount of sales reported with invoices available versus those reported as oral purchases, we see the opposite and expected pattern. Sales reported as OP are lower, on average, than sales reported with invoices (15.93 for log in-voice (sales reports only) compared to 14.45 for log OP sales reports only). This discrepancy between the total sales and OP-only versus invoice-only
data quality in reports of sales in a retail survey 309
sales occurs because some stores have only invoice sales, some have only OP reports, and some stores have both OP reports and invoices. When we sub-set the stores to only those that have both invoice reports and OP reports, we see the same trend. Thus, OP sales are lower than those from records, but many stores with records also have OP reports, leading to higher total sales for stores with any OP reports. Thus, surprisingly, OP reports supple-ment, rather than replace, invoice-based sales reports.
Can these differences be attributed to characteristics of the stores themselves?
One potential reason for differences in sales between stores with and with-out OP reports is that they are different types of store. To determine whether there are compositional differences between the stores with and without OP reports, we estimate a propensity model predicting whether or not the store had any OP reports.
Table 1 Mean natural logarithm of total sales, invoice-only reported sales and OP-only reported sales
Sales Sales (stores that have both Total sales = invoice + OP (all stores) invoice and OP reports)
Invoice OP Invoice OP sales sales sales sales No Any Abs. reports reports reports reports Abs. All OP OP diff. only only only only diff.
Log(sales)n 11,515 6,255 5,260 10,712 5,201 4,397 4,397Mean 16.03 15.80 16.30 0.50**** 15.93 14.45 16.11 14.27 1.84****SE 0.014 0.019 0.019 0.015 0.026 0.028 0.022
Log(cigarette sales)n 6,572 3,590 2,982 6,023 1,901 1,352 1,352Mean 15.02 15.02 15.03 0.003 14.94 13.48 14.81 12.97 1.84****SE 0.014 0.018 0.020 0.015 0.041 0.034 0.047
Log(beer sales)n 4,572 2,391 2,181 4,055 943 426 426Mean 15.15 15.36 14.92 0.45**** 15.12 14.56 14.87 14.18 0.67****SE 0.026 0.038 0.035 0.027 0.058 0.068 0.076
Stores with zero revenue were excluded from the analysis.**** p-value < 0.0001
310 olson, l in, & banks in intnl jrnl of market res 59 (2017)
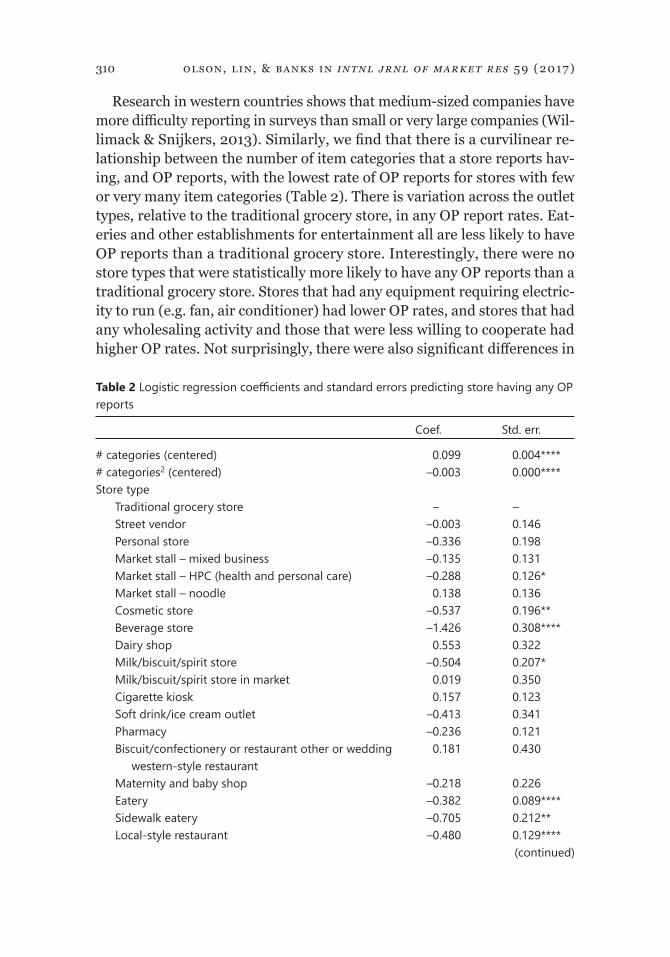
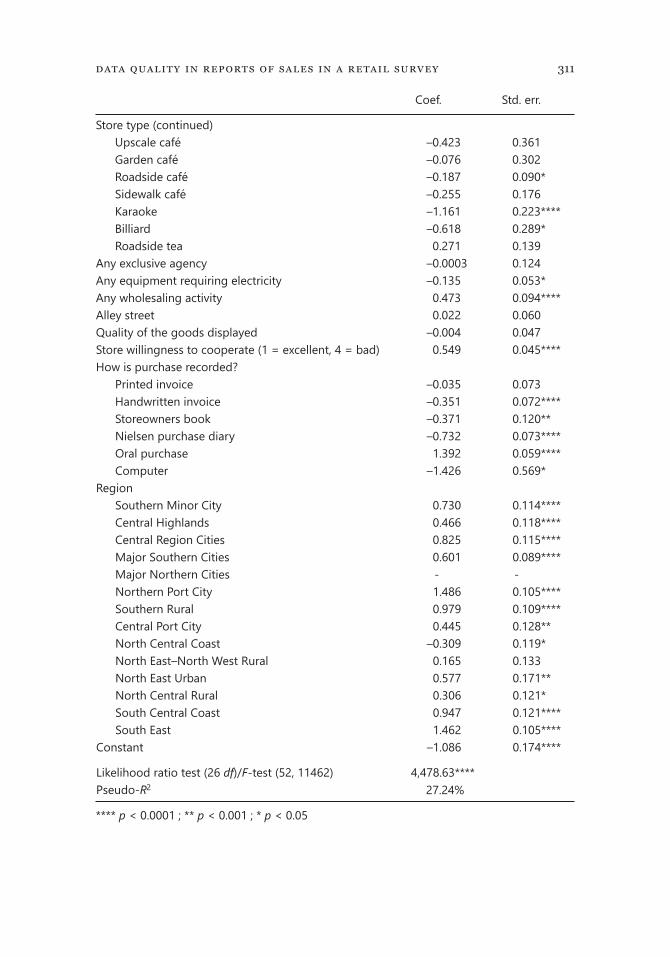
Research in western countries shows that medium-sized companies have more difficulty reporting in surveys than small or very large companies (Wil-limack & Snijkers, 2013). Similarly, we find that there is a curvilinear re-lationship between the number of item categories that a store reports hav-ing, and OP reports, with the lowest rate of OP reports for stores with few or very many item categories (Table 2). There is variation across the outlet types, relative to the traditional grocery store, in any OP report rates. Eat-eries and other establishments for entertainment all are less likely to have OP reports than a traditional grocery store. Interestingly, there were no store types that were statistically more likely to have any OP reports than a traditional grocery store. Stores that had any equipment requiring electric-ity to run (e.g. fan, air conditioner) had lower OP rates, and stores that had any wholesaling activity and those that were less willing to cooperate had higher OP rates. Not surprisingly, there were also significant differences in
Table 2 LogisticregressioncoefficientsandstandarderrorspredictingstorehavinganyOPreports
Coef. Std. err.
# categories (centered) 0.099 0.004****# categories2 (centered) –0.003 0.000****Store type
Traditional grocery store – –Street vendor –0.003 0.146Personal store –0.336 0.198Market stall – mixed business –0.135 0.131Market stall – HPC (health and personal care) –0.288 0.126*Market stall – noodle 0.138 0.136Cosmetic store –0.537 0.196**Beverage store –1.426 0.308****Dairy shop 0.553 0.322Milk/biscuit/spirit store –0.504 0.207*Milk/biscuit/spirit store in market 0.019 0.350Cigarette kiosk 0.157 0.123Soft drink/ice cream outlet –0.413 0.341Pharmacy –0.236 0.121Biscuit/confectionery or restaurant other or wedding 0.181 0.430 western-style restaurantMaternity and baby shop –0.218 0.226Eatery –0.382 0.089****Sidewalk eatery –0.705 0.212**Local-style restaurant –0.480 0.129****
(continued)
data quality in reports of sales in a retail survey 311
Coef. Std. err.
Store type (continued)Upscale café –0.423 0.361Garden café –0.076 0.302Roadside café –0.187 0.090*Sidewalk café –0.255 0.176Karaoke –1.161 0.223****Billiard –0.618 0.289*Roadside tea 0.271 0.139
Any exclusive agency –0.0003 0.124Any equipment requiring electricity –0.135 0.053*Any wholesaling activity 0.473 0.094****Alley street 0.022 0.060Quality of the goods displayed –0.004 0.047Store willingness to cooperate (1 = excellent, 4 = bad) 0.549 0.045****How is purchase recorded?
Printed invoice –0.035 0.073Handwritten invoice –0.351 0.072****Storeowners book –0.371 0.120**Nielsen purchase diary –0.732 0.073****Oral purchase 1.392 0.059****Computer –1.426 0.569*
RegionSouthern Minor City 0.730 0.114****Central Highlands 0.466 0.118****Central Region Cities 0.825 0.115****Major Southern Cities 0.601 0.089****Major Northern Cities - -Northern Port City 1.486 0.105****Southern Rural 0.979 0.109****Central Port City 0.445 0.128**North Central Coast –0.309 0.119*North East–North West Rural 0.165 0.133North East Urban 0.577 0.171**North Central Rural 0.306 0.121*South Central Coast 0.947 0.121****South East 1.462 0.105****
Constant –1.086 0.174****
Likelihood ratio test (26 df)/F-test (52, 11462) 4,478.63****Pseudo-R2 27.24%
**** p < 0.0001 ; ** p < 0.001 ; * p < 0.05
312 olson, l in, & banks in intnl jrnl of market res 59 (2017)
OP rates by how records were kept in the store. Importantly, stores that had a handwritten invoice, a storeowner’s book, the Nielsen purchase diary or a computer were less likely to have any OP reports, whereas those who were reported to be ‘oral purchase’ were more likely to have OP reports. There is also geographic variation in OP reports: the major northern cities have lower levels of OP reports than any other region.
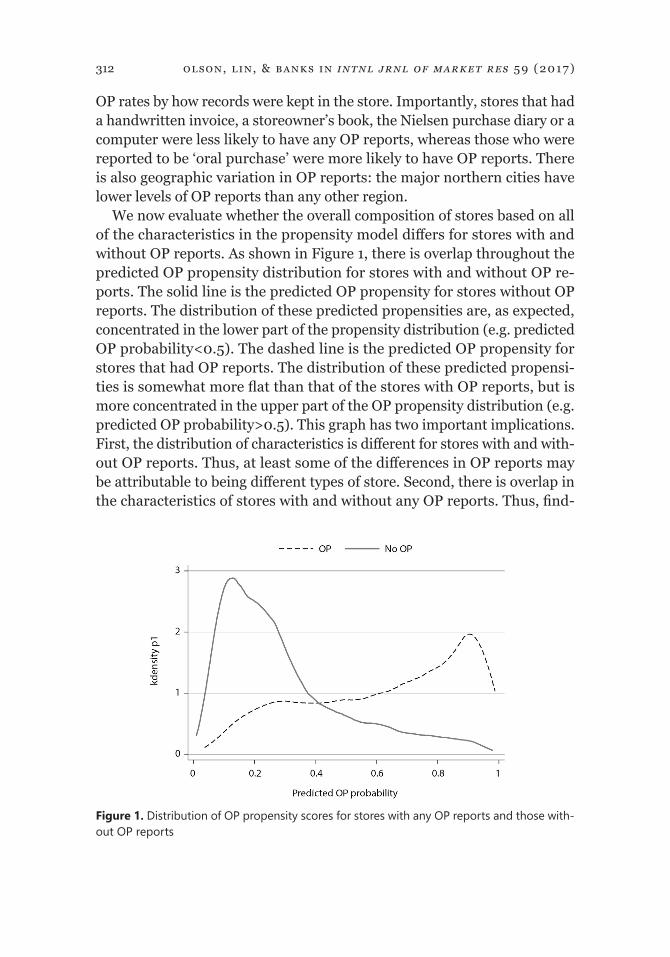
We now evaluate whether the overall composition of stores based on all of the characteristics in the propensity model differs for stores with and without OP reports. As shown in Figure 1, there is overlap throughout the predicted OP propensity distribution for stores with and without OP re-ports. The solid line is the predicted OP propensity for stores without OP reports. The distribution of these predicted propensities are, as expected, concentrated in the lower part of the propensity distribution (e.g. predicted OP probability<0.5). The dashed line is the predicted OP propensity for stores that had OP reports. The distribution of these predicted propensi-ties is somewhat more flat than that of the stores with OP reports, but is more concentrated in the upper part of the OP propensity distribution (e.g. predicted OP probability>0.5). This graph has two important implications. First, the distribution of characteristics is different for stores with and with-out OP reports. Thus, at least some of the differences in OP reports may be attributable to being different types of store. Second, there is overlap in the characteristics of stores with and without any OP reports. Thus, find-
Figure 1. Distribution of OP propensity scores for stores with any OP reports and those with-out OP reports
data quality in reports of sales in a retail survey 313
ing ‘matching’ stores for the propensity stratification and matching analy-ses is possible.
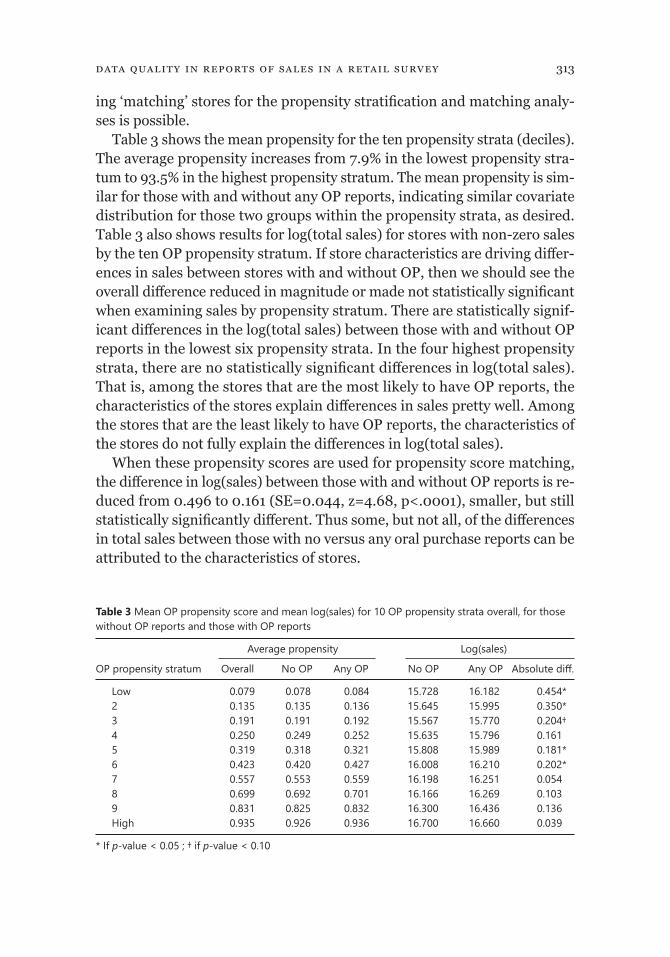
Table 3 shows the mean propensity for the ten propensity strata (deciles). The average propensity increases from 7.9% in the lowest propensity stra-tum to 93.5% in the highest propensity stratum. The mean propensity is sim-ilar for those with and without any OP reports, indicating similar covariate distribution for those two groups within the propensity strata, as desired. Table 3 also shows results for log(total sales) for stores with non-zero sales by the ten OP propensity stratum. If store characteristics are driving differ-ences in sales between stores with and without OP, then we should see the overall difference reduced in magnitude or made not statistically significant when examining sales by propensity stratum. There are statistically signif-icant differences in the log(total sales) between those with and without OP reports in the lowest six propensity strata. In the four highest propensity strata, there are no statistically significant differences in log(total sales). That is, among the stores that are the most likely to have OP reports, the characteristics of the stores explain differences in sales pretty well. Among the stores that are the least likely to have OP reports, the characteristics of the stores do not fully explain the differences in log(total sales).
When these propensity scores are used for propensity score matching, the difference in log(sales) between those with and without OP reports is re-duced from 0.496 to 0.161 (SE=0.044, z=4.68, p<.0001), smaller, but still statistically significantly different. Thus some, but not all, of the differences in total sales between those with no versus any oral purchase reports can be attributed to the characteristics of stores.
Table 3 Mean OP propensity score and mean log(sales) for 10 OP propensity strata overall, for those without OP reports and those with OP reports
Average propensity Log(sales)
OPpropensitystratum Overall NoOP AnyOP NoOPAnyOPAbsolutediff.
Low 0.079 0.078 0.084 15.728 16.182 0.454*2 0.135 0.135 0.136 15.645 15.995 0.350*3 0.191 0.191 0.192 15.567 15.770 0.204†4 0.250 0.249 0.252 15.635 15.796 0.1615 0.319 0.318 0.321 15.808 15.989 0.181*6 0.423 0.420 0.427 16.008 16.210 0.202*7 0.557 0.553 0.559 16.198 16.251 0.0548 0.699 0.692 0.701 16.166 16.269 0.1039 0.831 0.825 0.832 16.300 16.436 0.136High 0.935 0.926 0.936 16.700 16.660 0.039
* If p-value < 0.05 ; † if p-value < 0.10
314 olson, l in, & banks in intnl jrnl of market res 59 (2017)
Are these differences concentrated in particular categories of sales or products?
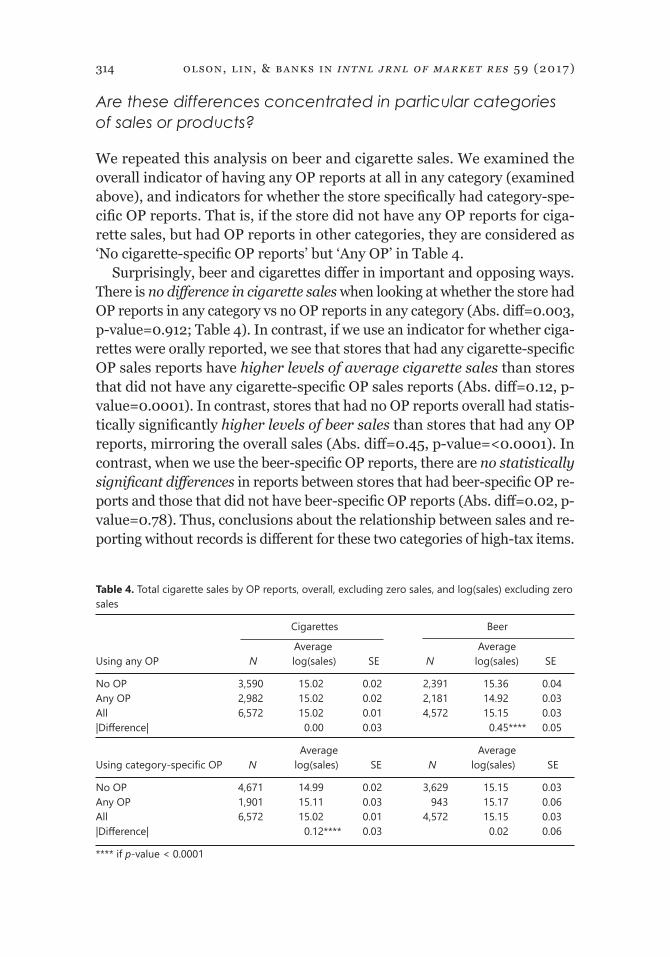
We repeated this analysis on beer and cigarette sales. We examined the overall indicator of having any OP reports at all in any category (examined above), and indicators for whether the store specifically had category-spe-cific OP reports. That is, if the store did not have any OP reports for ciga-rette sales, but had OP reports in other categories, they are considered as ‘No cigarette-specific OP reports’ but ‘Any OP’ in Table 4.
Surprisingly, beer and cigarettes differ in important and opposing ways. There is no difference in cigarette sales when looking at whether the store had OP reports in any category vs no OP reports in any category (Abs. diff=0.003, p-value=0.912; Table 4). In contrast, if we use an indicator for whether ciga-rettes were orally reported, we see that stores that had any cigarette-specific OP sales reports have higher levels of average cigarette sales than stores that did not have any cigarette-specific OP sales reports (Abs. diff=0.12, p-value=0.0001). In contrast, stores that had no OP reports overall had statis-tically significantly higher levels of beer sales than stores that had any OP reports, mirroring the overall sales (Abs. diff=0.45, p-value=<0.0001). In contrast, when we use the beer-specific OP reports, there are no statistically significant differences in reports between stores that had beer-specific OP re-ports and those that did not have beer-specific OP reports (Abs. diff=0.02, p-value=0.78). Thus, conclusions about the relationship between sales and re-porting without records is different for these two categories of high-tax items.
Table 4. Total cigarette sales by OP reports, overall, excluding zero sales, and log(sales) excluding zero sales
Cigarettes Beer
Average AverageUsing any OP N log(sales) SE N log(sales) SE
No OP 3,590 15.02 0.02 2,391 15.36 0.04Any OP 2,982 15.02 0.02 2,181 14.92 0.03All 6,572 15.02 0.01 4,572 15.15 0.03|Difference| 0.00 0.03 0.45**** 0.05
Average AverageUsingcategory-specificOPN log(sales) SE N log(sales) SE
No OP 4,671 14.99 0.02 3,629 15.15 0.03Any OP 1,901 15.11 0.03 943 15.17 0.06All 6,572 15.02 0.01 4,572 15.15 0.03|Difference| 0.12**** 0.03 0.02 0.06
**** if p-value < 0.0001
data quality in reports of sales in a retail survey 315
We cannot conclude from this analysis that high-tax products are systemat-ically under- or over-reported by the storekeepers.
When we create propensity-matched stores and look at cigarette sales, the unadjusted difference in log(sales) between those that reported cigarettes using category-specific oral reports and those with records was 0.120, but is reduced to 0.092 (SE=0.049, z=1.88, p<.06) when taking the characteristics of stores into account. For beer, the unadjusted difference in log(sales) was 0.018 using beer-specific OP reports, and increased to 0.145 (SE=0.095, z= –1.52, p=0.129) when stores were matched. In contrast, using the propensity matches based on the ‘any OP reports’ model, the unadjusted significant dif-ference of 0.446 decreased to –0.075 (SE=0.102, z= –0.74, p=0.462), and not significantly different. Thus, unlike overall sales, differences in oral re-ports about cigarettes and beer sales can largely be explained by store char-acteristics. Thus, differences in the quality of cigarette and beer sales be-tween reported and record-based sales may be due to characteristics of the stores and not differences in the measurement process.
Conclusions and implications
Little research has examined the quality of reports of sales from store owners in non-western countries. This paper examined the lack of use of records in reports of sales from about 12,000 store owners in a Southeast Asian coun-try. We found that reported sales that came from the storekeeper’s mem-ory were in fact lower than those from records, as expected. We also found, more surprisingly, that these oral reports acted as a supplement to record-based reports at the same store, such that stores that had oral purchase re-ports had higher total sales than those without oral purchase reports. This was surprising because stores were expected to either have a reliable re-cord system or not have a reliable record system; instead, many stores used both. This means that the initial hypothesis that oral purchase stores pro-vide lower, and thus incomplete reporting, was wrong. It is also suggests that replacing OP panel stores with non-OP stores would yield biased esti-mates. That is, the potential increase in measurement error in the oral pur-chase reports is overcome by the reduced selection bias in keeping these stores as part of the survey estimates.
For the second research question, the types of retail establishments, their size, and whether or not they engaged in wholesaling activities were pre-dictors of presence of oral purchase reports, along with geographic differ-ences within this country. Importantly, stores that had the Nielsen pur-chase diary were less likely to have OP reports overall and lower levels of
316 olson, l in, & banks in intnl jrnl of market res 59 (2017)
sales reported via OP when they did have OP reports. Therefore, Nielsen’s global standard operating procedure now encourages use of the purchase diary because it reduces recall burden. For other data collection organiza-tions, especially those working in non-western contexts, this research sug-gests that developing a recall tool such as a diary for companies with in-consistent records will lead to better-quality data than simply relying on the memory of the storekeeper.
Differences in the levels of overall sales could not be fully accounted for by the characteristics of stores, but differences in two high-tax products for OP versus non-OP reports were largely accounted for by the types of stores with these reports. However, there were different predictors and patterns in the direction of differences between reports and records for these two cat-egories of sales. It is possible that further evaluations of differences in re-ports for other individual categories of products would also be accounted for by the store characteristics, although from this analysis it is not possi-ble to anticipate whether the reports or the records would yield higher re-ports. Importantly, we cannot say that sales of individual categories of prod-ucts are systematically under- or over-reported by stores that do not have a complete record base. Future research that had records and recalled infor-mation on the same categories of products for the same stores would pro-vide additional insights into this question.
For survey practitioners more generally, a single statistical adjustment method that would align the record-based and reported sales values for both total and category-based sales is not feasible. Even though the raw level of OP-reported sales is lower than invoice-reported sales, there are inconsistent results when looking at individual categories. Thus, record-based reports are not necessarily ‘better’ than those that are not based on records, and as such we cannot identify an appropriate source as a benchmark value for adjustment. Future research using statistical tools such as propensity score methods to evaluate and reduce discrepancies between estimates based on records and reported values should anticipate that a ‘one size fits all’ ap-proach is unlikely to be effective.
The paper suggests that future research should explore avenues to im-prove data collection methods for stores from non-western countries. It is clear from this analysis that storekeepers’ use of reported values for sales are not a substitution for invoice data, but instead supplement the data from records. Future research will examine methods to improve real-time cap-ture of otherwise orally reported data, such as through the use of diaries, electronic self-administered instruments on tablet computers, or voice re-corders. These findings are likely to extend to other measurements where
data quality in reports of sales in a retail survey 317
complete records might not be captured or referenced during data collec-tion and are instead supplemented with recall. For example, this could be the case in other establishment surveys in which detailed records on other business expenses may not be maintained and thus have to be estimated. Of course, careful validation of the recalled information will be important to establish credibility and reliability of the recall data. The study’s ‘big sur-prise’ was that recalled data are not necessarily a bad thing. We had antic-ipated the recalled data to be of lower quality compared to computer and paper records. Instead, we found that recalled data are supplemental to non-recalled data and therefore should not be ignored.
Acknowledgments — The authors thank the anonymous peer reviewers for In-ternational Journal of Market Research for their helpful comments.
References
Ailawadi, K.L. & Keller, K.L. (2004) Understanding retail branding: Conceptual insights and research priorities. Journal of Retailing, 80, 4, pp. 331–342.
Bavdaz, M. (2006) The response process in recurring business surveys. Paper presented at the European Conference on Quality in Survey Statistics, Cardiff, UK.
Bavdaz, M. (2010) Sources of measurement errors in business surveys. Journal of Of-ficial Statistics, 26, 1, pp. 25–42.
Bergmann, M.M., Byers, T., Freedman, D.S. & Mokdad, A. (1998) Validity of self-re-ported diagnoses leading to hospitalization: A comparison of self-reports with hos-pital records in a prospective study of American adults. American Journal of Epide-miology, 147, 10, pp. 969–977.
Cavusgil, S.T. & Das, A. (1997) Methodological issues in empirical cross-cultural re-search: a survey of the management literature and a framework. MIR: Management International Review, 37, 1, pp. 71–96.
Dhar, S.K., Hoch, S.J. & Kumar, N. (2001) Effective category management depends on the role of the category. Journal of Retailing, 77, 2, pp. 165–184.
Goldenberg, K.L. (1994) Answering questions, questioning answers: evaluating data quality in an establishment survey. Proceedings of the Survey Research Methods Section, American Statistical Association, pp. 1357–1362. Available online at: www.bls.gov/osmr/abstract/st/st940230.htm (accessed 31 March 2017).
Groen, J.A. (2012) Sources of error in survey and administrative data: the importance of reporting procedures. Journal of Official Statistics, 28, 2, pp. 173–198.
Haraldsen, G. (2013) Questionnaire communication in business surveys, in Snijkers, G., Haraldsen, G., Jones, J. & Willimack, D.K. (eds) Designing and Conducting Business
Surveys. Hoboken, NJ: John Wiley & Sons, Inc., pp. 303–357.
318 olson, l in, & banks in intnl jrnl of market res 59 (2017)
Haraldsen, G., Jones, J., Giesen, D. & Zhang, L.-C. (2013) Understanding and coping with response burden, in Snijkers, G., Haraldsen, G., Jones, J. & Willimack, D.K. (eds) Designing and Conducting Business Surveys. Hoboken, NJ: John Wiley & Sons, Inc., pp. 219–252.
Lorenc, B. (2007) Using the theory of socially distributed cognition to analyse the es-tablishment survey response process. Paper presented at the Third International Conference on Establishment Surveys, Montreal, Quebec. Available online at: www.amstat.org/meetings/ices/2007/presentations/Session49/Lorenc.pdf (accessed 4 April 2016).
Lugtig, P., Lensvelt-Mulders, G.J.L.M., Frerichs, R. & Greven, A. (2011) Estimating non-response bias and mode effects in a mixed-mode survey. International Journal of Market Research, 53, 5, pp. 669–686.
Malhotra, N.K., Agarwal, J. & Peterson, M. (1996) Methodological issues in cross-cul-tural marketing research: a state-of-the-art review. International Marketing Re-view, 13, 5, pp. 7–43.
McKenzie, D. & Woodruff, C.M. (2013) What are we learning from business training and entrepreneurship evaluations around the developing world? CAGE Online Work-ing Paper Series. Department of Economics, University of Warwick. Coventry, UK. Available online at: http://wrap.warwick.ac.uk/57940/1/WRAP_116.2013_mcken-zie_and_woodruff.pdf (accessed 6 July 2016).
Mead, D.C. & Liedholm, C. (1998) The dynamics of micro and small enterprises in de-veloping countries. World Development, 26, 1, pp. 61–74.
National Research Council (2013) Measuring what we spend: Toward a new consumer expenditure survey, in Dillman, D.A. & House, C.C. (eds) Panel on Redesigning the BLS Consumer Expenditure Surveys. Washington, DC: The National Academies Press.
Nichter, S. & Goldmark, L. (2009) Small firm growth in developing countries. World Development, 37, 9, pp. 1453–1464.
Olson, K. (2006) Survey participation, nonresponse bias, measurement error bias, and total bias. Public Opinion Quarterly, 70, pp. 737–758.
Rodgers, W.L., Brown, C. & Duncan, G.J. (1993) Errors in survey reports of earnings, hours worked, and hourly wages. Journal of the American Statistical Association, 88, 424, pp. 1208–1218.
Rosenbaum, P.R. & Rubin, D.B. (1984) Reducing bias in observational studies using subclassification on the propensity score. Journal of the American Statistical Asso-ciation, 79, 387, pp. 516–524.
Rosenbaum, P.R. & Rubin, D.B. (1985) Constructing a control group using multivari-ate matched sampling methods that incorporate the propensity score. The Ameri-can Statistician, 39, 1, pp. 33–38.
Snijkers, G., Haraldsen, G., Jones, J. & Willimack, D.K. (2013) Designing and Conduct-ing Business Surveys. Hoboken, NJ: Wiley.
Tomaskovic-Devey, D., Leiter, J. & Thompson, S. (1995) Item nonresponse in organi-zational surveys. Sociological Methodology, 25, pp. 77–110.

data quality in reports of sales in a retail survey 319
Willimack, D.K. (2013) Methods for the development, testing, and evaluation of data collection instruments, in Snijkers, G., Haraldsen, G., Jones, J. & Willimack, D.K. (eds) Designing and Conducting Business Surveys. Hoboken, NJ: John Wiley & Sons, Inc., pp. 253–302.
Willimack, D.K. & Snijkers, G. (2013) The business context and its implications for the survey response process, in Snijkers, G., Haraldsen, G., Jones, J. & Willimack, D.K. (eds) Designing and Conducting Business Surveys. Hoboken, NJ: John Wiley & Sons, Inc., pp. 39–82.
Yang, Z., Wang, X. & Su, C. (2006) A review of research methodologies in international business. International Business Review, 15, 6, pp. 601–617.
About the authors
Kristen Olson is an Associate Professor in the Department of Sociology at the Univer-sity of Nebraska-Lincoln. Her research focuses on nonresponse and measurement er-rors in both interviewer-administered and self-administered surveys, paradata, and within-household selection in self-administered surveys. Her current research is on interviewer effects and questionnaire design in telephone surveys and questionnaire design issues in self-administered mail, web, and mobile surveys. She has a MS in Survey Methodology from the University of Maryland and a Ph.D. in Survey Meth-odology from the University of Michigan.
Xiaoyu Lin is a Data Scientist at Data Science department, Nielsen, Shanghai, China, where she works on statistical analysis and innovation projects around retail mar-keting research. She earned her BA and MS in Statistics from National University of Singapore. Prior to Nielsen, she was a Bio-Statistician, and co-authored a few publi-cations on Epidemiology and Public Health journals.
Timothy Banks is a Director in the Data Science group of Nielsen, and is based in Sin-gapore. He holds post-graduate degrees in Physics from Victoria University of Wel-lington (New Zealand). He has worked in applied analytics for 20 years, addressing questions from how to use analytics to improve staff retention to how to use hand-phones to measure exposure to outdoor advertising.
Corresponding author — Kristen Olson Department of Sociology University of Nebraska–Lincoln 703 Oldfather Hall Lincoln, NE 68588-0324
email [email protected]


![[1]Oracle® Retail Xstore Point of Service Reports Guide ... · [1]Oracle® Retail Xstore Point of Service Reports Guide Release 18.0 F10772-01 December 2018](https://img.pdfslide.us/doc/110x75/602ba6ac44c0cc415a402713/1oracle-retail-xstore-point-of-service-reports-guide-1oracle-retail.jpg)