Embed Size (px)
Citation preview

2005 EUVL Symposium1
EUV Endurance Testing of Ruthenium-Capped Multilayer Mirrors
S. B. Hill, C. Tarrio and T. B. LucatortoNIST
T. E. MadeyRutgers, the State University of New Jersey
S. Bajt†
Lawrence Livermore National Laboratory
O. Wood II, S. Wurm and N. V. EdwardsSEMATECH
† This work was performed under the auspices of the U.S. Department of Energy by University of California Lawrence Livermore National Laboratory under contract No. W-7405-Eng-48
Support for this work provided in part by SEMATECH LITH160
2005 EUVL Symposium2
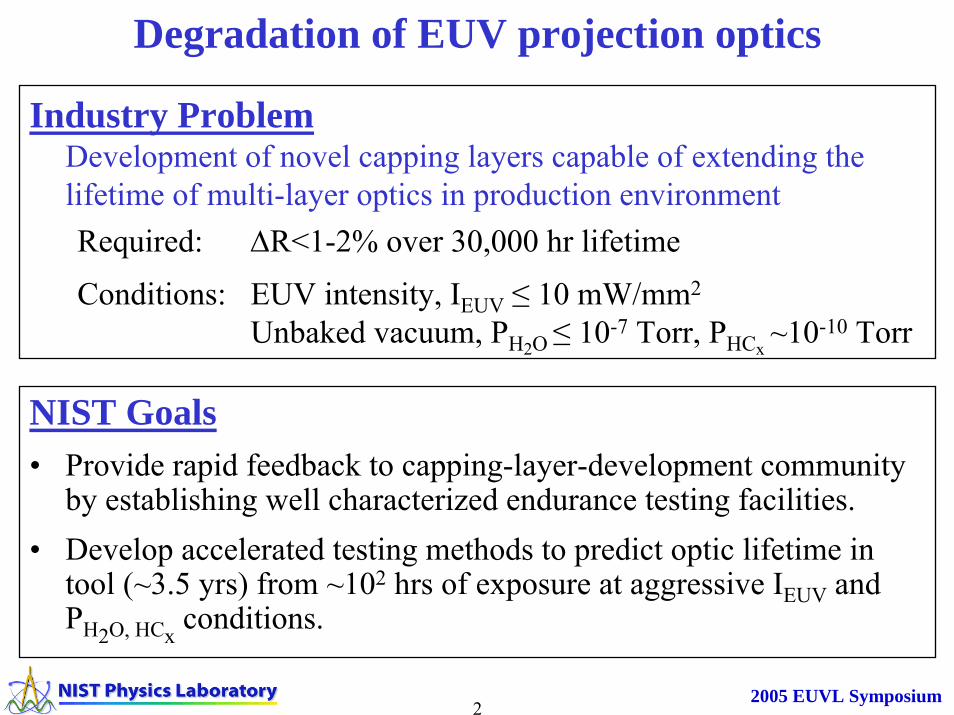
Degradation of EUV projection optics
Industry ProblemDevelopment of novel capping layers capable of extending the lifetime of multi-layer optics in production environmentRequired: ΔR<1-2% over 30,000 hr lifetime
Conditions: EUV intensity, IEUV ≤ 10 mW/mm2
Unbaked vacuum, PH2O ≤ 10-7 Torr, PHCx~10-10 Torr
NIST Goals• Provide rapid feedback to capping-layer-development community
by establishing well characterized endurance testing facilities.• Develop accelerated testing methods to predict optic lifetime in
tool (~3.5 yrs) from ~102 hrs of exposure at aggressive IEUV and PH2O, HCx
conditions.
2005 EUVL Symposium3
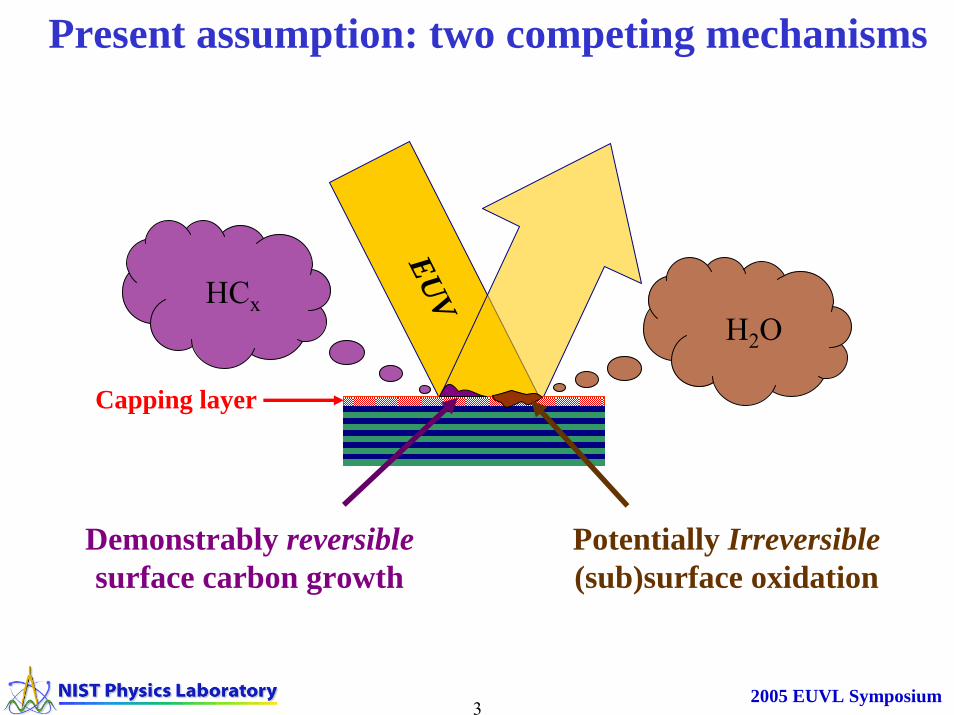
EUV HCxH2O
Demonstrably reversiblesurface carbon growth
Potentially Irreversible(sub)surface oxidation
Capping layer
Present assumption: two competing mechanisms

2005 EUVL Symposium4
Existing EUV endurance testing facility at NIST
• Spot size ~ 650 μm × 650 μm (FWHM) at sample• Average, in-band (13.1-13.6nm) intensity ~5 mW/mm2
• Be window permits high water vapor pressures: PH2O ≤10-5 Torr• Automation upgrades increased exposure duty cycle: ~15 hrs/day
Input beam from SURF III
Mo/Si ML FocusingMirror
H2O atmosphere
Be windowMo/Si ML sample
Detector

2005 EUVL Symposium5
EUVSample
13.5nm reflectivity map (ALS)
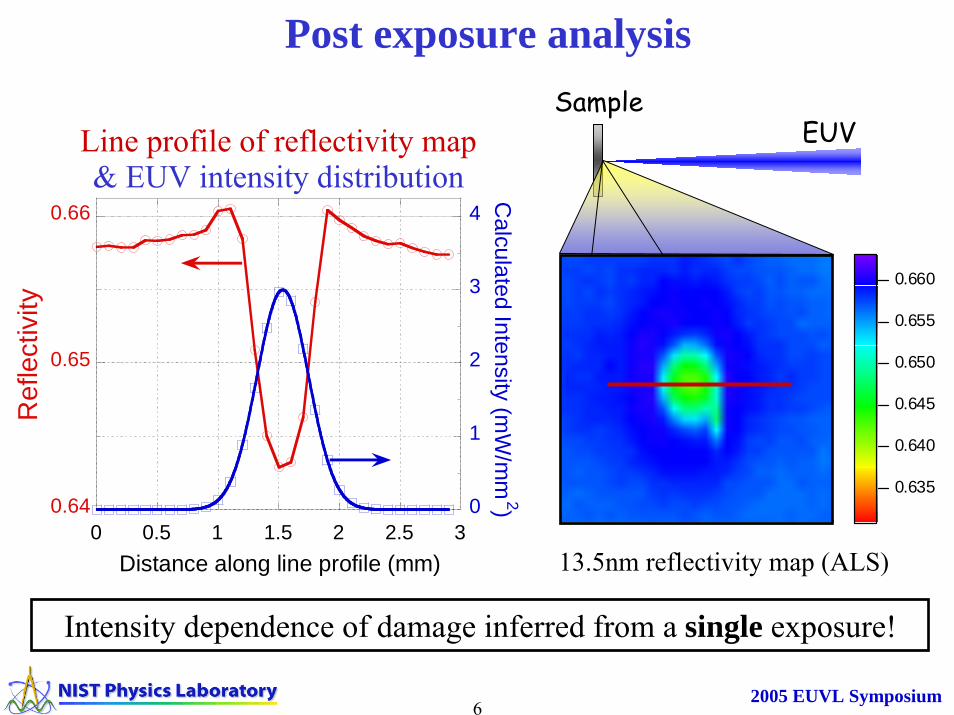
Post exposure analysis
0.660
0.655
0.650
0.645
0.640
0.635
Line profile of reflectivity map
0.64
0.65
0.66
0 0.5 1 1.5 2 2.5 3
Ref
lect
ivity
Distance along line profile (mm)
2005 EUVL Symposium6
EUVSample
0.64
0.65
0.66
0
1
2
3
4
0 0.5 1 1.5 2 2.5 3
Ref
lect
ivity
Calculated Intensity (m
W/m
m2)
Distance along line profile (mm)
Line profile of reflectivity map
13.5nm reflectivity map (ALS)
Post exposure analysis
0.660
0.655
0.650
0.645
0.640
0.635
& EUV intensity distribution
Intensity dependence of damage inferred from a single exposure!
2005 EUVL Symposium7
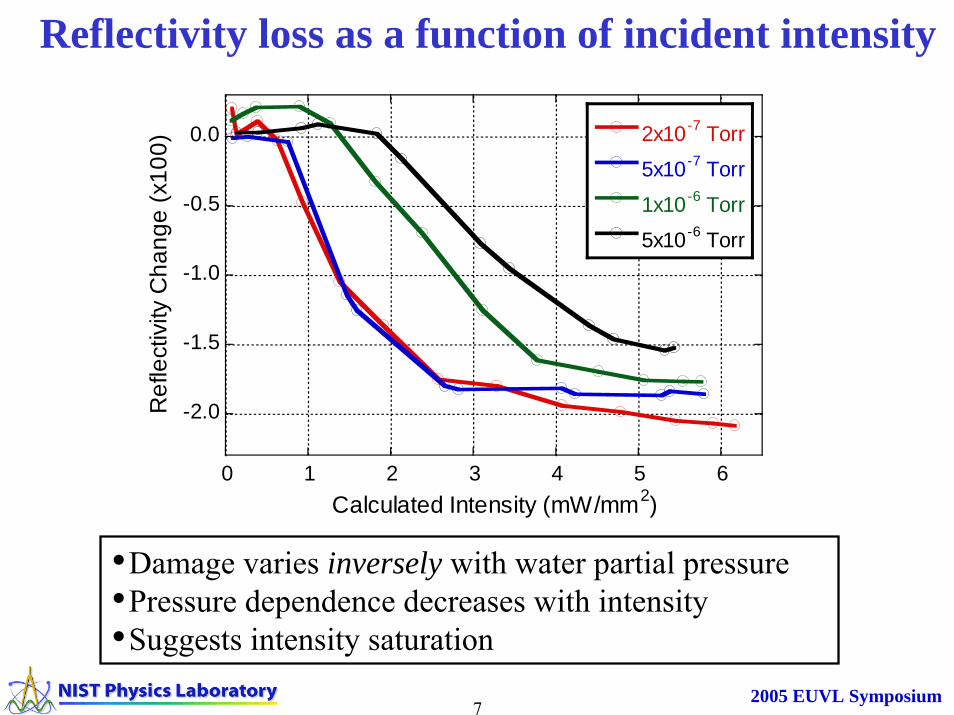
•Damage varies inversely with water partial pressure•Pressure dependence decreases with intensity•Suggests intensity saturation
-2.0
-1.5
-1.0
-0.5
0.0
0 1 2 3 4 5 6
2x10⁻⁷ Torr
5x10⁻⁷ Torr
1x10⁻⁶ Torr
5x10⁻⁶ Torr
Ref
lect
ivity
Cha
nge
(x10
0)
Calculated Intensity (mW/mm2)
Reflectivity loss as a function of incident intensity

2005 EUVL Symposium8
2x10⁻⁶ Torr H2O4.6±1.5 mW/mm2
10 hrs (2C-S3)
0.67
0.66
0.65
0.64
151050
0.67
0.66
0.65
0.64
151050
5x10⁻⁶ Torr H2O5.5±1.8 mW/mm2
10 hrs (2C-S4)
0.67
0.66
0.65
0.64
151050
5x10⁻⁷ Torr H2O5.8±2.1 mW/mm2
10 hrs (2C-S5)
1x10⁻⁶ Torr H2O5.8±1.9 mW/mm2
10 hrs (1A-S1)
0.66
0.65
0.64
0.633020100
2x10⁻⁷ Torr H2O6.2±1.9 mW/mm2
10 hrs (1A-S5)
0.66
0.65
0.64
0.6320100
10hr Exposures at Maximum Intensity (~6 mW/mm2)
Reflectivity loss decreases with increasing water pressure
Increasing water vapor pressure
Unexpected damage dependence on H2O pressure

2005 EUVL Symposium9
1x10⁻⁶ Torr H2O3.0±0.9 mW/mm2
10 hrs (1A-S2)
0.66
0.65
0.64
0.6320100
5x10⁻⁶ Torr H2O2.8±0.9 mW/mm2
10 hrs (1A-S3)
0.66
0.65
0.64
0.63151050
5x10⁻⁷ Torr H2O3.0±0.9 mW/mm2
10 hrs (1A-S4)
0.66
0.65
0.64
0.63151050
2x10⁻⁶ Torr H2O2.9±1.0 mW/mm2
10 hrs (2C-S2)
0.67
0.66
0.65
0.64
151050
Unexpected damage dependence on H2O pressure
10hr Exposures at Half Max Intensity (~3 mW/mm2)
Reflectivity loss decreases with increasing water pressure
Increasing water vapor pressure

2005 EUVL Symposium10
-2.0
-1.5
-1.0
-0.5
0.0
0.5
0 1 10-8 2 10-8 3 10-8 4 10-8 5 10-8
1e-6 Torr H2O
Peak
Ref
lect
ivity
Cha
nge
(x10
0)
Methanol Partial Pressure (Torr)
Methanol significantly reduces damage
•Just 2x10⁻⁸ Torr methanol prevents measurable damage from water
10hr, ~6mW/mm2

2005 EUVL Symposium11
-2.0
-1.5
-1.0
-0.5
0.0
0.5
0 1 10-8 2 10-8 3 10-8 4 10-8 5 10-8
1e-6 Torr H2O
5e-7 Torr H2O
Peak
Ref
lect
ivity
Cha
nge
(x10
0)
Methanol Partial Pressure (Torr)
•Just 2x10⁻⁸ Torr methanol prevents measurable damage from water
Methanol significantly reduces damage
10hr, ~6mW/mm2

2005 EUVL Symposium12
-2.0
-1.5
-1.0
-0.5
0.0
0.5
0 1 10-8 2 10-8 3 10-8 4 10-8 5 10-8
1e-6 Torr H2O5e-7 Torr H2ONo Added H2O
Peak
Ref
lect
ivity
Cha
nge
(x10
0)
Methanol Partial Pressure (Torr)
•Just 2x10⁻⁸ Torr methanol prevents measurable damage from water•Very little damage from low levels of methanol alone•Trace levels of carbon-containing compounds in ambient
background may similarly mitigate damage by water
Methanol significantly reduces damage
10hr, ~6mW/mm2

2005 EUVL Symposium13
10-13
10-12
10-11
10-10
10-9
10-8
10-7
Par
tial P
ress
ure
(Tor
r)
605040302010Mass (amu)
Base, 7e-10 Torr
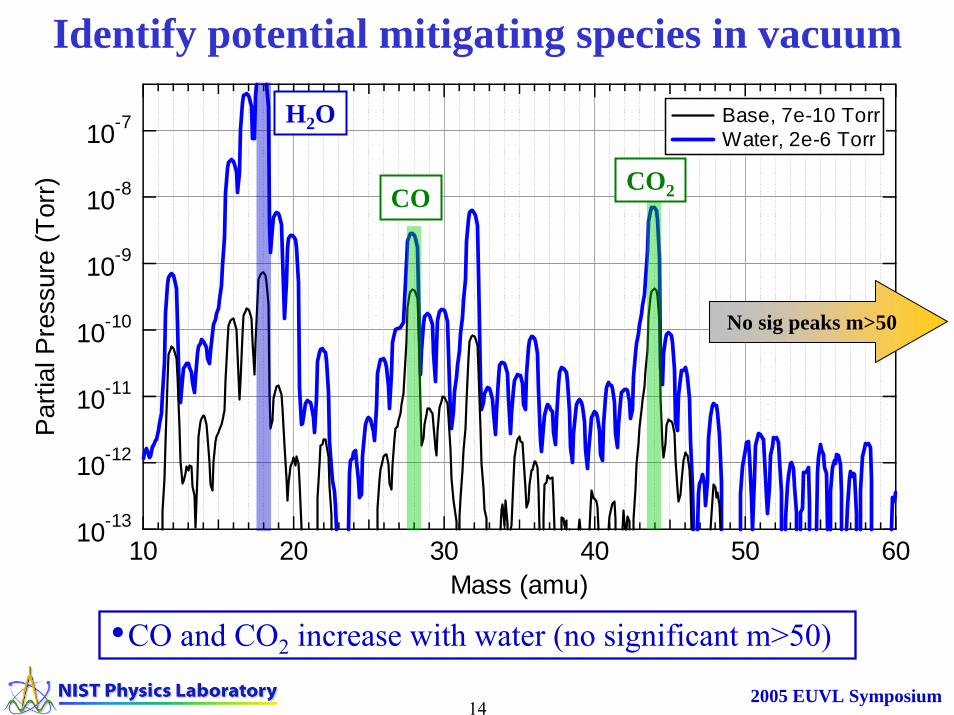
Identify potential mitigating species in vacuum
•No long-chain (m>50) hydrocarbons present
H2OCO CO2
No peaks m>50
2005 EUVL Symposium14
10-13
10-12
10-11
10-10
10-9
10-8
10-7
Par
tial P
ress
ure
(Tor
r)
605040302010Mass (amu)
Base, 7e-10 Torr Water, 2e-6 Torr
H2O
CO CO2
•CO and CO2 increase with water (no significant m>50)
Identify potential mitigating species in vacuum
No sig peaks m>50

2005 EUVL Symposium15
10-13
10-12
10-11
10-10
10-9
10-8
10-7
Par
tial P
ress
ure
(Tor
r)
605040302010Mass (amu)
Base, 7e-10 Torr Water, 2e-6 Torr Methanol, 1e-8 Torr
Identify potential mitigating species in vacuum
•CO and CO2 contribution from water similar to methanol
H2O
CO CO2
No sig peaks m>50

2005 EUVL Symposium16
2.0
1.5
1.0
0.5
0.0(CO
+CO
2):H
2O P
P R
atio
x10
-2
2.52.01.51.00.50.0Inverse Pumping Speed x10-2 (s/L)
Ancillary tests to find source of CO & CO2
Is water contaminated?
WWCC PLPS βα +=
WWW LPS =
Mass throughput equations
⎟⎟⎠
⎞⎜⎜⎝
⎛+∝
WW
C
SPP βα
•CO & CO2 NOT from contaminated water supply•Produced by water interaction with chamber
C-species displaced from unbaked chamber walls by waterReaction of water with C in hot tungsten/iridium filaments
2005 EUVL Symposium17
10-13
10-12
10-11
10-10
10-9
10-8
Par
tial P
ress
ure
(Tor
r)
605040302010Mass (amu)
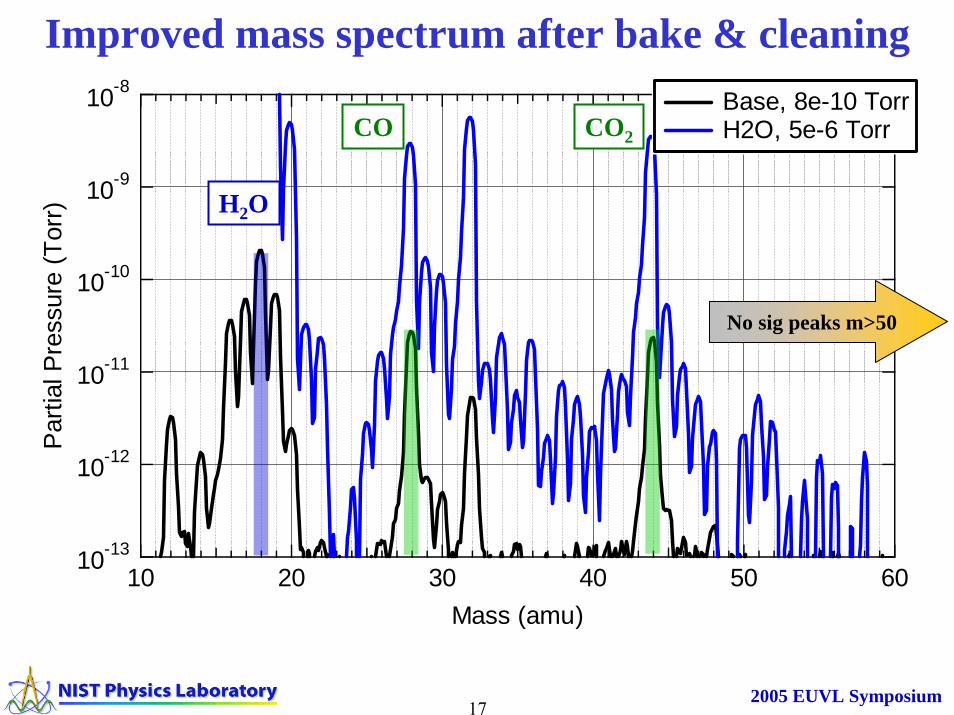
Base, 8e-10 Torr H2O, 5e-6 Torr
Improved mass spectrum after bake & cleaning
No sig peaks m>50
H2O
CO CO2

2005 EUVL Symposium18
• C-species generated at rate proportional to water partial pressure
• Chamber contains two filaments: IG, RGA
• Is rate of C-species production different with only RGA on?
Ancillary tests to find source(s) of CO & CO2
1.2
0.8
0.4
0.0
(CO
+CO
2) P
artia
l Pre
ssur
e x1
0-9 T
orr
43210Water Partial Pressure x10-7 Torr
Ion Gauge ONs=(2.8 ± 0.1)x10-3

2005 EUVL Symposium19
• C-species generated at rate proportional to water partial pressure
• Chamber contains two filaments: IG, RGA
• Is rate of C-species production different with only RGA on?
Ancillary tests to find source(s) of CO & CO2
• CO & CO2 3x smaller with IG off
• Likely reduced further if RGA also off
YES!
1.2
0.8
0.4
0.0
(CO
+CO
2) P
artia
l Pre
ssur
e x1
0-9 T
orr
43210Water Partial Pressure x10-7 Torr
Ion Gauge ONs=(2.8 ± 0.1)x10-3
Ion Gauge OFFs=(1.01 ± 0.02)x10-3
How will this affect EUV damage to ML optics?

2005 EUVL Symposium20
Input beam from SURF III
Mo/Si ML FocusingMirror
H2O atmosphere
Be windowMo/Si ML sample
Detector
Use in situ reflectivity monitor for initial tests
•Only need relative measurement of real-time decay

2005 EUVL Symposium21
Input beam from SURF III
Mo/Si ML FocusingMirror
H2O atmosphere
Be windowMo/Si ML sample
Detector
Use in situ reflectivity monitor for initial tests
•Only need relative measurement of real-time decay

2005 EUVL Symposium22
Input beam from SURF III
Mo/Si ML FocusingMirror
H2O atmosphere
Be windowMo/Si ML sample
Detector
EUV beam
ML sample
Photodiode
Use in situ reflectivity monitor for initial tests
•Only need relative measurement of real-time decay•Suitable for monitoring initial decay and changes >0.5% (abs)•Not reliable for absolute measurements over long exposures due to
highly non-uniform spatial distribution of damage.

2005 EUVL Symposium23
in situ measurement of reflectivity decay
-2
-1
0
% c
hang
e of
in s
itu re
flect
ivity
00:00 01:00 02:00 03:00 04:00 05:00Elapsed Exposure Time (hr:min)
5e-6 Torr H2O

2005 EUVL Symposium24
in situ measurement of reflectivity decay
-2
-1
0
% c
hang
e of
in s
itu re
flect
ivity
00:00 01:00 02:00 03:00 04:00 05:00Elapsed Exposure Time (hr:min)
5e-6 Torr H2O 1e-6 Torr H2O
•Observe increased damage at lower H2O pressures

2005 EUVL Symposium25
in situ measurement of reflectivity decay
-2
-1
0
% c
hang
e of
in s
itu re
flect
ivity
00:00 01:00 02:00 03:00 04:00 05:00Elapsed Exposure Time (hr:min)
5e-6 Torr H2O 1e-6 Torr H2O
•Observe increased damage at lower H2O pressures•Initial decay empirically described by exponential

2005 EUVL Symposium26
Effect of filaments on reflectivity decay0.448
0.444
0.440
0.436
In S
itu R
efle
ctiv
ity
04:00 05:00 06:00 07:00 08:00 09:00 10:00Elapsed Exposure Time (hr:min)
Filaments ON
5 x 6-10

2005 EUVL Symposium27
Effect of filaments on reflectivity decay0.448
0.444
0.440
0.436
In S
itu R
efle
ctiv
ity
04:00 05:00 06:00 07:00 08:00 09:00 10:00Elapsed Exposure Time (hr:min)
Filaments ON

2005 EUVL Symposium28
Effect of filaments on reflectivity decay
•Damage is measurably accelerated when filaments are switched off•Hot filaments play critical role in damage processes•Production of mitigating species: CO, CO2 and/or perhaps H
0.448
0.444
0.440
0.436
In S
itu R
efle
ctiv
ity
04:00 05:00 06:00 07:00 08:00 09:00 10:00Elapsed Exposure Time (hr:min)
Filaments OFF
Filaments ON

2005 EUVL Symposium29
Effect of filaments at different pressures
-3
-2
-1
0%
cha
nge
of in
situ
refle
ctiv
ity
00:00 01:00 02:00 03:00 04:00 05:00Elapsed Exposure Time (hr:min)
Filaments ON 5e-6 Torr H2O 1e-6 Torr H2O

2005 EUVL Symposium30
-3
-2
-1
0%
cha
nge
of in
situ
refle
ctiv
ity
00:00 01:00 02:00 03:00 04:00 05:00Elapsed Exposure Time (hr:min)
Filaments OFF 5e-6 Torr H2O 1e-6 Torr H2O
Filaments ON 5e-6 Torr H2O 1e-6 Torr H2O
•Damage still greater for lower H2O partial pressure, though less pronounced without filaments
•Suggests trace levels of mitigating species still present and active
Effect of filaments at different pressures

2005 EUVL Symposium31
• Mitigating C-species may result from water-induced desorption/displacement of C-compounds on chamber walls. Common concern in surface science
Designing new, UHV bakable chamberUse doser to reduce ambient pressure
Preliminary indications and next steps• In situ reflectivity can monitor initial evolution of damage
Verify with accurate reflectometry (next weeks)
• Observed mitigation attributed to low-mass species like CO, CO2. NOT due to m>45 amu hydrocarbons (e.g., m=55)
Direct admission of CO and/or CO2
• CO, CO2 & possibly H produced by H2O reacting with hot filaments significantly slows damage of Ru-cap MLs
Reflectometry of long exposure with and without filaments
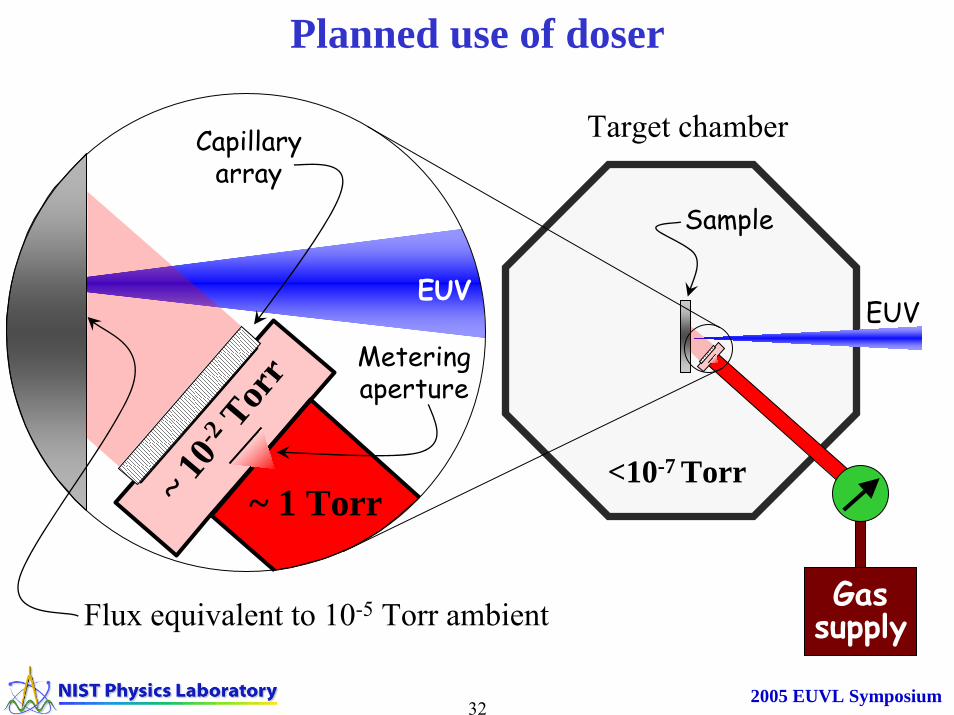
2005 EUVL Symposium32
Gassupply
Target chamber
EUV
Sample
<10-7 Torr
Flux equivalent to 10-5 Torr ambient
~ 1 Torr~ 10-
2 Torr Metering
aperture
Capillaryarray
EUV
Planned use of doser

2005 EUVL Symposium33
New UHV exposure facility under construction
• Load lock: cleanliness and increased throughput• Bake to 150-200 C• Gold plate majority of chamber surface area• Can accommodate two independent dosers• Potential to heat and cool samples during exposure (~ 0-50 C)

2005 EUVL Symposium34
• Continue to identify critical factors to establish well characterized exposure environment for benchmarking and capping layer development
• Investigate differences between pulsed and quasi-cwsynchrotron exposures
• Commission third high intensity exposure facility~150 mW/mm2 broadbandAlso UHV designInvestigate intensity dependence for accelerated testing
• Collaborate to identify useful surface analysis techniques:e.g., IR, elastic ion backscatter, XPS, TOF-SIMS,…
Future directions
![Ultra-High-Power Resistors Series UXP -2000€¦ · UXP-2000-8 Air and creeping distance depends on length of HV-cable 39 ±0.5 1.535] ±0.5 ±0.02 ±0.5 1.535 ±0.02 ±0.02 Please](https://img.pdfslide.us/doc/110x75/5fd7958025ef547a014228b5/ultra-high-power-resistors-series-uxp-2000-uxp-2000-8-air-and-creeping-distance.jpg)

![Invariant Shape Features and Relevance Feedback for Weld ... · Sym [0 1] < 0.5 > 0.5 > 0.5 < 0.5 Sig [0 1] < 0.5 < 0.5 → 1 > 0.5 2.2 Generic Fourier descriptor](https://img.pdfslide.us/doc/110x75/5fb60fbe46489e03c70e3474/invariant-shape-features-and-relevance-feedback-for-weld-sym-0-1-05.jpg)


![] 5Y7.O/1.5 [25-70C] a N 0.5 1 1.5 2 2.5 3 4 5 6 7 8 9 10 12 14 N 0.5 1 1.5 2 2.5 3 4 5 6 7 8 9 10 12 14 N 0.5 1 1.5 2 2.5 3 4 5 6 7 8 g 10 12 14 N 0.5 2.5 3 4 5 6 7 8 g 10 12 14 N](https://img.pdfslide.us/doc/110x75/5b3ecf5e7f8b9a5e2c8b5591/22-85d-5y7o15-25-70c-a-n-05-1-15-2-25-3-4-5-6-7-8-9-10-12-14-n-05-1-15.jpg)