Embed Size (px)
Citation preview

Theme 4 D Them'e 4 Energy and industry D Energie et industrie
Series F D Serie F Rapid reports D Statistiques rapides
eurostat Energy , Energie
May/Mai 1986 LIBR y '
PETROLEUM
Statistical aspects of the petroleum economy in 1985
Consumption trends
The provisional figures for 1985 shows that the petroleum consumption of the Community of Twelve, measured by the deliveries of petroleum products to the inland market, fell to 428 million tonnes in 1985, i.e. 3,1 % less than in 1984. The fall is particularly noticeable in the United Kingdom C- 14 %) where there was a dramatic reduction in deliveries of residual fuel oil to power stations compared to the exceptional situation in 1984 (miners' strike).
An analysis of this drop in overall petroleum consumption shows for the principal products that
- the demand for motor fuels has remained at practically the same level as in 1984, although the trends vary from one country to another;
- deliveries of gas diesel oil, which include derv fuel and gasoi l intended principally for space heating, rose significantly by 4 %. This trend, which varied from 0,2 % in France to 16 % in Ireland is due mainly to the increased use of derv fuel, which was up 6 % ;
- kerosenes and jet fuels continued to move upwards C+ 5,3 %) due to increased activity in the air transport sector;
- heavy fuel oil once again suffered a large drop of 21 % compared with 1984, particularly in the United Kingdom <- 42 %) and in France C- 19 %) resulting from a diversification of supplies to power stations.
Thus the percentage of light petroleum products in Community refining has again risen, with motor fuels and gas diesel oil reaching 59 % of total consumption ~gainst 18 % for residual fuel oil.
Supply structure
Following the slight drop in Community needs, the petroleum supply was structured as follows :
EUROSTAT-L -2920 Luxembourg Tel.: 4301-3801 Publication date: 02.05.1986

- 2 -
- Community production, 86 % of which is accounted for by British crude from the North Sea, progressed fairly weakly compared with 1984, i.e.+ 2,6 % ; however it covers more than a third of Community oil requirements.
- Taking into account a further reduction in stocks, imports of crude oil from third-party countries fell again by 4,4 % against the previous year, particularly to the Netherlands C- 20 %). This reduction touched supplies from the Middle East (- 18,7 %) and from Eastern Europe (- 30 %). OPEC countries were again responsible for 66 % of the total volume of extra-Community imports due to substantial increases in imports from Africa (+ 10 %). It should be noted that, with the expansion of the Community to twelve, Africa has become Europe's principal supplier of crude oil.
- As for petroleum products, the Community trade balance remained at practically the same level as in 1984. Following a reduction in imports of 42· %, the United Kindom has once again taken its place in the group of net exporting countries such as the Netherlands, Belgium and Spain.
IMPORTS FROM THIRD PARTY COUNTRIES IMPORTATIONS EN PROV. DES PAYS TIERS
January-December janvier ..... decembre
Provisional data 1985 Donnees provisoires 1985
CRUDE Oil AND FEEDSTOCKS PETROLE BRUT ET FEEDSTOCKS
EUR 12
I 1985
I 1984 :variations 1985-1984 I I
COUNTRY OF ORIGIN :106 tonnes : % :106 tonnes l % I 6 g
% PAYS O'ORIGINE
I I I I :10 tonnes I
1. Western Hemisphere 33,3 10,7 29,9 9,2 I + 3,4 + 11,4 1. H~misphllra occidantala I
among which: Mexico 18,0 5,8 19, 1 5,9 I - 1,1 - 5,8 dont : Mexique I
Venezuela 10,4 3,3 9,7 3,0 I + 0,7 + 7,2 Venezuela I I
1. Near and Middle East 100,3 32,1 123,3 37,8 - 23,0 - 18,7 2. Proche et Moyen-Orient
among which : Saudi Arabia 28,1 9,0 37,2 11,4 - 9,1 - 24,5 dont: Arabie Saoudite
United Arab Emirates 6,3 2,0 13,0 4,0 - 6,7 - 51,5 Emirats Arabes Unis
Iraq 25,1 8,0 19,6 6,0 + 5,5 + 28,1 lrak
Iran 25,3 8,1 34,8 10,7 - 9,5 - 27,3 fran
Koweit 9,5 3,0 9,6 2,9 - 0,1 - 1,0 u Koweit
3. Africa 123,9 39,7 112,2 34,4 + 11,7 + 10,4 3. Afrique
among which : Nigeria 39,3 12,6 37,4 11,5 + 1,9 + 5,0 dont: Nigeria
Libya 37,5 12,0 36,3 11,1 + 1,2 + 3,3 Libye
Algeria 19, 1 6,1 14,5 4,4 + 4,6 + 31,7 Algerie
Egypt 12, 1 3,9 12,3 3,8 - 0,2 - 1,6 Egypte
4. Eastern Europe 27,3 8,8 39,3 12,0 - 12,0 - 30,5 4. Europe de l'Est among which: USSR 26,7 8,6 38,9 11,9 - 2,2 - 31,4 dent: URSS
I
5. Other third party countries I 27,2 8,7 21,7 I 6,6 + 5,5 + 25,3 6. Autres pays tiers et I
and unidentified I origines non pr6cis€tes I i I I
6. TOT AL (1 + 2 + 3 + 4 + 5) : 312,0 100 : 326,4 100 - 14,4 - 4,4 6. TOTAL(1 +2+3+4+5) a111011g which: 0 PE C : 207, 1 66,4 : 221, 5 67,9 - 14,4 - 6,5 dont: 0 PE C

PETROLEUM PETROLE
FOREIGN TRADE COMMERCE EXTERIEUR
January-December janvier-decembre
Provisional data 1985 Donne'es provisoires 1985
1000t
EUR 12 EUR 10 I BRO F NL B L UK IRL DK GR E p
1. Total imports of crude oil (1) 1. Importations totales de p~trole brut ( 1)
,ero J : 326 641 65 212 71 183 77 321 40 228 23 032 30 324 180 6 026 12 135 : : 1984 384 706 335 274 66 931 73 523 75 532 44 486 23 442 32 204 220 5 817 12 119 41 728 7 704 1985 374 359 324 727 64 192 73 772 73 095 39 805 20 466 35 737 350 5 048 11 262 42 582 7 050
' ~985/~ % - 2, 7 - 3,1 - 4,1 + 0,3 - 3,2 - 10,5 - 12,7 + 11,0 + 10,7 - 13,2 - 7,1 + 2,0 - 8,5
among which : dont:
Imports from third party countries Importations en prov. des pays tiers
1983 279 724 so 410 61 697 75 203 32 271 17 268 27 278 179 3 283 12 135 1984 326 405 278 646 48 484 59 498 73 250 36 564 17 187 28 200 3 494 11 969 40 343 7 416 1985 312 014 264 415 47 812 57 838 69 411 29 247 14 137 32 355 2 353 11 262 40 933 6 666
1985/84 % - 4,4 - 5,1 - 1,4 - 2,8 - 5,2 - 20,0 - 17,7 + 14,7 - 32,7 - 5,9 + 1,5 - 10,1
2. Total exports of crude oil 2. Exportations totales de pirtrole brut
1983 70 414 6 257 239 131 68 580 145 56 1984 81 383 81 383 3 121 550 456 78 634 891 728 1985 85 069 84 997 817 465 167 80 724 074 750 72
1985/84 % + 4,5 + 4,4 + 575,2 + 166,4 - 63,4 - + 2,7 + 20,5 + 3,0
3. Total imports of petroleum products 3. Importations totales de produits pe'troliers
1983 153 401 43 942 21 118 15 288 36 448 12 996 998 9 907 3 231 5 437 4 036 1984 171 226 161 142 43 762 21 365 16 061 32 456 11 563 973 23 186 3 119 5 561 3 096 8 138 946 1985 ~ 167 517 161 098 48 705 18 384 18 116 36 556 11 615 072 13 404 2 965 6 540 3 741 5 299 120
1984/83 % + 5,0 - 0,4 + 1,2 + s, 1 - 11,0 - 11,0 - 2,5 + 134,0 - 3,5 + 2,3 - 23,3 1985/84 % - 2,2 o,o + 11,3 - 14,0 + 12,8 + 12,6 + 0,4 +10,2 - 42,2 - 4,9 +17,6 + 20,8 - 34,9 - 42,4
4. Total exports of petroleum products 4. Exportations totales de produits pe'troliers
1983 : 121 026 7 425 11 233 12 403 so 833 15 912 22 14 673 417 1 842 6 266 1984 126 442 116 593 6 992 10 560 10 270 51 491 15 876 17 14 285 475 2 064 4 563 9 440 409 1985 126 878 115 452 6 n17 11 164 10 456 51 060 12 729 22 16 926 491 2 246 3 741 11 039 387
1984/83 % - 3,7 - 5,8 - 6,0 -17,2 + 1,3 - 0,2 - 22,7 - 2,6 +13,9 +12,1 - 27,2 1985/84 % + 0,3 - 1,0 - 5,4 + 5,7 + 1,8 - 0,8 - 19,8 + 29,4 + 18,5 + 3,4 + 8,8 - 18,0 + 16,9 - 5,4
NET IMPORTS OF PETROLEUM IMPORTATIONS NETTES DE PETROLE (= 1 + 3-2-4) (= 1 +3-2-4)
1983 288 602 101 723 81 068 79 949 25 604 19 985 976 -43 022 3 994 8 476 9 849 1984 348 107 298 440 103 698 84 328 81 202 24 901 18 673 956 -37 529 3 864 8 423 9 924 40 426 9 241 1985 330 213 285 376 106 280 80 992 79 938 23 836 19 185 050 -48 509 3 824 8 268 10 512 36 770 8 067
I 1984/83 % + 3,4 + 1,9 + 4,0 + 1,6 - 2,7 - 6,6 - 2,0 - 12,8 - 3,3 - 0,6 + 0,8 1985/84 % - 5,1 - 4,4 + 2,5 - 4,0 - 1,6 - 4,3 + 2,7 + 9,8 + 29,3 - 1,0 - 1,8 + 5,9 - 9,0 - 12,7
J (1) Including feedstocks for distillation (1) Y compris feedstocks pour distillation

PETROLEUM PETROLE
January-December Janvler-decembre
Provisional data 1985 Donnees provlsoires 1985
1 OOOt
EUR 12 I EUR 10 BRO F NL B L UK IRL DK I' GR E p
Crude o ii production ( 1 ) Production de petrole brut (1)
1983 126 409 4 092 1 661 2 196 2 901 112 165 2 153 241 1984 140 304 138 043 4 030 2 064 2 285 3 433 122 608 2 314 309 2 261 1985 143 965 141 762 4 066 2 646 2 379 4 050 124 411 2 892 318 2 203
Refinery throughput P,trole traite dans les raffineries
1983 407 284 87 261 76 007 80 556 43 683 23 048 74 509 199 6 947 14 074 1984 462 315 410 256 86 564 76 625 77 774 47 902 23 192 76 932 240 7 340 12 687 44 493 7 566 1985 448 095 395 859 84 517 76 878 73 769 42 550 20 363 77 335 293 7 020 12 134 45 056 7 180
1984/83 % + 0,7 - 0,8 + 0,8 - 3,5 + 9,7 + 0,6 + 3,2 + 3,4 + 5,7 - 9,9 1985/84 % - 3,1 - 3,5 - 2,4 + 0,3 - 5,1 -11,2 -12,2 + 0,5 + 4,3 - 4,4 - 4,4 + 1,3 - 5,1
Total inland deliveries of petroleum products Livraisons interieures totales de produits petroliers
1983 386 836 103 537 80 113 79 621 17 757 16 172 974 64 615 3 892 10 019 10 136 1984 442 063 397 098 104 185 76 776 76 710 17 896 15 450 964 81 455 3 692 9 935 10 035 36 781 8 184 1985 428 410 385 527 106 177 74 658 75 624 17 613 16 180 038 69 916 3 799 10 291 10 231 35 286 7 597
1984/83 % + 2,7 + 0,6 - 4,2 - 3,7 + 0,8 - 4,5 - 1,0 + 26, 1 - 5,1 - 0,8 - 1,0 1985/84 % - 3,1 - 2,9 + 1,9 - 2,8 - 1,4 - 1,6 + 4,7 + 7,7 - 14,2 + 2,9 + 3,6 + 2,0 - 4,1 - 7,2
----- ----------among which: dont:
Motor spirit Essences moteur
1983 83 676 23 517 18 273 11 765 3 698 2 582 296 19 593 932 443 577 1984 91 543 85 129 24 150 18 354 11 720 3 711 2 595 293 20 255 886 493 672 5 604 810 1985 91 221 84 498 23 641 18 035 11 860 3 502 2 504 309 20 379 944 530 794 5 868 855
1984/83 % + 1,7 + 2,7 + 0,4 - 0,4 + 0,4 + 0,5 - 1,0 + 3,4 - 4,9 + 3,5 + 6,0 1985/84 % - 0,4 - 0,7 - 2,1 - 1, 7 + 1,2 - 5,6 - 3,5 + 5,5 + 0,6 + 6,5 + 2,5 + 7,3 + 4,7 + 5,6
----- ---------------------------------------------------------------------------------------------Kerosenes and jet fuels Petrole lampant et carbureacteurs
1983 17 817 3 166 2 352 2 324 188 485 51 6 244 ~68 641 1 098 1984 20 675 18 162 3-332 2 393 2 113 228 500 67 6 536 259 617 1 117 2 041 472 1985 21 777 19 317 3 524 2 638 2 121 358 600 73 6 877 281 655 1 190 1 971 487
1984/83 % + 1,9 + 5,2 + 1,7 - 9,1 + 3,4 + 3,1 + 31,4 + 4,7 .. 3,4 - 3,7 + 1,7 1985/84 % + 5,3 + 6,5 + 5,8 +10,2 + 0,4 +10,6 +20,0 + 9,0. + 5,2 + 8,5 + 6,2 + 6,5 - 3,4 + 3,2
------Gas diesel oil Gasoil et fuel-oil fluid~
1983 141 323 47 700 31 573 24 271 4 702 6 745 489 16 662 180 4 615 3 386 1984 155 254 142 557 48 274 31 557 24 146 4 612 6 882 479 17 252 212 4 723 3 420 10 763 1 934 1985 161 614 148 873 51 798 31 618 25 069 4 718 7 640 531 17 424 410 5 129 3 536 10 823 1 918
1984/83 % + 0,9 + 1,2 - 0, 1 - 0,5 - 1,9 + 2,0 - 2,0 + 3,5 + 2,7 + 2,3 + 1,0 1985/84 % + 4, 1 + 4,4 + 7,3 + 0,2 + 3,8 + 2,3 +11,0 +10,9 + 1,0 +16,3 + 8,6 + 3,4 + 0,6 - 0,8
-----Residual fuel-oil Fuel-oil residue!
1983 79 368 j1 556 12 709 31 120 821 3 577 75 12 414 258 2 425 3 413 1984 97 069 83 292 10 120 10 089 25 455 604 2 679 70 25 857 045 2 204 3 169 9 760 4 017 1985 77 428 66 455 9 443 8 164 23 405 527 2 591 82 16 282 892 2 117 2 952 7 686 3 287
1984/83 % + 4,9 -12,4 - 20,6 - 18,2 - 26,4 - 25, 1 - 6,7 +124,4 -16,9 - 9, 1 - 7, 1 1985/84 % - 20,2 - 20,2 - 6,7 - 19, 1 - 8,1 - 12,7 - 3,3 +17,1 - 41,6 -14,6 - 3;9 - 6,8 - 21,3 - 18,2
(1) Including condensates for distillation (1) Y compris condensats pour distillation

Theme 4 D Them'e 4 Energy and industry D Energia et industrie
Series F D Serie F Rapid reports D Statistiques rapides
Energy I
Energie
May/Mai 1986 UDR y
ENERGY ECONOMY
Statistical aspects of the energy economy in 1985
Since the beginning of the 80's a drop in Community energy consumption has been observed which contrasts with GDP figures which have been constant or slightly on the increase; however, since 1984 and 1985 the trend has been reversed with gross domestic consumption of energy rising faster than GDP.
In 1985 the increase in gross domestic energy consumption for the Community of Twelve was approximately 29 million tonnes oil equivalent, i.e. + 3%. Compared with other economic aggregates, the increase in energy consumption was higher than for GDP(+ 2.2%), private consumption(+ 1.7%) and public consumption(+ 1.2%) and Lower than industrial production (+ 3.2%). The energy intensity of the economy (the relationship between energy consumption and GDP) has thus increased further. In terms of energy, this means that the Community• s economy has been Less effective and that efforts to utilize energy efficiently have not been maintained as in the past; however, it should not be forgotten that 1985 was colder than normal, and the influence of this is not negligible.
The salient features of the trends in gross domestic consumption of the various energy sources compared with 1984 are a fresh decline in the use of oil ( - 3.5%) and an increase in the use of natural gas (+ 4.1%) and nuclear energy(+ 20%). The sharp rise in the figure for hard coal (+ 111) is accounted for by the unusually Low Level of consumption in 1984 due to the British miners' strike. These divergent trends have produced a change in the shares of various energy sources in overall consumption, namely an increase of one and a half points for hard coal, of almost two points for nuclear energy and a reduction of almost three points for oil.
The increase in primary energy production of 55 mi LL ion tonnes oi L equivalent, i.e.+ 10%, covers all the sources. The figures for hard coal C + 27%) and nuclear energy < + 20%) stand out for totally different reasons - the Latter resulting from a consistent trend and the former from the abnormal situation in 1984. As for crude oi L production, it has remained practically stable with only a modest
~ increase of 0.8 % recorded. V
EUROSTAT L -2920 Luxembourg T61.: 4301-3268 Publication date : 02. 05. 1986

- 2 -
Despite the increase in gross domestic consumption, the substantial increase in primary production and releases from stock of some 7 million tonnes oil equivalent led to a reduction in the Community's dependence for energy on non-Member States from 45.5% to 43.1% for total energy and from 32.3% to 31.5% for oil.
Gross domestic consumption of energy increased in almost all the Member States, the only exceptions being the new Members, Spain and Portugal, where the figures dropped by 0.3 and 5.7% respectively.
The initial conclusions which may be drawn at present, in the absence of figures for individual sectors, are of course extremely general. Firstly, it should be pointed out that developments observed in 1985 compared with 1984 are affected to some extent by severe distortions of 1984 figures caused by the British miners' strike.
Secondly, it is clear that, in general, after several years in which econom1s1ng energy has borne substantial fruit, a leveling off is to be expected. A variety of reasons, such as falling energy prices, greater availability, an upturn in industrial activity in particular energy intensive industries, as well as the effects of climate, can also be cited in explanation of the increase in consumption.
It should, moreover, be noted that the nuclear energy accounting system based on the heat produced by the reactor could distort figures for gross domestic consumption when related to market data due to the extremely high losses -approximately 70% - involved in converting nuclear heat to electrical energy.
N.B. 1. It should be noted that the data in the Annex were prepared in accordance with the definitions of the final energy balance sheet in which all the operations are recorded on the basis of the actual energy content of each source. This means that primary electrical energy is converted at 3 600 kJ per kWh (86 grammes of oil equivalent). Nuclear energy, which is considered a national resource, is recorded in terms of primary heat generated by the reactor and is based on thermal (and not electrical> production.
2. A tonne of oil equivalent is defined as a standard oil unit with a net calorific value of 41.8 million kilojoules (10 million kilocalories) per tonne.
Remark In the revue •energy in Europe• N° 1, 1986 which will be published shortly, a presentation of the outlook for 1986 is given.

- --------.-----~------ ~~~-~--~~...-,,.-..,--......-~~-.....--.-~~~-~~-~~~---~ -----------,:;--v--~ -- ~ ..__ - ~~ --~~--.--·-~~~~~
SUMMARY ''FINAL ENERGY" BALANCE-:-SHEET BILAN AGREGE DEL' "ENERGIE FINALE"
, · I I I I I I I I I I I I I I I I I I I I I I
E I
EUR 12 I EUR 10 I BRO I F I I I NL I B I L I UK I IRL I DK I GR I I p I
I I I I I
1984 millions of tonnes of oil equivalent Primary production (1) l . 533,6 507,6 124,0 74,1 22,0 60,1 11,2 o,o 203,8 3,9 2,5 6,0 24,9 1, 1 Imports I 726, 1 (2) 658, 1 (2) 150,3 129,4 123,7 88,4 49,6 3,0 73,8 5,3 17,9 16,6 57,2 10,9 I Changes in stocks (3) I +18,2 +17,4 +6,6 -0,6 -2, 1 +0,4 +1,0 +0,0 +12,2 -0,4 -o,o +0,2 +1,1 -0,3 Exports I 264,3 (2) 251,5 (2) 21,2 ~4,8 11,1 81,2. 18,0 o,o 95,7 0,5 3,5 5,4 12,2 0,6 I Gross consumption I 1 016,2 934,2 260,2 188,~ 132,6 67,7 44,3 3,0 194,9 8,3 16,9 17 ,4 71,0 11,0 Bunker3 I 24,7 22,0 2,3 2,3 3,2 7,5 2,4 - 2,6 0,0 0,4 1,3 2,2 0,5 I INLAND CONSUMPTION I 991,'• 912,1 257,9 186,5 129,4 60,2 41,9 3,0 192,3 8,3 16,5 16,2 68,8 10,5 I -- - - - - - - - - - -,-
' thousand Terajoules Primary production I
21 253,3 5 190,2 3 101,4 921,1 2 516,0 467,8 1,4 8 533,7 165,3 106,5 249,8 1 043,6 44,0 I 22 340,9 Imports I 30 401,,;<2> 27 553,0 <2> 6 293,0 5 417,5 5 179,4 3 701,5 2 077,7 127,0 3 091,8 221,3 748,3 695,7 2 392,9 · 455,.:4 Exports : 11 065, 1<2> 10 528,7 (2) 887,4 620,8 463,2 3 400,7 754,7 2,0 4 008,7 20,5 146,0 224,9 509,3 27, 1 lNLAND CONSUMPTION : 41 509,3 38 189,3 10 799,4 .7 806,8 5 418,2 2 520, 1 1 753,4 126,7 8 049,5 347,9 690,1 677,3 2 881,4 438;6
' 1985 en millions de tonnes d'equivalent petrole
Production primaire ( 1) I 588,8 560,9 132,1 81,5 22,5 64,7 12,3 o,o 233,7 4,0 3,9 6,2 26,8 1,1 I Importations I 716,2 (2) 651,9 (2) 153,6 127,3 124,3 F.6,5 46,4 3,1 69,3 5,4 19,7 16,3 54,7 9,6 Variations de stocks (3)
I +1,4 +O, 1 I +7,4 +6,0 +2,6 -0,9 +0,8 +0,5 -O,D +1,2 +O, 1 +D,2 +1,4 -0,0
Exponations I 264, 7 (2) 252, 7 (2) 19,2 14,8 11,7 83,0 14,6 o, 1 100, 1 0,6 4,0 4,6 11,5 0,5 I Consommation brute I 1 047,6 966,2 268,0 196,5 134,2 69,0 44,7 3, 1 204,1 8,8 19,7 18, 1 71,3 10, 1 Soutes I 26,9 24,0 2,9 2,5 3,4 8,9 2,4 - 2,1 o,o 0,4 1,4 2,7 0,2 I CONSOMMATION INTERIEURE I 1 020,7 942,3 265,1 194,1 130,8 60,1 42,3 3, 1 202,0 8,8 19,3 16,7 68,6 9,9
i - - - - - - - - - - - - - - - - - - - - - - -- -I I en milliers de Terajoule5
Production primaire I 24 792,9 23 626,0 5 529,8 3 409,7 940,9 2 706,6 514,5 1,5 9 781,0 165,9 163,5 259,2 1 120,8 46,1 Im po nations : 29 981,3(2) 27 292,3(2) 6 431,7 ;5 329,0 5 202,8 3 622,9 1 944,2 131,3 2 899,1 225,4 ,822,8 683, 1 2 288,5 400,5 Exportations · 11.1 1'67,6(2) 10 667,2(2) 801,8 620,3 488,7 3 472,4 611,7 2,5 4 188,5 25,7 167,2 194,4 480,1 20,3 CONS0MIV1ATION INTERIEURE 142 727,9 40 441,9 11 095,3 8 123,9 5 475,0 2 513,3 1 769,9 129,7 8 455,4 368,8 806,0 699,6 2 871,7 41413 I
(11 Including hard coal recovered ( 1 } y compris houine rl!cuperee
(2) y compris l!changes intra-communautaires 12) including intra-community trade (3) + reprises aux stocks; ~ mises aux stocks (3) + decrease of stocks; - increase of stocks

PRIMART ENERGT
PRODUCTION
CONSUMPTION
HARDCOAL. !..IGNITE
HOUIL.L.E !..IGNITE
EUR 1.2
1.985
588a6 MIO TOE,TEP
1020a1 MIO TOE,TEP
ENERGIE PRIMAIRE
PRODUCTION
CONSOMMATION
1901 "
-1.s ,
,__ ______ ......__1a.o x
~ 1111 CRUDE OIL. NATURAL. GAS NUCL.EAR ENERGY
PETROL.E BRUT GAZ NATUREL. ENERG I E NUCL.EA I RE
D PRIMARY EL.ECTRICITY
EL.ECTRICITE PRIMAIAE

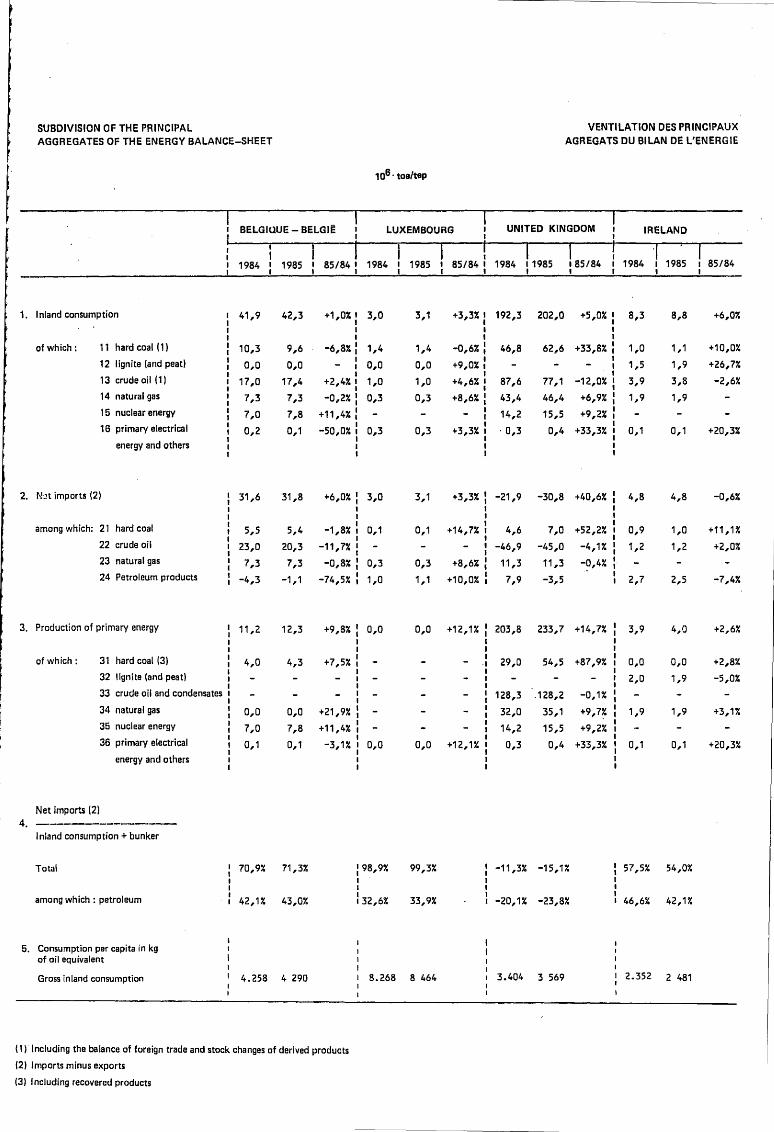
SUBDIVISION OF THE PRINCIPAL AGGREGATES OF THE ENERGY BALANCE-SHEET
106 toe/tep
EUR 12
1983 1984 1985 84/83 85/84 1985
1. Inland consumption :965,3 991,4 1020,7 + 2,7% + 3,0% I I
of which: 11 hard coal (1) : 192,5 180,7 200,8 - 6,2 % +11,1% 12 lignite (and peat) : 37,8 38,7 37,6 + 2,4% - 2,8% 13 crude oil (1)
I :468,1 472,8 456,4 + 1,0% - 3,5%
14 natural gas : 167,5 176,7 183,5 + 5,5% + 3,8%
15 nuclear energy : 78,8 102,2 122,5 +29,7% +20,0% 16 primary electrical : 20,7 20,4 19,9 - 1,2% - 2,5%
energy and others I I I
2. Net imports (2) !435,6 461,8 451,7 + 6,0% - 2,2% I I
among which: 21 hard coal : 42,4 55,5 61,5 +30,8% +10,8% 22 crude oil
I 1324,8 I
306,1 304,6 - 5,7% - 0,5% 23 natural gas : 50,3 57,1 59,4 +13,5% + 4,0%
24 Petroleum products : 15,4 40,7 25,4 +164,0% -37,6%
3. Production of primary energy 1537,7 533,6 588,6 I I I
of which: 31 hard coal (3) : 148,6 107,7 137,0
32 lignite (and peat) : 36,1 37,6 36,3 I
33 crude oil and condensates :135,5 147,2 148,4
34 natural gas :119,9 120,0 125,7
35 nuclear energy : 78,8 102,2 122,5
36 primary electrical I 18,7 18,9 18,7 I I
energy and others I I
Net imports (2) 4. ------------~~~--
Inland consumption+ bunker
Total :44,0% 45,5% 43,1% I I
among which: petroleum b4,4% 34,2% 31,5%
5. Consumption per capita in kg t
of oil equivalent I I
Gross inland consumption :3 012 3 087 3 170
(t) Including the balance of foreign trade and stock changes of derived products
(2) Imports minus exports
(3) Including recovered products
- 0,8% +10,3%
-27,5% +27,2%
+ 4,2% - 3,5% + 8,6% + 0,8%
+ 0,0% + 4,8%
+29,7% +19,9%
+ 0,0% - 1,1%
100 %
19,7%
3,7%
44,7% 18,0%
12,0% 1,9%
100 %
13,6% 67,4% 13,2%
5,6%
100 %
23,3%
6,2% 25,2%
21,4% 20,8%
3,2%
1983
:887,1 I I
l179,7 I : 32,7
:415,9 :165,3
: 76,1 : 17,4 I I I
:377,6 1 I
l 38,4 :213,9 I I 48,2 I I 14,9 I
1515,4 I I I
:140, 5
: 31,2 I :n2,2
:119,9 : 76, 1
: 15,5 I I I
: 41,5% I I I . I 31,7%
3 259
VENTILATION DES PRINCIPAUX AGREGATS DU BILAN DE L'ENERGIE
EUR 10
1984 1985 84/83 85/84 1985
912,1 942,2 + 2,8% + 3,3% 100 %
167,2 185,7 - 7,0% +11,1% 19,7%
33,8 32,9 + 3,3% - 2,7% 3,5% 423,9 411,3 + 1,9% - 3,0% 43,7% 174,6 181,2 + 5,6% + 3,8% 19,2%
96,3 115,1 +26,6% +19,5% 12,2% 16,4 16,0 - 5,5% - 2,4% 1,7%
406,6 399,4 + 7,7% - 1,8% 100 %
50,9 56,3 +32,6% +10,6% 14, 1% 256,7 254,3 - 6,6% - 0,9% 63, n: 55,3 57,3 +14,8% + 3,6% 14,3%
41,8 30,9 +181,0% -26,1% 7,7%
507,6 560,7 - 1,5% +10,5% 100 %
99,1 127,5 -29,5% +28,7% 22,7%
32,8 31,6 + 0,0% - 3,7% 5,6%
144,6 146,2 + 9,4% + 1,1% 26,1%
119,8 125,5 - 0,1% + 4,8% 22,3% 96,3 115,1 +26,6% +19,5% 20,5%
15,1 14,9 - 2,3% - 1,3% 2,7%
43,6% 41,3%
32,0% 29,5%
3 344 3 449

,,,.,. ~ {'J.S. ; ' ...,__ u ~ 111,-P. ........ -~
SUBDIVISION OF THE PRINCIPAL AGGREGATES OF THE ENERGY BALANCE-SHEET
106 toe/tep
BR DEUTSCH LAND
1984 1985 85/84 1984
1. Consommation interieure : 257,9 265,1 +2,8%:186,5 i i I I 8
+1, 1%: soit 11 houille ( 1 ) D 56,9 57,5 23,8 I I
12 lignite(ettourbe) I 26,9 25,4 -5,6%: 0,8 D
13 petrole brut ( 1 l R 107,7 108,4 +0,6%: 85,5 I 14 gaz nature! I -1,8%: I 40,8 40,1 23,4
u I 15 energie nucleaire 0 22,9 31,3 +36,7%: 49,3 D 16 energie electrique I 2,6 2,5 -3,8%: 3,7 8
primaire et autres I D
2. Importations nettes { 2 ) l 129, 1 134,5 +4,2%:114,6 I I I i
' I dont : 21 houille i -0,8 0,9 I 13,4 I I 22 petrole brut I 67,6 78,7 +16,4%: 75,7 I
23 gaz nature! I 27,5 29,2 +6,2%: 18,2 I 24 produits petroliers I 36,9 27,6 -25,2% I 8,7
3. Production primaire : 124,0 132,1 +6,5% 74,1 I B
soit : 31 houille(3) I 56,0 58,8 +5,0% 10,0 I i 32 lignite ( et tourbe ) I 25,4 24,2 -4,7% 0,8 I
33 petrole brut et condensats u 4,1 4,1 -0,1% 2,9 I
34 gaz nature( D 13,3 11,5 -13,5% 5,3 I I 35 energie nucleaire I 22,9 31,3 +36,7% 49,3 I ·35 energie electrique I 2,3 2,2 -4,3% 5,8 ff
primaire et autres I
Importations nettes ( 2 ) 4. ----------------------
Consommation interieure + soutes
I Total 49,3% 50,2% : 60, 7%
I I
dont : petrole 39,9% 39,7% : 44,7%
5. Consommation par habitant en kg d'equivalent petrole
Consommation interieure brute 4.217 4 344 3.394
( 1 ) Y compris solde du commerce exterieur et mouvement des stocks des produits derives
(2) Importations moins exportations
( 3 l Y compris recuperation
FRANCE
1985
194, 1
23,6
0,7
83,7
25,0
57,5 3,7
112,5
11,3
74,0
20,9
7,0
81,5
9,8
0,6
3,2
4,6
57,5
5,7
57,2%
41,2%
3 518
VENTILATION DES PRINCIPAUX AGREGATS DU BILAi\! DE L'ENERGfE
ITALIA NEDERLAND
8 85/84 1984 1985 85/84 : 1984 1985 85/84 .
+4,1%: 129,4 130,8 +1,1%: 60,2 60,2 -0,1% D D B D D D
-0,8%: 13,6 14,4 +5,9%: 6,6 6,4 -3,0% -12,5%: 0,3 0,3 -0,6%: 0,0 0,1 -2,1%: 79,1 78,8
• I -0,4%1 21,4 19,8 ... 7,5%
+6,8%: I
26,5 27,2 +2,6%: 30,8 32,3 +4,9% I
+16,6%: 1,9 2,0 +5,3%l 0,9 1,0 +11,1% +O, 1%: 7,9 8,1 +2,5%: 0,4 0,6 +50,0%
I I
-1,8%: 112,6 112,6 I I 7,2 3,6 -50,0%
D I I I I I
-15,7%1 13,8 15,0 +8, 7%: 6,4 6,8 +6,3% I
-2,2%: 75,3 72,3 -4,0% j 44,4 38,3 -13,7% +14,8%: 15,6 15,9 +1,9% l -24,8 -27,2 -9,7% -19,5%
1 I 6,4 7,7 +20,3% -19,1 -14,5 -24,1%
+10,0%: 22,0 22,5 +2,3%: 60, 1 64,7 +7,7% I u I I
-2,0%: I I
I D
-25,0%; 0,3 0,3 +9 ,3% j +10,3%: 2,3 2,4 +4,3%: 3,5 4, 1 +17,1% -13,2% ~ 11,4 11,7 +2,6% l 55,6 59,5 +7,0%
u I +16,6%: 1,9 2,0 +5,3%: 0,9 1,0 +11,1% -1,7%: 6,1 6,0 -1,6%: 0,1 0, 1 +26,6%
n u
85,0% 83,9% 10, 7% 5,2%
61,7% 59,6% 37,5%. 34,5%
2.271 2 289 4.168 4 154
l j
SUBDIVISION OF THE PRINCIPAL AGGREGATES OF THE ENERGY BALANCE-SHEET
106 · toe/tep
BELGIQUE - BELGI~ I LUXEMBOURG I I I
I I I
1984 1985 85/84 I 1984 1985 85/84 I I
1. Inland consumption 41,9 42,3 +1,0%
of which: 11 hard coal ( 1) 10,3 9,6 -6,8% 12 lignite (and peat) 0,0 0,0 13 crude oil ( 1 l 17,0 17,4 +2,4% 14 natural gas 7,3 7,3 -0,2% 15 nuclear energy 7,0 7,8 +11,4% 16 primary electrical 0,2 o, 1 -50,0%
energy and others
2. N;.')t imports (2) 31,6 31,8 +6,0%
among which: 21 hard coal 5,5 5,4 -1,8% 22 crude oil 23,0 20,3 -11,7% 23 natural gas 7,3 7,3 -0,8% 24 Petroleum products -4,3 -1,1 -74,5%
3. Production of primary energy I 11,2 12,3 +9,8% I I I
of which: 31 hard coal (3) I 4,0 4,3 +7,5% I
32 lignite (and peat) I I I
33 crude oil and condensates 1 I
34 natural gas I 0,0 0,0 +21,9% I
35 nuclear energy I 7,0 7,8 +11,4% I
36 primary electrical I I 0,1 0,1 -3,1% I
energy and others I I
Net imports (2) 4. -----~---~~~-~-
Inland consumption+ bunker
Total 70,9% 71,3%
among which : petroleum 42,1% 43,0%
5. Consumption per capita in kg of ail equivalent
Gross inland consumption 4.258 4 290
( 1) · including the balance of foreign trade and stock changes of derived products
(2) Imports minus exports
(3) Including recovered products
I
3,0 3, 1 +3,3%
1,4 1,4 -0,6%
0,0 0,0 +9,0%
1,0 1,0 +4,6%
0,3 0,3 +8,6%
0,3 0,3 +3,3%
3,0 3,1 +3,3%
0,1 0,1 +14,7%
0,3 0,3 +8,6%
1,0 1,1 +10,0%
0,0 0,0 +12,1%
0,0 o,o +12,1%
: 98,9% 99,3% I I
I 32,6% 33,9%
I 8.268 8 464 I
VENTILATION DES PRINClPAUX AGREGATS OU BILAN OE L'ENERGIE
UNITED KINGDOM IRELAND
I I ·I 1984 11985 I 85/84 1984 I 1985 85/84
I I I
192,3 202,0 +5,0% : 8,3 8,8 +6,0% I I
46,8 62,6 +33,8% : 1,0 1, 1 +10,0% I
1,5 1,9 +26,7%
87,6 77,1 -12,0% 3,9 3,8 -2,6%
43,4 46,4 +6,9% 1,9 1,9
14,2 15,5 +9,2%
· 0,3 0,4 +33,3% 0,1 0,1 +20,3%
-21,9 -30,8 +40,6% 4,8 4,8 -0,6%
4,6 7,0 +52,2% 0,9 1,0 +11,1%
-46,9 -45,0 -4,1% 1,2 1,2 +2,0%
11,3 11,3 -0,4%
7,9 -3,5 2,7 2,5 -7,4%
203,8 233,7 +14,7% 3,9 4,0 +2,6%
29,0 54,5 +87,9% o,o 0,0 +2,8%
2,0 1,9 -5,0%
128,3 .128,2 -0,1%
32,0 35,1 +9,1; 1,9 1,9 +3,1%
14,2 15,5 +9,2%
0,3 0,4 +33,3% O, 1 0,1 +20,3%
-11,3% -15,1% 57,5% 54,0%
-20, 1% -23,8% 46,6% 42,1%
3.404 3 569 2.352 2 481

SUBDIVISION OF rHE PRINCIPAL AGGREGATES OF THE ENERGY BALANCE-SHEET
,06 toe/tep
DANMARK
1984 1985 85/84 1984
1. Consommation interieure 16,5 19,3 +17,0 %1 16,2 I I I
soit 11 houille ( 1 ) 5,7 8,0 +40,4 %: 1,1 12 lignite (et tourbe) I
4,1 0,0 I I 13 petrole brut ( 1 ) 10,3 10,7 + 3,9 r.: 10,4
14 gaz nature! 0,1 0,6 I 0,1 I
15 energie nucleaire I I
16 energie electrique 0,4 0,1 -75,0 r.: 0,5 I primaire et autres I
2. Importations nettes ( 2 } I 14,4 15, 7 + 9,0 %1 11,2 I I I I I I
dent : 21 houille I 5,9 7,7 +30,5 r.: 1,1 I
22 petrole brut I 4,9 4,0 I -18,4 r.: 11,4 I I 23 gaz nature! 1- 0,1 0,4 :1 I I
24 produits petroliers I 3,.1 4,3 +38~. 7 %1- 1,5
3. Production primaire 2,5 3,9 +56,0 %1 6,0 I I I
soit 31 houille ( 3 l I I
32 lignite ( et tourbe ) I 4,3 I
I 33 petrole brut et condensats 2,3 2,9 +26,1 %1 1,3 I
34 gaz nature! 0,2 1,0 ·1 0,1 ·1 35 energie nucleaire I
I 36 energie electrique 0,0 0,.0 -28,3 r.: 0,2
I primaire et autres I
Importations nettes ( 2 l 4. ----------------------
Consommation interieure + soutes
Total : 85, 1 % 79,6 % : 64,5 % I I I I I I
dont : petrole : 47,9 % 42,0 % : 56,8 %
5. Consommation par habitant en kg d'equivalent petrofe I
I I I
Consommation interieure brute 13 224 I
3 767 : 1 635 I
( 1 l Y compris so Ide du commerce exterieur et mouvement des stocks des produits derives
(2) Importations mains exportations
(3 )Y compris recuperation
ELLAS
1985
16,7
1,1
4,6
10,7
0,1
0,3
11,7
1, 1
10,S
o,o
6,2
4,6
1,3
0,1
0,2
64,5 %
58,1 %
1 682
ESPANA
85/84 1984 1985
+ 3,1 %1 68,8 68,6 I I I
- 1,9 %: 13, 1 14,4
+12,2 ,d I
4,9 4,7
· + 2,9 %: 39,8 37,0
- 9,2 r.: 2,0 2,4 I 6,0 7,4 I
-40,0 r.: 2,7 3,0 I I
+ 4,5 %1 45,0 43,2 I I I
- 2,5 %1 I 4,2 4,3
- 7,9 %: 41,8 43,2 I I 1,9 2,1 I ,_
3,2 - 6,5
+ 3,3 %1 24,9 26,8 I I I I 8,5 9,5 I
+ 3,3 r.: 4,9 4,7 I
+ 0,8 r.: 2,6 2,2
- 9,2 %: 0,1 0,2 I 6,0 7,4 I
%: - 2,2 2,8 2,8 I I
I 163,.5 I
% 60,6 % t I
l54,.s % 51,5 %
I
: 1 791 1 7 77
VENTILATION DES PRINCIPAUX AGREGATS DU BILAN DE L'ENERGIE
PORTUGAL
85/84 1984 1985 85/84
- 0,3 %1 I
10,5 9,9 - 5,7 % I I
+ 9,9 r.: 0,4 0,7 +75,0 %
- 4,1 I
%1 I
- 7,0 %1 9,1 8,.1 -11,0 % I +20,0 r.:
+23,3 %: -10,0
I %1
I 1,0 1,2 +20,0 %
I
- 4,0 r.: 10,2 9,1 -10,8 % I I
+23,8 %: 0,4 0,8 + ·,oo %
+ 3,3 r.l 7,7 7,0 - 9,1 % I
+10,5 %1 I
+103,1 %1 2,1 0,9 -57,2 %
+ 7,6 r.: 1,1 1,.1 + 4,8 % I I
+11,8 %: 0,1 0,1 2,9 % I
- 4,1 %1. I
-15,4 r.: I I
+23,.3 %1 •I
I .I 0,.9 1,0 +11,1 % I I
I :93,.4 % 90,0 % I I
l89,3 % 79,1 %
I I I
'1 I 053 973
l I I
'1 1
I