Embed Size (px)
Citation preview
SECURING THE FUTURE OF EUROPEAN FREIGHT RAILWAY OPERATORS
Copyright © 2016 Oliver Wyman 2
EUROPEAN FREIGHT RAIL’S FATAL FLAW
Over the past decade, European freight rail operators have been growing without a clear strategy for their markets and operations, resulting in today’s unstructured networks, over-dimensioned organizations, relatively poor service quality and low profitability. It’s time for operators to face the flaws in their business designs and pursue turnaround strategies that could ensure meaningful profitability and a sustainable future in Europe’s growing logistics market.
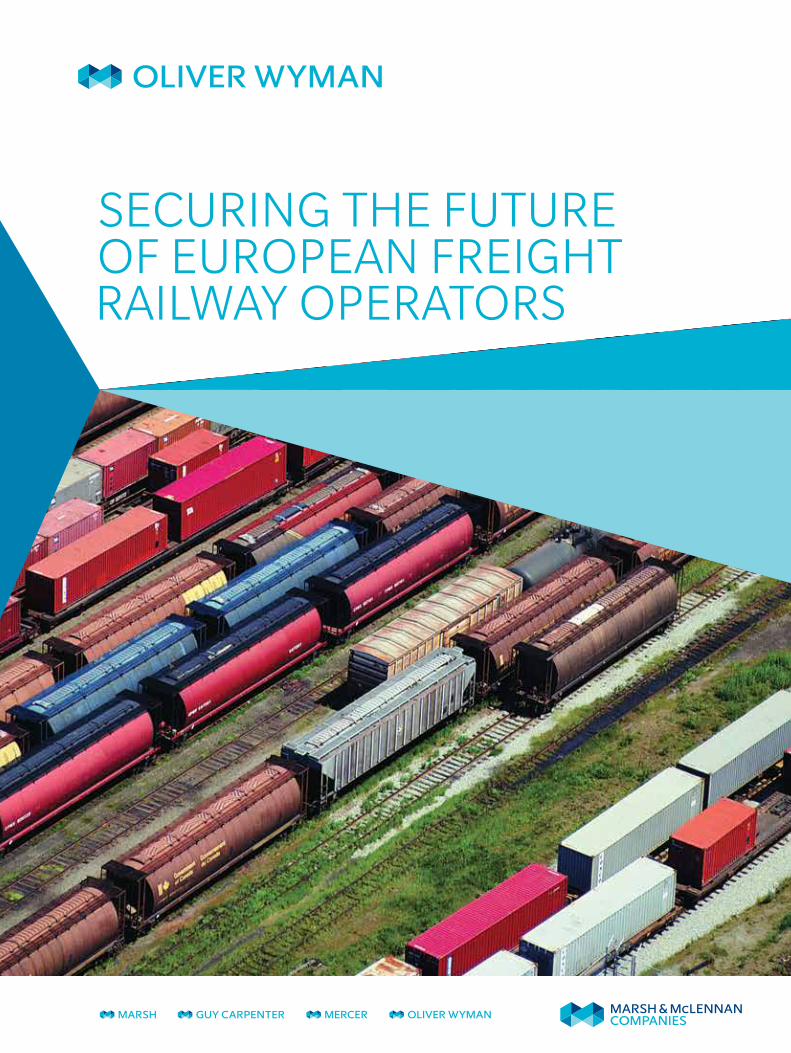
Incumbent European freight railway operators have continued to dominate their markets
since liberalization, but their shares have shown a steady decline. Incumbent shares now
range from 50 to 75 percent in most countries (Exhibit 1); shares for full trainload traffic are
much lower. The market also has become increasingly diverse, with many different business
designs claiming a role in rail transport – from corridor specialists and regional feeders to
combined logistics operators and service companies (Exhibit 2).
Exhibit 1: Concentration of the European Rail Freight Transport Market, 2012
50%
60%
60%
71%
60%
65%
65%
68%
90%
82%
50%
80%
82%
Bubble size = total transport volume (tkm)
Market share of incumbents in 000 ton-kilometres, wagonload and full load trains
83%
Source: UTK, SCI, Oliver Wyman analysis
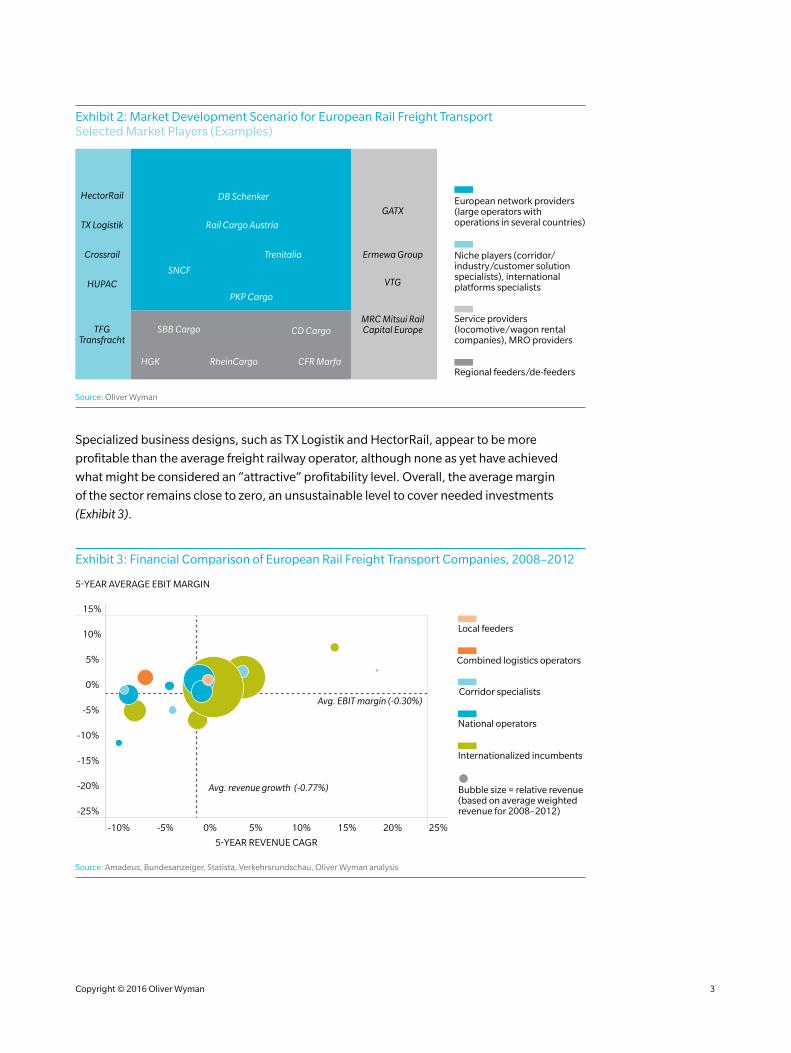
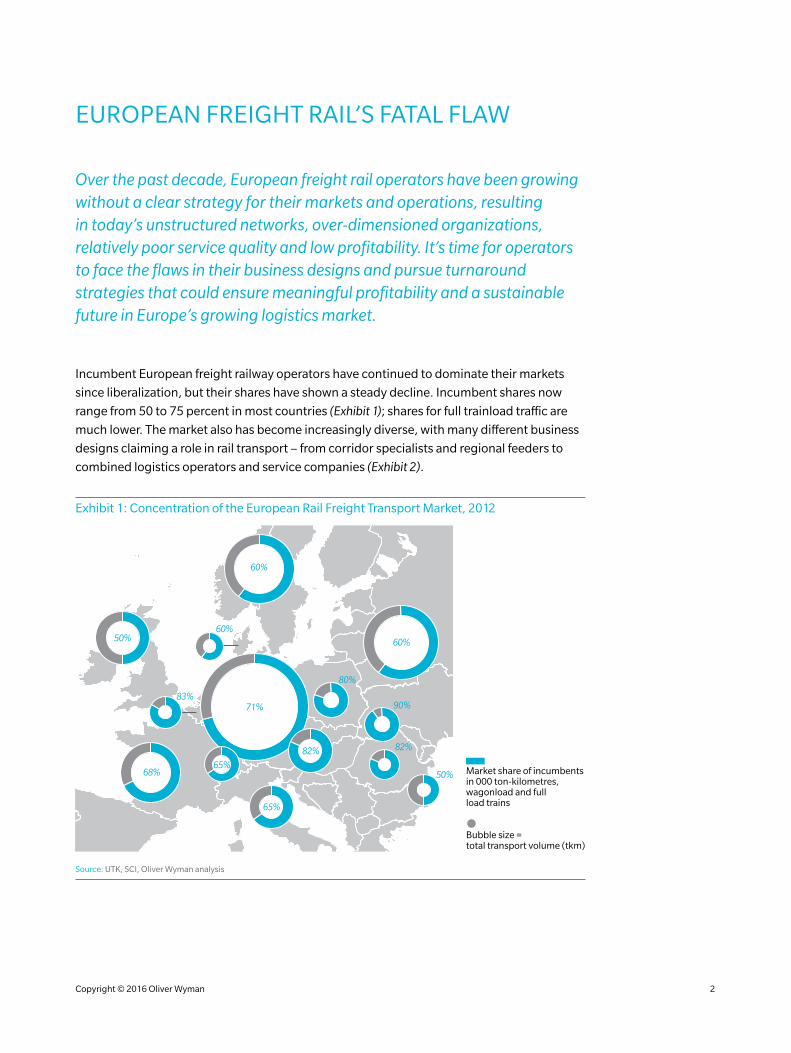
Exhibit 2: Market Development Scenario for European Rail Freight Transport Selected Market Players (Examples)
European network providers (large operators with operations in several countries)
Niche players (corridor/industry/customer solution specialists), international platforms specialists
Service providers(locomotive/wagon rental companies), MRO providers
Regional feeders/de-feeders
PKP Cargo
CFR Marfa
SBB Cargo
HGK RheinCargo
SNCF
Crossrail
MRC Mitsui Rail Capital Europe
Ermewa Group
HUPAC
HectorRail
TX Logistik
VTG
GATX
CD CargoTFGTransfracht
Rail Cargo Austria
DB Schenker
Trenitalia
Source: Oliver Wyman
Specialized business designs, such as TX Logistik and HectorRail, appear to be more
profitable than the average freight railway operator, although none as yet have achieved
what might be considered an “attractive” profitability level. Overall, the average margin
of the sector remains close to zero, an unsustainable level to cover needed investments
(Exhibit 3).
Exhibit 3: Financial Comparison of European Rail Freight Transport Companies, 2008–2012
-5%
-10%
-15%
-20%
10%
5%
0%
5-YEAR REVENUE CAGR
-25%
15%
5-YEAR AVERAGE EBIT MARGIN
25%20%15%10%0% 5%-5%-10%
Avg. EBIT margin (-0.30%)
Avg. revenue growth (-0.77%)
National operators
Corridor specialists
Combined logistics operators
Local feeders
Internationalized incumbents
Bubble size = relative revenue (based on average weighted revenue for 2008–2012)
Source: Amadeus, Bundesanzeiger, Statista, Verkehrsrundschau, Oliver Wyman analysis
Copyright © 2016 Oliver Wyman 3
So why isn’t growth and internationalization translating into profitability? Fundamentally,
the business designs of most rail operators are out of sync with current realities – unable to
deal with increasing factor costs, more professionalized procurement and the increasing
complexity of customer requirements.
Market fundamentals are positive. Despite some cyclicality, sector growth is expected
to be in the range of 1–2 percent over the long term, and traffic is becoming increasingly
internationalized, meaning more long-distance (and thus theoretically more attractive)
trains. Increasingly specialized client needs offer opportunities to generate profits via
integrating rail freight solutions with value-added services. But operators won’t benefit
from these trends without substantial turnaround programs that can generate positive
financial fundamentals in the short term, and a hard look at their business designs over
the mid- to long term.
AN INTEGRATED TURNAROUND APPROACH
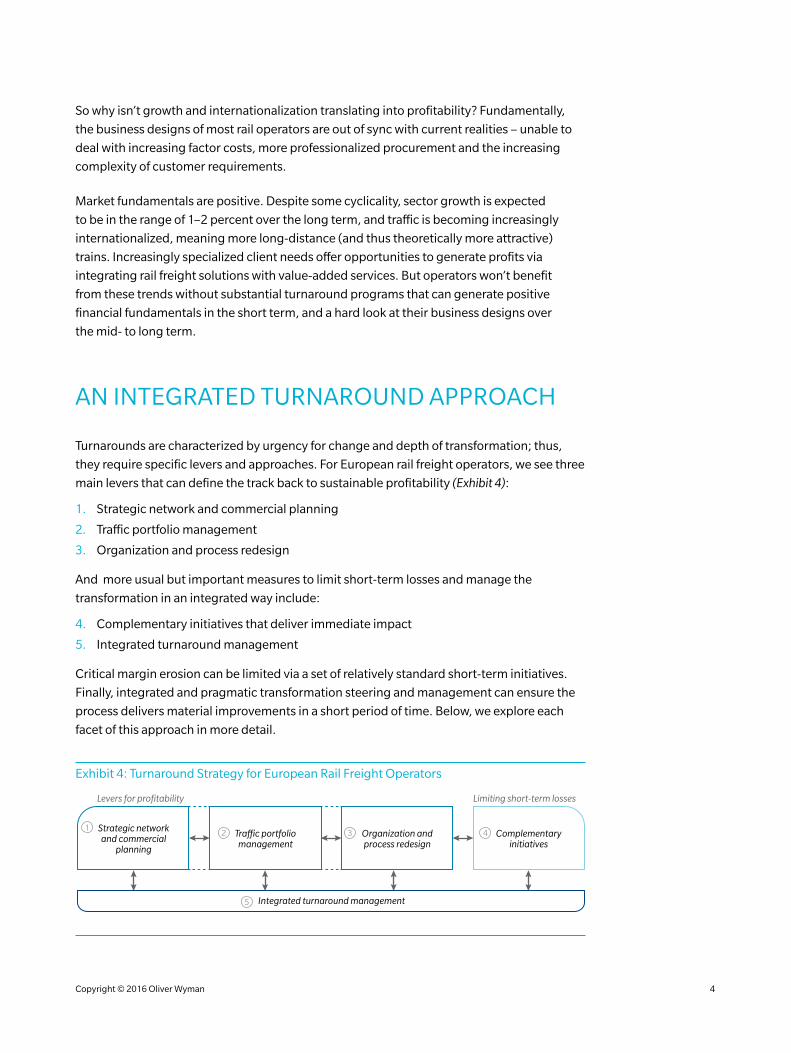
Turnarounds are characterized by urgency for change and depth of transformation; thus,
they require specific levers and approaches. For European rail freight operators, we see three
main levers that can define the track back to sustainable profitability (Exhibit 4):
1. Strategic network and commercial planning
2. Traffic portfolio management
3. Organization and process redesign
And more usual but important measures to limit short-term losses and manage the
transformation in an integrated way include:
4. Complementary initiatives that deliver immediate impact
5. Integrated turnaround management
Critical margin erosion can be limited via a set of relatively standard short-term initiatives.
Finally, integrated and pragmatic transformation steering and management can ensure the
process delivers material improvements in a short period of time. Below, we explore each
facet of this approach in more detail.
Exhibit 4: Turnaround Strategy for European Rail Freight Operators
Levers for profitability Limiting short-term losses
Strategic network and commercial
planning
Traffic portfolio management
Organization and process redesign
Complementaryinitiatives
12 3 4
Integrated turnaround management5
Copyright © 2016 Oliver Wyman 4
1. STRATEGIC NETWORK AND COMMERCIAL PLANNING
Freight railways must deal with numerous challenges that are intrinsic to the industry.
Some of the most critical are:
• Being asset and resource intensive, which requires careful long-term investment planning
• Facing increasingly volatile demand, resulting in short-term commercial and operational challenges
• Facing both stiff intermodal and intramodal competition, whilst price remains by far the main choice criteria for customers, putting pressure on the bidding process
Too often, in this high-pressure environment, freight operators let customers impose
conditions and thereby engage assets and follow demand passively. But at the end of
this track, operators can find themselves with inconsistent portfolios, over-dimensioned
resources and, eventually, earnings levels so low that they limit operators’ ability to renew
their investment in the business.
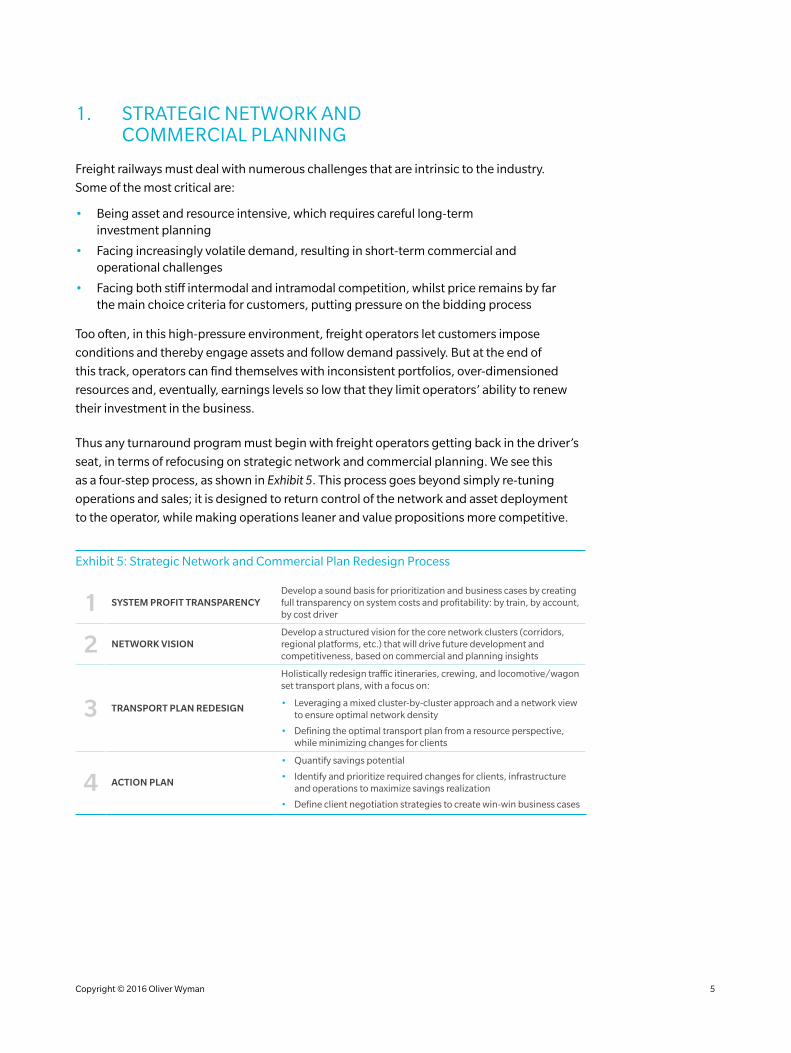
Thus any turnaround program must begin with freight operators getting back in the driver’s
seat, in terms of refocusing on strategic network and commercial planning. We see this
as a four-step process, as shown in Exhibit 5. This process goes beyond simply re-tuning
operations and sales; it is designed to return control of the network and asset deployment
to the operator, while making operations leaner and value propositions more competitive.
Exhibit 5: Strategic Network and Commercial Plan Redesign Process
1 SYSTEM PROFIT TRANSPARENCYDevelop a sound basis for prioritization and business cases by creating full transparency on system costs and profitability: by train, by account, by cost driver
2 NETWORK VISIONDevelop a structured vision for the core network clusters (corridors, regional platforms, etc.) that will drive future development and competitiveness, based on commercial and planning insights
3 TRANSPORT PLAN REDESIGN
Holistically redesign traffic itineraries, crewing, and locomotive/wagon set transport plans, with a focus on:
• Leveraging a mixed cluster-by-cluster approach and a network view to ensure optimal network density
• Defining the optimal transport plan from a resource perspective, while minimizing changes for clients
4 ACTION PLAN
• Quantify savings potential
• Identify and prioritize required changes for clients, infrastructure and operations to maximize savings realization
• Define client negotiation strategies to create win-win business cases
Copyright © 2016 Oliver Wyman 5
2. TRAFFIC PORTFOLIO MANAGEMENT
For most European freight rail operators today, the core business – that is, actual traffic
and associated contracts – is the heart of the profitability problem. Lack of root cause
understanding, prioritization, coordination and communication often prevents operators
from realizing the potential of their portfolio.
A strong portfolio management process can be leveraged in a railway turnaround to:
• Design counter-measure plans that can make traffic profitable
• Generate quick wins
• Coordinate and align all functions efficiently
Bringing four key functional activities together – that is, sales, controlling, planning and
operations (and in some cases, legal) – around a robust and action-oriented traffic portfolio
management process can have a tremendous impact on an operator’s earnings. Exhibit 6
provides an example of how traffic can be prioritized based on revenue, EBIT margin and
order realization rate.
CASE STUDY 1 STRATEGIC NETWORK AND COMMERCIAL PLAN REDESIGN
A freight railway had developed a relatively large network of traffic, fleet and driver depots
over time. The concept of corridors existed in the organization but had not been actively
used to grow traffic and balance client needs while optimizing costs. As a result, the
operator suffered from a structurally unprofitable network and resource dimensioning.
Oliver Wyman worked with dedicated planners, sales and the top management team to
redevelop the network and transport plan from scratch. A two-month effort realigned
network clusters, depot footprint, traffic itineraries, schedules and resource circulation
plans. A prioritized list of changes to negotiate with clients and the infrastructure
manager was then defined and deployed. Key impacts of the new plan included:
• An increase in EBIT of more than six points
• Increases of 20 percent in locomotive productivity and 15 percent in driver productivity
• A leaner footprint, with 30 percent fewer depots
• Development of long-term strategic hubs
Copyright © 2016 Oliver Wyman 6
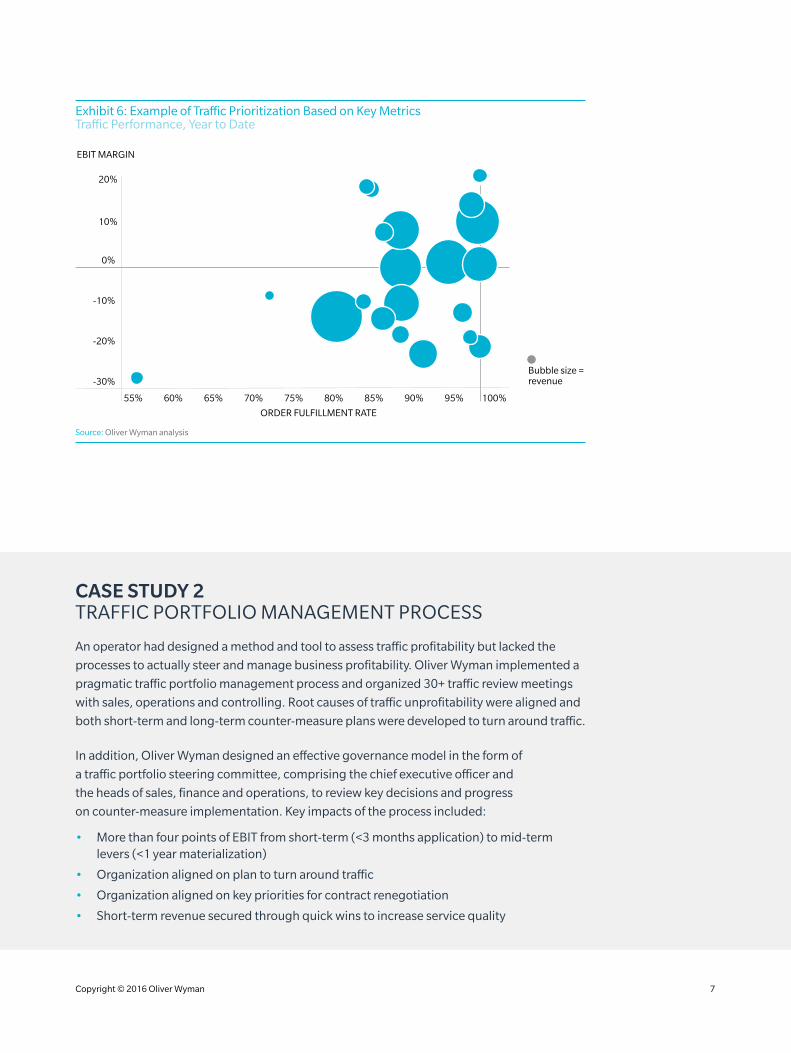
Exhibit 6: Example of Traffic Prioritization Based on Key Metrics Traffic Performance, Year to Date
-10%
-20%
0%
ORDER FULFILLMENT RATE
-30%
20%
10%
EBIT MARGIN
80% 85% 90% 95% 100%75%70%65%60%
Bubble size = revenue
55%
Source: Oliver Wyman analysis
CASE STUDY 2 TRAFFIC PORTFOLIO MANAGEMENT PROCESS
An operator had designed a method and tool to assess traffic profitability but lacked the
processes to actually steer and manage business profitability. Oliver Wyman implemented a
pragmatic traffic portfolio management process and organized 30+ traffic review meetings
with sales, operations and controlling. Root causes of traffic unprofitability were aligned and
both short-term and long-term counter-measure plans were developed to turn around traffic.
In addition, Oliver Wyman designed an effective governance model in the form of
a traffic portfolio steering committee, comprising the chief executive officer and
the heads of sales, finance and operations, to review key decisions and progress
on counter-measure implementation. Key impacts of the process included:
• More than four points of EBIT from short-term (<3 months application) to mid-term levers (<1 year materialization)
• Organization aligned on plan to turn around traffic
• Organization aligned on key priorities for contract renegotiation
• Short-term revenue secured through quick wins to increase service quality
Copyright © 2016 Oliver Wyman 7
3. ORGANIZATION AND PROCESS REDESIGN
Lack of strategic planning and sub-optimal operations result in over-dimensioning across the
freight railway organization. To secure a sustainable track towards profitability, organization
dimensioning and core business processes must be reconfigured in line with the company’s
new strategic and commercial plan and revised traffic portfolio (in addition to traditional
cost cutting).
For example, train drivers represent typically 10–15 percent of a freight operator’s total
costs. In addition, significant time and financial investment is required for driver training
(9–12 months). As a consequence, they are a particularly important resource to manage.
Depot footprint structure and the strategic network plan should drive their overall
dimensioning. All things being equal, however, a rigorous and pragmatic approach to
managing time off, absenteeism and overtime can significantly impact driver costs.
Similarly, adapting the sizing of the central organization (customer service, planning, HR,
finance, management, etc.) is a key lever to reduce costs and increase business agility. In
some non-optimized organizations, indirect functions can reach up to 33 percent of total
headcount, while leaner operators generally keep headcounts in the range of 15–20 percent.
Finally, in the battle for contracts and growth, most freight railways end up growing without
structured business processes. This can lead to, among other things, poor service quality
and uncontrolled (even risky) practices and contractual commitments. We find that
prioritizing the redesign and standardization of the following three core processes can
secure both some quick wins and make the path to profitability more sustainable.
3.1. OVERALL PLANNING PROCESSES – STRATEGIC, TACTICAL AND OPERATIONAL
Railway operators, even relatively small ones, have a lot of inertia. Getting the organization
moving to prepare and realize complex transport plans requires a robust and well-
dimensioned planning process. All planning objects from access and infrastructure to yard
conductors and maintenance should be considered at different time horizons and planned at
an adequate level of granularity. Some of the key questions that must be addressed include:
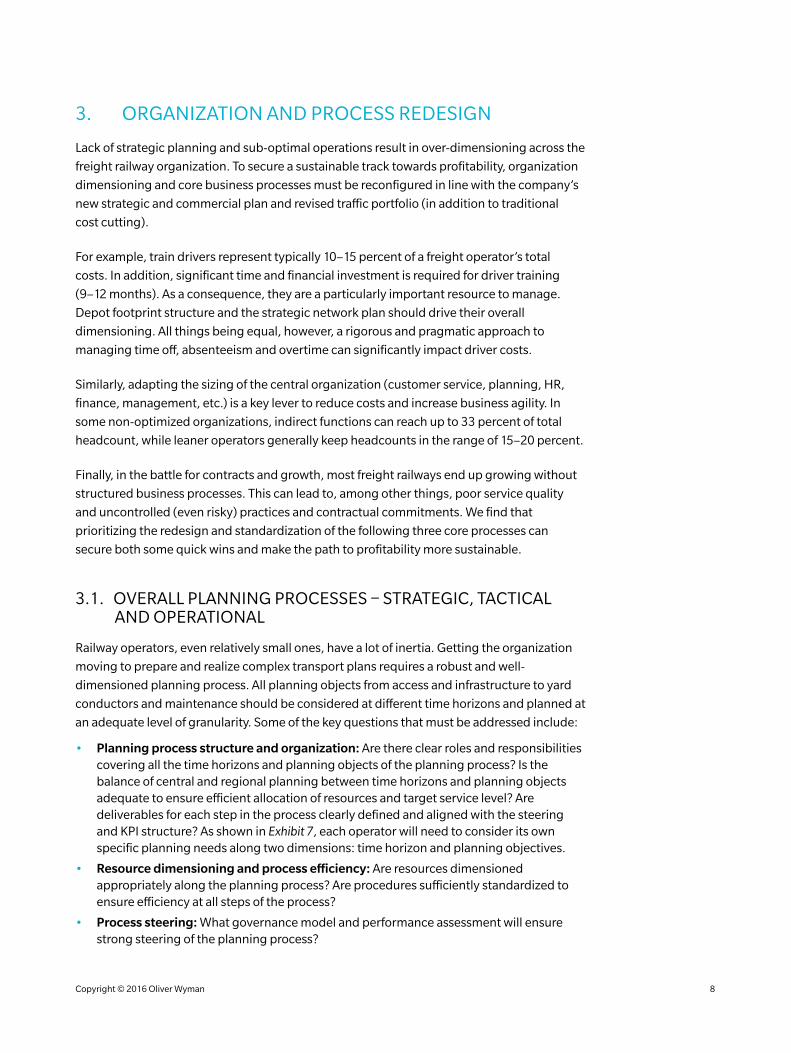
• Planning process structure and organization: Are there clear roles and responsibilities covering all the time horizons and planning objects of the planning process? Is the balance of central and regional planning between time horizons and planning objects adequate to ensure efficient allocation of resources and target service level? Are deliverables for each step in the process clearly defined and aligned with the steering and KPI structure? As shown in Exhibit 7, each operator will need to consider its own specific planning needs along two dimensions: time horizon and planning objectives.
• Resource dimensioning and process efficiency: Are resources dimensioned appropriately along the planning process? Are procedures sufficiently standardized to ensure efficiency at all steps of the process?
• Process steering: What governance model and performance assessment will ensure strong steering of the planning process?
Copyright © 2016 Oliver Wyman 8
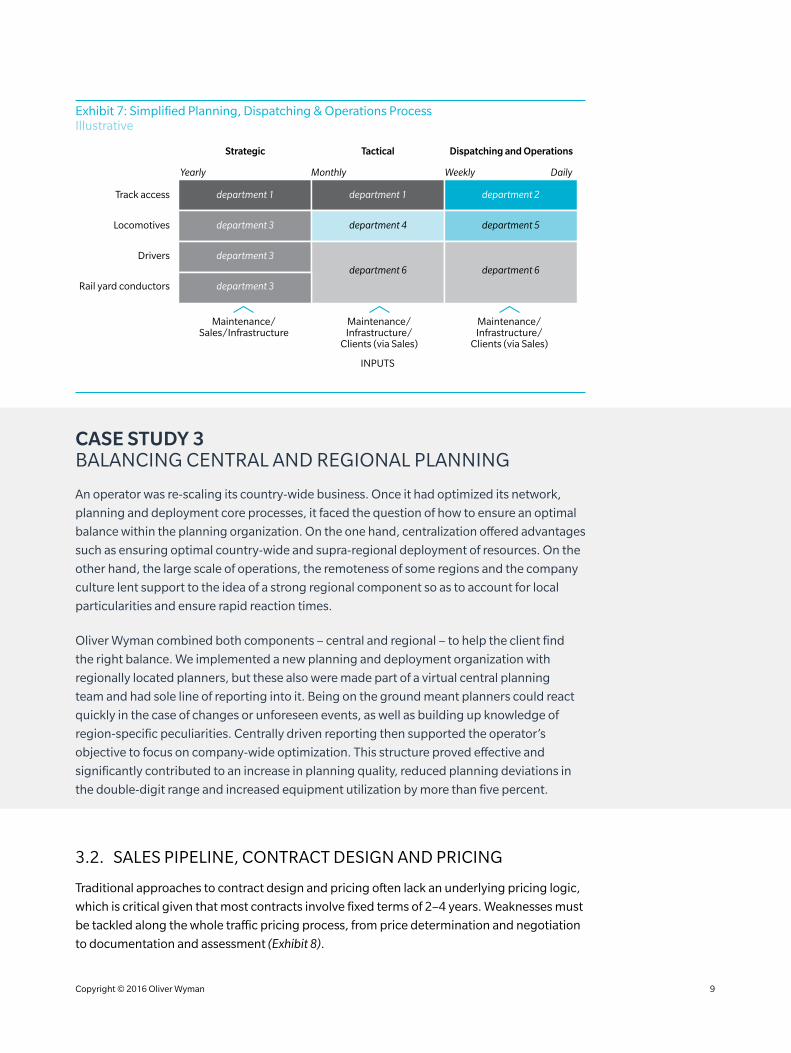
Exhibit 7: Simplified Planning, Dispatching & Operations Process Illustrative
Strategic Tactical Dispatching and Operations
Maintenance/Sales/Infrastructure
Maintenance/Infrastructure/
Clients (via Sales)
Maintenance/Infrastructure/
Clients (via Sales)
Yearly Monthly Weekly Daily
Track access
Locomotives
Drivers
Rail yard conductors
department 1
department 3
department 3
department 3
department 1
department 4
department 2
department 5
department 6 department 6
INPUTS
CASE STUDY 3 BALANCING CENTRAL AND REGIONAL PLANNING
An operator was re-scaling its country-wide business. Once it had optimized its network,
planning and deployment core processes, it faced the question of how to ensure an optimal
balance within the planning organization. On the one hand, centralization offered advantages
such as ensuring optimal country-wide and supra-regional deployment of resources. On the
other hand, the large scale of operations, the remoteness of some regions and the company
culture lent support to the idea of a strong regional component so as to account for local
particularities and ensure rapid reaction times.
Oliver Wyman combined both components – central and regional – to help the client find
the right balance. We implemented a new planning and deployment organization with
regionally located planners, but these also were made part of a virtual central planning
team and had sole line of reporting into it. Being on the ground meant planners could react
quickly in the case of changes or unforeseen events, as well as building up knowledge of
region-specific peculiarities. Centrally driven reporting then supported the operator’s
objective to focus on company-wide optimization. This structure proved effective and
significantly contributed to an increase in planning quality, reduced planning deviations in
the double-digit range and increased equipment utilization by more than five percent.
3.2. SALES PIPELINE, CONTRACT DESIGN AND PRICING
Traditional approaches to contract design and pricing often lack an underlying pricing logic,
which is critical given that most contracts involve fixed terms of 2–4 years. Weaknesses must
be tackled along the whole traffic pricing process, from price determination and negotiation
to documentation and assessment (Exhibit 8).
Copyright © 2016 Oliver Wyman 9
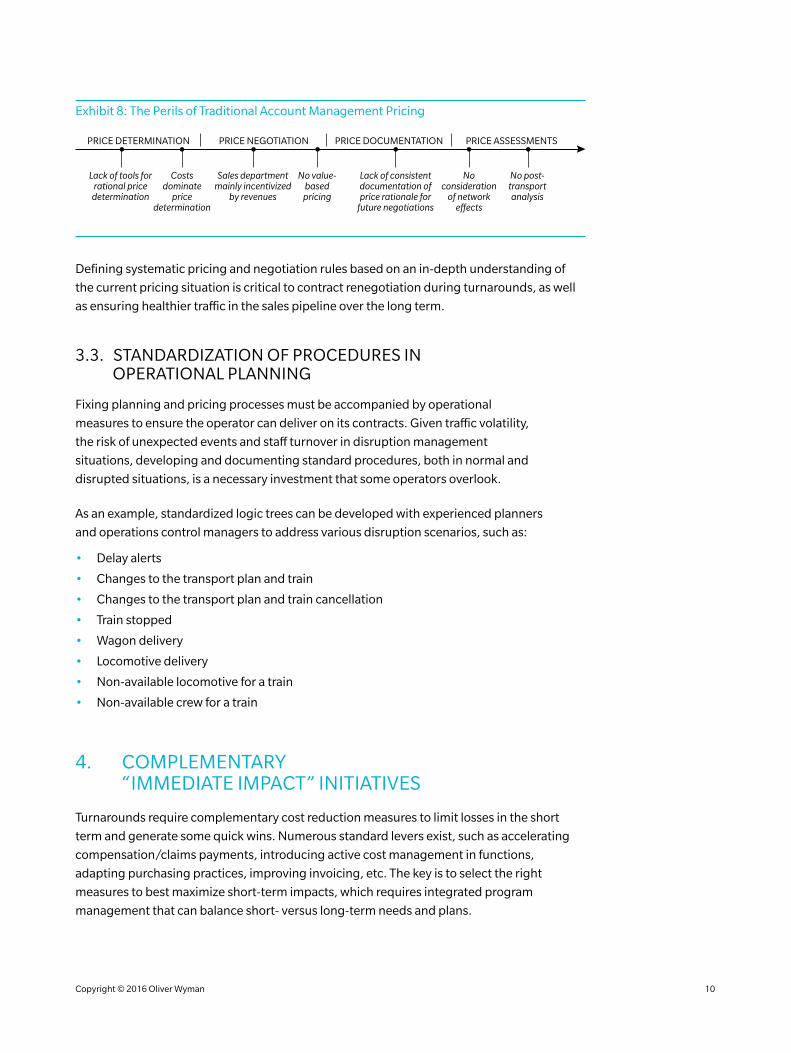
Exhibit 8: The Perils of Traditional Account Management Pricing
PRICE DETERMINATION PRICE NEGOTIATION PRICE DOCUMENTATION PRICE ASSESSMENTS
Lack of tools for rational price
determination
Costs dominate
price determination
Sales department mainly incentivized
by revenues
No value- based
pricing
Lack of consistent documentation ofprice rationale for
future negotiations
No consideration
of network effects
No post-transport analysis
Defining systematic pricing and negotiation rules based on an in-depth understanding of
the current pricing situation is critical to contract renegotiation during turnarounds, as well
as ensuring healthier traffic in the sales pipeline over the long term.
3.3. STANDARDIZATION OF PROCEDURES IN OPERATIONAL PLANNING
Fixing planning and pricing processes must be accompanied by operational
measures to ensure the operator can deliver on its contracts. Given traffic volatility,
the risk of unexpected events and staff turnover in disruption management
situations, developing and documenting standard procedures, both in normal and
disrupted situations, is a necessary investment that some operators overlook.
As an example, standardized logic trees can be developed with experienced planners
and operations control managers to address various disruption scenarios, such as:
• Delay alerts
• Changes to the transport plan and train
• Changes to the transport plan and train cancellation
• Train stopped
• Wagon delivery
• Locomotive delivery
• Non-available locomotive for a train
• Non-available crew for a train
4. COMPLEMENTARY “IMMEDIATE IMPACT” INITIATIVES
Turnarounds require complementary cost reduction measures to limit losses in the short
term and generate some quick wins. Numerous standard levers exist, such as accelerating
compensation/claims payments, introducing active cost management in functions,
adapting purchasing practices, improving invoicing, etc. The key is to select the right
measures to best maximize short-term impacts, which requires integrated program
management that can balance short- versus long-term needs and plans.
Copyright © 2016 Oliver Wyman 10
5. INTEGRATED TURNAROUND MANAGEMENT
Well-structured, integrated turnaround management not only helps focus the efforts of the
organization on the most important levers at each stage of the process, but is necessary
to catalyze critical decision making. A pragmatic approach to turnaround management
generally includes:
• A turnaround Program Management Office (PMO) to manage the process. The PMO coordinates stakeholder involvement and data rooms, challenges work stream leaders, facilitates reporting and communication and escalates risks when necessary.
• Governance embedded in the existing ExCo structure, to limit duplication of decision making and optimize the time and efforts of the management team.
• Modular and streamlined reporting tools, as a sudden uptick in reporting and communication flows can drastically increase the workload of middle and even senior management. Developing effective but light reporting tools and structure to optimize
efforts is key.
CONCLUSION
In summary, we believe that a sustainable and profitable future for European freight railways
is not out of reach. But securing this future will require a deep transformation of today’s
businesses – one that starts with building the right kind of foundations. As the sector has
become more competitive post-liberalization, rail freight operators have too often let their
customers set the terms of engagement, and so have ended up with traffic, operations and
organizations that are less than ideal. They are keeping their heads above water – but that’s
about all.
To turn around their businesses and realize sustainable profitability, operators will need to
take a hard look at the traffic they want to serve, improve their negotiating positions with
respect to customers and create leaner, more responsive organizations. Finally, to make such
a profound transformation happen, four success factors can’t be overemphasized:
• The chief executive officer must commit to mobilizing all of the organization.
• An open and creative mindset is required, particularly around what traffic and customers contribute the most to profitability.
• Fact based, pragmatic and standard supporting documentation of traffic performance must be developed to support decision making.
• A strong governance structure is required to validate critical decisions and monitor progress.
Copyright © 2016 Oliver Wyman 11
ABOUT OLIVER WYMAN
Oliver Wyman has worked with a number of large rail operators, logistics and supply chain clients to develop both strategic and operational approaches and efficiency solutions that often result in double-digit cost savings and/or significant service level improvements. Our list of clients includes many leading companies in Europe, North America, Asia and the Middle East/Africa.
Oliver Wyman is the only global management strategy consultancy that also has an integrated centre of excellence, focused on proprietary network optimization solutions such as the MultiRail™ freight and passenger rail planning system, which Oliver Wyman customizes as needed to meet specific client requirements. Our staff has extensive knowledge in relational database design and implementation as applied to transportation problems. Oliver Wyman combines custom development with commercial software components to provide powerful transportation software in minimal time and with maximum flexibility to adapt to the latest customer requirements.
Oliver Wyman’s transportation and logistics consulting business is only a part of our firm’s worldwide capabilities. With offices in 50+ cities across 25 countries, Oliver Wyman is a leading global management consulting firm that combines deep industry knowledge with specialized expertise in strategy, operations, risk management and organizational transformation. The firm’s 3,700 professionals help clients optimize their businesses, improve their operations and risk profile, and accelerate their organizational performance to seize the most attractive opportunities. Oliver Wyman is part of Marsh & McLennan Companies [NYSE: MMC]. For more information, visit www.oliverwyman.com.
Copyright © 2016 Oliver Wyman
All rights reserved. This report may not be reproduced or redistributed, in whole or in part, without the written permission of Oliver Wyman and Oliver Wyman accepts no liability whatsoever for the actions of third parties in this respect.
www.oliverwyman.com
For more information on this article or the specific strategies suggested here, please contact:
JORIS D’INCÀ Partner [email protected]
RAPHAEL JATTEAU Engagement Manager [email protected]