Embed Size (px)
Citation preview

EUROPEAN COMMISSION Employment, Social Affairs and Equal Opportunities DG Xavier Prats Monné, Director [email protected]
Active ageing and labour market trends for older workers in the European Union
Profit from experience: International experiences on the ageing workforce
AARP Conference and Capitol Hill Luncheon Briefing September 27-28, 2007
This text is a draft version of a study to be finalised published by the European Commission in October 2007, as part of its "Employment in Europe Report". The findings of this study do not reflect the official opinion of the European Commission For further information on the European Union's policies on employment, social affairs and equal opportunities, see http://ec.europa.eu/employment_social/index_en.html
2
TABLE OF CONTENTS
Active ageing and labour market trends for older workers in the EU 1. Introduction ........................................................................................................................4 2. Demographic and policy context: What is at stake ..........................................................5
2.1. Demographic context.....................................................................................................5 2.1.1. Impact on the working-age population....................................................................6 2.1.2. Labour market exit and life expectancy in retirement ...........................................11 2.1.3. Impact on economic growth, social security and public finances..........................12
2.2. Policy context ..............................................................................................................13 2.2.1. Stockholm and Barcelona targets..........................................................................13 2.2.2. Employment Guidelines (2005 to 2008) ...............................................................14 2.2.3. Active ageing........................................................................................................15
3. Current labour market situation and recent employment trends .................................16
3.1. Labour market characteristics and comparison between age groups............................16 3.2. Recent labour market trends and progress towards the targets.....................................19
3.2.1. Recent overall trends for older workers (55–64)...................................................19 3.2.2. Progress towards the Stockholm target .................................................................21 3.2.3. Progress towards the Barcelona target ..................................................................23
3.3. Main features of the rise in employment of older people since 2000 ...........................27 3.3.1. Changes in employment according to gender and type .........................................27 3.3.2. Sectoral employment changes...............................................................................29 3.3.3. Changes in occupational employment structure....................................................29
4. Inactivity among older people and their labour market transitions .............................31
4.1. The extent and gender-related aspects of older people’s inactivity ..............................31 4.2. Reasons for inactivity among older people ..................................................................34 4.3. Labour market transitions of older people ...................................................................37
5. Factors affecting older people’s labour market situation ..............................................43
5.1. Background .................................................................................................................43 5.2. Retirement, pensions and the balance of financial incentives ......................................46
5.2.1. Standard and early retirement ...............................................................................47 5.2.2. Balance of financial incentives .............................................................................49
5.3. Factors affecting the availability of jobs to older workers ...........................................52 5.3.1. Demand changes due to sectoral employment developments................................53 5.3.2. Age discrimination by employers .........................................................................54 5.3.3. Age-related wages and productivity......................................................................55 5.3.4. Employment protection legislation .......................................................................57 5.3.5. Health, disability, and health and safety at work...................................................58 5.3.6. Skill levels and lifelong learning...........................................................................60
5.4. Attractiveness (and conditions) of work ......................................................................65 5.4.1. Working time........................................................................................................66 5.4.2. Working-time organisation and atypical working hours .......................................68 5.4.3. Work organisation, ergonomics and job design ....................................................69
../..
3
6. A typology of approaches to active ageing in EU Member States .................................70
6.1. Cluster analysis on EU Member States........................................................................72 6.2. Principal components analysis on EU Member States .................................................73
7. Reasons for the rise in employment of older people since 2000.....................................76
7.1. Factors related to demographic and long-term societal changes ..................................77 7.1.1. The demographic effect within the older workers’ age group...............................77 7.1.2. Long-term trends – the importance of gender and cohort effects ..........................78
7.2. How governments and employers are responding........................................................80 7.2.1. How governments are responding to the challenge. ..............................................81 7.2.2. How employers are responding to the challenge...................................................84
8. Prospects of meeting the EU targets, and longer term prospects..................................86
8.1. Prospects of meeting the Stockholm and Barcelona targets .........................................86 8.2. Longer-term prospects .................................................................................................87
9. Summary and conclusions ...............................................................................................88 Annex 1 .Decomposing changes in participation and employment rates ................................93 Annex 2 Summary of recent pension reforms in EU Member States......................................94 References ..............................................................................................................................96
* * *
4
1. Introduction One of the most remarkable features of recent trends in labour markets in Europe has been the substantial increase in employment of older people, and this during a period of relatively limited economic and employment growth. Since 2000, the employment rate (ER) for people aged 55–641 has risen by 7 percentage points in the EU-252, compared to a rise of 2.3 percentage points for the working-age population as a whole. However, despite this improvement, employment of older people in Europe remains low by international standards, and many workers still exit the labour market at relatively early ages. The need to improve labour market participation of older people has gained heightened attention in recent years, especially in view of the significant demographic changes the European Union (EU) will undergo due to population ageing. Indeed, population ageing is one of the most important challenges facing the EU, posing a threat to its macro-economic performance and competitiveness. In this context, increases in participation and employment rates for older workers are essential to help sustain economic growth, reinforce social cohesion and the adequacy of pensions, and manage the rising financial burden on social protection systems. Increasing the labour market participation and employment of older people is therefore of key importance to EU policy, which is to be addressed through a comprehensive and sustainable approach known as ‘active ageing’. Indeed, in its synthesis report to the 2004 European Spring Council3 the Commission identified active ageing as one of the three priority areas for which swift action is needed to deliver the Lisbon Strategy. The report highlighted that efforts to promote active ageing must be pursued vigorously, particularly in those Member States with low employment rates for older workers and low average exit ages from the labour market. More recently, the European Commission’s Green Paper on demographic change4 has again highlighted the challenge of an ageing population in Europe. The promotion of active ageing is reflected in two complementary targets that the EU has set itself – the 2001 Stockholm European Council set a target that by 2010 at least 50% of the EU population aged 55–64 should be in employment, while the 2002 Barcelona European Council concluded that ‘a progressive increase of about five years in the effective average age at which people stop working in the EU should be sought by 2010’. Within the European
1 Conventionally the concept of ‘older workers’ has logically focused on the age group approaching retirement, namely the group aged 55–64 within Europe. Most of the analysis in this chapter is therefore focused on people in the age range 55–64, since this is also the main age group targeted by ageing-related policies, but, where relevant, some analysis is also provided on the group aged 65 and over. With demographic ageing and the target of delaying the exit age by five years, the latter group will enter more and more into labour supply considerations and it is therefore useful to also examine the factors which affect their participation. Indeed, policy and pension revisions currently being considered in many Member States could well lead to a need to revise the currently accepted definition of ‘older workers’ at some stage in the future. 2 The analysis of developments between 2000 and 2006 mainly focuses on the EU-25 Member States and the associated aggregate due to the availability of more complete data series over this period, and due to a significant break in series in the employment rate of older workers in Romania for technical reasons during this timeframe. Furthermore, several sections refer only to the EU-25 since the relevant data series currently available are not yet set up to include the EU-27 aggregate (e.g. Eurostat population projections). 3 Delivering Lisbon – Reforms for the Enlarged Union, report from the Commission to the Spring European Council, COM(2004) 29. 4 European Commission, ‘Confronting demographic change: A new solidarity between the generations’, COM(2005) 94 final.
5
Employment Strategy, the need to improve the labour market participation of older workers is fully taken into account in the Employment Guidelines (2005 to 2008)5, which highlight that as part of a new intergenerational approach particular attention should be paid to promoting access to employment throughout working life. In the framework of the Open Method of Coordination (OMC) in the field of pensions, the 2006 Joint Report on Social Protection and Social Inclusion6 highlighted that to ensure adequate and sustainable pension systems, Member States are implementing a three-pronged strategy of reducing public debt, reforming pensions and increasing employment, and that many have undertaken reforms that have begun to translate into higher employment rates of older people, notably by strengthening incentives to work longer. To address the challenge of the ageing population and meet the targets the EU has set itself, it is essential to create the necessary conditions to support people who wish to take advantage of the opportunities offered by longer and more productive lives in better health. For individual companies and the economy as a whole it is essential to raise the employment rate for older workers, so that any labour shortage can be averted or mitigated by making fuller use of the available resources. For this to be successful, governments and social partners need to work together to develop the skills and employability of older people while maintaining the health, motivation and capacities of workers as they age. Age discrimination and negative stereotypes of older workers must be tackled, while working conditions and employment opportunities must be adapted to an age-diverse workforce. In light of the above, the purpose of this chapter is not only to provide an update of the analysis on older workers presented in the 2003 Employment in Europe report7 but also to carry out a review of the main features of the recent substantial improvement in the labour market situation of this group, to examine the main factors influencing their labour market attachment and the differences and similarities in approaches to active ageing across Member States, and to explore in broad terms the underlying reasons for the remarkable rise in employment of older workers in recent years.
2. Demographic and policy context: What is at stake
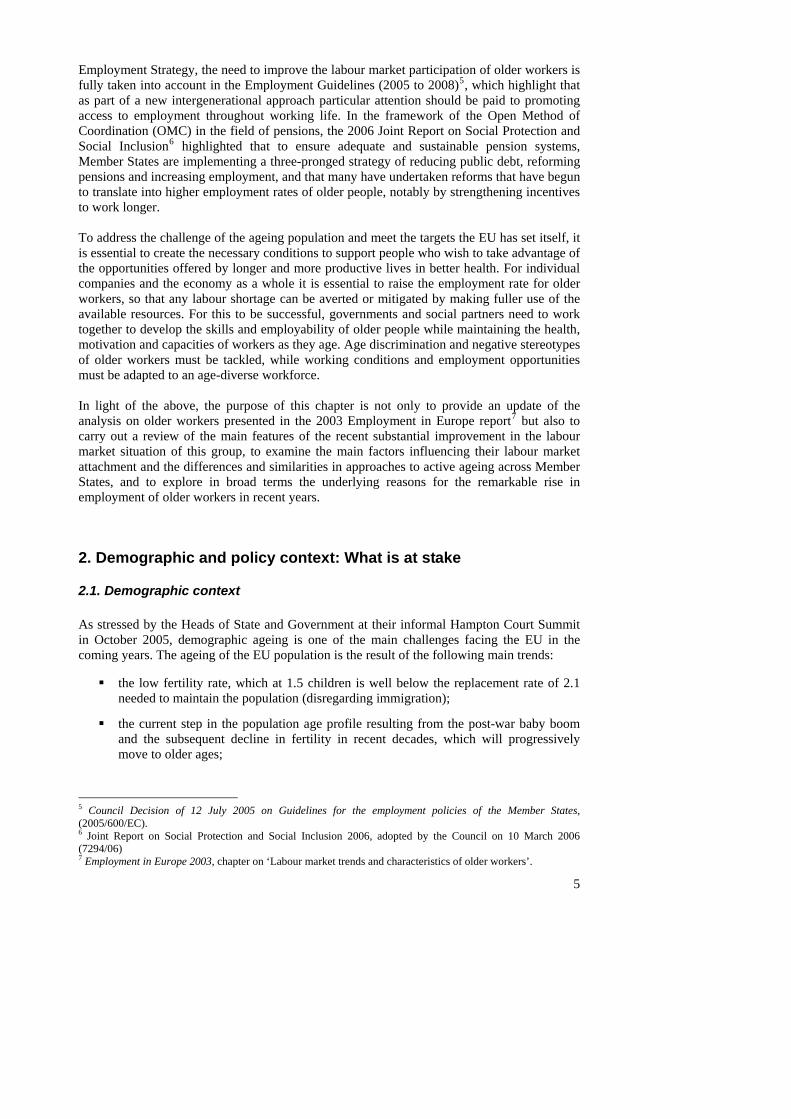
2.1. Demographic context As stressed by the Heads of State and Government at their informal Hampton Court Summit in October 2005, demographic ageing is one of the main challenges facing the EU in the coming years. The ageing of the EU population is the result of the following main trends:
the low fertility rate, which at 1.5 children is well below the replacement rate of 2.1 needed to maintain the population (disregarding immigration);
the current step in the population age profile resulting from the post-war baby boom
and the subsequent decline in fertility in recent decades, which will progressively move to older ages;
5 Council Decision of 12 July 2005 on Guidelines for the employment policies of the Member States, (2005/600/EC). 6 Joint Report on Social Protection and Social Inclusion 2006, adopted by the Council on 10 March 2006 (7294/06) 7 Employment in Europe 2003, chapter on ‘Labour market trends and characteristics of older workers’.
increasing life expectancy. This is expected to lead to a spectacular increase in the number of people surviving into their 80s and 90s, meaning that many could survive several decades in retirement.
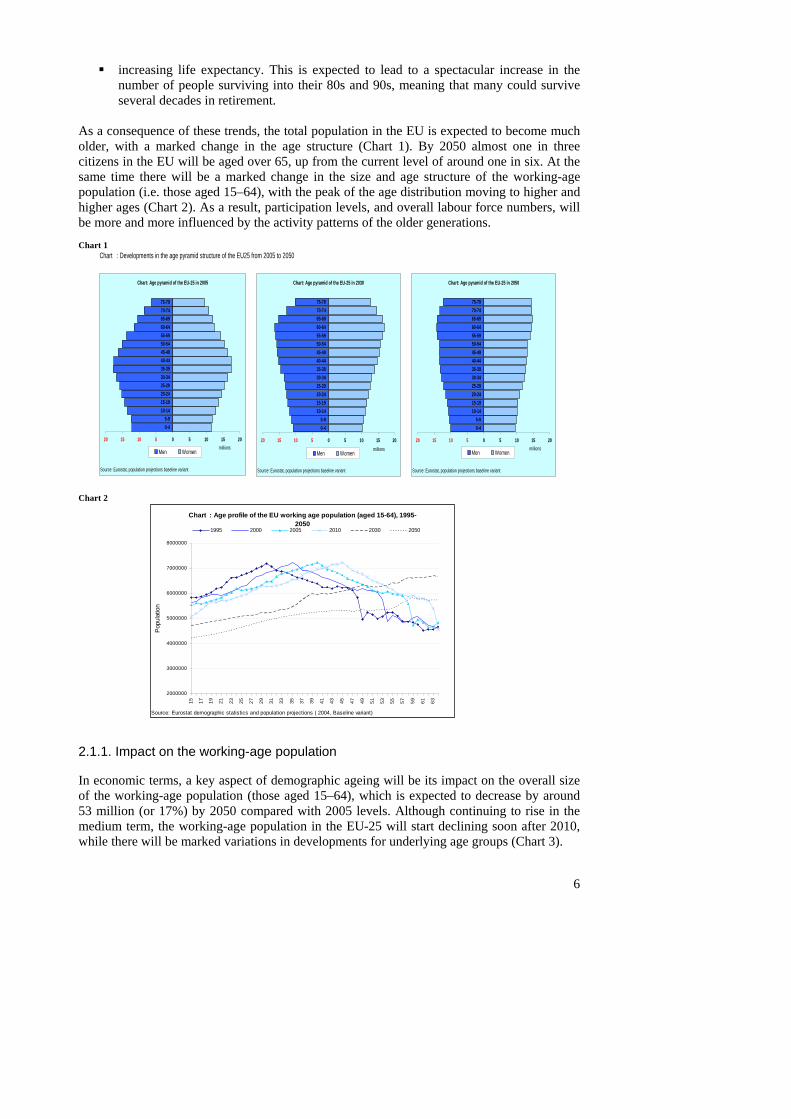
As a consequence of these trends, the total population in the EU is expected to become much older, with a marked change in the age structure (Chart 1). By 2050 almost one in three citizens in the EU will be aged over 65, up from the current level of around one in six. At the same time there will be a marked change in the size and age structure of the working-age population (i.e. those aged 15–64), with the peak of the age distribution moving to higher and higher ages (Chart 2). As a result, participation levels, and overall labour force numbers, will be more and more influenced by the activity patterns of the older generations.
6
Chart : Developments in the age pyramid structure of the EU25 from 2005 to 2050Chart 1
Chart: Age pyramid of the EU-25 in 2005
0 5 10 15 20
0-45-9
10-1415-1920-2425-2930-3435-3940-4445-4950-5455-5960-6465-6970-7475-79
Source: Eurostat, population projections baseline variant
20 15 10 5
Men Womenmillions
Chart: Age pyramid of the EU-25 in 2030
0 5 10 15 20
0-45-9
10-1415-1920-2425-2930-3435-3940-4445-4950-5455-5960-6465-6970-7475-79
Source: Eurostat, population projections baseline variant
20 15 10 5
Men Women
Chart: Age pyramid of the EU-25 in 2050
0 5 10 15 20
0-45-9
10-1415-1920-2425-2930-3435-3940-4445-4950-5455-5960-6465-6970-7475-79
Source: Eurostat, population projections baseline variant
20 15 10 5millions Men Women
millions
Chart 2
Chart : Age profile of the EU working age population (aged 15-64), 1995-2050
20
30
40
50
6000000
7000000
8000000
Source: E
Popu
latio
n
00000
00000
00000
00000
15 17 19 21 23 25 27 29 31 33 35 37 39 41 43 45 47 49 51 53 55 57 59 61 63
urostat demographic statistics and population projections ( 2004, Baseline variant)
1995 2000 2005 2010 2030 2050
2.1.1. Impact on the working-age population In economic terms, a key aspect of demographic ageing will be its impact on the overall size of the working-age population (those aged 15–64), which is expected to decrease by around 53 million (or 17%) by 2050 compared with 2005 levels. Although continuing to rise in the medium term, the working-age population in the EU-25 will start declining soon after 2010, while there will be marked variations in developments for underlying age groups (Chart 3).

7
By 2030, the working-age population in the EU-25 will total 288 million, down from 308 million in 2005, while there will be 116 million people aged over 65, compared to 77 million in 2005. The number of young people (aged 15–24) and young adults (25–39) is already falling, and for both groups the population will continue to decline significantly (down 12% and 16% respectively between 2010 and 2030 (Table 1)). Although rising initially, the number of 40–54 year olds will also start to fall shortly after 2010. In parallel, the number of people aged 55–64 will grow by 9.5% between 2005 and 2010 (from 52 million to 57 million), and by 15.3% (to 66 million) between 2010 and 2030. As a result, the working-age population will include an increasingly important share of older people in the age range 55–64 in the next two decades, with the share rising from 17% in 2005 to stabilise at around 23% from 2025 onwards (Chart 4). Employers will therefore have to rely increasingly on the experience and skills of older workers. At the same time, the dependency ratio (the number of people aged 65 years and older relative to those of working age) is foreseen to rise from the current 25% to 40% by 2030, and reach 53% by 2050, with the result that instead of having four people of working age for every person aged 65 and over as at present there will be only two people by 2050. Chart 3 Table 1
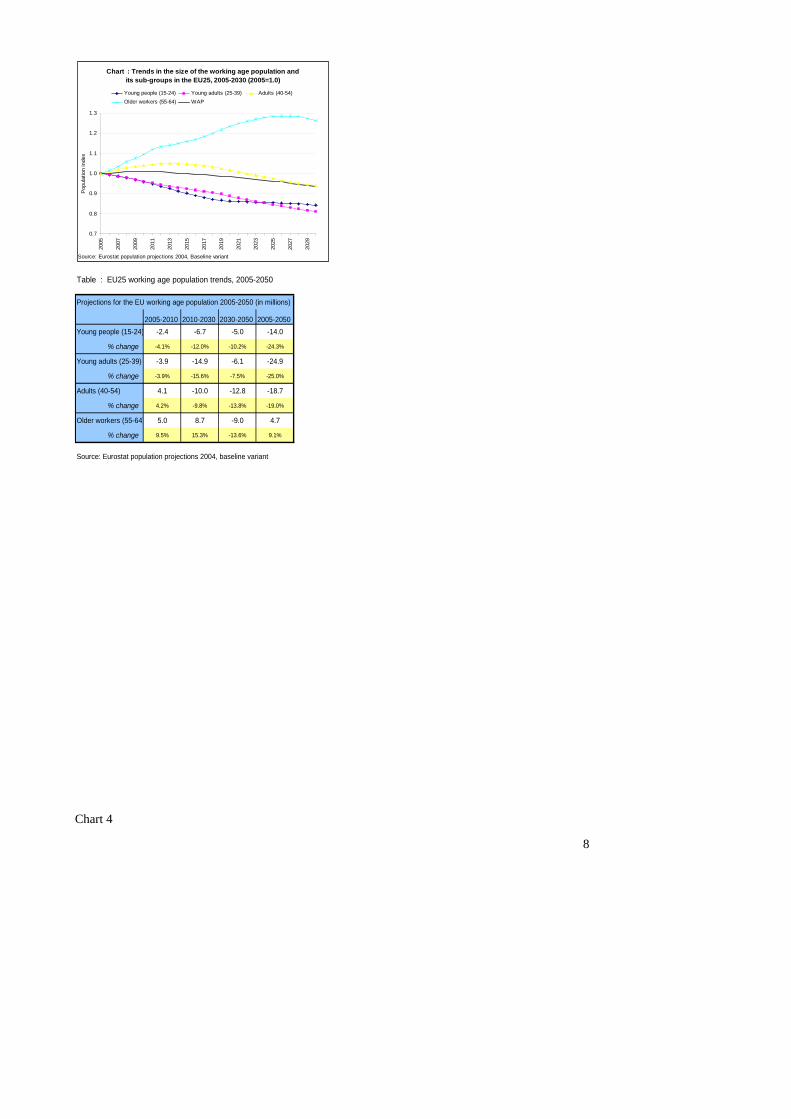
Chart : Trends in the size of the working age population and its sub-groups in the EU25, 2005-2030 (2005=1.0)
0.7
0.8
0.9
1.0
1.1
1.2
1.3
2005
2007
2009
2011
2013
2015
2017
2019
2021
2023
2025
2027
2029
e: Eurostat population projections 2004, Baseline variantSourc
Pop
ulat
ion
inde
x
Young people (15-24) Young adults (25-39) Adults (40-54)Older workers (55-64) WAP
Table : EU25 working age population trends, 2005-2050
Projections for the EU working age population 2005-2050 (in millions)
2005-2010 2010-2030 2030-2050 2005-2050Young people (15-24) -2.4 -6.7 -5.0 -14.0
Youn
Adults
Olde
% change -4.1% -12.0% -10.2% -24.3%
g adults (25-39) -3.9 -14.9 -6.1 -24.9
% change -3.9% -15.6% -7.5% -25.0%
(40-54) 4.1 -10.0 -12.8 -18.7
% change 4.2% -9.8% -13.8% -19.0%
r workers (55-64) 5.0 8.7 -9.0 4.7
% change 9.5% 15.3% -13.6% 9.1%
ce: Eurostat population projections 2004, baseline variantSour Chart 4
8
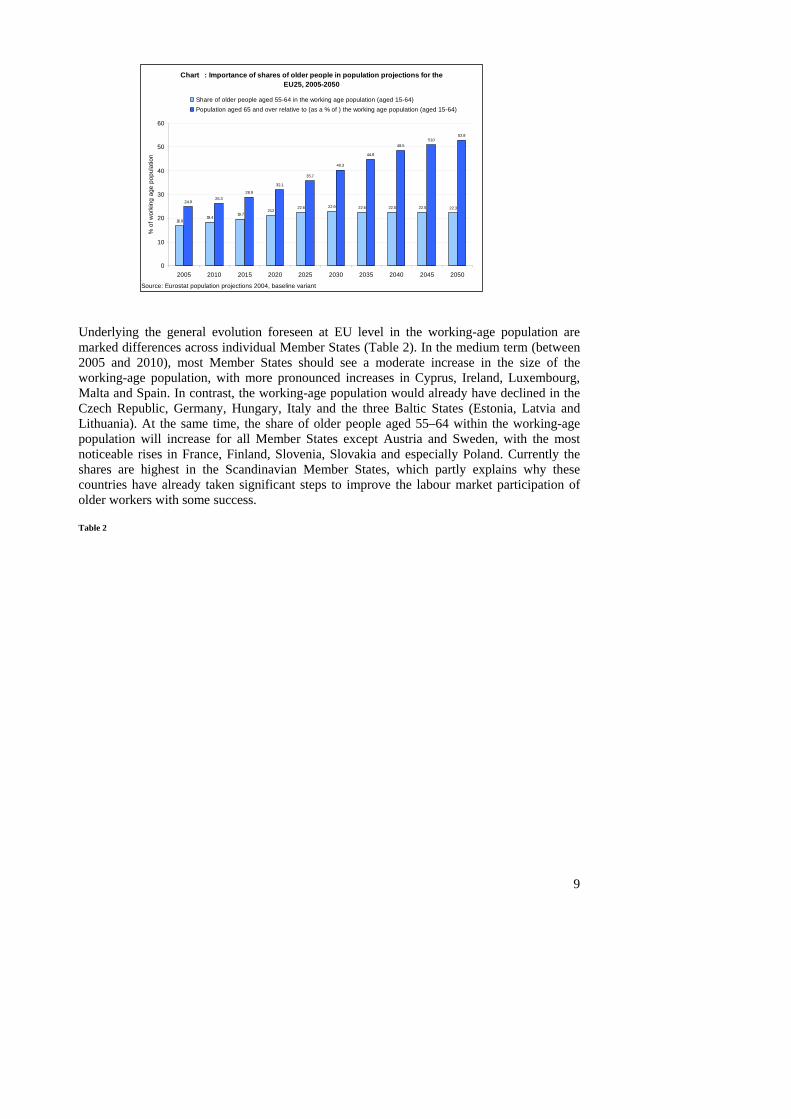
Chart : Importance of shares of older people in population projections for the EU25, 2005-2050
16.918.4
19.721.2
22.6 22.9 22.6 22.5 22.5 22.324.9
26.328.9
32.1
35.7
40.3
44.8
48.551.0
52.8
02005 2010 2015 2020 2025 2030 2035 2040 2045 2050
Eurostat population projections 2004, baseline variant
10
20
30
40
50
60
Source:
% o
f wor
king
age
pop
ulat
ion
Share of older people aged 55-64 in the working age population (aged 15-64)Population aged 65 and over relative to (as a % of ) the working age population (aged 15-64)
Underlying the general evolution foreseen at EU level in the working-age population are marked differences across individual Member States (Table 2). In the medium term (between 2005 and 2010), most Member States should see a moderate increase in the size of the working-age population, with more pronounced increases in Cyprus, Ireland, Luxembourg, Malta and Spain. In contrast, the working-age population would already have declined in the Czech Republic, Germany, Hungary, Italy and the three Baltic States (Estonia, Latvia and Lithuania). At the same time, the share of older people aged 55–64 within the working-age population will increase for all Member States except Austria and Sweden, with the most noticeable rises in France, Finland, Slovenia, Slovakia and especially Poland. Currently the shares are highest in the Scandinavian Member States, which partly explains why these countries have already taken significant steps to improve the labour market participation of older workers with some success. Table 2
9
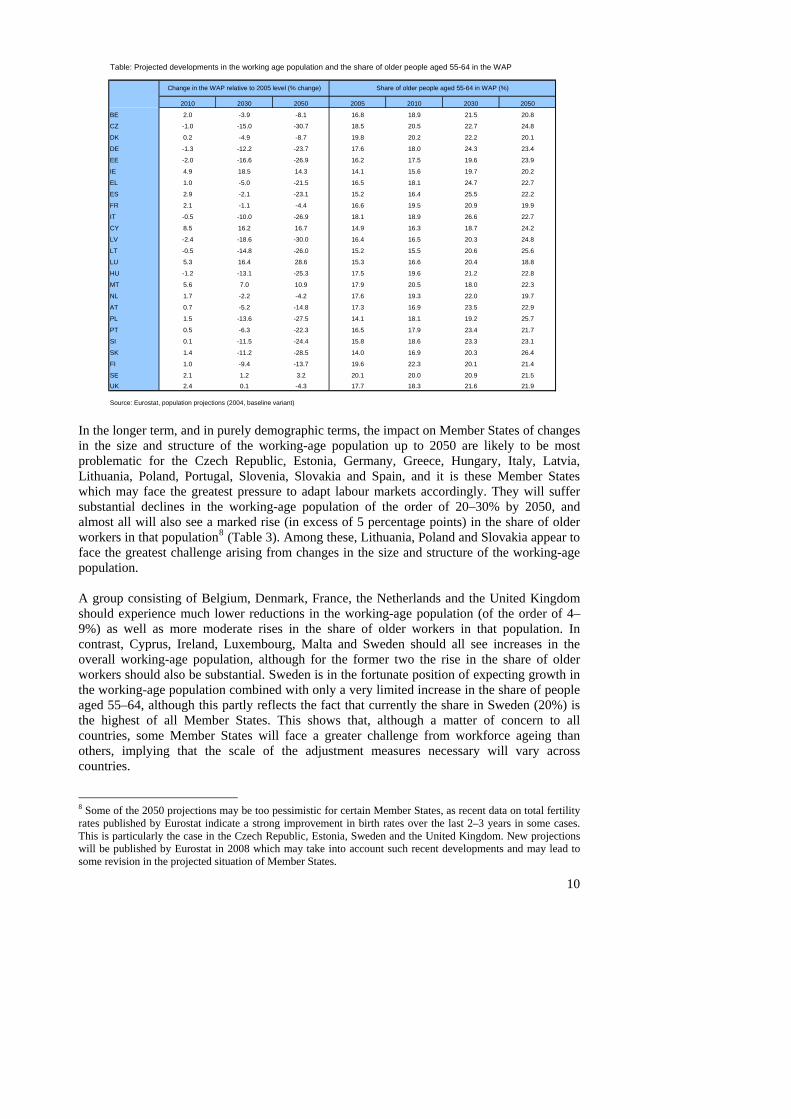
Table: Projected developments in the working age population and the share of older people aged 55-64 in the WAP
BE
CZ
DK
DE
EE
IE
EL
ES
FR
IT
CY
LV
LT
LU
HU
MT
NL
AT
PL
PT
SI
SK
FI
SEUK
Sourc
2010 2030 2050 2005 2010 2030 2050
2.0 -3.9 -8.1 16.8 18.9 21.5 20.8
-1.0 -15.0 -30.7 18.5 20.5 22.7 24.8
0.2 -4.9 -8.7 19.8 20.2 22.2 20.1
-1.3 -12.2 -23.7 17.6 18.0 24.3 23.4
-2.0 -16.6 -26.9 16.2 17.5 19.6 23.9
4.9 18.5 14.3 14.1 15.6 19.7 20.2
1.0 -5.0 -21.5 16.5 18.1 24.7 22.7
2.9 -2.1 -23.1 15.2 16.4 25.5 22.2
2.1 -1.1 -4.4 16.6 19.5 20.9 19.9
-0.5 -10.0 -26.9 18.1 18.9 26.6 22.7
8.5 16.2 16.7 14.9 16.3 18.7 24.2
-2.4 -18.6 -30.0 16.4 16.5 20.3 24.8
-0.5 -14.8 -26.0 15.2 15.5 20.6 25.6
5.3 16.4 28.6 15.3 16.6 20.4 18.8
-1.2 -13.1 -25.3 17.5 19.6 21.2 22.8
5.6 7.0 10.9 17.9 20.5 18.0 22.3
1.7 -2.2 -4.2 17.6 19.3 22.0 19.7
0.7 -5.2 -14.8 17.3 16.9 23.5 22.9
1.5 -13.6 -27.5 14.1 18.1 19.2 25.7
0.5 -6.3 -22.3 16.5 17.9 23.4 21.7
0.1 -11.5 -24.4 15.8 18.6 23.3 23.1
1.4 -11.2 -28.5 14.0 16.9 20.3 26.4
1.0 -9.4 -13.7 19.6 22.3 20.1 21.4
2.1 1.2 3.2 20.1 20.0 20.9 21.52.4 0.1 -4.3 17.7 18.3 21.6 21.9
e: Eurostat, population projections (2004, baseline variant)
Change in the WAP relative to 2005 level (% change) Share of older people aged 55-64 in WAP (%)
In the longer term, and in purely demographic terms, the impact on Member States of changes in the size and structure of the working-age population up to 2050 are likely to be most problematic for the Czech Republic, Estonia, Germany, Greece, Hungary, Italy, Latvia, Lithuania, Poland, Portugal, Slovenia, Slovakia and Spain, and it is these Member States which may face the greatest pressure to adapt labour markets accordingly. They will suffer substantial declines in the working-age population of the order of 20–30% by 2050, and almost all will also see a marked rise (in excess of 5 percentage points) in the share of older workers in that population8 (Table 3). Among these, Lithuania, Poland and Slovakia appear to face the greatest challenge arising from changes in the size and structure of the working-age population. A group consisting of Belgium, Denmark, France, the Netherlands and the United Kingdom should experience much lower reductions in the working-age population (of the order of 4–9%) as well as more moderate rises in the share of older workers in that population. In contrast, Cyprus, Ireland, Luxembourg, Malta and Sweden should all see increases in the overall working-age population, although for the former two the rise in the share of older workers should also be substantial. Sweden is in the fortunate position of expecting growth in the working-age population combined with only a very limited increase in the share of people aged 55–64, although this partly reflects the fact that currently the share in Sweden (20%) is the highest of all Member States. This shows that, although a matter of concern to all countries, some Member States will face a greater challenge from workforce ageing than others, implying that the scale of the adjustment measures necessary will vary across countries. 8 Some of the 2050 projections may be too pessimistic for certain Member States, as recent data on total fertility rates published by Eurostat indicate a strong improvement in birth rates over the last 2–3 years in some cases. This is particularly the case in the Czech Republic, Estonia, Sweden and the United Kingdom. New projections will be published by Eurostat in 2008 which may take into account such recent developments and may lead to some revision in the projected situation of Member States.
10
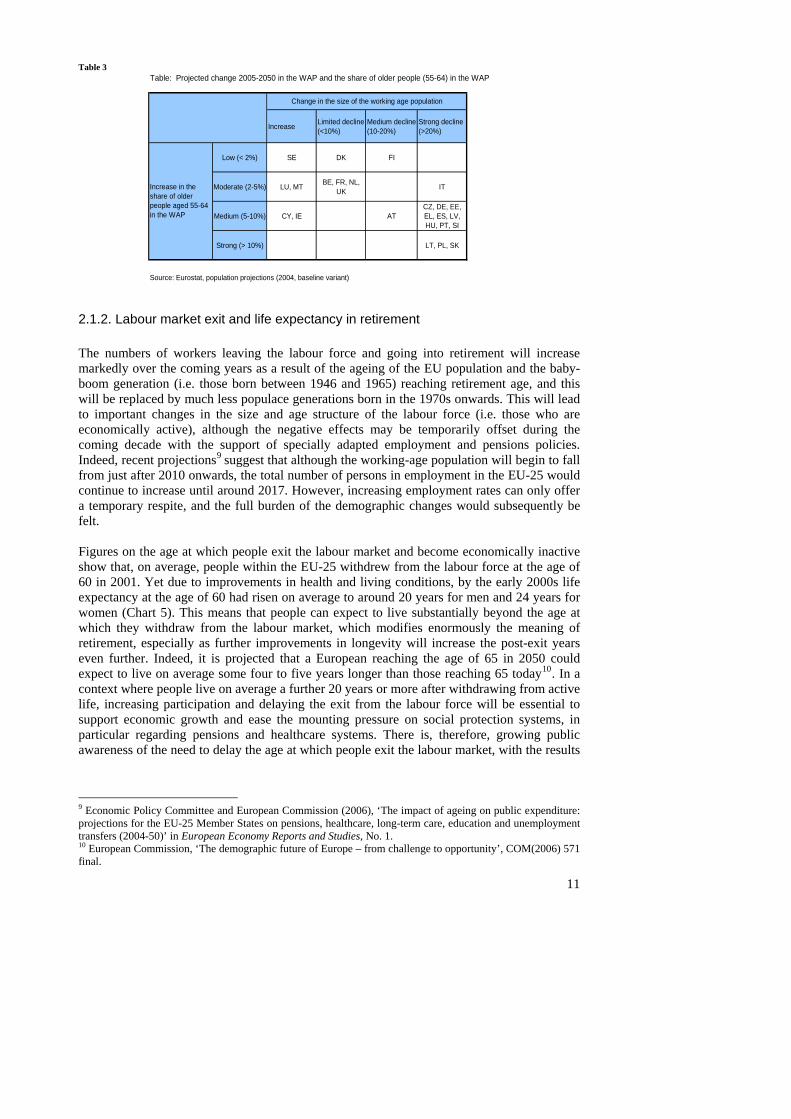
Table 3 Table: Projected change 2005-2050 in the WAP and the share of older people (55-64) in the WAP
Source:
Increase ishare ofpeople agin the W
Increase Limited decline (<10%)
Medium decline (10-20%)
Strong decline (>20%)
Low (< 2%) SE DK FI
Moderate (2-5%) LU, MT BE, FR, NL, UK IT
Medium (5-10%) CY, IE ATCZ, DE, EE, EL, ES, LV, HU, PT, SI
Strong (> 10%) LT, PL, SK
Eurostat, population projections (2004, baseline variant)
n the older
ed 55-64 AP
Change in the size of the working age population
2.1.2. Labour market exit and life expectancy in retirement The numbers of workers leaving the labour force and going into retirement will increase markedly over the coming years as a result of the ageing of the EU population and the baby-boom generation (i.e. those born between 1946 and 1965) reaching retirement age, and this will be replaced by much less populace generations born in the 1970s onwards. This will lead to important changes in the size and age structure of the labour force (i.e. those who are economically active), although the negative effects may be temporarily offset during the coming decade with the support of specially adapted employment and pensions policies. Indeed, recent projections9
suggest that although the working-age population will begin to fall from just after 2010 onwards, the total number of persons in employment in the EU-25 would continue to increase until around 2017. However, increasing employment rates can only offer a temporary respite, and the full burden of the demographic changes would subsequently be felt. Figures on the age at which people exit the labour market and become economically inactive show that, on average, people within the EU-25 withdrew from the labour force at the age of 60 in 2001. Yet due to improvements in health and living conditions, by the early 2000s life expectancy at the age of 60 had risen on average to around 20 years for men and 24 years for women (Chart 5). This means that people can expect to live substantially beyond the age at which they withdraw from the labour market, which modifies enormously the meaning of retirement, especially as further improvements in longevity will increase the post-exit years even further. Indeed, it is projected that a European reaching the age of 65 in 2050 could expect to live on average some four to five years longer than those reaching 65 today10. In a context where people live on average a further 20 years or more after withdrawing from active life, increasing participation and delaying the exit from the labour force will be essential to support economic growth and ease the mounting pressure on social protection systems, in particular regarding pensions and healthcare systems. There is, therefore, growing public awareness of the need to delay the age at which people exit the labour market, with the results
9 Economic Policy Committee and European Commission (2006), ‘The impact of ageing on public expenditure: projections for the EU-25 Member States on pensions, healthcare, long-term care, education and unemployment transfers (2004-50)’ in European Economy Reports and Studies, No. 1. 10 European Commission, ‘The demographic future of Europe – from challenge to opportunity’, COM(2006) 571 final.
11
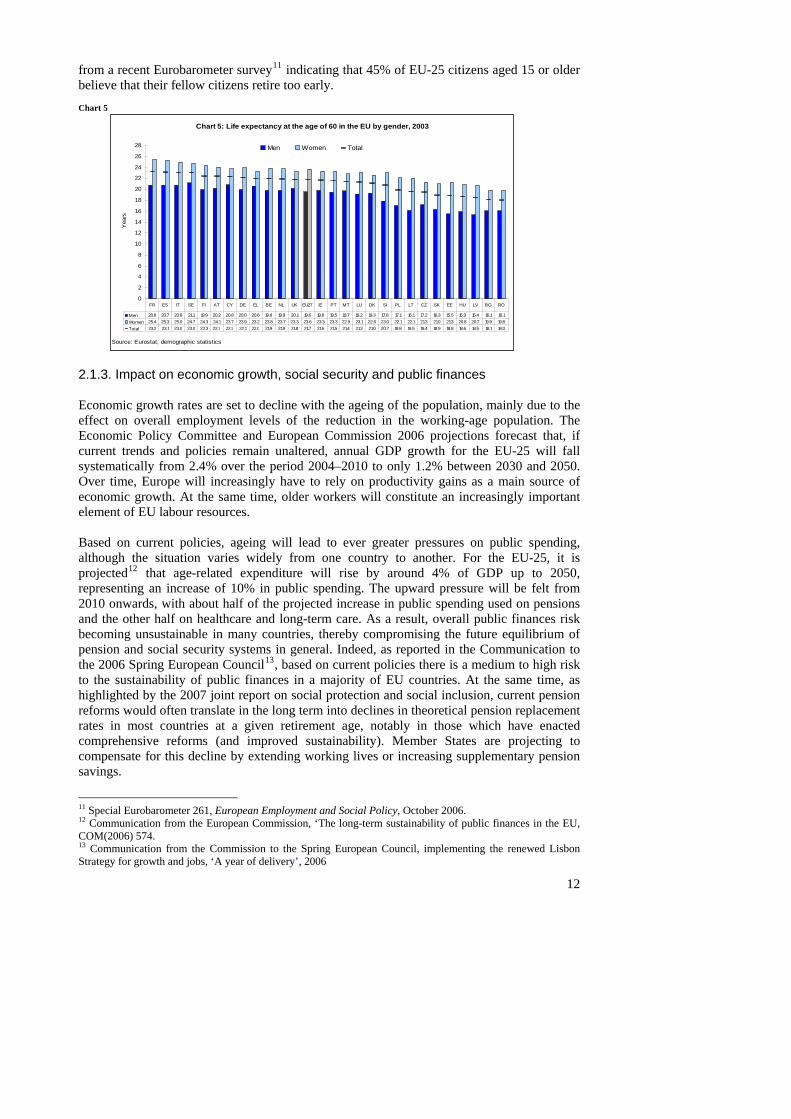
from a recent Eurobarometer survey11 indicating that 45% of EU-25 citizens aged 15 or older believe that their fellow citizens retire too early. Chart 5
Chart 5: Life expectancy at the age of 60 in the EU by gender, 2003
Sourc
Yea
rs
0
2
4
6
8
10
12
14
16
18
20
22
24
26
28
e: Eurostat, demographic statistics
Men Women Total
Men 20.8 20.7 20.8 21.1 19.9 20.2 20.8 20.0 20.6 19.8 19.8 20.1 19.6 19.8 19.5 19.7 19.2 19.3 17.8 17.1 16.1 17.2 16.3 15.5 15.9 15.4 16.1 16.1Women 25.4 25.3 25.0 24.7 24.3 24.1 23.7 23.9 23.2 23.8 23.7 23.3 23.6 23.3 23.3 22.9 23.1 22.6 23.0 22.1 22.1 21.3 21.0 21.3 20.8 20.7 19.9 19.8Total 23.2 23.1 23.0 23.0 22.3 22.3 22.3 22.1 22.0 21.9 21.9 21.8 21.7 21.6 21.5 21.4 21.3 21.0 20.7 19.8 19.5 19.4 18.9 18.8 18.6 18.5 18.1 18.0
FR ES IT SE FI AT CY DE EL BE NL UK EU27 IE PT MT LU DK SI PL LT CZ SK EE HU LV BG RO
2.1.3. Impact on economic growth, social security and public finances Economic growth rates are set to decline with the ageing of the population, mainly due to the effect on overall employment levels of the reduction in the working-age population. The Economic Policy Committee and European Commission 2006 projections forecast that, if current trends and policies remain unaltered, annual GDP growth for the EU-25 will fall systematically from 2.4% over the period 2004–2010 to only 1.2% between 2030 and 2050. Over time, Europe will increasingly have to rely on productivity gains as a main source of economic growth. At the same time, older workers will constitute an increasingly important element of EU labour resources. Based on current policies, ageing will lead to ever greater pressures on public spending, although the situation varies widely from one country to another. For the EU-25, it is projected12 that age-related expenditure will rise by around 4% of GDP up to 2050, representing an increase of 10% in public spending. The upward pressure will be felt from 2010 onwards, with about half of the projected increase in public spending used on pensions and the other half on healthcare and long-term care. As a result, overall public finances risk becoming unsustainable in many countries, thereby compromising the future equilibrium of pension and social security systems in general. Indeed, as reported in the Communication to the 2006 Spring European Council13, based on current policies there is a medium to high risk to the sustainability of public finances in a majority of EU countries. At the same time, as highlighted by the 2007 joint report on social protection and social inclusion, current pension reforms would often translate in the long term into declines in theoretical pension replacement rates in most countries at a given retirement age, notably in those which have enacted comprehensive reforms (and improved sustainability). Member States are projecting to compensate for this decline by extending working lives or increasing supplementary pension savings.
11 Special Eurobarometer 261, European Employment and Social Policy, October 2006. 12 Communication from the European Commission, ‘The long-term sustainability of public finances in the EU, COM(2006) 574. 13 Communication from the Commission to the Spring European Council, implementing the renewed Lisbon Strategy for growth and jobs, ‘A year of delivery’, 2006
12
13
In order to tackle these challenges the EU needs to implement structural reforms so as to restrain the long-term expenditure trends and to raise potential growth, notably by raising employment rates and the effective retirement age. Reforms are thus needed to redress past reductions in the effective retirement age, and to cope with the baby-boom generation retiring and the increases in the dependency ratio, so as to ensure, in particular, adequate and sustainable retirement provision. EU governments have, in general, not remained inactive and recent reforms, especially in the fields of public pensions, health, employment and education systems, have begun to pay off, as evidenced in particular by the employment rate for older workers, which has been rising rapidly since 2000.
2.2. Policy context
2.2.1. Stockholm and Barcelona targets Demographic ageing and its impact on employment in Europe is widely recognised as one of the main challenges facing the EU. This is clearly reflected in the fact that the EU has set itself two key objectives with regard to employment of older people. In 2001, the Stockholm European Council set a target that, by 2010, at least half of the EU population aged 55–64 should be in employment. This was then followed by the conclusion of the 2002 Barcelona European Council that ‘a progressive increase of about five years in the effective average age at which people stop working in the EU should be sought by 2010’, the aim being to step up efforts to allow older workers to remain longer in the labour market. In its synthesis report to the 2004 European Spring Council14, the Commission identified active ageing as one of the three priority areas for which swift action is needed to deliver the Lisbon Strategy. It highlighted that efforts to promote active ageing must be pursued vigorously, particularly in those Member States with low employment rates for older workers and low average exit ages, and called for action on four fronts combined with pension reforms: removing disincentives for workers to work longer, discouraging early retirement, stimulating lifelong learning to avoid skills obsolescence, and improving working conditions and maintaining the overall health status of the mature population. In line with this it proposed the following actions for Member States and the social partners:
Removing financial disincentives for workers to retire later and for employers to hire and keep older workers. This includes adjusting specific tax-benefit mechanisms, employment and pension legislation to reduce provisions discouraging older workers from staying longer in employment, and to discourage early exits from the labour market. Efforts to discourage early retirement should be pursued in all Member States.
Promoting access to training for all and developing lifelong learning strategies, particularly for older workers who are under-represented in training.
Improving quality in work to provide an attractive, safe and adaptable work environment throughout working life, including the provision of part-time and career breaks.
14 ‘Delivering Lisbon – Reforms for the Enlarged Union’, report from the European Commission to the Spring European Council, COM(2004) 29.
14
More recent key communications from the European Commission on the issue of Europe’s demographic future15 have again highlighted the major challenge of coping with an ageing population in Europe and its consequences for the labour market.
2.2.2. Employment Guidelines (2005 to 2008) Within the European Employment Strategy, the need to improve the labour market situation of older workers is fully taken into account in the Employment Guidelines (2005 to 2008) adopted by the Council in July 2005. These emphasise that strategies for the management of an ageing workforce must necessarily extend over several dimensions, and highlight that as part of a new intergenerational approach particular attention should be paid to promoting access to employment throughout working life. One overall aim of the guidelines is attracting and retaining more people in employment, increasing labour supply and modernising social protection systems. In this context it is emphasised that by promoting an increased labour supply in all groups, a new life-cycle approach to work and modernising social protection systems to ensure their adequacy, financial sustainability and a responsiveness to changing needs in society are all the more necessary because of the expected decline in the working-age population. The low employment rate of older workers is specifically mentioned as an issue requiring special attention and emphasis is put on the need for the right conditions to be put in place to facilitate progress in employment, including for those wishing to prolong working lives. Specific actions targeted at older people are called for under several of the guidelines. Guideline 17 – Implement employment policies aiming at full employment, improving quality and productivity at work, and strengthening social and territorial cohesion – recalls, among other things, that policies should contribute to achieving an average EU employment rate for older workers of 50% by 2010, and to reducing unemployment and inactivity. Under Guideline 18 (which concerns the promotion of a lifecycle approach to work) specific measures called for include:
- ‘support for active ageing, including appropriate working conditions, improved
(occupational) health status and adequate incentives to work and discouragement of early retirement
- ‘modern social protection systems, including pensions and healthcare, ensuring their social adequacy, financial sustainability and responsiveness to changing needs, so as to support participation and better retention in employment and longer working lives’.
Furthermore, although not specifically mentioned, older workers are also concerned by measures under several of the other guidelines. For example, Guideline 19 – Ensure inclusive labour markets, enhance work attractiveness, and make work pay for job-seekers, including disadvantaged people, and the inactive – concerns facilitating access to employment and requires breaking down barriers to the labour market by assisting with effective job searching, facilitating access to training and other active labour market measures and ensuring work pays, including through a continual review of the incentives and disincentives resulting form tax and benefits systems. Guideline 21 – Promote flexibility combined with employment
15 European Commission, ‘Confronting demographic change: a new solidarity between the generations’ COM(2005) 94 final, and ‘The demographic future of Europe – from challenge to opportunity’ COM(2006) 571 final.
15
security and reduce labour market segmentation – concerns the need to improve the adaptability of workers and enterprises to better anticipate, trigger and absorb economic and social change, and calls for employment-friendly labour costs, modern forms of work organisation and well functioning labour markets, allowing more flexibility combined with employment security. The promotion and dissemination of innovative and adaptable forms of work organisation with a view to improving quality and productivity at work (including health and safety) and support for transitions in occupational status (including training) are two of the measures highlighted. Furthermore, the measures under the guidelines which fall within the overall objective of improving human capital through better education and skills also apply to older workers. It is clearly recognised that the EU needs higher and more effective investment in human capital and lifelong learning in order to enhance access to employment for all ages, raise productivity levels and improve quality at work. In response, efficient lifelong learning strategies are called for with a view to enhancing participation in continuous and workplace training throughout the life cycle, especially for the low-skilled and older workers.
2.2.3. Active ageing The EU policy response is therefore based on a comprehensive and sustainable approach known as ‘active ageing’, which employs a range of tools beyond just retirement reforms. This recognises that in order to be able to seriously consider working longer, people must be in good physical and mental health and have good prospects of remaining so for longer, they must have access to more flexible retirement schemes and working arrangements as well as appropriate working conditions, they must have the opportunity to, and be prepared to, update and make the most of the skills they have gained, and they must have access to available employment opportunities and not be faced with discriminatory prejudices. As part of the new intergenerational approach advocated by the European Employment Strategy, it is recognised that particular attention should be paid to promoting access to employment throughout working life. In its Communication on ‘Increasing labour force participation and promoting active ageing’16, the European Commission emphasised that ‘the objective of a comprehensive strategy should be to maximise each individual’s capacity to participate over his or her whole life cycle. Prevention is the key to a successful integration and retention of people in the labour market. The aim is to ensure the positive interaction of economic, employment and social policies with the view to supporting a long-term sustainable working life in which all human resources in society are fully utilised.’ As part of this, raising the basic educational level and preventing the erosion of skills throughout adult working life are seen as key to raising participation and employment. Furthermore, the report states that ‘high employment and activity rates among the prime age group could be translated into significantly higher employment rates for older workers up to a decade later if a dynamic approach is taken to retain these workers longer in the labour market through better working arrangements and quality in work’, and that ‘appropriate incentives and services at decisive stages in life, for example the provision of childcare facilities for parents and better reconciliation between work and family responsibilities, will avoid early exits from the labour market’.
16 European Commission, ‘Increasing the employment of older workers and delaying the exit from the labour market’, COM(2004) 146 final.
As the results in the next section show, there has been a substantial improvement in the labour market situation of older people in recent years, suggesting that recent policy developments in the area of active ageing are starting to pay off.
3. Current labour market situation and recent employment trends
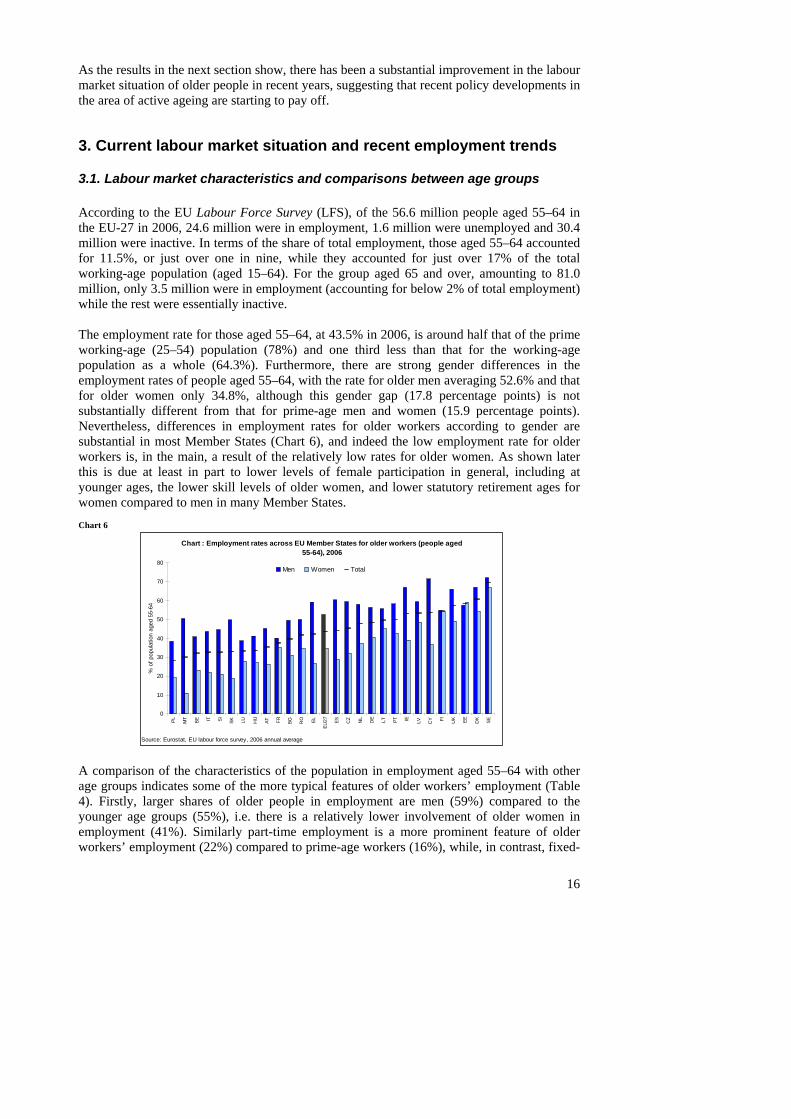
3.1. Labour market characteristics and comparisons between age groups According to the EU Labour Force Survey (LFS), of the 56.6 million people aged 55–64 in the EU-27 in 2006, 24.6 million were in employment, 1.6 million were unemployed and 30.4 million were inactive. In terms of the share of total employment, those aged 55–64 accounted for 11.5%, or just over one in nine, while they accounted for just over 17% of the total working-age population (aged 15–64). For the group aged 65 and over, amounting to 81.0 million, only 3.5 million were in employment (accounting for below 2% of total employment) while the rest were essentially inactive. The employment rate for those aged 55–64, at 43.5% in 2006, is around half that of the prime working-age (25–54) population (78%) and one third less than that for the working-age population as a whole (64.3%). Furthermore, there are strong gender differences in the employment rates of people aged 55–64, with the rate for older men averaging 52.6% and that for older women only 34.8%, although this gender gap (17.8 percentage points) is not substantially different from that for prime-age men and women (15.9 percentage points). Nevertheless, differences in employment rates for older workers according to gender are substantial in most Member States (Chart 6), and indeed the low employment rate for older workers is, in the main, a result of the relatively low rates for older women. As shown later this is due at least in part to lower levels of female participation in general, including at younger ages, the lower skill levels of older women, and lower statutory retirement ages for women compared to men in many Member States. Chart 6
Chart : Employment rates across EU Member States for older workers (people aged 55-64), 2006
0
10
20
30
40
50
60
70
80
PL MT
BE IT SI SK LU HU
AT FR BG RO EL
EU27 ES CZ NL
DE LT PT IE LV CY FI UK EE DK SE
Source: Eurostat, EU labour force survey, 2006 annual average
% o
f pop
ulat
ion
aged
55-
64
Men Women Total
A comparison of the characteristics of the population in employment aged 55–64 with other age groups indicates some of the more typical features of older workers’ employment (Table 4). Firstly, larger shares of older people in employment are men (59%) compared to the younger age groups (55%), i.e. there is a relatively lower involvement of older women in employment (41%). Similarly part-time employment is a more prominent feature of older workers’ employment (22%) compared to prime-age workers (16%), while, in contrast, fixed-
16
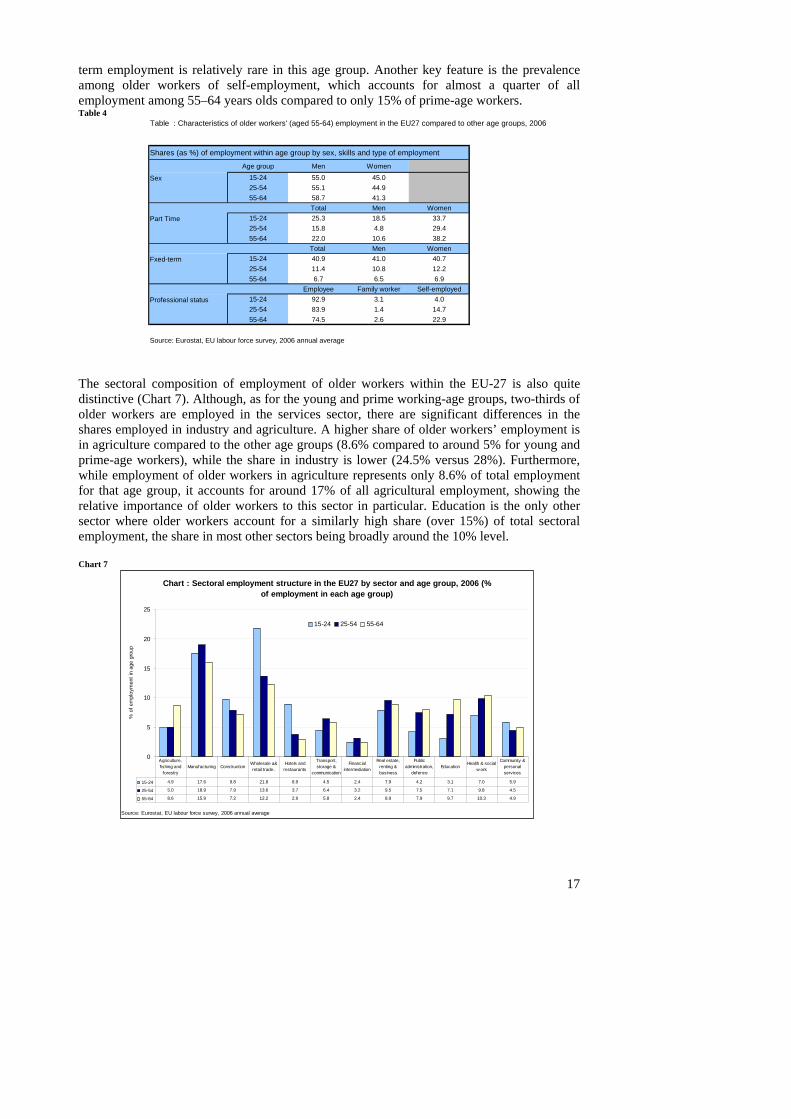
term employment is relatively rare in this age group. Another key feature is the prevalence among older workers of self-employment, which accounts for almost a quarter of all employment among 55–64 years olds compared to only 15% of prime-age workers. Table 4
Table : Characteristics of older workers' (aged 55-64) employment in the EU27 compared to other age groups, 2006
Sh
Sex
Part Tim
Fxed-ter
Professi
Source
ares (as %) of employment within age group by sex, skills and type of employment
Age group Men Women15-24 55.0 45.025-54 55.1 44.955-64 58.7 41.3
Total Men Womene 15-24 25.3 18.5 33.7
25-54 15.8 4.8 29.455-64 22.0 10.6 38.2
Total Men Womenm 15-24 40.9 41.0 40.7
25-54 11.4 10.8 12.255-64 6.7 6.5 6.9
Employee Family worker Self-employedonal status 15-24 92.9 3.1 4.0
25-54 83.9 1.4 14.755-64 74.5 2.6 22.9
: Eurostat, EU labour force survey, 2006 annual average The sectoral composition of employment of older workers within the EU-27 is also quite distinctive (Chart 7). Although, as for the young and prime working-age groups, two-thirds of older workers are employed in the services sector, there are significant differences in the shares employed in industry and agriculture. A higher share of older workers’ employment is in agriculture compared to the other age groups (8.6% compared to around 5% for young and prime-age workers), while the share in industry is lower (24.5% versus 28%). Furthermore, while employment of older workers in agriculture represents only 8.6% of total employment for that age group, it accounts for around 17% of all agricultural employment, showing the relative importance of older workers to this sector in particular. Education is the only other sector where older workers account for a similarly high share (over 15%) of total sectoral employment, the share in most other sectors being broadly around the 10% level. Chart 7
Chart : Sectoral employment structure in the EU27 by sector and age group, 2006 (% of employment in each age group)
0
5
10
15
20
25
Source: Eurostat, EU labour force survey, 2006 annual average
% o
f em
ploy
men
t in
age
grou
p
15-24 25-54 55-64
15-24 4.9 17.6 9.8 21.8 8.9 4.5 2.4 7.9 4.2 3.1 7.0 5.9
25-54 5.0 18.9 7.9 13.6 3.7 6.4 3.2 9.5 7.5 7.1 9.8 4.5
55-64 8.6 15.9 7.2 12.2 2.9 5.8 2.4 8.9 7.9 9.7 10.3 4.9
Agriculture, fishing and
forestryManufacturing Construction
Wholesale a& retail trade..
Hotels and restaurants
Transport, storage &
communication
Financial intermediation
Real estate, renting & business
Public administration,
defence Education
Health & social w ork
Community & personal services
17
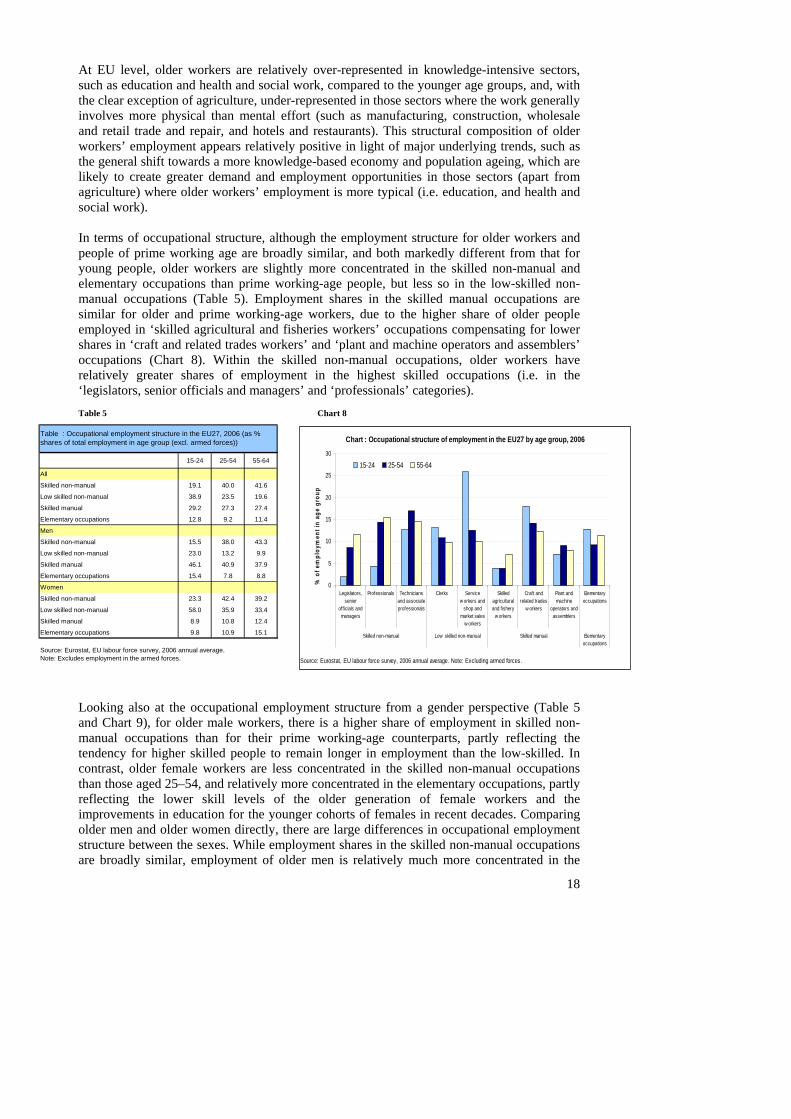
At EU level, older workers are relatively over-represented in knowledge-intensive sectors, such as education and health and social work, compared to the younger age groups, and, with the clear exception of agriculture, under-represented in those sectors where the work generally involves more physical than mental effort (such as manufacturing, construction, wholesale and retail trade and repair, and hotels and restaurants). This structural composition of older workers’ employment appears relatively positive in light of major underlying trends, such as the general shift towards a more knowledge-based economy and population ageing, which are likely to create greater demand and employment opportunities in those sectors (apart from agriculture) where older workers’ employment is more typical (i.e. education, and health and social work). In terms of occupational structure, although the employment structure for older workers and people of prime working age are broadly similar, and both markedly different from that for young people, older workers are slightly more concentrated in the skilled non-manual and elementary occupations than prime working-age people, but less so in the low-skilled non-manual occupations (Table 5). Employment shares in the skilled manual occupations are similar for older and prime working-age workers, due to the higher share of older people employed in ‘skilled agricultural and fisheries workers’ occupations compensating for lower shares in ‘craft and related trades workers’ and ‘plant and machine operators and assemblers’ occupations (Chart 8). Within the skilled non-manual occupations, older workers have relatively greater shares of employment in the highest skilled occupations (i.e. in the ‘legislators, senior officials and managers’ and ‘professionals’ categories). Table 5 Chart 8
18
15-24 25-54 55-64
All
Skilled non-manual 19.1 40.0 41.6
Low skilled non-manual 38.9 23.5 19.6
N
Table : Occupational employment structure in the EU27, 2006 (as % shares of total employment in age group (excl. armed forces))
Skilled manual 29.2 27.3 27.4
Elementary occupations 12.8 9.2 11.4
Men
Skilled non-manual 15.5 38.0 43.3
Low skilled non-manual 23.0 13.2 9.9
Skilled manual 46.1 40.9 37.9
Elementary occupations 15.4 7.8 8.8
Women
Skilled non-manual 23.3 42.4 39.2
Low skilled non-manual 58.0 35.9 33.4
Skilled manual 8.9 10.8 12.4
Elementary occupations 9.8 10.9 15.1
Source: Eurostat, EU labour force survey, 2006 annual average. ote: Excludes employment in the armed forces.
Chart : Occupational structure of employment in the EU27 by age group, 2006
0
5
10
15
20
25
30
Legislaseni
off icialsmanag
tors,or anders
Professionals Techniciansand associateprofessionals
Clerks Servicew orkers and
shop andmarket sales
w orkers
Skilledagriculturaland f ishery
w orkers
Craft andrelated trades
w orkers
Plant andmachine
operators andassemblers
Elementaryoccupations
Skilled non-manual Low skilled non-manual Skilled manual Elementaryoccupations
15-24 25-54 55-64
Source: Eurostat, EU l
% o
f em
ploy
men
t in
age
grou
p
abour force survey, 2006 annual average. Note: Excluding armed forces.
Looking also at the occupational employment structure from a gender perspective (Table 5 and Chart 9), for older male workers, there is a higher share of employment in skilled non-manual occupations than for their prime working-age counterparts, partly reflecting the tendency for higher skilled people to remain longer in employment than the low-skilled. In contrast, older female workers are less concentrated in the skilled non-manual occupations than those aged 25–54, and relatively more concentrated in the elementary occupations, partly reflecting the lower skill levels of the older generation of female workers and the improvements in education for the younger cohorts of females in recent decades. Comparing older men and older women directly, there are large differences in occupational employment structure between the sexes. While employment shares in the skilled non-manual occupations are broadly similar, employment of older men is relatively much more concentrated in the
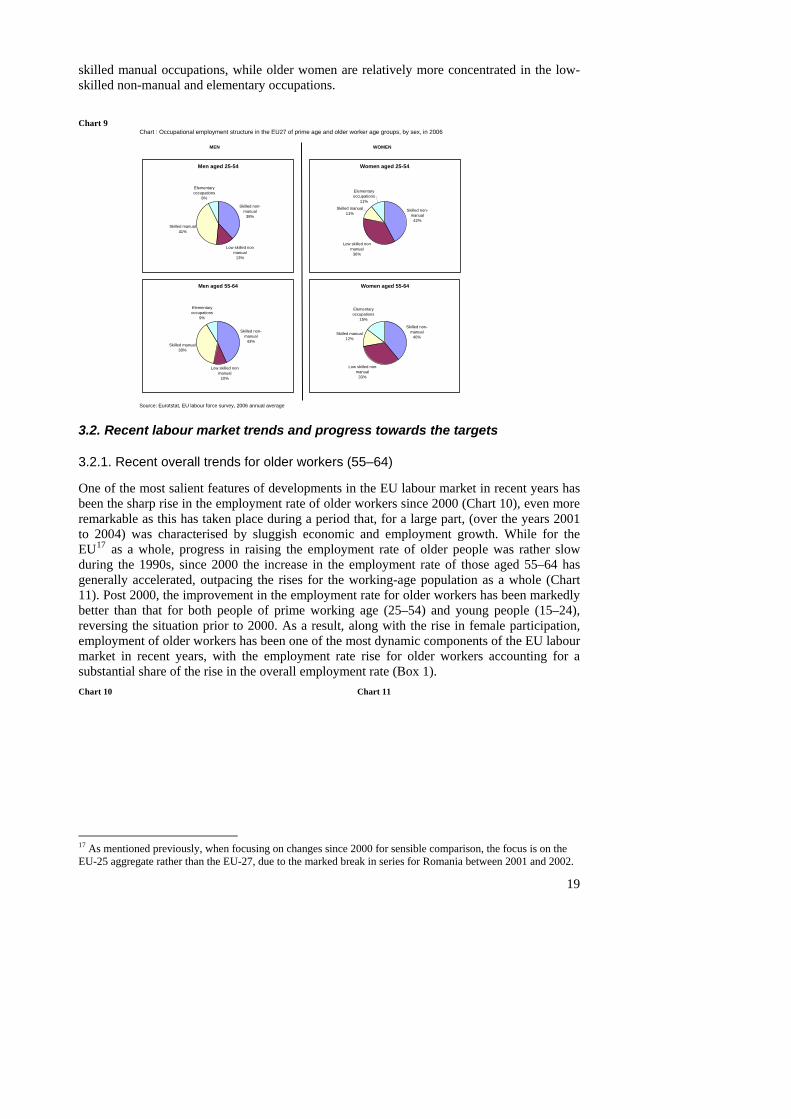
skilled manual occupations, while older women are relatively more concentrated in the low-skilled non-manual and elementary occupations.
19
Chart : Occupational employment structure in the EU27 of prime age and older worker age groups, by sex, in 2006
MEN WOMEN
Source: E
Chart 9
urotstat, EU labour force survey, 2006 annual average
Men aged 25-54
Skilled non-manual
38%
Low skilled non-manual
13%
Skilled manual41%
Elementary occupations
8%
Men aged 55-64
Skilled non-manual
43%
Low skilled non-manual
10%
Skilled manual38%
Elementary occupations
9%
Women aged 25-54
Skilled non-manual
42%
Low skilled non-manual
36%
Skilled manual11%
Elementary occupations
11%
Women aged 55-64
Skilled non-manual
40%
Low skilled non-manual
33%
Skilled manual12%
Elementary occupations
15%
3.2. Recent labour market trends and progress towards the targets
3.2.1. Recent overall trends for older workers (55–64)
One of the most salient features of developments in the EU labour market in recent years has been the sharp rise in the employment rate of older workers since 2000 (Chart 10), even more remarkable as this has taken place during a period that, for a large part, (over the years 2001 to 2004) was characterised by sluggish economic and employment growth. While for the EU17 as a whole, progress in raising the employment rate of older people was rather slow during the 1990s, since 2000 the increase in the employment rate of those aged 55–64 has generally accelerated, outpacing the rises for the working-age population as a whole (Chart 11). Post 2000, the improvement in the employment rate for older workers has been markedly better than that for both people of prime working age (25–54) and young people (15–24), reversing the situation prior to 2000. As a result, along with the rise in female participation, employment of older workers has been one of the most dynamic components of the EU labour market in recent years, with the employment rate rise for older workers accounting for a substantial share of the rise in the overall employment rate (Box 1). Chart 10 Chart 11
17 As mentioned previously, when focusing on changes since 2000 for sensible comparison, the focus is on the EU-25 aggregate rather than the EU-27, due to the marked break in series for Romania between 2001 and 2002.
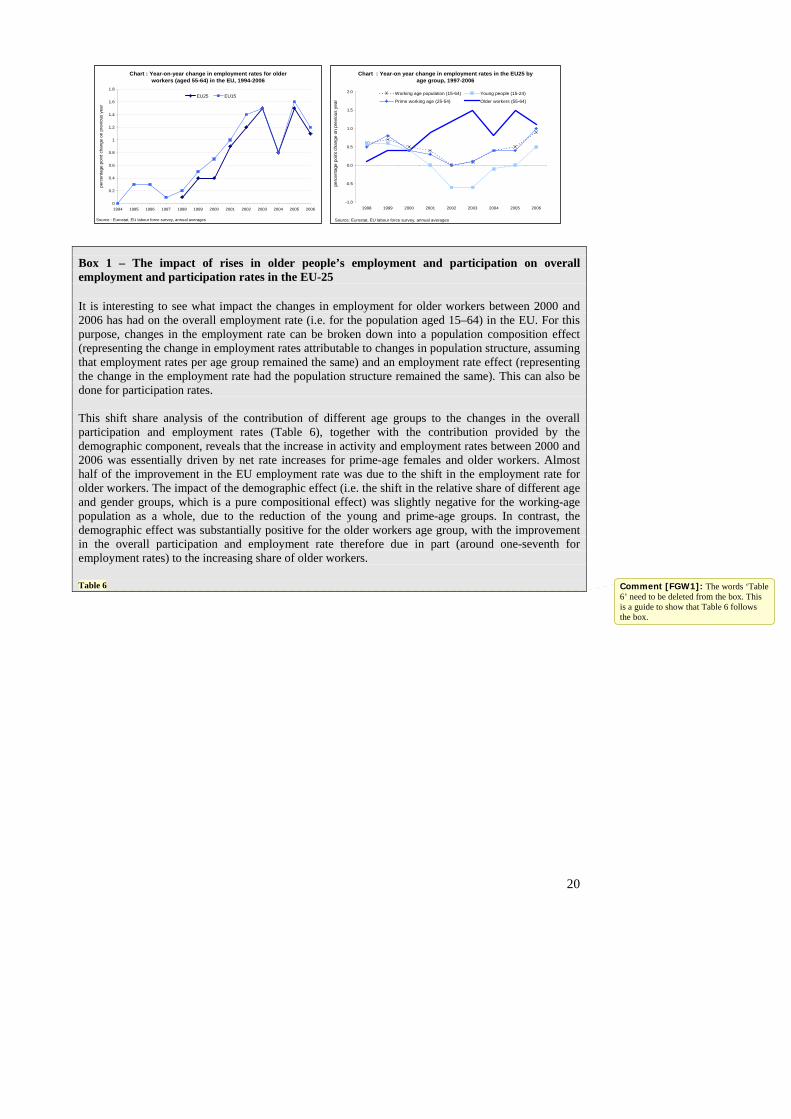
Chart : Year-on-year change in employment rates for older workers (aged 55-64) in the EU, 1994-2006
0
0.2
0.4
0.6
0.8
1
1.2
1.4
1.6
1.8
1994 1995 1996 1997 1998 1999 2000 2001 2002 2003 2004 2005 2006
rce : Eurostat, EU labour force survey, annual averagesSou
perc
enta
ge p
oint
cha
nge
on p
revi
ous
year
EU25 EU15
Chart : Year-on year change in employment rates in the EU25 by age group, 1997-2006
-1.0
-0.5
0.0
0.5
1.0
1.5
2.0
1998 1999 2000 2001 2002 2003 2004 2005 2006
Source: Eurostat, EU labour force survey, annual averages
perc
enta
ge p
oint
cha
nge
on p
revi
ous
year
Working age population (15-64) Young people (15-24)
Prime working age (25-54) Older workers (55-64)
Box 1 – The impact of rises in older people’s employment and participation on overall employment and participation rates in the EU-25 It is interesting to see what impact the changes in employment for older workers between 2000 and 2006 has had on the overall employment rate (i.e. for the population aged 15–64) in the EU. For this purpose, changes in the employment rate can be broken down into a population composition effect (representing the change in employment rates attributable to changes in population structure, assuming that employment rates per age group remained the same) and an employment rate effect (representing the change in the employment rate had the population structure remained the same). This can also be done for participation rates. This shift share analysis of the contribution of different age groups to the changes in the overall participation and employment rates (Table 6), together with the contribution provided by the demographic component, reveals that the increase in activity and employment rates between 2000 and 2006 was essentially driven by net rate increases for prime-age females and older workers. Almost half of the improvement in the EU employment rate was due to the shift in the employment rate for older workers. The impact of the demographic effect (i.e. the shift in the relative share of different age and gender groups, which is a pure compositional effect) was slightly negative for the working-age population as a whole, due to the reduction of the young and prime-age groups. In contrast, the demographic effect was substantially positive for the older workers age group, with the improvement in the overall participation and employment rate therefore due in part (around one-seventh for employment rates) to the increasing share of older workers. Table 6 Comment [FGW1]: The words ‘Table
6’ need to be deleted from the box. This is a guide to show that Table 6 follows the box.
20
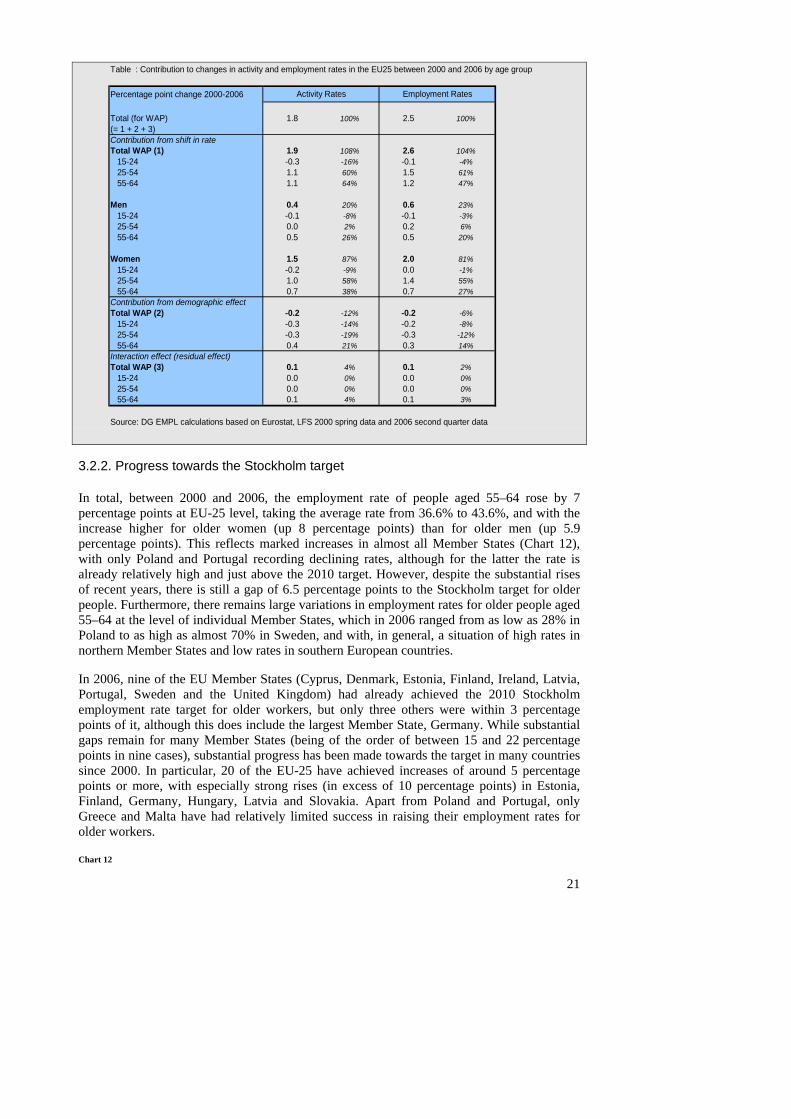
Table : Contribution to changes in activity and employment rates in the EU25 between 2000 and 2006 by age group
Perc
Tota(= 1 ContTota 15- 25- 55-
Men 15- 25- 55-
Wome 15- 25- 55-ContTota 15- 25- 55-InteTota 15- 25- 55-
Sour
entage point change 2000-2006
l (for WAP) 1.8 100% 2.5 100%+ 2 + 3)ribution from shift in ratel WAP (1) 1.9 108% 2.6 104%24 -0.3 -16% -0.1 -4%54 1.1 60% 1.5 61%64 1.1 64% 1.2 47%
0.4 20% 0.6 23%24 -0.1 -8% -0.1 -3%54 0.0 2% 0.2 6%64 0.5 26% 0.5 20%
n 1.5 87% 2.0 81%24 -0.2 -9% 0.0 -1%54 1.0 58% 1.4 55%64 0.7 38% 0.7 27%ribution from demographic effectl WAP (2) -0.2 -12% -0.2 -6%24 -0.3 -14% -0.2 -8%54 -0.3 -19% -0.3 -12%64 0.4 21% 0.3 14%
raction effect (residual effect)l WAP (3) 0.1 4% 0.1 2%24 0.0 0% 0.0 0%54 0.0 0% 0.0 0%64 0.1 4% 0.1 3%
ce: DG EMPL calculations based on Eurostat, LFS 2000 spring data and 2006 second quarter data
Activity Rates Employment Rates
3.2.2. Progress towards the Stockholm target
In total, between 2000 and 2006, the employment rate of people aged 55–64 rose by 7 percentage points at EU-25 level, taking the average rate from 36.6% to 43.6%, and with the increase higher for older women (up 8 percentage points) than for older men (up 5.9 percentage points). This reflects marked increases in almost all Member States (Chart 12), with only Poland and Portugal recording declining rates, although for the latter the rate is already relatively high and just above the 2010 target. However, despite the substantial rises of recent years, there is still a gap of 6.5 percentage points to the Stockholm target for older people. Furthermore, there remains large variations in employment rates for older people aged 55–64 at the level of individual Member States, which in 2006 ranged from as low as 28% in Poland to as high as almost 70% in Sweden, and with, in general, a situation of high rates in northern Member States and low rates in southern European countries.
In 2006, nine of the EU Member States (Cyprus, Denmark, Estonia, Finland, Ireland, Latvia, Portugal, Sweden and the United Kingdom) had already achieved the 2010 Stockholm employment rate target for older workers, but only three others were within 3 percentage points of it, although this does include the largest Member State, Germany. While substantial gaps remain for many Member States (being of the order of between 15 and 22 percentage points in nine cases), substantial progress has been made towards the target in many countries since 2000. In particular, 20 of the EU-25 have achieved increases of around 5 percentage points or more, with especially strong rises (in excess of 10 percentage points) in Estonia, Finland, Germany, Hungary, Latvia and Slovakia. Apart from Poland and Portugal, only Greece and Malta have had relatively limited success in raising their employment rates for older workers. Chart 12
21
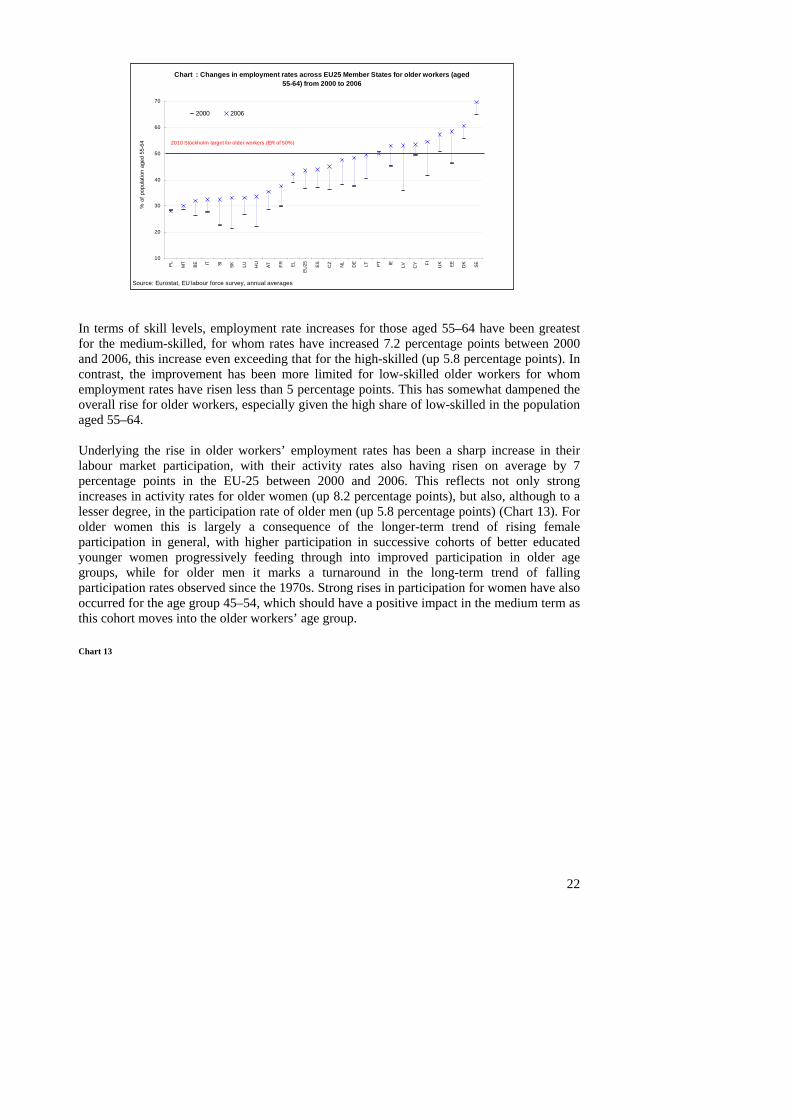
Chart : Changes in employment rates across EU25 Member States for older workers (aged 55-64) from 2000 to 2006
10
20
30
40
50
60
70
PL MT
BE IT SI SK LU HU
AT FR EL
EU25 ES CZ NL
DE LT PT IE LV CY FI UK EE DK SE
: Eurostat, EU labour force survey, annual averagesSource
% o
f pop
ulat
ion
aged
55-
64
2000 2006
2010 Stockholm target for older workers (ER of 50%)
In terms of skill levels, employment rate increases for those aged 55–64 have been greatest for the medium-skilled, for whom rates have increased 7.2 percentage points between 2000 and 2006, this increase even exceeding that for the high-skilled (up 5.8 percentage points). In contrast, the improvement has been more limited for low-skilled older workers for whom employment rates have risen less than 5 percentage points. This has somewhat dampened the overall rise for older workers, especially given the high share of low-skilled in the population aged 55–64. Underlying the rise in older workers’ employment rates has been a sharp increase in their labour market participation, with their activity rates also having risen on average by 7 percentage points in the EU-25 between 2000 and 2006. This reflects not only strong increases in activity rates for older women (up 8.2 percentage points), but also, although to a lesser degree, in the participation rate of older men (up 5.8 percentage points) (Chart 13). For older women this is largely a consequence of the longer-term trend of rising female participation in general, with higher participation in successive cohorts of better educated younger women progressively feeding through into improved participation in older age groups, while for older men it marks a turnaround in the long-term trend of falling participation rates observed since the 1970s. Strong rises in participation for women have also occurred for the age group 45–54, which should have a positive impact in the medium term as this cohort moves into the older workers’ age group. Chart 13
22
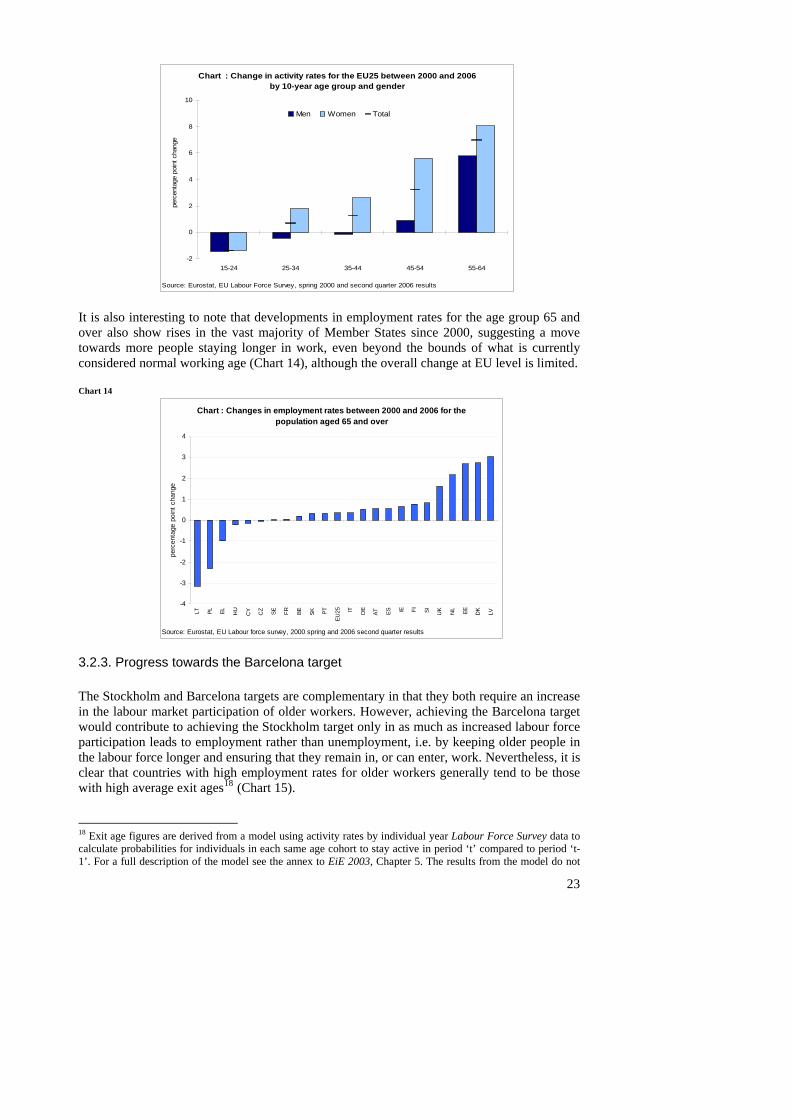
Chart : Change in activity rates for the EU25 between 2000 and 2006 by 10-year age group and gender
-2
0
2
4
6
8
10
15-24 25-34 35-44 45-54 55-64
Eurostat, EU Labour Force Survey, spring 2000 and second quarter 2006 resultsSource:
perc
enta
ge p
oint
cha
nge
Men Women Total
It is also interesting to note that developments in employment rates for the age group 65 and over also show rises in the vast majority of Member States since 2000, suggesting a move towards more people staying longer in work, even beyond the bounds of what is currently considered normal working age (Chart 14), although the overall change at EU level is limited. Chart 14
Chart : Changes in employment rates between 2000 and 2006 for the population aged 65 and over
-4
-3
-2
-1
0
1
2
3
4
Source:
perc
enta
ge p
oint
cha
nge
LT PL EL HU
CY CZ SE FR BE SK PT
EU25 IT DE
AT ES IE FI SI UK NL EE DK
LV
Eurostat, EU Labour force survey, 2000 spring and 2006 second quarter results
3.2.3. Progress towards the Barcelona target The Stockholm and Barcelona targets are complementary in that they both require an increase in the labour market participation of older workers. However, achieving the Barcelona target would contribute to achieving the Stockholm target only in as much as increased labour force participation leads to employment rather than unemployment, i.e. by keeping older people in the labour force longer and ensuring that they remain in, or can enter, work. Nevertheless, it is clear that countries with high employment rates for older workers generally tend to be those with high average exit ages18 (Chart 15).
18 Exit age figures are derived from a model using activity rates by individual year Labour Force Survey data to calculate probabilities for individuals in each same age cohort to stay active in period ‘t’ compared to period ‘t-1’. For a full description of the model see the annex to EiE 2003, Chapter 5. The results from the model do not
23
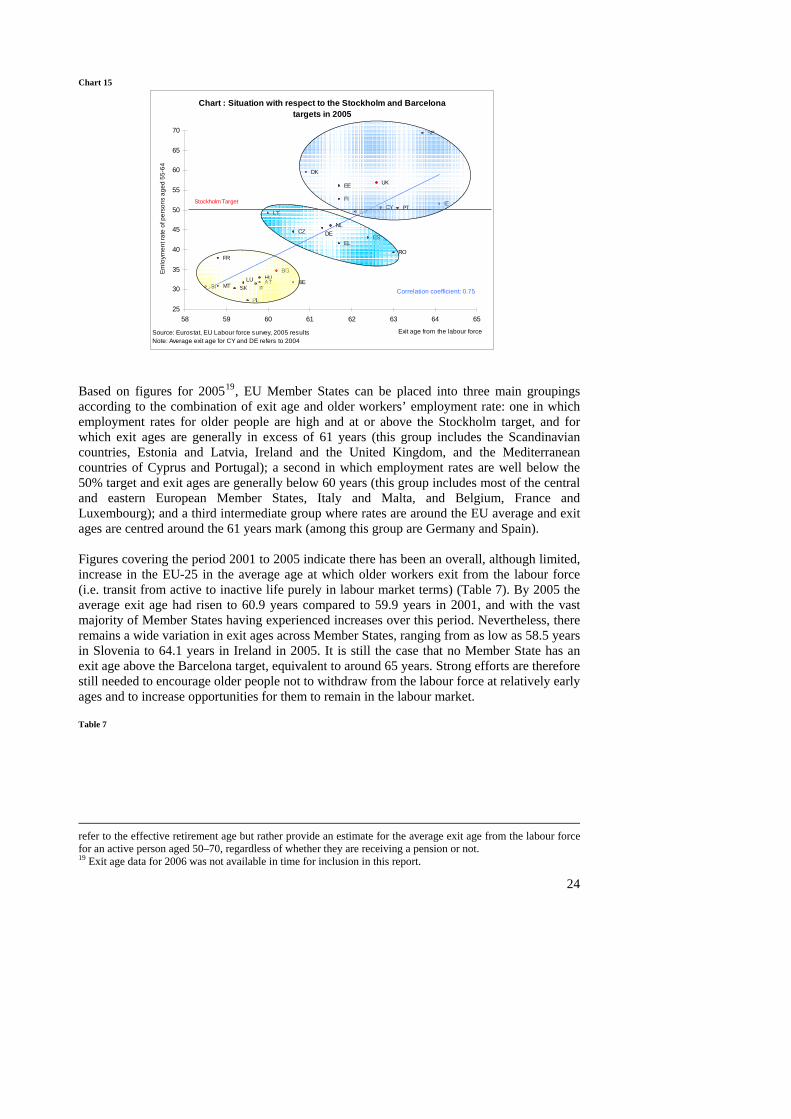
Chart 15
Chart : Situation with respect to the Stockholm and Barcelona targets in 2005
UK
SE
FI
SKSI
RO
PT
PL
AT
NL
MTHULU
LT LVCY
IT
FR
ESEL
IE
EE
DE
DK
CZ
BG
BE
25
30
35
40
45
50
55
60
65
70
58 59 60 61 62 63 64 65
Exit age from the labour force
Emlo
ymen
t rat
e of
per
sons
age
d 55
-64
Source:Note: Av
Eurostat, EU Labour force survey, 2005 resultserage exit age for CY and DE refers to 2004
Stockholm Target
Correlation coefficient: 0.75
Based on figures for 200519, EU Member States can be placed into three main groupings according to the combination of exit age and older workers’ employment rate: one in which employment rates for older people are high and at or above the Stockholm target, and for which exit ages are generally in excess of 61 years (this group includes the Scandinavian countries, Estonia and Latvia, Ireland and the United Kingdom, and the Mediterranean countries of Cyprus and Portugal); a second in which employment rates are well below the 50% target and exit ages are generally below 60 years (this group includes most of the central and eastern European Member States, Italy and Malta, and Belgium, France and Luxembourg); and a third intermediate group where rates are around the EU average and exit ages are centred around the 61 years mark (among this group are Germany and Spain). Figures covering the period 2001 to 2005 indicate there has been an overall, although limited, increase in the EU-25 in the average age at which older workers exit from the labour force (i.e. transit from active to inactive life purely in labour market terms) (Table 7). By 2005 the average exit age had risen to 60.9 years compared to 59.9 years in 2001, and with the vast majority of Member States having experienced increases over this period. Nevertheless, there remains a wide variation in exit ages across Member States, ranging from as low as 58.5 years in Slovenia to 64.1 years in Ireland in 2005. It is still the case that no Member State has an exit age above the Barcelona target, equivalent to around 65 years. Strong efforts are therefore still needed to encourage older people not to withdraw from the labour force at relatively early ages and to increase opportunities for them to remain in the labour market. Table 7
refer to the effective retirement age but rather provide an estimate for the average exit age from the labour force for an active person aged 50–70, regardless of whether they are receiving a pension or not. 19 Exit age data for 2006 was not available in time for inclusion in this report.
24
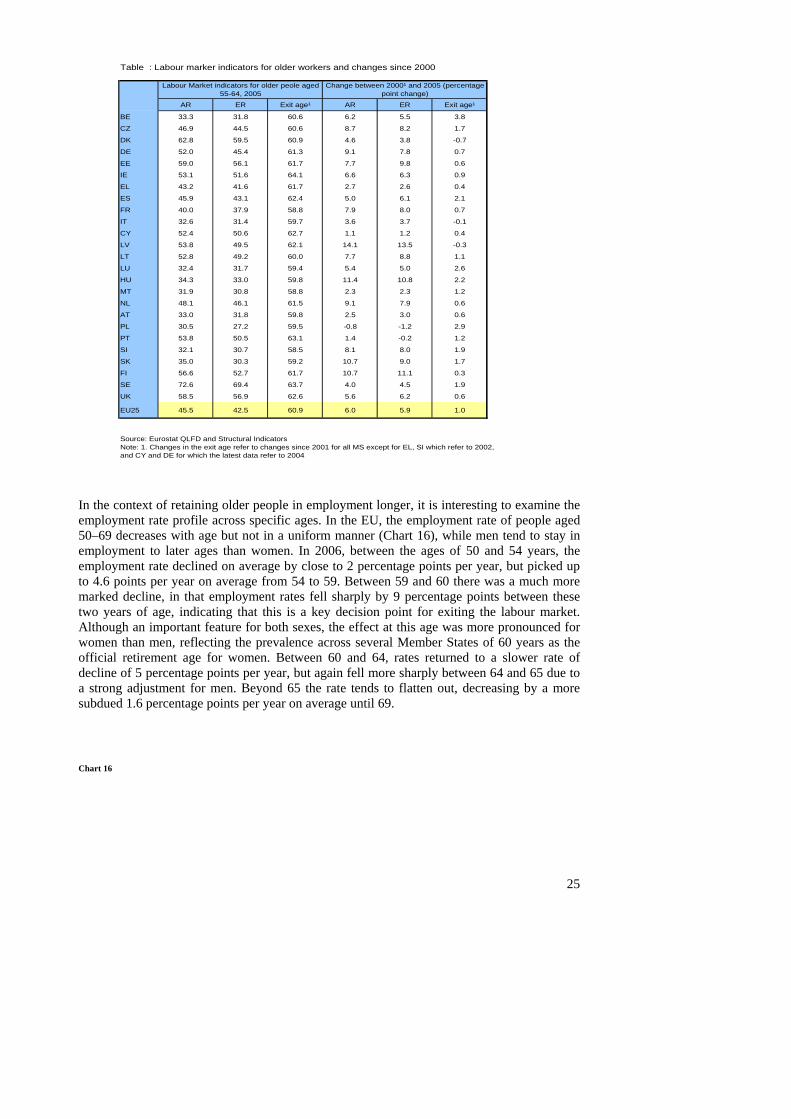
Table : Labour marker indicators for older workers and changes since 2000
BE
CZ
DK
DE
EE
IE
EL
ES
FR
IT
CY
LV
LT
LU
HU
MT
NL
AT
PL
PT
SI
SK
FI
SE
UK
EU25
Sour
and C
AR ER Exit age¹ AR ER Exit age¹
33.3 31.8 60.6 6.2 5.5 3.8
46.9 44.5 60.6 8.7 8.2 1.7
62.8 59.5 60.9 4.6 3.8 -0.7
52.0 45.4 61.3 9.1 7.8 0.7
59.0 56.1 61.7 7.7 9.8 0.6
53.1 51.6 64.1 6.6 6.3 0.9
43.2 41.6 61.7 2.7 2.6 0.4
45.9 43.1 62.4 5.0 6.1 2.1
40.0 37.9 58.8 7.9 8.0 0.7
32.6 31.4 59.7 3.6 3.7 -0.1
52.4 50.6 62.7 1.1 1.2 0.4
53.8 49.5 62.1 14.1 13.5 -0.3
52.8 49.2 60.0 7.7 8.8 1.1
32.4 31.7 59.4 5.4 5.0 2.6
34.3 33.0 59.8 11.4 10.8 2.2
31.9 30.8 58.8 2.3 2.3 1.2
48.1 46.1 61.5 9.1 7.9 0.6
33.0 31.8 59.8 2.5 3.0 0.6
30.5 27.2 59.5 -0.8 -1.2 2.9
53.8 50.5 63.1 1.4 -0.2 1.2
32.1 30.7 58.5 8.1 8.0 1.9
35.0 30.3 59.2 10.7 9.0 1.7
56.6 52.7 61.7 10.7 11.1 0.3
72.6 69.4 63.7 4.0 4.5 1.9
58.5 56.9 62.6 5.6 6.2 0.6
45.5 42.5 60.9 6.0 5.9 1.0
ce: Eurostat QLFD and Structural IndicatorsNote: 1. Changes in the exit age refer to changes since 2001 for all MS except for EL, SI which refer to 2002,
Y and DE for which the latest data refer to 2004
Labour Market indicators for older peole aged 55-64, 2005
Change between 2000¹ and 2005 (percentage point change)
In the context of retaining older people in employment longer, it is interesting to examine the employment rate profile across specific ages. In the EU, the employment rate of people aged 50–69 decreases with age but not in a uniform manner (Chart 16), while men tend to stay in employment to later ages than women. In 2006, between the ages of 50 and 54 years, the employment rate declined on average by close to 2 percentage points per year, but picked up to 4.6 points per year on average from 54 to 59. Between 59 and 60 there was a much more marked decline, in that employment rates fell sharply by 9 percentage points between these two years of age, indicating that this is a key decision point for exiting the labour market. Although an important feature for both sexes, the effect at this age was more pronounced for women than men, reflecting the prevalence across several Member States of 60 years as the official retirement age for women. Between 60 and 64, rates returned to a slower rate of decline of 5 percentage points per year, but again fell more sharply between 64 and 65 due to a strong adjustment for men. Beyond 65 the rate tends to flatten out, decreasing by a more subdued 1.6 percentage points per year on average until 69.
Chart 16
25
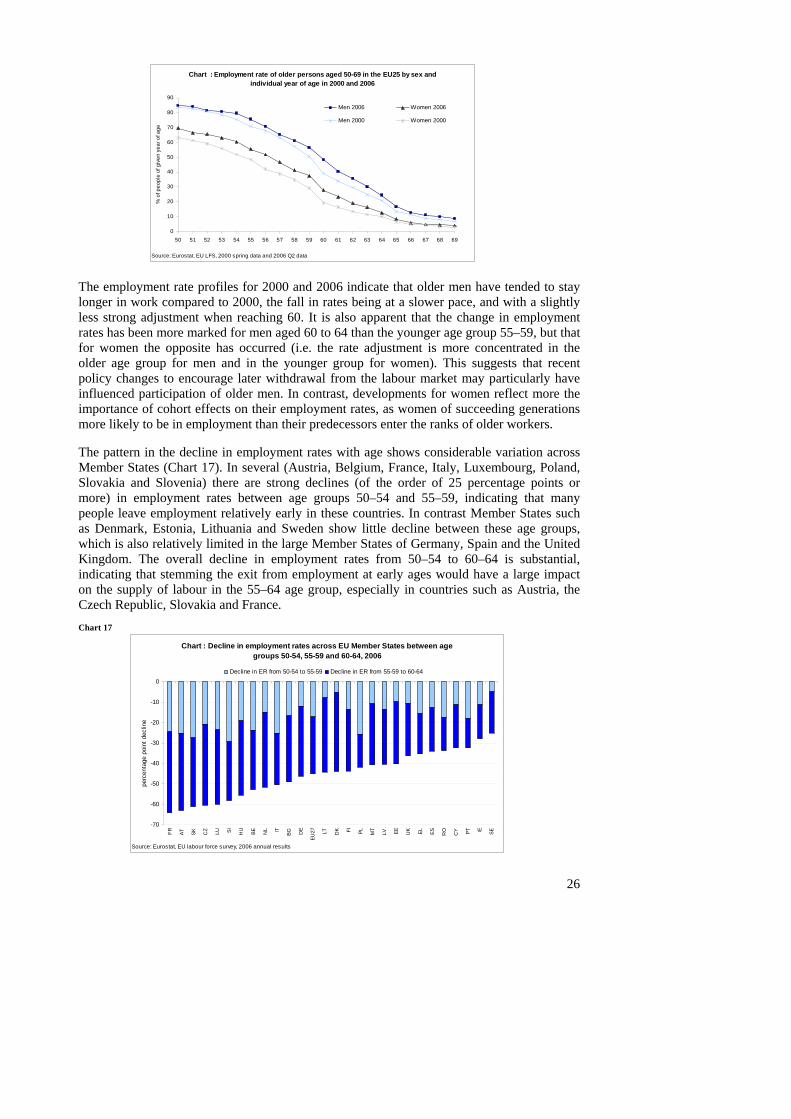
Chart : Employment rate of older persons aged 50-69 in the EU25 by sex and individual year of age in 2000 and 2006
50 51 52 53 54 55 56 57 58 59 60 61 62 63 64 65 66 67 68 69
urostat, EU LFS, 2000 spring data and 2006 Q2 data
0
10
20
30
40
50
60
70
80
90
Source: E
% o
f peo
ple
of g
iven
yea
r of a
ge
Men 2006 Women 2006
Men 2000 Women 2000
The employment rate profiles for 2000 and 2006 indicate that older men have tended to stay longer in work compared to 2000, the fall in rates being at a slower pace, and with a slightly less strong adjustment when reaching 60. It is also apparent that the change in employment rates has been more marked for men aged 60 to 64 than the younger age group 55–59, but that for women the opposite has occurred (i.e. the rate adjustment is more concentrated in the older age group for men and in the younger group for women). This suggests that recent policy changes to encourage later withdrawal from the labour market may particularly have influenced participation of older men. In contrast, developments for women reflect more the importance of cohort effects on their employment rates, as women of succeeding generations more likely to be in employment than their predecessors enter the ranks of older workers. The pattern in the decline in employment rates with age shows considerable variation across Member States (Chart 17). In several (Austria, Belgium, France, Italy, Luxembourg, Poland, Slovakia and Slovenia) there are strong declines (of the order of 25 percentage points or more) in employment rates between age groups 50–54 and 55–59, indicating that many people leave employment relatively early in these countries. In contrast Member States such as Denmark, Estonia, Lithuania and Sweden show little decline between these age groups, which is also relatively limited in the large Member States of Germany, Spain and the United Kingdom. The overall decline in employment rates from 50–54 to 60–64 is substantial, indicating that stemming the exit from employment at early ages would have a large impact on the supply of labour in the 55–64 age group, especially in countries such as Austria, the Czech Republic, Slovakia and France. Chart 17
Chart : Decline in employment rates across EU Member States between age groups 50-54, 55-59 and 60-64, 2006
-70
-60
-50
-40
-30
-20
-10
0
FR AT SK CZ LU SI HU BE NL IT BG DE
EU27 LT DK FI PL MT
LV EE UK EL ES RO
CY PT IE SE
Source: Eurostat, EU labour force survey, 2006 annual results
perc
enta
ge p
oint
dec
line
Decline in ER from 50-54 to 55-59 Decline in ER from 55-59 to 60-64
26
27
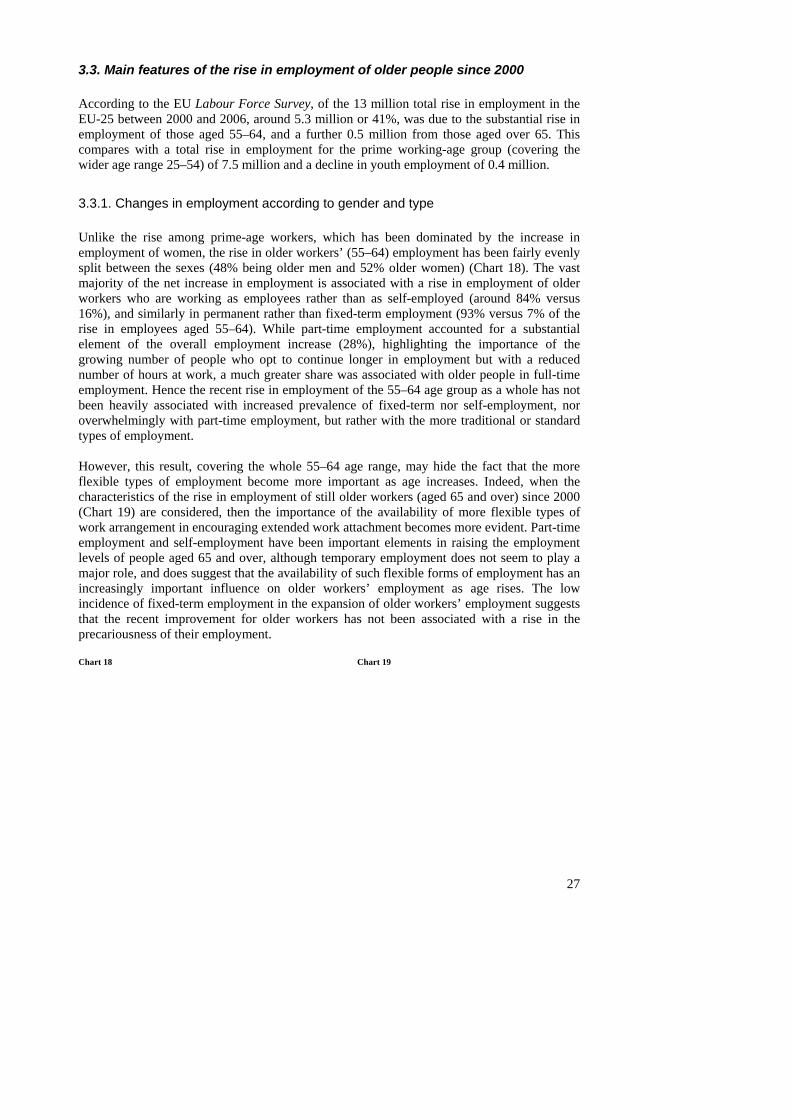
3.3. Main features of the rise in employment of older people since 2000 According to the EU Labour Force Survey, of the 13 million total rise in employment in the EU-25 between 2000 and 2006, around 5.3 million or 41%, was due to the substantial rise in employment of those aged 55–64, and a further 0.5 million from those aged over 65. This compares with a total rise in employment for the prime working-age group (covering the wider age range 25–54) of 7.5 million and a decline in youth employment of 0.4 million.
3.3.1. Changes in employment according to gender and type Unlike the rise among prime-age workers, which has been dominated by the increase in employment of women, the rise in older workers’ (55–64) employment has been fairly evenly split between the sexes (48% being older men and 52% older women) (Chart 18). The vast majority of the net increase in employment is associated with a rise in employment of older workers who are working as employees rather than as self-employed (around 84% versus 16%), and similarly in permanent rather than fixed-term employment (93% versus 7% of the rise in employees aged 55–64). While part-time employment accounted for a substantial element of the overall employment increase (28%), highlighting the importance of the growing number of people who opt to continue longer in employment but with a reduced number of hours at work, a much greater share was associated with older people in full-time employment. Hence the recent rise in employment of the 55–64 age group as a whole has not been heavily associated with increased prevalence of fixed-term nor self-employment, nor overwhelmingly with part-time employment, but rather with the more traditional or standard types of employment. However, this result, covering the whole 55–64 age range, may hide the fact that the more flexible types of employment become more important as age increases. Indeed, when the characteristics of the rise in employment of still older workers (aged 65 and over) since 2000 (Chart 19) are considered, then the importance of the availability of more flexible types of work arrangement in encouraging extended work attachment becomes more evident. Part-time employment and self-employment have been important elements in raising the employment levels of people aged 65 and over, although temporary employment does not seem to play a major role, and does suggest that the availability of such flexible forms of employment has an increasingly important influence on older workers’ employment as age rises. The low incidence of fixed-term employment in the expansion of older workers’ employment suggests that the recent improvement for older workers has not been associated with a rise in the precariousness of their employment. Chart 18 Chart 19
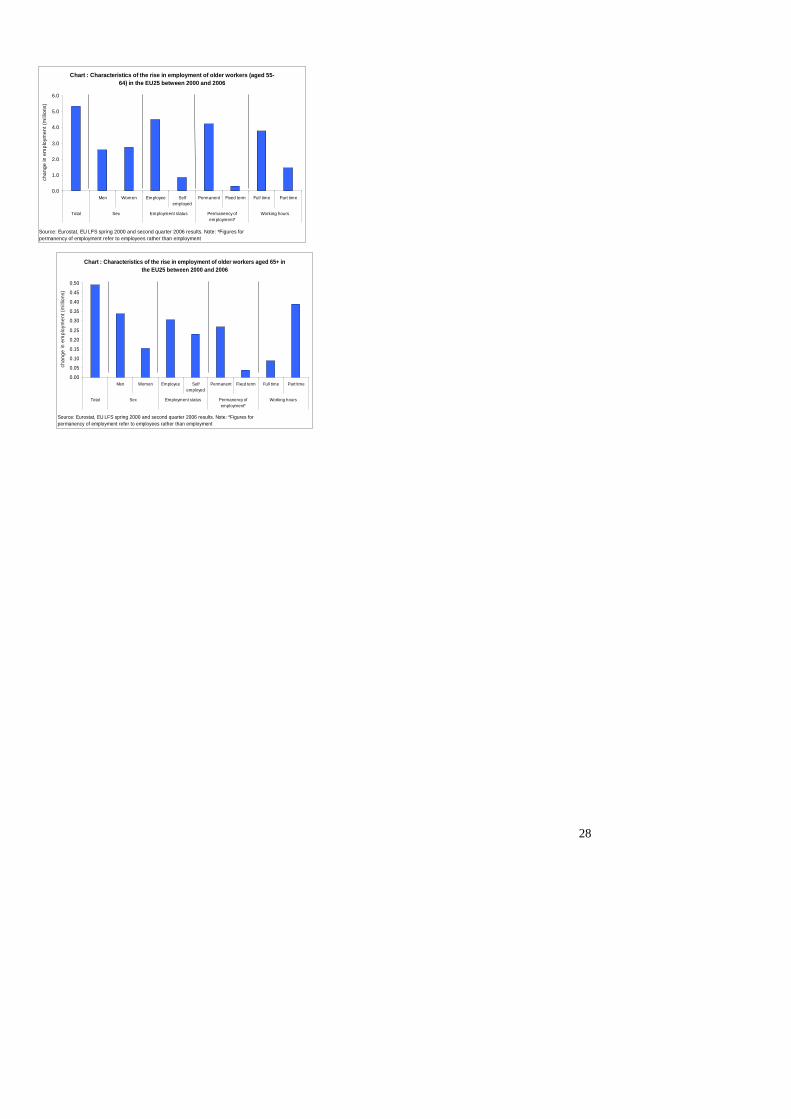
Chart : Characteristics of the rise in employment of older workers (aged 55-64) in the EU25 between 2000 and 2006
0.0
1.0
2.0
3.0
4.0
5.0
6.0
Men Women Employee Selfemployed
Permanent Fixed term Full time Part time
Total Sex Employment status Permanency ofemployment*
Working hours
Source: Eurostat, EU LFS spring 2000 and second quarter 2006 results. Note: *Figures for permanency of employment refer to employees rather than employment
chan
ge in
em
ploy
men
t (m
illion
s)
Chart : Characteristics of the rise in employment of older workers aged 65+ in
the EU25 between 2000 and 2006
0.35
0.40
0.45
0.50
0.00
0.05
0.10
0.15
0.20
0.25
0.30
Men Women Employee Selfemployed
Permanent Fixed term Full time Part time
Total Sex Employment status Permanency ofemployment*
Working hours
Sourper
chan
ge in
em
ploy
men
t (m
illion
s)
ce: Eurostat, EU LFS spring 2000 and second quarter 2006 results. Note: *Figures for manency of employment refer to employees rather than employment
28
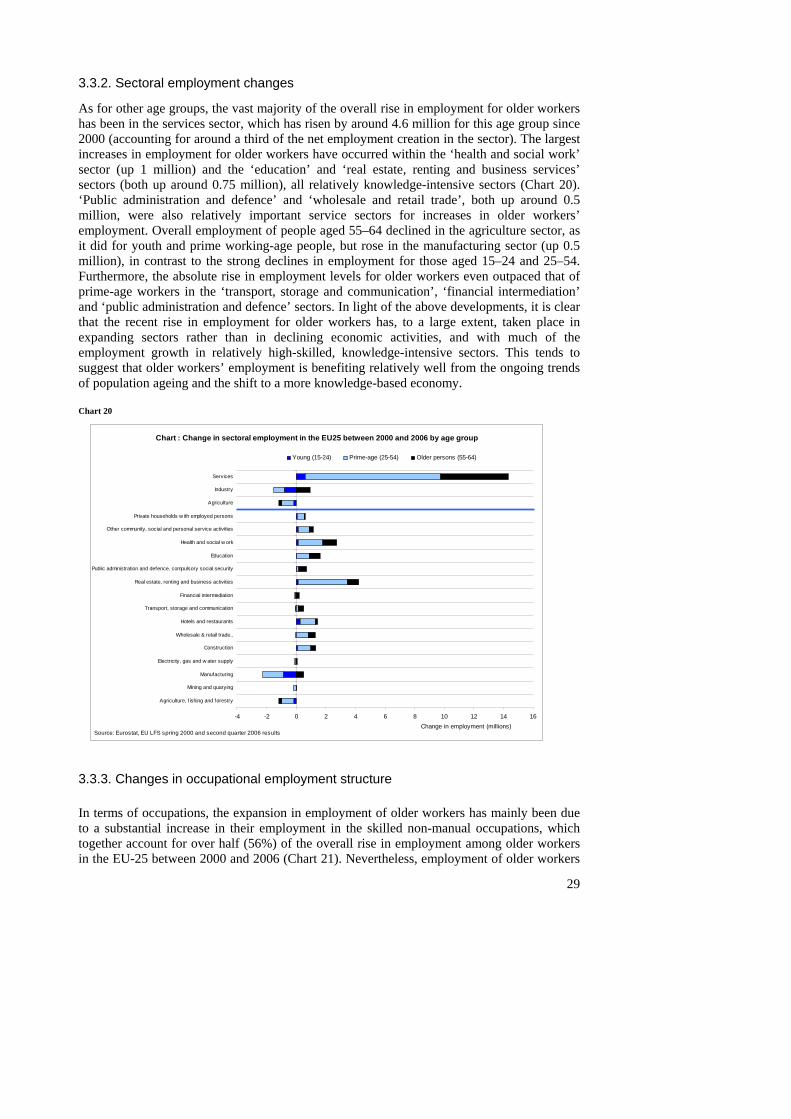
3.3.2. Sectoral employment changes
As for other age groups, the vast majority of the overall rise in employment for older workers has been in the services sector, which has risen by around 4.6 million for this age group since 2000 (accounting for around a third of the net employment creation in the sector). The largest increases in employment for older workers have occurred within the ‘health and social work’ sector (up 1 million) and the ‘education’ and ‘real estate, renting and business services’ sectors (both up around 0.75 million), all relatively knowledge-intensive sectors (Chart 20). ‘Public administration and defence’ and ‘wholesale and retail trade’, both up around 0.5 million, were also relatively important service sectors for increases in older workers’ employment. Overall employment of people aged 55–64 declined in the agriculture sector, as it did for youth and prime working-age people, but rose in the manufacturing sector (up 0.5 million), in contrast to the strong declines in employment for those aged 15–24 and 25–54. Furthermore, the absolute rise in employment levels for older workers even outpaced that of prime-age workers in the ‘transport, storage and communication’, ‘financial intermediation’ and ‘public administration and defence’ sectors. In light of the above developments, it is clear that the recent rise in employment for older workers has, to a large extent, taken place in expanding sectors rather than in declining economic activities, and with much of the employment growth in relatively high-skilled, knowledge-intensive sectors. This tends to suggest that older workers’ employment is benefiting relatively well from the ongoing trends of population ageing and the shift to a more knowledge-based economy. Chart 20
Chart : Change in sectoral employment in the EU25 between 2000 and 2006 by age group
-4 -2 0 2 4 6 8 10 12 14 16
Agriculture, f ishing and forestry
Mining and quarying
Manufacturing
Electricity, gas and w ater supply
Construction
Wholesale & retail trade..
Hotels and restaurants
Transport, storage and communication
Financial intermediation
Real estate, renting and business activities
Public administration and defence, compulsory social security
Education
Health and social w ork
Other community, social and personal service activities
Private households w ith employed persons
Agriculture
Industry
Services
Change in employment (millions)
Young (15-24) Prime-age (25-54) Older persons (55-64)
Source: Eurostat, EU LFS spring 2000 and second quarter 2006 results
3.3.3. Changes in occupational employment structure In terms of occupations, the expansion in employment of older workers has mainly been due to a substantial increase in their employment in the skilled non-manual occupations, which together account for over half (56%) of the overall rise in employment among older workers in the EU-25 between 2000 and 2006 (Chart 21). Nevertheless, employment of older workers
29
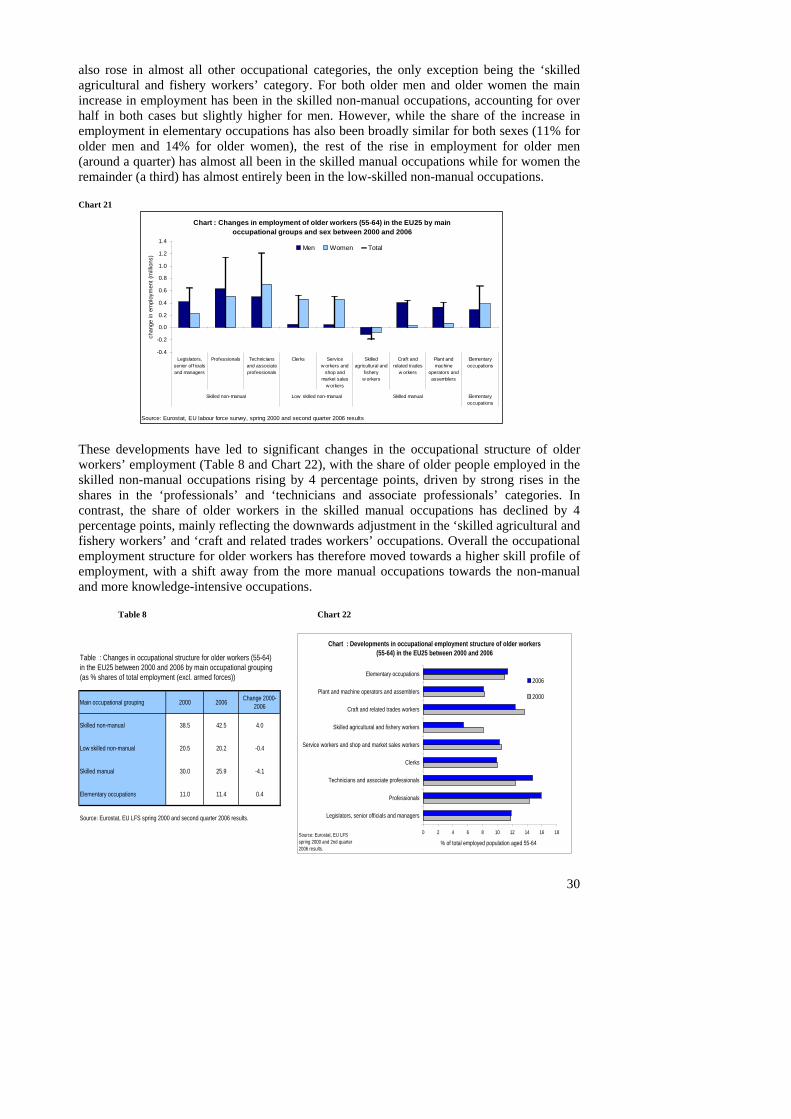
also rose in almost all other occupational categories, the only exception being the ‘skilled agricultural and fishery workers’ category. For both older men and older women the main increase in employment has been in the skilled non-manual occupations, accounting for over half in both cases but slightly higher for men. However, while the share of the increase in employment in elementary occupations has also been broadly similar for both sexes (11% for older men and 14% for older women), the rest of the rise in employment for older men (around a quarter) has almost all been in the skilled manual occupations while for women the remainder (a third) has almost entirely been in the low-skilled non-manual occupations. Chart 21
Chart : Changes in employment of older workers (55-64) in the EU25 by main occupational groups and sex between 2000 and 2006
-0.
-0.
0.
0.
0.
0.
0.
1.
1.
1.4
4
2
0
2
4
6
8
0
2
Legislators,senior officialsand managers
Professionals Techniciansand associateprofessionals
Clerks Servicew orkers and
shop andmarket sales
w orkers
Skilledagricultural and
fisheryw orkers
Craft andrelated trades
w orkers
Plant andmachine
operators andassemblers
Elementaryoccupations
Skilled non-manual Low skilled non-manual Skilled manual Elementaryoccupations
Source:
chan
ge in
em
ploy
men
t (m
illio
ns)
Eurostat, EU labour force survey, spring 2000 and second quarter 2006 results
Men Women Total
These developments have led to significant changes in the occupational structure of older workers’ employment (Table 8 and Chart 22), with the share of older people employed in the skilled non-manual occupations rising by 4 percentage points, driven by strong rises in the shares in the ‘professionals’ and ‘technicians and associate professionals’ categories. In contrast, the share of older workers in the skilled manual occupations has declined by 4 percentage points, mainly reflecting the downwards adjustment in the ‘skilled agricultural and fishery workers’ and ‘craft and related trades workers’ occupations. Overall the occupational employment structure for older workers has therefore moved towards a higher skill profile of employment, with a shift away from the more manual occupations towards the non-manual and more knowledge-intensive occupations. Table 8 Chart 22
30
Table : Changes in occupational structure for older workers (55-64) in the EU25 between 2000 and 2006 by main occupational grouping(as % shares of total employment (excl. armed forces))
Main occupational grouping 2000 2006 Change 2000-2006
Skilled non-manual 38.5 42.5 4.0
Low skilled non-manual 20.5 20.2 -0.4
Skilled manual 30.0 25.9 -4.1
Elementary occupations 11.0 11.4 0.4
Source: Eurostat, EU LFS spring 2000 and second quarter 2006 results.
Chart : Developments in occupational employment structure of older workers (55-64) in the EU25 between 2000 and 2006
0 2 4 6 8 10 12 14 16 18
Legislators, senior officials and managers
Professionals
Technicians and associate professionals
Clerks
Service workers and shop and market sales workers
Skilled agricultural and fishery workers
Craft and related trades workers
Plant and machine operators and assemblers
Elementary occupations
% of total employed population aged 55-64
2006
2000
Source: Eurostat, EU LFS spring 2000 and 2nd quarter 2006 results.
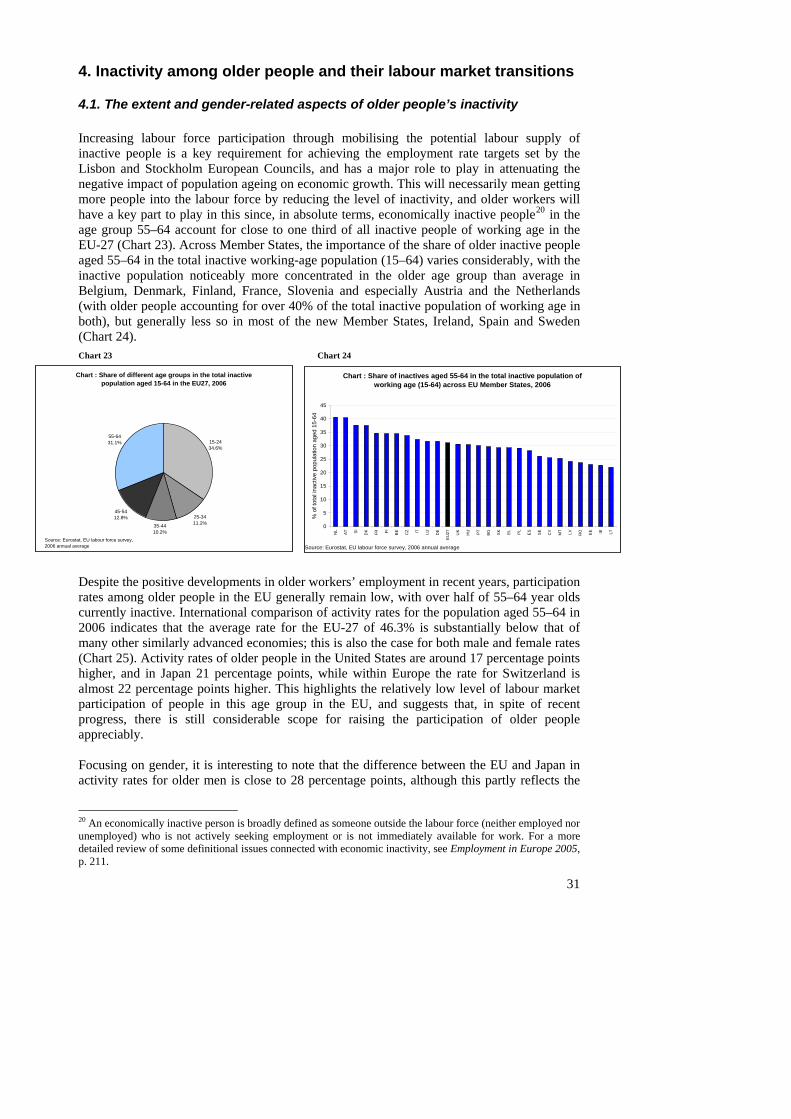
4. Inactivity among older people and their labour market transitions
4.1. The extent and gender-related aspects of older people’s inactivity Increasing labour force participation through mobilising the potential labour supply of inactive people is a key requirement for achieving the employment rate targets set by the Lisbon and Stockholm European Councils, and has a major role to play in attenuating the negative impact of population ageing on economic growth. This will necessarily mean getting more people into the labour force by reducing the level of inactivity, and older workers will have a key part to play in this since, in absolute terms, economically inactive people20 in the age group 55–64 account for close to one third of all inactive people of working age in the EU-27 (Chart 23). Across Member States, the importance of the share of older inactive people aged 55–64 in the total inactive working-age population (15–64) varies considerably, with the inactive population noticeably more concentrated in the older age group than average in Belgium, Denmark, Finland, France, Slovenia and especially Austria and the Netherlands (with older people accounting for over 40% of the total inactive population of working age in both), but generally less so in most of the new Member States, Ireland, Spain and Sweden (Chart 24).
Chart 23 Chart 24
Chart : Share of different age groups in the total inactive population aged 15-64 in the EU27, 2006
15-2434.6%
25-3411.2%35-44
10.2%
45-5412.8%
55-6431.1%
Source: Eurostat, EU labour force survey, 2006 annual average
Chart : Share of inactives aged 55-64 in the total inactive population of working age (15-64) across EU Member States, 2006
40
45
64
0
5
10
15
20
25
30
35
NL
AT SI
DK FR FI BE CZ IT LU DE
EU
27 UK
HU PT BG SK EL
PL
ES
SE
CY
MT LV RO EE IE LT
Source: Eurostat, EU labour force survey, 2006 annual average
% o
f tot
al in
activ
e po
pula
tion
aged
15-
Despite the positive developments in older workers’ employment in recent years, participation rates among older people in the EU generally remain low, with over half of 55–64 year olds currently inactive. International comparison of activity rates for the population aged 55–64 in 2006 indicates that the average rate for the EU-27 of 46.3% is substantially below that of many other similarly advanced economies; this is also the case for both male and female rates (Chart 25). Activity rates of older people in the United States are around 17 percentage points higher, and in Japan 21 percentage points, while within Europe the rate for Switzerland is almost 22 percentage points higher. This highlights the relatively low level of labour market participation of people in this age group in the EU, and suggests that, in spite of recent progress, there is still considerable scope for raising the participation of older people appreciably. Focusing on gender, it is interesting to note that the difference between the EU and Japan in activity rates for older men is close to 28 percentage points, although this partly reflects the
20 An economically inactive person is broadly defined as someone outside the labour force (neither employed nor unemployed) who is not actively seeking employment or is not immediately available for work. For a more detailed review of some definitional issues connected with economic inactivity, see Employment in Europe 2005, p. 211.
31
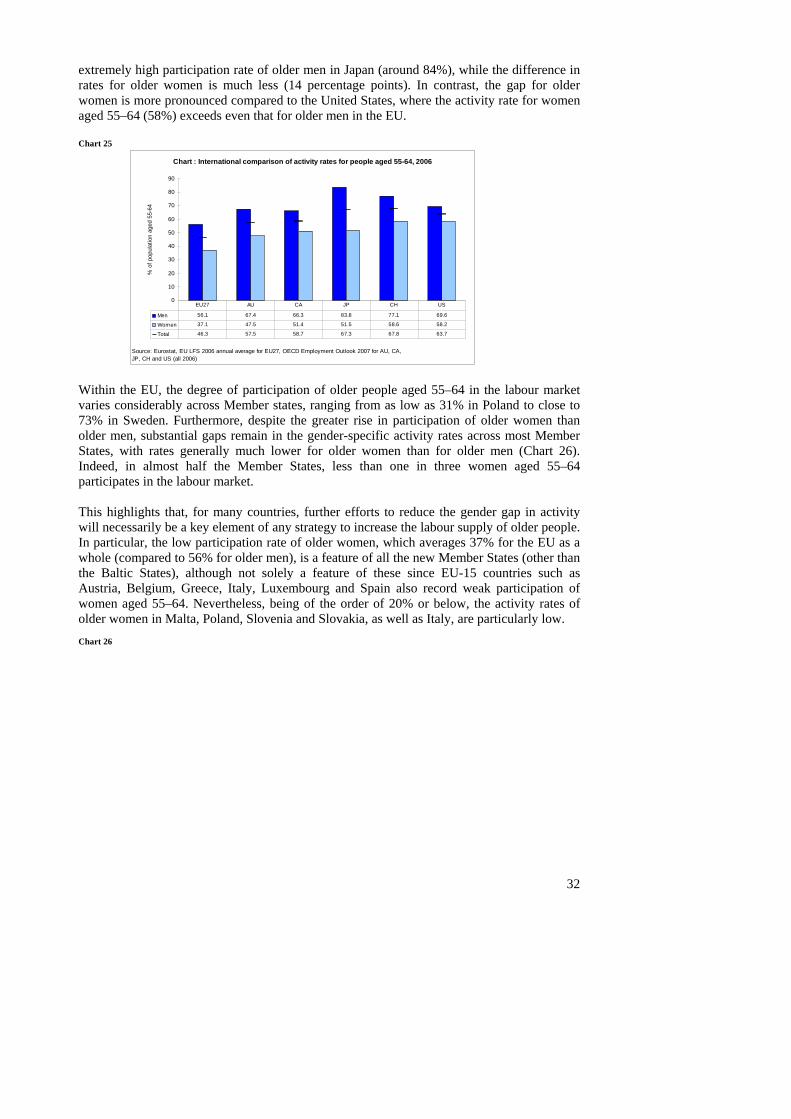
extremely high participation rate of older men in Japan (around 84%), while the difference in rates for older women is much less (14 percentage points). In contrast, the gap for older women is more pronounced compared to the United States, where the activity rate for women aged 55–64 (58%) exceeds even that for older men in the EU. Chart 25
Chart : International comparison of activity rates for people aged 55-64, 2006
SourceJP, CH an
% o
f pop
ulat
ion
aged
55-
64
0
10
20
30
40
50
60
70
80
90
: Eurostat, EU LFS 2006 annual average for EU27, OECD Employment Outlook 2007 for AU, CA, d US (all 2006)
Men 56.1 67.4 66.3 83.8 77.1 69.6
Women 37.1 47.5 51.4 51.5 58.6 58.2
Total 46.3 57.5 58.7 67.3 67.8 63.7
EU27 AU CA JP CH US
Within the EU, the degree of participation of older people aged 55–64 in the labour market varies considerably across Member states, ranging from as low as 31% in Poland to close to 73% in Sweden. Furthermore, despite the greater rise in participation of older women than older men, substantial gaps remain in the gender-specific activity rates across most Member States, with rates generally much lower for older women than for older men (Chart 26). Indeed, in almost half the Member States, less than one in three women aged 55–64 participates in the labour market. This highlights that, for many countries, further efforts to reduce the gender gap in activity will necessarily be a key element of any strategy to increase the labour supply of older people. In particular, the low participation rate of older women, which averages 37% for the EU as a whole (compared to 56% for older men), is a feature of all the new Member States (other than the Baltic States), although not solely a feature of these since EU-15 countries such as Austria, Belgium, Greece, Italy, Luxembourg and Spain also record weak participation of women aged 55–64. Nevertheless, being of the order of 20% or below, the activity rates of older women in Malta, Poland, Slovenia and Slovakia, as well as Italy, are particularly low. Chart 26
32
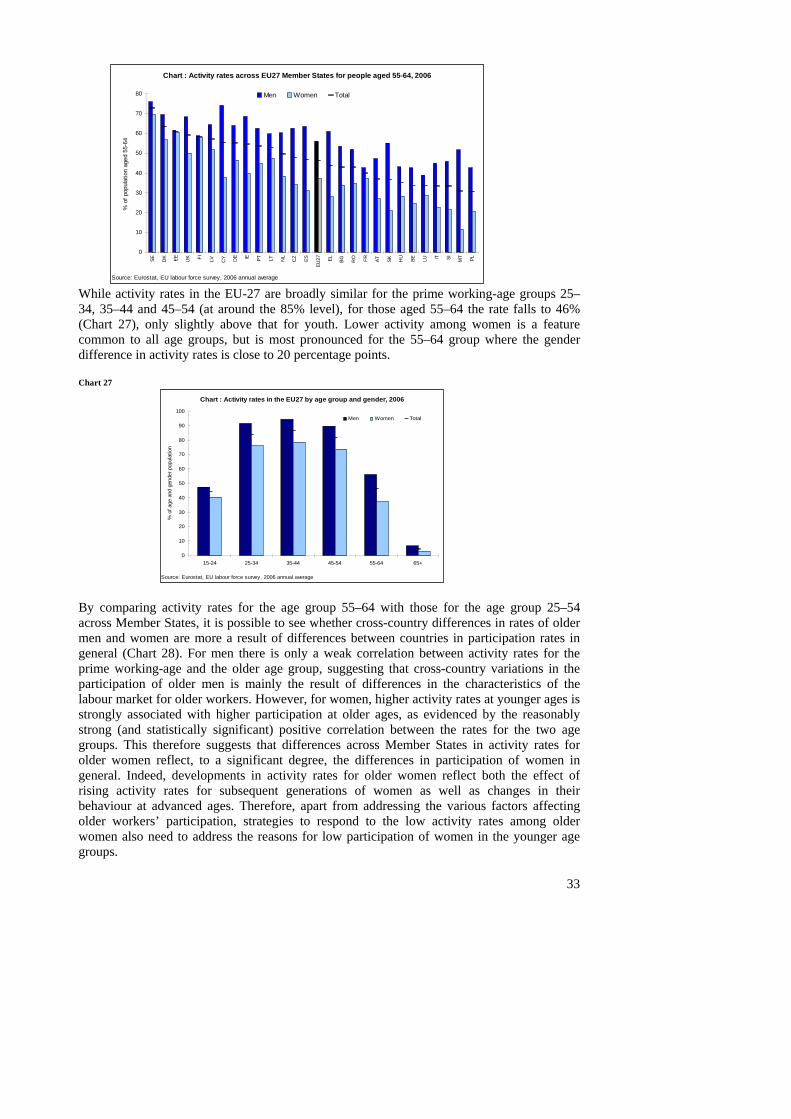
Chart : Activity rates across EU27 Member States for people aged 55-64, 2006
0
10
20
30
40
50
60
70
80
SE DK EE UK FI LV CY DE IE PT LT NL
CZ ES
EU27 EL BG RO FR AT SK HU BE LU IT SI MT PL
e: Eurostat, EU labour force survey, 2006 annual averageSourc
% o
f pop
ulat
ion
aged
55-
64
Men Women Total
While activity rates in the EU-27 are broadly similar for the prime working-age groups 25–34, 35–44 and 45–54 (at around the 85% level), for those aged 55–64 the rate falls to 46% (Chart 27), only slightly above that for youth. Lower activity among women is a feature common to all age groups, but is most pronounced for the 55–64 group where the gender difference in activity rates is close to 20 percentage points. Chart 27
Chart : Activity rates in the EU27 by age group and gender, 2006
0
10
20
30
40
50
60
70
80
90
100
Source: E
% o
f age
and
gen
der p
opul
atio
n
15-24 25-34 35-44 45-54 55-64 65+
urostat, EU labour force survey, 2006 annual average
Men Women Total
By comparing activity rates for the age group 55–64 with those for the age group 25–54 across Member States, it is possible to see whether cross-country differences in rates of older men and women are more a result of differences between countries in participation rates in general (Chart 28). For men there is only a weak correlation between activity rates for the prime working-age and the older age group, suggesting that cross-country variations in the participation of older men is mainly the result of differences in the characteristics of the labour market for older workers. However, for women, higher activity rates at younger ages is strongly associated with higher participation at older ages, as evidenced by the reasonably strong (and statistically significant) positive correlation between the rates for the two age groups. This therefore suggests that differences across Member States in activity rates for older women reflect, to a significant degree, the differences in participation of women in general. Indeed, developments in activity rates for older women reflect both the effect of rising activity rates for subsequent generations of women as well as changes in their behaviour at advanced ages. Therefore, apart from addressing the various factors affecting older workers’ participation, strategies to respond to the low activity rates among older women also need to address the reasons for low participation of women in the younger age groups.
33
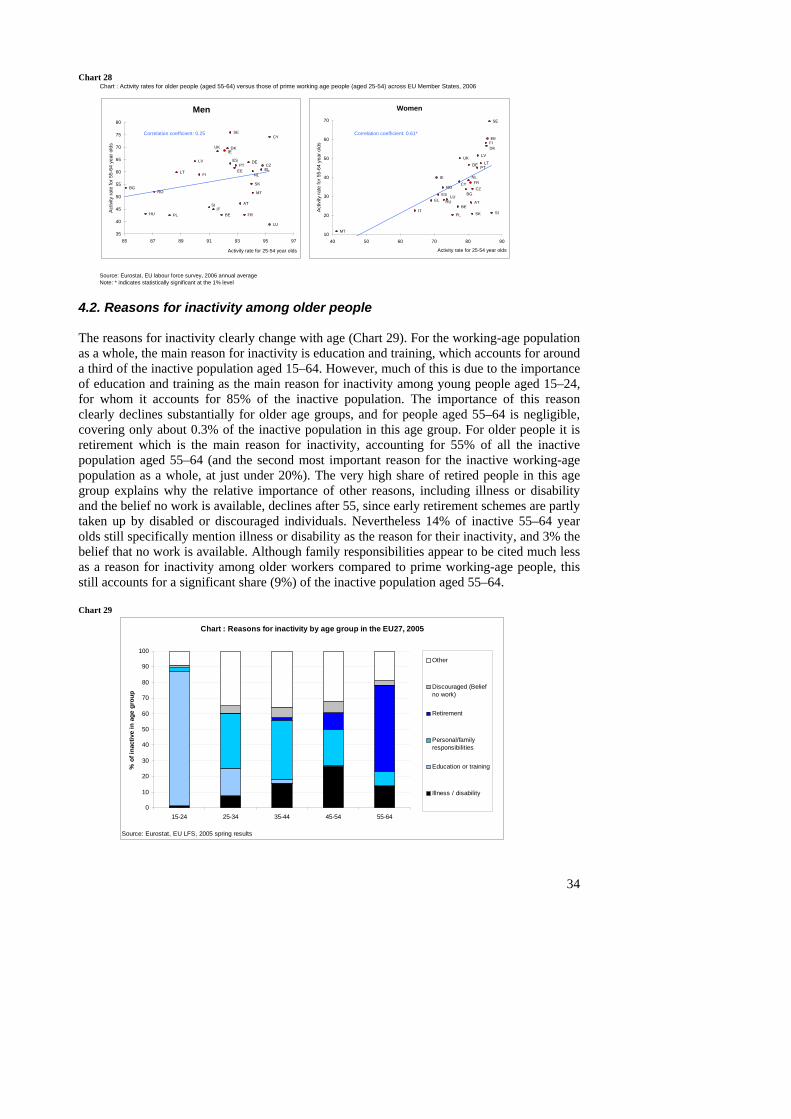
Chart : Activity rates for older people (aged 55-64) versus those of prime working age people (aged 25-54) across EU Member States, 2006
SourNote:
Chart 28
ce: Eurostat, EU labour force survey, 2006 annual average * indicates statistically significant at the 1% level
Men
BE
BG
CZ
DK
DE
EE
IE
EL
ES
FRIT
CY
LV
LT
LU
HU
MT
NL
AT
PL
PT
RO
SI
SK
FI
SE
UK
35
40
45
50
55
60
65
70
75
80
85 87 89 91 93 95 97
Activity rate for 25-54 year olds
Activ
ity ra
te fo
r 55-
64 y
ear o
lds
Correlation coefficient: 0.25
Women
BE
BGCZ
DK
DE
EE
IE
ELES
FR
IT
CY
LV
LT
LUHU
MT
NL
AT
PL
PT
RO
SISK
FI
SE
UK
10
20
30
40
50
60
70
40 50 60 70 80 90
Activity rate for 25-54 year olds
Activ
ity ra
te fo
r 55-
64 y
ear o
lds
Correlation coefficient: 0.61*
4.2. Reasons for inactivity among older people The reasons for inactivity clearly change with age (Chart 29). For the working-age population as a whole, the main reason for inactivity is education and training, which accounts for around a third of the inactive population aged 15–64. However, much of this is due to the importance of education and training as the main reason for inactivity among young people aged 15–24, for whom it accounts for 85% of the inactive population. The importance of this reason clearly declines substantially for older age groups, and for people aged 55–64 is negligible, covering only about 0.3% of the inactive population in this age group. For older people it is retirement which is the main reason for inactivity, accounting for 55% of all the inactive population aged 55–64 (and the second most important reason for the inactive working-age population as a whole, at just under 20%). The very high share of retired people in this age group explains why the relative importance of other reasons, including illness or disability and the belief no work is available, declines after 55, since early retirement schemes are partly taken up by disabled or discouraged individuals. Nevertheless 14% of inactive 55–64 year olds still specifically mention illness or disability as the reason for their inactivity, and 3% the belief that no work is available. Although family responsibilities appear to be cited much less as a reason for inactivity among older workers compared to prime working-age people, this still accounts for a significant share (9%) of the inactive population aged 55–64. Chart 29
Chart : Reasons for inactivity by age group in the EU27, 2005
0
10
20
30
40
50
60
70
80
90
100
15-24 25-34 35-44 45-54 55-64
Source: Eurostat, EU LFS, 2005 spring results
% o
f ina
ctiv
e in
age
gro
up
Other
Discouraged (Beliefno work)
Retirement
Personal/familyresponsibilities
Education or training
Illness / disability
34
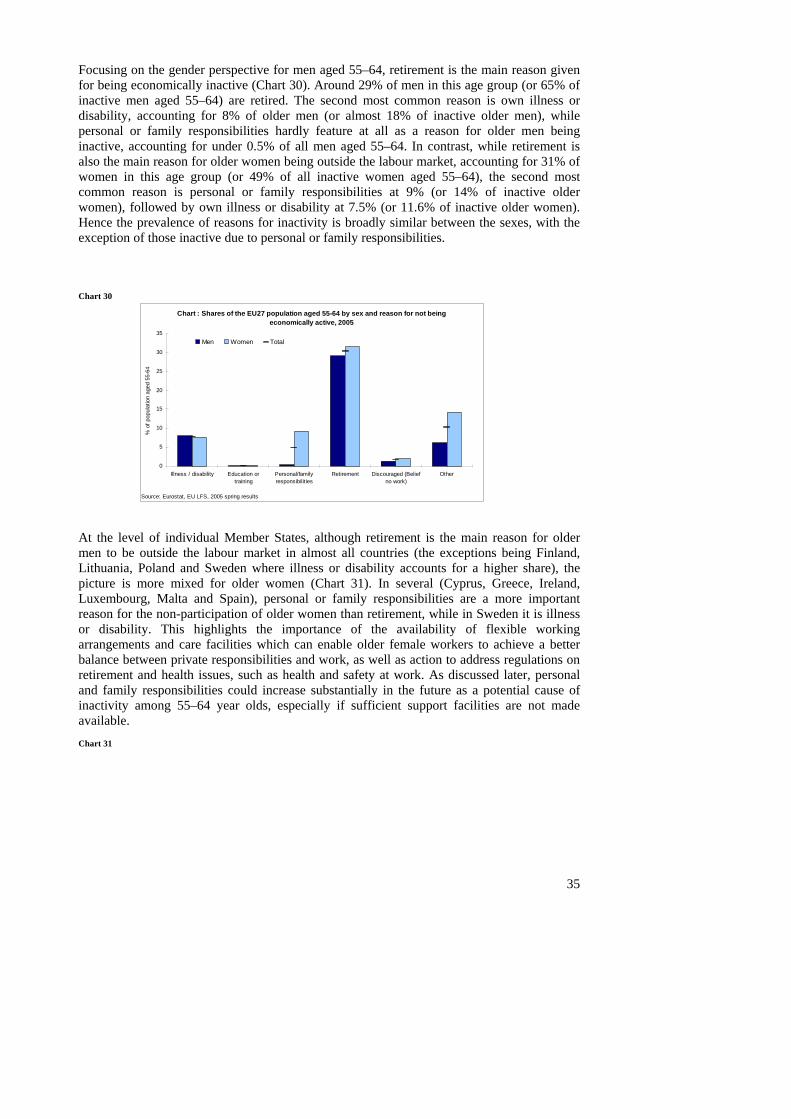
Focusing on the gender perspective for men aged 55–64, retirement is the main reason given for being economically inactive (Chart 30). Around 29% of men in this age group (or 65% of inactive men aged 55–64) are retired. The second most common reason is own illness or disability, accounting for 8% of older men (or almost 18% of inactive older men), while personal or family responsibilities hardly feature at all as a reason for older men being inactive, accounting for under 0.5% of all men aged 55–64. In contrast, while retirement is also the main reason for older women being outside the labour market, accounting for 31% of women in this age group (or 49% of all inactive women aged 55–64), the second most common reason is personal or family responsibilities at 9% (or 14% of inactive older women), followed by own illness or disability at 7.5% (or 11.6% of inactive older women). Hence the prevalence of reasons for inactivity is broadly similar between the sexes, with the exception of those inactive due to personal or family responsibilities.
Chart 30
Chart : Shares of the EU27 population aged 55-64 by sex and reason for not being economically active, 2005
0
5
10
15
20
25
30
35
Source:
% o
f pop
ulat
ion
aged
55-
64
Illness / disability Education ortraining
Personal/familyresponsibilities
Retirement Discouraged (Beliefno work)
Other
Eurostat, EU LFS, 2005 spring results
Men Women Total
At the level of individual Member States, although retirement is the main reason for older men to be outside the labour market in almost all countries (the exceptions being Finland, Lithuania, Poland and Sweden where illness or disability accounts for a higher share), the picture is more mixed for older women (Chart 31). In several (Cyprus, Greece, Ireland, Luxembourg, Malta and Spain), personal or family responsibilities are a more important reason for the non-participation of older women than retirement, while in Sweden it is illness or disability. This highlights the importance of the availability of flexible working arrangements and care facilities which can enable older female workers to achieve a better balance between private responsibilities and work, as well as action to address regulations on retirement and health issues, such as health and safety at work. As discussed later, personal and family responsibilities could increase substantially in the future as a potential cause of inactivity among 55–64 year olds, especially if sufficient support facilities are not made available. Chart 31
35
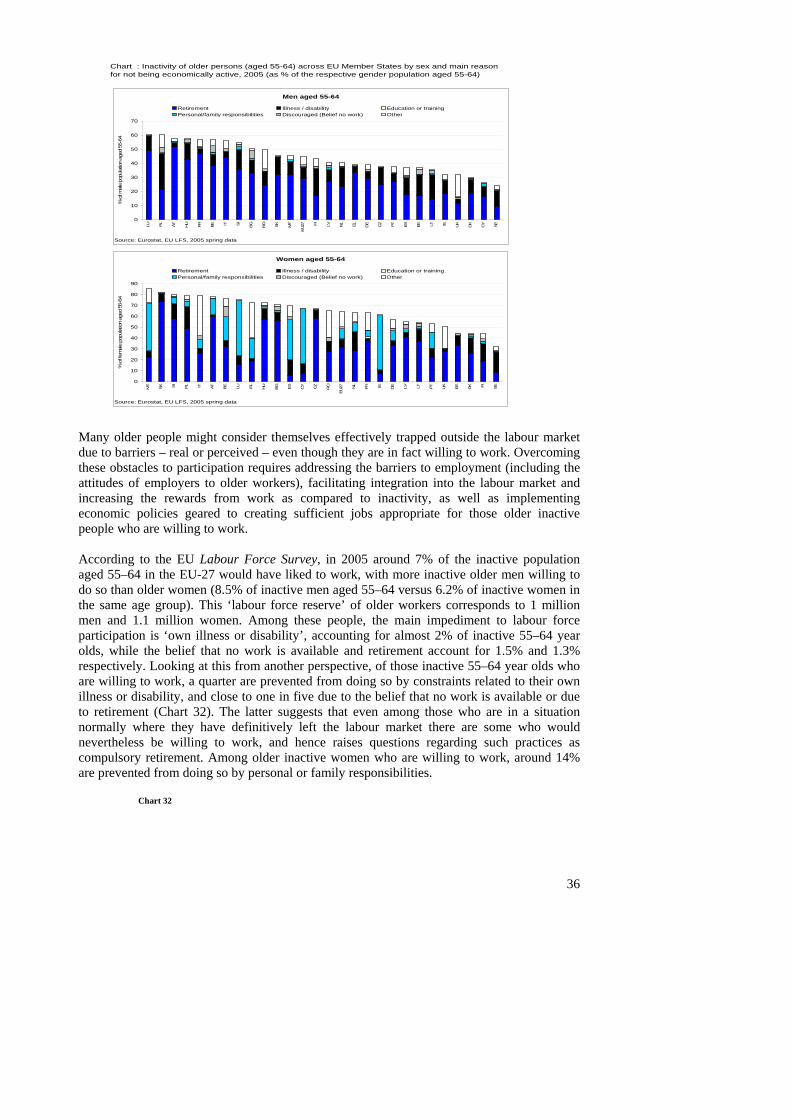
36
Chart : Inactivity of older persons (aged 55-64) across EU Member States by sex and main reason for not being economically active, 2005 (as % of the respective gender population aged 55-64)
Men aged 55-64
0
10
20
30
40
50
60
70
LU PL AT
HU FR BE IT SI
BG
RO SK
MT
EU27 FI LV NL EL DE CZ
PT
ES
EE LT IE UK
DK
CY
SE
ce: Eurostat, EU LFS, 2005 spring dataSour
% o
f mal
e po
pula
tion
aged
55-
64
Retirement Illness / disability Education or trainingPersonal/family responsibilities Discouraged (Belief no work) Other
Women aged 55-64
0
10
20
30
40
50
60
70
80
90
MT
SK SI
PL IT AT BE LU EL HU
BG ES
CY CZ
RO
EU27 NL
FR IE DE LV LT PT UK
EE
DK FI SE
ce: Eurostat, EU LFS, 2005 spring dataSour
% o
f fem
ale
popu
latio
n ag
ed 5
5-64
Retirement Illness / disability Education or trainingPersonal/family responsibilities Discouraged (Belief no work) Other
Many older people might consider themselves effectively trapped outside the labour market due to barriers – real or perceived – even though they are in fact willing to work. Overcoming these obstacles to participation requires addressing the barriers to employment (including the attitudes of employers to older workers), facilitating integration into the labour market and increasing the rewards from work as compared to inactivity, as well as implementing economic policies geared to creating sufficient jobs appropriate for those older inactive people who are willing to work. According to the EU Labour Force Survey, in 2005 around 7% of the inactive population aged 55–64 in the EU-27 would have liked to work, with more inactive older men willing to do so than older women (8.5% of inactive men aged 55–64 versus 6.2% of inactive women in the same age group). This ‘labour force reserve’ of older workers corresponds to 1 million men and 1.1 million women. Among these people, the main impediment to labour force participation is ‘own illness or disability’, accounting for almost 2% of inactive 55–64 year olds, while the belief that no work is available and retirement account for 1.5% and 1.3% respectively. Looking at this from another perspective, of those inactive 55–64 year olds who are willing to work, a quarter are prevented from doing so by constraints related to their own illness or disability, and close to one in five due to the belief that no work is available or due to retirement (Chart 32). The latter suggests that even among those who are in a situation normally where they have definitively left the labour market there are some who would nevertheless be willing to work, and hence raises questions regarding such practices as compulsory retirement. Among older inactive women who are willing to work, around 14% are prevented from doing so by personal or family responsibilities.
Chart 32
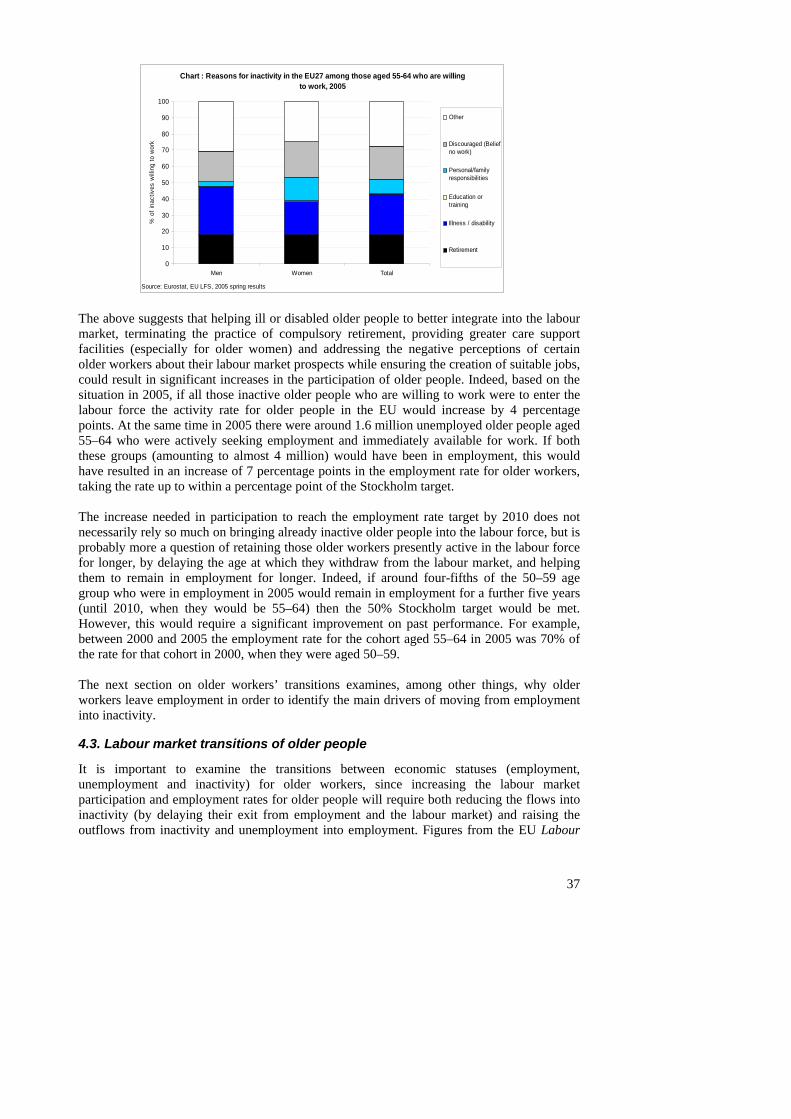
Chart : Reasons for inactivity in the EU27 among those aged 55-64 who are willing to work, 2005
0
10
20
30
40
50
60
70
80
90
100
Men Women Total
: Eurostat, EU LFS, 2005 spring resultsSource
% o
f ina
ctiv
es w
illin
g to
wor
k
Other
Discouraged (Beliefno work)
Personal/familyresponsibilities
Education ortraining
Illness / disability
Retirement
The above suggests that helping ill or disabled older people to better integrate into the labour market, terminating the practice of compulsory retirement, providing greater care support facilities (especially for older women) and addressing the negative perceptions of certain older workers about their labour market prospects while ensuring the creation of suitable jobs, could result in significant increases in the participation of older people. Indeed, based on the situation in 2005, if all those inactive older people who are willing to work were to enter the labour force the activity rate for older people in the EU would increase by 4 percentage points. At the same time in 2005 there were around 1.6 million unemployed older people aged 55–64 who were actively seeking employment and immediately available for work. If both these groups (amounting to almost 4 million) would have been in employment, this would have resulted in an increase of 7 percentage points in the employment rate for older workers, taking the rate up to within a percentage point of the Stockholm target. The increase needed in participation to reach the employment rate target by 2010 does not necessarily rely so much on bringing already inactive older people into the labour force, but is probably more a question of retaining those older workers presently active in the labour force for longer, by delaying the age at which they withdraw from the labour market, and helping them to remain in employment for longer. Indeed, if around four-fifths of the 50–59 age group who were in employment in 2005 would remain in employment for a further five years (until 2010, when they would be 55–64) then the 50% Stockholm target would be met. However, this would require a significant improvement on past performance. For example, between 2000 and 2005 the employment rate for the cohort aged 55–64 in 2005 was 70% of the rate for that cohort in 2000, when they were aged 50–59. The next section on older workers’ transitions examines, among other things, why older workers leave employment in order to identify the main drivers of moving from employment into inactivity.
4.3. Labour market transitions of older people
It is important to examine the transitions between economic statuses (employment, unemployment and inactivity) for older workers, since increasing the labour market participation and employment rates for older people will require both reducing the flows into inactivity (by delaying their exit from employment and the labour market) and raising the outflows from inactivity and unemployment into employment. Figures from the EU Labour
37
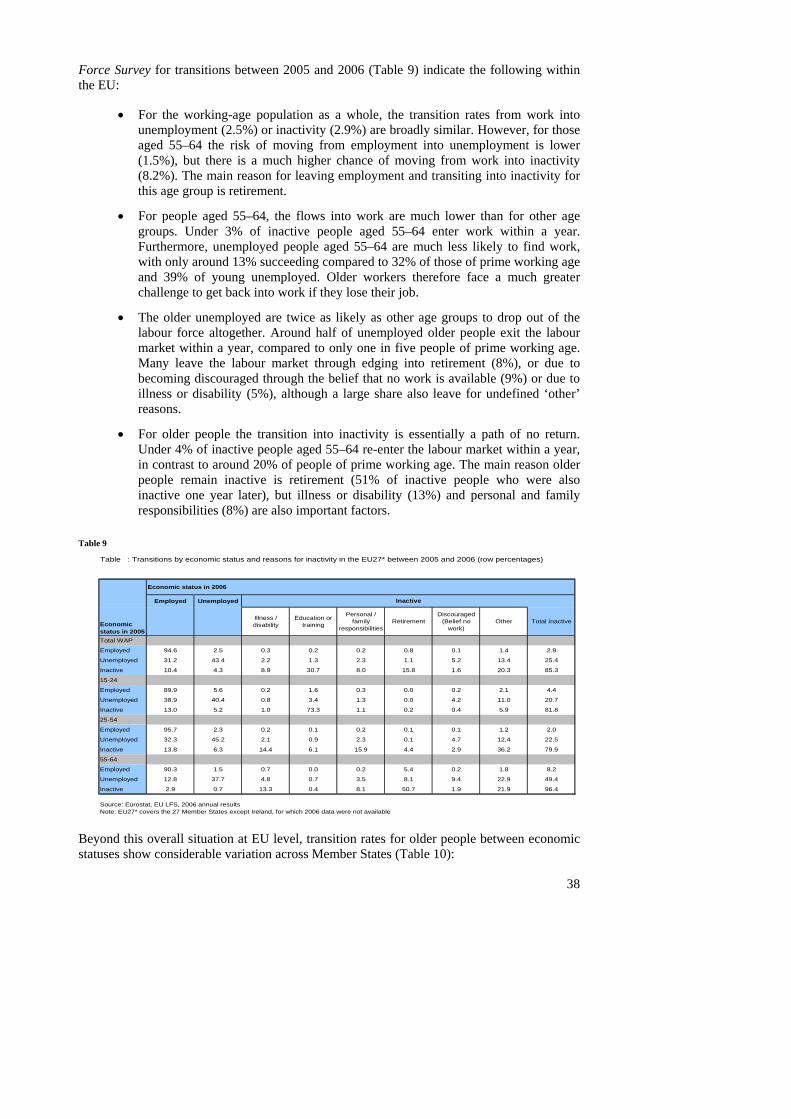
Force Survey for transitions between 2005 and 2006 (Table 9) indicate the following within the EU:
• For the working-age population as a whole, the transition rates from work into unemployment (2.5%) or inactivity (2.9%) are broadly similar. However, for those aged 55–64 the risk of moving from employment into unemployment is lower (1.5%), but there is a much higher chance of moving from work into inactivity (8.2%). The main reason for leaving employment and transiting into inactivity for this age group is retirement.
• For people aged 55–64, the flows into work are much lower than for other age groups. Under 3% of inactive people aged 55–64 enter work within a year. Furthermore, unemployed people aged 55–64 are much less likely to find work, with only around 13% succeeding compared to 32% of those of prime working age and 39% of young unemployed. Older workers therefore face a much greater challenge to get back into work if they lose their job.
• The older unemployed are twice as likely as other age groups to drop out of the labour force altogether. Around half of unemployed older people exit the labour market within a year, compared to only one in five people of prime working age. Many leave the labour market through edging into retirement (8%), or due to becoming discouraged through the belief that no work is available (9%) or due to illness or disability (5%), although a large share also leave for undefined ‘other’ reasons.
• For older people the transition into inactivity is essentially a path of no return. Under 4% of inactive people aged 55–64 re-enter the labour market within a year, in contrast to around 20% of people of prime working age. The main reason older people remain inactive is retirement (51% of inactive people who were also inactive one year later), but illness or disability (13%) and personal and family responsibilities (8%) are also important factors.
Table 9
Table : Transitions by economic status and reasons for inactivity in the EU27* between 2005 and 2006 (row percentages)
Economic status in 2006
Employed Unemployed
Economic status in 2005
Illness / disability
Education or training
Personal / family
responsibilitiesRetirement
Discouraged (Belief no
work)Other Total Inactive
Total WAP
Employed 94.6 2.5 0.3 0.2 0.2 0.8 0.1 1.4 2.9
Unemployed 31.2 43.4 2.2 1.3 2.3 1.1 5.2 13.4 25.4
Inactive 10.4 4.3 8.9 30.7 8.0 15.8 1.6 20.3 85.3
15-24
Employed 89.9 5.6 0.2 1.6 0.3 0.0 0.2 2.1 4.4
Unemployed 38.9 40.4 0.8 3.4 1.3 0.0 4.2 11.0 20.7
Inactive 13.0 5.2 1.0 73.3 1.1 0.2 0.4 5.9 81.8
25-54
Employed 95.7 2.3 0.2 0.1 0.2 0.1 0.1 1.2 2.0
Unemployed 32.3 45.2 2.1 0.9 2.3 0.1 4.7 12.4 22.5
Inactive 13.8 6.3 14.4 6.1 15.9 4.4 2.9 36.2 79.9
55-64
Employed 90.3 1.5 0.7 0.0 0.2 5.4 0.2 1.8 8.2
Unemployed 12.8 37.7 4.8 0.7 3.5 8.1 9.4 22.9 49.4
Inactive 2.9 0.7 13.3 0.4 8.1 50.7 1.9 21.9 96.4
Source: Eurostat, EU LFS, 2006 annual resultsNote: EU27* covers the 27 Member States except Ireland, for which 2006 data were not available
Inactive
Beyond this overall situation at EU level, transition rates for older people between economic statuses show considerable variation across Member States (Table 10):
38
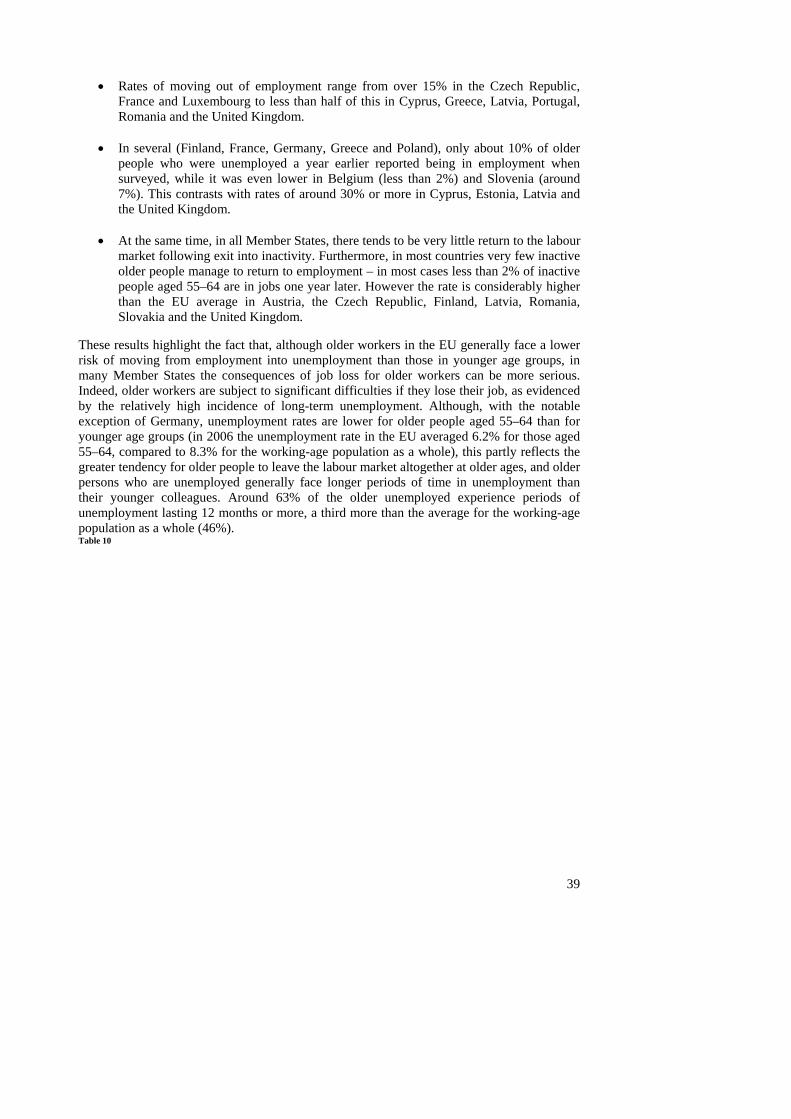
39
• Rates of moving out of employment range from over 15% in the Czech Republic,
France and Luxembourg to less than half of this in Cyprus, Greece, Latvia, Portugal, Romania and the United Kingdom.
• In several (Finland, France, Germany, Greece and Poland), only about 10% of older people who were unemployed a year earlier reported being in employment when surveyed, while it was even lower in Belgium (less than 2%) and Slovenia (around 7%). This contrasts with rates of around 30% or more in Cyprus, Estonia, Latvia and the United Kingdom.
• At the same time, in all Member States, there tends to be very little return to the labour market following exit into inactivity. Furthermore, in most countries very few inactive older people manage to return to employment – in most cases less than 2% of inactive people aged 55–64 are in jobs one year later. However the rate is considerably higher than the EU average in Austria, the Czech Republic, Finland, Latvia, Romania, Slovakia and the United Kingdom.
These results highlight the fact that, although older workers in the EU generally face a lower risk of moving from employment into unemployment than those in younger age groups, in many Member States the consequences of job loss for older workers can be more serious. Indeed, older workers are subject to significant difficulties if they lose their job, as evidenced by the relatively high incidence of long-term unemployment. Although, with the notable exception of Germany, unemployment rates are lower for older people aged 55–64 than for younger age groups (in 2006 the unemployment rate in the EU averaged 6.2% for those aged 55–64, compared to 8.3% for the working-age population as a whole), this partly reflects the greater tendency for older people to leave the labour market altogether at older ages, and older persons who are unemployed generally face longer periods of time in unemployment than their younger colleagues. Around 63% of the older unemployed experience periods of unemployment lasting 12 months or more, a third more than the average for the working-age population as a whole (46%). Table 10
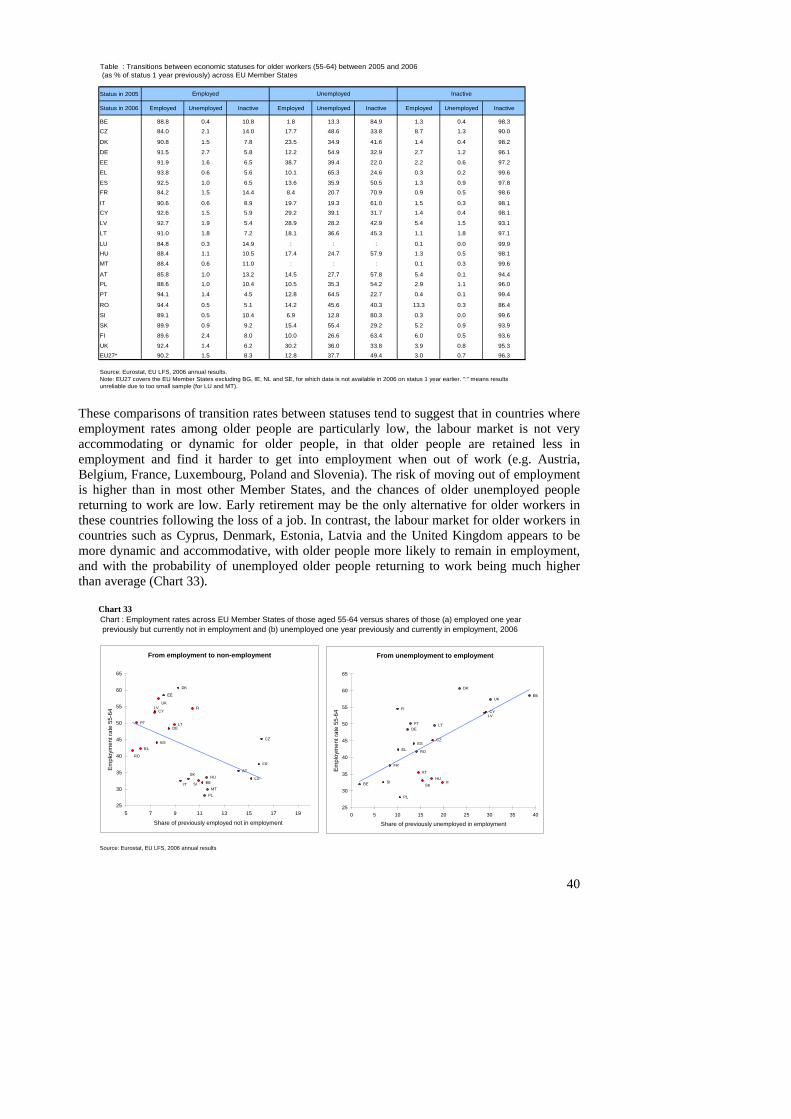
Table : Transitions between economic statuses for older workers (55-64) between 2005 and 2006 (as
Status i
Status i
BECZ
DK
DE
EE
EL
ESFR
ITCY
LV
LT
LUHU
MT
ATPL
PT
RO
SI
SK
FI
UKEU27*
SourcNote: Eunrel
% of status 1 year previously) across EU Member States
n 2005
n 2006 Employed Unemployed Inactive Employed Unemployed Inactive Employed Unemployed Inactive
88.8 0.4 10.8 1.8 13.3 84.9 1.3 0.4 98.384.0 2.1 14.0 17.7 48.6 33.8 8.7 1.3 90.0
90.8 1.5 7.8 23.5 34.9 41.6 1.4 0.4 98.2
91.5 2.7 5.8 12.2 54.9 32.9 2.7 1.2 96.1
91.9 1.6 6.5 38.7 39.4 22.0 2.2 0.6 97.2
93.8 0.6 5.6 10.1 65.3 24.6 0.3 0.2 99.6
92.5 1.0 6.5 13.6 35.9 50.5 1.3 0.9 97.884.2 1.5 14.4 8.4 20.7 70.9 0.9 0.5 98.6
90.6 0.6 8.9 19.7 19.3 61.0 1.5 0.3 98.192.6 1.5 5.9 29.2 39.1 31.7 1.4 0.4 98.1
92.7 1.9 5.4 28.9 28.2 42.9 5.4 1.5 93.1
91.0 1.8 7.2 18.1 36.6 45.3 1.1 1.8 97.1
84.8 0.3 14.9 : : : 0.1 0.0 99.988.4 1.1 10.5 17.4 24.7 57.9 1.3 0.5 98.1
88.4 0.6 11.0 : : : 0.1 0.3 99.6
85.8 1.0 13.2 14.5 27.7 57.8 5.4 0.1 94.488.6 1.0 10.4 10.5 35.3 54.2 2.9 1.1 96.0
94.1 1.4 4.5 12.8 64.5 22.7 0.4 0.1 99.4
94.4 0.5 5.1 14.2 45.6 40.3 13.3 0.3 86.4
89.1 0.5 10.4 6.9 12.8 80.3 0.3 0.0 99.6
89.9 0.9 9.2 15.4 55.4 29.2 5.2 0.9 93.9
89.6 2.4 8.0 10.0 26.6 63.4 6.0 0.5 93.6
92.4 1.4 6.2 30.2 36.0 33.8 3.9 0.8 95.390.2 1.5 8.3 12.8 37.7 49.4 3.0 0.7 96.3
e: Eurostat, EU LFS, 2006 annual results. U27 covers the EU Member States excluding BG, IE, NL and SE, for which data is not available in 2006 on status 1 year earlier. ":" means results
iable due to too small sample (for LU and MT).
Employed Unemployed Inactive
These comparisons of transition rates between statuses tend to suggest that in countries where employment rates among older people are particularly low, the labour market is not very accommodating or dynamic for older people, in that older people are retained less in employment and find it harder to get into employment when out of work (e.g. Austria, Belgium, France, Luxembourg, Poland and Slovenia). The risk of moving out of employment is higher than in most other Member States, and the chances of older unemployed people returning to work are low. Early retirement may be the only alternative for older workers in these countries following the loss of a job. In contrast, the labour market for older workers in countries such as Cyprus, Denmark, Estonia, Latvia and the United Kingdom appears to be more dynamic and accommodative, with older people more likely to remain in employment, and with the probability of unemployed older people returning to work being much higher than average (Chart 33).
Chart 33 Chart : Employment rates across EU Member States of those aged 55-64 versus shares of those (a) employed one year previously but currently not in employment and (b) unemployed one year previously and currently in employment, 2006
Source: Eurostat, EU LFS, 2006 annual results
40
From employment to non-employment
BE
CZ
DK
DE
EE
ELES
FR
IT
CYLV
LT
LUHU
MT
AT
PL
PT
RO
SI
SK
FIUK
25
30
35
40
45
50
55
60
65
5 7 9 11 13 15 17 19
Share of previously employed not in employment
Em
ploy
men
t rat
e 55
-64
From unemployment to employment
BE
CZ
DK
DE
EE
ELES
FR
IT
CYLV
LT
HUAT
PL
PT
RO
SISK
FI
UK
25
30
35
40
45
50
55
60
65
0 5 10 15 20 25 30 35 40
Share of previously unemployed in employment
Em
ploy
men
t rat
e 55
-64
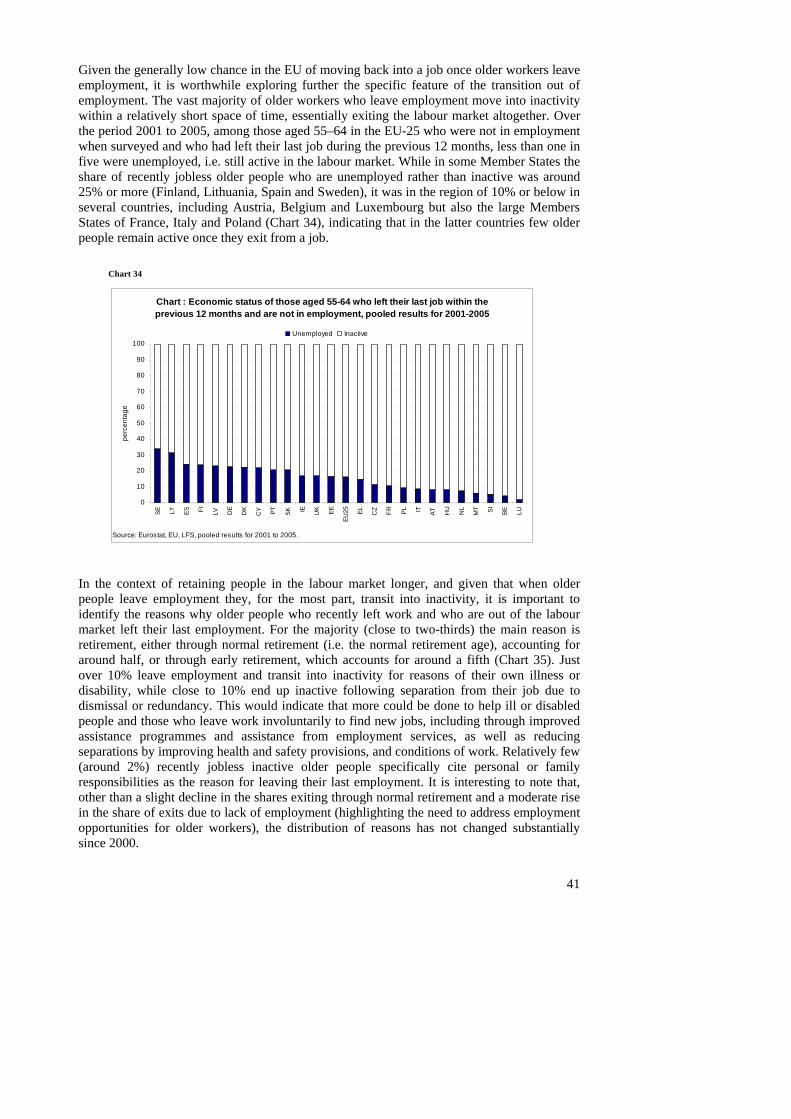
Given the generally low chance in the EU of moving back into a job once older workers leave employment, it is worthwhile exploring further the specific feature of the transition out of employment. The vast majority of older workers who leave employment move into inactivity within a relatively short space of time, essentially exiting the labour market altogether. Over the period 2001 to 2005, among those aged 55–64 in the EU-25 who were not in employment when surveyed and who had left their last job during the previous 12 months, less than one in five were unemployed, i.e. still active in the labour market. While in some Member States the share of recently jobless older people who are unemployed rather than inactive was around 25% or more (Finland, Lithuania, Spain and Sweden), it was in the region of 10% or below in several countries, including Austria, Belgium and Luxembourg but also the large Members States of France, Italy and Poland (Chart 34), indicating that in the latter countries few older people remain active once they exit from a job.
Chart 34
Chart : Economic status of those aged 55-64 who left their last job within the previous 12 months and are not in employment, pooled results for 2001-2005
Sour
perc
enta
ge
0
10
20
30
40
50
60
70
80
90
100
SE LT ES FI LV DE
DK
CY PT SK IE UK EE
EU25 EL CZ FR PL IT AT HU NL
MT SI BE LU
ce: Eurostat, EU, LFS, pooled results for 2001 to 2005.
Unemployed Inactive
In the context of retaining people in the labour market longer, and given that when older people leave employment they, for the most part, transit into inactivity, it is important to identify the reasons why older people who recently left work and who are out of the labour market left their last employment. For the majority (close to two-thirds) the main reason is retirement, either through normal retirement (i.e. the normal retirement age), accounting for around half, or through early retirement, which accounts for around a fifth (Chart 35). Just over 10% leave employment and transit into inactivity for reasons of their own illness or disability, while close to 10% end up inactive following separation from their job due to dismissal or redundancy. This would indicate that more could be done to help ill or disabled people and those who leave work involuntarily to find new jobs, including through improved assistance programmes and assistance from employment services, as well as reducing separations by improving health and safety provisions, and conditions of work. Relatively few (around 2%) recently jobless inactive older people specifically cite personal or family responsibilities as the reason for leaving their last employment. It is interesting to note that, other than a slight decline in the shares exiting through normal retirement and a moderate rise in the share of exits due to lack of employment (highlighting the need to address employment opportunities for older workers), the distribution of reasons has not changed substantially since 2000.
41
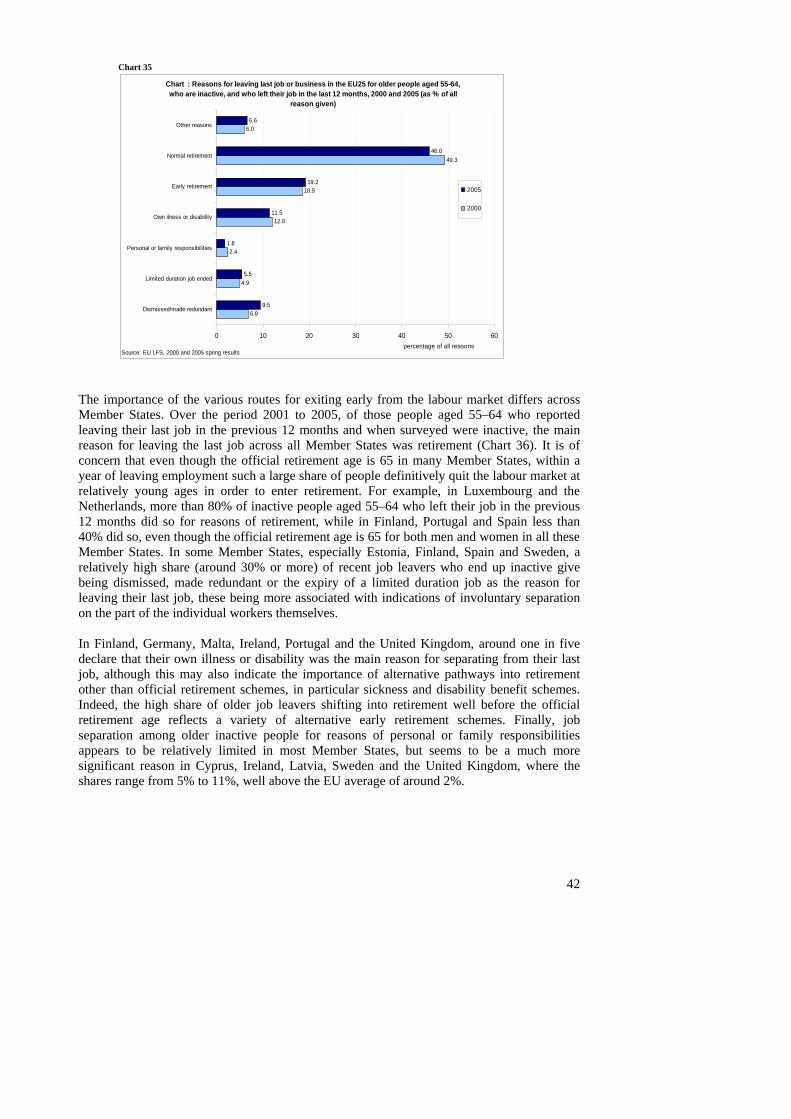
Chart 35 Chart : Reasons for leaving last job or business in the EU25 for older people aged 55-64, who are inactive, and who left their job in the last 12 months, 2000 and 2005 (as % of all
reason given)
6.8
4.9
2.4
12.0
18.5
49.3
6.0
9.5
5.5
1.8
11.5
19.2
46.0
6.6
0 10 20 30 40 50 60
Dismissed/made redundant
Limited duration job ended
onal or family responsibilities
Own ilness or disability
Early retirement
Normal retirement
Other reasons
: EU LFS, 2000 and 2005 spring results
Pers
Source
2005
2000
percentage of all reasons
The importance of the various routes for exiting early from the labour market differs across Member States. Over the period 2001 to 2005, of those people aged 55–64 who reported leaving their last job in the previous 12 months and when surveyed were inactive, the main reason for leaving the last job across all Member States was retirement (Chart 36). It is of concern that even though the official retirement age is 65 in many Member States, within a year of leaving employment such a large share of people definitively quit the labour market at relatively young ages in order to enter retirement. For example, in Luxembourg and the Netherlands, more than 80% of inactive people aged 55–64 who left their job in the previous 12 months did so for reasons of retirement, while in Finland, Portugal and Spain less than 40% did so, even though the official retirement age is 65 for both men and women in all these Member States. In some Member States, especially Estonia, Finland, Spain and Sweden, a relatively high share (around 30% or more) of recent job leavers who end up inactive give being dismissed, made redundant or the expiry of a limited duration job as the reason for leaving their last job, these being more associated with indications of involuntary separation on the part of the individual workers themselves. In Finland, Germany, Malta, Ireland, Portugal and the United Kingdom, around one in five declare that their own illness or disability was the main reason for separating from their last job, although this may also indicate the importance of alternative pathways into retirement other than official retirement schemes, in particular sickness and disability benefit schemes. Indeed, the high share of older job leavers shifting into retirement well before the official retirement age reflects a variety of alternative early retirement schemes. Finally, job separation among older inactive people for reasons of personal or family responsibilities appears to be relatively limited in most Member States, but seems to be a much more significant reason in Cyprus, Ireland, Latvia, Sweden and the United Kingdom, where the shares range from 5% to 11%, well above the EU average of around 2%.
42
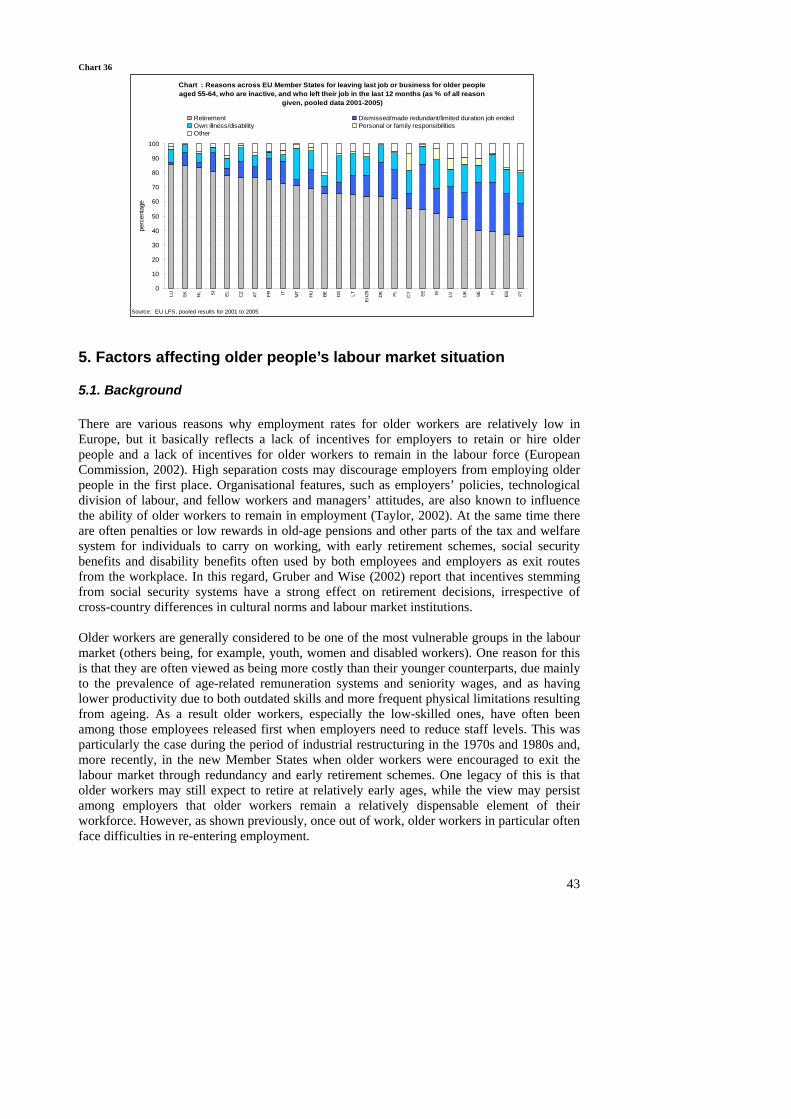
Chart 36 Chart : Reasons across EU Member States for leaving last job or business for older people aged 55-64, who are inactive, and who left their job in the last 12 months (as % of all reason
given, pooled data 2001-2005)
0
10
20
30
40
50
60
70
80
90
100
LU SK NL SI EL CZ
AT FR IT MT
HU BE DE LT
EU25 DK PL CY EE IE LV UK SE FI ES PT
EU LFS, pooled results for 2001 to 2005Source:
perc
enta
ge
Retirement Dismissed/made redundant/limited duration job endedOwn illness/disability Personal or family responsibilitiesOther
5. Factors affecting older people’s labour market situation
5.1. Background There are various reasons why employment rates for older workers are relatively low in Europe, but it basically reflects a lack of incentives for employers to retain or hire older people and a lack of incentives for older workers to remain in the labour force (European Commission, 2002). High separation costs may discourage employers from employing older people in the first place. Organisational features, such as employers’ policies, technological division of labour, and fellow workers and managers’ attitudes, are also known to influence the ability of older workers to remain in employment (Taylor, 2002). At the same time there are often penalties or low rewards in old-age pensions and other parts of the tax and welfare system for individuals to carry on working, with early retirement schemes, social security benefits and disability benefits often used by both employees and employers as exit routes from the workplace. In this regard, Gruber and Wise (2002) report that incentives stemming from social security systems have a strong effect on retirement decisions, irrespective of cross-country differences in cultural norms and labour market institutions. Older workers are generally considered to be one of the most vulnerable groups in the labour market (others being, for example, youth, women and disabled workers). One reason for this is that they are often viewed as being more costly than their younger counterparts, due mainly to the prevalence of age-related remuneration systems and seniority wages, and as having lower productivity due to both outdated skills and more frequent physical limitations resulting from ageing. As a result older workers, especially the low-skilled ones, have often been among those employees released first when employers need to reduce staff levels. This was particularly the case during the period of industrial restructuring in the 1970s and 1980s and, more recently, in the new Member States when older workers were encouraged to exit the labour market through redundancy and early retirement schemes. One legacy of this is that older workers may still expect to retire at relatively early ages, while the view may persist among employers that older workers remain a relatively dispensable element of their workforce. However, as shown previously, once out of work, older workers in particular often face difficulties in re-entering employment.
43
44
Existing research has classified the factors that influence the exit of older workers from the labour market into ‘push’ and ‘pull’ factors (OECD, 2006). From the perspective of employers, push factors include negative perceptions about the capacities of older workers and the labour costs relative to their productivity. From the perspective of individual older workers, they include poor health and disability, work-related issues (including negative attributes of their present employment and unsatisfactory working conditions), and the obsolescence of skills as a consequence of technological change and lack of opportunities to update skills. Pull factors essentially consist of financial incentives which encourage older workers into retirement and factors associated with the attractiveness of life in retirement, such as opportunities to take up a secondary career, undertake voluntary work, or to enjoy new hobbies (Taylor, 2002). In the context of raising older people’s labour market participation, much analysis and debate has taken place on reviewing financially related aspects (such as pension provisions and increasing the retirement age to receive a pension), while less attention has been given to creating appropriate employment opportunities and the right working and employment conditions to encourage older workers to remain in work for longer. However, recent studies (Haider and Loughran, 2001: Taylor,2001) emphasise that financial incentives and social security regulations are not the only determinant of older people’s labour supply – non-pecuniary factors also play an important role in their decision to remain in or re-enter the labour market.21 Steps to limit access to early retirement must therefore be backed up by removing barriers and disincentives which prevent older people from working longer, and through providing better and more appropriate employment opportunities for ageing workers. The employability of older people also needs to be addressed, focusing on the improvement of types and levels of skills that are often a major obstacle to hiring older workers. It is also becoming increasingly clear that the work-life balance is an important factor in job satisfaction and the planning of ageing staffs’ careers in particular. Employers must consider the overall pattern of their older employees’ wishes and expectations towards work. With advancing age, these increasingly encompass their personal lives outside work, such as their family care responsibilities. In this regard, flexible working arrangements, particularly part-time work and self-employment, have been promoted as an important mechanism for ‘active ageing’. Some of the key factors which influence the labour market participation of older people are examined in more detail in the following sections. These are addressed under three broad headings which generally reflect the main areas for action identified in the Commission’s synthesis report to the 2004 European Spring Council, namely:
- Retirement, pensions and the balance of financial incentives
- Factors affecting the availability of jobs for older workers and their employability
- Conditions and attractiveness of work.
21 Haider and Loughran (2001), in a study of American labour supply for elderly people aged 65 and older, find that ‘non-pecuniary factors dominate the labour supply decisions of the elderly’ who ‘are particularly willing to purchase jobs that they enjoy and allow them the flexibility they desire at the expense of low financial returns’. The authors therefore conclude that ‘policies that affect the financial return to work for the elderly will have less impact on labour supply in this population than policies targeted at improving the non-pecuniary returns to work’.
45
Before exploring further, a few words are necessary on the need for a broad supportive environment to underpin active ageing strategies. For many people, being able to work may depend heavily on factors such as cultural aspects relating to the participation of certain elements of the population in the labour market, their general health and the availability of, and access to, good quality care facilities and employment services. All these can be seen as components of a more general environment which will encourage, or not, the labour market participation of older workers.
Cultural aspects and the general attitudes of business and society towards the labour market participation of older workers have a role to play. For example, older women have low participation rates in many Member States, reflecting the more traditional cultural roles for elderly women in those countries. At the same time, attitudes of employers and staff towards older workers are an important issue. Raising awareness is a necessary measure to change attitudes and reduce discrimination against older workers and has been used quite extensively in the United Kingdom and Sweden. In its Communication to the 2006 Spring European Council (European Commission, 2006c) the Commission highlighted that Member States increasingly recognise that improving health and the access to medical and preventive care and rehabilitation services are also key dimensions of a strategy to increase labour supply in a sustainable manner. OECD (2006) also emphasises that prevention is an important means for promoting longer working lives, not just by reducing the risk of occupational injuries and diseases but also by tackling those factors outside of work, which may be leading to poor health, such as obesity and tobacco and alcohol consumption. In this context, measures aimed at stepping up lifelong preventive health policies should have an important influence on extending working lives. Recent research (Ghosheh Jr. et al, 2006; EFILWC, 1999) highlights that the need for better reconciliation of work and family life is likely to rise significantly for older workers in the future. Such responsibilities are likely to become more demanding, as older people try to cope with balancing professional responsibilities with addressing the needs not only of elderly relatives, but also of elderly or infirm partners, adolescent children who remain in the family home, or even of grandchildren for whom the grandparent may provide the majority of childcare. Indeed, as the current demographic trend for women to have children later in life continues, together with the postponement of departure from the family household by adolescent or adult children, and the older elements of the population living to ever older ages, the 55–64 age group may well increasingly face a rising challenge of reconciling work and family life. Policies and work arrangements will need to be developed to take this into account if older workers’ participation is not to be adversely affected. In particular, raising the labour market participation of older women aged 55–64, upon whom the care responsibilities principally fall rather than upon older men, will require improvements in the provision of care and assistance services for dependent members of their families. The availability and quality of local employment services, and in particular the level of assistance available related to non-passive labour market policy measures, may have an impact on the possibility for older workers to find appropriate employment. Indeed, comparing across countries, those Member States with higher spending on such measures tend to have higher employment rates among older workers (Chart 37). Well-designed non-passive labour market policies, generally covering job placement services and measures such as vocational training, job search or hiring subsidies, can help to reduce unemployment through improving the skills of the unemployed as well as achieving more efficient job matching. Conversely, insufficient availability of good quality employment services will
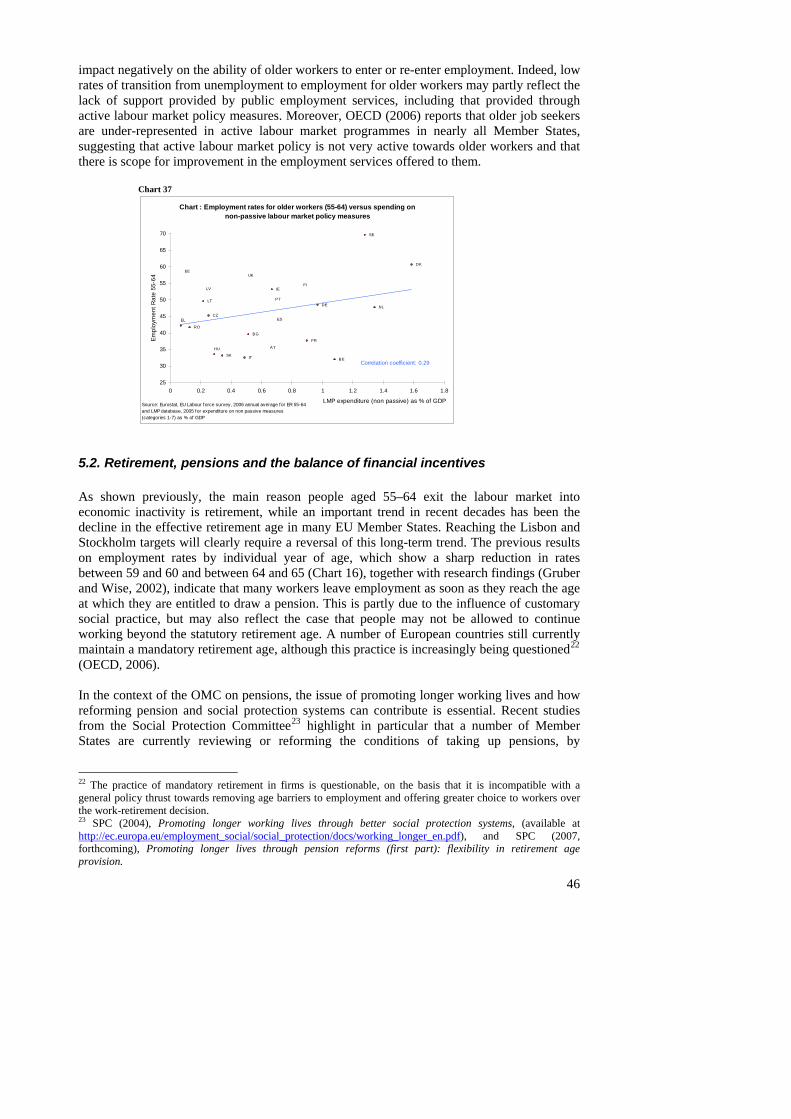
impact negatively on the ability of older workers to enter or re-enter employment. Indeed, low rates of transition from unemployment to employment for older workers may partly reflect the lack of support provided by public employment services, including that provided through active labour market policy measures. Moreover, OECD (2006) reports that older job seekers are under-represented in active labour market programmes in nearly all Member States, suggesting that active labour market policy is not very active towards older workers and that there is scope for improvement in the employment services offered to them.
Chart 37
Chart : Employment rates for older workers (55-64) versus spending on non-passive labour market policy measures
Empl
oym
ent R
ate
55-6
4 UK
SE
FI
SK
RO
PT
AT
NL
HU
LT
LV
IT
FR
ESEL
IE
EE
DE
DK
CZ
BG
BE
25
30
35
40
45
50
55
60
65
70
0 0.2 0.4 0.6 0.8 1 1.2 1.4 1.6 1.8
LMP expenditure (non passive) as % of GDPSource: Eand LMP(categorie
urostat, EU Labour force survey, 2006 annual average for ER 55-64 database, 2005 for expenditure on non passive measures
s 1-7) as % of GDP
Correlation coefficient: 0.29
5.2. Retirement, pensions and the balance of financial incentives As shown previously, the main reason people aged 55–64 exit the labour market into economic inactivity is retirement, while an important trend in recent decades has been the decline in the effective retirement age in many EU Member States. Reaching the Lisbon and Stockholm targets will clearly require a reversal of this long-term trend. The previous results on employment rates by individual year of age, which show a sharp reduction in rates between 59 and 60 and between 64 and 65 (Chart 16), together with research findings (Gruber and Wise, 2002), indicate that many workers leave employment as soon as they reach the age at which they are entitled to draw a pension. This is partly due to the influence of customary social practice, but may also reflect the case that people may not be allowed to continue working beyond the statutory retirement age. A number of European countries still currently maintain a mandatory retirement age, although this practice is increasingly being questioned22 (OECD, 2006). In the context of the OMC on pensions, the issue of promoting longer working lives and how reforming pension and social protection systems can contribute is essential. Recent studies from the Social Protection Committee23 highlight in particular that a number of Member States are currently reviewing or reforming the conditions of taking up pensions, by
22 The practice of mandatory retirement in firms is questionable, on the basis that it is incompatible with a general policy thrust towards removing age barriers to employment and offering greater choice to workers over the work-retirement decision. 23 SPC (2004), Promoting longer working lives through better social protection systems, (available at http://ec.europa.eu/employment_social/social_protection/docs/working_longer_en.pdf), and SPC (2007, forthcoming), Promoting longer lives through pension reforms (first part): flexibility in retirement age provision.
46
47
introducing more flexibility in the choice of the path from work to retirement. This can be achieved through more flexibility at retirement age and appropriate incentives to prolong working lives, but also through partial pensions and possibilities to combine pensions and earnings. At the same time, the general public is becoming increasingly aware of the need to remain longer in the labour force. Results from a recent Eurobarometer survey24 indicate that 45% of EU-25 citizens aged 15 or older believe that their fellow citizens retire too early. Furthermore, persons aged 55 years and over were the only age group in which a majority believe that people retire too early, while half of retired persons also agreed with this statement. These results suggest that ‘older people and the retired would probably favour extending their working lives for various reasons, including social integration and the maintenance of the standard of living they enjoy when in employment’.
5.2.1. Standard and early retirement There is substantial variation across Member States in the age at which people are eligible to standard pension benefits (Table 11), although to a certain extent this reflects the variation in life expectancy across countries (with lower retirement ages tending to be found in countries with lower life expectancy, as is the case in eastern Europe). In most Member States the age at which people are entitled to a public pension has remained fixed over recent decades, despite the fact that life expectancy has increased substantially. For most the age of eligibility for men is 65, but ages of eligibility are considerably below this in some Member States (the Baltic States, the Czech Republic, France, Hungary, Malta, Slovenia and Slovakia). Differences are wider with respect to standard retirement ages for women, despite the fact that a number of Member States are in the process of bringing female eligibility ages into line with those for men. The availability of early retirement schemes and minimum ages of eligibility to these also shows wide variation across countries, with no such schemes being available in seven Member States, while several others allow access to early retirement benefits from ages around the mid-50s mark. At the same time, occupational or private pension schemes play a large role in pension provision in a number of Member States and thus can potentially have an important impact on retirement decisions. As for public pension schemes, the way these are set up can encourage or discourage retirement at an early age. In response to the need to raise the labour market participation of older workers, many Member States have carried out, or are in the process of carrying out, pension reform. These have included increases in the age of eligibility for a full pension, bringing retirement ages for women into line with those for men, and reducing the availability of early retirement schemes, although in many cases the increase in the statutory retirement age will be implemented over a long time period to prevent sudden changes.
Table 11
24 Special Eurobarometer 261, European Employment and Social Policy, October 2006.
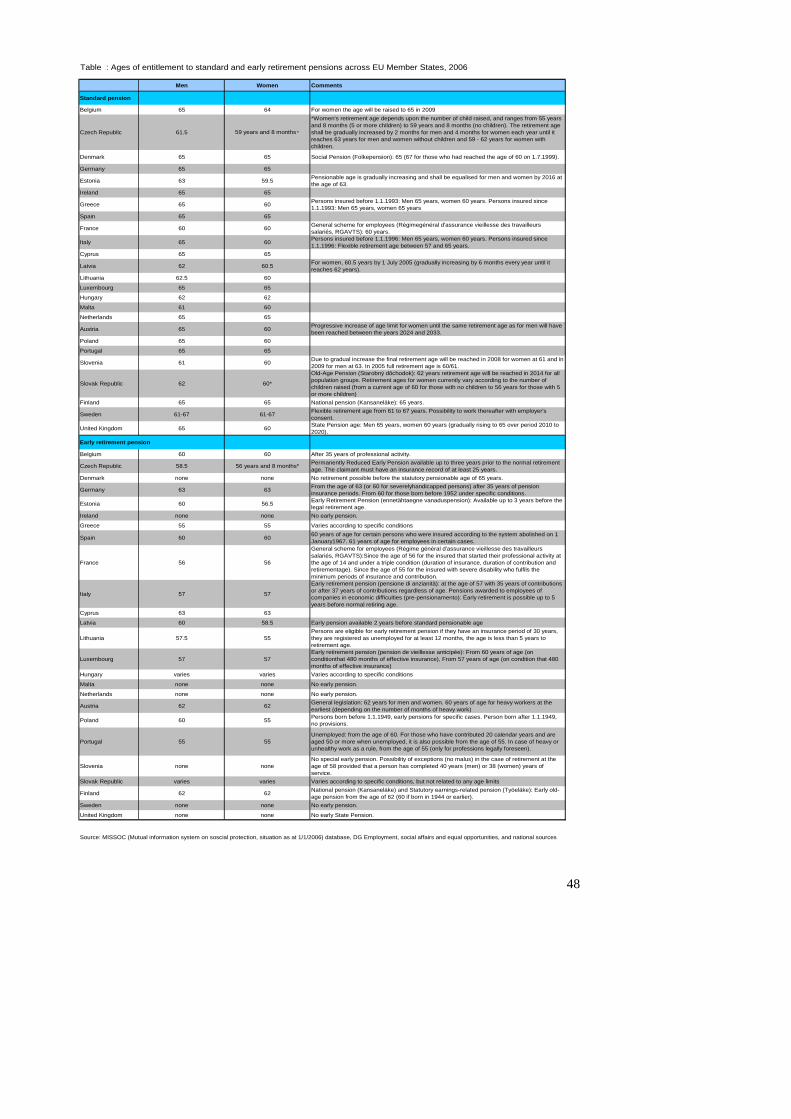
48
Table : Ages of entitlement to standard and early retirement pensions across EU Member States, 2006
Stand
Belg
Cz
De
Ger
Eston
Irel
Gre
Spai
Fran
Italy
Cy
Latvi
Lithua
Luxe
Hu
Ma
Ne
Aus
Pol
Portug
Slov
Slov
Finl
Swe
Unite
Earl
Belg
Cz
De
Ger
Eston
Irel
Gre
Spai
Fran
Italy
Cy
Latvi
Lithua
Luxe
Hu
Ma
Ne
Aus
Pol
Portug
Slov
Slov
Swe
Unite
Men Women Comments
ard pension
ium 65 64 For women the age will be raised to 65 in 2009
ech Republic 61.5 59 years and 8 months*
*Women's retirement age depends upon the number of child raised, and ranges from 55 years and 8 months (5 or more children) to 59 years and 8 months (no children). The retirement age shall be gradually increased by 2 months for men and 4 months for women each year until it reaches 63 years for men and women without children and 59 - 62 years for women with children.
nmark 65 65 Social Pension (Folkepension): 65 (67 for those who had reached the age of 60 on 1.7.1999).
many 65 65
ia 63 59.5 Pensionable age is gradually increasing and shall be equalised for men and women by 2016 at the age of 63.
and 65 65
ece 65 60 Persons insured before 1.1.1993: Men 65 years, women 60 years. Persons insured since 1.1.1993: Men 65 years, women 65 years
n 65 65
ce 60 60 General scheme for employees (Régimegénéral d'assurance vieillesse des travailleurs salariés, RGAVTS): 60 years.
65 60 Persons insured before 1.1.1996: Men 65 years, women 60 years. Persons insured since 1.1.1996: Flexible retirement age between 57 and 65 years.
prus 65 65
a 62 60.5 For women, 60.5 years by 1 July 2005 (gradually increasing by 6 months every year until it reaches 62 years).
nia 62.5 60
mbourg 65 65
ngary 62 62
lta 61 60
therlands 65 65
tria 65 60 Progressive increase of age limit for women until the same retirement age as for men will have been reached between the years 2024 and 2033.
and 65 60
al 65 65
enia 61 60 Due to gradual increase the final retirement age will be reached in 2008 for women at 61 and in 2009 for men at 63. In 2005 full retirement age is 60/61.
ak Republic 62 60*
Old-Age Pension (Starobný dôchodok): 62 years retirement age will be reached in 2014 for all population groups. Retirement ages for women currently vary according to the number of children raised (from a current age of 60 for those with no children to 56 years for those with 5 or more children)
and 65 65 National pension (Kansaneläke): 65 years.
den 61-67 61-67 Flexible retirement age from 61 to 67 years. Possibility to work thereafter with employer's consent.
d Kingdom 65 60 State Pension age: Men 65 years, women 60 years (gradually rising to 65 over period 2010 to 2020).
y retirement pension
ium 60 60 After 35 years of professional activity.
ech Republic 58.5 56 years and 8 months* Permanently Reduced Early Pension available up to three years prior to the normal retirement age. The claimant must have an insurance record of at least 25 years.
nmark none none No retirement possible before the statutory pensionable age of 65 years.
many 63 63 From the age of 63 (or 60 for severelyhandicapped persons) after 35 years of pension insurance periods. From 60 for those born before 1952 under specific conditions.
ia 60 56.5 Early Retirement Pension (ennetähtaegne vanaduspension): Available up to 3 years before the legal retirement age.
and none none No early pension.
ece 55 55 Varies according to specific conditions
n 60 60 60 years of age for certain persons who were insured according to the system abolished on 1 January1967. 61 years of age for employees in certain cases.
ce 56 56
General scheme for employees (Régime général d'assurance vieillesse des travailleurs salariés, RGAVTS):Since the age of 56 for the insured that started their professional activity at the age of 14 and under a triple condition (duration of insurance, duration of contribution and retirementage). Since the age of 55 for the insured with severe disability who fulfils the minimum periods of insurance and contribution.
57 57
Early retirement pension (pensione di anzianità): at the age of 57 with 35 years of contributions or after 37 years of contributions regardless of age. Pensions awarded to employees of companies in economic difficulties (pre-pensionamento): Early retirement is possible up to 5 years before normal retiring age.
prus 63 63
a 60 58.5 Early pension available 2 years before standard pensionable age
nia 57.5 55Persons are eligible for early retirement pension if they have an insurance period of 30 years, they are registered as unemployed for at least 12 months, the age is less than 5 years to retirement age.
mbourg 57 57Early retirement pension (pension de vieillesse anticipée): From 60 years of age (on conditionthat 480 months of effective insurance), From 57 years of age (on condition that 480 months of effective insurance)
ngary varies varies Varies according to specific conditions
lta none none No early pension.
therlands none none No early pension.
tria 62 62 General legislation: 62 years for men and women. 60 years of age for heavy workers at the earliest (depending on the number of months of heavy work)
and 60 55 Persons born before 1.1.1949, early pensions for specific cases. Person born after 1.1.1949, no provisions.
al 55 55Unemployed: from the age of 60. For those who have contributed 20 calendar years and are aged 50 or more when unemployed, it is also possible from the age of 55. In case of heavy or unhealthy work as a rule, from the age of 55 (only for professions legally foreseen).
enia none noneNo special early pension. Possibility of exceptions (no malus) in the case of retirement at the age of 58 provided that a person has completed 40 years (men) or 38 (women) years of service.
ak Republic varies varies Varies according to specific conditions, but not related to any age limits
Finland 62 62 National pension (Kansaneläke) and Statutory earnings-related pension (Työeläke): Early old-age pension from the age of 62 (60 if born in 1944 or earlier).
den none none No early pension.
d Kingdom none none No early State Pension.
Source: MISSOC (Mutual information system on soscial protection, situation as at 1/1/2006) database, DG Employment, social affairs and equal opportunities, and national sources
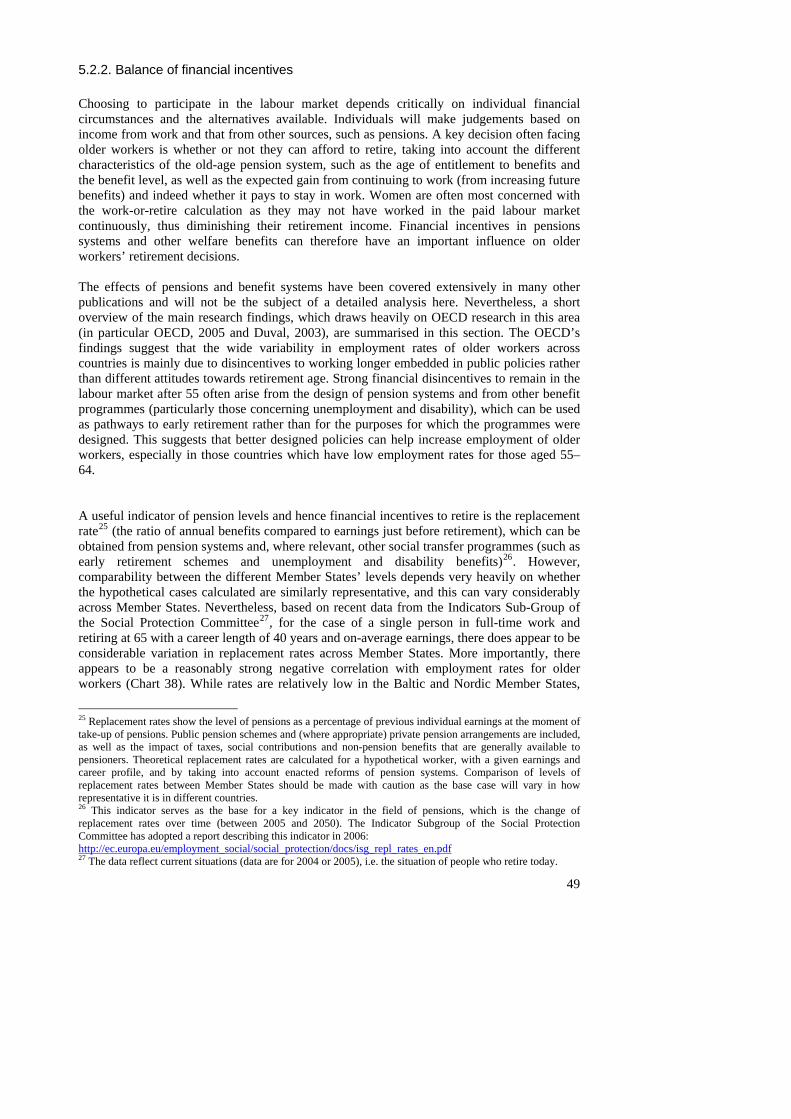
49
5.2.2. Balance of financial incentives Choosing to participate in the labour market depends critically on individual financial circumstances and the alternatives available. Individuals will make judgements based on income from work and that from other sources, such as pensions. A key decision often facing older workers is whether or not they can afford to retire, taking into account the different characteristics of the old-age pension system, such as the age of entitlement to benefits and the benefit level, as well as the expected gain from continuing to work (from increasing future benefits) and indeed whether it pays to stay in work. Women are often most concerned with the work-or-retire calculation as they may not have worked in the paid labour market continuously, thus diminishing their retirement income. Financial incentives in pensions systems and other welfare benefits can therefore have an important influence on older workers’ retirement decisions. The effects of pensions and benefit systems have been covered extensively in many other publications and will not be the subject of a detailed analysis here. Nevertheless, a short overview of the main research findings, which draws heavily on OECD research in this area (in particular OECD, 2005 and Duval, 2003), are summarised in this section. The OECD’s findings suggest that the wide variability in employment rates of older workers across countries is mainly due to disincentives to working longer embedded in public policies rather than different attitudes towards retirement age. Strong financial disincentives to remain in the labour market after 55 often arise from the design of pension systems and from other benefit programmes (particularly those concerning unemployment and disability), which can be used as pathways to early retirement rather than for the purposes for which the programmes were designed. This suggests that better designed policies can help increase employment of older workers, especially in those countries which have low employment rates for those aged 55–64. A useful indicator of pension levels and hence financial incentives to retire is the replacement rate25 (the ratio of annual benefits compared to earnings just before retirement), which can be obtained from pension systems and, where relevant, other social transfer programmes (such as early retirement schemes and unemployment and disability benefits)26. However, comparability between the different Member States’ levels depends very heavily on whether the hypothetical cases calculated are similarly representative, and this can vary considerably across Member States. Nevertheless, based on recent data from the Indicators Sub-Group of the Social Protection Committee27, for the case of a single person in full-time work and retiring at 65 with a career length of 40 years and on-average earnings, there does appear to be considerable variation in replacement rates across Member States. More importantly, there appears to be a reasonably strong negative correlation with employment rates for older workers (Chart 38). While rates are relatively low in the Baltic and Nordic Member States,
25 Replacement rates show the level of pensions as a percentage of previous individual earnings at the moment of take-up of pensions. Public pension schemes and (where appropriate) private pension arrangements are included, as well as the impact of taxes, social contributions and non-pension benefits that are generally available to pensioners. Theoretical replacement rates are calculated for a hypothetical worker, with a given earnings and career profile, and by taking into account enacted reforms of pension systems. Comparison of levels of replacement rates between Member States should be made with caution as the base case will vary in how representative it is in different countries. 26 This indicator serves as the base for a key indicator in the field of pensions, which is the change of replacement rates over time (between 2005 and 2050). The Indicator Subgroup of the Social Protection Committee has adopted a report describing this indicator in 2006: http://ec.europa.eu/employment_social/social_protection/docs/isg_repl_rates_en.pdf27 The data reflect current situations (data are for 2004 or 2005), i.e. the situation of people who retire today.
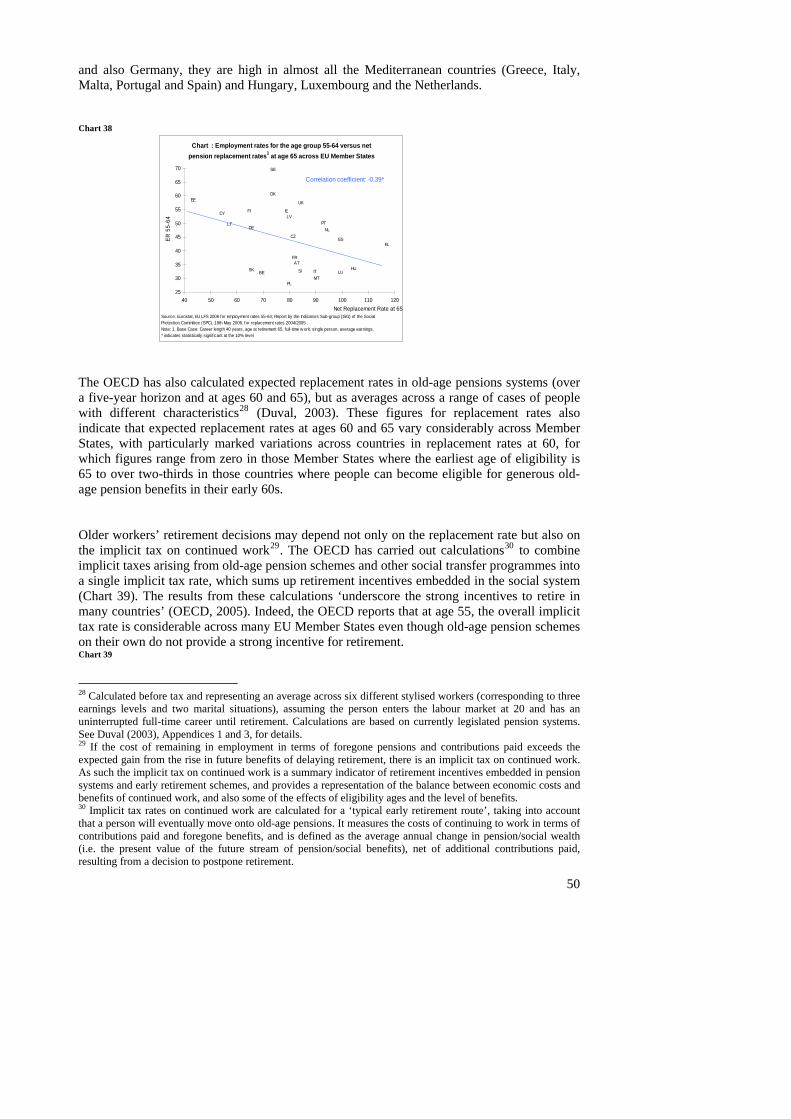
and also Germany, they are high in almost all the Mediterranean countries (Greece, Italy, Malta, Portugal and Spain) and Hungary, Luxembourg and the Netherlands.
Chart 38
Chart : Employment rates for the age group 55-64 versus net 1
25
30
35
40
45
50
55
60
65
70
40
ER 5
5-64
pension replacement rates at age 65 across EU Member States
UK
SE
FI
SK SI
PT
PL
AT
NL
MT
HULU
LTLV
CY
IT
FR
ESEL
IE
EE
DE
DK
CZ
BE
50 60 70 80 90 100 110 120Net Replacement Rate at 65
Source: EuroProtection CoNote: 1. Base* indicates st
stat, EU LFS 2006 for employment rates 55-64; Report by the Indicators Sub-group (ISG) of the Social mmittee (SPC), 19th May 2006, for replacement rates 2004/2005 . Case: Career length 40 years, age at retirement 65, full-time w ork, single person, average earnings.atistically signif icant at the 10% level
Correlation coefficient: -0.39*
The OECD has also calculated expected replacement rates in old-age pensions systems (over a five-year horizon and at ages 60 and 65), but as averages across a range of cases of people with different characteristics28 (Duval, 2003). These figures for replacement rates also indicate that expected replacement rates at ages 60 and 65 vary considerably across Member States, with particularly marked variations across countries in replacement rates at 60, for which figures range from zero in those Member States where the earliest age of eligibility is 65 to over two-thirds in those countries where people can become eligible for generous old-age pension benefits in their early 60s. Older workers’ retirement decisions may depend not only on the replacement rate but also on the implicit tax on continued work29. The OECD has carried out calculations30 to combine implicit taxes arising from old-age pension schemes and other social transfer programmes into a single implicit tax rate, which sums up retirement incentives embedded in the social system (Chart 39). The results from these calculations ‘underscore the strong incentives to retire in many countries’ (OECD, 2005). Indeed, the OECD reports that at age 55, the overall implicit tax rate is considerable across many EU Member States even though old-age pension schemes on their own do not provide a strong incentive for retirement. Chart 39
28 Calculated before tax and representing an average across six different stylised workers (corresponding to three earnings levels and two marital situations), assuming the person enters the labour market at 20 and has an uninterrupted full-time career until retirement. Calculations are based on currently legislated pension systems. See Duval (2003), Appendices 1 and 3, for details. 29 If the cost of remaining in employment in terms of foregone pensions and contributions paid exceeds the expected gain from the rise in future benefits of delaying retirement, there is an implicit tax on continued work. As such the implicit tax on continued work is a summary indicator of retirement incentives embedded in pension systems and early retirement schemes, and provides a representation of the balance between economic costs and benefits of continued work, and also some of the effects of eligibility ages and the level of benefits. 30 Implicit tax rates on continued work are calculated for a ‘typical early retirement route’, taking into account that a person will eventually move onto old-age pensions. It measures the costs of continuing to work in terms of contributions paid and foregone benefits, and is defined as the average annual change in pension/social wealth (i.e. the present value of the future stream of pension/social benefits), net of additional contributions paid, resulting from a decision to postpone retirement.
50
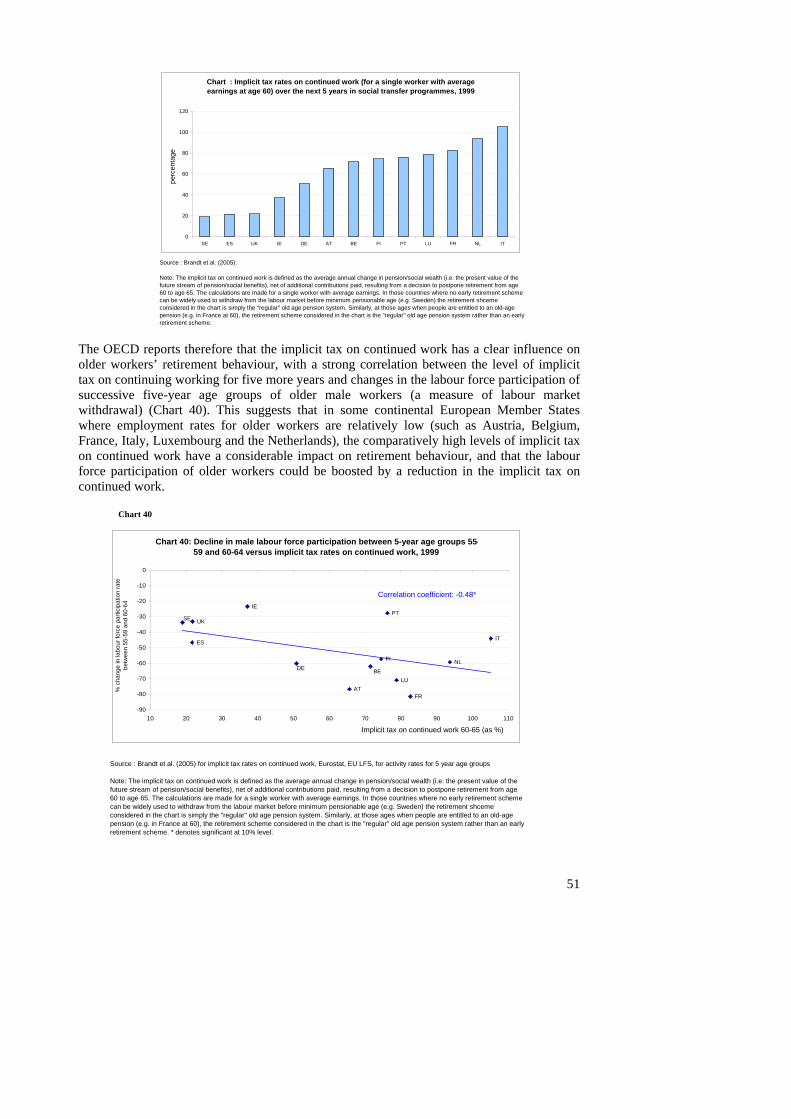
Source : B
Note: Tfuture stream60 to age 65. Tcan be wiconsiderpension (e.g. in retirement s
randt et al. (2005).
he implicit tax on continued work is defined as the average annual change in pension/social wealth (i.e. the present value of the of pension/social benefits), net of additional contributions paid, resulting from a decision to postpone retirement from age
he calculations are made for a single worker with average earnings. In those countries where no early retirement scheme dely used to withdraw from the labour market before minimum pensionable age (e.g. Sweden) the retirement shceme
ed in the chart is simply the "regular" old age pension system. Similarly, at those ages when people are entitled to an old-age France at 60), the retirement scheme considered in the chart is the "regular" old age pension system rather than an early
cheme.
Chart : Implicit tax rates on continued work (for a single worker with average earnings at age 60) over the next 5 years in social transfer programmes, 1999
0SE ES UK IE DE AT BE FI PT LU FR NL IT
20
40
60
80
100
120
perc
enta
ge
The OECD reports therefore that the implicit tax on continued work has a clear influence on older workers’ retirement behaviour, with a strong correlation between the level of implicit tax on continuing working for five more years and changes in the labour force participation of successive five-year age groups of older male workers (a measure of labour market withdrawal) (Chart 40). This suggests that in some continental European Member States where employment rates for older workers are relatively low (such as Austria, Belgium, France, Italy, Luxembourg and the Netherlands), the comparatively high levels of implicit tax on continued work have a considerable impact on retirement behaviour, and that the labour force participation of older workers could be boosted by a reduction in the implicit tax on continued work.
Chart 40
Chart 40: Decline in male labour force participation between 5-year age groups 55-59 and 60-64 versus implicit tax rates on continued work, 1999
UKSE
FI
PT
AT
NL
LU
IT
FR
ES
IE
DE BE
-90
-80
-70
-60
-50
-40
-30
-20
-10
0
10 20 30 40 50 60 70 80 90 100 110
Implicit tax on continued work 60-65 (as %)
% c
hang
e in
labo
ur fo
rce
parti
cipa
tion
rate
be
twee
n 55
-59
and
60-6
4
Correlation coefficient: -0.48*
Source : Brandt et al. (2005) for implicit tax rates on continued work, Eurostat, EU LFS, for activity rates for 5 year age groups
Note: The implicit tax on continued work is defined as the average annual change in pension/social wealth (i.e. the present value of the future stream of pension/social benefits), net of additional contributions paid, resulting from a decision to postpone retirement from age 60 to age 65. The calculations are made for a single worker with average earnings. In those countries where no early retirement scheme can be widely used to withdraw from the labour market before minimum pensionable age (e.g. Sweden) the retirement shceme considered in the chart is simply the "regular" old age pension system. Similarly, at those ages when people are entitled to an old-age pension (e.g. in France at 60), the retirement scheme considered in the chart is the "regular" old age pension system rather than an early retirement scheme. * denotes significant at 10% level.
51
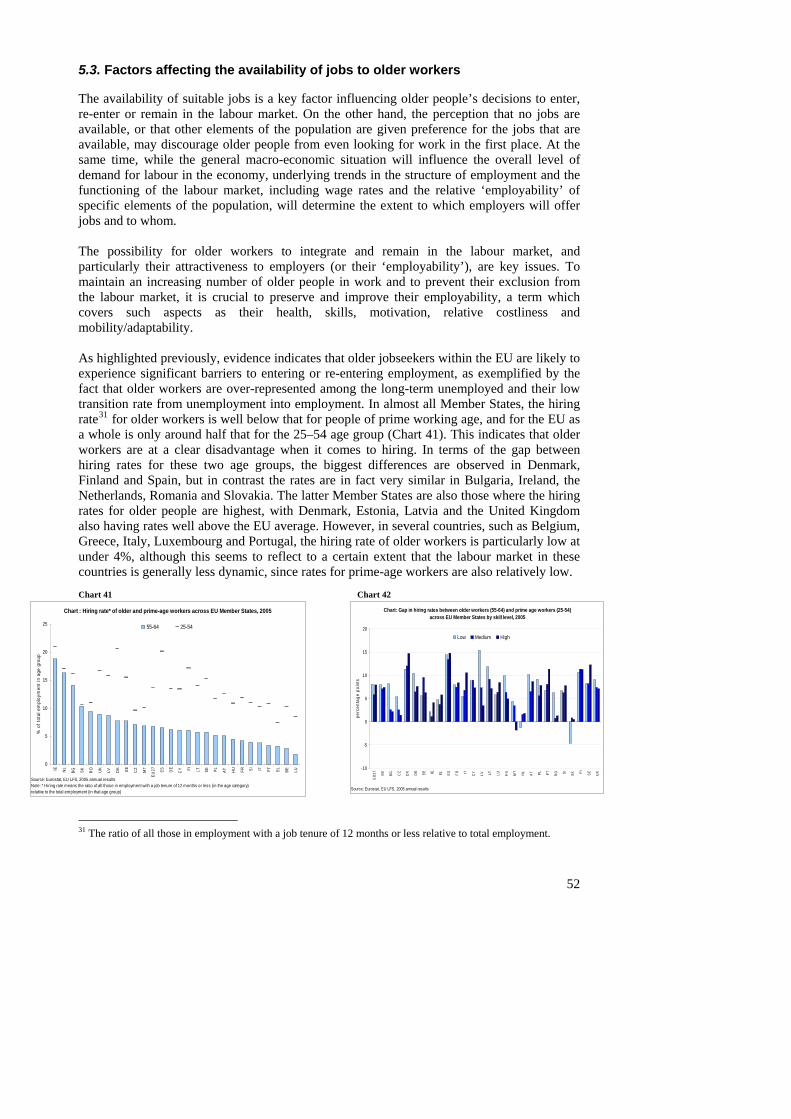
5.3. Factors affecting the availability of jobs to older workers The availability of suitable jobs is a key factor influencing older people’s decisions to enter, re-enter or remain in the labour market. On the other hand, the perception that no jobs are available, or that other elements of the population are given preference for the jobs that are available, may discourage older people from even looking for work in the first place. At the same time, while the general macro-economic situation will influence the overall level of demand for labour in the economy, underlying trends in the structure of employment and the functioning of the labour market, including wage rates and the relative ‘employability’ of specific elements of the population, will determine the extent to which employers will offer jobs and to whom. The possibility for older workers to integrate and remain in the labour market, and particularly their attractiveness to employers (or their ‘employability’), are key issues. To maintain an increasing number of older people in work and to prevent their exclusion from the labour market, it is crucial to preserve and improve their employability, a term which covers such aspects as their health, skills, motivation, relative costliness and mobility/adaptability. As highlighted previously, evidence indicates that older jobseekers within the EU are likely to experience significant barriers to entering or re-entering employment, as exemplified by the fact that older workers are over-represented among the long-term unemployed and their low transition rate from unemployment into employment. In almost all Member States, the hiring rate31 for older workers is well below that for people of prime working age, and for the EU as a whole is only around half that for the 25–54 age group (Chart 41). This indicates that older workers are at a clear disadvantage when it comes to hiring. In terms of the gap between hiring rates for these two age groups, the biggest differences are observed in Denmark, Finland and Spain, but in contrast the rates are in fact very similar in Bulgaria, Ireland, the Netherlands, Romania and Slovakia. The latter Member States are also those where the hiring rates for older people are highest, with Denmark, Estonia, Latvia and the United Kingdom also having rates well above the EU average. However, in several countries, such as Belgium, Greece, Italy, Luxembourg and Portugal, the hiring rate of older workers is particularly low at under 4%, although this seems to reflect to a certain extent that the labour market in these countries is generally less dynamic, since rates for prime-age workers are also relatively low. Chart 41 Chart 42
52
31 The ratio of all those in employment with a job tenure of 12 months or less relative to total employment.
Chart : Hiring rate* of older and prime-age workers across EU Member States, 2005
0
5
10
15
20
25
IE NL
BG SK RO UK
LV DK EE CZ
MT
EU27 ES DE
CY FI LT SE PL AT HU FR SI IT PT EL BE LU
Source: Eurostat, EU LFS, 2005 annual resultsNote: * Hiring rate means the ratio of all those in employment with a job tenure of 12 months or less (in the age category) relative to the total employment (in that age group)
% o
f tot
al e
mpl
oym
ent i
n ag
e gr
oup
55-64 25-54
Chart: Gap in hiring rates between older workers (55-64) and prime age workers (25-54) across EU Member States by skill level, 2005
-10
-5
0
5
10
15
20
EU27 BE BG CZ
DK DE EE IE EL ES FR IT CY LV LT LU HU
MT
NL
AT PL PT RO SI SK FI SE UK
Source: Eurostat, EU LFS, 2005 annual results
perc
enta
ge p
oint
s
Low Medium High
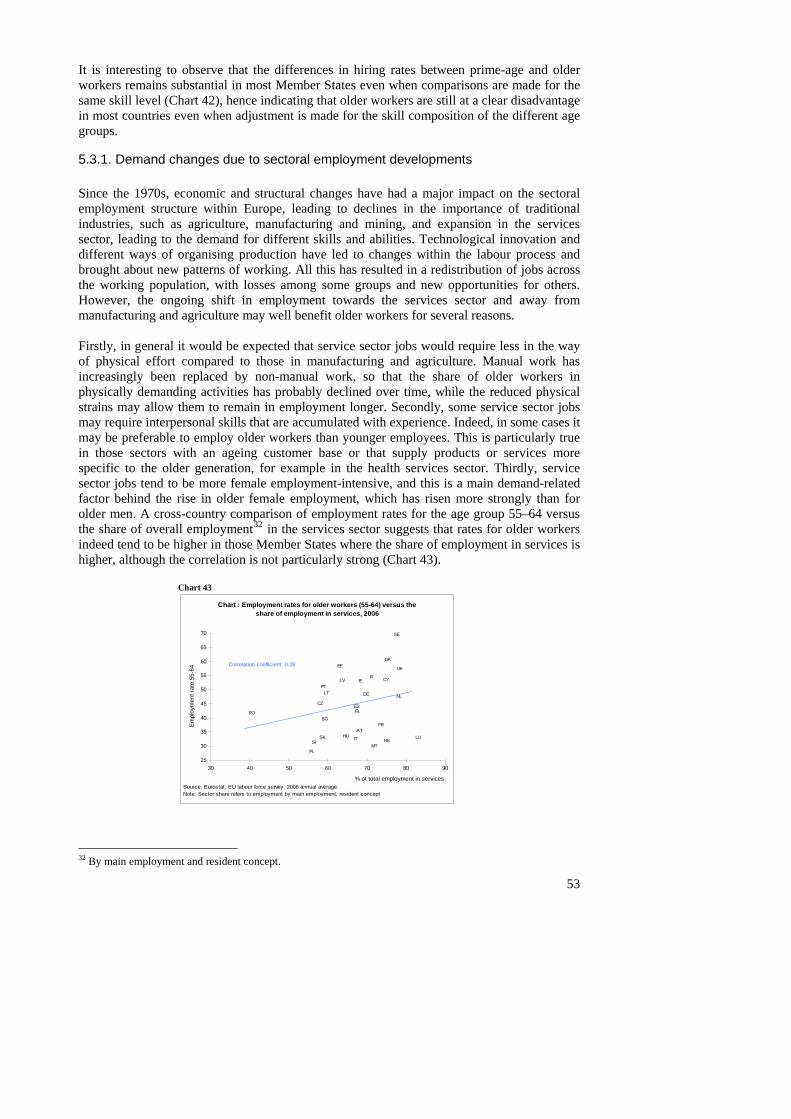
It is interesting to observe that the differences in hiring rates between prime-age and older workers remains substantial in most Member States even when comparisons are made for the same skill level (Chart 42), hence indicating that older workers are still at a clear disadvantage in most countries even when adjustment is made for the skill composition of the different age groups.
5.3.1. Demand changes due to sectoral employment developments Since the 1970s, economic and structural changes have had a major impact on the sectoral employment structure within Europe, leading to declines in the importance of traditional industries, such as agriculture, manufacturing and mining, and expansion in the services sector, leading to the demand for different skills and abilities. Technological innovation and different ways of organising production have led to changes within the labour process and brought about new patterns of working. All this has resulted in a redistribution of jobs across the working population, with losses among some groups and new opportunities for others. However, the ongoing shift in employment towards the services sector and away from manufacturing and agriculture may well benefit older workers for several reasons. Firstly, in general it would be expected that service sector jobs would require less in the way of physical effort compared to those in manufacturing and agriculture. Manual work has increasingly been replaced by non-manual work, so that the share of older workers in physically demanding activities has probably declined over time, while the reduced physical strains may allow them to remain in employment longer. Secondly, some service sector jobs may require interpersonal skills that are accumulated with experience. Indeed, in some cases it may be preferable to employ older workers than younger employees. This is particularly true in those sectors with an ageing customer base or that supply products or services more specific to the older generation, for example in the health services sector. Thirdly, service sector jobs tend to be more female employment-intensive, and this is a main demand-related factor behind the rise in older female employment, which has risen more strongly than for older men. A cross-country comparison of employment rates for the age group 55–64 versus the share of overall employment32 in the services sector suggests that rates for older workers indeed tend to be higher in those Member States where the share of employment in services is higher, although the correlation is not particularly strong (Chart 43).
Chart 43 Chart : Employment rates for older workers (55-64) versus the
share of employment in services, 2006
UK
SE
FI
PT
NLLT
LV CY
ES
IE
EE
DE
DK
CZ
25
30
35
40
45
50
55
60
65
70
Empl
oym
ent r
ate
55-6
4
SKSI
RO
PL
AT
MT
HU LUIT
FR
ELBG
BE
30 40 50 60 70 80 90
% ot total employment in servicesSource: EuNote: Sect
Correlation coefficient: 0.26
rostat, EU labour force survey, 2006 annual average. or share refers to employment by main employment, resident concept
32 By main employment and resident concept.
53
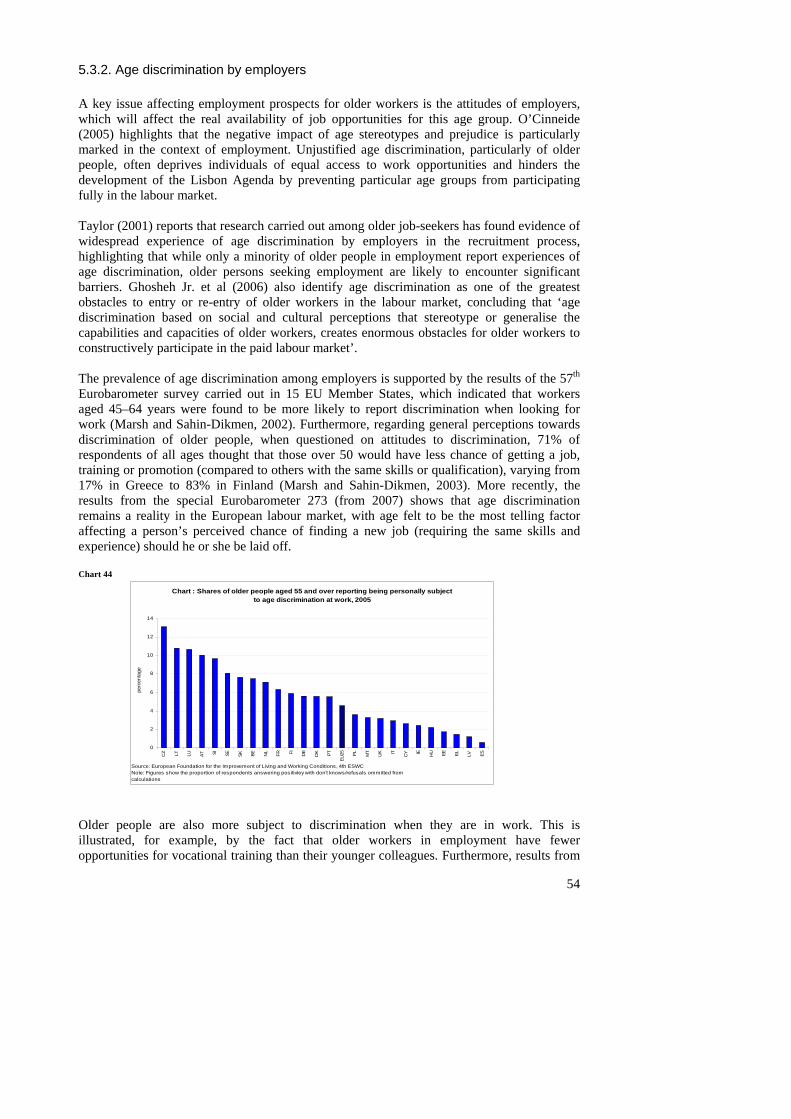
5.3.2. Age discrimination by employers A key issue affecting employment prospects for older workers is the attitudes of employers, which will affect the real availability of job opportunities for this age group. O’Cinneide (2005) highlights that the negative impact of age stereotypes and prejudice is particularly marked in the context of employment. Unjustified age discrimination, particularly of older people, often deprives individuals of equal access to work opportunities and hinders the development of the Lisbon Agenda by preventing particular age groups from participating fully in the labour market. Taylor (2001) reports that research carried out among older job-seekers has found evidence of widespread experience of age discrimination by employers in the recruitment process, highlighting that while only a minority of older people in employment report experiences of age discrimination, older persons seeking employment are likely to encounter significant barriers. Ghosheh Jr. et al (2006) also identify age discrimination as one of the greatest obstacles to entry or re-entry of older workers in the labour market, concluding that ‘age discrimination based on social and cultural perceptions that stereotype or generalise the capabilities and capacities of older workers, creates enormous obstacles for older workers to constructively participate in the paid labour market’. The prevalence of age discrimination among employers is supported by the results of the 57th Eurobarometer survey carried out in 15 EU Member States, which indicated that workers aged 45–64 years were found to be more likely to report discrimination when looking for work (Marsh and Sahin-Dikmen, 2002). Furthermore, regarding general perceptions towards discrimination of older people, when questioned on attitudes to discrimination, 71% of respondents of all ages thought that those over 50 would have less chance of getting a job, training or promotion (compared to others with the same skills or qualification), varying from 17% in Greece to 83% in Finland (Marsh and Sahin-Dikmen, 2003). More recently, the results from the special Eurobarometer 273 (from 2007) shows that age discrimination remains a reality in the European labour market, with age felt to be the most telling factor affecting a person’s perceived chance of finding a new job (requiring the same skills and experience) should he or she be laid off. Chart 44
Chart : Shares of older people aged 55 and over reporting being personally subject to age discrimination at work, 2005
0
2
4
6
8
10
12
14
CZ LT LU AT SI SE SK BE NL
FR FI DE
DK PT
EU25 PL MT
UK IT CY IE HU EE EL LV ES
Source: European Foundation for the Improvement of Living and Working Conditions, 4th ESWCNote: Figures show the proportion of respondents answering positivley with don't knows/refusals ommitted from calculations
perc
enta
ge
Older people are also more subject to discrimination when they are in work. This is illustrated, for example, by the fact that older workers in employment have fewer opportunities for vocational training than their younger colleagues. Furthermore, results from
54
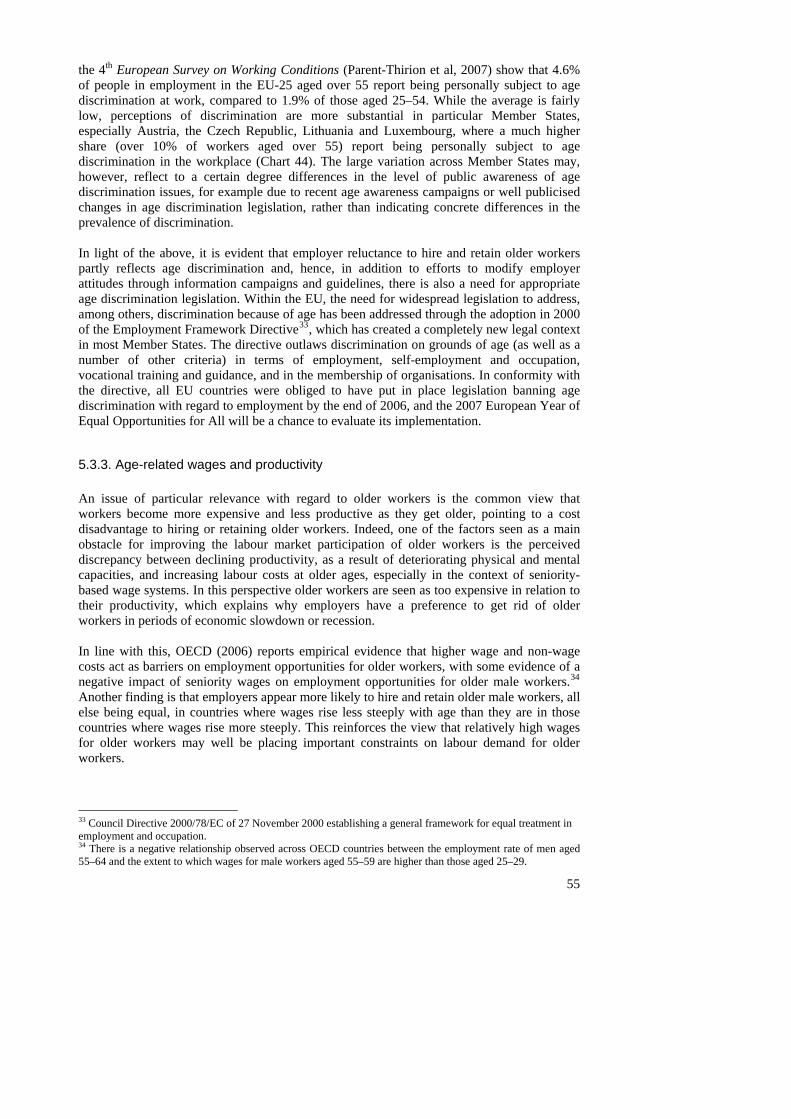
55
the 4th European Survey on Working Conditions (Parent-Thirion et al, 2007) show that 4.6% of people in employment in the EU-25 aged over 55 report being personally subject to age discrimination at work, compared to 1.9% of those aged 25–54. While the average is fairly low, perceptions of discrimination are more substantial in particular Member States, especially Austria, the Czech Republic, Lithuania and Luxembourg, where a much higher share (over 10% of workers aged over 55) report being personally subject to age discrimination in the workplace (Chart 44). The large variation across Member States may, however, reflect to a certain degree differences in the level of public awareness of age discrimination issues, for example due to recent age awareness campaigns or well publicised changes in age discrimination legislation, rather than indicating concrete differences in the prevalence of discrimination. In light of the above, it is evident that employer reluctance to hire and retain older workers partly reflects age discrimination and, hence, in addition to efforts to modify employer attitudes through information campaigns and guidelines, there is also a need for appropriate age discrimination legislation. Within the EU, the need for widespread legislation to address, among others, discrimination because of age has been addressed through the adoption in 2000 of the Employment Framework Directive33, which has created a completely new legal context in most Member States. The directive outlaws discrimination on grounds of age (as well as a number of other criteria) in terms of employment, self-employment and occupation, vocational training and guidance, and in the membership of organisations. In conformity with the directive, all EU countries were obliged to have put in place legislation banning age discrimination with regard to employment by the end of 2006, and the 2007 European Year of Equal Opportunities for All will be a chance to evaluate its implementation.
5.3.3. Age-related wages and productivity An issue of particular relevance with regard to older workers is the common view that workers become more expensive and less productive as they get older, pointing to a cost disadvantage to hiring or retaining older workers. Indeed, one of the factors seen as a main obstacle for improving the labour market participation of older workers is the perceived discrepancy between declining productivity, as a result of deteriorating physical and mental capacities, and increasing labour costs at older ages, especially in the context of seniority-based wage systems. In this perspective older workers are seen as too expensive in relation to their productivity, which explains why employers have a preference to get rid of older workers in periods of economic slowdown or recession. In line with this, OECD (2006) reports empirical evidence that higher wage and non-wage costs act as barriers on employment opportunities for older workers, with some evidence of a negative impact of seniority wages on employment opportunities for older male workers.34 Another finding is that employers appear more likely to hire and retain older male workers, all else being equal, in countries where wages rise less steeply with age than they are in those countries where wages rise more steeply. This reinforces the view that relatively high wages for older workers may well be placing important constraints on labour demand for older workers.
33 Council Directive 2000/78/EC of 27 November 2000 establishing a general framework for equal treatment in employment and occupation. 34 There is a negative relationship observed across OECD countries between the employment rate of men aged 55–64 and the extent to which wages for male workers aged 55–59 are higher than those aged 25–29.
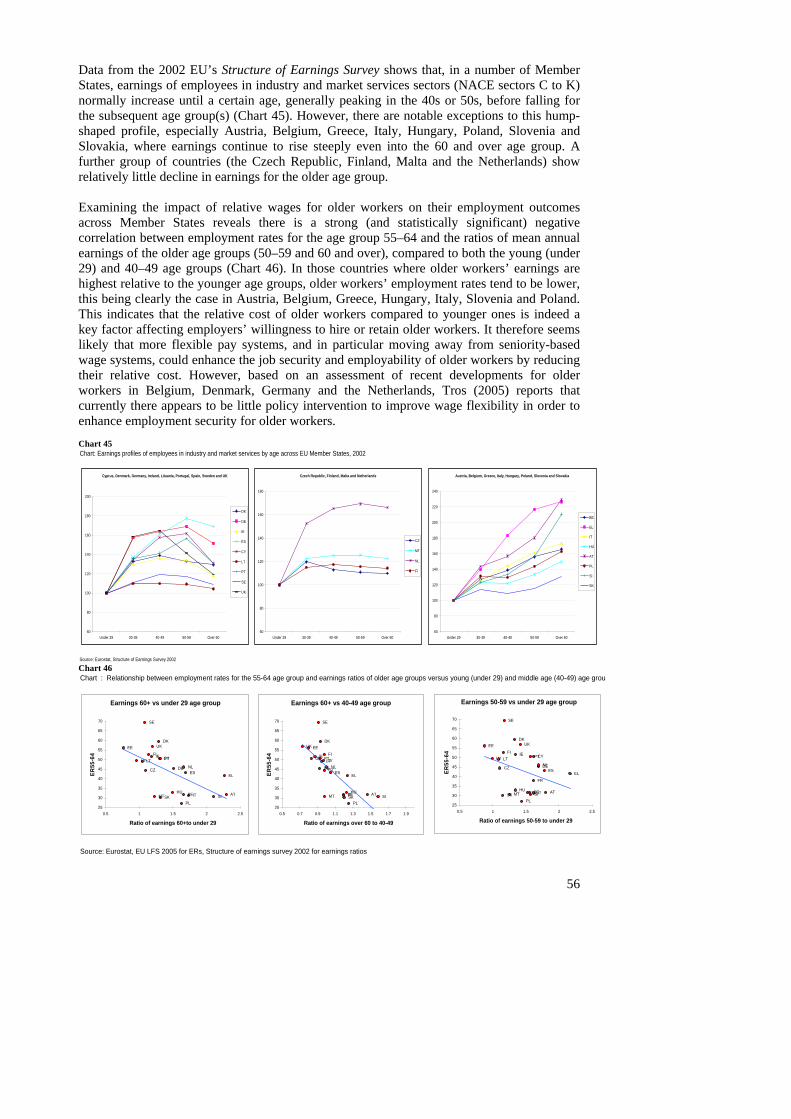
Data from the 2002 EU’s Structure of Earnings Survey shows that, in a number of Member States, earnings of employees in industry and market services sectors (NACE sectors C to K) normally increase until a certain age, generally peaking in the 40s or 50s, before falling for the subsequent age group(s) (Chart 45). However, there are notable exceptions to this hump-shaped profile, especially Austria, Belgium, Greece, Italy, Hungary, Poland, Slovenia and Slovakia, where earnings continue to rise steeply even into the 60 and over age group. A further group of countries (the Czech Republic, Finland, Malta and the Netherlands) show relatively little decline in earnings for the older age group. Examining the impact of relative wages for older workers on their employment outcomes across Member States reveals there is a strong (and statistically significant) negative correlation between employment rates for the age group 55–64 and the ratios of mean annual earnings of the older age groups (50–59 and 60 and over), compared to both the young (under 29) and 40–49 age groups (Chart 46). In those countries where older workers’ earnings are highest relative to the younger age groups, older workers’ employment rates tend to be lower, this being clearly the case in Austria, Belgium, Greece, Hungary, Italy, Slovenia and Poland. This indicates that the relative cost of older workers compared to younger ones is indeed a key factor affecting employers’ willingness to hire or retain older workers. It therefore seems likely that more flexible pay systems, and in particular moving away from seniority-based wage systems, could enhance the job security and employability of older workers by reducing their relative cost. However, based on an assessment of recent developments for older workers in Belgium, Denmark, Germany and the Netherlands, Tros (2005) reports that currently there appears to be little policy intervention to improve wage flexibility in order to enhance employment security for older workers.
Chart: Earnings profiles of employees in industry and market services by age across EU Member States, 2002Chart 45
56
Source: Eurostat, Structure of Earnings Survey 2002
Austria, Belgium, Greece, Italy, Hungary, Poland, Slovenia and Slovakia
200
220
240
60
80
100
120
140
160
180
Under 29 30-39 40-49 50-59 Over 60
BE
EL
IT
HU
AT
PL
SI
SK
Czech Republic, Finland, Malta and Netherlands
160
180
60
80
100
120
140
Under 29 30-39 40-49 50-59 Over 60
CZ
MT
NL
FI
Cyprus, Denmark, Germany, Ireland, Lituania, Portugal, Spain, Sweden and UK
60
80
100
120
140
160
180
200
Under 29 30-39 40-49 50-59 Over 60
DK
DE
IE
ES
CY
LT
PT
SE
UK
Chart 46 Chart : Relationship between employment rates for the 55-64 age group and earnings ratios of older age groups versus young (under 29) and middle age (40-49) age group
Source: Eurostat, EU LFS 2005 for ERs, Structure of earnings survey 2002 for earnings ratios
Earnings 60+ vs under 29 age group
BE
CZ
DK
DE
EE
IE
ELES
IT
CYLV LT
HUMT
NL
AT
PL
PT
SISK
FI
SE
UK
25
30
35
40
45
50
55
60
65
70
0.5 1 1.5 2 2.5
Ratio of earnings 60+to under 29
ER55
-64
Earnings 60+ vs 40-49 age group
BE
CZ
DK
DE
EE
IE
ELES
IT
CY LVLT
HUMT
NL
AT
PL
PT
SISK
FI
SE
UK
25
30
35
40
45
50
55
60
65
70
0.5 0.7 0.9 1.1 1.3 1.5 1.7 1.9
Ratio of earnings over 60 to 40-49
ER55
-64
Earnings 50-59 vs under 29 age group
BE
CZ
DK
DE
EE
IE
ELES
FR
IT
CYLV LT
LUHUMT
NL
AT
PL
PT
SISK
FI
SE
UK
25
30
35
40
45
50
55
60
65
70
0.5 1 1.5 2 2.5
Ratio of earnings 50-59 to under 29
ER55
-64
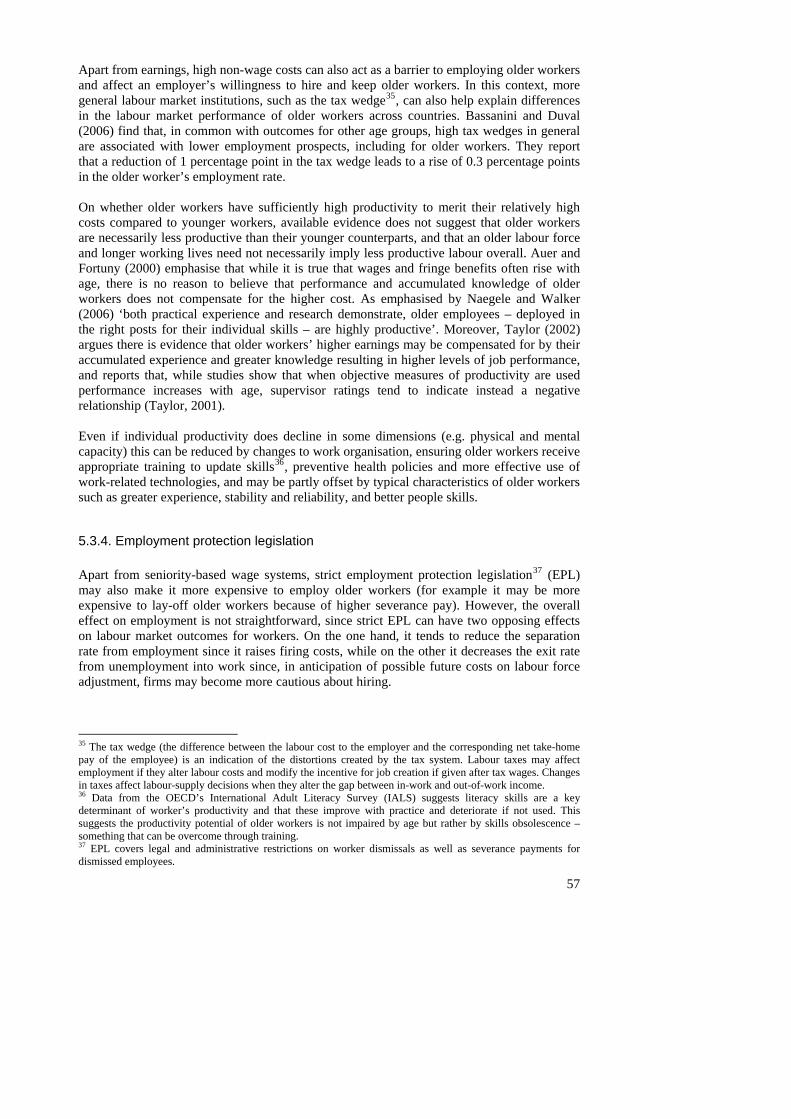
57
Apart from earnings, high non-wage costs can also act as a barrier to employing older workers and affect an employer’s willingness to hire and keep older workers. In this context, more general labour market institutions, such as the tax wedge35, can also help explain differences in the labour market performance of older workers across countries. Bassanini and Duval (2006) find that, in common with outcomes for other age groups, high tax wedges in general are associated with lower employment prospects, including for older workers. They report that a reduction of 1 percentage point in the tax wedge leads to a rise of 0.3 percentage points in the older worker’s employment rate. On whether older workers have sufficiently high productivity to merit their relatively high costs compared to younger workers, available evidence does not suggest that older workers are necessarily less productive than their younger counterparts, and that an older labour force and longer working lives need not necessarily imply less productive labour overall. Auer and Fortuny (2000) emphasise that while it is true that wages and fringe benefits often rise with age, there is no reason to believe that performance and accumulated knowledge of older workers does not compensate for the higher cost. As emphasised by Naegele and Walker (2006) ‘both practical experience and research demonstrate, older employees – deployed in the right posts for their individual skills – are highly productive’. Moreover, Taylor (2002) argues there is evidence that older workers’ higher earnings may be compensated for by their accumulated experience and greater knowledge resulting in higher levels of job performance, and reports that, while studies show that when objective measures of productivity are used performance increases with age, supervisor ratings tend to indicate instead a negative relationship (Taylor, 2001). Even if individual productivity does decline in some dimensions (e.g. physical and mental capacity) this can be reduced by changes to work organisation, ensuring older workers receive appropriate training to update skills36, preventive health policies and more effective use of work-related technologies, and may be partly offset by typical characteristics of older workers such as greater experience, stability and reliability, and better people skills.
5.3.4. Employment protection legislation Apart from seniority-based wage systems, strict employment protection legislation37 (EPL) may also make it more expensive to employ older workers (for example it may be more expensive to lay-off older workers because of higher severance pay). However, the overall effect on employment is not straightforward, since strict EPL can have two opposing effects on labour market outcomes for workers. On the one hand, it tends to reduce the separation rate from employment since it raises firing costs, while on the other it decreases the exit rate from unemployment into work since, in anticipation of possible future costs on labour force adjustment, firms may become more cautious about hiring.
35 The tax wedge (the difference between the labour cost to the employer and the corresponding net take-home pay of the employee) is an indication of the distortions created by the tax system. Labour taxes may affect employment if they alter labour costs and modify the incentive for job creation if given after tax wages. Changes in taxes affect labour-supply decisions when they alter the gap between in-work and out-of-work income. 36 Data from the OECD’s International Adult Literacy Survey (IALS) suggests literacy skills are a key determinant of worker’s productivity and that these improve with practice and deteriorate if not used. This suggests the productivity potential of older workers is not impaired by age but rather by skills obsolescence – something that can be overcome through training. 37 EPL covers legal and administrative restrictions on worker dismissals as well as severance payments for dismissed employees.
Empirical evidence generally indicates a weak negative correlation across Member States between the OECD calculated indicator of the overall strictness of EPL38 and the corresponding employment rate for the 55–64 age group (Chart 47). However, by focusing on outcomes for older men and the employment ratio specifically of employees aged 50–64 to the population of the same age (hence excluding the self-employed), the OECD (2006) finds much stronger evidence that strict EPL is a barrier to employment of older workers. In particular, it appears to be associated with lower labour mobility in a number of countries, especially in terms of lower hiring rates. Results from the EU Labour Force Survey for 2006 confirm the stronger nature of the negative relationship for male employees (Chart 48), although the correlation in this case is not statistically significant. Chart 47 Chart 48
Chart : Older workers employment rates across EU Member States versus strictness of EPL
70
Empl
oym
ent R
ates
55-
64 (2
006)
BE
CZ
DK
DE
IE
ELES
FR
ITHU
NL
AT
PL
PT
SK
FI
SE
UK
25
30
35
40
45
50
55
60
65
1 1.5 2 2.5 3 3.5Overall EPL strictness (2003)
Source: Eurostat, EU LFS for ERs 55-64 (2006 annual averages), OECD Employment tlook 2006 and OECD.stat for EPL strictness, 2003
Correlation coefficient: -0.08
Ou
Chart: Ratio of male employees aged 55-64 to the male population of the same age versus EPL strictness
BE
CZ
DK
DE
IE
EL
ES
FR
IT
HU
NL
AT
PL
PT
SKFI
SE
UK
20
25
30
35
40
45
50
55
60
1 1.5 2 2.5 3 3.5Overall EPL strictness (2003)
Rat
io o
f mal
e em
ploy
ees
55-6
4 to
tota
l mal
epo
pn 5
5-64
(200
6)
Source: Eurostat, EU LFS second quarter 2006 results for male employee ratio, Employment Outlook 2006 and OECD.Stat for EPL strictness (2003)
Correlation coefficient: -0.36
However, recent research by Bassanini and Duval (2006) using cross-country and time-series econometric techniques39 finds that stringent EPL may in fact benefit older workers. They find that, although EPL is likely to reduce the opportunities of older job seekers through its negative impact on hiring rates, this may be more than offset by the lower risk when already employed older workers are laid off.
5.3.5. Health, disability, and health and safety at work Health often declines with age, and the onset of health problems affects the timing of retirement for a significant number of workers unless it is possible for them to adapt work activities.40 Research (Bound et al., 1998) and results shown earlier indicate that poor health and disability are among the most common factors leading people to withdraw from the labour market and are a very important determinant of labour force participation for older people. Indeed, employment rates for the age group 55–64 tend to be higher in those Member States where the share of people in this age group reporting self-perceived health as good or very good is greater (Chart 49).
38 The OECD calculates a summary indicator of the overall strictness of EPL as a weighted average of three components: 1. regular employees, 2. temporary employees and 3. collective dismissals. The summary indicator ranges from 0 to 6, with higher values indicating greater strictness of EPL. 39 They explore the policy and institutional determinants of employment rates through pooled cross-country/time series regressions, including for the older workers age group 40 Bound et al (1998) find that changing jobs appears to be an important method adopted by older workers to enable continued labour force participation.
58
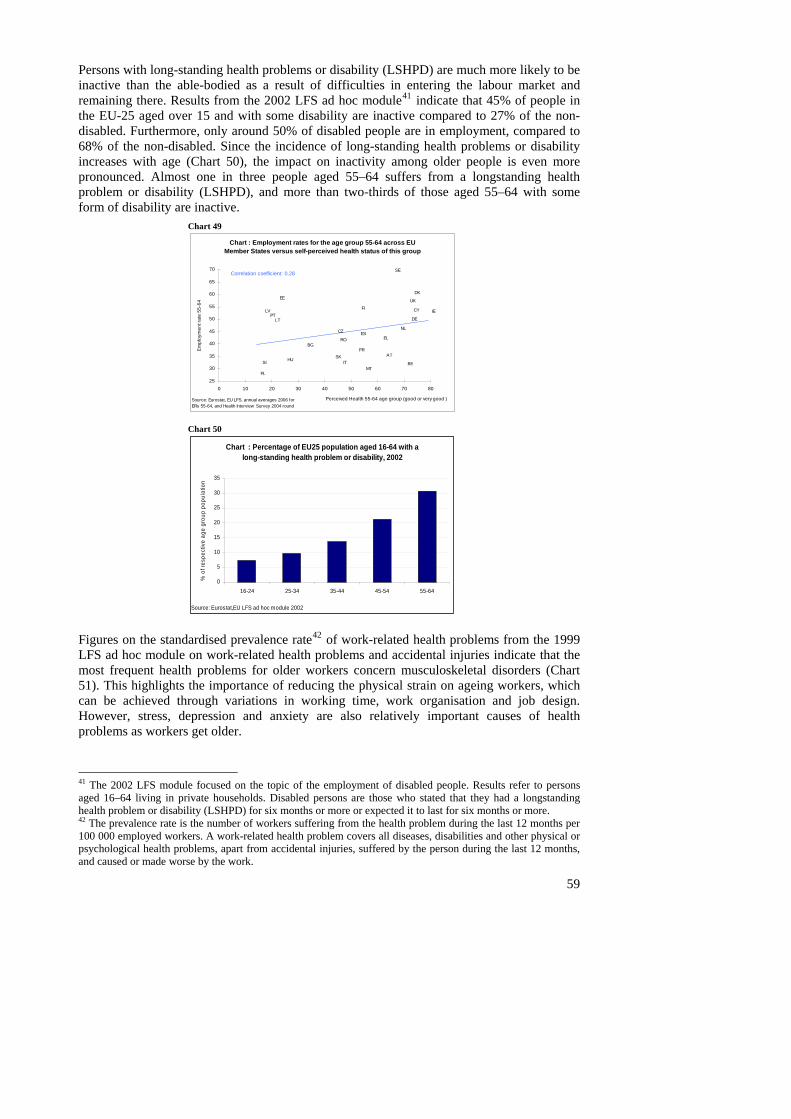
Persons with long-standing health problems or disability (LSHPD) are much more likely to be inactive than the able-bodied as a result of difficulties in entering the labour market and remaining there. Results from the 2002 LFS ad hoc module41 indicate that 45% of people in the EU-25 aged over 15 and with some disability are inactive compared to 27% of the non-disabled. Furthermore, only around 50% of disabled people are in employment, compared to 68% of the non-disabled. Since the incidence of long-standing health problems or disability increases with age (Chart 50), the impact on inactivity among older people is even more pronounced. Almost one in three people aged 55–64 suffers from a longstanding health problem or disability (LSHPD), and more than two-thirds of those aged 55–64 with some form of disability are inactive.
Chart 49
Chart : Employment rates for the age group 55-64 across EU Member States versus self-perceived health status of this group
SE
25
30
35
40
45
50
55
60
65
70
Em
ploy
men
t rat
e 55
-64 UK
FI
SKSI
RO
PT
PL
AT
NL
MT
HU
LT
LV CY
IT
FR
ESEL
IE
EE
DE
DK
CZ
BG
BE
0 10 20 30 40 50 60 70 80
Perceived Health 55-64 age group (good or very good )Source: EurostERs 55-64, and H
at, EU LFS, annual averages 2006 for ealth Interview Survey 2004 round
Correlation coefficient: 0.28
Chart 50
Chart : Percentage of EU25 population aged 16-64 with a long-standing health problem or disability, 2002
0
5
10
15
20
25
30
35
Source: Euro
% o
f res
pect
ive
age
grou
p po
pula
tion
16-24 25-34 35-44 45-54 55-64
stat,EU LFS ad hoc module 2002 Figures on the standardised prevalence rate42 of work-related health problems from the 1999 LFS ad hoc module on work-related health problems and accidental injuries indicate that the most frequent health problems for older workers concern musculoskeletal disorders (Chart 51). This highlights the importance of reducing the physical strain on ageing workers, which can be achieved through variations in working time, work organisation and job design. However, stress, depression and anxiety are also relatively important causes of health problems as workers get older.
41 The 2002 LFS module focused on the topic of the employment of disabled people. Results refer to persons aged 16–64 living in private households. Disabled persons are those who stated that they had a longstanding health problem or disability (LSHPD) for six months or more or expected it to last for six months or more. 42 The prevalence rate is the number of workers suffering from the health problem during the last 12 months per 100 000 employed workers. A work-related health problem covers all diseases, disabilities and other physical or psychological health problems, apart from accidental injuries, suffered by the person during the last 12 months, and caused or made worse by the work.
59
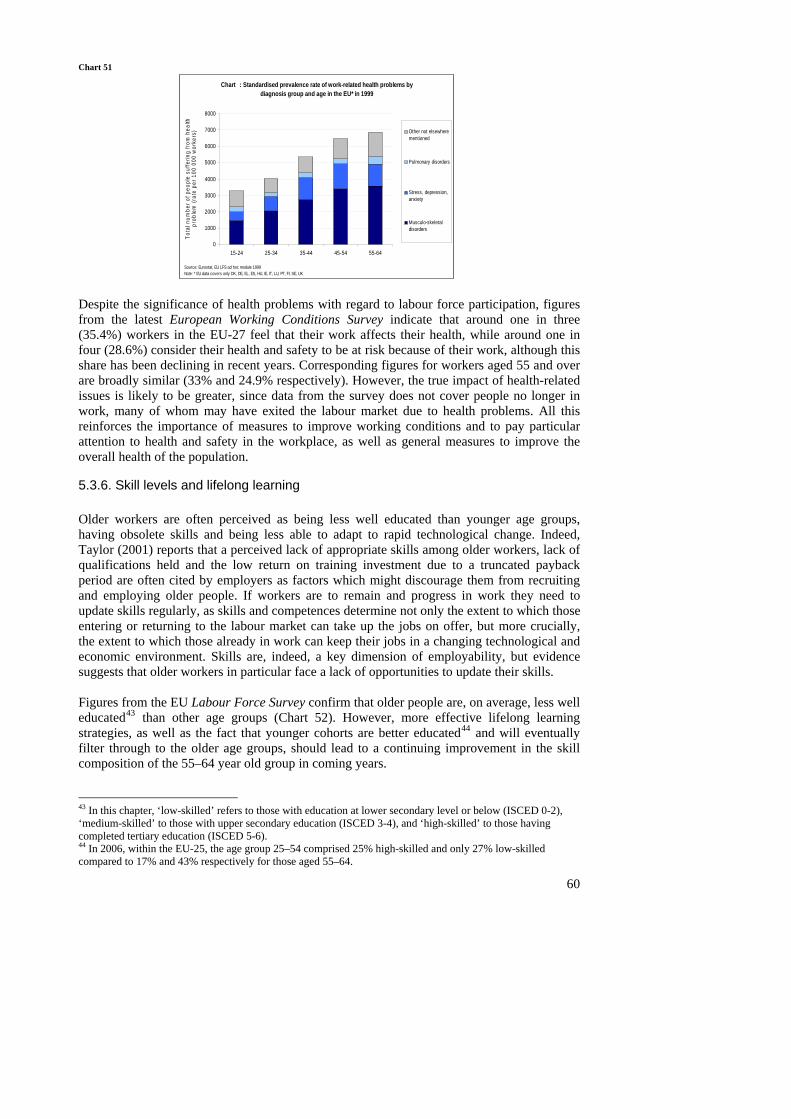
Chart 51 Chart : Standardised prevalence rate of work-related health problems by
diagnosis group and age in the EU* in 1999
0
00
00
00
00
00
00
00
00
15-24 25-34 35-44 45-54 55-64
at, EU LFS ad hoc module 1999 covers only DK, DE, EL, ES, HU, IE, IT, LU, PT, FI, SE, UK
10
20
30
40
50
60
70
80
Source: EurostNote: * EU data
Tota
l num
ber o
f peo
ple
suffe
ring
from
hea
lth
prob
lem
(rat
e pe
r 100
000
wor
kers
) Other not elsewherementioned
Pulmonary disorders
Stress, depression,anxiety
Musculo-skeletaldisorders
Despite the significance of health problems with regard to labour force participation, figures from the latest European Working Conditions Survey indicate that around one in three (35.4%) workers in the EU-27 feel that their work affects their health, while around one in four (28.6%) consider their health and safety to be at risk because of their work, although this share has been declining in recent years. Corresponding figures for workers aged 55 and over are broadly similar (33% and 24.9% respectively). However, the true impact of health-related issues is likely to be greater, since data from the survey does not cover people no longer in work, many of whom may have exited the labour market due to health problems. All this reinforces the importance of measures to improve working conditions and to pay particular attention to health and safety in the workplace, as well as general measures to improve the overall health of the population.
5.3.6. Skill levels and lifelong learning Older workers are often perceived as being less well educated than younger age groups, having obsolete skills and being less able to adapt to rapid technological change. Indeed, Taylor (2001) reports that a perceived lack of appropriate skills among older workers, lack of qualifications held and the low return on training investment due to a truncated payback period are often cited by employers as factors which might discourage them from recruiting and employing older people. If workers are to remain and progress in work they need to update skills regularly, as skills and competences determine not only the extent to which those entering or returning to the labour market can take up the jobs on offer, but more crucially, the extent to which those already in work can keep their jobs in a changing technological and economic environment. Skills are, indeed, a key dimension of employability, but evidence suggests that older workers in particular face a lack of opportunities to update their skills. Figures from the EU Labour Force Survey confirm that older people are, on average, less well educated43 than other age groups (Chart 52). However, more effective lifelong learning strategies, as well as the fact that younger cohorts are better educated44 and will eventually filter through to the older age groups, should lead to a continuing improvement in the skill composition of the 55–64 year old group in coming years.
43 In this chapter, ‘low-skilled’ refers to those with education at lower secondary level or below (ISCED 0-2), ‘medium-skilled’ to those with upper secondary education (ISCED 3-4), and ‘high-skilled’ to those having completed tertiary education (ISCED 5-6). 44 In 2006, within the EU-25, the age group 25–54 comprised 25% high-skilled and only 27% low-skilled compared to 17% and 43% respectively for those aged 55–64.
60
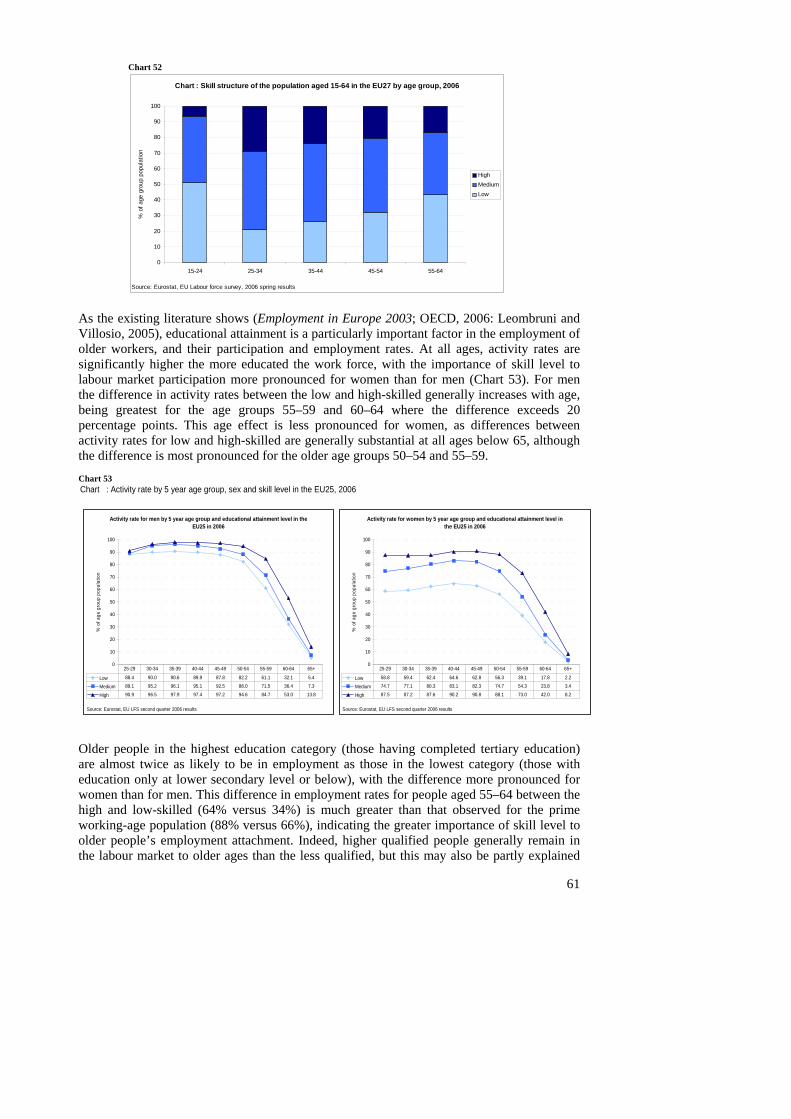
Chart 52 Chart : Skill structure of the population aged 15-64 in the EU27 by age group, 2006
0
10
20
30
40
50
60
70
80
90
100
15-24 25-34 35-44 45-54 55-64
: Eurostat, EU Labour force survey, 2006 spring resultsSource
% o
f age
gro
up p
opul
atio
n
HighMediumLow
As the existing literature shows (Employment in Europe 2003; OECD, 2006: Leombruni and Villosio, 2005), educational attainment is a particularly important factor in the employment of older workers, and their participation and employment rates. At all ages, activity rates are significantly higher the more educated the work force, with the importance of skill level to labour market participation more pronounced for women than for men (Chart 53). For men the difference in activity rates between the low and high-skilled generally increases with age, being greatest for the age groups 55–59 and 60–64 where the difference exceeds 20 percentage points. This age effect is less pronounced for women, as differences between activity rates for low and high-skilled are generally substantial at all ages below 65, although the difference is most pronounced for the older age groups 50–54 and 55–59. Chart 53 Chart : Activity rate by 5 year age group, sex and skill level in the EU25, 2006
Activity rate for men by 5 year age group and educational attainment level in the EU25 in 2006
80
90
100
S
n
0
10
20
30
40
50
60
70
ource: Eurostat, EU LFS second quarter 2006 results
% o
f age
gro
up p
opul
atio
Low 88.4 90.0 90.6 89.9 87.8 82.2 61.1 32.1 5.4
Medium 89.1 95.2 96.1 95.1 92.5 88.0 71.5 36.4 7.3
High 90.9 96.5 97.9 97.4 97.2 94.6 84.7 53.0 13.8
25-29 30-34 35-39 40-44 45-49 50-54 55-59 60-64 65+
Activity rate for women by 5 year age group and educational attainment level in the EU25 in 2006
80
90
100
n
0
10
20
30
40
50
60
70
Source: Eurostat, EU LFS second quarter 2006 results
% o
f age
gro
up p
opul
atio
Low 58.8 59.4 62.4 64.6 62.8 56.3 39.1 17.8 2.2
Medium 74.7 77.1 80.3 83.1 82.3 74.7 54.3 23.8 3.4
High 87.5 87.2 87.6 90.2 90.8 88.1 73.0 42.0 8.2
25-29 30-34 35-39 40-44 45-49 50-54 55-59 60-64 65+
Older people in the highest education category (those having completed tertiary education) are almost twice as likely to be in employment as those in the lowest category (those with education only at lower secondary level or below), with the difference more pronounced for women than for men. This difference in employment rates for people aged 55–64 between the high and low-skilled (64% versus 34%) is much greater than that observed for the prime working-age population (88% versus 66%), indicating the greater importance of skill level to older people’s employment attachment. Indeed, higher qualified people generally remain in the labour market to older ages than the less qualified, but this may also be partly explained
61
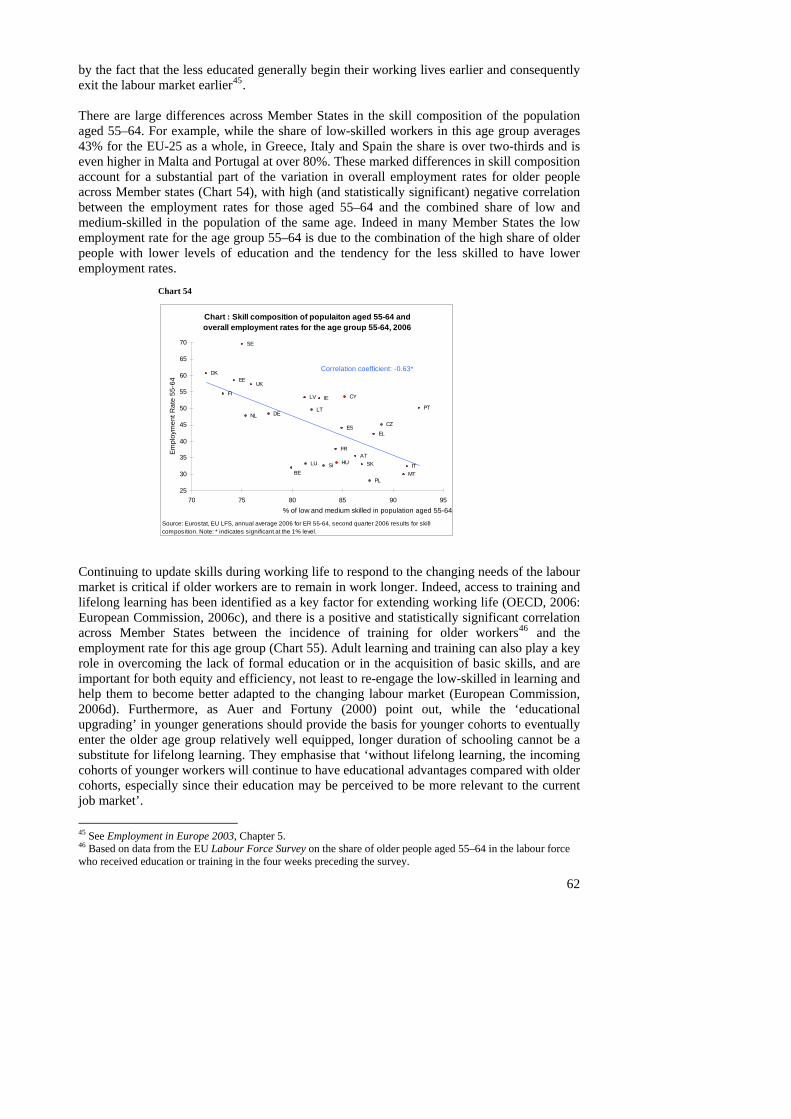
by the fact that the less educated generally begin their working lives earlier and consequently exit the labour market earlier45. There are large differences across Member States in the skill composition of the population aged 55–64. For example, while the share of low-skilled workers in this age group averages 43% for the EU-25 as a whole, in Greece, Italy and Spain the share is over two-thirds and is even higher in Malta and Portugal at over 80%. These marked differences in skill composition account for a substantial part of the variation in overall employment rates for older people across Member states (Chart 54), with high (and statistically significant) negative correlation between the employment rates for those aged 55–64 and the combined share of low and medium-skilled in the population of the same age. Indeed in many Member States the low employment rate for the age group 55–64 is due to the combination of the high share of older people with lower levels of education and the tendency for the less skilled to have lower employment rates.
Chart 54
Chart : Skill composition of populaiton aged 55-64 and overall employment rates for the age group 55-64, 2006
SE
25
30
35
40
45
50
55
60
65
70
Empl
oym
ent R
ate
55-6
4
UK
FI
SKSI
PT
PL
AT
NL
MT
HULU
LT
LV CY
IT
FR
ESEL
IE
EE
DE
DK
CZ
BE
70 75 80 85 90 95% of low and medium skilled in population aged 55-64
Source: Ecomposit
urostat, EU LFS, annual average 2006 for ER 55-64, second quarter 2006 results for skill ion. Note: * indicates significant at the 1% level.
Correlation coefficient: -0.63*
Continuing to update skills during working life to respond to the changing needs of the labour market is critical if older workers are to remain in work longer. Indeed, access to training and lifelong learning has been identified as a key factor for extending working life (OECD, 2006: European Commission, 2006c), and there is a positive and statistically significant correlation across Member States between the incidence of training for older workers46 and the employment rate for this age group (Chart 55). Adult learning and training can also play a key role in overcoming the lack of formal education or in the acquisition of basic skills, and are important for both equity and efficiency, not least to re-engage the low-skilled in learning and help them to become better adapted to the changing labour market (European Commission, 2006d). Furthermore, as Auer and Fortuny (2000) point out, while the ‘educational upgrading’ in younger generations should provide the basis for younger cohorts to eventually enter the older age group relatively well equipped, longer duration of schooling cannot be a substitute for lifelong learning. They emphasise that ‘without lifelong learning, the incoming cohorts of younger workers will continue to have educational advantages compared with older cohorts, especially since their education may be perceived to be more relevant to the current job market’.
45 See Employment in Europe 2003, Chapter 5. 46 Based on data from the EU Labour Force Survey on the share of older people aged 55–64 in the labour force who received education or training in the four weeks preceding the survey.
62
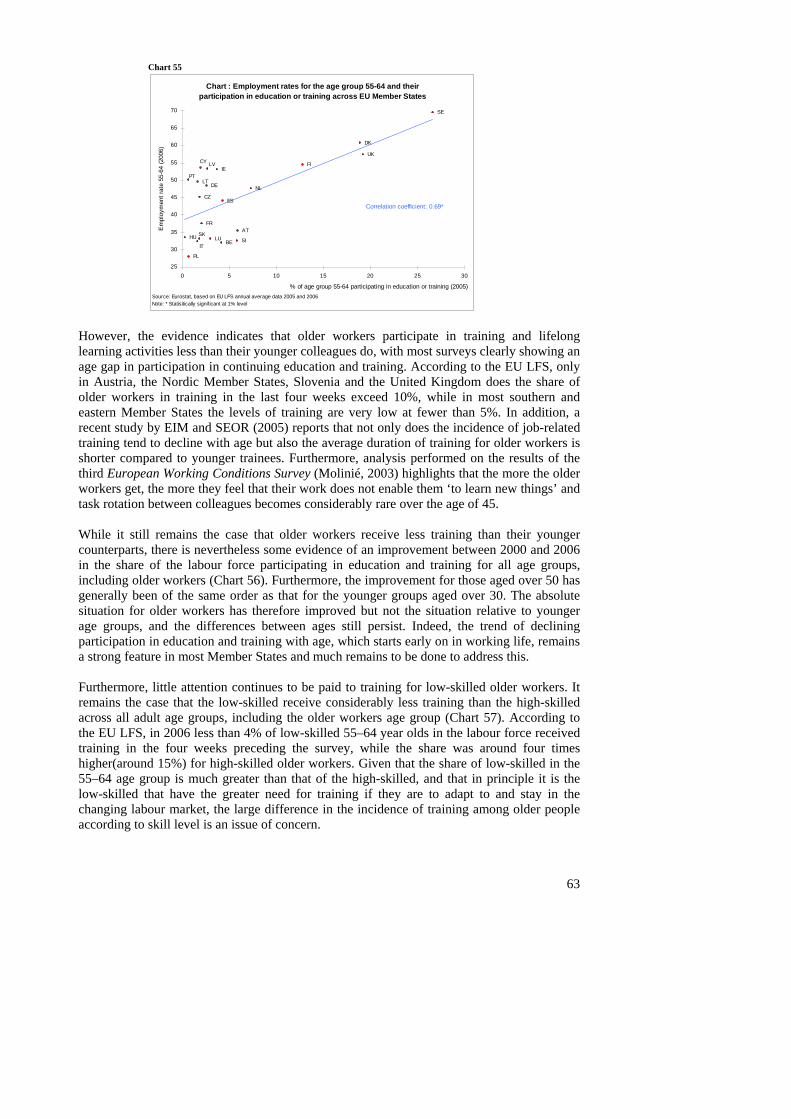
Chart 55
Chart : Employment rates for the age group 55-64 and their participation in education or training across EU Member States
BE
CZ
DK
DE
IE
ES
FR
IT
CY LV
LT
LUHU
NL
AT
PL
PT
SISK
FI
SE
UK
0 5 10 15 20 25 30
% of age group 55-64 participating in education or training (2005)
25
30
35
40
45
50
55
60
65
70
Em
ploy
men
t rat
e 55
-64
(200
6)
Source: ENote: * St
urostat, based on EU LFS annual average data 2005 and 2006atisitically signif icant at 1% level
Correlation coefficient: 0.69*
However, the evidence indicates that older workers participate in training and lifelong learning activities less than their younger colleagues do, with most surveys clearly showing an age gap in participation in continuing education and training. According to the EU LFS, only in Austria, the Nordic Member States, Slovenia and the United Kingdom does the share of older workers in training in the last four weeks exceed 10%, while in most southern and eastern Member States the levels of training are very low at fewer than 5%. In addition, a recent study by EIM and SEOR (2005) reports that not only does the incidence of job-related training tend to decline with age but also the average duration of training for older workers is shorter compared to younger trainees. Furthermore, analysis performed on the results of the third European Working Conditions Survey (Molinié, 2003) highlights that the more the older workers get, the more they feel that their work does not enable them ‘to learn new things’ and task rotation between colleagues becomes considerably rare over the age of 45. While it still remains the case that older workers receive less training than their younger counterparts, there is nevertheless some evidence of an improvement between 2000 and 2006 in the share of the labour force participating in education and training for all age groups, including older workers (Chart 56). Furthermore, the improvement for those aged over 50 has generally been of the same order as that for the younger groups aged over 30. The absolute situation for older workers has therefore improved but not the situation relative to younger age groups, and the differences between ages still persist. Indeed, the trend of declining participation in education and training with age, which starts early on in working life, remains a strong feature in most Member States and much remains to be done to address this. Furthermore, little attention continues to be paid to training for low-skilled older workers. It remains the case that the low-skilled receive considerably less training than the high-skilled across all adult age groups, including the older workers age group (Chart 57). According to the EU LFS, in 2006 less than 4% of low-skilled 55–64 year olds in the labour force received training in the four weeks preceding the survey, while the share was around four times higher(around 15%) for high-skilled older workers. Given that the share of low-skilled in the 55–64 age group is much greater than that of the high-skilled, and that in principle it is the low-skilled that have the greater need for training if they are to adapt to and stay in the changing labour market, the large difference in the incidence of training among older people according to skill level is an issue of concern.
63
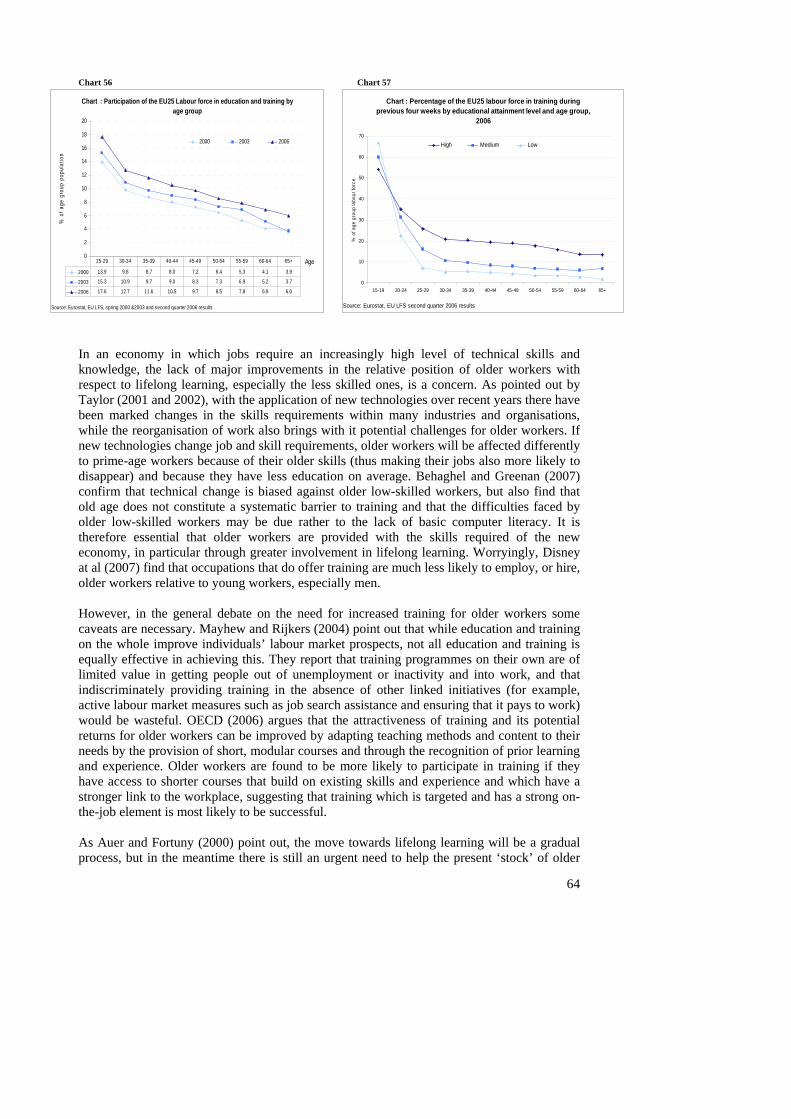
Chart 56 Chart 57
Chart : Participation of the EU25 Labour force in education and training by age group
0
2
4
6
8
10
12
14
16
18
20
ource: Eurostat, EU LFS, spring 2000 &2003 and second quarter 2006 results
% o
f age
gro
up p
opul
atio
n
S
2000 2003 2006
2000 13.9 9.8 8.7 8.0 7.2 6.4 5.3 4.1 3.9
2003 15.3 10.9 9.7 9.0 8.3 7.3 6.9 5.2 3.7
2006 17.6 12.7 11.6 10.5 9.7 8.5 7.8 6.9 6.0
25-29 30-34 35-39 40-44 45-49 50-54 55-59 60-64 65+ Age
Chartprevious
0
10
20
30
40
50
60
70
15-19 20-24
Source: Eurostat, EU LFS
% o
f age
gro
up la
bour
forc
e
: Percentage of the EU25 labour force in training during four weeks by educational attainment level and age group,
2006
25-29 30-34 35-39 40-44 45-49 50-54 55-59 60-64 65+
second quarter 2006 results
High Medium Low
In an economy in which jobs require an increasingly high level of technical skills and knowledge, the lack of major improvements in the relative position of older workers with respect to lifelong learning, especially the less skilled ones, is a concern. As pointed out by Taylor (2001 and 2002), with the application of new technologies over recent years there have been marked changes in the skills requirements within many industries and organisations, while the reorganisation of work also brings with it potential challenges for older workers. If new technologies change job and skill requirements, older workers will be affected differently to prime-age workers because of their older skills (thus making their jobs also more likely to disappear) and because they have less education on average. Behaghel and Greenan (2007) confirm that technical change is biased against older low-skilled workers, but also find that old age does not constitute a systematic barrier to training and that the difficulties faced by older low-skilled workers may be due rather to the lack of basic computer literacy. It is therefore essential that older workers are provided with the skills required of the new economy, in particular through greater involvement in lifelong learning. Worryingly, Disney at al (2007) find that occupations that do offer training are much less likely to employ, or hire, older workers relative to young workers, especially men. However, in the general debate on the need for increased training for older workers some caveats are necessary. Mayhew and Rijkers (2004) point out that while education and training on the whole improve individuals’ labour market prospects, not all education and training is equally effective in achieving this. They report that training programmes on their own are of limited value in getting people out of unemployment or inactivity and into work, and that indiscriminately providing training in the absence of other linked initiatives (for example, active labour market measures such as job search assistance and ensuring that it pays to work) would be wasteful. OECD (2006) argues that the attractiveness of training and its potential returns for older workers can be improved by adapting teaching methods and content to their needs by the provision of short, modular courses and through the recognition of prior learning and experience. Older workers are found to be more likely to participate in training if they have access to shorter courses that build on existing skills and experience and which have a stronger link to the workplace, suggesting that training which is targeted and has a strong on-the-job element is most likely to be successful. As Auer and Fortuny (2000) point out, the move towards lifelong learning will be a gradual process, but in the meantime there is still an urgent need to help the present ‘stock’ of older
64
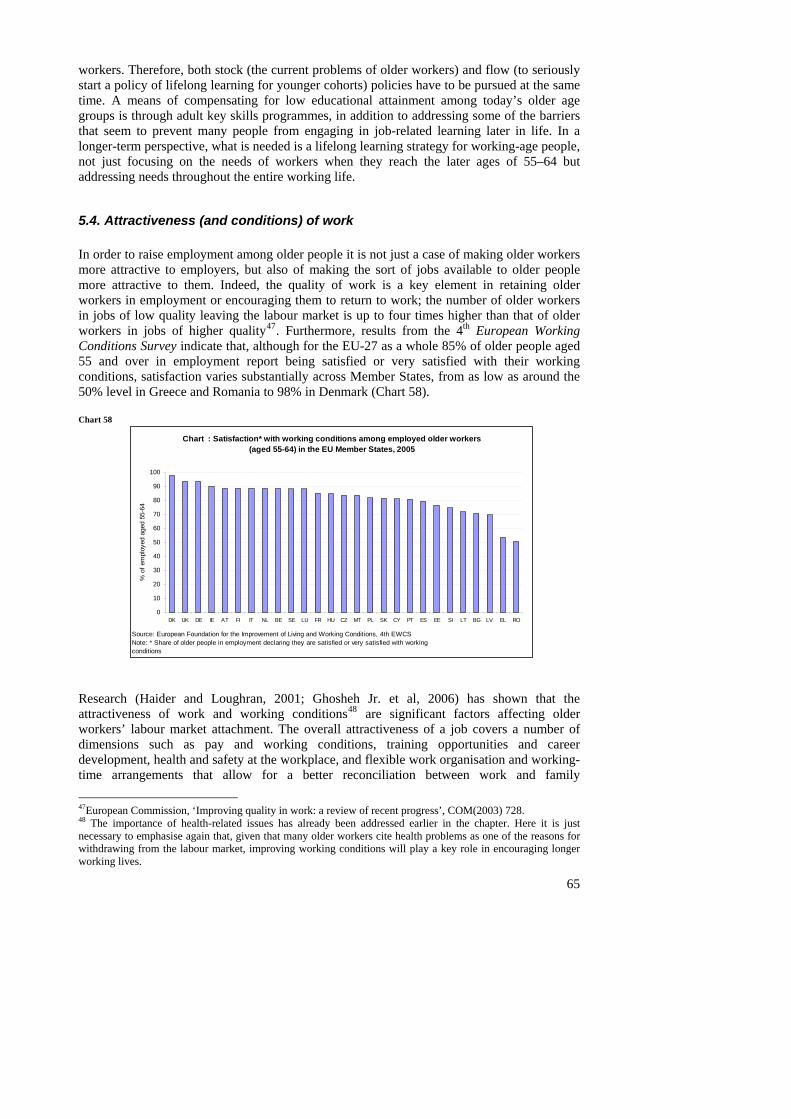
workers. Therefore, both stock (the current problems of older workers) and flow (to seriously start a policy of lifelong learning for younger cohorts) policies have to be pursued at the same time. A means of compensating for low educational attainment among today’s older age groups is through adult key skills programmes, in addition to addressing some of the barriers that seem to prevent many people from engaging in job-related learning later in life. In a longer-term perspective, what is needed is a lifelong learning strategy for working-age people, not just focusing on the needs of workers when they reach the later ages of 55–64 but addressing needs throughout the entire working life.
5.4. Attractiveness (and conditions) of work In order to raise employment among older people it is not just a case of making older workers more attractive to employers, but also of making the sort of jobs available to older people more attractive to them. Indeed, the quality of work is a key element in retaining older workers in employment or encouraging them to return to work; the number of older workers in jobs of low quality leaving the labour market is up to four times higher than that of older workers in jobs of higher quality47. Furthermore, results from the 4th European Working Conditions Survey indicate that, although for the EU-27 as a whole 85% of older people aged 55 and over in employment report being satisfied or very satisfied with their working conditions, satisfaction varies substantially across Member States, from as low as around the 50% level in Greece and Romania to 98% in Denmark (Chart 58). Chart 58
Chart : Satisfaction* with working conditions among employed older workers (aged 55-64) in the EU Member States, 2005
80
90
100
SourcNote: *condit
% o
f em
ploy
ed a
ged
55-6
4
0
10
20
30
40
50
60
70
DK UK DE IE AT FI IT NL BE SE LU FR HU CZ MT PL SK CY PT ES EE SI LT BG LV EL RO
e: European Foundation for the Improvement of Living and Working Conditions, 4th EWCS Share of older people in employment declaring they are satisfied or very satisfied with working
ions Research (Haider and Loughran, 2001; Ghosheh Jr. et al, 2006) has shown that the attractiveness of work and working conditions48 are significant factors affecting older workers’ labour market attachment. The overall attractiveness of a job covers a number of dimensions such as pay and working conditions, training opportunities and career development, health and safety at the workplace, and flexible work organisation and working-time arrangements that allow for a better reconciliation between work and family
47European Commission, ‘Improving quality in work: a review of recent progress’, COM(2003) 728. 48 The importance of health-related issues has already been addressed earlier in the chapter. Here it is just necessary to emphasise again that, given that many older workers cite health problems as one of the reasons for withdrawing from the labour market, improving working conditions will play a key role in encouraging longer working lives.
65
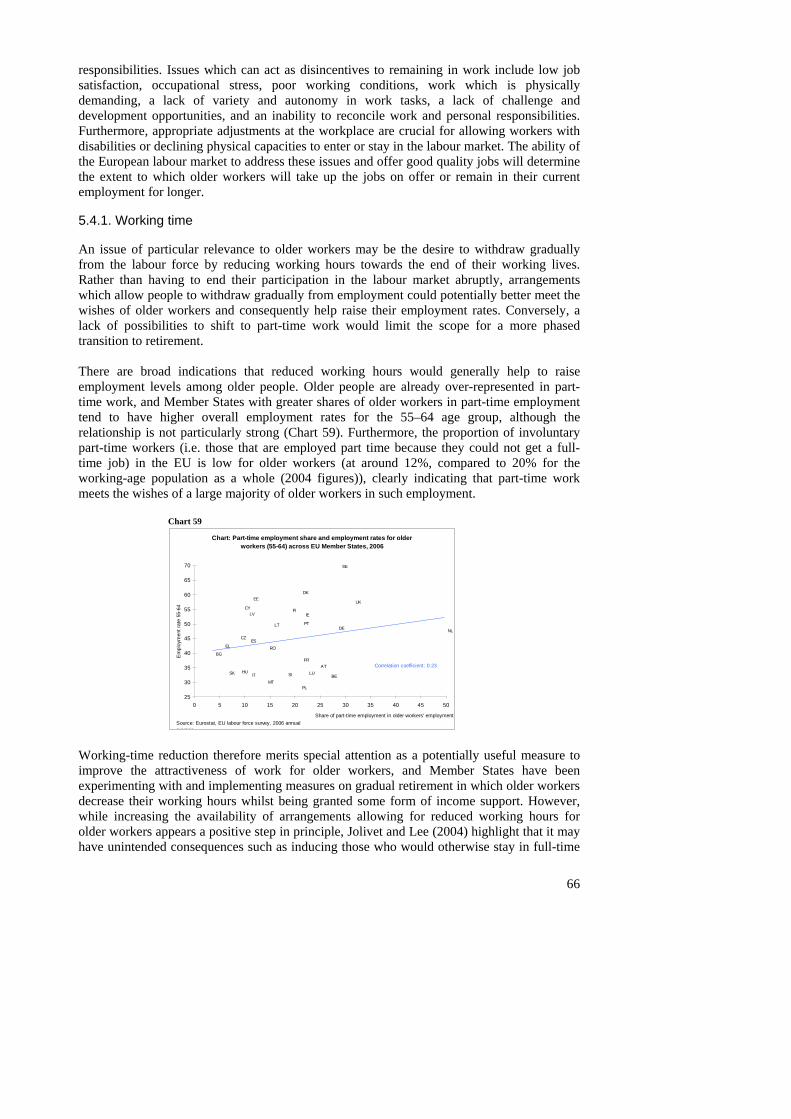
responsibilities. Issues which can act as disincentives to remaining in work include low job satisfaction, occupational stress, poor working conditions, work which is physically demanding, a lack of variety and autonomy in work tasks, a lack of challenge and development opportunities, and an inability to reconcile work and personal responsibilities. Furthermore, appropriate adjustments at the workplace are crucial for allowing workers with disabilities or declining physical capacities to enter or stay in the labour market. The ability of the European labour market to address these issues and offer good quality jobs will determine the extent to which older workers will take up the jobs on offer or remain in their current employment for longer.
5.4.1. Working time An issue of particular relevance to older workers may be the desire to withdraw gradually from the labour force by reducing working hours towards the end of their working lives. Rather than having to end their participation in the labour market abruptly, arrangements which allow people to withdraw gradually from employment could potentially better meet the wishes of older workers and consequently help raise their employment rates. Conversely, a lack of possibilities to shift to part-time work would limit the scope for a more phased transition to retirement. There are broad indications that reduced working hours would generally help to raise employment levels among older people. Older people are already over-represented in part-time work, and Member States with greater shares of older workers in part-time employment tend to have higher overall employment rates for the 55–64 age group, although the relationship is not particularly strong (Chart 59). Furthermore, the proportion of involuntary part-time workers (i.e. those that are employed part time because they could not get a full-time job) in the EU is low for older workers (at around 12%, compared to 20% for the working-age population as a whole (2004 figures)), clearly indicating that part-time work meets the wishes of a large majority of older workers in such employment.
Chart 59 Chart: Part-time employment share and employment rates for older
workers (55-64) across EU Member States, 2006
UK
SE
FI
PTLT
LVCY
IE
EEDK
25
30
35
40
45
50
55
60
65
70
0
Em
ploy
men
t rat
e 55
-64
SK SI
RO
PL
AT
NL
MT
HU LUIT
FR
ESEL
DE
CZ
BG
BE
5 10 15 20 25 30 35 40 45 50
Share of part-time employment in older workers' employmentSource: Eurostat, EU labour force survey, 2006 annual average
Correlation coefficient: 0.23
Working-time reduction therefore merits special attention as a potentially useful measure to improve the attractiveness of work for older workers, and Member States have been experimenting with and implementing measures on gradual retirement in which older workers decrease their working hours whilst being granted some form of income support. However, while increasing the availability of arrangements allowing for reduced working hours for older workers appears a positive step in principle, Jolivet and Lee (2004) highlight that it may have unintended consequences such as inducing those who would otherwise stay in full-time
66
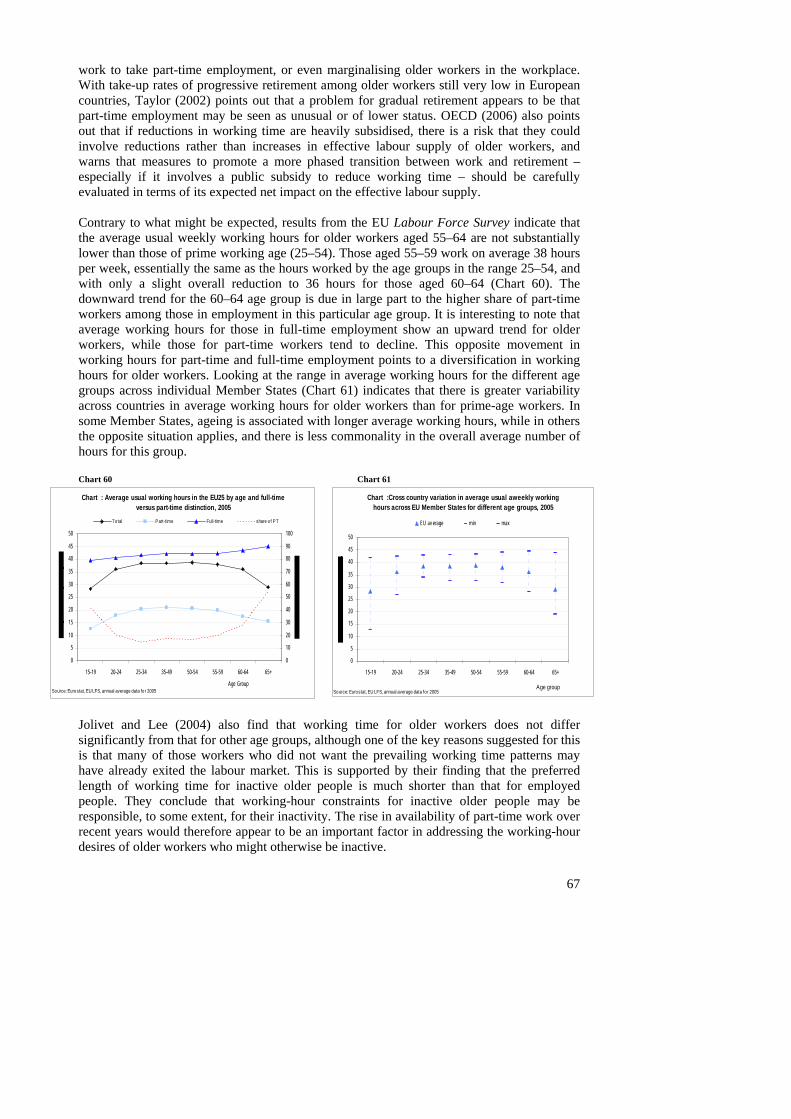
work to take part-time employment, or even marginalising older workers in the workplace. With take-up rates of progressive retirement among older workers still very low in European countries, Taylor (2002) points out that a problem for gradual retirement appears to be that part-time employment may be seen as unusual or of lower status. OECD (2006) also points out that if reductions in working time are heavily subsidised, there is a risk that they could involve reductions rather than increases in effective labour supply of older workers, and warns that measures to promote a more phased transition between work and retirement – especially if it involves a public subsidy to reduce working time – should be carefully evaluated in terms of its expected net impact on the effective labour supply. Contrary to what might be expected, results from the EU Labour Force Survey indicate that the average usual weekly working hours for older workers aged 55–64 are not substantially lower than those of prime working age (25–54). Those aged 55–59 work on average 38 hours per week, essentially the same as the hours worked by the age groups in the range 25–54, and with only a slight overall reduction to 36 hours for those aged 60–64 (Chart 60). The downward trend for the 60–64 age group is due in large part to the higher share of part-time workers among those in employment in this particular age group. It is interesting to note that average working hours for those in full-time employment show an upward trend for older workers, while those for part-time workers tend to decline. This opposite movement in working hours for part-time and full-time employment points to a diversification in working hours for older workers. Looking at the range in average working hours for the different age groups across individual Member States (Chart 61) indicates that there is greater variability across countries in average working hours for older workers than for prime-age workers. In some Member States, ageing is associated with longer average working hours, while in others the opposite situation applies, and there is less commonality in the overall average number of hours for this group. Chart 60 Chart 61
67
Chart : Average usual working hours in the EU25 by age and full-time versus part-time distinction, 2005
35
40
45
50
So
0
5
10
15
20
25
30
15-19 20-24 25-34 35-49 50-54 55-59 60-64 65+
urce: Eurostat, EU LFS, annual average data fo r 2005
0
10
20
30
40
50
60
70
80
90
100
Total Part-time Full-time share o f PT
Age Group
Chart :Cross country variation in average usual aweekly working hours across EU Member States for different age groups, 2005
0
5
10
15
20
25
30
35
40
45
50
15-19
Source: Eurostat, EU LFS, annu
EU av erage min max
20-24 25-34 35-49 50-54 55-59 60-64 65+
al average data for 2005Age group
Jolivet and Lee (2004) also find that working time for older workers does not differ significantly from that for other age groups, although one of the key reasons suggested for this is that many of those workers who did not want the prevailing working time patterns may have already exited the labour market. This is supported by their finding that the preferred length of working time for inactive older people is much shorter than that for employed people. They conclude that working-hour constraints for inactive older people may be responsible, to some extent, for their inactivity. The rise in availability of part-time work over recent years would therefore appear to be an important factor in addressing the working-hour desires of older workers who might otherwise be inactive.
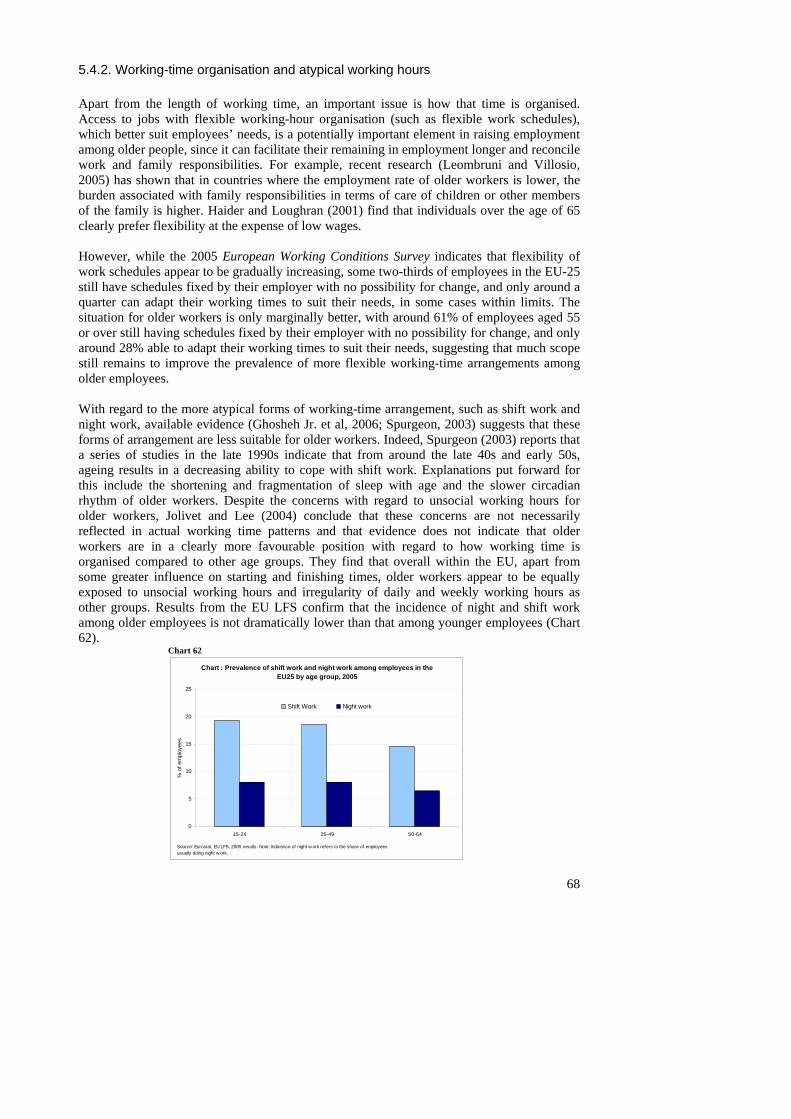
5.4.2. Working-time organisation and atypical working hours Apart from the length of working time, an important issue is how that time is organised. Access to jobs with flexible working-hour organisation (such as flexible work schedules), which better suit employees’ needs, is a potentially important element in raising employment among older people, since it can facilitate their remaining in employment longer and reconcile work and family responsibilities. For example, recent research (Leombruni and Villosio, 2005) has shown that in countries where the employment rate of older workers is lower, the burden associated with family responsibilities in terms of care of children or other members of the family is higher. Haider and Loughran (2001) find that individuals over the age of 65 clearly prefer flexibility at the expense of low wages. However, while the 2005 European Working Conditions Survey indicates that flexibility of work schedules appear to be gradually increasing, some two-thirds of employees in the EU-25 still have schedules fixed by their employer with no possibility for change, and only around a quarter can adapt their working times to suit their needs, in some cases within limits. The situation for older workers is only marginally better, with around 61% of employees aged 55 or over still having schedules fixed by their employer with no possibility for change, and only around 28% able to adapt their working times to suit their needs, suggesting that much scope still remains to improve the prevalence of more flexible working-time arrangements among older employees.
With regard to the more atypical forms of working-time arrangement, such as shift work and night work, available evidence (Ghosheh Jr. et al, 2006; Spurgeon, 2003) suggests that these forms of arrangement are less suitable for older workers. Indeed, Spurgeon (2003) reports that a series of studies in the late 1990s indicate that from around the late 40s and early 50s, ageing results in a decreasing ability to cope with shift work. Explanations put forward for this include the shortening and fragmentation of sleep with age and the slower circadian rhythm of older workers. Despite the concerns with regard to unsocial working hours for older workers, Jolivet and Lee (2004) conclude that these concerns are not necessarily reflected in actual working time patterns and that evidence does not indicate that older workers are in a clearly more favourable position with regard to how working time is organised compared to other age groups. They find that overall within the EU, apart from some greater influence on starting and finishing times, older workers appear to be equally exposed to unsocial working hours and irregularity of daily and weekly working hours as other groups. Results from the EU LFS confirm that the incidence of night and shift work among older employees is not dramatically lower than that among younger employees (Chart 62).
Chart 62 Chart : Prevalence of shift work and night work among employees in the
EU25 by age group, 2005
0
5
10
15
20
25
% o
f em
ploy
ees
15-24 25-49 50-64
Shift Work Night work
Source: Euusually doi
rostat, EU LFS, 2005 results. Note: Indicence of night w ork refers to the share of employees ng night w ork.
68
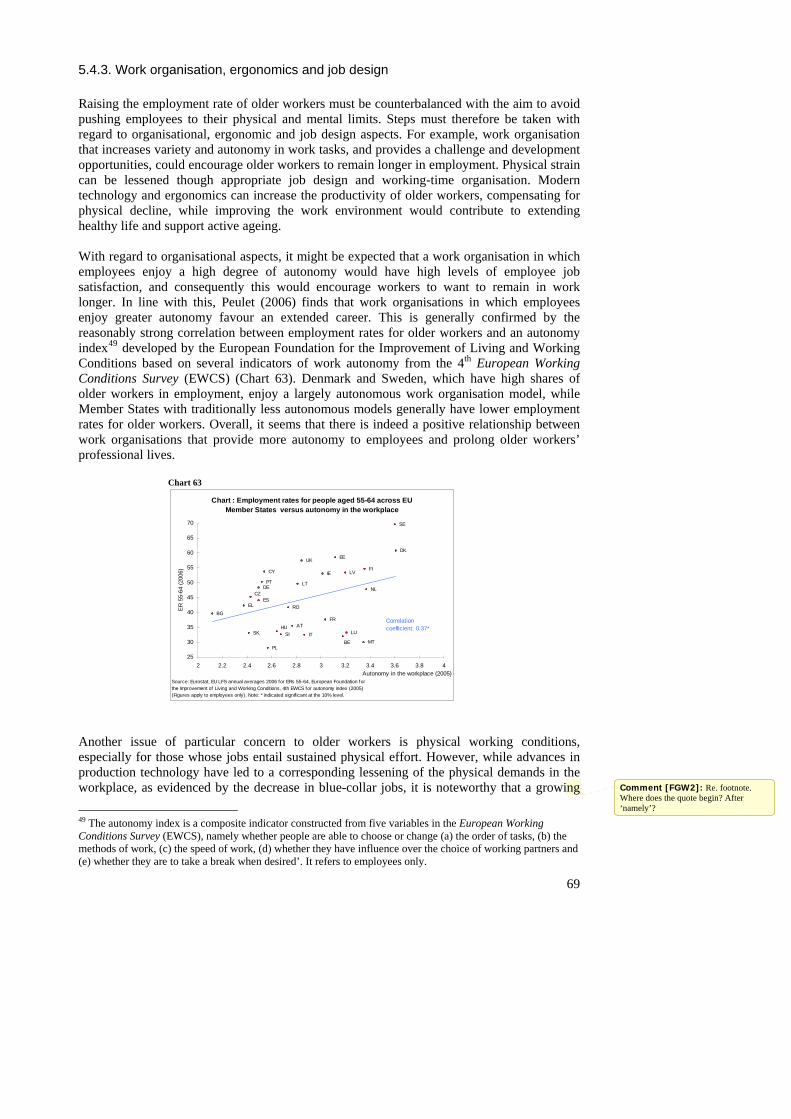
5.4.3. Work organisation, ergonomics and job design Raising the employment rate of older workers must be counterbalanced with the aim to avoid pushing employees to their physical and mental limits. Steps must therefore be taken with regard to organisational, ergonomic and job design aspects. For example, work organisation that increases variety and autonomy in work tasks, and provides a challenge and development opportunities, could encourage older workers to remain longer in employment. Physical strain can be lessened though appropriate job design and working-time organisation. Modern technology and ergonomics can increase the productivity of older workers, compensating for physical decline, while improving the work environment would contribute to extending healthy life and support active ageing. With regard to organisational aspects, it might be expected that a work organisation in which employees enjoy a high degree of autonomy would have high levels of employee job satisfaction, and consequently this would encourage workers to want to remain in work longer. In line with this, Peulet (2006) finds that work organisations in which employees enjoy greater autonomy favour an extended career. This is generally confirmed by the reasonably strong correlation between employment rates for older workers and an autonomy index49 developed by the European Foundation for the Improvement of Living and Working Conditions based on several indicators of work autonomy from the 4th European Working Conditions Survey (EWCS) (Chart 63). Denmark and Sweden, which have high shares of older workers in employment, enjoy a largely autonomous work organisation model, while Member States with traditionally less autonomous models generally have lower employment rates for older workers. Overall, it seems that there is indeed a positive relationship between work organisations that provide more autonomy to employees and prolong older workers’ professional lives.
Chart 63 Chart : Employment rates for people aged 55-64 across EU
Member States versus autonomy in the workplace
UK
SE
FILVCY IE
EEDK
25
30
35
40
45
50
55
60
65
70
2
ER
55-
64 (2
006)
SK SI
RO
PT
PL
AT
NL
MT
HULU
LT
IT
FR
ESEL
DECZ
BG
BE
2.2 2.4 2.6 2.8 3 3.2 3.4 3.6 3.8 4Autonomy in the workplace (2005)
Source: Eurthe Improvem(Figures appl
ostat, EU LFS annual averages 2006 for ERs 55-64, European Foundation for ent of Living and Working Conditions, 4th EWCS for autonomy index (2005) y to employees only). Note: * indicated signif icant at the 10% level.
Correlation coefficient: 0.37*
Another issue of particular concern to older workers is physical working conditions, especially for those whose jobs entail sustained physical effort. However, while advances in production technology have led to a corresponding lessening of the physical demands in the workplace, as evidenced by the decrease in blue-collar jobs, it is noteworthy that a growing
69
49 The autonomy index is a composite indicator constructed from five variables in the European Working Conditions Survey (EWCS), namely whether people are able to choose or change (a) the order of tasks, (b) the methods of work, (c) the speed of work, (d) whether they have influence over the choice of working partners and (e) whether they are to take a break when desired’. It refers to employees only.
Comment [FGW2]: Re. footnote. Where does the quote begin? After ‘namely’?
70
body of research has identified the phenomenon of work intensification50 and that consequently the level of non-physical demands faced by older workers (e.g. intense concentration and stress) may have increased significantly. Tros (2005) argues that the job and employment security of older workers is under pressure due to trends like work intensification, leading to loss of soft jobs and bridge jobs. Various ergonomic and job design measures can be implemented to address the specific work-environment needs of older workers, including those which prevent work-induced illness or disability and compensate for the decline in physical capabilities that comes with age. This may include, for example, the provision of better lighting and seating, removing the need for heavy lifting or violent twisting movements, and arranging workstations to avoid tiring movements and to improve working postures. Furthermore, older people can be reassigned to less physically demanding activities or their task organisation structured to allow more intervals between the more physically demanding tasks. However, Ghosheh Jr. et al (2006) point out that while measures specific to improving the working environment of older workers are often introduced in workplaces, it should be borne in mind that older workers’ health is a function of past as well as current working conditions, which means that the best approach lies in a policy of improving working conditions throughout working life.
6. A typology of approaches to active ageing in EU Member States
The previous analysis has highlighted some of the main factors which may influence the labour market attachment of older people and which either encourage or prevent them from extending their working lives. These fell into the broad categories of retirement, pensions and the balance of financial incentives, which focused on various disincentives or penalties to carry on working embedded in each country’s pension system and in other aspects of the tax and social welfare system, the factors affecting the availability of jobs to older workers, the employability of older workers, and the conditions and attractiveness of work, as well as the existence of a supportive environment. In this context it is interesting to examine the existence of different types of approach to active ageing within the EU Member States, in terms of the combination of policy-relevant measures aimed at addressing some of the key factors already identified as influencing the labour market participation of older workers. This provides an indication of the similarities and differences across countries in terms of how relevant active-ageing strategies are implemented, and in particular how groups of Member States stand with respect to various factors which have been recognised as being of particular importance to the employment of older people, and linking these with their present position with regard to older workers’ labour market outcomes, such as their employment rates. An initial examination has been carried out on the basis of a select set of factors which, based on the preceding review, appear particularly important with regard to the labour market situation of older workers. The approach focuses on a cluster analysis of variables which are representative indicators of the factors thus identified, and for which data are available for a large majority of the EU Member States. The variables concerned are the following:
• AV ORA: The standard retirement age as a simple average across male and female statutory ages for entitlement to a standard pension. Source: MISSOC 2006.
50 See, for example, the European Foundation for the Improvement of Living and Working Condition’s publication (2006), Fifteen years of working conditions in the EU: Charting of the trends.
71
• NRR at 65: The net pension replacement rate at age 65.51 This is a straightforward
indicator of pension levels (the ratio of annual benefits to earnings just before retirement) which influences older workers’ decisions to remain in work, depending on whether they consider their benefits to be high enough. Source: Report by the Indicators Sub-group (ISG) of the Social Protection Committee (SPC), 19 May 2006.
• ERN ratio: The ratio of average earnings for the age group 50–59 compared to
those aged under 29, for NACE sectors C to K, as a proxy for the influence of seniority wages. Source: Eurostat, Structure of Earnings Survey, 2002.
• Tax wedge: The tax wedge on labour costs,52 as a proxy for the influence of
distortions created by the tax system on older workers’ employment prospects. Source: Eurostat, Structural Indicators.
• EPL: The strictness of EPL, as given by the overall OECD indicator (2003 data).
Source: OECD (OECD.stat database), plus figures for Bulgaria, Estonia, Lithuania and Slovenia from S. Cazes and A. Nesporova (2007), Flexicurity: a relevant approach in Central and Eastern Europe, International Labour Office.
• ALMP (excl PES): Total expenditure on active labour market policy measures
(active spending excluding public employment services)53 as a percentage of GDP, as an indicator of the relative importance given to ALMP in general in Member States. It covers active interventions that aim to help the unemployed and other disadvantaged groups to prepare for or enter work, including training, job rotation and job sharing, employment incentives, integration of people with disabilities, direct job creation and start-up incentives. (Figures are the average over the years 2003–2005 where data is available, otherwise 2005 figures.) Source: Eurostat, Labour Market Policy database.
• LLL: Life-long learning, as the percentage of the population aged 25–64
participating in education and training. (This is very highly correlated (0.98) with the lifelong learning figures for the age group 55–64, and available for more countries.) Source: Eurostat, EU Labour Force Survey.
• Flex-work hours: Working-hour flexibility, as the percentage of employees aged
55+ who can adapt working hours to suit their needs (i.e. working hours entirely determined by them or can adapt working hours within certain limits). Source: European Foundation for the Improvement of Living and Working Conditions, 4th EWCS.
51 Data refers to the base case of a single person with a career length of 40 years, age at retirement 65, in full-time work and on average earnings. 52 Defined as income tax on gross wage earnings plus employee’s and employer’s social security contributions, expressed as a percentage of the total labour costs of the earner, defined as gross earnings plus the employer’s social security contributions plus payroll taxes (where applicable). Here data for the tax wedge refers to that for a single low-wage earner (earning 67% of the average worker earnings), without children. Employment in Europe 2004 reports that the cross-country correlation of the tax wedge between the categories ‘single worker with no children’ and ‘married couple with two children’ is high and stable over time. 53 This correlates very highly with active expenditure including PES (correlation coefficient 0.94).
72
• Flex-autonomy: Autonomy in work arrangements, as an index of the extent of autonomy in the workplace for employees. This index covers work organisation including control over order, methods and speed of tasks and ability to rest when desired. Source: European Foundation for the Improvement of Living and Working Conditions, 4th EWCS.
• Health (perc 55–64): Self-perceived health status among the older population (the
percentage of older people aged 55–64 declaring their health as good or very good). Source: Eurostat, Health Interview Surveys, 2004 round.
6.1. Cluster analysis on EU Member States The six main groupings of Member States (Table 12) can be distinguished by using hierarchical clustering54, which is a common and well-established statistical technique55, based on the 10 variables mentioned above. A robustness check was also carried out using the k-means clustering technique with the same number of clusters. The composition and characteristics of these six groups are (Chart 64):
• Group 1: Consists of the ‘western continental’ countries of Austria, Belgium, France, Germany and Italy, with the group characterised by intermediate standard retirement ages and pension replacement rates, together with intermediate work flexibility and lifelong learning participation, but relatively high EPL, tax wedge and relative earnings for older workers. The average (unweighted) employment rate of older workers is second lowest for this group.
• Group 2: Consists of the ‘Central European’ Member States of the Czech Republic,
Hungary, Poland, Slovenia and Slovakia, with the group characterised on the one hand by relatively low-perceived health and standard retirement ages, together with relatively low ALMP spending, lifelong learning participation and work flexibility, but on the other hand by comparatively low relative wages for older workers and EPL, and intermediate tax wedges. This group has the lowest (unweighted) employment rate for older workers.
• Group 3: This cluster includes the ‘Nordic’ countries of Denmark, Finland and Sweden, plus the Netherlands. It is characterised on the one hand by intermediately low pension-replacement rates, relative costs of older workers and EPL, but on the other by high-perceived health and standard retirement ages, together with substantially higher ALMP spending, lifelong learning participation and work flexibility. It has the highest average (unweighted) employment rate for older workers.
• Group 4: In this group are the ‘Baltic States’ of Estonia and Lithuania, which although
broadly similar to the Central European grouping of countries (Group 2) are
54 Using both complete linkage and Ward’s method of agglomeration. Only those Member States where data was available on all factors were included in the cluster analysis (21 of the 27 EU countries, excluding BG, CY, LU, LV, MT and RO). 55 A word of caution is required on the application of such techniques. Cluster analysis uses the country scores on the various factors to come up with groupings of countries based on some measure of ‘distance’. Results can be sensitive to the specific agglomeration methodology used and the particular parameters chosen for the clustering exercise. For a description of cluster analysis see Employment in Europe 2006, p. 109.
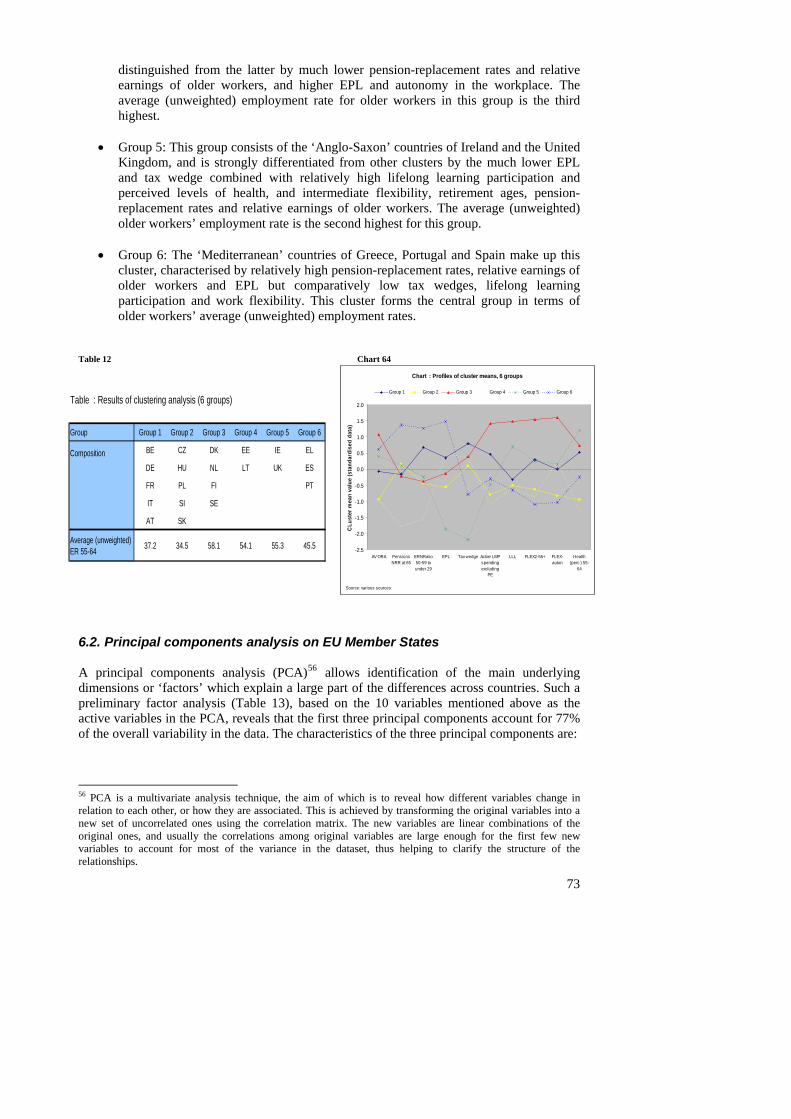
distinguished from the latter by much lower pension-replacement rates and relative earnings of older workers, and higher EPL and autonomy in the workplace. The average (unweighted) employment rate for older workers in this group is the third highest.
• Group 5: This group consists of the ‘Anglo-Saxon’ countries of Ireland and the United
Kingdom, and is strongly differentiated from other clusters by the much lower EPL and tax wedge combined with relatively high lifelong learning participation and perceived levels of health, and intermediate flexibility, retirement ages, pension-replacement rates and relative earnings of older workers. The average (unweighted) older workers’ employment rate is the second highest for this group.
• Group 6: The ‘Mediterranean’ countries of Greece, Portugal and Spain make up this
cluster, characterised by relatively high pension-replacement rates, relative earnings of older workers and EPL but comparatively low tax wedges, lifelong learning participation and work flexibility. This cluster forms the central group in terms of older workers’ average (unweighted) employment rates.
Table 12 Chart 64 Chart : Profiles of cluster means, 6 groups
-2.5
-2.0
-1.5
-1.0
-0.5
0.0
0.5
1.0
1.5
2.0
AV ORA PensNRR a
Source: various sources
CLu
ster
mea
n va
lue
(sta
ndar
dise
d da
ta)
ionst 65
ERNRatio50-59 tounder 29
EPL Tax wedge Active LMPspendingexcluding
PE
LLL FLEX2-55+ FLEX-auton
Health(perc ) 55-
64
Group 1 Group 2 Group 3 Group 4 Group 5 Group 6
Table : Results of clustering analysis (6 groups)
Group Group 1 Group 2 Group 3 Group 4 Group 5 Group 6
Co BE CZ DK EE IE EL
AvER
mpositionDE HU NL LT UK ES
FR PL FI PT
IT SI SE
AT SK
erage (unweighted) 55-64 37.2 34.5 58.1 54.1 55.3 45.5
6.2. Principal components analysis on EU Member States A principal components analysis (PCA)56 allows identification of the main underlying dimensions or ‘factors’ which explain a large part of the differences across countries. Such a preliminary factor analysis (Table 13), based on the 10 variables mentioned above as the active variables in the PCA, reveals that the first three principal components account for 77% of the overall variability in the data. The characteristics of the three principal components are:
56 PCA is a multivariate analysis technique, the aim of which is to reveal how different variables change in relation to each other, or how they are associated. This is achieved by transforming the original variables into a new set of uncorrelated ones using the correlation matrix. The new variables are linear combinations of the original ones, and usually the correlations among original variables are large enough for the first few new variables to account for most of the variance in the dataset, thus helping to clarify the structure of the relationships.
73
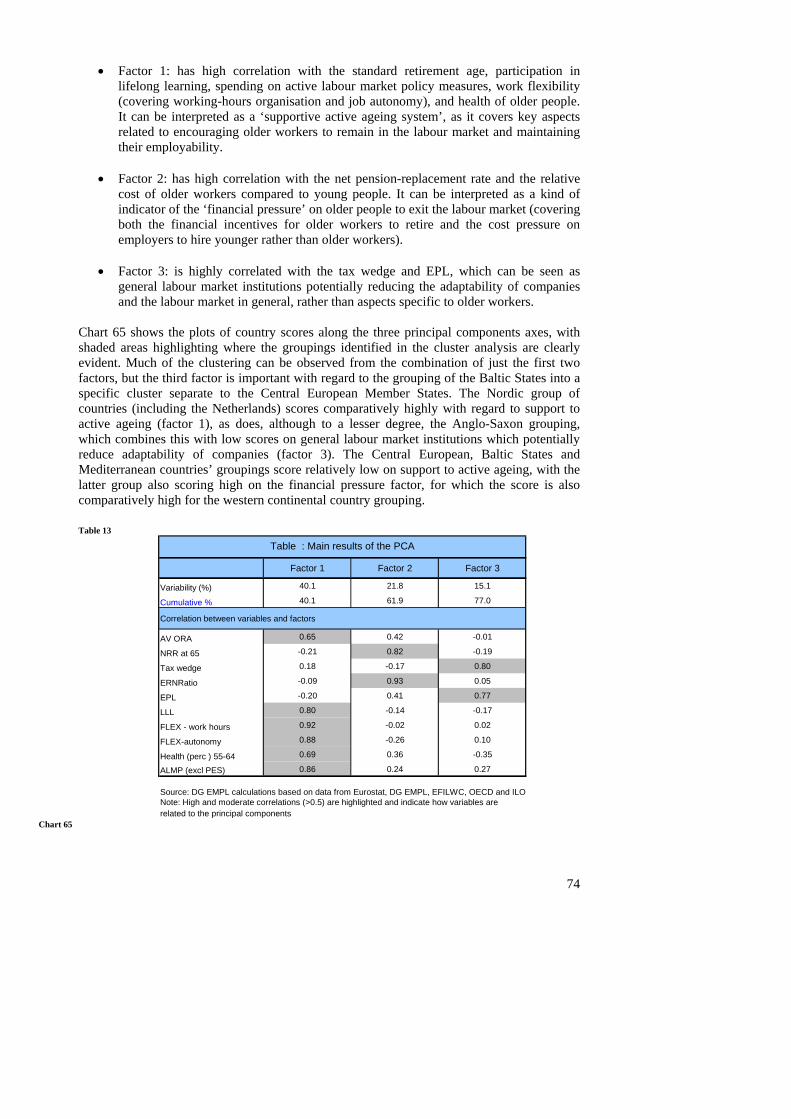
• Factor 1: has high correlation with the standard retirement age, participation in lifelong learning, spending on active labour market policy measures, work flexibility (covering working-hours organisation and job autonomy), and health of older people. It can be interpreted as a ‘supportive active ageing system’, as it covers key aspects related to encouraging older workers to remain in the labour market and maintaining their employability.
• Factor 2: has high correlation with the net pension-replacement rate and the relative
cost of older workers compared to young people. It can be interpreted as a kind of indicator of the ‘financial pressure’ on older people to exit the labour market (covering both the financial incentives for older workers to retire and the cost pressure on employers to hire younger rather than older workers).
• Factor 3: is highly correlated with the tax wedge and EPL, which can be seen as
general labour market institutions potentially reducing the adaptability of companies and the labour market in general, rather than aspects specific to older workers.
Chart 65 shows the plots of country scores along the three principal components axes, with shaded areas highlighting where the groupings identified in the cluster analysis are clearly evident. Much of the clustering can be observed from the combination of just the first two factors, but the third factor is important with regard to the grouping of the Baltic States into a specific cluster separate to the Central European Member States. The Nordic group of countries (including the Netherlands) scores comparatively highly with regard to support to active ageing (factor 1), as does, although to a lesser degree, the Anglo-Saxon grouping, which combines this with low scores on general labour market institutions which potentially reduce adaptability of companies (factor 3). The Central European, Baltic States and Mediterranean countries’ groupings score relatively low on support to active ageing, with the latter group also scoring high on the financial pressure factor, for which the score is also comparatively high for the western continental country grouping.
Table 13
Factor 1 Factor 2 Factor 3
Variability (%) 40.1 21.8 15.1
Cumulative % 40.1 61.9 77.0
Correlation between variables and factors
AV ORA 0.65 0.42 -0.01
NRR at 65 -0.21 0.82 -0.19
Tax wedge 0.18 -0.17 0.80
ERNRatio -0.09 0.93 0.05
EPL -0.20 0.41 0.77
LLL 0.80 -0.14 -0.17
FLEX - work hours 0.92 -0.02 0.02
FLEX-autonomy 0.88 -0.26 0.10
Health (perc ) 55-64 0.69 0.36 -0.35
ALMP (excl PES) 0.86 0.24 0.27
Source: DG EMPL calculations based on data from Eurostat, DG EMPL, EFILWC, OECD and ILONote: High and moderate correlations (>0.5) are highlighted and indicate how variables arerelated to the principal components
Table : Main results of the PCA
Chart 65
74
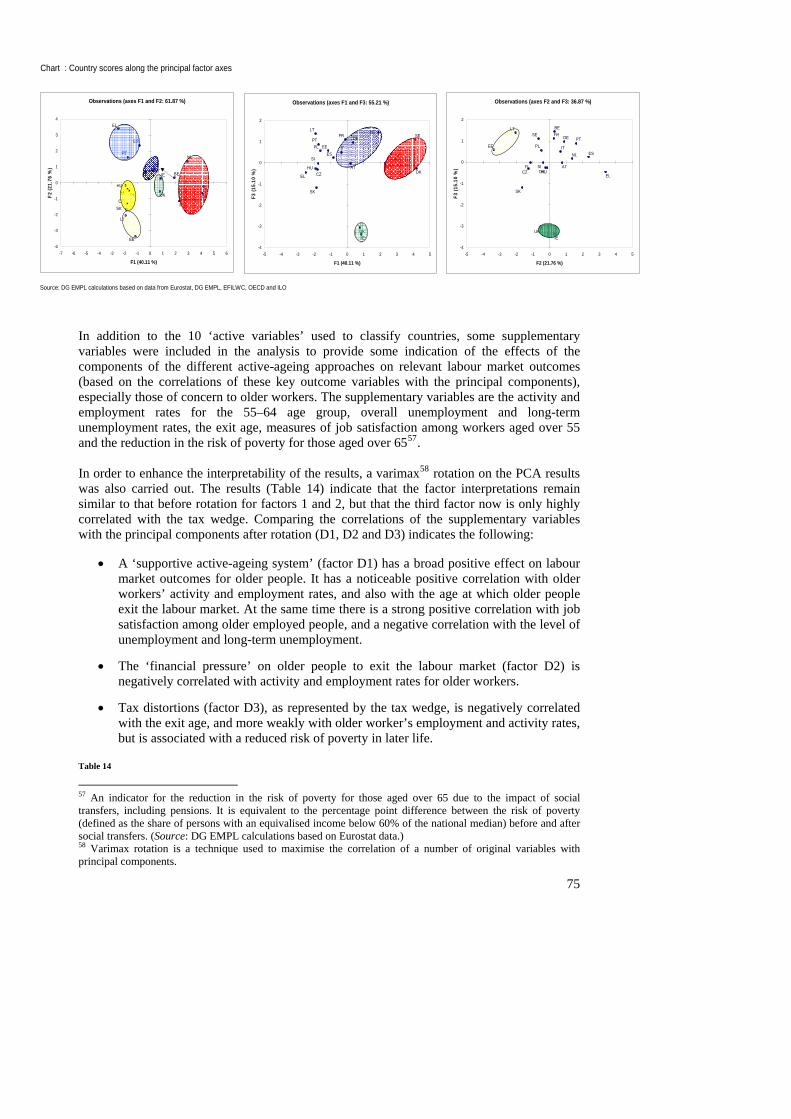
75
Chart : Country scores along the principal factor axes
Source: DG EMPL calculations based on data from Eurostat, DG EMPL, EFILWC, OECD and ILO
Observations (axes F1 and F2: 61.87 %)
UK SE
FISK
SI
PT
PL
AT
NL
HU
LT
ITFR
ES
EL
IE
EE
DE
DK
CZ
BE
-4
-3
-2
-1
0
1
2
3
4
-7 -6 -5 -4 -3 -2 -1 0 1 2 3 4 5 6
F1 (40.11 %)
F2 (2
1.76
%)
Observations (axes F1 and F3: 55.21 %)
UK
SE
FI
SK
SI
PTPL
AT
NL
HU
LT
IT
FR
ES
EL
IE
EE
DE
DKCZ
BE
-4
-3
-2
-1
0
1
2
-5 -4 -3 -2 -1 0 1 2 3 4 5
F1 (40.11 %)
F3 (1
5.10
%)
Observations (axes F2 and F3: 36.87 %)
BE
CZ DK
DE
EE
IE
EL
ES
FR
IT
LT
HU
NL
AT
PLPT
SI
SK
FI
SE
UK
-4
-3
-2
-1
0
1
2
-5 -4 -3 -2 -1 0 1 2 3 4 5
F2 (21.76 %)
F3 (1
5.10
%)
In addition to the 10 ‘active variables’ used to classify countries, some supplementary variables were included in the analysis to provide some indication of the effects of the components of the different active-ageing approaches on relevant labour market outcomes (based on the correlations of these key outcome variables with the principal components), especially those of concern to older workers. The supplementary variables are the activity and employment rates for the 55–64 age group, overall unemployment and long-term unemployment rates, the exit age, measures of job satisfaction among workers aged over 55 and the reduction in the risk of poverty for those aged over 6557. In order to enhance the interpretability of the results, a varimax58 rotation on the PCA results was also carried out. The results (Table 14) indicate that the factor interpretations remain similar to that before rotation for factors 1 and 2, but that the third factor now is only highly correlated with the tax wedge. Comparing the correlations of the supplementary variables with the principal components after rotation (D1, D2 and D3) indicates the following:
• A ‘supportive active-ageing system’ (factor D1) has a broad positive effect on labour market outcomes for older people. It has a noticeable positive correlation with older workers’ activity and employment rates, and also with the age at which older people exit the labour market. At the same time there is a strong positive correlation with job satisfaction among older employed people, and a negative correlation with the level of unemployment and long-term unemployment.
• The ‘financial pressure’ on older people to exit the labour market (factor D2) is negatively correlated with activity and employment rates for older workers.
• Tax distortions (factor D3), as represented by the tax wedge, is negatively correlated with the exit age, and more weakly with older worker’s employment and activity rates, but is associated with a reduced risk of poverty in later life.
Table 14
57 An indicator for the reduction in the risk of poverty for those aged over 65 due to the impact of social transfers, including pensions. It is equivalent to the percentage point difference between the risk of poverty (defined as the share of persons with an equivalised income below 60% of the national median) before and after social transfers. (Source: DG EMPL calculations based on Eurostat data.) 58 Varimax rotation is a technique used to maximise the correlation of a number of original variables with principal components.
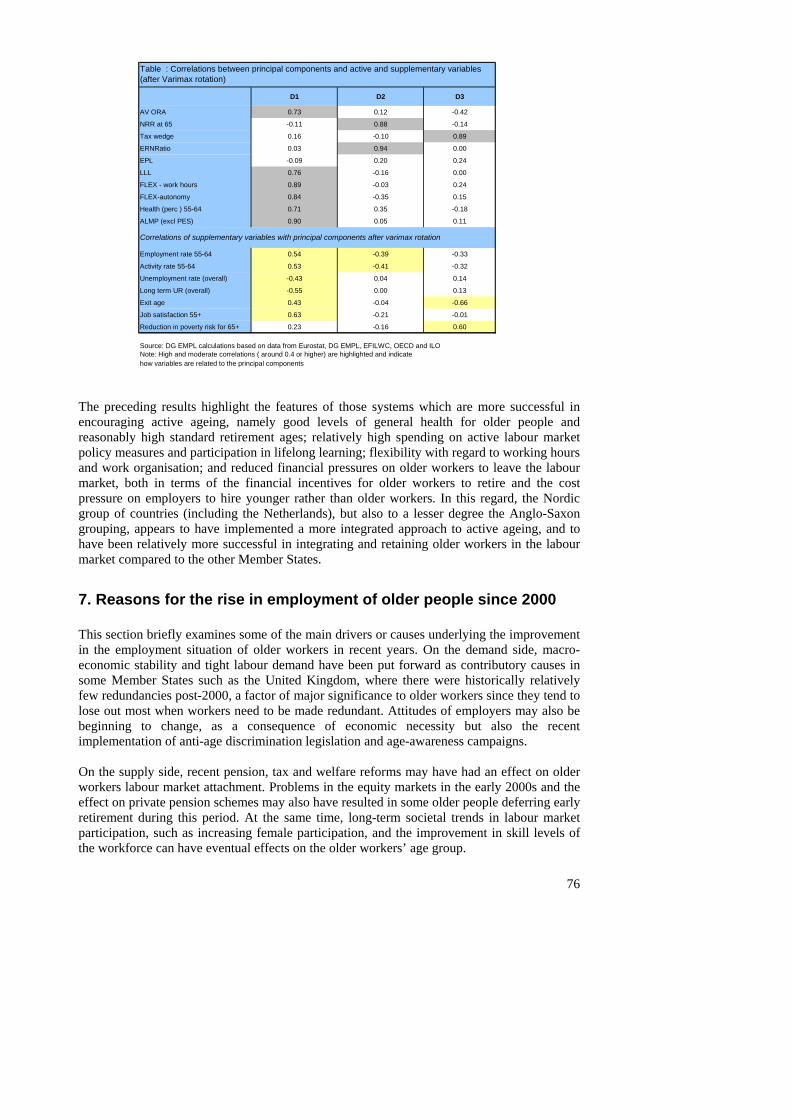
D1 D2 D3
A 0.73 0.12 -0.42
65 -0.11 0.88 -0.14
dge 0.16 -0.10 0.89
0.03 0.94 0.00
-0.09 0.20 0.24
0.76 -0.16 0.00
- work hours 0.89 -0.03 0.24
-autonomy 0.84 -0.35 0.15
perc ) 55-64 0.71 0.35 -0.18
cl PES) 0.90 0.05 0.11
ment rate 55-64 0.54 -0.39 -0.33
rate 55-64 0.53 -0.41 -0.32
loyment rate (overall) -0.43 0.04 0.14
term UR (overall) -0.55 0.00 0.13
0.43 -0.04 -0.66
isfaction 55+ 0.63 -0.21 -0.01
tion in poverty risk for 65+ 0.23 -0.16 0.60
: DG EMPL calculations based on data from Eurostat, DG EMPL, EFILWC, OECD and ILOigh and moderate correlations ( around 0.4 or higher) are highlighted and indicate iables are related to the principal components
lations of supplementary variables with principal components after varimax rotation
Varimax rotation)
AV OR
NRR at
Tax we
ERNRatio
EPL
LLL
FLEX
FLEX
Health (
ALMP (ex
Employ
Activity
Unemp
Long
Exit age
Job sat
Reduc
SourceNote: Hhow var
Corre
Table : Correlations between principal components and active and supplementary variables (after
The preceding results highlight the features of those systems which are more successful in encouraging active ageing, namely good levels of general health for older people and reasonably high standard retirement ages; relatively high spending on active labour market policy measures and participation in lifelong learning; flexibility with regard to working hours and work organisation; and reduced financial pressures on older workers to leave the labour market, both in terms of the financial incentives for older workers to retire and the cost pressure on employers to hire younger rather than older workers. In this regard, the Nordic group of countries (including the Netherlands), but also to a lesser degree the Anglo-Saxon grouping, appears to have implemented a more integrated approach to active ageing, and to have been relatively more successful in integrating and retaining older workers in the labour market compared to the other Member States.
7. Reasons for the rise in employment of older people since 2000 This section briefly examines some of the main drivers or causes underlying the improvement in the employment situation of older workers in recent years. On the demand side, macro-economic stability and tight labour demand have been put forward as contributory causes in some Member States such as the United Kingdom, where there were historically relatively few redundancies post-2000, a factor of major significance to older workers since they tend to lose out most when workers need to be made redundant. Attitudes of employers may also be beginning to change, as a consequence of economic necessity but also the recent implementation of anti-age discrimination legislation and age-awareness campaigns. On the supply side, recent pension, tax and welfare reforms may have had an effect on older workers labour market attachment. Problems in the equity markets in the early 2000s and the effect on private pension schemes may also have resulted in some older people deferring early retirement during this period. At the same time, long-term societal trends in labour market participation, such as increasing female participation, and the improvement in skill levels of the workforce can have eventual effects on the older workers’ age group.
76
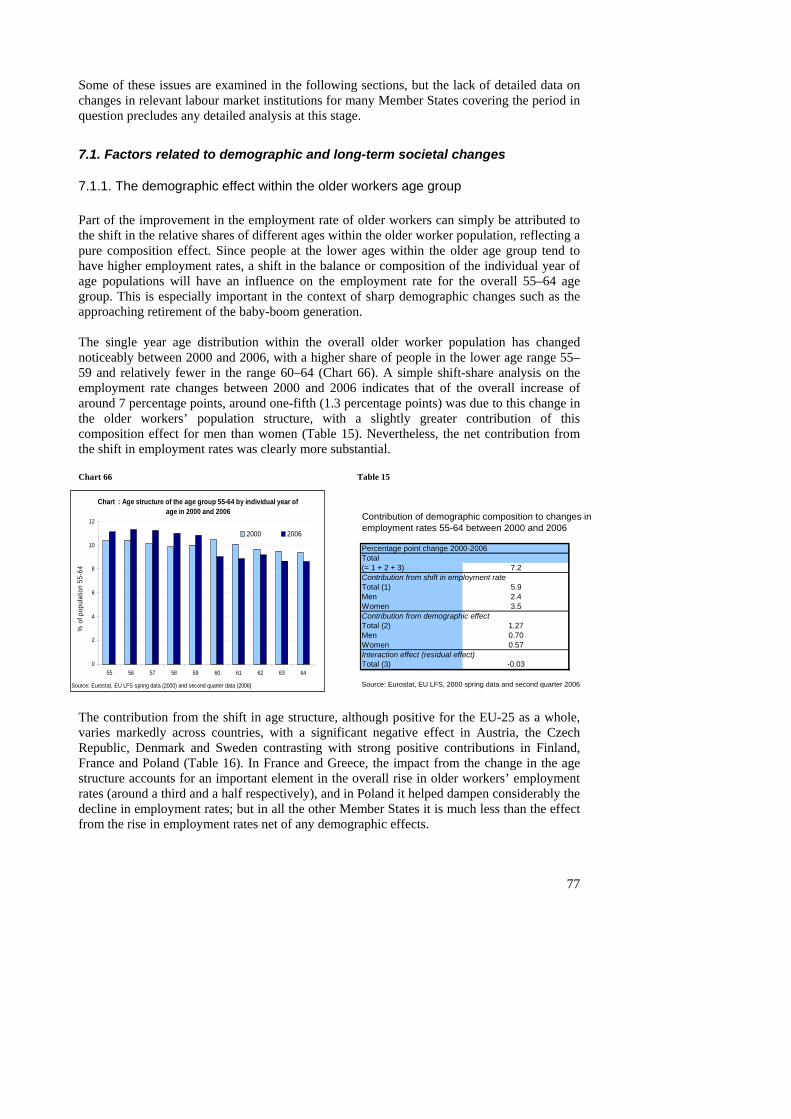
Some of these issues are examined in the following sections, but the lack of detailed data on changes in relevant labour market institutions for many Member States covering the period in question precludes any detailed analysis at this stage.
7.1. Factors related to demographic and long-term societal changes
7.1.1. The demographic effect within the older workers age group Part of the improvement in the employment rate of older workers can simply be attributed to the shift in the relative shares of different ages within the older worker population, reflecting a pure composition effect. Since people at the lower ages within the older age group tend to have higher employment rates, a shift in the balance or composition of the individual year of age populations will have an influence on the employment rate for the overall 55–64 age group. This is especially important in the context of sharp demographic changes such as the approaching retirement of the baby-boom generation. The single year age distribution within the overall older worker population has changed noticeably between 2000 and 2006, with a higher share of people in the lower age range 55–59 and relatively fewer in the range 60–64 (Chart 66). A simple shift-share analysis on the employment rate changes between 2000 and 2006 indicates that of the overall increase of around 7 percentage points, around one-fifth (1.3 percentage points) was due to this change in the older workers’ population structure, with a slightly greater contribution of this composition effect for men than women (Table 15). Nevertheless, the net contribution from the shift in employment rates was clearly more substantial.
Chart 66 Table 15
Chart : Age structure of the age group 55-64 by individual year of age in 2000 and 2006
8
10
12
So
55-6
4
0
2
4
6
55 56 57 58 59 60 61 62 63 64
urce: Eurostat, EU LFS spring data (2000) and second quarter data (2006)
% o
f pop
ulat
ion
77
2000 2006
Contribution of demographic composition to changes in employment rates 55-64 between 2000 and 2006
Percentage point change 2000-2006Total(= 1 + 2 + 3) 7.2Contribution from shift in employment rateTotal (1) 5.9Men 2.4Women 3.5Contribution from dTotal (2)MenWomenInteraction effect (rTotal (3)
Source: Eurostat, EU
emographic effect1.270.700.57
esidual effect)-0.03
LFS, 2000 spring data and second quarter 2006
The contribution from the shift in age structure, although positive for the EU-25 as a whole, varies markedly across countries, with a significant negative effect in Austria, the Czech Republic, Denmark and Sweden contrasting with strong positive contributions in Finland, France and Poland (Table 16). In France and Greece, the impact from the change in the age structure accounts for an important element in the overall rise in older workers’ employment rates (around a third and a half respectively), and in Poland it helped dampen considerably the decline in employment rates; but in all the other Member States it is much less than the effect from the rise in employment rates net of any demographic effects.
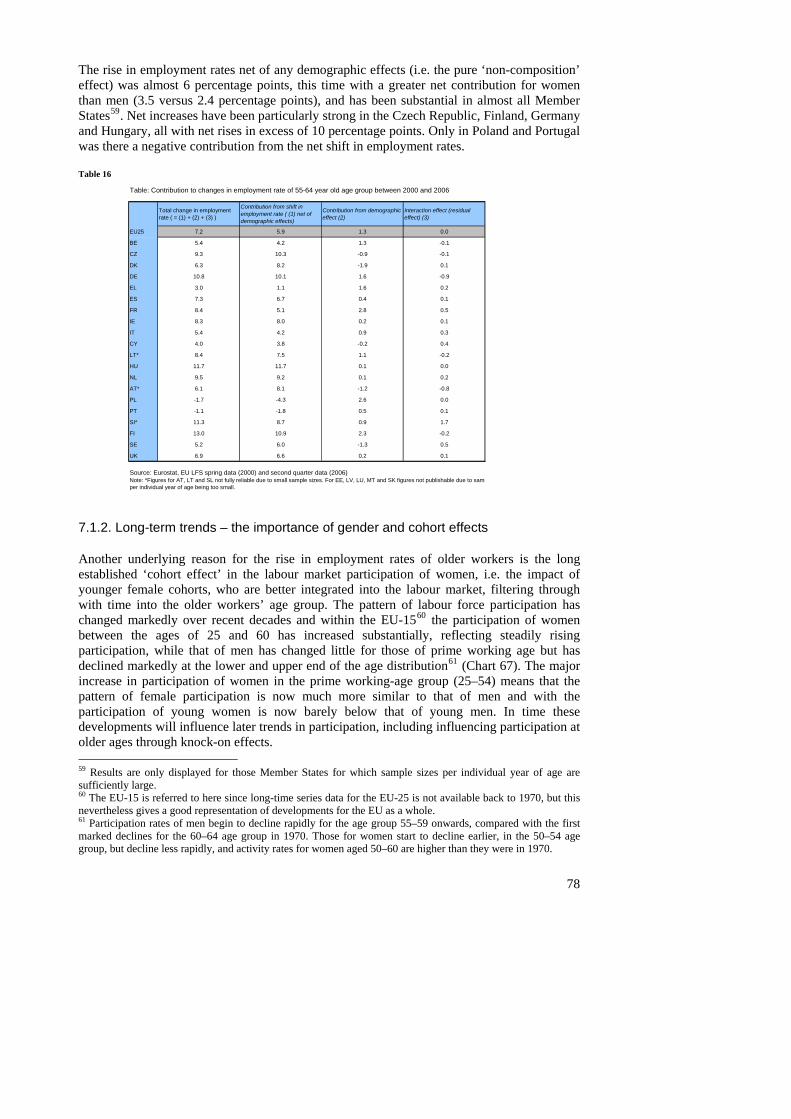
The rise in employment rates net of any demographic effects (i.e. the pure ‘non-composition’ effect) was almost 6 percentage points, this time with a greater net contribution for women than men (3.5 versus 2.4 percentage points), and has been substantial in almost all Member States59. Net increases have been particularly strong in the Czech Republic, Finland, Germany and Hungary, all with net rises in excess of 10 percentage points. Only in Poland and Portugal was there a negative contribution from the net shift in employment rates. Table 16
Table: Contribution to changes in employment rate of 55-64 year old age group between 2000 and 2006
Total change in employment rate ( = (1) + (2) + (3) )
Contribution from shift in employment rate ( (1) net of Contribution from demographic
effect (2)Interaction effect (residual effect) (3)
EU25
BE
CZ
DK
DE
EL
ES
IE
IT
CY
LT*
HU
AT*
PL
PT
SI*
FI
SE
SourceNote: *Fig
demographic effects)
7.2 5.9 1.3 0.0
5.4 4.2 1.3 -0.1
9.3 10.3 -0.9 -0.1
6.3 8.2 -1.9 0.1
10.8 10.1 1.6 -0.9
3.0 1.1 1.6 0.2
7.3 6.7 0.4 0.1
FR 8.4 5.1 2.8 0.5
8.3 8.0 0.2 0.1
5.4 4.2 0.9 0.3
4.0 3.8 -0.2 0.4
8.4 7.5 1.1 -0.2
11.7 11.7 0.1 0.0
NL 9.5 9.2 0.1 0.2
6.1 8.1 -1.2 -0.8
-1.7 -4.3 2.6 0.0
-1.1 -1.8 0.5 0.1
11.3 8.7 0.9 1.7
13.0 10.9 2.3 -0.2
5.2 6.0 -1.3 0.5
UK 6.9 6.6 0.2 0.1
: Eurostat, EU LFS spring data (2000) and second quarter data (2006)ures for AT, LT and SL not fully reliable due to small sample sizes. For EE, LV, LU, MT and SK figures not publishable due to samp
per individual year of age being too small.
7.1.2. Long-term trends – the importance of gender and cohort effects Another underlying reason for the rise in employment rates of older workers is the long established ‘cohort effect’ in the labour market participation of women, i.e. the impact of younger female cohorts, who are better integrated into the labour market, filtering through with time into the older workers’ age group. The pattern of labour force participation has changed markedly over recent decades and within the EU-1560 the participation of women between the ages of 25 and 60 has increased substantially, reflecting steadily rising participation, while that of men has changed little for those of prime working age but has declined markedly at the lower and upper end of the age distribution61 (Chart 67). The major increase in participation of women in the prime working-age group (25–54) means that the pattern of female participation is now much more similar to that of men and with the participation of young women is now barely below that of young men. In time these developments will influence later trends in participation, including influencing participation at older ages through knock-on effects. 59 Results are only displayed for those Member States for which sample sizes per individual year of age are sufficiently large. 60 The EU-15 is referred to here since long-time series data for the EU-25 is not available back to 1970, but this nevertheless gives a good representation of developments for the EU as a whole. 61 Participation rates of men begin to decline rapidly for the age group 55–59 onwards, compared with the first marked declines for the 60–64 age group in 1970. Those for women start to decline earlier, in the 50–54 age group, but decline less rapidly, and activity rates for women aged 50–60 are higher than they were in 1970.
78
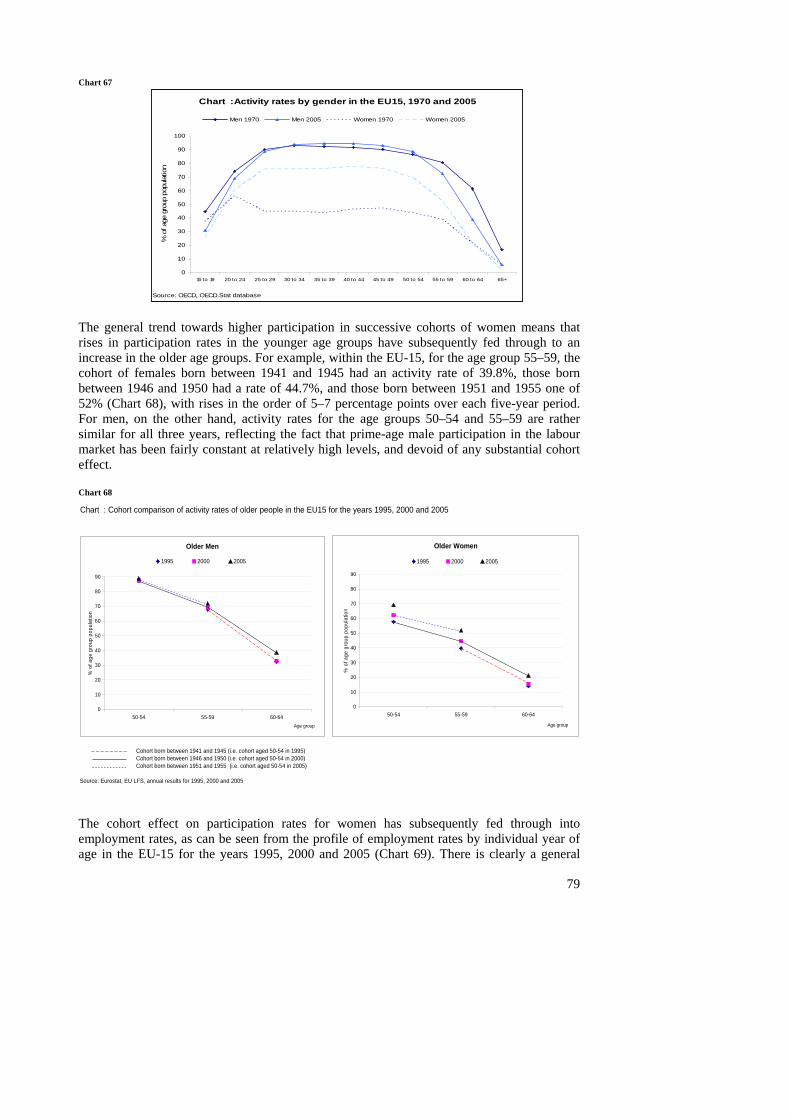
Chart 67
Chart :Activity rates by gender in the EU15, 1970 and 2005
0
10
20
30
40
50
60
70
80
90
100
15 to 19 20 to 24 25 to 29 30 to 34 35 to 39 40 to 44 45 to 49 50 to 54 55 to 59 60 to 64 65+
: OECD, OECD.Stat databaseSource
% o
f age
gro
up p
opul
atio
n
Men 1970 Men 2005 Women 1970 Women 2005
The general trend towards higher participation in successive cohorts of women means that rises in participation rates in the younger age groups have subsequently fed through to an increase in the older age groups. For example, within the EU-15, for the age group 55–59, the cohort of females born between 1941 and 1945 had an activity rate of 39.8%, those born between 1946 and 1950 had a rate of 44.7%, and those born between 1951 and 1955 one of 52% (Chart 68), with rises in the order of 5–7 percentage points over each five-year period. For men, on the other hand, activity rates for the age groups 50–54 and 55–59 are rather similar for all three years, reflecting the fact that prime-age male participation in the labour market has been fairly constant at relatively high levels, and devoid of any substantial cohort effect. Chart 68 Chart : Cohort comparison of activity rates of older people in the EU15 for the years 1995, 2000 and 2005
Cohort born between 1941 and 1945 (i.e. cohort aged 50-54 in 1995)Cohort born between 1946 and 1950 (i.e. cohort aged 50-54 in 2000)Cohort born between 1951 and 1955 (i.e. cohort aged 50-54 in 2005)
ource: Eurostat, EU LFS, annual results for 1995, 2000 and 2005
79
S
Older Men
0
10
20
30
40
50
60
70
80
90
50-54 55-59 60-64Age group
% o
f age
gro
up p
opul
atio
n
1995 2000 2005
Older Women
0
10
20
30
40
50
60
70
80
90
50-54 55-59 60-64
Age group
% o
f age
gro
up p
opul
atio
n
1995 2000 2005
The cohort effect on participation rates for women has subsequently fed through into employment rates, as can be seen from the profile of employment rates by individual year of age in the EU-15 for the years 1995, 2000 and 2005 (Chart 69). There is clearly a general
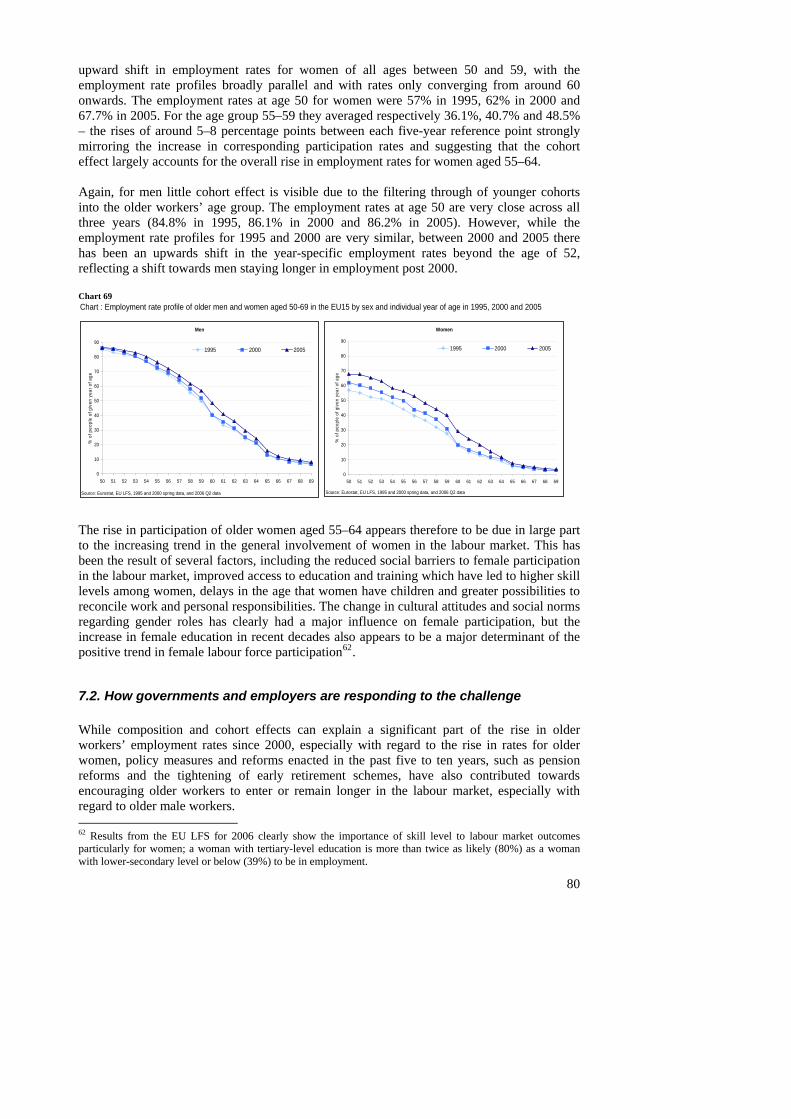
upward shift in employment rates for women of all ages between 50 and 59, with the employment rate profiles broadly parallel and with rates only converging from around 60 onwards. The employment rates at age 50 for women were 57% in 1995, 62% in 2000 and 67.7% in 2005. For the age group 55–59 they averaged respectively 36.1%, 40.7% and 48.5% – the rises of around 5–8 percentage points between each five-year reference point strongly mirroring the increase in corresponding participation rates and suggesting that the cohort effect largely accounts for the overall rise in employment rates for women aged 55–64. Again, for men little cohort effect is visible due to the filtering through of younger cohorts into the older workers’ age group. The employment rates at age 50 are very close across all three years (84.8% in 1995, 86.1% in 2000 and 86.2% in 2005). However, while the employment rate profiles for 1995 and 2000 are very similar, between 2000 and 2005 there has been an upwards shift in the year-specific employment rates beyond the age of 52, reflecting a shift towards men staying longer in employment post 2000.
80
Chart : Employment rate profile of older men and women aged 50-69 in the EU15 by sex and individual year of age in 1995, 2000 and 2005Chart 69
Men
80
90
So
% o
f peo
ple
of g
iven
yea
r of a
ge
0
10
20
30
40
50
60
70
50 51 52 53 54 55 56 57 58 59 60 61 62 63 64 65 66 67 68 69
urce: Eurostat, EU LFS, 1995 and 2000 spring data, and 2006 Q2 data
1995 2000 2005
Women
80
90
0
10
20
30
40
50
60
70
50 51 52 53 54 55 56 57 58 59 60 61 62 63 64 65 66 67 68 69
Source: Eurostat, EU LFS, 1995 and 2000 spring data, and 2006 Q2 data
% o
f peo
ple
of g
iven
yea
r of a
ge
1995 2000 2005
The rise in participation of older women aged 55–64 appears therefore to be due in large part to the increasing trend in the general involvement of women in the labour market. This has been the result of several factors, including the reduced social barriers to female participation in the labour market, improved access to education and training which have led to higher skill levels among women, delays in the age that women have children and greater possibilities to reconcile work and personal responsibilities. The change in cultural attitudes and social norms regarding gender roles has clearly had a major influence on female participation, but the increase in female education in recent decades also appears to be a major determinant of the positive trend in female labour force participation62.
7.2. How governments and employers are responding to the challenge While composition and cohort effects can explain a significant part of the rise in older workers’ employment rates since 2000, especially with regard to the rise in rates for older women, policy measures and reforms enacted in the past five to ten years, such as pension reforms and the tightening of early retirement schemes, have also contributed towards encouraging older workers to enter or remain longer in the labour market, especially with regard to older male workers. 62 Results from the EU LFS for 2006 clearly show the importance of skill level to labour market outcomes particularly for women; a woman with tertiary-level education is more than twice as likely (80%) as a woman with lower-secondary level or below (39%) to be in employment.
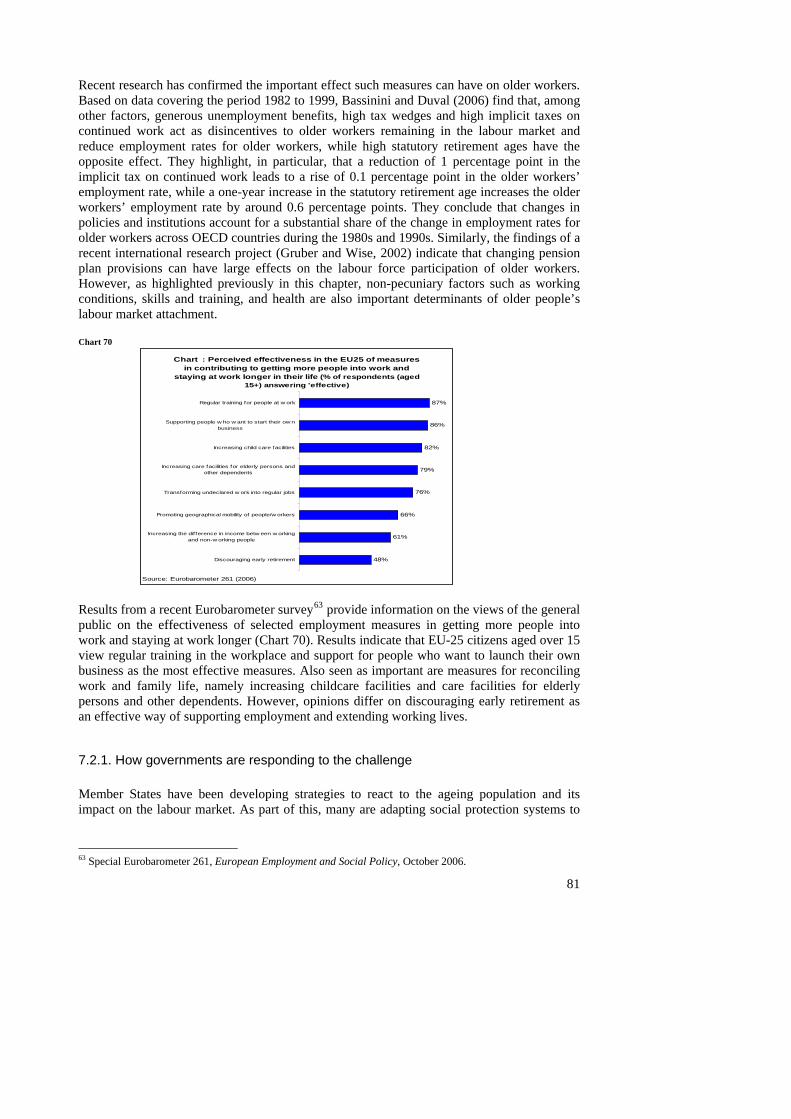
Recent research has confirmed the important effect such measures can have on older workers. Based on data covering the period 1982 to 1999, Bassinini and Duval (2006) find that, among other factors, generous unemployment benefits, high tax wedges and high implicit taxes on continued work act as disincentives to older workers remaining in the labour market and reduce employment rates for older workers, while high statutory retirement ages have the opposite effect. They highlight, in particular, that a reduction of 1 percentage point in the implicit tax on continued work leads to a rise of 0.1 percentage point in the older workers’ employment rate, while a one-year increase in the statutory retirement age increases the older workers’ employment rate by around 0.6 percentage points. They conclude that changes in policies and institutions account for a substantial share of the change in employment rates for older workers across OECD countries during the 1980s and 1990s. Similarly, the findings of a recent international research project (Gruber and Wise, 2002) indicate that changing pension plan provisions can have large effects on the labour force participation of older workers. However, as highlighted previously in this chapter, non-pecuniary factors such as working conditions, skills and training, and health are also important determinants of older people’s labour market attachment. Chart 70
Chart : Perceived effectiveness in the EU25 of measures in contributing to getting more people into work and
staying at work longer in their life (% of respondents (aged 15+) answering 'effective)
87%
Incr
Pr
I
Regular training for people at w ork
Sourc
48%
61%
66%
76%
79%
82%
86%
Discouraging early retirement
easing the difference in income betw een w orkingand non-w orking people
omoting geographical mobility of people/w orkers
Transforming undeclared w ork into regular jobs
ncreasing care facilities for elderly persons andother dependents
Increasing child care facilities
Supporting people w ho w ant to start their ow nbusiness
e: Eurobarometer 261 (2006) Results from a recent Eurobarometer survey63 provide information on the views of the general public on the effectiveness of selected employment measures in getting more people into work and staying at work longer (Chart 70). Results indicate that EU-25 citizens aged over 15 view regular training in the workplace and support for people who want to launch their own business as the most effective measures. Also seen as important are measures for reconciling work and family life, namely increasing childcare facilities and care facilities for elderly persons and other dependents. However, opinions differ on discouraging early retirement as an effective way of supporting employment and extending working lives.
7.2.1. How governments are responding to the challenge Member States have been developing strategies to react to the ageing population and its impact on the labour market. As part of this, many are adapting social protection systems to
63 Special Eurobarometer 261, European Employment and Social Policy, October 2006.
81
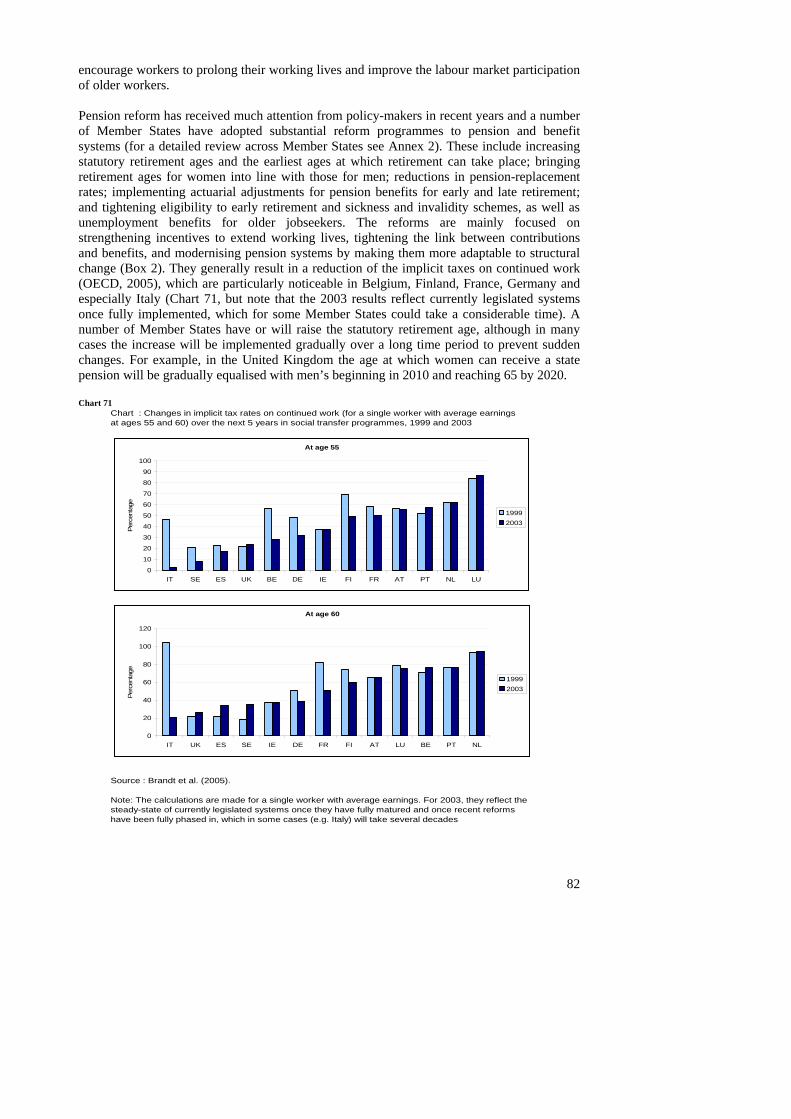
encourage workers to prolong their working lives and improve the labour market participation of older workers. Pension reform has received much attention from policy-makers in recent years and a number of Member States have adopted substantial reform programmes to pension and benefit systems (for a detailed review across Member States see Annex 2). These include increasing statutory retirement ages and the earliest ages at which retirement can take place; bringing retirement ages for women into line with those for men; reductions in pension-replacement rates; implementing actuarial adjustments for pension benefits for early and late retirement; and tightening eligibility to early retirement and sickness and invalidity schemes, as well as unemployment benefits for older jobseekers. The reforms are mainly focused on strengthening incentives to extend working lives, tightening the link between contributions and benefits, and modernising pension systems by making them more adaptable to structural change (Box 2). They generally result in a reduction of the implicit taxes on continued work (OECD, 2005), which are particularly noticeable in Belgium, Finland, France, Germany and especially Italy (Chart 71, but note that the 2003 results reflect currently legislated systems once fully implemented, which for some Member States could take a considerable time). A number of Member States have or will raise the statutory retirement age, although in many cases the increase will be implemented gradually over a long time period to prevent sudden changes. For example, in the United Kingdom the age at which women can receive a state pension will be gradually equalised with men’s beginning in 2010 and reaching 65 by 2020.
Chart : Changes in implicit tax rates on continued work (for a single worker with average earnings at ages 55 and 60) over the next 5 years in social transfer programmes, 1999 and 2003
Source : Brandt et al. (2005).
Note: The calculations are made for a single worker with average earnings. For 2003, they reflect the steady-state of currently legislated systems once they have fully matured and once recent reforms have been fully phased in, which in some cases (e.g. Italy) will take several decades
Chart 71
At age 55
0
10
20
30
40
50
60
70
80
90
100
IT SE ES UK BE DE IE FI FR AT PT NL LU
Per
cent
age
19992003
At age 60
0
20
40
60
80
100
120
IT UK ES SE IE DE FR FI AT LU BE PT NL
Per
cent
age
19992003
82
83
Box 2 – Main features of recent pension reforms in EU Member States As reported in the 2006 Joint Report on Social Protection and Social Inclusion64, there has been substantial progress in reforming pension systems in recent years. Disincentives to work longer have been reduced and incentives strengthened, links between contributions and benefits have been tightened, and life expectancy has been further taken into account in pension systems. Moreover, the provision of supplementary pensions has been promoted and legislative frameworks improved. Strengthening incentives to extend working lives In nearly all Member States, recent reforms have strengthened incentives to extend working lives (especially for statutory schemes), and reduced access to early retirement. Working longer is generally encouraged by pension supplements and leaving earlier discouraged by actuarial reductions. Furthermore, greater flexibility is provided in the timing of retirement, for example combining employment and partial retirement. In addition, access to disability, sickness and incapacity schemes are being reviewed to eliminate other paths to early exit. Reforms of statutory schemes have often led to a decrease of individual replacement rates, while many Member States have increased the accrual of pension rights if people work longer, which should act as incentives to work longer. Strengthening the link between contributions and benefits A number of recent reforms have strengthened the benefit/contribution link of pension systems. This has occurred, firstly, through the introduction of longer contribution periods required for a full pension. Secondly, by calculating full pensions based on lifetime earnings instead of final salary, thus reflecting contributions more accurately over an entire career, rather than just wage progression in later years. Thirdly, applying actuarial reductions/increases for early/deferred retirement also contributes to a culture in which early retirement is less prevalent (this has occurred in a number of Member States, like AT, FR, FI, ES, PT, NL and IT), while the link was strengthened by previous reforms in many Member States, such as DE, BE, LU, HU, EE, LV, LT, PL, SK, SI and SE). Modernising pension systems by making them more adaptable to structural change New labour-supply structures require adaptable pension systems (more and more people do not follow the standard career of full-time, lifelong employment). Member States have started to review pension provisions for workers with atypical careers and for the self-employed, with a view to easing access to statutory and supplementary pension schemes. For example, some Member States allow people to acquire pension credits for periods of short-term contracts, part-time and voluntary work as well as for some breaks in the work career such as for child and old-age care, education and unemployment. Most of the Member States are gradually phasing out differences in legal retirement ages between men and women. Given the rising importance of supplementary schemes some Member States (DK, DE, NL and UK) have improved the portability of supplementary pension rights which pose obstacles to workers’ mobility.
OECD (2006) reports that a number of countries have introduced various types of wage subsidies which are intended to align older workers’ labour costs more closely with their productivity. In addition, countries have adopted a wide range of measures promoting greater participation in learning across the adult population. Several Member States have focused on the promotion of key basic skills and compensatory education with, for example, some Nordic countries systematically offering adults courses that allow older people to gain equivalent qualifications to young people. Different methods for maintaining skills have also been
64 Joint Report on Social Protection and Social Inclusion 2006 – Synthesis report on adequate and sustainable pensions (COM(2006) 62 final).
84
developed, which form part of the EU’s general principle of lifelong learning. For example Germany’s AQTIV programme aims to improve qualifications of the over 50s in small and medium-sized companies (employing fewer than 100 employees). In Sweden, the programme ‘100 steps to safety and development with an ageing population’ offers public study grants and individual skills assessments to help older workers access the labour market. In parallel, programmes are being set up to encourage companies to promote better health in the workplace, the general aim being to maintain the health of employees and avoid premature fatigue. The Finnish national TYKY campaign is the most far-reaching. It aims at protecting employees’ physical and psychological capacities to avoid them deteriorating with age. In the Netherlands, several collective labour agreements cover reduction or adaptation of the workload for older workers as well as adapting working hours. Major restructuring of the public employment services (PES) and boosting of activation measures also took place in a large number of Member States over the period 2000–2006, with a rationalisation of the services provided by the PES in the direction of more individualised and better targeted activation measures, improved coordination of different actors, and the modernisation and expansion of the training on offer, including the development of continuous and vocational training systems. In line with the Employment Framework Directive adopted in 2000, EU Member States have also been putting in place legislation banning age discrimination with regard to employment, self-employment and occupation, vocational training and guidance. Some Member States have also implemented awareness-raising campaigns among employers in order to modify attitudes of employers and staff towards older workers. For example, the United Kingdom has issued a set of guidelines to help employers recognise the business benefits of an age-diverse workforce and to promote best practice, while in Sweden a lot of work has also been done on changing attitudes and negative perceptions towards older workers65.
7.2.2. How employers are responding to the challenge Apart from government action, employers have important contributions to make by developing initiatives in the workplace related to, for example, the work environment and the quality of work, in particular by creating conditions that allow and encourage older workers to stay longer in work. There is a growing awareness among employers that, by artificially limiting the field of candidates, age barriers may prevent an organisation from maximising its recruitment potential. Furthermore, some enterprises are recognising that the organisation with a diverse age base is likely to be able to respond best to rapidly changing circumstances. In the service sector in particular, employers are seeing the benefits of adjusting the age range of their employees to reflect the age composition of their customers better. However, much still remains to be done to convince companies in Europe to establish a sustainable age management policy. An extensive project funded by the European Commission has examined how companies are beginning to address the issue of managing an ageing workforce (Box 3).
65 For further details on actions at country level see, for example, the synthesis report ‘Attracting more people to the labour market’, July 2005 (produced in the framework of the mutual learning programme of the European Employment Strategy) and related reports on active ageing (see http://www.mutual-learning-employment.net/).
85
Box 3 – Study on the identification of good practice to increase job opportunities and maintain older workers in employment A recent report on ageing and employment66, resulting from a project funded by the European Commission, considers measures designed to help maintain and improve the employment opportunities of older workers. Based on case studies of 41 companies in 11 EU Member States (the Czech Republic, Finland, France, Germany, Hungary, Italy, Lithuania, the Netherlands, Poland, Portugal and the United Kingdom), covering a range of sectors and company sizes, the report provides important empirical findings that demonstrate how some companies are beginning to address the issue of managing an ageing workforce. The report highlights that age management can be observed within a variety of contexts and involves a broad range of measures. With regard to the latter, in an attempt to achieve the right balance between an individual’s abilities according to their age and the tasks to be fulfilled, the case-study companies have introduced a range of practices aimed at: • improving working conditions and workers’ abilities
• promoting health
• greater internal flexibility and mobility
• career development for all age groups
• establishing mixed age groups and the promotion of knowledge transfer
• flexible working-time practices
• avoiding physically demanding working hours and using older workers at non-stressful periods
• changing wage structures and pension provisions to reduce incentives for early retirement.
In terms of positive outcomes, respondents of the case studies mainly referred to the cost-effectiveness of such measures. The most notable savings were in reduced severance pay, lower absenteeism rates and a decline in staff turnover. In addition, companies also reported an improvement in workers’ motivation and productivity; however, the report suggests that measuring the degree of improvement with regard to these two factors proved difficult. Other recent research reveals that many cases of good practice in age management aimed at improving job opportunities and working conditions for older workers already exist. Based on a follow-up in 200567 of case studies from a project first carried out in the mid-1990s, and an examination of developments over the past 10 years, Taylor (2006) reports on how employers are so far responding to the challenge of an ageing labour force. Among the key findings from this analysis is that, in general, there has been an overall increase in the complexity of organisations’ approaches to age management. While training and development remains by 66 ‘Ageing and employment: Identification of good practices to increase job opportunities and maintain older workers in employment’, study for the European Commission by the Warwick Institute for Employment Research, University of Warwick and Economix Research and Consulting, Munich, in collaboration with various other research institutes, 2006. 67 Case studies from a project (Combating age barriers), first carried out in the mid 1990s by the European Foundation for the Improvement of Living and Working Conditions, were followed up in 2005. New data was collected from over 100 companies, all of which exemplified long-standing documented good practice in age management and which covered a broad range of industries overall, in 11 Member States from the former EU-15.
86
far the most common measure, followed by flexible working, and with the incidence of both having risen over time, there has also been a gradual change in the types of measures adopted by organisations, with health and well-being growing in importance. In addition there has been a general move away from focusing on one age group towards measures involving all staff. The results from the analysis point to a range of benefits for staff and organisations in implementing effective age management. For individuals, these include improved health and well-being, more satisfying work and the prospect of continuing employment. Benefits for organisations include securing labour supply, maximising workforce utility and hence increased productivity and competitiveness, and improved company/industrial relations. The findings from the above project, together with further research covering the new Member States68 (Mandl et al, 2006), have contributed to the development of a European guide on good practice on age management69. Aimed primarily at the organisational level, the guide is designed to assist all those who are responsible for employment to ensure that workplace ageing is managed successfully and that older workers are enabled to fulfil their potential, and that age does not become a barrier to employment.
8. Prospects of meeting the EU targets, and longer term prospects
8.1. Prospects of meeting the Stockholm and Barcelona targets Despite the considerable recent improvements in employment of older people, the employment rate of older workers in the EU (43.5 % in 2006) is still a long way from the target of 50% established by the Council of Stockholm in 2001. It is estimated that between 2006 and 2010 employment of those in the age group 55–64 would need to increase by around 6 million in order to reach the target, equivalent to an employment growth of around 5.5% per year. This should be seen in the context of employment creation for the older workers age group of around 5.3 million between 2000 and 2006, with an average annual growth rate of 4.2% over this period. Increases in the employment rate depend on both employment growth and population growth. The effort needed to achieve the 50% employment rate target by 2010 is magnified by the fact that the population in this age group is projected to increase by close to 8% between 2006 and 2010. It is estimated that around 2 million of the employment increase necessary to reach the target would be needed just to balance this effect of population ageing. Furthermore, while for the EU as a whole the composition effect of the older workers’ population age group on the employment rate has been positive over the first half of the decade, the gradual ageing of the baby-boom generation will result in a shift in the distribution towards older ages and consequently a negative contribution to employment rates by 2010. Assuming that year-of-age specific employment rates remain unchanged from those in 2006, it is estimated70 that the effect of the shift in the age structure alone would result in a decline in the average employment rate between 2006 and 2010 of almost 1 percentage point (i.e. the overall
68 The guidelines are derived mainly from the findings of a project looking at developments in employment initiatives for an ageing workforce across 11 EU countries (Austria, Belgium, Finland, France, Germany, Greece, Italy, the Netherlands, Sweden, Spain and the United Kingdom). Further information comes from new research across the EU including the new Member States. Throughout, the guide makes reference to a wide spectrum of organisations: small and large; in the public and private sectors; in services and manufacturing. 69 G. Naegele and A. Walker. (2006), ‘A guide to good practice in age management’, research project for the European Foundation for the Improvement of Living and Working Conditions. 70 By applying the year-of-age specific employment rates for 2006 (using data for the second quarter of 2006 from the EU Labour Force Survey) to the projected single-year population totals for 2010, using data from the Eurostat population projections (baseline variant).
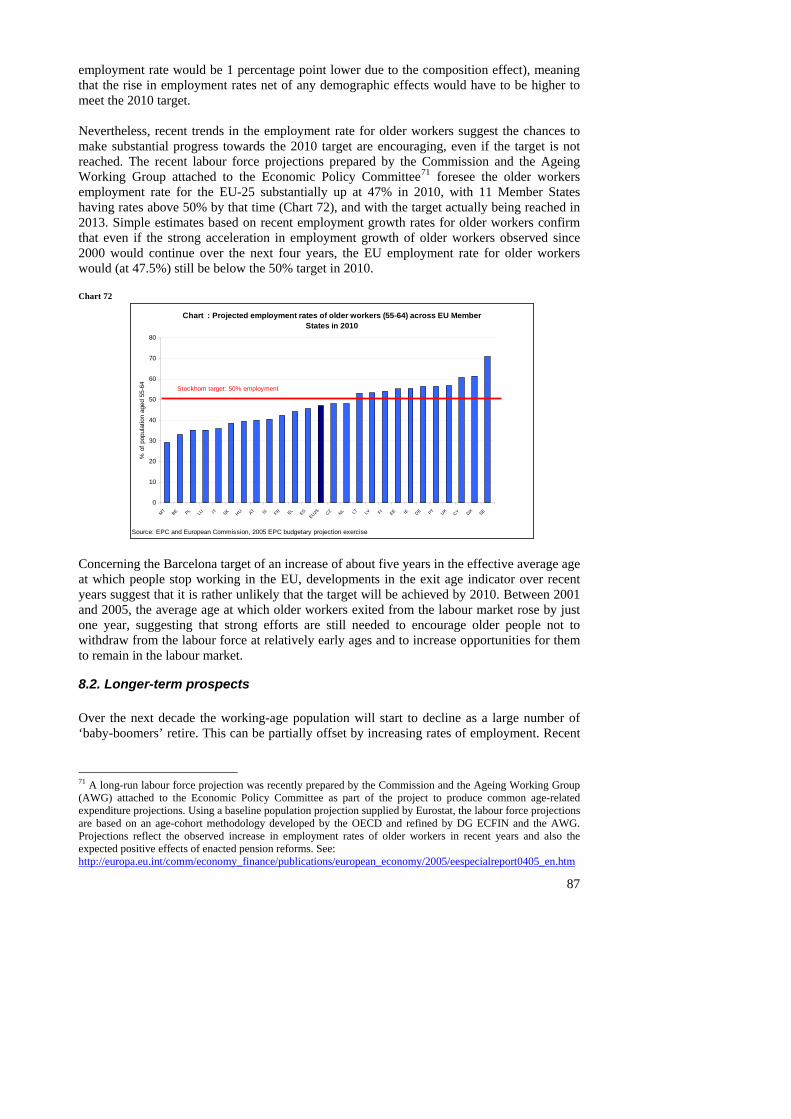
employment rate would be 1 percentage point lower due to the composition effect), meaning that the rise in employment rates net of any demographic effects would have to be higher to meet the 2010 target. Nevertheless, recent trends in the employment rate for older workers suggest the chances to make substantial progress towards the 2010 target are encouraging, even if the target is not reached. The recent labour force projections prepared by the Commission and the Ageing Working Group attached to the Economic Policy Committee71 foresee the older workers employment rate for the EU-25 substantially up at 47% in 2010, with 11 Member States having rates above 50% by that time (Chart 72), and with the target actually being reached in 2013. Simple estimates based on recent employment growth rates for older workers confirm that even if the strong acceleration in employment growth of older workers observed since 2000 would continue over the next four years, the EU employment rate for older workers would (at 47.5%) still be below the 50% target in 2010. Chart 72
Chart : Projected employment rates of older workers (55-64) across EU Member States in 2010
80
Source
% o
f pop
ulat
ion
aged
55-
64
0
10
20
30
40
50
60
70
MT BE PL LU IT SK HU AT SIFR EL ES
EU25 CZ NL LT LV FIEE IE DE PT UK
CY DK SE
: EPC and European Commission, 2005 EPC budgetary projection exercise
Stockhom target: 50% employmentt
Concerning the Barcelona target of an increase of about five years in the effective average age at which people stop working in the EU, developments in the exit age indicator over recent years suggest that it is rather unlikely that the target will be achieved by 2010. Between 2001 and 2005, the average age at which older workers exited from the labour market rose by just one year, suggesting that strong efforts are still needed to encourage older people not to withdraw from the labour force at relatively early ages and to increase opportunities for them to remain in the labour market.
8.2. Longer-term prospects Over the next decade the working-age population will start to decline as a large number of ‘baby-boomers’ retire. This can be partially offset by increasing rates of employment. Recent
71 A long-run labour force projection was recently prepared by the Commission and the Ageing Working Group (AWG) attached to the Economic Policy Committee as part of the project to produce common age-related expenditure projections. Using a baseline population projection supplied by Eurostat, the labour force projections are based on an age-cohort methodology developed by the OECD and refined by DG ECFIN and the AWG. Projections reflect the observed increase in employment rates of older workers in recent years and also the expected positive effects of enacted pension reforms. See: http://europa.eu.int/comm/economy_finance/publications/european_economy/2005/eespecialreport0405_en.htm
87
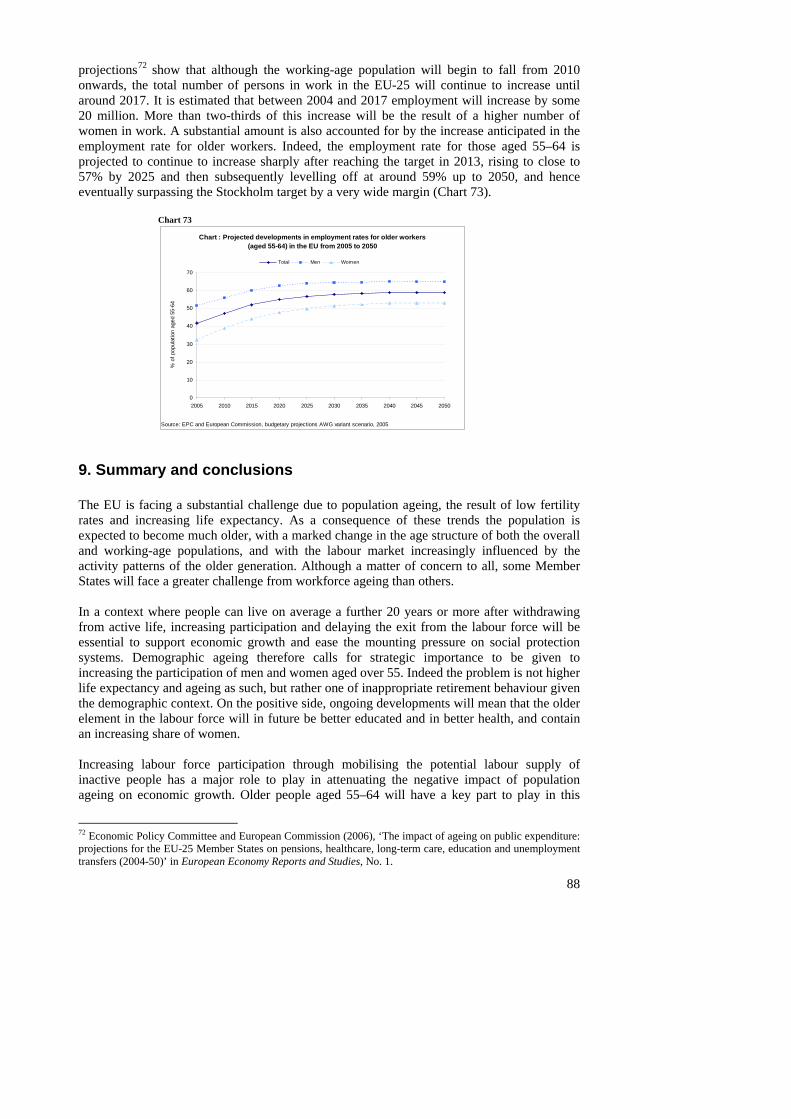
projections72 show that although the working-age population will begin to fall from 2010
onwards, the total number of persons in work in the EU-25 will continue to increase until around 2017. It is estimated that between 2004 and 2017 employment will increase by some 20 million. More than two-thirds of this increase will be the result of a higher number of women in work. A substantial amount is also accounted for by the increase anticipated in the employment rate for older workers. Indeed, the employment rate for those aged 55–64 is projected to continue to increase sharply after reaching the target in 2013, rising to close to 57% by 2025 and then subsequently levelling off at around 59% up to 2050, and hence eventually surpassing the Stockholm target by a very wide margin (Chart 73).
Chart 73
Chart : Projected developments in employment rates for older workers (aged 55-64) in the EU from 2005 to 2050
Source: E
% o
f pop
ulat
ion
aged
55-
64
0
10
20
30
40
50
60
70
2005 2010 2015 2020 2025 2030 2035 2040 2045 2050
PC and European Commission, budgetary projections AWG variant scenario, 2005
Total Men Women
9. Summary and conclusions The EU is facing a substantial challenge due to population ageing, the result of low fertility rates and increasing life expectancy. As a consequence of these trends the population is expected to become much older, with a marked change in the age structure of both the overall and working-age populations, and with the labour market increasingly influenced by the activity patterns of the older generation. Although a matter of concern to all, some Member States will face a greater challenge from workforce ageing than others. In a context where people can live on average a further 20 years or more after withdrawing from active life, increasing participation and delaying the exit from the labour force will be essential to support economic growth and ease the mounting pressure on social protection systems. Demographic ageing therefore calls for strategic importance to be given to increasing the participation of men and women aged over 55. Indeed the problem is not higher life expectancy and ageing as such, but rather one of inappropriate retirement behaviour given the demographic context. On the positive side, ongoing developments will mean that the older element in the labour force will in future be better educated and in better health, and contain an increasing share of women. Increasing labour force participation through mobilising the potential labour supply of inactive people has a major role to play in attenuating the negative impact of population ageing on economic growth. Older people aged 55–64 will have a key part to play in this
72 Economic Policy Committee and European Commission (2006), ‘The impact of ageing on public expenditure: projections for the EU-25 Member States on pensions, healthcare, long-term care, education and unemployment transfers (2004-50)’ in European Economy Reports and Studies, No. 1.
88
89
since they account for close to a third of all inactive people of working age in the EU. However, currently over half of 55–64 year olds in the EU are inactive, mainly for reasons of retirement but also poor health or due to personal or family responsibilities, or the belief that no work is available, and the transition into inactivity is essentially a path of no return. At the same time, older workers are subject to significant difficulties if they lose their job, as evidenced by the relatively low hiring rates and the high incidence of long-term unemployment for this age group. The European Employment Strategy, as a key element of the overall Lisbon Strategy for Growth and Jobs, calls on Member States to develop and implement comprehensive and effective active-ageing strategies, which must address the main barriers affecting the labour market participation of older people. This includes far-reaching reforms to remove incentives for early exit from the labour market and to encourage employment of senior citizens, ensuring that it is effectively possible to work for longer and that employment policies as a whole create more job opportunities for older workers. While more still needs to be done, recent results indicate that efforts by Member States to implement measures in support of active ageing are bearing fruit. Employment rates for older workers have risen substantially since 2000 (up 7 percentage points), even though this was a period for a large part characterised by sluggish economic and employment growth. Indeed, along with the rise in female participation, employment of older workers has been one of the most dynamic components of the EU labour market in recent years. The recent rise in employment of older workers has not been clearly associated with a rise in the precariousness of their employment (i.e. the share of fixed-term employment) or with self-employment, nor is it overwhelmingly associated with increased prevalence of part-time employment, but rather with the more traditional forms of employment. In addition, much of the rise in older workers’ employment has been in relatively high-skilled, knowledge-intensive sectors. Furthermore, the occupational employment structure for older workers has moved towards a higher skill profile of employment, with a shift away from the more manual occupations towards the non-manual and more knowledge-intensive occupations. These trends suggest that older workers are benefiting relatively well from the ongoing trends of population ageing and the shift to a more knowledge-based economy. Much of the rise in employment rates for older workers is due to the increase in rates for older women, which is due in turn mainly to the knock-on effect of increasing participation over time of women at younger ages. This is a result of changes in cultural attitudes and social norms regarding female participation but also measures such as improved access to education and training for women, and greater possibilities to reconcile work and family responsibilities. In contrast, for men the rise in employment rates is a result of the rising delay in exiting the labour market, this being more due to such factors as reforms of pension and social protection systems and other recent measures associated with active ageing. Around a fifth of the overall rise is due specifically to the shift in age structure of the population aged 55–64. Despite the recent increase in their employment, labour market participation of older people in Europe remains low by international standards, and many workers still exit the labour market at relatively early ages. Efforts to promote active ageing must therefore still be pursued vigorously, particularly in those Member States with low employment rates for older workers. Indeed, despite having risen markedly since 2000, the employment rate for older people aged 55–64 remains over 6.5 percentage points from the Stockholm target. Nevertheless recent trends in the employment rate for older workers suggest the chances to make substantial progress are encouraging, even if the target is not reached.
90
Further increasing the labour market participation of older workers will require measures to overcome the continuing barriers and disincentives they face to employment. Existing research on older workers and analysis in this chapter has highlighted that the low labour market participation of older people is the result of a combination of factors, among which the following appear to be of particular importance:
The balance of financial incentives, including those to discourage early retirement and to make employment financially more attractive. There is evidence that incentives embedded in tax and benefit systems, in particular public pension systems and other social transfer programmes, provide strong incentives for older workers to withdraw relatively early from the labour market. Addressing this will require reducing the attractiveness and availability of early pathways into retirement and appropriate adjustment of the value of pension benefits in case of anticipated and deferred retirement.
Reducing the obstacle older people face through age discrimination and negative
perceptions of their capabilities. This is a key element in improving the employment of older workers, both through legislation and age-awareness campaigns to educate people about the need for age diversity. A shift in attitudes towards working at an older age will be necessary by employers, older workers and society as a whole.
Helping disabled older people to better integrate into the labour market. This is also
important and particular attention must be paid to health and safety in the workplace, as well as maintaining the health and working capacity of workers as they age.
• The relative cost of older workers compared to younger people is a key factor
affecting employers’ willingness to hire or retain older workers. More flexible pay systems, in particular moving away from seniority-based wage systems, could enhance the job security and employability of older workers.
• Training is essential to improving the employability of older workers, through
addressing inadequate skills and competences. However, low participation of older workers in lifelong learning, especially the low-skilled, remains a feature in the large majority of Member States. Specific measures are needed to help upgrade the basic skills of the present stock of older workers, but, in the long term, a lifelong learning strategy is needed for working-age people that addresses their needs throughout their entire working life.
Attractiveness of work and good working conditions are significant factors affecting
older workers’ labour market attachment. Increasing the opportunities for reduced working hours and particularly more flexible working-time arrangements appear to be especially important. More flexible work organisation, ergonomics and job design are also very relevant for encouraging older workers to remain longer in employment.
Active ageing must be supported by an appropriate general support framework. For
many older people, being able to work may depend heavily on factors such as cultural aspects relating to their participation in the labour market, their general health and the availability of, and access to, good quality care facilities and employment services.
A broad range of factors therefore needs to be addressed. Pension systems can encourage later retirement, but without suitable access for older workers to appropriate employment, they may not be particularly effective. Apart from addressing financial incentives, general
91
challenges therefore include changing attitudes to older workers, maintaining and promoting the health and working capacity of workers as they age, developing the skills and employability of older workers, and providing suitable working conditions together with employment opportunities for an ageing workforce. It is also necessary to provide the necessary general supportive environment for this. Addressing gender-related issues is also important. Differences in employment rates for older workers according to gender are substantial in most Member States, and indeed the low employment rate for older workers in Europe is mainly a result of the relatively low rates for older women and, in a broader perspective, of women in general. Further efforts to reduce the gap in activity between men and women will necessarily be a key element of any strategy to increase the labour supply of older people, as family-friendly employment policies which encourage younger women to participate in the labour market may also eventually lead to increased participation of older women. In this context, a lack of sufficient support for women in combining work and family responsibilities continues to be an important factor limiting their participation. As women’s labour market participation increases, it will be important to develop mechanisms, or even extend existing work and family policies, to ensure adequate coverage of older female workers’ needs. In particular, it is likely that women’s growing participation in the workforce will increasingly impact on their availability to carry out their traditional role of providing care for family and relations, which may require a substantial expansion in formal care facilities. The increasingly larger older female component in the workforce may also present employers with a number of challenges as women’s employment goals, career patterns and work styles may be different to those of men. Different types of approach to active ageing currently exist across Member States. Features of those systems which are more successful in supporting active ageing include good levels of general health for older people and reasonably high standard retirement ages; relatively high spending on active labour market policy measures and participation in lifelong learning; flexibility with regard to working hours and work organisation; and reduced financial pressures on older workers to leave the labour market, both in terms of the financial incentives for older workers to retire and the cost pressure on employers to hire younger rather than older workers. In this regard, the Nordic group of countries (including the Netherlands), but also to a lesser degree the Anglo-Saxon grouping, appear to have implemented a more integrated approach to active ageing and have been relatively more successful in integrating and retaining older workers in the labour market compared to the other Member States. Addressing the challenge of demographic ageing and its impact on the workforce will require the wider implementation of more integrated strategies than have been the case to date. Measures are needed both in the labour market and in the workplace, which emphasise the integration of older workers and improve their employability, as well as closing off routes for early exit from the labour market. Member States have been developing strategies to react to the ageing population and its impact on the labour market. A number have adopted substantial reform programmes to pension and benefit systems, others have strengthened their efforts, while some remain at an early stage of the reform process. In the general move to tighten up early retirement schemes it will nevertheless be necessary to ensure that such systems can still address the needs of those genuinely requiring support. In addition to pension reform, improvements in participation of older workers in lifelong learning, promotion of better health in the
92
workplace, improvements in public employment services, and implementation of stricter legislation banning age discrimination in employment and age awareness campaigns have been among the recent approaches implemented in a number of Member States. Although much remains to be done, there are also some indications that companies are beginning to address the issue of managing an ageing workforce. In this area further progress needs to be made with regard to better working conditions, greater availability of flexible working time and work-organisation practices, more flexible wage-setting that is less linked to seniority, and changing attitudes of managers and staff towards older workers. Access to company training will also play a key role, since continued vocational training offers a tremendous opportunity for older workers to acquire new skills and to update qualifications throughout their professional lives. As a final point, as part of the new intergenerational approach advocated by the European Employment Strategy, it is recognised that particular attention should be paid to promoting access to employment throughout working life. Indeed active ageing must not start with elderly people but rather requires much earlier intervention throughout an entire career: a lifecycle perspective is essential. For example, improving occupational health and safety for workers of all ages and emphasising the prevention of age-related work problems (such as the deskilling of older workers and work-related health problems) will assist future generations of older workers to remain in employment longer. Therefore a comprehensive active-ageing strategy must focus on the entire working lifespan and all age groups, not just older workers.
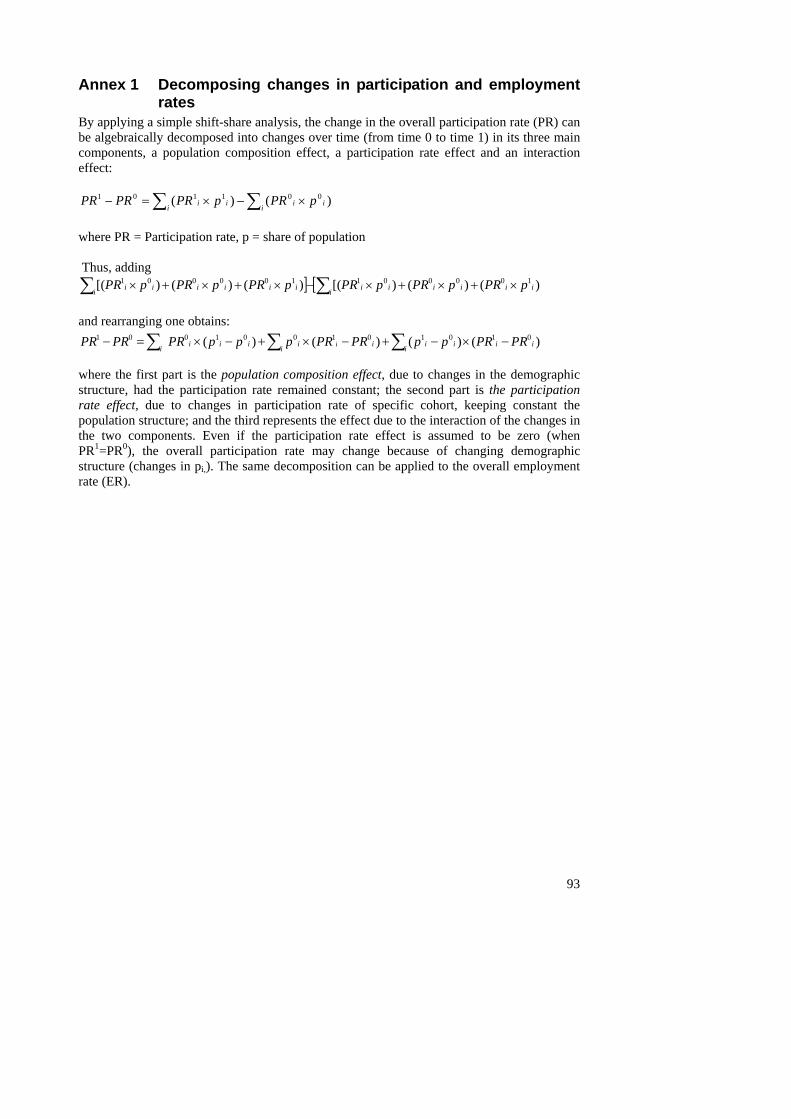
Annex 1 Decomposing changes in participation and employment rates
By applying a simple shift-share analysis, the change in the overall participation rate (PR) can be algebraically decomposed into changes over time (from time 0 to time 1) in its three main components, a population composition effect, a participation rate effect and an interaction effect:
93
∑∑ ×−×=−i iii ii pPRpPRPRPR )()( 001101
] [ )()()[()()()[( 100001100001iiiii iiiiiii ii pPRpPRpPRpPRpPRpPR ×+×+×−×+×+× ∑∑
where PR = Participation rate, p = share of population Thus, adding
and rearranging one obtains:
)()()( )( 010101001 001iii iiiii i i iii PRPRppPRPRp pp PR PR PR −×−+−×+ −×= − ∑∑ ∑
where the first part is the population composition effect, due to changes in the demographic structure, had the participation rate remained constant; the second part is the participation rate effect, due to changes in participation rate of specific cohort, keeping constant the population structure; and the third represents the effect due to the interaction of the changes in the two components. Even if the participation rate effect is assumed to be zero (when PR1=PR0), the overall participation rate may change because of changing demographic structure (changes in pi,). The same decomposition can be applied to the overall employment rate (ER).
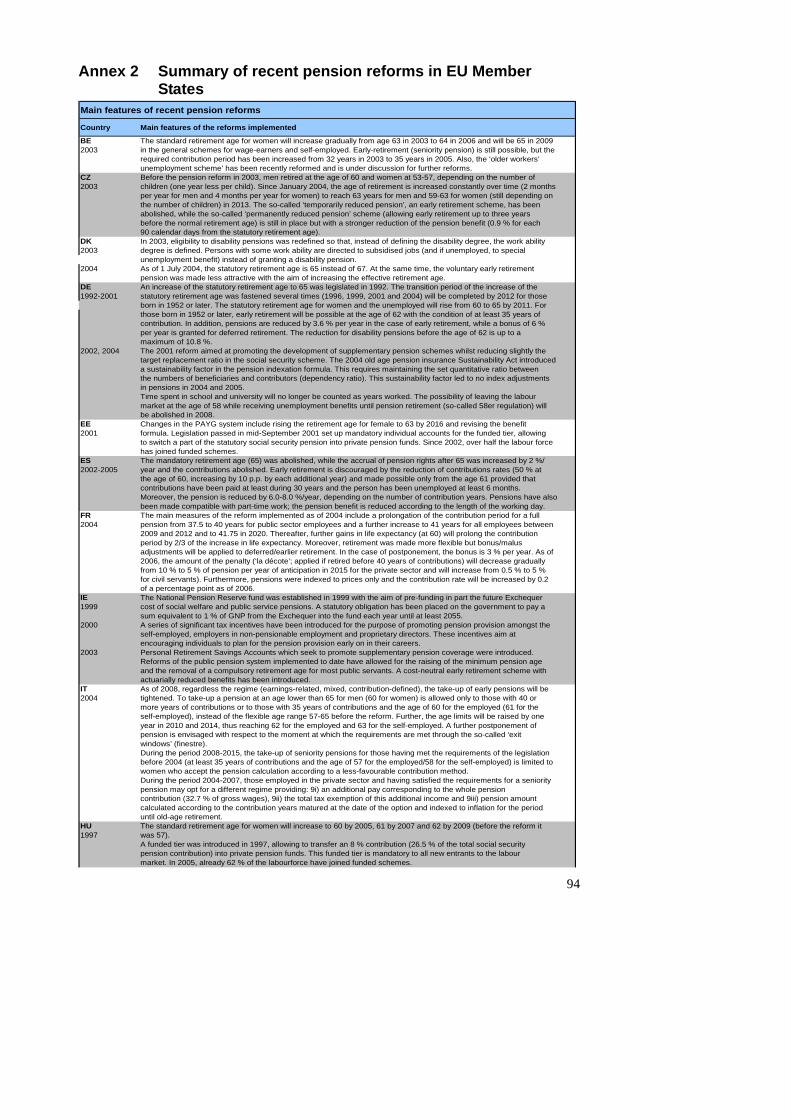
Annex 2 Summary of recent pension reforms in EU Member States
Main features of recent pension reforms
Country Main features of the reforms implemented
BE The standard retirement age for women will increase gradually from age 63 in 2003 to 64 in 2006 and will be 65 in 20092003 in the general schemes for wage-earners and self-employed. Early-retirement (seniority pension) is still possible, but the
required contribution period has been increased from 32 years in 2003 to 35 years in 2005. Also, the ‘older workers’unemployment scheme’ has been recently reformed and is under discussion for further reforms.
CZ Before the pension reform in 2003, men retired at the age of 60 and women at 53-57, depending on the number of2003 children (one year less per child). Since January 2004, the age of retirement is increased constantly over time (2 months
per year for men and 4 months per year for women) to reach 63 years for men and 59-63 for women (still depending onthe number of children) in 2013. The so-called ‘temporarily reduced pension’, an early retirement scheme, has beenabolished, while the so-called ‘permanently reduced pension’ scheme (allowing early retirement up to three yearsbefore the normal retirement age) is still in place but with a stronger reduction of the pension benefit (0.9 % for each90 calendar days from the statutory retirement age).
DK In 2003, eligibility to disability pensions was redefined so that, instead of defining the disability degree, the work ability2003 degree is defined. Persons with some work ability are directed to subsidised jobs (and if unemployed, to special
unemployment benefit) instead of granting a disability pension.2004 As of 1 July 2004, the statutory retirement age is 65 instead of 67. At the same time, the voluntary early retirement
pension was made less attractive with the aim of increasing the effective retirement age.DE An increase of the statutory retirement age to 65 was legislated in 1992. The transition period of the increase of the1992-2001 statutory retirement age was fastened several times (1996, 1999, 2001 and 2004) will be completed by 2012 for those
born in 1952 or later. The statutory retirement age for women and the unemployed will rise from 60 to 65 by 2011. Forthose born in 1952 or later, early retirement will be possible at the age of 62 with the condition of at least 35 years ofcontribution. In addition, pensions are reduced by 3.6 % per year in the case of early retirement, while a bonus of 6 %per year is granted for deferred retirement. The reduction for disability pensions before the age of 62 is up to amaximum of 10.8 %.
2002, 2004 The 2001 reform aimed at promoting the development of supplementary pension schemes whilst reducing slightly thetarget replacement ratio in the social security scheme. The 2004 old age pension insurance Sustainability Act introduceda sustainability factor in the pension indexation formula. This requires maintaining the set quantitative ratio betweenthe numbers of beneficiaries and contributors (dependency ratio). This sustainability factor led to no index adjustmentsin pensions in 2004 and 2005.Time spent in school and university will no longer be counted as years worked. The possibility of leaving the labourmarket at the age of 58 while receiving unemployment benefits until pension retirement (so-called 58er regulation) willbe abolished in 2008.
EE Changes in the PAYG system include rising the retirement age for female to 63 by 2016 and revising the benefit2001 formula. Legislation passed in mid-September 2001 set up mandatory individual accounts for the funded tier, allowing
to switch a part of the statutory social security pension into private pension funds. Since 2002, over half the labour forcehas joined funded schemes.
ES The mandatory retirement age (65) was abolished, while the accrual of pension rights after 65 was increased by 2 %/2002-2005 year and the contributions abolished. Early retirement is discouraged by the reduction of contributions rates (50 % at
the age of 60, increasing by 10 p.p. by each additional year) and made possible only from the age 61 provided thatcontributions have been paid at least during 30 years and the person has been unemployed at least 6 months.Moreover, the pension is reduced by 6.0-8.0 %/year, depending on the number of contribution years. Pensions have alsobeen made compatible with part-time work; the pension benefit is reduced according to the length of the working day.
FR The main measures of the reform implemented as of 2004 include a prolongation of the contribution period for a full2004 pension from 37.5 to 40 years for public sector employees and a further increase to 41 years for all employees between
2009 and 2012 and to 41.75 in 2020. Thereafter, further gains in life expectancy (at 60) will prolong the contributionperiod by 2/3 of the increase in life expectancy. Moreover, retirement was made more flexible but bonus/malusadjustments will be applied to deferred/earlier retirement. In the case of postponement, the bonus is 3 % per year. As of2006, the amount of the penalty (‘la décote’; applied if retired before 40 years of contributions) will decrease graduallyfrom 10 % to 5 % of pension per year of anticipation in 2015 for the private sector and will increase from 0.5 % to 5 %for civil servants). Furthermore, pensions were indexed to prices only and the contribution rate will be increased by 0.2of a percentage point as of 2006.
IE The National Pension Reserve fund was established in 1999 with the aim of pre-funding in part the future Exchequer1999 cost of social welfare and public service pensions. A statutory obligation has been placed on the government to pay a
sum equivalent to 1 % of GNP from the Exchequer into the fund each year until at least 2055.2000 A series of significant tax incentives have been introduced for the purpose of promoting pension provision amongst the
self-employed, employers in non-pensionable employment and proprietary directors. These incentives aim atencouraging individuals to plan for the pension provision early on in their careers.
2003 Personal Retirement Savings Accounts which seek to promote supplementary pension coverage were introduced.Reforms of the public pension system implemented to date have allowed for the raising of the minimum pension ageand the removal of a compulsory retirement age for most public servants. A cost-neutral early retirement scheme withactuarially reduced benefits has been introduced.
IT As of 2008, regardless the regime (earnings-related, mixed, contribution-defined), the take-up of early pensions will be2004 tightened. To take-up a pension at an age lower than 65 for men (60 for women) is allowed only to those with 40 or
more years of contributions or to those with 35 years of contributions and the age of 60 for the employed (61 for theself-employed), instead of the flexible age range 57-65 before the reform. Further, the age limits will be raised by oneyear in 2010 and 2014, thus reaching 62 for the employed and 63 for the self-employed. A further postponement ofpension is envisaged with respect to the moment at which the requirements are met through the so-called ‘exitwindows’ (finestre).During the period 2008-2015, the take-up of seniority pensions for those having met the requirements of the legislationbefore 2004 (at least 35 years of contributions and the age of 57 for the employed/58 for the self-employed) is limited towomen who accept the pension calculation according to a less-favourable contribution method.During the period 2004-2007, those employed in the private sector and having satisfied the requirements for a senioritypension may opt for a different regime providing: 9i) an additional pay corresponding to the whole pensioncontribution (32.7 % of gross wages), 9ii) the total tax exemption of this additional income and 9iii) pension amountcalculated according to the contribution years matured at the date of the option and indexed to inflation for the perioduntil old-age retirement.
HU The standard retirement age for women will increase to 60 by 2005, 61 by 2007 and 62 by 2009 (before the reform it1997 was 57).
A funded tier was introduced in 1997, allowing to transfer an 8 % contribution (26.5 % of the total social securitypension contribution) into private pension funds. This funded tier is mandatory to all new entrants to the labourmarket. In 2005, already 62 % of the labourforce have joined funded schemes.
94
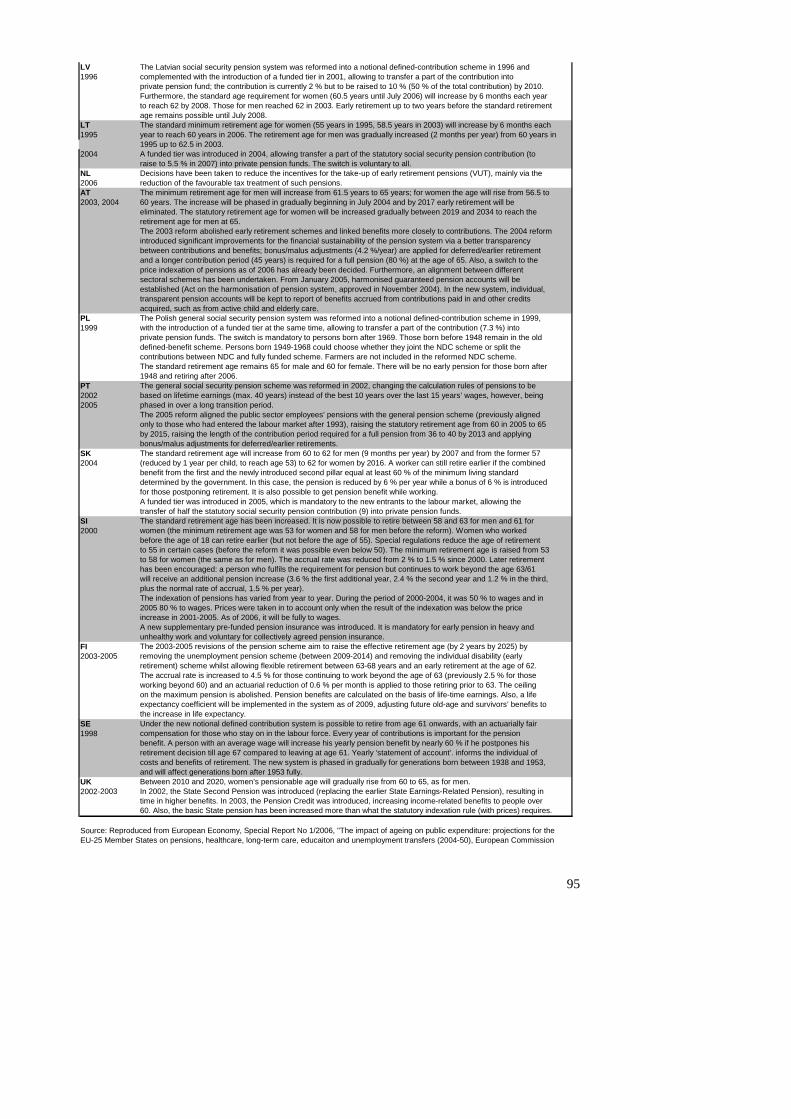
95
LV The Latvian social security pension system was reformed into a notional defined-contribution scheme in 1996 and1996
LT1995
2004
NL2006AT
PL1999
PT20022005
SK2004
SI2000
FI2003-
SE1998
UK2002-
SourEU-
complemented with the introduction of a funded tier in 2001, allowing to transfer a part of the contribution intoprivate pension fund; the contribution is currently 2 % but to be raised to 10 % (50 % of the total contribution) by 2010.Furthermore, the standard age requirement for women (60.5 years until July 2006) will increase by 6 months each yearto reach 62 by 2008. Those for men reached 62 in 2003. Early retirement up to two years before the standard retirementage remains possible until July 2008.The standard minimum retirement age for women (55 years in 1995, 58.5 years in 2003) will increase by 6 months eachyear to reach 60 years in 2006. The retirement age for men was gradually increased (2 months per year) from 60 years in1995 up to 62.5 in 2003.A funded tier was introduced in 2004, allowing transfer a part of the statutory social security pension contribution (toraise to 5.5 % in 2007) into private pension funds. The switch is voluntary to all.Decisions have been taken to reduce the incentives for the take-up of early retirement pensions (VUT), mainly via thereduction of the favourable tax treatment of such pensions.The minimum retirement age for men will increase from 61.5 years to 65 years; for women the age will rise from 56.5 to
2003, 2004 60 years. The increase will be phased in gradually beginning in July 2004 and by 2017 early retirement will beeliminated. The statutory retirement age for women will be increased gradually between 2019 and 2034 to reach theretirement age for men at 65.The 2003 reform abolished early retirement schemes and linked benefits more closely to contributions. The 2004 reformintroduced significant improvements for the financial sustainability of the pension system via a better transparencybetween contributions and benefits; bonus/malus adjustments (4.2 %/year) are applied for deferred/earlier retirementand a longer contribution period (45 years) is required for a full pension (80 %) at the age of 65. Also, a switch to theprice indexation of pensions as of 2006 has already been decided. Furthermore, an alignment between differentsectoral schemes has been undertaken. From January 2005, harmonised guaranteed pension accounts will beestablished (Act on the harmonisation of pension system, approved in November 2004). In the new system, individual,transparent pension accounts will be kept to report of benefits accrued from contributions paid in and other creditsacquired, such as from active child and elderly care.The Polish general social security pension system was reformed into a notional defined-contribution scheme in 1999,with the introduction of a funded tier at the same time, allowing to transfer a part of the contribution (7.3 %) intoprivate pension funds. The switch is mandatory to persons born after 1969. Those born before 1948 remain in the olddefined-benefit scheme. Persons born 1949-1968 could choose whether they joint the NDC scheme or split thecontributions between NDC and fully funded scheme. Farmers are not included in the reformed NDC scheme.The standard retirement age remains 65 for male and 60 for female. There will be no early pension for those born after1948 and retiring after 2006.The general social security pension scheme was reformed in 2002, changing the calculation rules of pensions to bebased on lifetime earnings (max. 40 years) instead of the best 10 years over the last 15 years’ wages, however, beingphased in over a long transition period.The 2005 reform aligned the public sector employees’ pensions with the general pension scheme (previously alignedonly to those who had entered the labour market after 1993), raising the statutory retirement age from 60 in 2005 to 65by 2015, raising the length of the contribution period required for a full pension from 36 to 40 by 2013 and applyingbonus/malus adjustments for deferred/earlier retirements.The standard retirement age will increase from 60 to 62 for men (9 months per year) by 2007 and from the former 57(reduced by 1 year per child, to reach age 53) to 62 for women by 2016. A worker can still retire earlier if the combinedbenefit from the first and the newly introduced second pillar equal at least 60 % of the minimum living standarddetermined by the government. In this case, the pension is reduced by 6 % per year while a bonus of 6 % is introducedfor those postponing retirement. It is also possible to get pension benefit while working.A funded tier was introduced in 2005, which is mandatory to the new entrants to the labour market, allowing thetransfer of half the statutory social security pension contribution (9) into private pension funds.The standard retirement age has been increased. It is now possible to retire between 58 and 63 for men and 61 forwomen (the minimum retirement age was 53 for women and 58 for men before the reform). Women who workedbefore the age of 18 can retire earlier (but not before the age of 55). Special regulations reduce the age of retirementto 55 in certain cases (before the reform it was possible even below 50). The minimum retirement age is raised from 53to 58 for women (the same as for men). The accrual rate was reduced from 2 % to 1.5 % since 2000. Later retirementhas been encouraged: a person who fulfils the requirement for pension but continues to work beyond the age 63/61will receive an additional pension increase (3.6 % the first additional year, 2.4 % the second year and 1.2 % in the third,plus the normal rate of accrual, 1.5 % per year).The indexation of pensions has varied from year to year. During the period of 2000-2004, it was 50 % to wages and in2005 80 % to wages. Prices were taken in to account only when the result of the indexation was below the priceincrease in 2001-2005. As of 2006, it will be fully to wages.A new supplementary pre-funded pension insurance was introduced. It is mandatory for early pension in heavy andunhealthy work and voluntary for collectively agreed pension insurance.The 2003-2005 revisions of the pension scheme aim to raise the effective retirement age (by 2 years by 2025) by
2005 removing the unemployment pension scheme (between 2009-2014) and removing the individual disability (earlyretirement) scheme whilst allowing flexible retirement between 63-68 years and an early retirement at the age of 62.The accrual rate is increased to 4.5 % for those continuing to work beyond the age of 63 (previously 2.5 % for thoseworking beyond 60) and an actuarial reduction of 0.6 % per month is applied to those retiring prior to 63. The ceilingon the maximum pension is abolished. Pension benefits are calculated on the basis of life-time earnings. Also, a lifeexpectancy coefficient will be implemented in the system as of 2009, adjusting future old-age and survivors’ benefits tothe increase in life expectancy.Under the new notional defined contribution system is possible to retire from age 61 onwards, with an actuarially faircompensation for those who stay on in the labour force. Every year of contributions is important for the pensionbenefit. A person with an average wage will increase his yearly pension benefit by nearly 60 % if he postpones hisretirement decision till age 67 compared to leaving at age 61. Yearly ‘statement of account’. informs the individual ofcosts and benefits of retirement. The new system is phased in gradually for generations born between 1938 and 1953,and will affect generations born after 1953 fully.Between 2010 and 2020, women’s pensionable age will gradually rise from 60 to 65, as for men.
2003 In 2002, the State Second Pension was introduced (replacing the earlier State Earnings-Related Pension), resulting intime in higher benefits. In 2003, the Pension Credit was introduced, increasing income-related benefits to people over60. Also, the basic State pension has been increased more than what the statutory indexation rule (with prices) requires.
ce: Reproduced from European Economy, Special Report No 1/2006, "The impact of ageing on public expenditure: projections for the 25 Member States on pensions, healthcare, long-term care, educaiton and unemployment transfers (2004-50), European Commission
96
References Auer, P. and M. Fortuny (2000), ‘Ageing of the labour force in OECD countries: Economic and social consequences’, Employment Paper 2000/2, International Labour Office, Geneva. Bassanini, A. and R. Duval (2006), ‘Employment patterns in OECD countries: Reassessing the role of policies and institutions’, OECD Social, Employment and Migration Working Paper, No. 35. Behaghel, L. and N. Greenan (2007), ‘Training and age-biased technical change’, Laboratoire d'economie appliqué WP 0705, INRA. Bound, J. et al. (1998), ‘The dynamic effects of health on the labour force transitions of older workers’, Working paper 6777, National Bureau of Economic Research Working Paper Series. Brandt, N., J-M. Burniaux and R. Duval (2005), ‘Assessing the OECD jobs strategy: past developments and reforms’, Economics Department Working Paper, No. 429, OECD. Disney, R., D. Hawkes and Y. Heden (2007), ‘Declining job opportunities for older workers in Britain: The role of job-specific characteristics’, 10 January 2007. Duval, R. (2003), ‘The retirement effects of old-age pension and early retirement schemes in OECD countries’, Economics Department Working Paper, No. 370, OECD. EIM Business and Policy Research and SEOR (2005), ‘Final report: Lifelong learning: Policy instruments to foster training of the employed’, final report on a study commissioned by the European Commission. European Commission (2002), ‘Report requested by the Stockholm European Council: Increasing labour force participation and promoting active ageing’, COM(2002) 9 final, Office for official publications of the European Communities, Luxembourg. European Commission (2003), ‘Improving quality in work: a review of recent progress’, COM(2003) 728, Office for official publications of the European Communities, Luxembourg. European Commission (2004), ‘Delivering Lisbon – Reforms for the enlarged Union, Report from the Commission to the Spring European Council’, COM(2004) 29, Office for official publications of the European Communities, Luxembourg. European Commission (2006a), Commission Communication, ‘The long-term sustainability of public finances in the EU’, COM(2006) 574, Office for official publications of the European Communities, Luxembourg. European Commission (2006b), ‘Joint Report on social protection and social inclusion 2006 – Synthesis report on adequate and sustainable pensions’, COM(2006) 62 final, Office for official publications of the European Communities, Luxembourg. European Commission (2006c), Commission Communication to the Spring European Council, ‘Implementing the renewed Lisbon Strategy for growth and jobs, a year of delivery’, Office for official publications of the European Communities, Luxembourg.
Comment [FGW3]: Was this published in a newspaper, journal or what?

97
European Commission (2006d), Commission Communication, ‘Efficiency and equity in European education and training systems’, COM(2006) 481 final, Office for official publications of the European Communities, Luxembourg. European Foundation for the Improvement of Living and Working Conditions (1999), ‘Active strategies for an ageing workforce’, conference report, Office for official publications of the European Communities, Luxembourg, Luxembourg. Ghosheh Jr., N.S., S. Lee and D. McCann (2006), ‘Conditions of work and employment for older workers in industrialized countries: Understanding the issues’, Conditions of Work and Employment Series, No. 15, International Labour Office, Geneva. Gruber, J. and D.A. Wise (2002), ‘Social security programs and retirement around the world: micro estimation’, National Bureau of Economic Research Working Paper Series, No. 9407. Haider, S. and D. Loughran (2001), ‘Elderly labor supply: Work or play?’, Center for Retirement Research at Boston College, CRR WP 2001-04. Jolivet, A. and S. Lee (2004), ‘Employment conditions in an ageing world: Meeting the working time challenge’, Conditions of Work and Employment Series, No. 9, International Labour Office, Geneva. Leombruni, R. and C. Villosio (2005), ‘Employability of older workers in Italy and Europe’ (paper presented at the conference ‘Quality in labour market transitions: A European challenge’ on 25–26 November 2004 in Amsterdam), LABORatorio Riccardo Revelli. Mandl, I., A. Dorr and T. Oberholzner (2006), ‘Age and employment in the new Member States’, report on a research project carried out for the European Foundation for the Improvement of Living and Working Conditions. Marsh, A. and M. Sahin-Dikmen (2002), ‘Discrimination in Europe (Report B)’, Policy Studies Institute, London. Marsh, A. and M. Sahin-Dikmen (2003), ‘Discrimination in Europe (Executive summary, Eurobarometer 57.0)’, Policy Studies Institute, London. Mayhew, K. and B. Rijkers (2004), ‘How to improve the human capital of older workers or the sad tale of the magic bullet’, paper prepared for the joint EC-OECD seminar on human capital and labour market performance held in Brussels on 8 December 2004. Molinié, A-F (2003), ‘Age and working conditions in the European Union’, study for the European Foundation for the Improvement of Living and Working Conditions carried out by Créapt (Centre for research and studies on age and the working population), Paris. Naegele, G. and A. Walker (2006), ‘A guide to good practice in age management’, report on a research project carried out for the European Foundation for the Improvement of Living and Working Conditions. O’Cinneide, C. (2005), ‘Age discrimination and European law’, report drafted on the authority of the European Network of Legal Experts in the non-discrimination field and

98
commissioned by the European Commission, DG Employment, Social Affairs and Equal Opportunities. OECD (2005), Going for growth, Chapter 5 (the retirement effects of old-age pension and early retirement schemes in OECD countries), OECD. OECD (2006), Live longer, work longer, OECD. Parent-Thirion, A. et al. (2007), ‘Fourth European Working Conditions Survey’, report of the European Foundation for the Improvement of Living and Working Conditions, Office for official publications of the European Communities, Luxembourg. Peulet, J-P (2006), ‘Ageing and work in Europe’, study for the European Foundation for the Improvement of Living and Working Conditions carried out by ANACT, France. Spurgeon, A. (2003), ‘Working time: its impact on safety and health’, International Labour Office, Geneva. Taylor, P. (2001), ‘Analysis of ways to improve employment opportunities for older workers’, Report to the European Commission, November 2001. Taylor, P. (2002), ‘Improving employment opportunities for older workers: Developing a policy framework’, Summary of EU expert presentation at the 9th EU-Japan Symposium of 21–22 March 2002. Taylor, P. (2006), ‘Employment initiatives for an ageing workforce in the EU-15’, report on a research project carried out for the European Foundation for the Improvement of Living and Working Conditions. Tros, F. (2005), ‘Flexicurity in the policies for the older workers’, in Bredgaard and Larsen (eds.), Employment Policy from Different Angles, DJØF Publishing, Copenhagen.