Embed Size (px)
Citation preview
E S T O N I A
L A T V I A
L I T H U A N I A
P O L A N D
R U S S I A N F E D E R A T I O N
U K R A I N E
BrestGomel
GrodnoMinsk
Minsk City
Mogilev
Vitebsk
Minsk
13
5 7.7 9.8176
GDP (billions of $)
FLOOD
EARTHQUAKE
3
1
Negligible
Annual Average of Affected GDP (%)
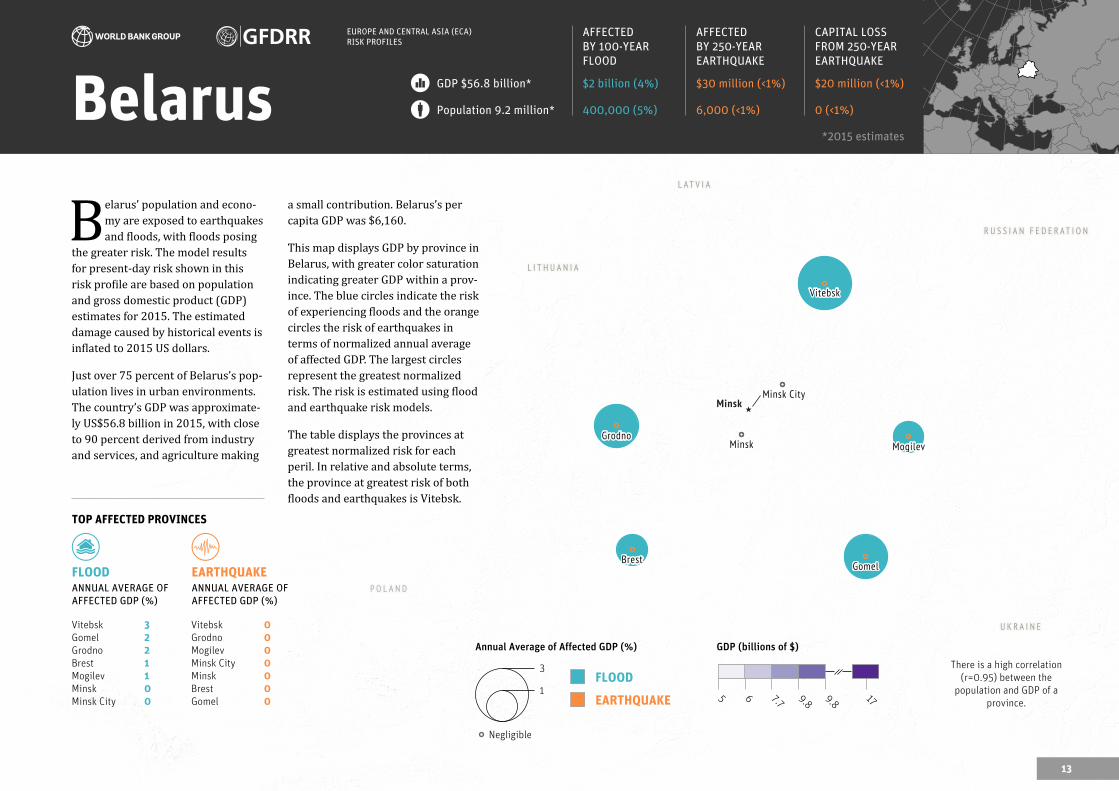
There is a high correlation(r=0.95) between the
population and GDP of a province.
TOP AFFECTED PROVINCES
FLOOD EARTHQUAKEANNUAL AVERAGE OF AFFECTED GDP (%)
ANNUAL AVERAGE OF AFFECTED GDP (%)
VitebskGomelGrodnoBrestMogilevMinskMinsk City
3221100
VitebskGrodnoMogilevMinsk CityMinskBrestGomel
0000000
Belarus’ population and econo-my are exposed to earthquakes and floods, with floods posing
the greater risk. The model results for present-day risk shown in this risk profile are based on population and gross domestic product (GDP) estimates for 2015. The estimated damage caused by historical events is inflated to 2015 US dollars.
Just over 75 percent of Belarus’s pop-ulation lives in urban environments. The country’s GDP was approximate-ly US$56.8 billion in 2015, with close to 90 percent derived from industry and services, and agriculture making
BelarusEUROPE AND CENTRAL ASIA (ECA) RISK PROFILES
GDP $56.8 billion*
Population 9.2 million*
AFFECTED BY 100-YEAR FLOOD
AFFECTED BY 250-YEAR EARTHQUAKE
CAPITAL LOSS FROM 250-YEAR EARTHQUAKE
$2 billion (4%)
400,000 (5%)
$30 million (<1%)
6,000 (<1%)
$20 million (<1%)
0 (<1%)
*2015 estimates
a small contribution. Belarus’s per capita GDP was $6,160.
This map displays GDP by province in Belarus, with greater color saturation indicating greater GDP within a prov-ince. The blue circles indicate the risk of experiencing floods and the orange circles the risk of earthquakes in terms of normalized annual average of affected GDP. The largest circles represent the greatest normalized risk. The risk is estimated using flood and earthquake risk models.
The table displays the provinces at greatest normalized risk for each peril. In relative and absolute terms, the province at greatest risk of both floods and earthquakes is Vitebsk.
9.8
L A T V I A
L I T H U A N I A
P O L A N D
R U S S I A N F E D E R A T I O N
U K R A I N E
BrestGomel
Grodno
Minsk
Minsk City
Mogilev
Vitebsk
Minsk
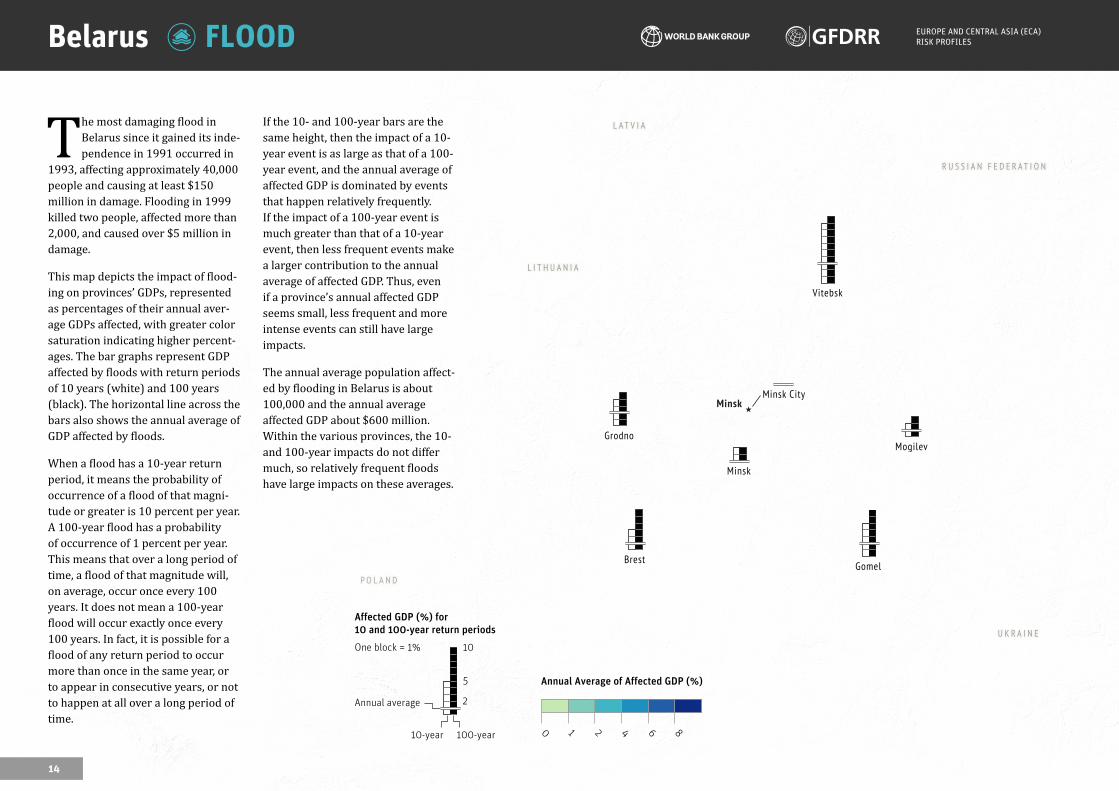
The most damaging flood in Belarus since it gained its inde-pendence in 1991 occurred in
1993, affecting approximately 40,000 people and causing at least $150 million in damage. Flooding in 1999 killed two people, affected more than 2,000, and caused over $5 million in damage.
This map depicts the impact of flood-ing on provinces’ GDPs, represented as percentages of their annual aver-age GDPs affected, with greater color saturation indicating higher percent-ages. The bar graphs represent GDP affected by floods with return periods of 10 years (white) and 100 years (black). The horizontal line across the bars also shows the annual average of GDP affected by floods.
When a flood has a 10-year return period, it means the probability of occurrence of a flood of that magni-tude or greater is 10 percent per year. A 100-year flood has a probability of occurrence of 1 percent per year. This means that over a long period of time, a flood of that magnitude will, on average, occur once every 100 years. It does not mean a 100-year flood will occur exactly once every 100 years. In fact, it is possible for a flood of any return period to occur more than once in the same year, or to appear in consecutive years, or not to happen at all over a long period of time.
If the 10- and 100-year bars are the same height, then the impact of a 10-year event is as large as that of a 100-year event, and the annual average of affected GDP is dominated by events that happen relatively frequently. If the impact of a 100-year event is much greater than that of a 10-year event, then less frequent events make a larger contribution to the annual average of affected GDP. Thus, even if a province’s annual affected GDP seems small, less frequent and more intense events can still have large impacts.
The annual average population affect-ed by flooding in Belarus is about 100,000 and the annual average affected GDP about $600 million. Within the various provinces, the 10- and 100-year impacts do not differ much, so relatively frequent floods have large impacts on these averages.
EUROPE AND CENTRAL ASIA (ECA) RISK PROFILESFLOODBelarus
0 1 2 4 8
Annual Average of Affected GDP (%)
6
10
5
2
Affected GDP (%) for
10 and 100-year return periods
Annual average
10-year 100-year
One block = 1%
14

L A T V I A
L I T H U A N I A
P O L A N D
R U S S I A N F E D E R A T I O N
U K R A I N E
BrestGomel
Grodno
Minsk
Minsk City
Mogilev
Vitebsk
Minsk
L A T V I A
L I T H U A N I A
P O L A N D
R U S S I A N F E D E R A T I O N
U K R A I N E
BrestGomel
Grodno
Minsk
Minsk City
Mogilev
Vitebsk
Minsk
Belarus’s worst earthquake since 1900 took place in 1908.
This map depicts the impact of earthquakes on provinces’ GDPs, represented as percentages of their annual average GDPs affected, with greater color saturation indicating higher percentages. The bar graphs represent GDP affected by earth-quakes with return periods of 10 years (white) and 100 years (black). The horizontal line across the bars also shows the annual average of GDP affected by earthquakes.
When an earthquake has a 10-year return period, it means the probabil-ity of occurrence of an earthquake of that magnitude or greater is 10 percent per year. A 100-year earth-quake has a probability of occurrence of 1 percent per year. This means that over a long period of time, an earthquake of that magnitude will, on average, occur once every 100 years. It does not mean a 100-year earth-quake will occur exactly once every 100 years. In fact, it is possible for an earthquake of any return period to occur more than once in the same year, or to appear in consecutive years, or not to happen at all over a long period of time.
If the 10- and 100-year bars are the same height, then the impact of a 10-year event is as large as that of a 100-year event, and the annual average of
affected GDP is dominated by events that happen relatively frequently. If the impact of a 100-year event is much greater than that of a 10-year event, then less frequent events make larger contributions to the annual av-erage of affected GDP. Thus, even if a province’s annual affected GDP seems small, less frequent and more intense events can still have large impacts.
The annual average population affect-ed by earthquakes in Belarus is about 100 and the annual average affected GDP about $800,000. The annual av-erages of fatalities and capital losses caused by earthquakes are less than one and about $400,000, respective-ly. The fatalities and capital losses caused by more intense, less frequent events can be substantially larger than the annual averages. For exam-ple, an earthquake with a 0.4 percent annual probability of occurrence (a 250-year return period event) could cause about $20 million in capital loss (less than 1 percent of GDP).
EUROPE AND CENTRAL ASIA (ECA) RISK PROFILESEARTHQUAKEBelarus
0 1 2 4 8
Annual Average of Affected GDP (%)
6
GDP (%) not affected for 10 and
100-year return periods
Annual average = 0
15
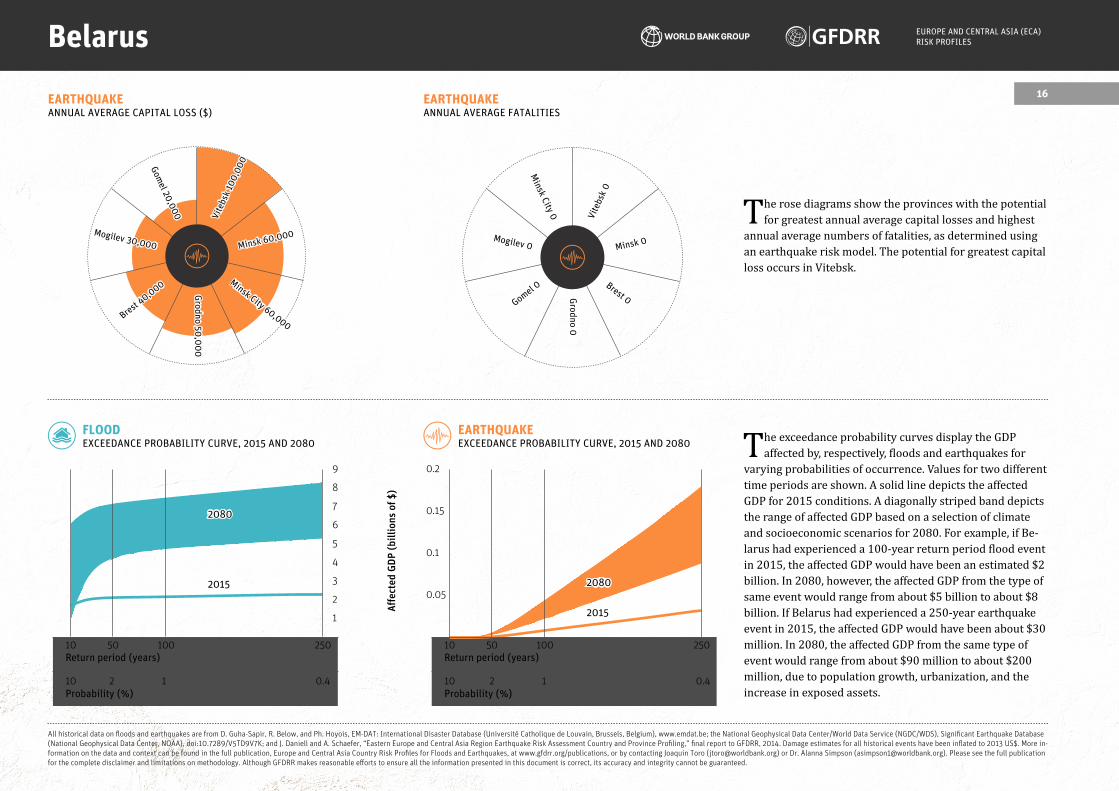
The rose diagrams show the provinces with the potential for greatest annual average capital losses and highest
annual average numbers of fatalities, as determined using an earthquake risk model. The potential for greatest capital loss occurs in Vitebsk.
EUROPE AND CENTRAL ASIA (ECA) RISK PROFILESBelarus
EARTHQUAKEEXCEEDANCE PROBABILITY CURVE, 2015 AND 2080
FLOODEXCEEDANCE PROBABILITY CURVE, 2015 AND 2080 The exceedance probability curves display the GDP
affected by, respectively, floods and earthquakes for varying probabilities of occurrence. Values for two different time periods are shown. A solid line depicts the affected GDP for 2015 conditions. A diagonally striped band depicts the range of affected GDP based on a selection of climate and socioeconomic scenarios for 2080. For example, if Be-larus had experienced a 100-year return period flood event in 2015, the affected GDP would have been an estimated $2 billion. In 2080, however, the affected GDP from the type of same event would range from about $5 billion to about $8 billion. If Belarus had experienced a 250-year earthquake event in 2015, the affected GDP would have been about $30 million. In 2080, the affected GDP from the same type of event would range from about $90 million to about $200 million, due to population growth, urbanization, and the increase in exposed assets.
All historical data on floods and earthquakes are from D. Guha-Sapir, R. Below, and Ph. Hoyois, EM-DAT: International Disaster Database (Université Catholique de Louvain, Brussels, Belgium), www.emdat.be; the National Geophysical Data Center/World Data Service (NGDC/WDS), Significant Earthquake Database (National Geophysical Data Center, NOAA), doi:10.7289/V5TD9V7K; and J. Daniell and A. Schaefer, “Eastern Europe and Central Asia Region Earthquake Risk Assessment Country and Province Profiling,” final report to GFDRR, 2014. Damage estimates for all historical events have been inflated to 2013 US$. More in-formation on the data and context can be found in the full publication, Europe and Central Asia Country Risk Profiles for Floods and Earthquakes, at www.gfdrr.org/publications, or by contacting Joaquin Toro ([email protected]) or Dr. Alanna Simpson ([email protected]). Please see the full publication for the complete disclaimer and limitations on methodology. Although GFDRR makes reasonable efforts to ensure all the information presented in this document is correct, its accuracy and integrity cannot be guaranteed.
Aff
ecte
d G
DP
(b
illi
on
s o
f $
)
EARTHQUAKEANNUAL AVERAGE FATALITIES
EARTHQUAKEANNUAL AVERAGE CAPITAL LOSS ($)
Return period (years)
Probability (%)
10
10
250
0.4
50
2
100
1
0.05
0.1
0.2
0.15
2080
2015
Return period (years)
Probability (%)
10
10
250
0.4
50
2
100
1
3
2
1
4
5
9
6
7
8
2080
2015
Minsk 60,000
Vite
bsk
100,
000Gom
el 20,000
Mogilev 30,000
Brest 40,000 Minsk City 60,000
Grodno 50
,00
0
Minsk 0
Vite
bsk
0
Minsk City 0
Mogilev 0
Gomel 0 Brest 0Grodno 0
16