Embed Size (px)
Citation preview

i
TECHNICAL REPORT
UCED 96/97-14
EUREKA COUNTY:
FINANCIAL TRENDS AND INDICATORS
UNIVERSITY OF NEVADA, RENO

ii
EUREKA COUNTY:
Financial Trends and Indicators
Prepared By:
Ted E. Oleson, Jr.Peter Janson
andThomas R. Harris
Nevada Cooperative ExtensionCenter For Economic Development
University of Nevada, Reno
Ted E. Oleson, Jr. is an Instructor in the Department of Economics at the University of Nevada,Reno.
Peter Janson is a Graduate Research Associate with the University Center for EconomicDevelopment, Department of Applied Economics and Statistics at the University ofNevada, Reno.
Thomas R. Harris is a Professor in the Department of Applied Economics and Director of theUniversity Center for Economic Development at the University of Nevada, Reno.
December 1997
UNIVERSITYOF NEVADA
RENO
The University of Nevada, Reno is an Equal Opportunity/Affirmative Action employer and does not discriminate on the basis ofrace, color, religion, sex, age, creed, national origin, veteran status, physical or mental disability, and in accordance with universitypolicy, sexual orientation, in any program or activity it operates. The University of Nevada employs only United States citizens andaliens lawfully authorized to work in the United States.
iii
This publication, Eureka County: Financial Trends andIndicators was published by the University Center for EconomicDevelopment in the Department of Applied Economics andStatistics at the University of Nevada, Reno. Funds for thispublication were provided by the United States Department ofCommerce Economic Development Administration underUniversity Centers Program contract #07-06-03262-97. Thispublication's statements, conclusions, recommendations, and/ordata represent solely the findings and views of the authors and donot necessarily represent the views of the U.S. Department ofCommerce, the Economic Development Administration, EurekaCounty Commissioners, State of Nevada Commission onEconomic Development, the University of Nevada, Reno, or anyreference sources used or quoted by this study. Reference toresearch projects, programs, books, magazines, or newspaperarticles does not imply an endorsement or recommendation by theauthors unless otherwise stated. Correspondence regarding thisdocument should be sent to:
Thomas R. Harris, DirectorUniversity Center for Economic Development
University of Nevada, RenoDepartment of Applied Economics and Statistics
Mail Stop 204Reno, Nevada 89557-0105
UCEDUniversity of Nevada, Reno
Nevada Cooperative Extension
iv
Table of Contents
Section Page
Executive Summary vi
I Economic and Demographic Characteristics 1
1.1 a Population 21.1 b, c Population Components 41.1 d Dependents as Percent of
Population6
1.2 a Total Housing Units 81.2 b Types of Housing 91.3 Real Income per Capita 121.4 Poverty Food Stamp Recipients Per
1000 Population13
1.5 a Labor Force 151.5 b Unemployment Rate 16
II Tax Bases 18
2.1 Real Assessed Value of Property 192.2 Real Sales 222.3 Net Proceeds of Mines 242.4 Tax Base Indices 26
III Revenues 28
3.1 Real Total Revenue 303.2 Real Revenues Per Capita 323.3 Revenues by Source per Capita 343.4 Composition of Revenues 373.5 Restricted Revenues 403.6 Intergovernmental Revenues 423.7 Elastic Revenue Sources 443.8 Ratio of General Fund to All Funds 463.9 County Property Tax Rate 483.10 Actual - Budgeted Revenues 50
IV Expenditures 52
4.1 Real General Fund Expenditures 534.2 Expenditures Per Capita 554.3 Expenditures by Major Type 574.4 Composition of Spending Functions 604.4 b Composition of Spending 63
v
4.4 c Spending Functions 654.5 Public Employees Per 1000
Population67
4.6 Fringe Benefits as Percent of Salaries and Wages
69
V Operating Position 71
5.1 Net Surplus (Deficit) 725.2 Ending Balance as Percent of Total
Expenditures74
VI Capital Outlay 76
6.1 Capital Outlay 766.2 Capital Outlay to Total Spending 77
Appendix 79

vi
Executive Summary
Introduction
Local Governments must understand their current fiscal position for planning their future needs andresources. The Financial Trends Monitoring System was developed by the International CityManagement Association as a standard approach to evaluate local fiscal conditions. The goal of thisreport is to present an overview of the county's economic, demographic, tax base, revenue, andspending trends. The trends in the indicators presented for these areas allow the county to assess itscurrent condition and identify any emerging needs or problems. Within each group of indicators, thefollowing aspects are presented:
• Indicator Description and Relevance: Each indicator is defined in the context of itsimportance in evaluating the fiscal condition.
• A Comparison of Current and Past Conditions: A ten year history of the indicator intabular and graphic form allows the county to evaluate whether its current condition hasimproved or deteriorated.
• Changes and Trends: The changes in the indicator are examined to determine what hashappened and whether it is an aberration or part of a trend.
• Multiple Measures: Each group of fiscal indicators presents several different measureswhich each show a particular aspect of the broader area. For example, demographics aremeasured by total population, growth rates, percent over age 64 and school enrollments.
Economic and Demographic Conditions:
The economic and demographic condition indicators are used to evaluate the community's needs andresources. The economy (measured by employment and other labor related measures) is an indicatorof both the health of the community and its needs for public services. The demographic indicators(population and housing) show who is living in the community and what types of services are likely tobe needed. Certain measures such as poverty rates or mobile home residents may indicate particularneeds.
• Population: The county added 375 people from 1986 to 1996. This is a growth rate of31.4% over the period. The statewide growth rate was 67.0%. The population is agingsomewhat as the over 64 age group increased from 7.7% to 10.4% of the population andthe under 20 age group decreased slightly from 30.2% of the population to 29.2%.Population growth has been relatively slow since 1990, only increasing by 1.6% overall.
• Housing: Total housing units increased slightly during the last ten years. The county’shousing is dominated by mobile homes.
vii
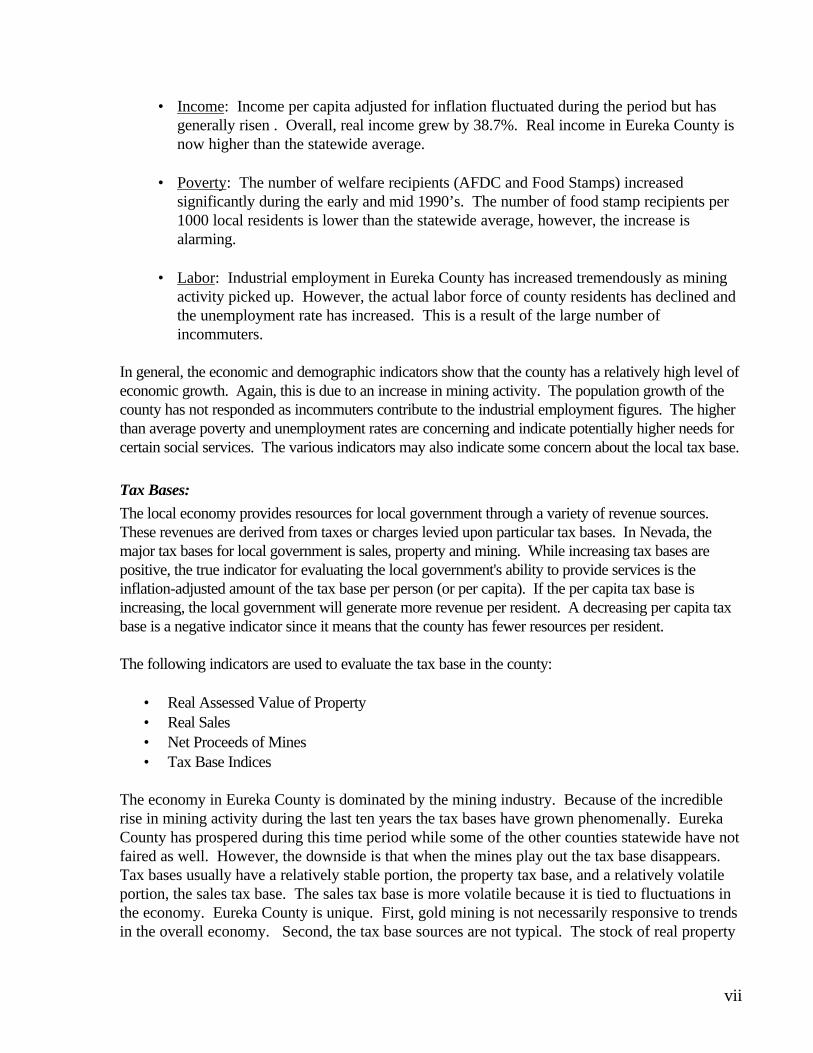
• Income: Income per capita adjusted for inflation fluctuated during the period but hasgenerally risen . Overall, real income grew by 38.7%. Real income in Eureka County isnow higher than the statewide average.
• Poverty: The number of welfare recipients (AFDC and Food Stamps) increasedsignificantly during the early and mid 1990’s. The number of food stamp recipients per1000 local residents is lower than the statewide average, however, the increase isalarming.
• Labor: Industrial employment in Eureka County has increased tremendously as miningactivity picked up. However, the actual labor force of county residents has declined andthe unemployment rate has increased. This is a result of the large number ofincommuters.
In general, the economic and demographic indicators show that the county has a relatively high level ofeconomic growth. Again, this is due to an increase in mining activity. The population growth of thecounty has not responded as incommuters contribute to the industrial employment figures. The higherthan average poverty and unemployment rates are concerning and indicate potentially higher needs forcertain social services. The various indicators may also indicate some concern about the local tax base.
Tax Bases:
The local economy provides resources for local government through a variety of revenue sources.These revenues are derived from taxes or charges levied upon particular tax bases. In Nevada, themajor tax bases for local government is sales, property and mining. While increasing tax bases arepositive, the true indicator for evaluating the local government's ability to provide services is theinflation-adjusted amount of the tax base per person (or per capita). If the per capita tax base isincreasing, the local government will generate more revenue per resident. A decreasing per capita taxbase is a negative indicator since it means that the county has fewer resources per resident.
The following indicators are used to evaluate the tax base in the county:
• Real Assessed Value of Property• Real Sales• Net Proceeds of Mines• Tax Base Indices
The economy in Eureka County is dominated by the mining industry. Because of the incrediblerise in mining activity during the last ten years the tax bases have grown phenomenally. EurekaCounty has prospered during this time period while some of the other counties statewide have notfaired as well. However, the downside is that when the mines play out the tax base disappears.Tax bases usually have a relatively stable portion, the property tax base, and a relatively volatileportion, the sales tax base. The sales tax base is more volatile because it is tied to fluctuations inthe economy. Eureka County is unique. First, gold mining is not necessarily responsive to trendsin the overall economy. Second, the tax base sources are not typical. The stock of real property

viii
is dominated by mining industry structures. The sales tax base is tied to mining activity with alarge percentage of mining equipment sales. Therefore, the entire tax base is relatively volatileand not necessarily tied to the economy as a whole.
The Division of Assessment Standards of the Department of Taxation has in place a formula thatwould apply to the property improvements of mines, which have been either “mothballed” orclosed down. The formula systematically devalues the property over a five-year period. If thereis a significant downturn in the mining industry the property tax base will not be depreciated awayentirely for up to five years. During this same period the sales tax base can erode at a much fasterrate.
Revenues:
Local governments receive revenues from various sources. Some sources are relatively stable whilethe business cycle and growth of the community affect others. The community needs to have sufficientrevenues to provide the necessary services while having a mix of revenue sources that will not be toosensitive to any downturn in the local economy. The elastic revenue sources are that sensitive to thebusiness cycle. If the share of revenues coming from elastic sources is rising, this may forebodeproblems in the event of an economic downturn. A community's tax rates are an indicator of whetherthe tax base is keeping pace with growth or whether higher rates are needed to finance necessaryservices for growth. Tax rates are limited by Nevada Statutes and by voters.
The following indicators are used to evaluate revenues in the county:
• Real Total Revenue• Real Revenues Per Capita• Revenues by Source Per Capita• Composition of Revenues• Restricted Revenues• Intergovernmental Revenues• Elastic Revenue Sources• Ratio of General Fund to All Funds• County Property Tax Rate• Actual Minus Budgeted Revenues
Revenues grew tremendously for Eureka County during the past decade except for a period from1994 through 1996. The overall increase in real revenues from 1986 to 1996 was 369.5%compared to a statewide growth rate of 88.9%. When further adjusted for changes in population,revenues increased by 257.4% while statewide per capita revenues grew by a relatively smaller13.1%. The source of revenues has changed somewhat. Sales tax revenues have increasedconsiderably more than property and “other” revenue sources, although property tax revenues areexpected to equal sales tax revenues in 1997. Sales tax revenues per capita increased by 429.7%from 1986 to 1996. Property tax revenues increased by 246.9% while other revenue sourcesincreased by a comparatively modest 36.1% during the same period. It appears that otherrevenue sources will continue to be a diminishing share of total revenues. The county relies on an
ix
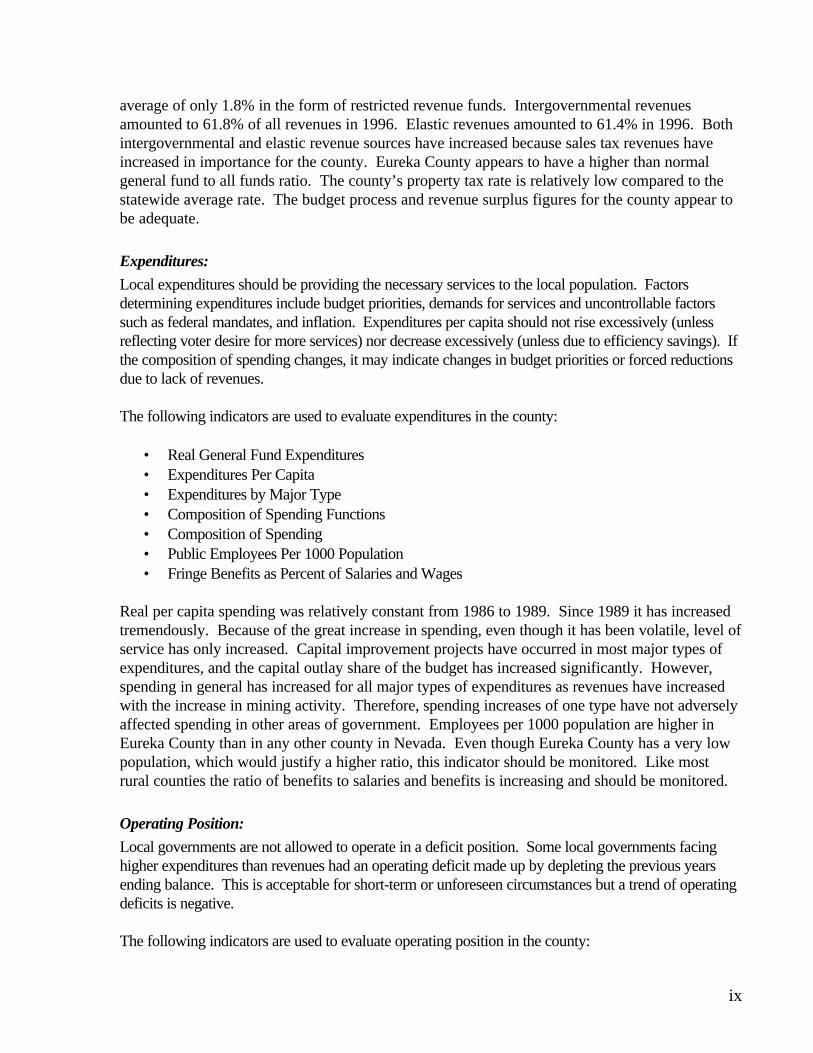
average of only 1.8% in the form of restricted revenue funds. Intergovernmental revenuesamounted to 61.8% of all revenues in 1996. Elastic revenues amounted to 61.4% in 1996. Bothintergovernmental and elastic revenue sources have increased because sales tax revenues haveincreased in importance for the county. Eureka County appears to have a higher than normalgeneral fund to all funds ratio. The county’s property tax rate is relatively low compared to thestatewide average rate. The budget process and revenue surplus figures for the county appear tobe adequate.
Expenditures:
Local expenditures should be providing the necessary services to the local population. Factorsdetermining expenditures include budget priorities, demands for services and uncontrollable factorssuch as federal mandates, and inflation. Expenditures per capita should not rise excessively (unlessreflecting voter desire for more services) nor decrease excessively (unless due to efficiency savings). Ifthe composition of spending changes, it may indicate changes in budget priorities or forced reductionsdue to lack of revenues.
The following indicators are used to evaluate expenditures in the county:
• Real General Fund Expenditures• Expenditures Per Capita• Expenditures by Major Type• Composition of Spending Functions• Composition of Spending• Public Employees Per 1000 Population• Fringe Benefits as Percent of Salaries and Wages
Real per capita spending was relatively constant from 1986 to 1989. Since 1989 it has increasedtremendously. Because of the great increase in spending, even though it has been volatile, level ofservice has only increased. Capital improvement projects have occurred in most major types ofexpenditures, and the capital outlay share of the budget has increased significantly. However,spending in general has increased for all major types of expenditures as revenues have increasedwith the increase in mining activity. Therefore, spending increases of one type have not adverselyaffected spending in other areas of government. Employees per 1000 population are higher inEureka County than in any other county in Nevada. Even though Eureka County has a very lowpopulation, which would justify a higher ratio, this indicator should be monitored. Like mostrural counties the ratio of benefits to salaries and benefits is increasing and should be monitored.
Operating Position:
Local governments are not allowed to operate in a deficit position. Some local governments facinghigher expenditures than revenues had an operating deficit made up by depleting the previous yearsending balance. This is acceptable for short-term or unforeseen circumstances but a trend of operatingdeficits is negative.
The following indicators are used to evaluate operating position in the county:

x
• Net Surplus (Deficit)• Ending Balance as Percent of Total Expenditures
The county maintained an adequate net surplus before revenue and spending patterns began tofluctuate. The ending balance for Eureka County has always been very high. This may not beunusual, because the required amount is determined by characteristics unique to the county.Overall, it appears that the county has maintained an adequate operating position.
Capital:
Expenditures for operating equipment—such as trucks and computers—drawn from the operatingbudget are usually referred to as capital outlay. Capital outlay items normally include equipment thatwill last longer than one year and that has an initial cost above a significant minimum cost. The ratio ofcapital outlay to net operating expenditures is a rough indicator of whether the stock of equipment isbeing adequately replaced. If this ratio declines it may mean that the local government’s needs aretemporarily satisfied or that they are being deferred due to other budget priorities.
The following indicators are used to evaluate capital outlay for the county:
• Capital Outlay• Capital Outlay to Total Spending
The county has taken advantage of the recent economic growth to increase level of service.Eureka County is in a unique situation and the extraordinary increases in capital spending seemreasonable.

1
I Economic and Demographic Characteristics
The economic and demographic condition indicators are used to evaluate the community's needsand resources. The economy (measured by income, labor force, employment, and unemployment)is an indicator of both the health of the community and its needs for public services. Thedemographic indicators (population, poverty, and housing) show who is living in the communityand what types of services are likely to be needed. Certain measures such as poverty rates ormobile home residents may indicate particular needs.
By and large, the economic and demographic characteristics are beyond the control of localgovernment, which can usually only react to them. In the long run, a community needs a localeconomic base that is protected from sudden downturns in the business cycle but can takeadvantage of upturns.
• Population: The county added 375 people from 1986 to 1996. This is a growth rate of31.4% over the period. The statewide growth rate was 67.0%. The population is agingsomewhat as the over 64 age group increased from 7.7% to 10.4% of the population andthe under 20 age group decreased slightly from 30.2% of the population to 29.2%.Population growth has been relatively slow since 1990, only increasing by 1.6% overall.
• Housing: Total housing units increased slightly during the last ten years. The county’shousing is dominated by mobile homes.
• Income: Income per capita adjusted for inflation fluctuated during the period but hasgenerally risen . Overall, real income grew by 38.7%. Real income in Eureka County isnow higher than the statewide average.
• Poverty: The number of welfare recipients (AFDC and Food Stamps) increasedsignificantly during the early and mid 1990’s. The number of food stamp recipients per1000 local residents is lower than the statewide average, however, the increase is alarming.
• Labor: Industrial employment in Eureka County has increased tremendously as miningactivity picked up. However, the actual labor force of county residents has declined and theunemployment rate has increased. This is a result of the large number of incommuters.
In general, the economic and demographic indicators show that the county has a relatively high level ofeconomic growth. The population growth of the county has not responded as incommuters contributeto industrial employment figures. The higher than average poverty and unemployment rates areconcerning and indicate potentially higher needs for certain social services. The various indicators mayalso signal need for concern about the local tax base.
2
Indicator 1.1aPopulation
0
200
400
600
800
1,000
1,200
1,400
1,600
1,800
1986 1987 1988 1989 1990 1991 1992 1993 1994 1995 1996 1997
Indicator 1.1a 1986 1987 1988 1989 1990 1991 1992 1993 1994 1995 1996 1997
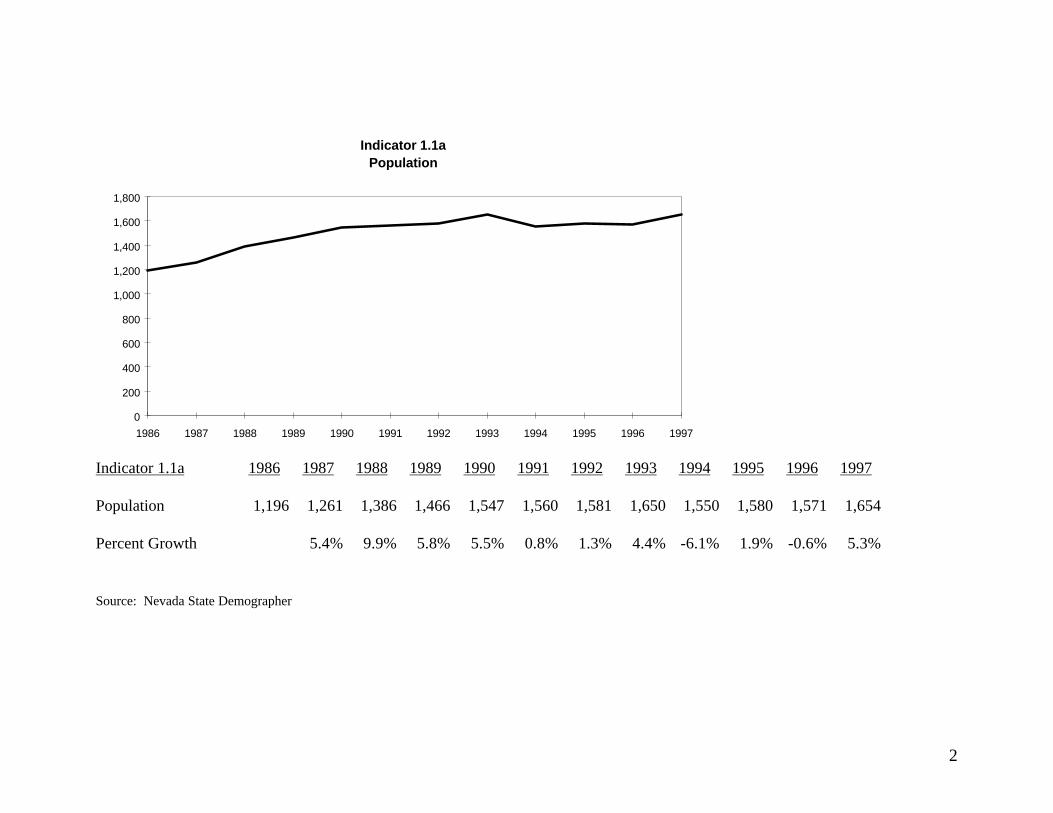
Population 1,196 1,261 1,386 1,466 1,547 1,560 1,581 1,650 1,550 1,580 1,571 1,654
Percent Growth 5.4% 9.9% 5.8% 5.5% 0.8% 1.3% 4.4% -6.1% 1.9% -0.6% 5.3%
Source: Nevada State Demographer

3
Indicator 1.1 aPopulation
Description: Population is a fundamental indicator of the size of the community. It thus reflectsthe most basic measure of the demand for public services and the local tax base. Significantpopulation changes can have budgetary implications. If population grows too rapidly this maycreate need for increased capital and public services. If population declines or grows too slowly,the community may not enjoy economies of scale from local infrastructure (such as sewer androads) and costs per resident may actually increase. Population decline may also require reducedspending.
Analysis: The county experienced steady growth in the late 1980s and then leveled off in theearly 1990s. Growth was generally flat during the 1990s except for a 4.4% growth rate in 1993.From 1986 to 1996 the statewide population growth rate was 67.0% while the county grew at arate of 31.4%. However, from 1990 to 1996 the county grew at a rate of only 1.6%.

4
Indicator 1.1b,cPopulation Components
0
50
100
150
200
250
300
350
400
450
500
1986 1987 1988 1989 1990 1991 1992 1993 1994 1995 1996 1997
Over 64
Under Age 20
School Enrollment

5
Indicator 1.1b 1986 1987 1988 1989 1990 1991 1992 1993 1994 1995 1996 1997
Over 64 92 100 113 119 131 133 139 156 154 163 164 183
% Over 64 7.7% 7.9% 8.2% 8.1% 8.5% 8.5% 8.8% 9.5% 9.9% 10.3% 10.4% 11.1%
Under Age 20 361 377 414 436 456 456 468 490 465 469 458 468
% Under Age 20 30.2% 29.9% 29.9% 29.7% 29.5% 29.2% 29.6% 29.7% 30.0% 29.7% 29.2% 28.3%
Indicator 1.1c 1986 1987 1988 1989 1990 1991 1992 1993 1994 1995 1996
School Enrollment 205 235 255 272 286 302 317 319 274 308 332
Enrollment Ratio 17.1% 18.6% 18.4% 18.6% 18.5% 19.4% 20.1% 19.3% 17.7% 19.5% 21.1%

6
Indicator 1.1dDependents As Percent of Population
30.0%
32.0%
34.0%
36.0%
38.0%
40.0%
42.0%
44.0%
46.0%
48.0%
50.0%
1986 1987 1988 1989 1990 1991 1992 1993 1994 1995 1996
Indicator 1.1d 1986 1987 1988 1989 1990 1991 1992 1993 1994 1995 1996
Dependents Ratio 37.9% 37.8% 38.0% 37.9% 37.9% 37.8% 38.4% 39.2% 39.9% 40.0% 39.6%
Source: Nevada State Demographer

7
1.1 b, cPopulation Components
1.1 dDependents as Percent of Population
Description: The components of the population represent different age groups within thecounty. The importance of this indicator is that school enrollment represents demand for schoolservices and other child services while the population over age 64 typically has different demandsfor public services. Older population groups typically require higher levels of services such asmedical care, long-term care, and other social services. The percent of dependents in thepopulation consists of persons under age 20 (children and school age) and persons over age 64(presumably retired). If the number of dependents in an area rises too high it may mean that ahigher tax burden may be imposed on the rest of the population.
Analysis: Demographic characteristics of the county are gradually changing. The under age 20group has decreased slightly from 30.2% of the population to 29.2% during the period of 1986 to1996. The over age 64 group has grown significantly from 7.7% to 10.4%. Overall thedependents ratio has increased, which signifies an aging of the population. At the same time, theschool enrollment ratio has increased in recent years. It appears that the county will requireincreased expenditures for social services even as the working age population decreases.
8
Indicator 1.2aTotal Housing Units
720
740
760
780
800
820
840
860
880
1991 1992 1993 1994 1995 1996
Indicator 1.2a 1991 1992 1993 1994 1995 1996
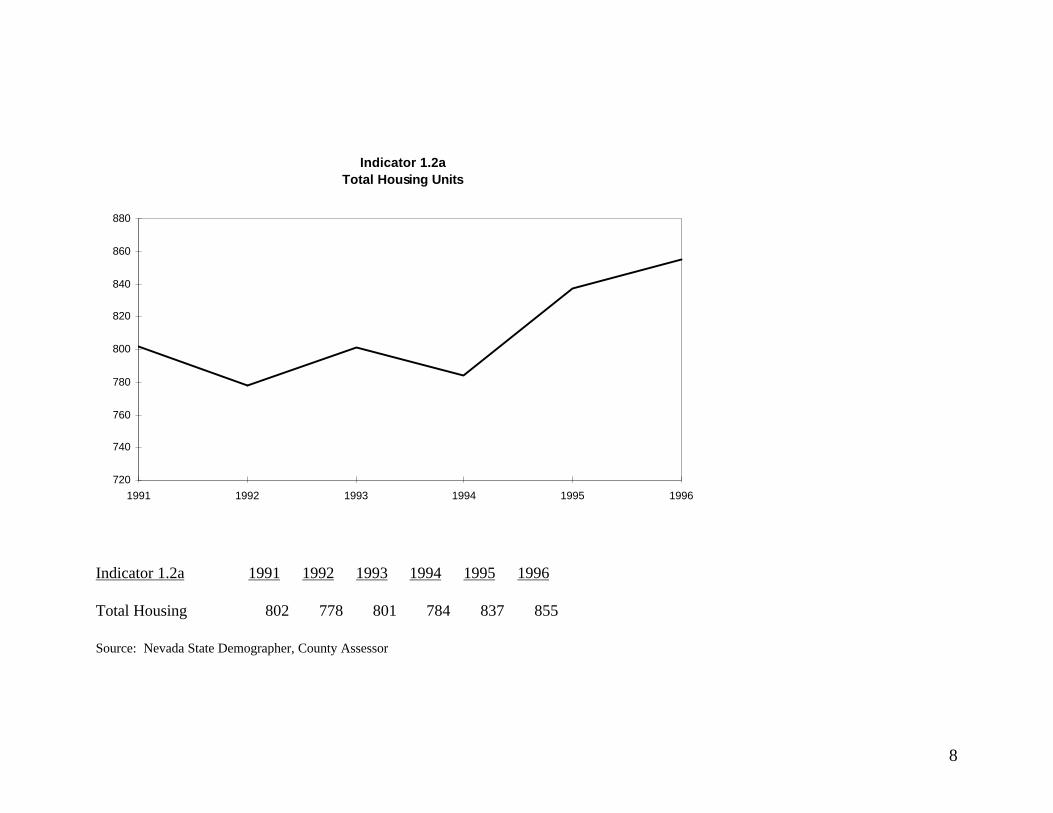
Total Housing 802 778 801 784 837 855
Source: Nevada State Demographer, County Assessor
9
Indicator 1.2bShare of Types of Housing
0.0%
10.0%
20.0%
30.0%
40.0%
50.0%
60.0%
70.0%
1991 1992 1993 1994 1995 1996
SF Share
MF Share
Mobile Share

10
Indicator 1.2a 1991 1992 1993 1994 1995 1996
Total 802 778 801 784 837 855
SF 246 271 273 272 273 279
MF 31 6 6 3 3 15
Mobile 525 501 522 509 561 561
Indicator 1.2b 1991 1992 1993 1994 1995 1996
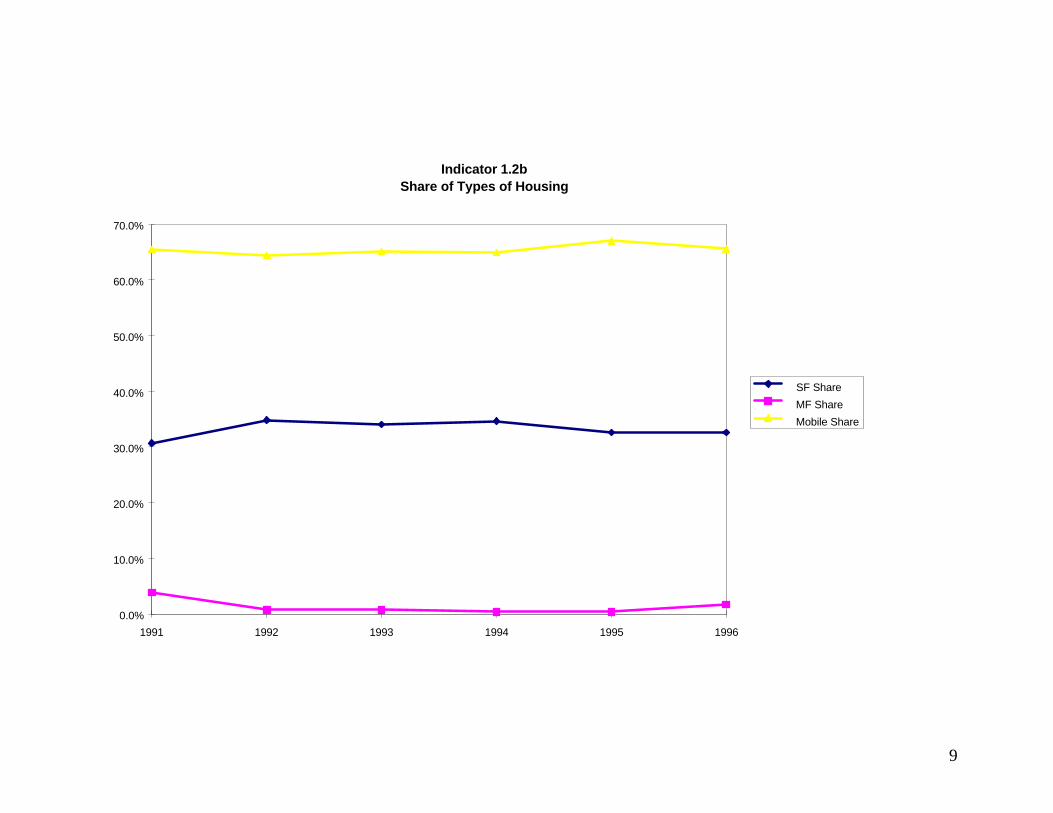
SF Share 30.7% 34.8% 34.1% 34.7% 32.6% 32.6%
MF Share 3.9% 0.8% 0.7% 0.4% 0.4% 1.8%
Mobile Share 65.5% 64.4% 65.2% 64.9% 67.0% 65.6%
Source: Nevada State Demographer, County Assessor

11
Indicator 1.2 aTotal Housing Units
Indicator 1.2 bTypes of Housing
Description: The number and type of housing are indicators of the need for housing relatedservices and indirect indicators of the property tax base. Like population, if housing grows toofast, the community’s infrastructure may be stretched. If housing grows too slow or declines thismay cause declining housing prices and declining property tax base. The type of housing isimportant as different housing has different values and different impacts on infrastructure andpublic services. For example, mobile homes typically have lower values than single family anddepreciate faster. Single family houses typically have higher number of persons per house.Multifamily (apartments or condominiums) often serves as entry level or temporary housing. Acommunity should have a mix of housing types.
Analysis: Total housing has increased slightly during the period and the mix of housing hasremained relatively constant. Eureka County has a large percentage of mobile homes. In 1996the percentage is 65.6% compared to a statewide average of 12.2%. Since 1992 the share ofsingle family housing has actually declined slightly while the mobile home share has increasedslightly. This can negatively affect the tax base (see indicator 2.1) in the long run.

12
Indicator 1.3 Real Income Per Capita
-
5,000
10,000
15,000
20,000
25,000
30,000
1986 1987 1988 1989 1990 1991 1992 1993 1994
Indicator 1.3 1986 1987 1988 1989 1990 1991 1992 1993 1994
Income Per Capita 15,421 15,740 19,916 22,338 21,064 20,392 21,763 24,628 26,984
Real Income Per Capita 18,649 18,485 22,790 24,762 22,394 20,926 21,763 24,067 25,859
Sources: Bureau of Economic Analysis REIS.State of Nevada, Human Resources Department, Welfare Division
Note: Welfare data are estimates only, not official caseload.
13
Indicator 1.4Food Stamp Recipients Per 1000 Population
0
5
10
15
20
25
30
35
40
45
50
1990 1991 1992 1993 1994 1995 1996 1997
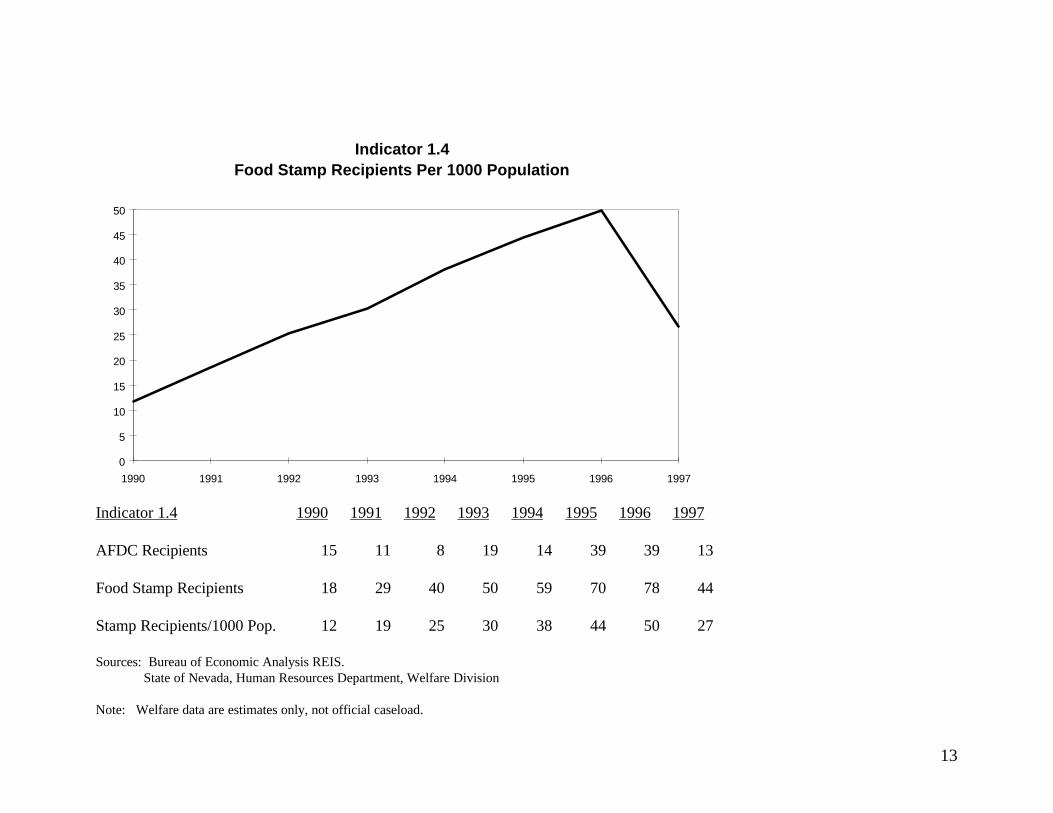
Indicator 1.4 1990 1991 1992 1993 1994 1995 1996 1997
AFDC Recipients 15 11 8 19 14 39 39 13
Food Stamp Recipients 18 29 40 50 59 70 78 44
Stamp Recipients/1000 Pop. 12 19 25 30 38 44 50 27
Sources: Bureau of Economic Analysis REIS.State of Nevada, Human Resources Department, Welfare Division
Note: Welfare data are estimates only, not official caseload.

14
Indicator 1.3Real Income Per Capita
Indicator 1.4Food Stamp Recipients Per 1000 Population
Description: The two measures of income represent the level and distribution of income withinthe county. Real per capita income shows the average amount of income earned by residentswithin the county. A rising level of per capita income indicates a more prosperous economy.Food stamp and AFDC recipients represent the number of people in poverty. A rising number ofFood Stamp or AFDC recipients may indicate increasing demands for social services andproblems with the local economy. To adjust for population changes, the number of Food Stamprecipients is also reported per 1000 population.
Analysis: Real income per capita was flat during 1987 then increased through 1989. Itdecreased from 1989 to 1991 before increasing again from 1991 to 1994. Eureka County percapita income in 1994 was $25,859 compared to a statewide average of $22,694. The growthrate of per capita income was 38.7% in Eureka County compared to a statewide rate of 14.0%during the period from 1986 to 1994. The relatively high per capita income and volatility is aresult of the significant mining activity in the county (see indicator 2.3.) Food stamp recipientsper 1000 population increased by 317% from 1990 to 1996, going from 12 to 50. The total isexpected to drop down to 27 in 1997 compared to a statewide average of 49. The two trends aresomewhat contradictory and may reflect changes in the distribution of income.

15
Indicator 1.5a Labor Force and Industrial Employment
0
500
1000
1500
2000
2500
3000
3500
4000
4500
5000
1986 1987 1988 1989 1990 1991 1992 1993 1994 1995 1996
Labor Force Industrial Employment
Indicator 1.5a 1986 1987 1988 1989 1990 1991 1992 1993 1994 1995 1996
Labor Force * 850 870 840 910 920 740 770
IndustrialEmployment
1086 1456 3181 3864 4026 4106 4326 4518 4948 4530 4860
Sources: State of Nevada, Employment, Training and Rehabilitation Department.* Labor Force data for the years 1986 to 1989 was intentionally left out. A break in this series rendered the data unusable.

16
Indicator 1.5b Unemployment Rate
0.0%
1.0%
2.0%
3.0%
4.0%
5.0%
6.0%
7.0%
8.0%
9.0%
10.0%
1986 1987 1988 1989 1990 1991 1992 1993 1994 1995 1996
Indicator 1.5b 1986 1987 1988 1989 1990 1991 1992 1993 1994 1995 1996
Unemployment Rate 4.3% 2.6% 1.8% 2.3% 5.7% 4.2% 5.6% 7.2% 9.5% 8.8% 7.8%
Sources: State of Nevada, Employment, Training and Rehabilitation Department.

17
Indicator 1.5 aLabor Force and Industrial Employment(Combined with Indicator 1.5b)
Indicator 1.5 bUnemployment Rate
Description: Indicators 1.5a and 1.5b show the labor market conditions in the county. Laboravailability, measured by labor force and industrial employment, indicates the number of peoplewho are either actually working or actively seeking a job. Labor force is the number of residentsworking or looking for work within the county, while industrial employment is the job availabilitywithin the county. Industrial employment is an indicator of job availability within the county. Theparticipation ratio indicates the proportion of people in the labor force relative to the totalpopulation. An increasing participation rate indicates that more of the population is able to work.The unemployment rate measures the percent of the labor force that is unable to find employment.A decreasing unemployment rate is an indicator of a better local economy.
Analysis: Industrial employment increased drastically from 1986 to 1989. This was a result of ahuge increase in mining activity. The growth rate during this period was 255.8%. The industrialemployment growth rate has moderated considerably since 1989 with an average annual growthrate of 3.5%. The industrial employment figures include incommuters. Many of the miners live inthe Elko area and work in Eureka County. Labor force accounts solely for workers that reside inEureka County. Because of a break in the data series 1990 is the first year of reliable data. Thelabor force has remained fairly constant except for a drop of 19.6% in 1995. A similar dropoccurred in the industrial employment data and accounts for a drop in mining activity.

18
II Tax Bases
Description:
Local tax bases are directly related to the level of economic activity in the county. Through thevarious tax formulas, the tax bases generate revenues for local government. The largest tax basesfor county governments in Nevada are property, sales, mining and gaming. Unfortunately,gaming data is not available for most rural Nevada counties.
To provide necessary services, a local government requires a stable or increasing tax base. Tomeasure tax bases requires adjusting for two factors: inflation and population. A tax base mustkeep pace with both these factors. The most important measure of a tax base is therefore its “realper capita” level. The term “real” refers to inflation adjusted while “per capita” refers to dividingby the population. If the real per capita tax base is increasing, then a constant tax rate willprovide increased tax revenues per resident. If the per capita base is decreasing, then tax ratesmust be increased just to maintain the current tax revenues. Often when local governments askwhether growth pays for itself, they are asking whether the local tax base per capita is rising orfalling.
Analysis:
The economy in Eureka County is dominated by the mining industry. Because of the incrediblerise in mining activity during the last ten years the tax bases have grown phenomenally. EurekaCounty has prospered during this time period while some of the other counties statewide have notfaired as well. However, the downside is that when the mines play out the tax base disappears.Tax bases usually have a relatively stable portion, the property tax base, and a relatively volatileportion, the sales tax base. The sales tax base is more volatile because it is tied to fluctuations inthe economy. Eureka County is unique. First, gold mining is not necessarily responsive to trendsin the overall economy. Second, the tax base sources are not typical. The stock of real propertyis dominated by mining industry structures. The sales tax base is tied to mining activity with alarge percentage of mining equipment sales. Therefore, the entire tax base is relatively volatileand not necessarily tied to the economy as a whole.
The Division of Assessment Standards of the Department of Taxation has in place a formula thatwould apply to the property improvements of mines, which have been either “mothballed” orclosed down. The formula systematically devalues the property over a five-year period. If thereis a significant downturn in the mining industry the property tax base will not be depreciated awayentirely for up to five years. During this same period the sales tax base can erode at a much fasterrate.

19
Indicator 2.1 Real Assessed Value of Property
0
100,000,000
200,000,000
300,000,000
400,000,000
500,000,000
600,000,000
700,000,000
800,000,000
900,000,000
1986 1987 1988 1989 1990 1991 1992 1993 1994 1995 1996
Real AV Real AV Excluding NPM

20
Indicator 2.1 1986 1987 1988 1989 1990 1991 1992 1993 1994 1995 1996
Assessed Value* 72.8 210.5 287.8 344.3 477.5 564.8 542.5 590.1 737.5 894.2 923.3
AV Excluding NPM* 41.3 82.0 87.5 141.7 220.1 286.9 291.4 318.3 381.5 428.4 448.7
NPM* 31.5 128.6 200.2 202.6 257.4 277.9 251.0 271.7 356.0 465.8 474.6
Real AV* 88.1 247.2 329.3 381.6 507.6 579.6 542.5 576.6 706.8 829.6 834.1
Real AV Excluding NPM* 50.0 96.3 100.2 157.1 234.0 294.4 291.4 311.1 365.6 397.4 405.4
Real Total AV Per Capita** 73.7 196.1 237.6 260.3 328.1 371.5 343.1 349.5 456.0 525.1 530.9
Real AV-NPM Per Capita** 41.8 76.3 72.3 107.2 151.2 188.7 184.3 188.5 235.9 251.5 258.0
*In Millions of Dollars**In Thousands of Dollars
Source: Nevada Department of Taxation

21
Indicator 2.1Real Assessed Value of Property
Description: Assessed value is the taxable value of real and personal property. It includescentrally assessed property (such as utilities) and net proceeds of mines. Assessed value isnormally the most stable tax base in a county. Wide fluctuations, especially downward, areindicative of a decrease in local tax base. Real Assessed value adjusts the reported values for theeffects of inflation. Real assessed value per capita adjusts for population. This indicator shouldbe stable or increasing.
Analysis: Real assessed value of property has increased by 846.8% from 1986 to 1996. Thisincrease is attributable to the significant increase in mining activity in Eureka County during theperiod. This reflects the increased value in the physical structures of the mining properties.Typically, if an industry closes down, the property tax base in a community is still supported byresidential home values, at least for a period of time. However, in Eureka County the propertytax base is supported to a large extent by industrial mining property. Any significant downturn inthe industry will eventually have an effect across all tax bases. For Eureka County assessed valueof property is a more volatile tax base than for counties in general.

22
Indicator 2.2 Real Taxable Sales
-
50,000,000
100,000,000
150,000,000
200,000,000
250,000,000
1986 1987 1988 1989 1990 1991 1992 1993 1994 1995 1996
Indicator 2.2 1986 1987 1988 1989 1990 1991 1992 1993 1994 1995 1996
Taxable Sales* 26.0 20.6 57.8 95.6 92.7 92.6 116.7 198.0 200.6 202.8 240.4
Real Sales* 31.4 24.2 66.1 106.0 98.5 95.0 116.7 193.5 192.2 188.2 217.2
Sales Per Capita** 26.2 19.2 47.7 72.3 63.7 60.9 73.8 117.3 124.0 119.1 138.3
*In Millions of Dollars**In Thousands of Dollars
Source: Nevada Department of Taxation

23
Indicator 2.2Real Sales
Description: Taxable sales represent the second largest tax base in most counties (afterproperty). Local governments do not collect sales tax directly. The state government collects allsales and use taxes and redistributes them to local government depending on various formulas.The most significant sales taxes for county government are BCCRT (Basic City County ReliefTax), a 0.5% tax, and SCCRT (Supplemental City County Relief Tax), a 1.75% tax. Both thesetaxes are shared with cities and special districts on the basis of population and relative assessedvalue. Taxable sales are sensitive to business cycles and local economic activity. Because of asmall retail sales base many local counties in Nevada are considered guaranteed counties forSCCRT purposes. Guarantee status means that sales taxes will be less subject to fluctuation thanthe underlying taxable sales base.
Analysis: Taxable sales have shown fluctuations throughout the period. Sales tax bases typicallyfluctuate with the condition of the state or national economy. Sales taxes in Eureka County areprimarily related to the gold mining industry, which does not necessarily fluctuate with theeconomy in general. Not only is the sales tax base a relatively volatile tax base but in EurekaCounty it has unique characteristics. This indicator should be monitored.

24
Indicator 2.3Real Net Proceeds of Mines
-
50,000,000
100,000,000
150,000,000
200,000,000
250,000,000
300,000,000
350,000,000
400,000,000
450,000,000
1986 1987 1988 1989 1990 1991 1992 1993 1994 1995 1996
Indicator 2.3 1986 1987 1988 1989 1990 1991 1992 1993 1994 1995 1996
Net Proceeds of Mines* 31.5 128.6 200.2 202.6 257.4 277.9 251.0 271.7 356.0 465.8 474.6
Real NPM* 38.1 151.0 229.1 224.5 273.7 285.2 251.0 265.5 341.2 432.2 428.7
Real NPM Per Capita** 31.9 119.7 165.3 153.2 176.9 182.8 158.8 160.9 220.1 273.5 272.9
*In Millions of Dollars**In Thousands of Dollars
Source: Nevada Department of Taxation
25
Indicator 2.3Net Proceeds of Mines
Description: Net Proceeds of Mines is the primary tax base for determining the property taxes ofmines. It is calculated similar to net profit and allows mines to subtract their operating costs fromtheir gross output.
Analysis: Net proceeds have had significant fluctuations during recent years although they aregenerally increasing. External forces including the market value of gold influence net proceeds.This causes the fluctuations to be unpredictable. Eureka County has the highest net proceeds ofmines in the State of Nevada. The magnitude of gold production is not expected to changesubstantially in the near future. However, the gap between gross proceeds of mines and netproceeds of mines has been widening in recent years. Because this industry dominates the localeconomy, this indicator should be monitored

26
Indicator 2.4 Tax Base Indices
1988=100
0.0
50.0
100.0
150.0
200.0
250.0
300.0
350.0
400.0
1986 1987 1988 1989 1990 1991 1992 1993 1994 1995 1996
AV
Sales
NPM
Indicator 2.4 1986 1987 1988 1989 1990 1991 1992 1993 1994 1995 1996
Assessed Value of Property* 57.8 105.6 100.0 148.3 209.2 261.1 255.0 260.9 326.3 348.0 357.0
Real Taxable Sales 55.0 40.3 100.0 151.5 133.5 127.7 154.7 245.9 260.0 249.7 289.9
Net Proceeds of Mines 19.3 72.4 100.0 92.7 107.0 110.6 96.1 97.4 133.2 165.5 165.1
*Excluding value of Net Proceeds of Mines

27
Indicator 2.4Tax Base Indices1988=100
Description: The tax index is created to adjust for two factors, inflation and population. Thismeasures the relative amount of tax base per resident. An increase in the index indicates more taxbase. The amount of tax base per capita in 1988 is used as the base. An increasing tax base indexindicates that the tax base is increasing faster than the local population or inflation. An increasingtax base index potentially means that the same tax rate would generate an increased amount ofrevenue. Conversely, a decreasing index means that either the tax base is decreasing or isgrowing slower than the population or inflation. A decreasing index may mean that an increasedtax rate is required to generate the former level of revenues.
Analysis: All three relevant tax base indices are generally increasing for Eureka County. Thisindicates that resources per capita have been increasing. The fluctuations are attributable tomining activity (see indicators 2.1, 2.2 and 2.3) which is difficult to predict.

28
III Revenues
Description: Revenues determine the capacity of a local government to fund and provideservices. Important issues to consider in revenue analysis are:
⇒ Growth: Revenues should grow at a pace sufficient to meet demands for servicesfrom increased population, housing or employment. Per capita revenues should bestable or increasing.
⇒ Sources: No one economic sector or population group should bear the entire taxburden. The county should have diverse sources of revenue, which are appropriate tothe economic base. Relying too heavily on one particular source (such as property)may cause excessive tax rates.
⇒ Dependability: Revenues should be balanced between those that fluctuate with theeconomic base (such as sales) and those that are stable (such as property). If revenuesare too “elastic” they may increase quickly during economic growth but decline tooquickly during a recession.
⇒ Flexibility: Revenue sources should not be too restricted as to their use (such asgrants) and should be available to fund different spending priorities as the prioritieschange.
⇒ Administration: Revenues should not be too difficult to collect and administer.Forecasts of revenue for budgeting purposes should be relatively accurate.
Analysis: Corresponding to the issues described above, a number of revenue indicators wereanalyzed.
• Real Revenues• Revenue Sources• Composition of Revenues• Restricted Revenues• Intergovernmental Revenues• Elastic Revenues• All Funds• Property Tax Rate• Budget Minus Actual
Revenues grew tremendously for Eureka County during the past decade except for a period from1994 through 1996. The overall increase in real revenues from 1986 to 1996 was 369.5%compared to a statewide growth rate of 88.9%. When further adjusted for changes in population,revenues increased by 257.4% while statewide per capita revenues grew by a relatively smaller13.1%. The source of revenues has changed somewhat. Sales tax revenues have increasedconsiderably more than property and “other” revenue sources, although property tax revenues areexpected to equal sales tax revenues in 1997. Sales tax revenues per capita increased by 429.7%from 1986 to 1996. Property tax revenues increased by 246.9% while other revenue sourcesincreased by a comparatively modest 36.1% during the same period. It appears that other

29
revenue sources will continue to be a diminishing share of total revenues. The county relies on anaverage of only 1.8% in the form of restricted revenue funds. Intergovernmental revenuesamounted to 61.8% of all revenues in 1996. Elastic revenues amounted to 61.4% in 1996. Bothintergovernmental and elastic revenue sources have increased because sales tax revenues haveincreased in importance for the county. Eureka County appears to have a higher than normalgeneral fund to all funds ratio. The county’s property tax rate is relatively low compared to thestatewide average rate. The budget process and revenue surplus figures for the county appear tobe adequate.

30
Indicator 3.1 Real Total Revenue
0
1,000,000
2,000,000
3,000,000
4,000,000
5,000,000
6,000,000
7,000,000
8,000,000
1986 1987 1988 1989 1990 1991 1992 1993 1994 1995 1996a 1997b
Indicator 3.1 1986 1987 1988 1989 1990 1991 1992 1993 1994 1995 1996a 1997b
Total Revenue* 1,125 1,508 1,670 2,392 3,593 4,591 5,318 6,495 6,643 6,572 7,073 8,678
Real Total Revenue* 1,361 1,771 1,911 2,652 3,820 4,711 5,318 6,348 6,366 6,097 6,390 7,582
Source: County Budget, LCB
*Thousands of dollars

31
Indicator 3.1Real Total Revenue
Description: Total revenue includes General Fund revenues from all sources. Nominal revenuepresents the total in current or actual amounts. Real Total Revenue presents the revenue adjustedfor inflation or in constant purchasing power. Nominal revenue may be increasing but if inflationis increasing faster, real revenue may actually decrease. Real revenue is a better indicator since itadjusts revenues for the effects of inflation and thus allows comparison between different years.Ideally, real revenue should be increasing at a rate parallel to population (see Indicator 3.2). Ifreal revenue is declining the county will be unable to purchase as much as it could previously.
Analysis: Both nominal and real revenue grew considerably for Eureka County during the pastdecade except for a period from 1994 through 1996. The overall increase in real revenues from1986 to 1996 was 369.5%. The statewide growth during this same period was 88.9%, while therural counties (15 Nevada counties excluding Clark and Washoe) growth rate was 53.7%.

32
Indicator 3.2 Real Revenues Per Capita
0
500
1,000
1,500
2,000
2,500
3,000
3,500
4,000
4,500
5,000
1986 1987 1988 1989 1990 1991 1992 1993 1994 1995 1996a 1997b
Indicator 3.2 1986 1987 1988 1989 1990 1991 1992 1993 1994 1995 1996a 1997b
Real Revenues Per Capita 1,138 1,404 1,379 1,809 2,469 3,020 3,364 3,847 4,107 3,859 4,067 4,584
Percent Change 23.4% -1.8% 31.2% 36.5% 22.3% 11.4% 14.4% 6.8% -6.0% 5.4% 12.7%
Source: Local Budget, LCB
33
Indicator 3.2Real Revenues Per Capita
Description: Real revenues per capita are the total real revenues divided by the countypopulation. Since this adjusts for the effects of both inflation and population growth, it is a goodindicator of the county’s revenues and hence its ability to fund services. To provide a constantlevel of services, real revenues per capita should also be constant. Decreasing revenues per capitais a negative factor.
Analysis: Real revenues per capita have averaged a substantial 14.3% yearly growth rate from1986 to 1996. The growth rate statewide during the same period is only 5.3%. Only during theyears of 1988 and 1995 was the per capita growth rate of revenues less than the state average.The revenue growth rate for Eureka County is substantially exceeding inflation and populationgrowth rates.
34
Indicator 3.3 Per Capita Revenue Sources
0.0
500.0
1000.0
1500.0
2000.0
2500.0
3000.0
1986 1987 1988 1989 1990 1991 1992 1993 1994 1995 1996a 1997b
Ad Valorem
Sales
Other
35
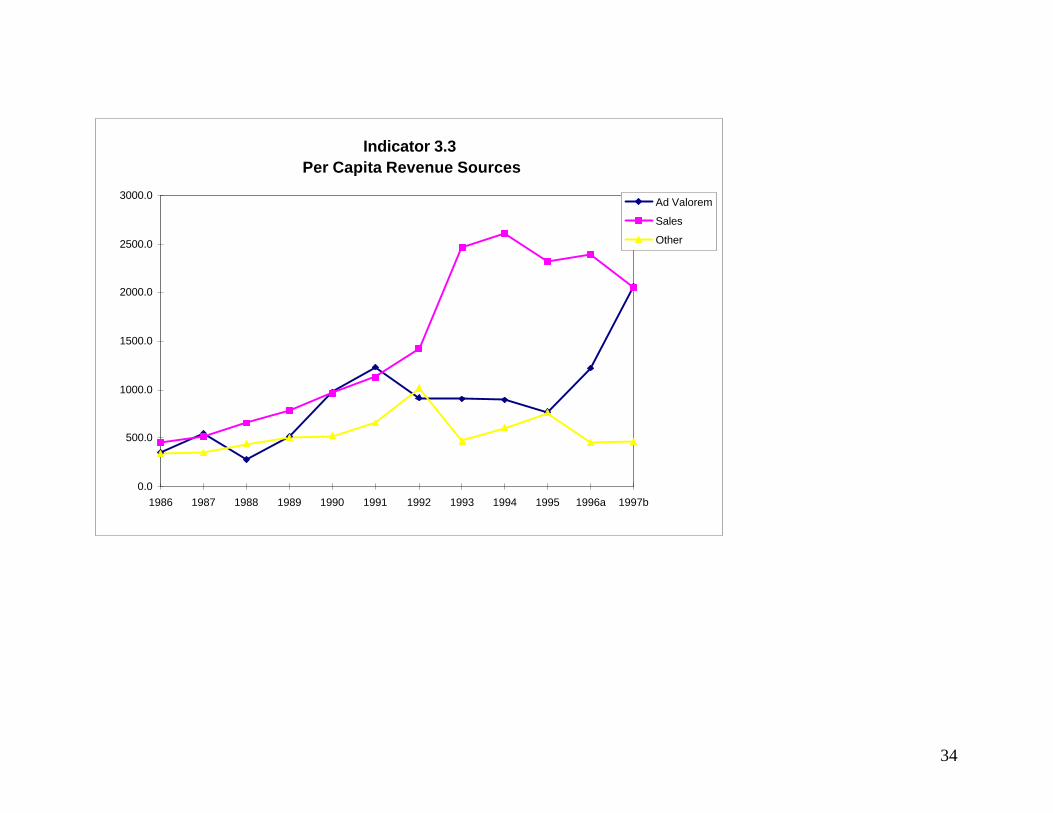
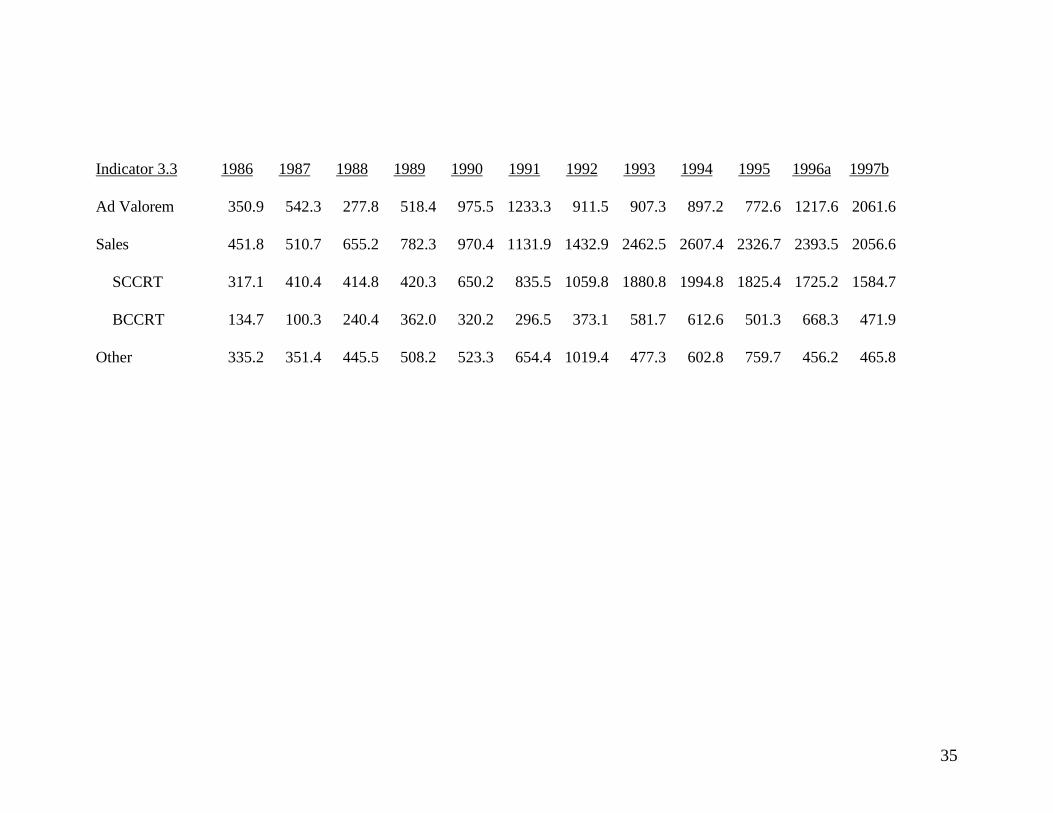
Indicator 3.3 1986 1987 1988 1989 1990 1991 1992 1993 1994 1995 1996a 1997b
Ad Valorem 350.9 542.3 277.8 518.4 975.5 1233.3 911.5 907.3 897.2 772.6 1217.6 2061.6
Sales 451.8 510.7 655.2 782.3 970.4 1131.9 1432.9 2462.5 2607.4 2326.7 2393.5 2056.6
SCCRT 317.1 410.4 414.8 420.3 650.2 835.5 1059.8 1880.8 1994.8 1825.4 1725.2 1584.7
BCCRT 134.7 100.3 240.4 362.0 320.2 296.5 373.1 581.7 612.6 501.3 668.3 471.9
Other 335.2 351.4 445.5 508.2 523.3 654.4 1019.4 477.3 602.8 759.7 456.2 465.8
36
Indicator 3.3Revenues by Source Per Capita
Description: Indicator 3.3 presents a disaggregated view of the information in the previousindicators. It presents real revenues per capita from selected individual revenue sources. Thisinformation is useful since it shows how different revenue sources are affected differently by thebusiness cycle. Traditionally, sales taxes are the most sensitive to economic changes whileproperty taxes are much more stable. The two major sales taxes are Supplemental City CountyRelief Tax (a 1.75% tax with certain minimum amounts guaranteed to certain rural counties) andBasic City County Relief Tax (a 0.5% sales tax based on actual county sales). Since BCCRT isnot guaranteed, it will experience wider swings with the business cycle. The category “Other”includes all other revenue categories (see Indicator 3.4 for more information).
Analysis: From 1986 through 1992 sales tax revenues and “other” revenue sources increased ata fairly steady rate. Sales tax revenues grew by 217.0% and other revenue sources grew by204.0%. Property tax revenue increased during this period although it was more volatile anddidn’t grow at the same rate. Property tax revenues grew by 160.0% during this early period.From 1992 through 1996 sales tax revenues continued to rise by 33.6%. However, other revenuesources decreased by 55.2%. During this period property tax revenues increased by 67.0%.After 1992 all three revenue sources have become more volatile. In general, sales and propertytax revenues have become more important while other revenue sources have become lessimportant. It appears that budget sales and property tax revenue will be almost equal for 1997while other revenue sources remain fairly constant.

37
Indicator 3.4 Composition of Revenues
0%
10%
20%
30%
40%
50%
60%
70%
80%
90%
100%
1986 1991 1996a
Transfer In
Misc Revenues
Filt
Grants
Bond Proceeds
Interest Earned
Chrgs for Services
Intergovernmental
Local Gaming
Licenses, Permits, Fines & Forfeits
Sales
Ad Valorem

38
Indicator 3.4 1986 1987 1988 1989 1990 1991 1992 1993 1994 1995 1996a 1997b
Ad Valorem 30.8% 38.6% 20.2% 28.7% 39.5% 40.8% 27.1% 23.6% 21.8% 20.0% 29.9% 45.0%
Sales 39.7% 36.4% 47.5% 43.2% 39.3% 37.5% 42.6% 64.0% 63.5% 60.3% 58.8% 44.9%
SCCRT 27.9% 29.2% 30.1% 23.2% 26.3% 27.7% 31.5% 48.9% 48.6% 47.3% 42.4% 34.6%
BCCRT 11.8% 7.1% 17.4% 20.0% 13.0% 9.8% 11.1% 15.1% 14.9% 13.0% 16.4% 10.3%
Other 29.5% 25.0% 32.3% 28.1% 21.2% 21.7% 30.3% 12.4% 14.7% 19.7% 11.2% 10.2%
Lic., Per., Fines & Forfeits 2.0% 1.7% 1.3% 0.9% 1.1% 0.7% 1.2% 0.8% 1.4% 1.2% 0.8% 0.7%
Local Gaming 0.1% 0.1% 0.1% 0.1% 0.1% 0.0% 0.1% 0.0% 0.0% 0.0% 0.0% 0.0%
Intergovernmental 8.4% 2.4% 4.0% 7.6% 4.8% 4.6% 3.2% 3.1% 3.1% 3.3% 2.5% 1.9%
Charges for Services 10.7% 11.7% 16.1% 11.6% 8.0% 6.7% 5.6% 5.1% 6.8% 7.0% 4.9% 4.7%
Interest Earned 4.9% 2.7% 5.6% 6.7% 6.2% 8.0% 5.7% 2.3% 1.9% 3.7% 2.1% 1.0%
Bond Proceeds 0.0% 0.0% 0.0% 0.0% 0.0% 0.0% 0.0% 0.0% 0.0% 0.0% 0.0% 0.0%
Grants 0.0% 0.2% 0.7% 0.3% 0.1% 0.5% 14.3% 0.6% 1.0% 2.4% 0.5% 1.5%
Filt 1.4% 4.2% 3.0% 0.0% 0.0% 0.0% 0.0% 0.0% 0.0% 0.0% 0.0% 0.0%
Misc. Revenues 1.9% 2.1% 1.4% 0.9% 1.0% 1.1% 0.3% 0.5% 0.5% 2.1% 0.4% 0.4%
Transfer In 0.0% 0.0% 0.0% 0.0% 0.0% 0.0% 0.0% 0.0% 0.0% 0.0% 0.0% 0.0%

39
Indicator 3.4Composition of Revenues
Description: Indicator 3.4 presents a detailed breakdown of the revenues for the county generalfund. For each year, the revenue is shown as a percent of the total. In general, a county shouldhave a diverse mix of revenues some of which are relatively stable and some of which are sensitiveto the business cycle.
Analysis: As noted in the discussion on tax bases, the mining industry dominates the county’srevenue sources. Because of this a proper mix of stable and business cycle sensitive revenues isnot easily engineered. However, property tax revenue will remain relatively stable, thoughdiminish eventually, in the event of a downturn in mining activity. The most noticeable trends ofthis indicator is the rise in importance in sales taxes and the decrease in importance of otherrevenue sources (The table for indicator 3.4 shows that budgeted property tax revenues for 1997will equal sales tax revenues.) Because of the dominance of the mining industry in EurekaCounty, tax revenue sources that respond the quickest to changes in mining activity will have thegreatest impact. When mining activity increases this is an asset and when mining activitydecreases this is a detriment. This indicator should be monitored.

40
Indicator 3.5 Restricted Revenues
0.0%
2.0%
4.0%
6.0%
8.0%
10.0%
12.0%
14.0%
16.0%
1986 1987 1988 1989 1990 1991 1992 1993 1994 1995 1996a 1997b
Indicator 3.5 1986 1987 1988 1989 1990 1991 1992 1993 1994 1995 1996a 1997b
Restricted/Net Revenues 0.0% 0.2% 0.7% 0.3% 0.1% 0.5% 14.3% 0.6% 1.0% 2.4% 0.5% 1.5%
41
Indicator 3.5Restricted Revenues
Description: Restricted revenues are revenues that are earmarked or otherwise limited in whatthey can be spent on. For example, grants must be spent on certain limited areas. For thisanalysis, it was assumed that grants and transfers were the primary earmarked revenue sources inthe general fund. As the percentage of restricted revenues increases, a local government loses itsability to respond to changing conditions and to citizen’s needs and demands. Increases inrestricted revenues may also indicate overdependence on external revenues and signal futureinability to maintain service levels.
Analysis: In 1992 the county received a large grant from Federal Aviation Administration forairport improvement. This is a one-time event. Eureka County averages only 1.84% of itsrevenues in the form of restricted revenues. The statewide average is 15.6%. This is a positiveindicator for Eureka County.

42
Indicator 3.6 Intergovernmental Revenues
0.0%
10.0%
20.0%
30.0%
40.0%
50.0%
60.0%
70.0%
1986 1987 1988 1989 1990 1991 1992 1993 1994 1995 1996a 1997b
Indicator 3.6 1986 1987 1988 1989 1990 1991 1992 1993 1994 1995 1996a 1997b
Intergovernmental/NetRevenues
48.1% 39.0% 52.2% 51.1% 44.2% 42.6% 60.1% 67.7% 67.5% 66.0% 61.8% 48.3%
43
Indicator 3.6Intergovernmental Revenues
Description: Intergovernmental revenues are revenues that are received from anothergovernmental entity. This includes revenues that are collected centrally and redistributed using aformula (such as sales taxes). Intergovernmental revenues are important because anoverdependence on such revenues can be harmful. Federal and state governments may withdrawor reduce payments to local government as one of their cutback measures. Thus,intergovernmental revenues are often beyond the control of local government. A recent study ofNevada State and local government finances by the Urban Institute stated that Nevada had one ofthe most centralized fiscal systems in the country.
Analysis: From 1986 through 1996 Eureka County has gradually become more dependent onintergovernmental revenues (the 1997 budget revenues indicate that this trend may reverse.) Ifthis trend continues the county may not have optimal budget flexibility. This trend should bemonitored.
44
Indicator 3.7 Elastic Revenues
0.0%
10.0%
20.0%
30.0%
40.0%
50.0%
60.0%
70.0%
1986 1987 1988 1989 1990 1991 1992 1993 1994 1995 1996a 1997b
Indicator 3.7 1986 1987 1988 1989 1990 1991 1992 1993 1994 1995 1996a 1997b
Elastic/Net Revenues 48.2% 38.8% 51.6% 50.9% 44.1% 42.1% 45.9% 67.1% 66.6% 63.6% 61.4% 46.8%

45
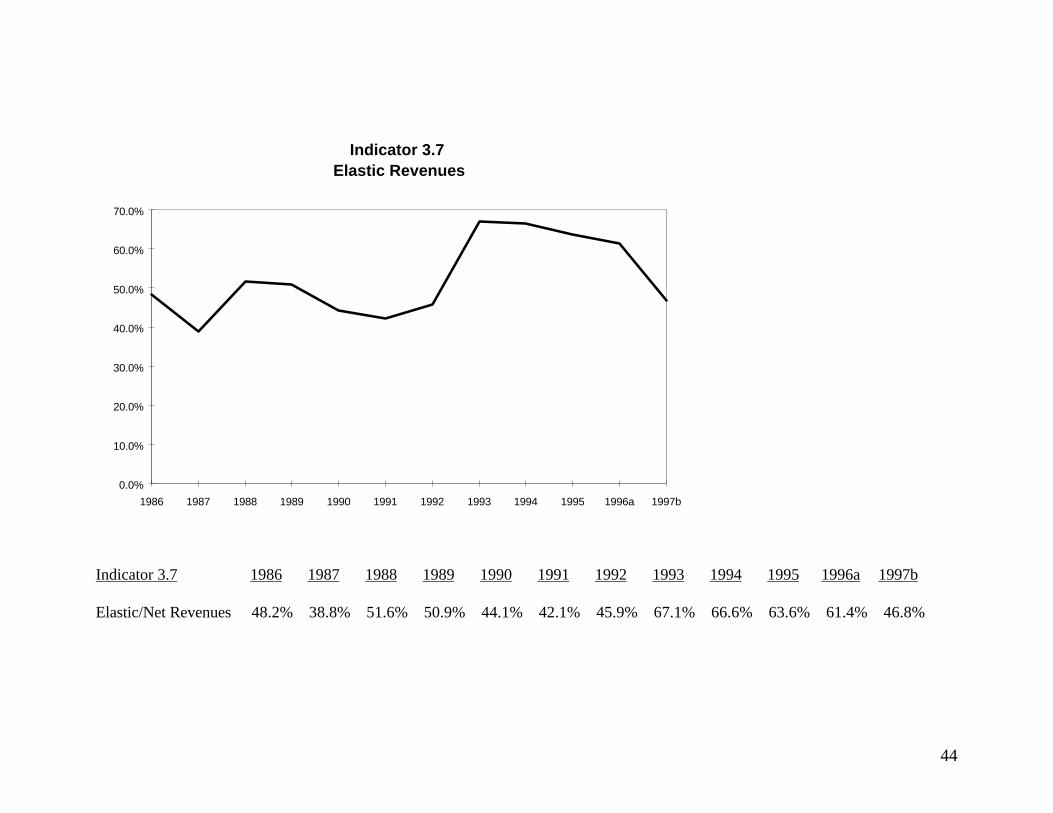
Indicator 3.7Elastic Revenue Sources
Description: Elastic revenues are highly responsive to changes in the economic base andinflation. As the economic base expands or contracts, elastic revenues expand or contract inroughly proportional or greater amounts. Sales taxes are the largest elastic revenue source.Other elastic revenues include intergovernmental and gaming revenues. While net proceeds ofmines tend to fluctuate, they do not necessarily parallel the overall economy and so are notconsidered an elastic revenue source. A balance between elastic and inelastic revenue sources isdesirable to benefit from economic growth while mitigating the effects of economic downturns.
Analysis: The elastic revenue share in Eureka County has been volatile though generallyincreasing. The increase is because sales taxes have become a greater share of revenues. Sincethe sales are related to mining activity they cannot be considered elastic with respect to the stateor national economy. They are elastic with regard to mining activity. The volatility in netproceeds of mines explains the volatility in elastic revenues (see Indicator 2.3).

46
Indicator 3.8 Ratio of General Fund to All Funds
0.0%
10.0%
20.0%
30.0%
40.0%
50.0%
60.0%
70.0%
1986 1987 1988 1989 1990 1991 1992 1993 1994 1995 1996a 1997b
Indicator 3.8 1986 1987 1988 1989 1990 1991 1992 1993 1994 1995 1996a 1997b
General Fund/All Funds 60.7% 57.5% 52.2% 52.4% 55.5% 60.1% 53.6% 60.5% 52.5% 51.1% 56.7% 68.1%
47
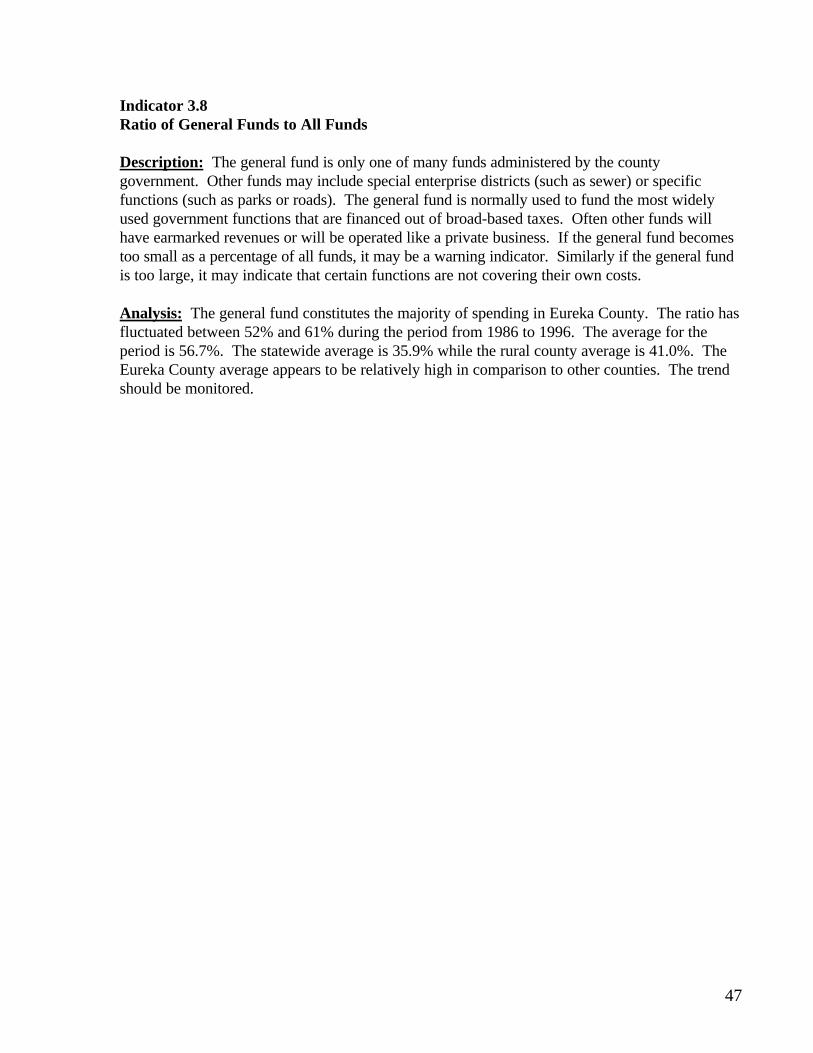
Indicator 3.8Ratio of General Funds to All Funds
Description: The general fund is only one of many funds administered by the countygovernment. Other funds may include special enterprise districts (such as sewer) or specificfunctions (such as parks or roads). The general fund is normally used to fund the most widelyused government functions that are financed out of broad-based taxes. Often other funds willhave earmarked revenues or will be operated like a private business. If the general fund becomestoo small as a percentage of all funds, it may be a warning indicator. Similarly if the general fundis too large, it may indicate that certain functions are not covering their own costs.
Analysis: The general fund constitutes the majority of spending in Eureka County. The ratio hasfluctuated between 52% and 61% during the period from 1986 to 1996. The average for theperiod is 56.7%. The statewide average is 35.9% while the rural county average is 41.0%. TheEureka County average appears to be relatively high in comparison to other counties. The trendshould be monitored.
48
Indicator 3.9 County Property Tax Rates
0.0000
0.5000
1.0000
1.5000
2.0000
2.5000
1986 1987 1988 1989 1990 1991 1992 1993 1994 1995 1996a 1997b
Max Tax Rate Avg Tax Rate
Indicator 3.9 1986 1987 1988 1989 1990 1991 1992 1993 1994 1995 1996a 1997b
Maximum Tax Rate 1.4615 1.3398 1.5355 1.5383 1.5966 2.0925 1.7948 1.7943 1.7962 1.7962 1.7962 1.8462
Average Tax Rate 1.4161 1.2940 1.4955 1.5017 1.5500 1.6170 1.6359 1.6354 1.6373 1.6373 1.6373 1.6873
49
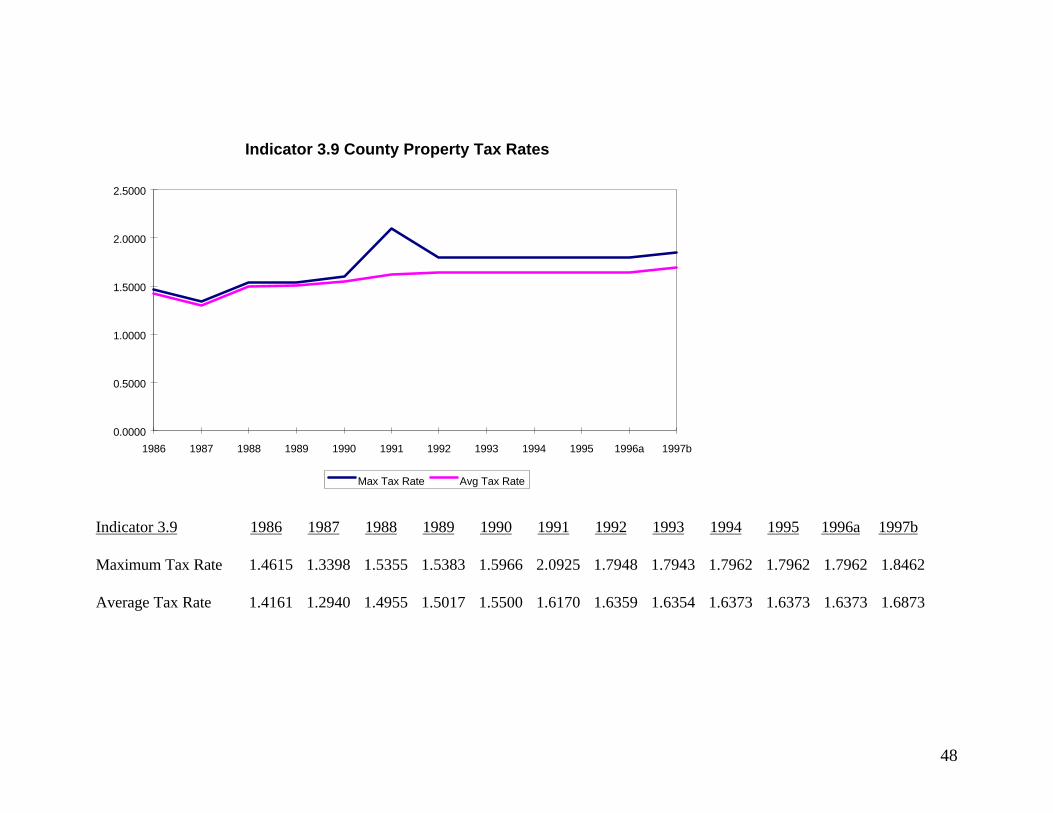
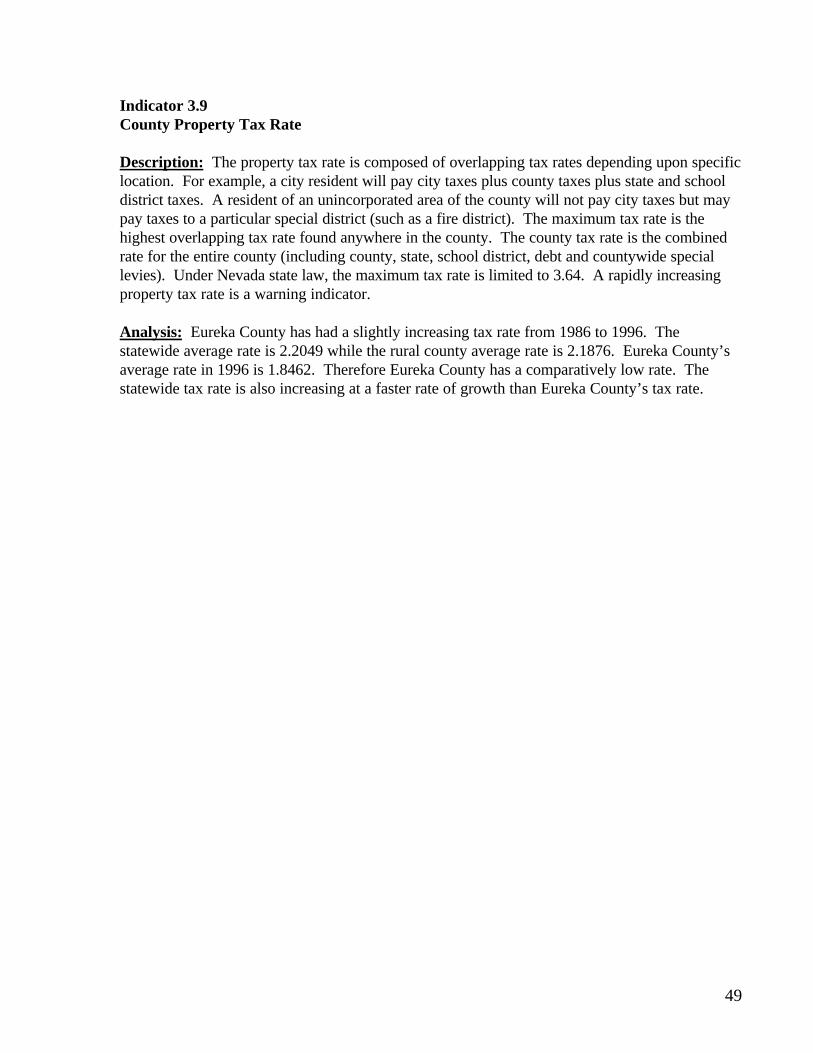
Indicator 3.9County Property Tax Rate
Description: The property tax rate is composed of overlapping tax rates depending upon specificlocation. For example, a city resident will pay city taxes plus county taxes plus state and schooldistrict taxes. A resident of an unincorporated area of the county will not pay city taxes but maypay taxes to a particular special district (such as a fire district). The maximum tax rate is thehighest overlapping tax rate found anywhere in the county. The county tax rate is the combinedrate for the entire county (including county, state, school district, debt and countywide speciallevies). Under Nevada state law, the maximum tax rate is limited to 3.64. A rapidly increasingproperty tax rate is a warning indicator.
Analysis: Eureka County has had a slightly increasing tax rate from 1986 to 1996. Thestatewide average rate is 2.2049 while the rural county average rate is 2.1876. Eureka County’saverage rate in 1996 is 1.8462. Therefore Eureka County has a comparatively low rate. Thestatewide tax rate is also increasing at a faster rate of growth than Eureka County’s tax rate.

50
Indicator 3.10 Revenue Surplus (Deficit)
-500,000
0
500,000
1,000,000
1,500,000
2,000,000
2,500,000
3,000,000
3,500,000
1986 1987 1988 1989 1990 1991 1992 1993 1994 1995 1996a
Indicator 3.10 1986 1987 1988 1989 1990 1991 1992 1993 1994 1995 1996a
Revenues Surplus -43.9 639.6 492.3 1,511.9 435.6 777.9 1,878.7 3,172.4 1,890.1 -107.0 1,598.1

51
Indicator 3.10Actual - Budgeted Revenues
Description: When preparing a budget, forecast revenues and expenditures are used. Theseforecasts can be wrong and the budget will not reflect the actual revenues or spending. Therevenue shortfall equals the difference between the actual and budgeted (forecast) revenues. Apositive value indicates that the actual was higher than forecast. Ideally, there should be minimaldifference between actual and budgeted revenues. Too large a difference either positive ornegative is indicative of poor revenue forecasts, which make county budget preparations difficult.
Analysis: The county generally seems to have somewhat conservative revenue forecasts. Thatis, the actual revenues tended to be somewhat higher than budgeted. Overall, budgeting and therevenue surplus do not appear to be out of line given the economic conditions in the county.
52
IV Expenditures
Description: The function of local government is to provide services to its resident and transientpopulation (such as employees or tourists). Government provides many services and severalissues should be considered in evaluating the level and mix of services:
⇒ Growth: Expenditures should grow at a pace sufficient to provide constant levels ofservices to population, housing or employment. Per capita spending should be stableor increasing.
⇒ Types and Functions: No one area of government spending should dominate.Government provides a mix of services that change over time as public needs anddesires change.
⇒ Employees: Local government is primarily a service provider and so should havesufficient employees to provide the desired services. Government employment shouldgrow at a rate sufficient to maintain service levels without creating excessbureaucracy.
⇒ Compensation: Total salaries and benefits should be attractive to good employeeswithout becoming excessive. Benefit levels are often rising faster than other forms ofcompensation and may be a source of concern.
A number of indicators of government expenditures were analyzed including:• Real Expenditures• Expenditures per capita• Composition of spending• Number of Employees per 1000 resident population• Salaries and Benefits
Analysis:
Real per capita spending was relatively constant from 1986 to 1989. Since 1989 it has increasedtremendously. Because of the great increase in spending, even though it has been volatile, level ofservice has only increased. Capital improvement projects have occurred in most major types ofexpenditures, and the capital outlay share of the budget has increased significantly. However,spending in general has increased for all major types of expenditures as revenues have increasedwith the increase in mining activity. Therefore, spending increases of one type have not adverselyaffected spending in other areas of government. Employees per 1000 population are higher inEureka County than in any other county in Nevada. Even though Eureka County has a very lowpopulation, which would justify a higher ratio, this indicator should be monitored. Like mostrural counties the ratio of benefits to salaries and benefits is increasing and should be monitored.

53
Indicator 4.1 Real General Fund Expenditures
-
1,000,000
2,000,000
3,000,000
4,000,000
5,000,000
6,000,000
7,000,000
8,000,000
9,000,000
10,000,000
1986 1987 1988 1989 1990 1991 1992 1993 1994 1995 1996a 1997b
Indicator 4.1 1986 1987 1988 1989 1990 1991 1992 1993 1994 1995 1996a 1997b
Expenditures* 1,134 1,355 1,398 1,768 3,209 2,862 5,398 4,174 6,184 6,199 10,257 10,373
Real Expenditures* 1,371 1,592 1,600 1,960 3,411 2,937 5,398 4,079 5,926 5,752 9,267 9,063
*In Thousands of Dollars
54
Indicator 4.1Real General Fund Expenditures
Description: Total Expenditures represent general fund spending on all items. Real expendituresare total expenditures adjusted for inflation. Real expenditures are more useful for makingcomparisons between different years since they adjust for changes in purchasing power due toinflation. Normally, expenditures should rise at a rate corresponding to inflation and populationgrowth to provide a constant level of services. If expenditures are growing slower thanpopulation and inflation it may indicate an inability to provide services or need to cut spending.
Analysis: Real expenditures have risen sharply in Eureka County during the past decade. Themajor exceptions to spending growth were during 1991, 1993 and 1995. Total real spending hasrisen by $7.9 million or 576.0% during this period. This indicates that spending has risen muchfaster than the inflation rate.
55
Indicator 4.2 Real Per Capita Expenditures
0.0
1000.0
2000.0
3000.0
4000.0
5000.0
6000.0
1986 1987 1988 1989 1990 1991 1992 1993 1994 1995 1996 1997
Indicator 4.2 1986 1987 1988 1989 1990 1991 1992 1993 1994 1995 1996a 1997b
Per Capita Expenditures 1146.2 1262.2 1154.6 1336.9 2205.1 1882.8 3414.0 2472.4 3823.5 3640.4 5898.6 5479.4

56
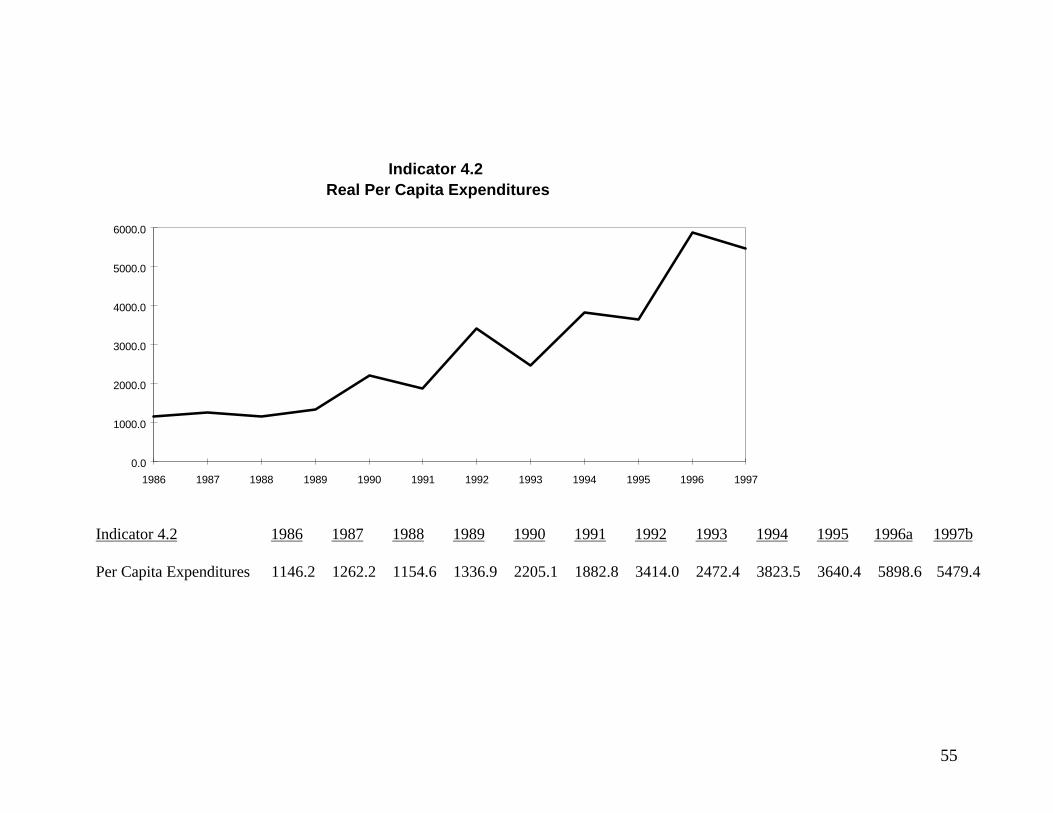
Indicator 4.2Expenditures Per Capita
Description: Real Expenditures per capita adjusts total spending for the growth of population bydividing real expenditures by the county population. To provide a constant level of services(assuming no changes in efficiency) it is necessary to have constant per capita spending.Decreases in per capita spending may indicate budget cuts which may affect service delivery.Increases in per capita spending may be due to increases in type, level or composition ofgovernment services (such as additional police). Expenditures per capita is a good indicator ofthe cost to provide services to county residents.
Analysis: Per capita spending was relatively constant from 1986 through 1989. After this periodthe trend was volatile though per capita spending increased tremendously. The statewide growthrate of per capita spending from 1986 to 1996 was 18.8% while the Eureka County growth ratefor the same period was 414.6%. This would indicate that level of service has increasedsubstantially for county residents.

57
Indicator 4.3 Per Capita Expenditures by Major Type
0.0
500.0
1000.0
1500.0
2000.0
2500.0
3000.0
3500.0
1986 1987 1988 1989 1990 1991 1992 1993 1994 1995 1996a 1997b
General Government Public Safety Judicial
Welfare and Sanitation Culture and Recreation Misc. Other
58
Indicator 4.3 1986 1987 1988 1989 1990 1991 1992 1993 1994 1995 1996a 1997b
General Government 442.1 516.3 488.6 584.8 572.8 639.1 1078.1 703.1 1021.6 1336.3 3015.4 2018.3
Public Safety 321.7 308.8 315.8 357.8 477.6 540.4 767.3 581.0 660.0 736.2 999.3 915.3
Judicial 173.2 162.1 157.8 187.3 212.7 205.4 244.1 253.9 309.2 272.8 338.1 346.8
Welfare and Sanitation 121.1 150.1 112.4 128.2 174.7 221.9 169.0 103.0 307.0 247.1 537.9 598.2
Culture and Recreation 83.1 125.0 80.0 78.8 97.3 177.9 199.0 156.1 311.2 321.9 350.7 335.9
Misc. Other 0.0 0.0 0.0 0.0 0.0 0.0 381.1 59.3 1214.4 720.3 645.6 1254.3

59
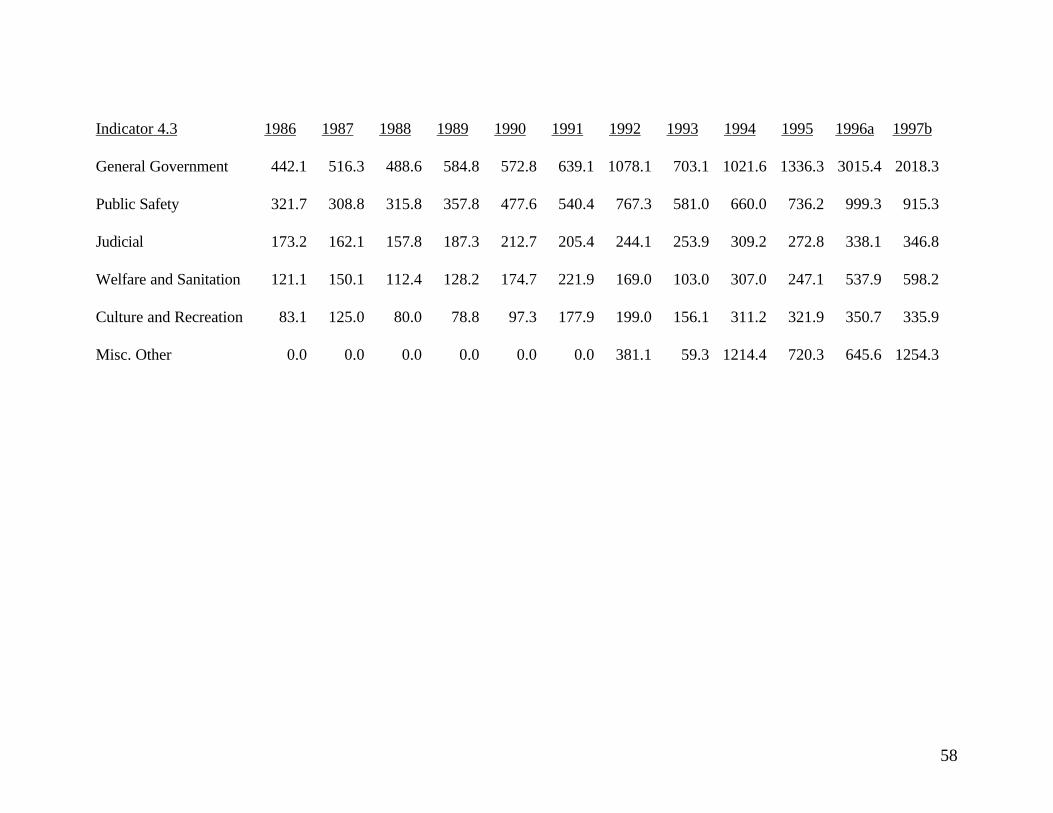
Indicator 4.3Expenditures by Major Type
Description: Indicator 4.3 presents information similar to the previous indicator about per capitaexpenditures except that it is disaggregated into particular types of government services. The mixof government services may change as a government is mandated to take on additional services,or as the public demands different levels or types of services. Viewing the changes in spending bytype of service can show how government spending has changed or what is causing spendinggrowth. Excessive growth in certain types of services may crowd out other types of spending.
Analysis: Spending of most types increased only slightly from 1986 to 1991. After 1991 capitalimprovement projects were undertaken. The increases in general government and “other”expenses in 1992 were a result of remodeling of the opera house. The increase in “other”expenses in 1994 was due to transfers from the general fund to special funds and other entities inthe county that needed financing. The increase in general government expenses in 1996 was tobuild the new county annex and for two water projects. The increase in 1996 in welfare andsanitation was to create a new landfill site per federal regulations. The increase in 1997 in otherexpenses is for a downtown Eureka revitalization project and airport improvement. In generalEureka County has had major spending increases in recent years.

60
Indicator 4.4a Composition of Spending Functions
0%
10%
20%
30%
40%
50%
60%
70%
80%
90%
100%
1986 1991 1996a
Misc. Other
Culture and Recreation
Welfare and Sanitation
Judicial
Public Safety
General Government
61
Indicator 4.4a 1986 1987 1988 1989 1990 1991 1992 1993 1994 1995 1996a 1997b
General Government 38.7% 40.9% 42.3% 43.7% 37.3% 35.8% 38.0% 37.9% 26.7% 36.8% 51.2% 36.9%
Public Safety 28.2% 24.5% 27.3% 26.8% 31.1% 30.3% 27.0% 31.3% 17.3% 20.3% 17.0% 16.7%
Judicial 15.2% 12.8% 13.7% 14.0% 13.9% 11.5% 8.6% 13.7% 8.1% 7.5% 5.7% 6.3%
Welfare and Sanitation 10.6% 11.9% 9.7% 9.6% 11.4% 12.4% 6.0% 5.5% 8.0% 6.8% 9.1% 10.9%
Culture and Recreation 7.3% 9.9% 6.9% 5.9% 6.3% 10.0% 7.0% 8.4% 8.1% 8.9% 6.0% 6.1%
Misc. Other 0.0% 0.0% 0.0% 0.0% 0.0% 0.0% 13.4% 3.2% 31.8% 19.8% 11.0% 22.9%

62
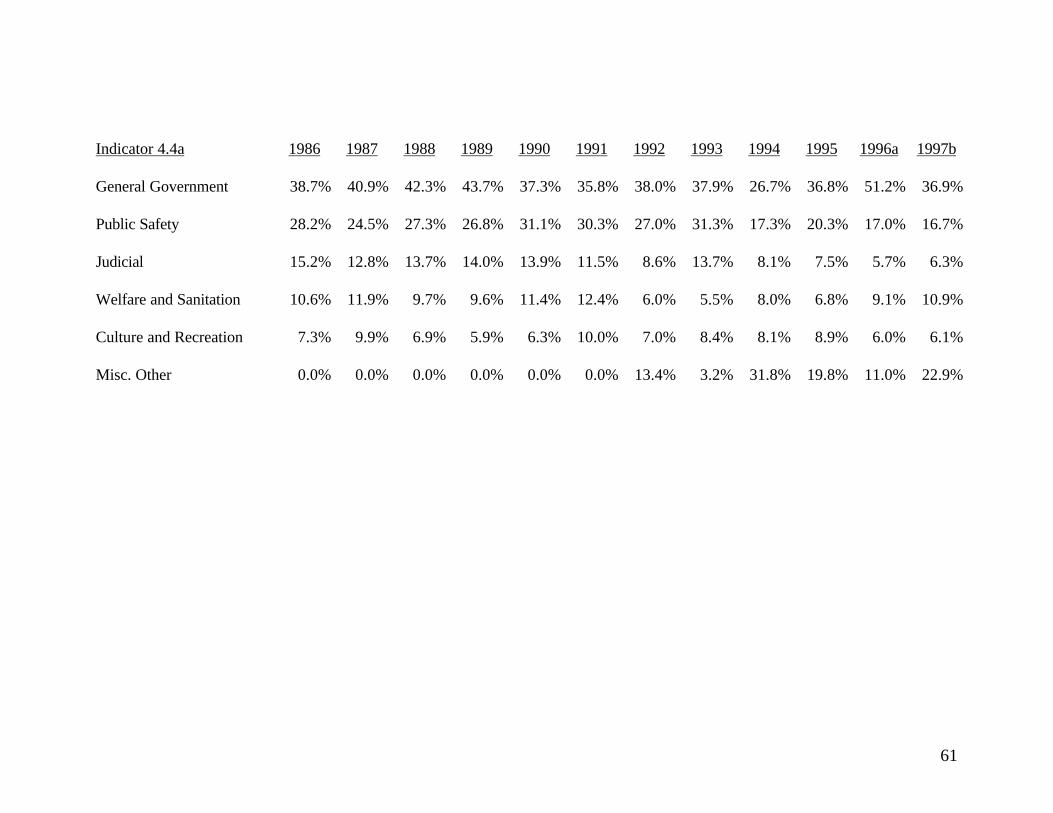
Indicator 4.4aComposition of Spending Functions
Description: Indicator 4.4a shows the composition of spending as a percent of the total budget.In contrast to Indicator 4.3, which showed levels of spending per capita, this indicator shows howbudget priorities have changed. County governments are required to spend on numerous types ofservices, if one type begins to increase too rapidly, it may be crowding out other services.
Analysis: This indicator is affected by the many recent capital improvement projects (CIPs) inEureka County. The “miscellaneous other” category has increased significantly in recent yearsand will tend to reduce the apparent significance of the other functions of spending. In somecases other functions indirectly benefit from the spending increases. For 1996, generalgovernment and other spending reflect unique projects and are not long-term reallocations ofresources. In general, spending has increased significantly throughout local government andincreases in spending functions of one kind do not adversely affect other spending functions.When revenues level off this indicator will become relevant.

63
Indicator 4.4b Composition of Spending
0%
10%
20%
30%
40%
50%
60%
70%
80%
90%
100%
1986 1991 1996a
Capital Outlay
Services & Supplies
Benefits
Salaries & Wages
Indicator 4.4b 1986 1987 1988 1989 1990 1991 1992 1993 1994 1995 1996a 1997b
Salaries & Wages 44.9% 39.7% 41.0% 37.2% 38.0% 35.2% 25.1% 38.6% 22.8% 26.3% 19.7% 21.0%
Benefits 12.0% 11.5% 12.2% 10.9% 10.9% 12.9% 8.4% 14.1% 8.3% 9.1% 7.3% 7.9%
Services & Supplies 36.3% 41.9% 39.7% 42.3% 43.1% 38.4% 35.1% 37.9% 53.9% 47.0% 28.6% 37.3%
Capital Outlay 6.9% 6.9% 7.0% 9.6% 8.0% 13.5% 31.4% 9.3% 15.0% 17.6% 44.4% 33.8%

64
Indicator 4.4 bComposition of Spending
Description: Indicator 4.4b shows the breakdown of spending by salaries, benefits, services andcapital. Local governments are service providers and therefore usually have high proportions oftheir budgets spent on salaries and benefits. If these areas grow too rapidly, they may reduce theability of the government to purchase needed supplies or replacement or new capital. Some shareof the budget must be devoted to capital outlay, if this declines too low, it may indicate a localgovernment’s failure to replace worn out equipment or buy infrastructure to support localpopulation growth.
Analysis: The tremendous increase in capital outlay has distorted the relationship of thecomposition of spending shares in the county (see indicator 4.4c.) The enormous increase inmining activity of the last few years is a unique occurrence for a local government. As localgovernment spending stabilizes in Eureka County indicator 4.4b will become more relevant.

65
Indicator 4.4c Spending Functions
0
500,000
1,000,000
1,500,000
2,000,000
2,500,000
3,000,000
3,500,000
4,000,000
4,500,000
5,000,000
1986 1987 1988 1989 1990 1991 1992 1993 1994 1995 1996a 1997b
Salaries & Wages
Benefits
Services & Supplies
Capital Outlay
Indicator 4.4c 1986 1987 1988 1989 1990 1991 1992 1993 1994 1995 1996a 1997b
Salaries & Wages 506 538 574 657 848 955 1,126 1,210 1,409 1,630 2,016 2,170
Benefits 135 156 171 193 245 351 376 443 516 561 745 821
Services & Supplies 409 568 556 748 963 1,042 1,576 1,189 3,331 2,912 2,932 3,862
Capital Outlay 78 94 98 170 178 366 1,409 292 928 1,087 4,545 3,501

66
Indicator 4.4cSpending Functions
Description: Indicator 4.4c shows the breakdown of spending by salaries, benefits, services andcapital. As mentioned above, local governments are service providers and therefore usually havehigh proportions of their budgets spent on salaries and benefits. When economic activity ischanging rapidly relationships can distort temporarily.
Analysis: Eureka County has taken advantage of the growth of mining activity to increase thelevel of service for county residents. The typical hierarchy of spending categories has beentemporarily altered as services and supplies and capital outlay have recently increased inimportance. This trend will not continue after level of service has maximized. Salaries andbenefits may predominate in the future and the change in trends should be monitored.

67
Indicator 4.5 Public Employees Per 1000 Population
0.0
10.0
20.0
30.0
40.0
50.0
60.0
70.0
1986 1987 1988 1989 1990 1991 1992 1993 1994 1995 1996a 1997b
Indicator 4.5 1986 1987 1988 1989 1990 1991 1992 1993 1994 1995 1996a 1997b
Public Employees Per1000 Pop
38.5 37.3 33.2 38.9 42.7 46.5 48.7 49.1 54.8 53.8 64.6 55.9
Source: Local Government Budgets schedule S-2 (includes employees from all governmental funds except proprietary funds)

68
Indicator 4.5Public Employees Per 1000 Population
Description: The number of employees in local government is an indicator of the level ofservices provided. By dividing the number by the resident population, this is an indicator of howgrowth is affecting the level of services. The number of employees is reported as “Full TimeEquivalents” (FTE). An increasing number of employees per 1000 people may indicate that thelocal government is hiring too many employees and is not as efficient as it could be. A decreasingnumber of employees may indicate problems maintaining levels of services or it may indicateincreasing efficiency.
Analysis: The number of employees has generally increased from 1988 to 1996. In 1996 theFTE for Eureka County is estimated to be 64.6. The statewide average* in 1996 is 16.2 FTE andthe rural county average* is 17.0 FTE. Counties with small population bases generally have ahigher FTE. Eureka County has the highest FTE in Nevada. The next highest county isEsmeralda County with 30.2 FTE. Even considering Eureka’s small population base, the numberof employees appears high. This trend should be monitored.
*The statewide average includes all counties except Douglas County and Washoe County.**The rural county average includes all counties except Clark, Douglas and Washoe Counties.
69
Indicator 4.6 Fringe Benefits as a Percent of Salaries & Wages
0.0%
5.0%
10.0%
15.0%
20.0%
25.0%
30.0%
35.0%
40.0%
1986 1987 1988 1989 1990 1991 1992 1993 1994 1995 1996a 1997b
Indicator 4.6 1986 1987 1988 1989 1990 1991 1992 1993 1994 1995 1996a 1997b
Fringe Benefits as a Percentof Salaries & Wages
26.7% 29.0% 29.8% 29.3% 28.8% 36.7% 33.4% 36.6% 36.6% 34.4% 36.9% 37.9%

70
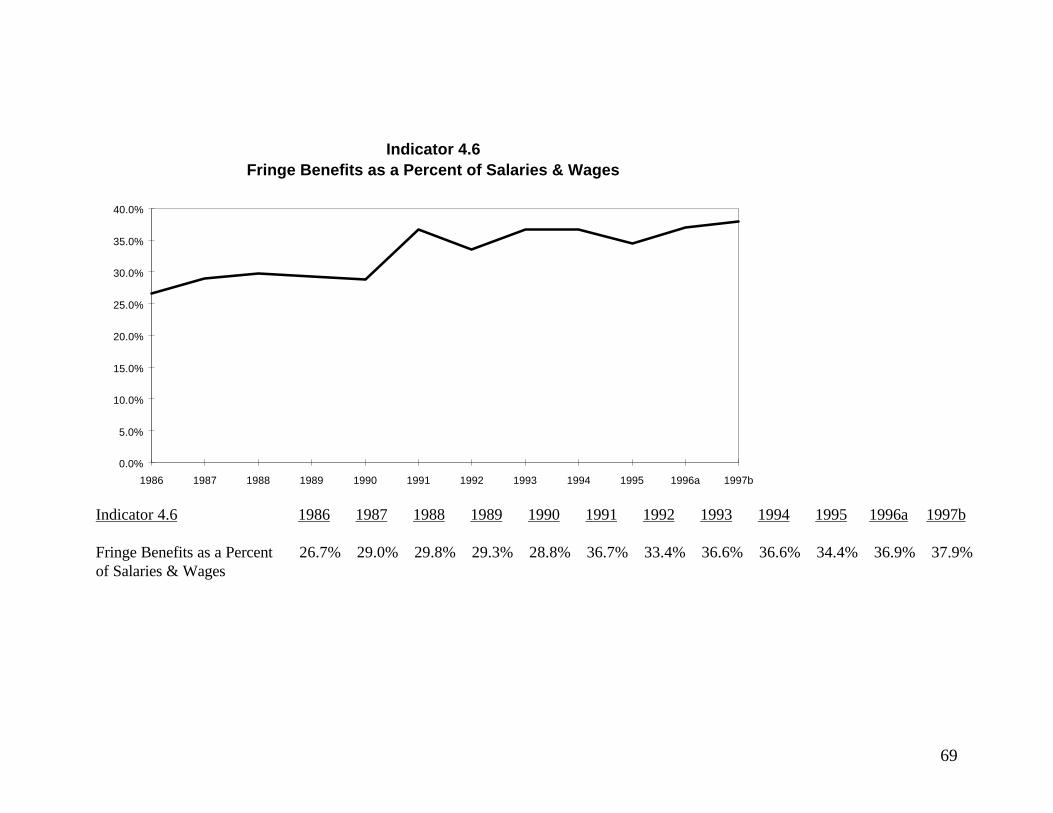
Indicator 4.6Fringe BenefitsPercent of Salaries & Wages
Description: Fringe benefits include pension plans, health and life insurance, vacation, sick andholiday leave, deferred compensation, disability insurance and educational and incentive pay.Benefits represent a significant share of personnel costs and nationally average over 30% ofemployee compensation. The cost of providing benefits, especially insurance, has risen atdramatic rates and requires careful monitoring. Prudent risk management may mitigate excessivegrowth in benefits.
Analysis: Benefits in Eureka County have risen from 26.7% of total compensation to 37.9%during the last ten years. While other counties have seen similar increases, this is higher than thestatewide average of 32.3% for 1996. This indicator should be monitored.
71
V Operating Position
Description:
The operating position group contains two indicators: net surplus/deficit and ending fund balance.The net surplus/deficit reflects how current revenues compare with current spending. A netdeficit occurs when revenues are less than spending. Typically, to fund a net deficit requires usingsome of the General Funds previous year’s ending balance. Thus the ending balance is a measureof how much reserves the county has to fund emergencies or capital spending. If the endingbalance becomes too low, the county may be forced to raise revenues or cut spending.
Analysis:
• Net Surplus Deficit: The county maintained an adequate net surplus before revenue andspending patterns began to fluctuate. Recent deficits should be monitored.
• Ending Balance: The ending balance for Eureka County has always been very high. Thismay not be unusual, as the required amount should be determined by characteristicsunique to the county.
Overall, it appears that the county has maintained an adequate operating position.

72
Indicator 5.1 Net Surplus (Deficit)
-4,000,000
-3,000,000
-2,000,000
-1,000,000
0
1,000,000
2,000,000
3,000,000
1986 1987 1988 1989 1990 1991 1992 1993 1994 1995 1996a 1997b
Indicator 5.1 1986 1987 1988 1989 1990 1991 1992 1993 1994 1995 1996a 1997b
Net Surplus(Deficit) -8.1 152.7 271.2 624.3 384.4 1728.3 -79.5 2321.0 459.1 372.1 -3184.7 -1694.9
Net To Current Revenues -0.7% 10.1% 16.2% 26.1% 10.7% 37.6% -1.5% 35.7% 6.9% 5.7% -45.0% -19.5%
Source: Legislative Counsel Bureau County Budget

73
Indicator 5.1Net Surplus (Deficit)
Description: The net revenue is the difference between the current revenues and currentexpenditures of the General Fund. A deficit occurs when current expenditures exceed currentrevenues. This does not necessarily mean that the budget is not balanced since reserves or fundbalances can be used to cover the difference. Continuing deficits cannot be maintained howeverand will require increased revenues or decreased spending.
Analysis: Net surplus began fluctuating with the tremendous increase in spending in EurekaCounty. Before the spending increases, from 1987 through 1990, the county maintained a healthyand relatively constant net surplus. In 1996 and budget year 1997 there are significant deficits.There should be concern if this trend continues.

74
Indicator 5.2 Ending Balance as a Percent of Total Expenditures
0.0%
20.0%
40.0%
60.0%
80.0%
100.0%
120.0%
140.0%
160.0%
1986 1987 1988 1989 1990 1991 1992 1993 1994 1995 1996a 1997b
Indicator 5.2 1986 1987 1988 1989 1990 1991 1992 1993 1994 1995 1996a 1997b
End Balance/TotalExpenditures
38.4% 48.1% 69.6% 90.3% 61.8% 129.6% 67.3% 142.6% 103.7% 109.4% 35.1% 18.3%
Source: Legislative Counsel Bureau County Budget

75
Indicator 5.2Ending BalanceAs Percent of Total Expenditures
Description: The ending balance is the difference between the year’s revenues and spending plusthe previous year’s ending balance. The ending balance should be sufficient to cover a portion ofoperating expenses. The size of a local government’s fund balance can affect its ability towithstand financial emergencies. It can also affect its ability to accumulate funds for capitalpurchases without having to borrow. Many local governments like to keep a certain percent ofexpenditures in reserve. Statewide local governments average 8% to 20% in reserves.
Analysis: Ending balance levels have always been very high for Eureka County. The countyaverage for the period is 76.2% while the statewide average is 16.5%. A reserve forextraordinary expenditures, in the form of ending balance, is a requirement unique to EurekaCounty.

76
I Capital Outlay
Indicator 6.1 Capital Outlay
0
500,000
1,000,000
1,500,000
2,000,000
2,500,000
3,000,000
3,500,000
4,000,000
4,500,000
5,000,000
1986 1987 1988 1989 1990 1991 1992 1993 1994 1995 1996a 1997b
Indicator 6.1 1986 1987 1988 1989 1990 1991 1992 1993 1994 1995 1996a 1997b
Capital Outlay* 78.1 94.2 97.6 170.5 178.0 365.8 1,409.4 292.2 928.4 1,087.4 4,545.1 3,500.6
*In Thousands of Dollars

77
Indicator 6.2 Capital Outlay to Total Spending
0.0%
5.0%
10.0%
15.0%
20.0%
25.0%
30.0%
35.0%
40.0%
45.0%
1986 1987 1988 1989 1990 1991 1992 1993 1994 1995 1996a 1997b
Indicator 6.2 1986 1987 1988 1989 1990 1991 1992 1993 1994 1995 1996a 1997b
Capital Outlay/TotalSpending
6.9% 6.9% 7.0% 9.6% 5.5% 12.8% 26.1% 7.0% 15.0% 17.5% 44.3% 33.7%
Sources: Legislative Counsel Bureau County Budget
78
Indicator 6.1Capital Outlay(Combined with Indicator 6.2)
Indicator 6.2Capital Outlay to Total Spending
Description: Expenditures for operating equipment, such as trucks and computers, drawn fromthe operating budget are usually referred to as capital outlay. Capital outlay items normallyinclude equipment that will last longer than one year and that has an initial cost above a significantminimum cost. The ratio of capital outlay to net operating expenditures is a rough indicator ofwhether the stock of equipment is being adequately replaced. If this ratio declines it may meanthat the local government’s needs are temporarily satisfied or that they are being deferred due toother budget priorities.
Analysis: The county has taken advantage of the recent economic growth to increase level ofservice. Eureka County is in a unique situation and the extraordinary increases in capital spendingseem reasonable.

79
Appendix
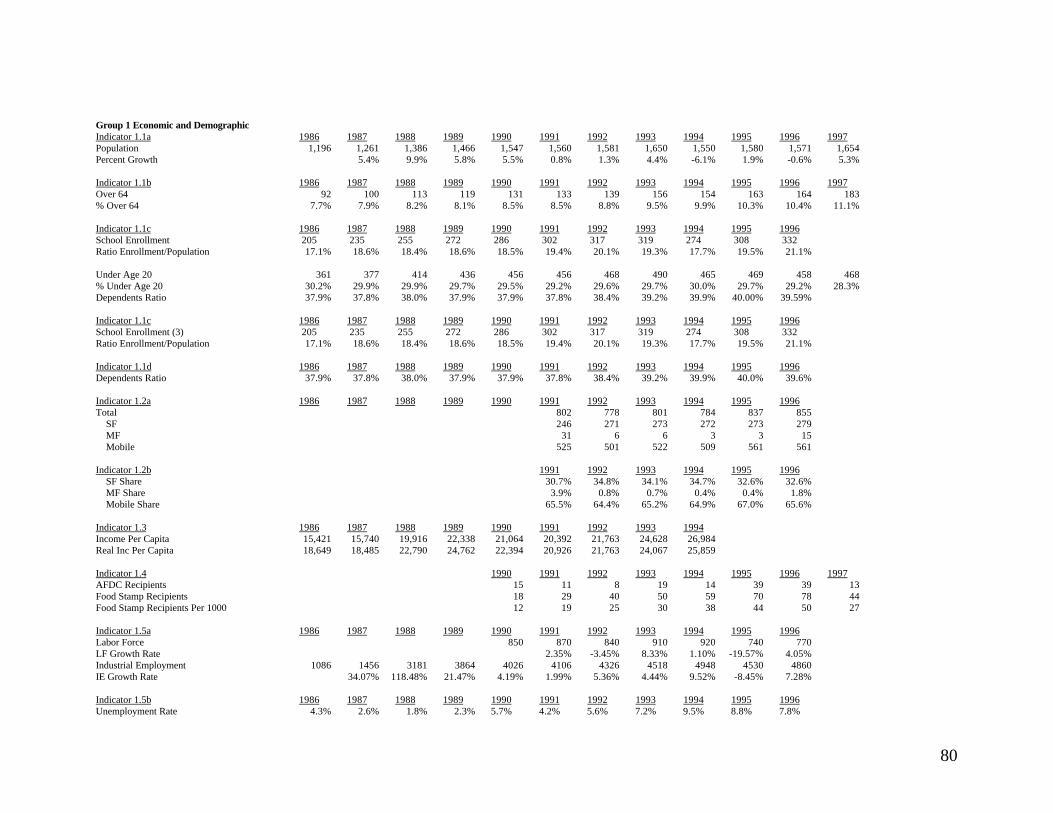
80
Group 1 Economic and DemographicIndicator 1.1a 1986 1987 1988 1989 1990 1991 1992 1993 1994 1995 1996 1997Population 1,196 1,261 1,386 1,466 1,547 1,560 1,581 1,650 1,550 1,580 1,571 1,654Percent Growth 5.4% 9.9% 5.8% 5.5% 0.8% 1.3% 4.4% -6.1% 1.9% -0.6% 5.3%
Indicator 1.1b 1986 1987 1988 1989 1990 1991 1992 1993 1994 1995 1996 1997Over 64 92 100 113 119 131 133 139 156 154 163 164 183% Over 64 7.7% 7.9% 8.2% 8.1% 8.5% 8.5% 8.8% 9.5% 9.9% 10.3% 10.4% 11.1%
Indicator 1.1c 1986 1987 1988 1989 1990 1991 1992 1993 1994 1995 1996School Enrollment 205 235 255 272 286 302 317 319 274 308 332Ratio Enrollment/Population 17.1% 18.6% 18.4% 18.6% 18.5% 19.4% 20.1% 19.3% 17.7% 19.5% 21.1%
Under Age 20 361 377 414 436 456 456 468 490 465 469 458 468% Under Age 20 30.2% 29.9% 29.9% 29.7% 29.5% 29.2% 29.6% 29.7% 30.0% 29.7% 29.2% 28.3%Dependents Ratio 37.9% 37.8% 38.0% 37.9% 37.9% 37.8% 38.4% 39.2% 39.9% 40.00% 39.59%
Indicator 1.1c 1986 1987 1988 1989 1990 1991 1992 1993 1994 1995 1996School Enrollment (3) 205 235 255 272 286 302 317 319 274 308 332Ratio Enrollment/Population 17.1% 18.6% 18.4% 18.6% 18.5% 19.4% 20.1% 19.3% 17.7% 19.5% 21.1%
Indicator 1.1d 1986 1987 1988 1989 1990 1991 1992 1993 1994 1995 1996Dependents Ratio 37.9% 37.8% 38.0% 37.9% 37.9% 37.8% 38.4% 39.2% 39.9% 40.0% 39.6%
Indicator 1.2a 1986 1987 1988 1989 1990 1991 1992 1993 1994 1995 1996Total 802 778 801 784 837 855 SF 246 271 273 272 273 279 MF 31 6 6 3 3 15 Mobile 525 501 522 509 561 561
Indicator 1.2b 1991 1992 1993 1994 1995 1996 SF Share 30.7% 34.8% 34.1% 34.7% 32.6% 32.6% MF Share 3.9% 0.8% 0.7% 0.4% 0.4% 1.8% Mobile Share 65.5% 64.4% 65.2% 64.9% 67.0% 65.6%
Indicator 1.3 1986 1987 1988 1989 1990 1991 1992 1993 1994Income Per Capita 15,421 15,740 19,916 22,338 21,064 20,392 21,763 24,628 26,984Real Inc Per Capita 18,649 18,485 22,790 24,762 22,394 20,926 21,763 24,067 25,859
Indicator 1.4 1990 1991 1992 1993 1994 1995 1996 1997AFDC Recipients 15 11 8 19 14 39 39 13Food Stamp Recipients 18 29 40 50 59 70 78 44Food Stamp Recipients Per 1000 12 19 25 30 38 44 50 27
Indicator 1.5a 1986 1987 1988 1989 1990 1991 1992 1993 1994 1995 1996Labor Force 850 870 840 910 920 740 770LF Growth Rate 2.35% -3.45% 8.33% 1.10% -19.57% 4.05%Industrial Employment 1086 1456 3181 3864 4026 4106 4326 4518 4948 4530 4860IE Growth Rate 34.07% 118.48% 21.47% 4.19% 1.99% 5.36% 4.44% 9.52% -8.45% 7.28%
Indicator 1.5b 1986 1987 1988 1989 1990 1991 1992 1993 1994 1995 1996Unemployment Rate 4.3% 2.6% 1.8% 2.3% 5.7% 4.2% 5.6% 7.2% 9.5% 8.8% 7.8%
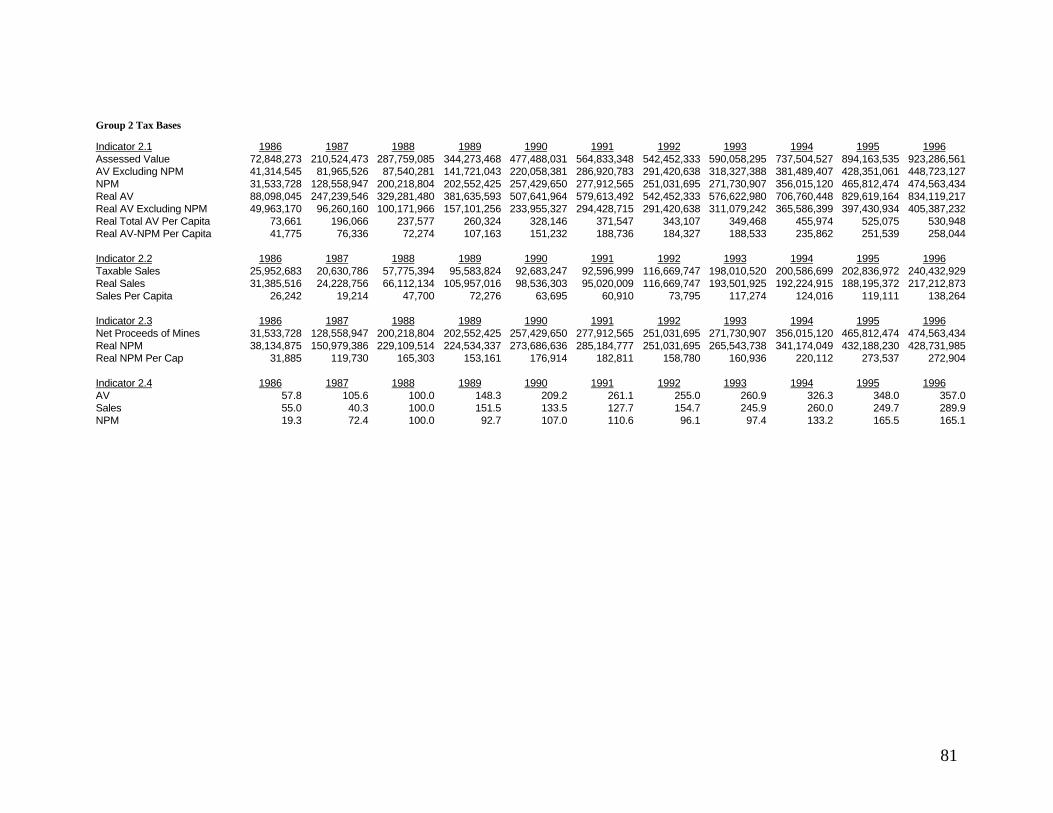
81
Group 2 Tax Bases
Indicator 2.1 1986 1987 1988 1989 1990 1991 1992 1993 1994 1995 1996Assessed Value 72,848,273 210,524,473 287,759,085 344,273,468 477,488,031 564,833,348 542,452,333 590,058,295 737,504,527 894,163,535 923,286,561AV Excluding NPM 41,314,545 81,965,526 87,540,281 141,721,043 220,058,381 286,920,783 291,420,638 318,327,388 381,489,407 428,351,061 448,723,127NPM 31,533,728 128,558,947 200,218,804 202,552,425 257,429,650 277,912,565 251,031,695 271,730,907 356,015,120 465,812,474 474,563,434Real AV 88,098,045 247,239,546 329,281,480 381,635,593 507,641,964 579,613,492 542,452,333 576,622,980 706,760,448 829,619,164 834,119,217Real AV Excluding NPM 49,963,170 96,260,160 100,171,966 157,101,256 233,955,327 294,428,715 291,420,638 311,079,242 365,586,399 397,430,934 405,387,232Real Total AV Per Capita 73,661 196,066 237,577 260,324 328,146 371,547 343,107 349,468 455,974 525,075 530,948Real AV-NPM Per Capita 41,775 76,336 72,274 107,163 151,232 188,736 184,327 188,533 235,862 251,539 258,044
Indicator 2.2 1986 1987 1988 1989 1990 1991 1992 1993 1994 1995 1996Taxable Sales 25,952,683 20,630,786 57,775,394 95,583,824 92,683,247 92,596,999 116,669,747 198,010,520 200,586,699 202,836,972 240,432,929Real Sales 31,385,516 24,228,756 66,112,134 105,957,016 98,536,303 95,020,009 116,669,747 193,501,925 192,224,915 188,195,372 217,212,873Sales Per Capita 26,242 19,214 47,700 72,276 63,695 60,910 73,795 117,274 124,016 119,111 138,264
Indicator 2.3 1986 1987 1988 1989 1990 1991 1992 1993 1994 1995 1996Net Proceeds of Mines 31,533,728 128,558,947 200,218,804 202,552,425 257,429,650 277,912,565 251,031,695 271,730,907 356,015,120 465,812,474 474,563,434Real NPM 38,134,875 150,979,386 229,109,514 224,534,337 273,686,636 285,184,777 251,031,695 265,543,738 341,174,049 432,188,230 428,731,985Real NPM Per Cap 31,885 119,730 165,303 153,161 176,914 182,811 158,780 160,936 220,112 273,537 272,904
Indicator 2.4 1986 1987 1988 1989 1990 1991 1992 1993 1994 1995 1996AV 57.8 105.6 100.0 148.3 209.2 261.1 255.0 260.9 326.3 348.0 357.0Sales 55.0 40.3 100.0 151.5 133.5 127.7 154.7 245.9 260.0 249.7 289.9NPM 19.3 72.4 100.0 92.7 107.0 110.6 96.1 97.4 133.2 165.5 165.1

82
Group 3 Revenue IndicatorsIndicator 3.1 1986 1987 1988 1989 1990 1991 1992 1993 1994 1995 1996a 1997bNominal Total Revenue 1,125,398 1,507,992 1,669,704 2,392,330 3,592,993 4,590,517 5,318,061 6,495,493 6,643,378 6,571,503 7,072,649 8,677,958Real Total Revenue 1,360,984 1,770,983 1,910,635 2,651,957 3,819,895 4,710,638 5,318,061 6,347,594 6,366,438 6,097,145 6,389,601 7,582,084
Indicator 3.2 1986 1987 1988 1989 1990 1991 1992 1993 1994 1995 1996a 1997bTotal Real Revenues Per Capita 1,138 1,404 1,379 1,809 2,469 3,020 3,364 3,847 4,107 3,859 4,067 4,584Percent Change 23.4% -1.8% 31.2% 36.5% 22.3% 11.4% 14.4% 6.8% -6.0% 5.4% 12.7%
Indicator 3.3 1986 1987 1988 1989 1990 1991 1992 1993 1994 1995 1996a 1997bAd Valorem 350.9 542.3 277.8 518.4 975.5 1233.3 911.5 907.3 897.2 772.6 1217.6 2061.6Sales 451.8 510.7 655.2 782.3 970.4 1131.9 1432.9 2462.5 2607.4 2326.7 2393.5 2056.6 SCCRT 317.1 410.4 414.8 420.3 650.2 835.5 1059.8 1880.8 1994.8 1825.4 1725.2 1584.7 BCCRT 134.7 100.3 240.4 362.0 320.2 296.5 373.1 581.7 612.6 501.3 668.3 471.9Other 335.2 351.4 445.5 508.2 523.3 654.4 1019.4 477.3 602.8 759.7 456.2 465.8 Licenses, Permits 23.1 23.6 18.3 16.3 26.3 21.3 39.8 32.0 57.4 46.0 31.0 31.1 Local Gaming 1.5 1.1 1.7 1.4 1.3 1.4 2.6 1.1 1.5 1.0 1.4 1.3 Intergovernmental 95.5 33.6 54.6 137.4 118.3 137.7 107.4 118.2 126.6 125.4 101.9 86.1 Charges for Services 121.9 164.9 222.5 209.7 197.7 201.0 187.1 195.6 281.3 271.0 200.3 214.8 Interest Earned 55.4 37.3 76.9 122.0 152.4 242.6 191.2 89.6 77.8 143.2 86.3 44.9 Bond Proceeds 0.0 0.0 0.0 0.0 0.0 0.0 0.0 0.0 0.0 0.0 0.0 0.0 Grants 0.0 2.8 10.0 5.0 2.5 16.0 480.7 22.2 39.5 93.7 19.7 70.3 Filt 16.2 58.9 41.6 0.0 0.0 0.0 0.0 0.0 0.0 0.0 0.0 0.0 Misc. Revenues 21.6 29.3 19.8 16.5 24.9 34.4 10.6 18.6 18.8 79.3 15.5 17.3 Transfer In 0.0 0.0 0.0 0.0 0.0 0.0 0.0 0.0 0.0 0.0 0.0 0.0
Indicator 3.4 1986 1987 1988 1989 1990 1991 1992 1993 1994 1995 1996a 1997bAd Valorem 30.8% 38.6% 20.2% 28.7% 39.5% 40.8% 27.1% 23.6% 21.8% 20.0% 29.9% 45.0%Sales 39.7% 36.4% 47.5% 43.2% 39.3% 37.5% 42.6% 64.0% 63.5% 60.3% 58.8% 44.9%SCCRT 27.9% 29.2% 30.1% 23.2% 26.3% 27.7% 31.5% 48.9% 48.6% 47.3% 42.4% 34.6%BCCRT 11.8% 7.1% 17.4% 20.0% 13.0% 9.8% 11.1% 15.1% 14.9% 13.0% 16.4% 10.3%Other 29.5% 25.0% 32.3% 28.1% 21.2% 21.7% 30.3% 12.4% 14.7% 19.7% 11.2% 10.2%Licenses, Permits, Fines & Forfeits 2.0% 1.7% 1.3% 0.9% 1.1% 0.7% 1.2% 0.8% 1.4% 1.2% 0.8% 0.7%Local Gaming 0.1% 0.1% 0.1% 0.1% 0.1% 0.0% 0.1% 0.0% 0.0% 0.0% 0.0% 0.0%Intergovernmental 8.4% 2.4% 4.0% 7.6% 4.8% 4.6% 3.2% 3.1% 3.1% 3.3% 2.5% 1.9%Charges for Services 10.7% 11.7% 16.1% 11.6% 8.0% 6.7% 5.6% 5.1% 6.8% 7.0% 4.9% 4.7%Interest Earned 4.9% 2.7% 5.6% 6.7% 6.2% 8.0% 5.7% 2.3% 1.9% 3.7% 2.1% 1.0%Bond Proceeds 0.0% 0.0% 0.0% 0.0% 0.0% 0.0% 0.0% 0.0% 0.0% 0.0% 0.0% 0.0%Grants 0.0% 0.2% 0.7% 0.3% 0.1% 0.5% 14.3% 0.6% 1.0% 2.4% 0.5% 1.5%Filt 1.4% 4.2% 3.0% 0.0% 0.0% 0.0% 0.0% 0.0% 0.0% 0.0% 0.0% 0.0%Misc. Revenues 1.9% 2.1% 1.4% 0.9% 1.0% 1.1% 0.3% 0.5% 0.5% 2.1% 0.4% 0.4%Transfer In 0.0% 0.0% 0.0% 0.0% 0.0% 0.0% 0.0% 0.0% 0.0% 0.0% 0.0% 0.0%
Indicator 3.5 1986 1987 1988 1989 1990 1991 1992 1993 1994 1995 1996a 1997bRestricted/Net Revenues 0.0% 0.2% 0.7% 0.3% 0.1% 0.5% 14.3% 0.6% 1.0% 2.4% 0.5% 1.5%
Indicator 3.6 1986 1987 1988 1989 1990 1991 1992 1993 1994 1995 1996a 1997bIntergovernmental/Net Revenues 48.1% 39.0% 52.2% 51.1% 44.2% 42.6% 60.1% 67.7% 67.5% 66.0% 61.8% 48.3%
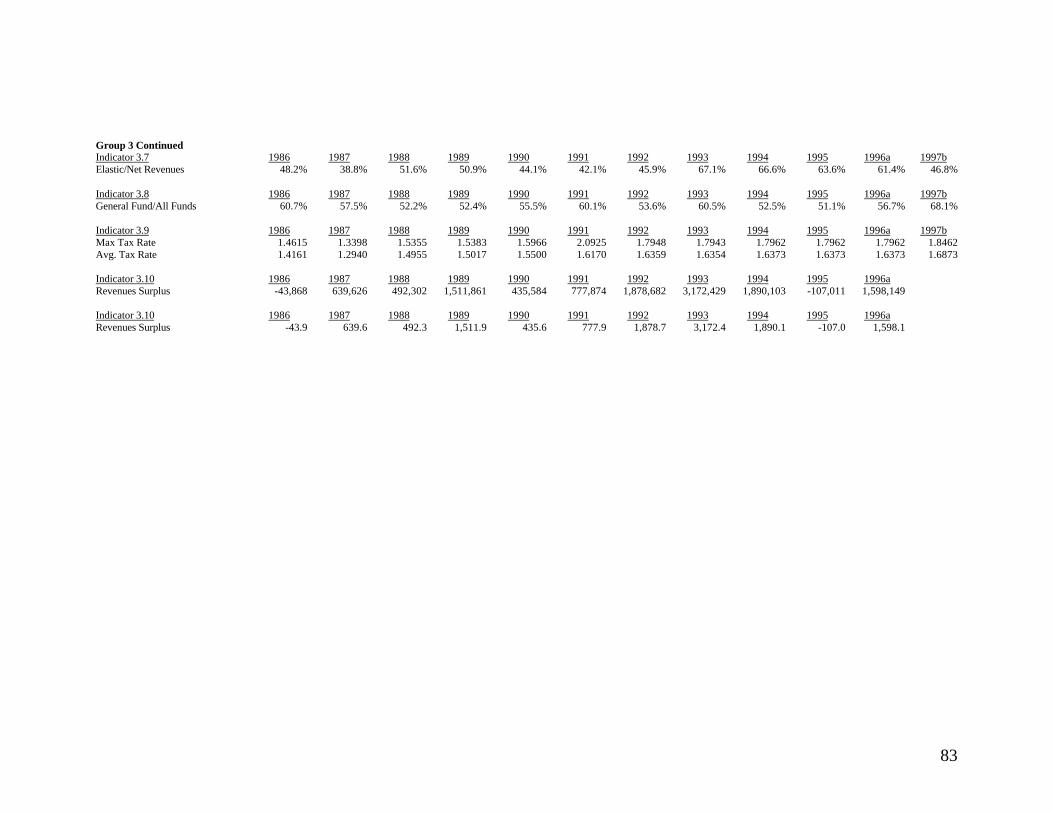
83
Group 3 ContinuedIndicator 3.7 1986 1987 1988 1989 1990 1991 1992 1993 1994 1995 1996a 1997bElastic/Net Revenues 48.2% 38.8% 51.6% 50.9% 44.1% 42.1% 45.9% 67.1% 66.6% 63.6% 61.4% 46.8%
Indicator 3.8 1986 1987 1988 1989 1990 1991 1992 1993 1994 1995 1996a 1997bGeneral Fund/All Funds 60.7% 57.5% 52.2% 52.4% 55.5% 60.1% 53.6% 60.5% 52.5% 51.1% 56.7% 68.1%
Indicator 3.9 1986 1987 1988 1989 1990 1991 1992 1993 1994 1995 1996a 1997bMax Tax Rate 1.4615 1.3398 1.5355 1.5383 1.5966 2.0925 1.7948 1.7943 1.7962 1.7962 1.7962 1.8462Avg. Tax Rate 1.4161 1.2940 1.4955 1.5017 1.5500 1.6170 1.6359 1.6354 1.6373 1.6373 1.6373 1.6873
Indicator 3.10 1986 1987 1988 1989 1990 1991 1992 1993 1994 1995 1996aRevenues Surplus -43,868 639,626 492,302 1,511,861 435,584 777,874 1,878,682 3,172,429 1,890,103 -107,011 1,598,149
Indicator 3.10 1986 1987 1988 1989 1990 1991 1992 1993 1994 1995 1996aRevenues Surplus -43.9 639.6 492.3 1,511.9 435.6 777.9 1,878.7 3,172.4 1,890.1 -107.0 1,598.1
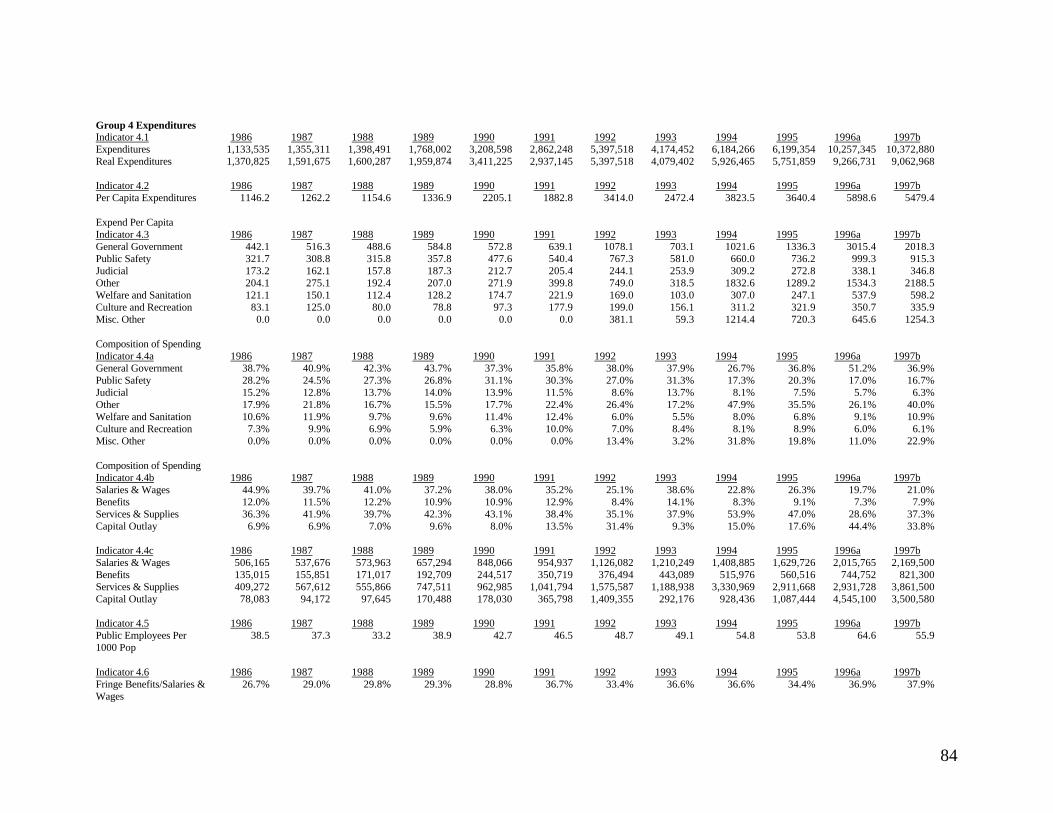
84
Group 4 ExpendituresIndicator 4.1 1986 1987 1988 1989 1990 1991 1992 1993 1994 1995 1996a 1997bExpenditures 1,133,535 1,355,311 1,398,491 1,768,002 3,208,598 2,862,248 5,397,518 4,174,452 6,184,266 6,199,354 10,257,345 10,372,880Real Expenditures 1,370,825 1,591,675 1,600,287 1,959,874 3,411,225 2,937,145 5,397,518 4,079,402 5,926,465 5,751,859 9,266,731 9,062,968
Indicator 4.2 1986 1987 1988 1989 1990 1991 1992 1993 1994 1995 1996a 1997bPer Capita Expenditures 1146.2 1262.2 1154.6 1336.9 2205.1 1882.8 3414.0 2472.4 3823.5 3640.4 5898.6 5479.4
Expend Per CapitaIndicator 4.3 1986 1987 1988 1989 1990 1991 1992 1993 1994 1995 1996a 1997bGeneral Government 442.1 516.3 488.6 584.8 572.8 639.1 1078.1 703.1 1021.6 1336.3 3015.4 2018.3Public Safety 321.7 308.8 315.8 357.8 477.6 540.4 767.3 581.0 660.0 736.2 999.3 915.3Judicial 173.2 162.1 157.8 187.3 212.7 205.4 244.1 253.9 309.2 272.8 338.1 346.8Other 204.1 275.1 192.4 207.0 271.9 399.8 749.0 318.5 1832.6 1289.2 1534.3 2188.5Welfare and Sanitation 121.1 150.1 112.4 128.2 174.7 221.9 169.0 103.0 307.0 247.1 537.9 598.2Culture and Recreation 83.1 125.0 80.0 78.8 97.3 177.9 199.0 156.1 311.2 321.9 350.7 335.9Misc. Other 0.0 0.0 0.0 0.0 0.0 0.0 381.1 59.3 1214.4 720.3 645.6 1254.3
Composition of SpendingIndicator 4.4a 1986 1987 1988 1989 1990 1991 1992 1993 1994 1995 1996a 1997bGeneral Government 38.7% 40.9% 42.3% 43.7% 37.3% 35.8% 38.0% 37.9% 26.7% 36.8% 51.2% 36.9%Public Safety 28.2% 24.5% 27.3% 26.8% 31.1% 30.3% 27.0% 31.3% 17.3% 20.3% 17.0% 16.7%Judicial 15.2% 12.8% 13.7% 14.0% 13.9% 11.5% 8.6% 13.7% 8.1% 7.5% 5.7% 6.3%Other 17.9% 21.8% 16.7% 15.5% 17.7% 22.4% 26.4% 17.2% 47.9% 35.5% 26.1% 40.0%Welfare and Sanitation 10.6% 11.9% 9.7% 9.6% 11.4% 12.4% 6.0% 5.5% 8.0% 6.8% 9.1% 10.9%Culture and Recreation 7.3% 9.9% 6.9% 5.9% 6.3% 10.0% 7.0% 8.4% 8.1% 8.9% 6.0% 6.1%Misc. Other 0.0% 0.0% 0.0% 0.0% 0.0% 0.0% 13.4% 3.2% 31.8% 19.8% 11.0% 22.9%
Composition of SpendingIndicator 4.4b 1986 1987 1988 1989 1990 1991 1992 1993 1994 1995 1996a 1997bSalaries & Wages 44.9% 39.7% 41.0% 37.2% 38.0% 35.2% 25.1% 38.6% 22.8% 26.3% 19.7% 21.0%Benefits 12.0% 11.5% 12.2% 10.9% 10.9% 12.9% 8.4% 14.1% 8.3% 9.1% 7.3% 7.9%Services & Supplies 36.3% 41.9% 39.7% 42.3% 43.1% 38.4% 35.1% 37.9% 53.9% 47.0% 28.6% 37.3%Capital Outlay 6.9% 6.9% 7.0% 9.6% 8.0% 13.5% 31.4% 9.3% 15.0% 17.6% 44.4% 33.8%
Indicator 4.4c 1986 1987 1988 1989 1990 1991 1992 1993 1994 1995 1996a 1997bSalaries & Wages 506,165 537,676 573,963 657,294 848,066 954,937 1,126,082 1,210,249 1,408,885 1,629,726 2,015,765 2,169,500Benefits 135,015 155,851 171,017 192,709 244,517 350,719 376,494 443,089 515,976 560,516 744,752 821,300Services & Supplies 409,272 567,612 555,866 747,511 962,985 1,041,794 1,575,587 1,188,938 3,330,969 2,911,668 2,931,728 3,861,500Capital Outlay 78,083 94,172 97,645 170,488 178,030 365,798 1,409,355 292,176 928,436 1,087,444 4,545,100 3,500,580
Indicator 4.5 1986 1987 1988 1989 1990 1991 1992 1993 1994 1995 1996a 1997bPublic Employees Per1000 Pop
38.5 37.3 33.2 38.9 42.7 46.5 48.7 49.1 54.8 53.8 64.6 55.9
Indicator 4.6 1986 1987 1988 1989 1990 1991 1992 1993 1994 1995 1996a 1997bFringe Benefits/Salaries &Wages
26.7% 29.0% 29.8% 29.3% 28.8% 36.7% 33.4% 36.6% 36.6% 34.4% 36.9% 37.9%

85
Group 5 Operating Position
Indicator 5.1 1986 1987 1988 1989 1990 1991 1992 1993 1994 1995 1996a 1997b
Net Surplus(deficit) -8,137 152,681 271,213 624,328 384,395 1,728,269 -79,457 2,321,041 459,112 372,149 -3,184,696 -1,694,922
Net / Current Revenues -0.7% 10.1% 16.2% 26.1% 10.7% 37.6% -1.5% 35.7% 6.9% 5.7% -45.0% -19.5%
Indicator 5.2 1986 1987 1988 1989 1990 1991 1992 1993 1994 1995 1996a 1997b
End Balance/Total Expenditures 38.4% 48.1% 69.6% 90.3% 61.8% 129.6% 67.3% 142.6% 103.7% 109.4% 35.1% 18.3%
Group 6 Capital
Indicator 6.1 1986 1987 1988 1989 1990 1991 1992 1993 1994 1995 1996a 1997b
Capital Outlay 78,083 94,172 97,645 170,488 178,030 365,798 1,409,355 292,176 928,436 1,087,444 4,545,100 3,500,580
Indicator 6.2 1986 1987 1988 1989 1990 1991 1992 1993 1994 1995 1996a 1997b
Capital Outlay/Total Spending 6.9% 6.9% 7.0% 9.6% 5.5% 12.8% 26.1% 7.0% 15.0% 17.5% 44.3% 33.7%