Embed Size (px)
Citation preview
Onondaga County
Trends 2007 Summary
Syracuse – Onondaga Planning Agency
1100 Civic Center 421 Montgomery Street
Syracuse, New York 13202
SYRACUSE – ONONDAGA COUNTY PLANNING AGENCY ONONDAGA COUNTY TRENDS 2007
i
Table of Contents
Summary ............................................................................................................................................... 1 Population.......................................................................................................................................... 1 Components of Population Change ................................................................................................... 1 Population Estimates and Projections................................................................................................ 1 Households........................................................................................................................................ 2 Housing Units .................................................................................................................................... 2 Population and Housing Unit Density ................................................................................................. 2 Urbanization....................................................................................................................................... 2
Population.............................................................................................................................................. 3 County and City Population................................................................................................................ 3 Town Population ................................................................................................................................ 4 Urban and Rural Population............................................................................................................... 6 Age .................................................................................................................................................... 7
Components of Population Change ....................................................................................................... 9 Natural Change.................................................................................................................................. 9 Migration............................................................................................................................................ 9
County-to-County Flow ................................................................................................................ 10 County Migrant General Characteristics....................................................................................... 10
Population Change .......................................................................................................................... 12 Population Estimates and Projections.................................................................................................. 13
County Population Estimates ........................................................................................................... 13 County Population Projections ......................................................................................................... 14
Households.......................................................................................................................................... 15 Number and Size of Households...................................................................................................... 15 Household Characteristics ............................................................................................................... 17
Housing Units ...................................................................................................................................... 18 Housing Units .................................................................................................................................. 18
Population and Housing Unit Density................................................................................................... 22 Urbanization ........................................................................................................................................ 25 General Profile..................................................................................................................................... 27 Maps.................................................................................................................................................... 28
Onondaga County............................................................................................................................ 28 Urban Development in Onondaga County 1960 – 2000 ................................................................... 29 Syracuse Urban Areas 1950 - 2000 ................................................................................................. 30 US Census Bureau 2000 Urbanized Areas ...................................................................................... 31 US Census Bureau 2000 Metropolitan Statistical Areas................................................................... 32
Glossary .............................................................................................................................................. 33
List of Figures Figure 1. Onondaga County Population Growth Rates 1950’s - 1990's ...................................................................3 Figure 2. Onondaga County Births, Deaths, and Natural Change 1960 - 2005........................................................9 Figure 3. Onondaga County Population Change 1950 - 2000 ................................................................................12 Figure 4. Onondaga County Households 1960 - 2000............................................................................................16 Figure 5. Onondaga County Population and Housing Unit Density ........................................................................22
List of Tables
SYRACUSE – ONONDAGA COUNTY PLANNING AGENCY ONONDAGA COUNTY TRENDS 2007
ii
Table 1. Onondaga County Population 1950 - 2000 .................................................................................................3 Table 2. Onondaga County Town Populations 1950 - 2000 .....................................................................................4 Table 3. Onondaga County Town Population Growth Rates 1950’s - 1990’s...........................................................5 Table 4. Onondaga County Urban and Rural Populations........................................................................................6 Table 5. Onondaga County Age Groups by Sex .......................................................................................................7 Table 6. Onondaga County and City of Syracuse 18 - 24 Year Old College Enrollment..........................................7 Table 7. Onondaga County College Enrollment........................................................................................................8 Table 8. Onondaga County Age Groups 1950 - 2000...............................................................................................8 Table 9. Central New York Residential Population and Components of Change 1990 - 2000.................................9 Table 10. Central New York Residential Population and Components of Change 2000 - 2006.............................10 Table 11. Onondaga County County-to-County Flow Migration Totals...................................................................10 Table 12. Onondaga County Age Group Characteristics of 1995 to 2000 Migrants & Non-Movers.......................10 Table 13. Onondaga County Educational Attainment Characteristics of 1995 to 2000 Migrants & Non-Movers ..11 Table 14. Onondaga County Income Characteristics of 1995 and 2000 Migrants & Non-Movers .........................11 Table 15. Onondaga County Nativity Characteristics of 1995 - 2000 Migrants & Non-Movers ..............................11 Table 16. Onondaga County Percent Population Change 1950 - 2000..................................................................12 Table 17. Onondaga County Population Estimates July 1, 2006............................................................................13 Table 18. Onondaga County Age Groups 1950 - 2000...........................................................................................14 Table 19. Onondaga County Number of Households 1960 - 2000 .........................................................................15 Table 20. Onondaga County Average Household and Family Size 1980 - 2000 ...................................................16 Table 21. Onondaga County Town and City of Syracuse Households and Population 1960 - 2000 .....................16 Table 22. Onondaga County Households and Families..........................................................................................17 Table 23. Onondaga County Total Housing Units 1950 - 2000 ..............................................................................18 Table 24. Onondaga County Year Structure Built ...................................................................................................19 Table 25. Onondaga County Urban and Rural Housing Units and Occupancy ......................................................20 Table 26. Onondaga County Subdivisions by Decade 1980 - 1990 .......................................................................20 Table 27. Onondaga County Building Permits by Decade 1970 - 1990..................................................................20 Table 28. Onondaga County Building Permits by Decade 1990 - 2000..................................................................21 Table 29. Onondaga County Population Density Per Square Mile 1970 - 2000.....................................................23 Table 30. Onondaga County Housing Unit Density Per Square Mile 1970 - 2000 .................................................24 Table 31. Census 2000 Syracuse Urbanized Area ..................................................................................................25 Table 32. Onondaga County Census Rural and Urban Square Miles ....................................................................25 Table 33. Onondaga County Urbanized Areas, Population, and Households Changes 1950 - 2000 .....................26

SYRACUSE – ONONDAGA COUNTY PLANNING AGENCY ONONDAGA COUNTY TRENDS 2007
1
Summary
Population
� Onondaga County population surged in the post World War II years during the 1950’s and 1960’s.
Town populations increased with new suburban development and the expansion of transportation
corridors and increased car usage. The City of Syracuse population started to decrease in the 1960’s.
� Since the 1970’s the overall County population has remained relatively stable with slight increases
and decreases from decade to decade. Town population continues to increase and City population
continues to decrease.
� Over the past two decades the towns of Cicero, Onondaga, Lysander, Pompey, and Otisco had the
highest percent change in population. Clay, Manlius, Lafayette, Tully and Otisco were in the next
tier. Van Buren, Marcellus, Elbridge, and Spafford were in the lowest tier. The older, first suburbs in
Salina, Dewitt, Camillus, and Geddes had negative population growth. Skaneateles also had a
population decrease.
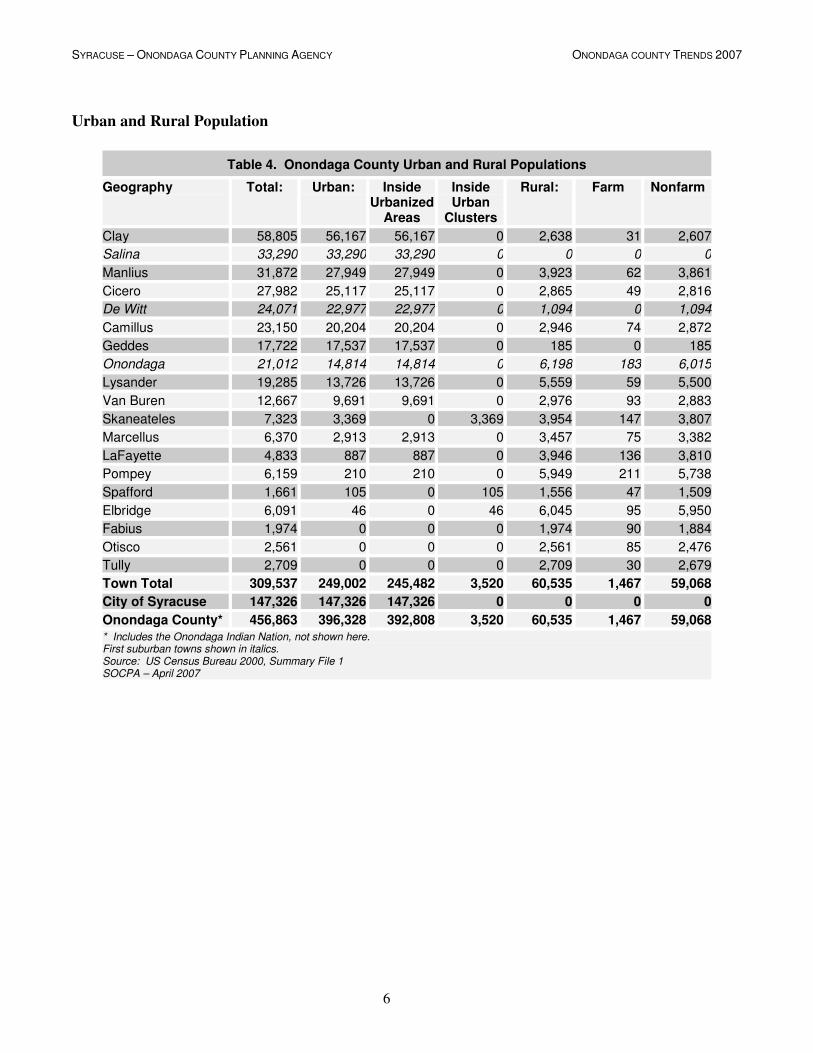
� Onondaga County is primarily an urban county, with rural populations located in all of the towns
except the Town of Salina. The City of Syracuse is completely urban.
� The population is aging as the baby boomers start to enter their retirement years. The dependency
ratio will increase to rates comparable to the 1960’s when the baby boomers were children. Higher
education institutions in the City of Syracuse boost the number of college-age residents.
Components of Population Change
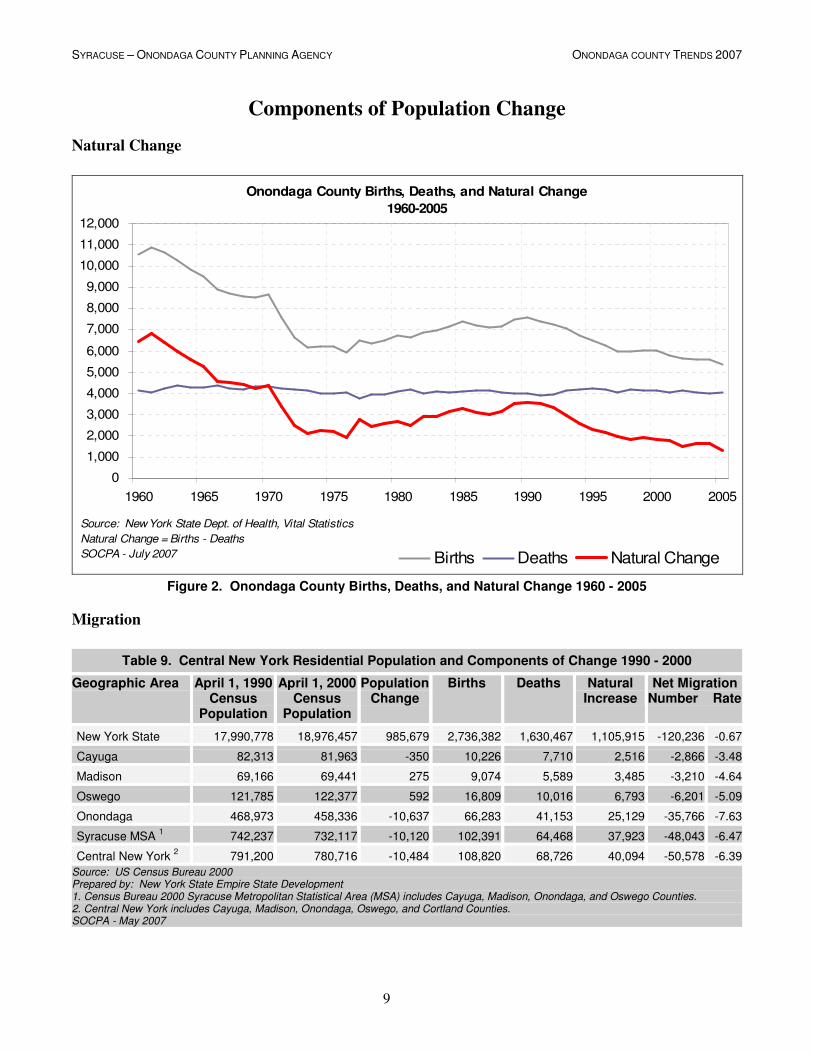
� County birth rates are declining, death rates are stable, and more people are moving out of Onondaga
County than moving in. As a result County population is stable to slightly decreasing. This
phenomenon is not unique to Onondaga County or Central New York; it’s occurring throughout the
northeast and the “Rust Belt.” Many areas of Upstate New York have experienced greater net
population decreases than Onondaga County.
� The majority of people moving into Onondaga County in 1995 were from other counties in New York
State. A small, positive net flow came from Oneida, Broome, Cortland and Jefferson Counties. The
largest negative net flows went to Oswego, Madison, New York, Monroe, and Orange Counties.
� The majority of people moving out of Onondaga County between 1995 and 2000 moved to another
state.
� Between 1995 and 2000 the City of Syracuse had a net loss of roughly 11,000 residents to towns in
the Syracuse Metropolitan Area, particularly the Onondaga County towns of Clay, Salina, DeWitt,
Onondaga, Geddes, Camillus, Manlius, Cicero, Lysander, and Van Buren.
� Virtually all age, educational attainment, and income groups had net population loss. The exceptions
are college age, lower income, and foreign-born groups, which are presumably related to college
student imports.
Population Estimates and Projections
� Net population and migration estimates indicate that County population is decreasing. The most
recent estimates, however, indicate that those rates of loss are decreasing, in Onondaga County and
throughout the Northeast.
� The County population projections vary. Given past and current trends of population stability, an
aging population, positive net out migration, and a declining birth rate, it seems unlikely the County’s
population will increase unless a significant change occurs, e.g., major changes in employment
opportunities. The population will most likely remain stable or decrease.
� The Nation’s, State’s, and County’s population is aging. As the baby boomers age, the senior
population will surge throughout the country. In New York and the Syracuse area the senior

SYRACUSE – ONONDAGA COUNTY PLANNING AGENCY ONONDAGA COUNTY TRENDS 2007
2
population will be aging in place, that is, they will not be migrating in from other areas. Our senior
population, therefore, will not increase as much as it will in other rapidly growing states, e.g., Florida,
with high in migration rates.
Households
� The number of households have continually increased in Onondaga County. The towns have had
significant increases, despite population losses in some. The number of households in the City of
Syracuse has decreased, but much less significantly than the City population.
� The number of households, in addition to population, drives housing needs. Increasing numbers of
households can create a demand for additional housing despite stable or decreasing population.
� In general, the percentage of family households and married-couple families with children increases
as you travel away from the City of Syracuse and where populations are increasing, i.e., in the
suburbs and rural areas.
Housing Units
� The number of housing units in Onondaga County has increased significantly since the 1950’s. These
increases continue, but at much slower rates, particularly in the fast growing suburbs of Cicero, Clay,
Onondaga, and Lysander.
� In the 1990’s the City of Syracuse experienced a decrease in the number of housing units.
� Newer housing units are located in the suburbs and further away from the City of Syracuse.
� A majority of the City of Syracuse’s housing units were built in 1939 or earlier. Older housing units
are also found in the villages.
� Highly populated suburban towns have a majority of housing stock built between 1950 and 1969.
� Vacancy rates are highest in the City of Syracuse and the most rural towns of Spafford, Otisco,
Fabius, and Tully.
� The average annual number of building permits issued so far this decade is slightly higher than the
1990’s indicating that the rate of decline maybe decreasing.
Population and Housing Unit Density
� County housing unit and population density increased significantly in the 1950’s and 1960’s.
� In the 1970’s County population density started to decrease as the population stabilized.
� Population density continued to increase, however, in many of the towns except Salina, Geddes,
Dewitt, Camillus, and Skaneateles where their populations are decreasing .
� Population density in the City of Syracuse has decreased.
� Since the 1970’s housing unit density increased County-wide and in all of the towns.
� Since the 1970’s housing unit density decreased in the City of Syracuse.
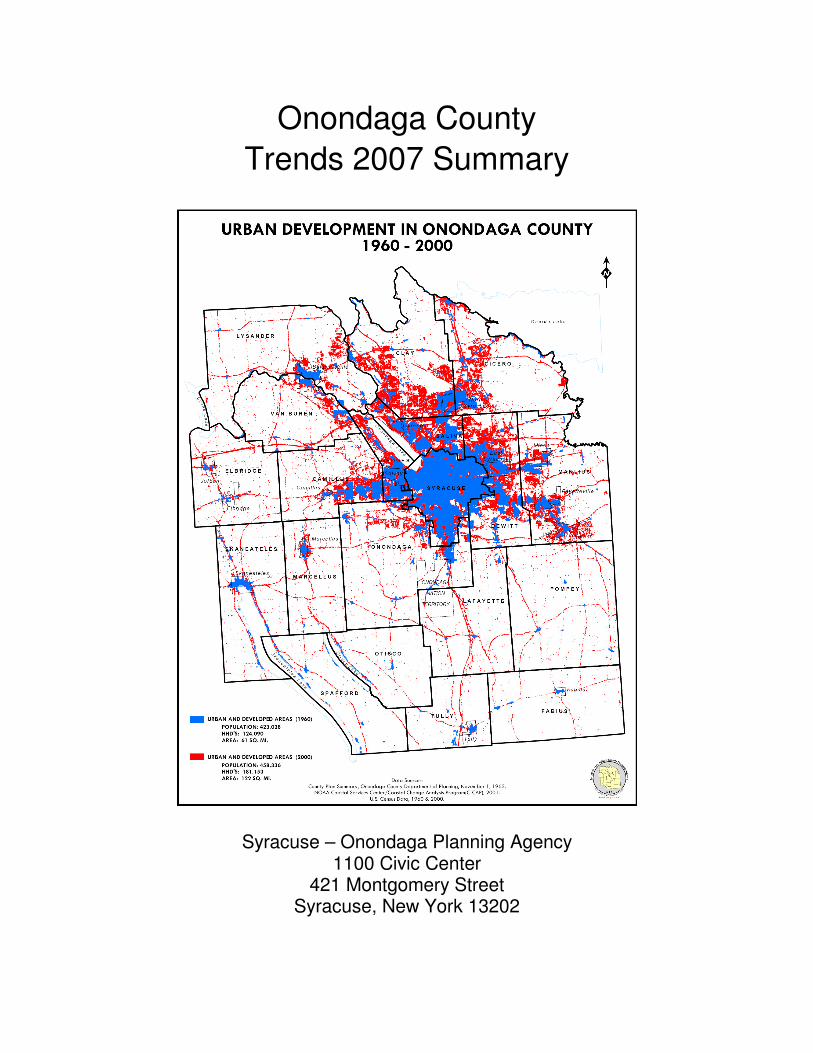
Urbanization
� The Syracuse Urbanized Area (central city of 50,000 or more people and its surrounding densely
settled urban fringe) is expanding beyond the central “urban core” of the City of Syracuse.
� In 1950 the Syracuse Urban Area encompassed 44 square miles.
� By 1970, 20 years later, the Urban Area more than doubled in size to 96 square.
� The Urban Area nearly doubled in size again over the next 30 years and by the year 2000 it included
184 square miles and it extended beyond County boundaries into neighboring Oswego and Madison
Counties.
� Eighty seven percent of the County population resides in an Urbanized Area.
SYRACUSE – ONONDAGA COUNTY PLANNING AGENCY ONONDAGA COUNTY TRENDS 2007
3
Population
County and City Population
Table 1. Onondaga County Population 1950 - 2000
Geographic Area 1950 1960 1970 1980 1990 2000 Total Change
Percent Change
Town Total 120,062 206,049 274,753 293,219 304,342 310,428 190,366 159%
City of Syracuse 220,583 216,038 197,297 170,105 163,860 146,435 -74,148 -34%
Onondaga County* 341,539 423,028 472,835 463,920 468,973 458,336 116,797 34% * Includes the Onondaga Indian Nation, not shown here. Source: US Census Bureau SOCPA – April 2007
Onondaga County Population Growth Rates
1950's - 1990's
-15%-10%-5%0%5%
10%15%20%25%30%35%40%45%50%55%60%65%70%75%
Town Total City of Syracuse County Total
Town Total 72% 33% 7% 4% 2%
City of Syracuse -2% -9% -14% -4% -11%
County Total 24% 12% -2% 1% -2%
1950's 1960's 1970's 1980's 1990's
Source: US Census Bureau
SOCPA - October 2007
Figure 1. Onondaga County Population Growth Rates 1950’s - 1990's
SYRACUSE – ONONDAGA COUNTY PLANNING AGENCY ONONDAGA COUNTY TRENDS 2007
4
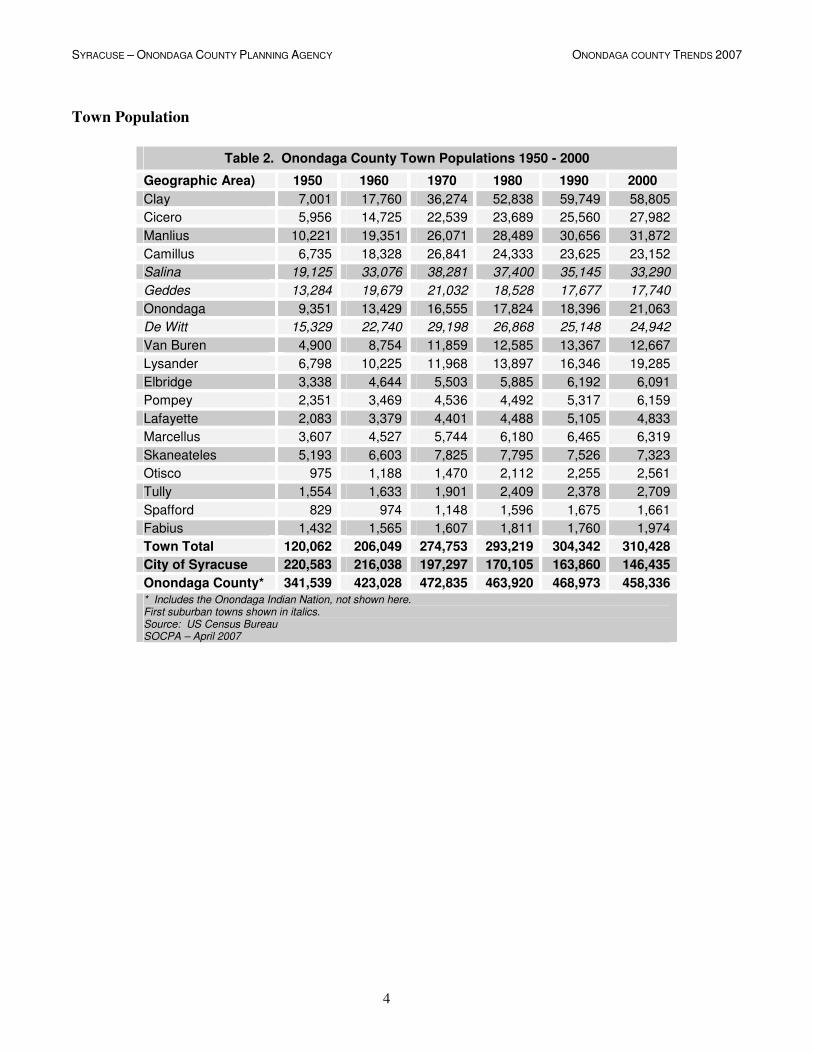
Town Population
Table 2. Onondaga County Town Populations 1950 - 2000
Geographic Area) 1950 1960 1970 1980 1990 2000
Clay 7,001 17,760 36,274 52,838 59,749 58,805
Cicero 5,956 14,725 22,539 23,689 25,560 27,982
Manlius 10,221 19,351 26,071 28,489 30,656 31,872
Camillus 6,735 18,328 26,841 24,333 23,625 23,152
Salina 19,125 33,076 38,281 37,400 35,145 33,290
Geddes 13,284 19,679 21,032 18,528 17,677 17,740
Onondaga 9,351 13,429 16,555 17,824 18,396 21,063
De Witt 15,329 22,740 29,198 26,868 25,148 24,942
Van Buren 4,900 8,754 11,859 12,585 13,367 12,667
Lysander 6,798 10,225 11,968 13,897 16,346 19,285
Elbridge 3,338 4,644 5,503 5,885 6,192 6,091
Pompey 2,351 3,469 4,536 4,492 5,317 6,159
Lafayette 2,083 3,379 4,401 4,488 5,105 4,833
Marcellus 3,607 4,527 5,744 6,180 6,465 6,319
Skaneateles 5,193 6,603 7,825 7,795 7,526 7,323
Otisco 975 1,188 1,470 2,112 2,255 2,561
Tully 1,554 1,633 1,901 2,409 2,378 2,709
Spafford 829 974 1,148 1,596 1,675 1,661
Fabius 1,432 1,565 1,607 1,811 1,760 1,974
Town Total 120,062 206,049 274,753 293,219 304,342 310,428
City of Syracuse 220,583 216,038 197,297 170,105 163,860 146,435
Onondaga County* 341,539 423,028 472,835 463,920 468,973 458,336 * Includes the Onondaga Indian Nation, not shown here. First suburban towns shown in italics. Source: US Census Bureau SOCPA – April 2007

SYRACUSE – ONONDAGA COUNTY PLANNING AGENCY ONONDAGA COUNTY TRENDS 2007
5
Table 3. Onondaga County Town Population Growth Rates 1950’s - 1990’s
Town 1950's 1960's 1970's 1980's 1990's Total
Lysander 50% 17% 16% 18% 18% 184%
Pompey 48% 31% -1% 18% 16% 162%
Onondaga 44% 23% 8% 3% 14% 125%
Tully 5% 16% 27% -1% 14% 74%
Otisco 22% 24% 44% 7% 14% 163%
Fabius 9% 3% 13% -3% 12% 38%
Cicero 147% 53% 5% 8% 9% 370%
Manlius 89% 35% 9% 8% 4% 212%
Geddes 48% 7% -12% -5% 0% 34%
De Witt 48% 28% -8% -6% -1% 63%
Spafford 17% 18% 39% 5% -1% 100%
Clay 154% 104% 46% 13% -2% 740%
Camillus 172% 46% -9% -3% -2% 244%
Marcellus 26% 27% 8% 5% -2% 75%
Elbridge 39% 18% 7% 5% -2% 82%
Skaneateles 27% 19% 0% -3% -3% 41%
Salina 73% 16% -2% -6% -5% 74%
Van Buren 79% 35% 6% 6% -5% 159%
Lafayette 62% 30% 2% 14% -5% 132%
Town Total 72% 33% 7% 4% 2% 159%First suburban towns shown in italics. Source: US Census Bureau SOCPA – June 2007
SYRACUSE – ONONDAGA COUNTY PLANNING AGENCY ONONDAGA COUNTY TRENDS 2007
6
Urban and Rural Population
Table 4. Onondaga County Urban and Rural Populations
Geography Total: Urban: Inside Urbanized
Areas
Inside Urban
Clusters
Rural: Farm Nonfarm
Clay 58,805 56,167 56,167 0 2,638 31 2,607
Salina 33,290 33,290 33,290 0 0 0 0
Manlius 31,872 27,949 27,949 0 3,923 62 3,861
Cicero 27,982 25,117 25,117 0 2,865 49 2,816
De Witt 24,071 22,977 22,977 0 1,094 0 1,094
Camillus 23,150 20,204 20,204 0 2,946 74 2,872
Geddes 17,722 17,537 17,537 0 185 0 185
Onondaga 21,012 14,814 14,814 0 6,198 183 6,015
Lysander 19,285 13,726 13,726 0 5,559 59 5,500
Van Buren 12,667 9,691 9,691 0 2,976 93 2,883
Skaneateles 7,323 3,369 0 3,369 3,954 147 3,807
Marcellus 6,370 2,913 2,913 0 3,457 75 3,382
LaFayette 4,833 887 887 0 3,946 136 3,810
Pompey 6,159 210 210 0 5,949 211 5,738
Spafford 1,661 105 0 105 1,556 47 1,509
Elbridge 6,091 46 0 46 6,045 95 5,950
Fabius 1,974 0 0 0 1,974 90 1,884
Otisco 2,561 0 0 0 2,561 85 2,476
Tully 2,709 0 0 0 2,709 30 2,679
Town Total 309,537 249,002 245,482 3,520 60,535 1,467 59,068
City of Syracuse 147,326 147,326 147,326 0 0 0 0
Onondaga County* 456,863 396,328 392,808 3,520 60,535 1,467 59,068
* Includes the Onondaga Indian Nation, not shown here. First suburban towns shown in italics. Source: US Census Bureau 2000, Summary File 1 SOCPA – April 2007

SYRACUSE – ONONDAGA COUNTY PLANNING AGENCY ONONDAGA COUNTY TRENDS 2007
7
Age
Table 5. Onondaga County Age Groups by Sex
Age Group Total Male Number
Female Number
Total Percent
Male Percent
Female Percent
Males per 100 Females
Under 5 29,917 15,282 14,635 6.5 -7 6.1 104.4
5 to 9 33,986 17,270 16,716 7.4 -7.9 7 103.3
10 to 14 34,481 17,610 16,871 7.5 -8 7.1 104.4
15 to 19 33,632 16,796 16,836 7.3 -7.7 7 99.8
20 to 24 29,695 14,402 15,293 6.5 -6.6 6.4 94.2
25 to 29 26,902 12,886 14,016 5.9 -5.9 5.9 91.9
30 to 34 31,586 15,387 16,199 6.9 -7 6.8 95
35 to 39 36,585 17,573 19,012 8 -8 8 92.4
40 to 44 37,082 18,182 18,900 8.1 -8.3 7.9 96.2
45 to 49 33,695 16,386 17,309 7.4 -7.5 7.2 94.7
50 to 54 28,840 13,881 14,959 6.3 -6.3 6.3 92.8
55 to 59 21,665 10,282 11,383 4.7 -4.7 4.8 90.3
60 to 64 16,976 7,932 9,044 3.7 -3.6 3.8 87.7
65 to 69 16,305 7,475 8,830 3.6 -3.4 3.7 84.7
70 to 74 15,862 6,834 9,028 3.5 -3.1 3.8 75.7
75 to 79 13,871 5,564 8,307 3 -2.5 3.5 67
80 to 84 9,490 3,380 6,110 2.1 -1.5 2.6 55.3
85 to 89 5,032 1,486 3,546 1.1 -0.7 1.5 41.9
90 and over 2,734 587 2,147 0.6 -0.3 0.9 27.3Source: US Census Bureau 2000, Summary File 1 SOCPA – November 2007
Table 6. Onondaga County and City of Syracuse 18 - 24 Year Old College Enrollment
Age Group Total Enrolled Percent Enrolled
Onondaga County 18 to 24 43,630 20,609 47%
Percent of County Enrolled
City of Syracuse 18 to 24 24,712 14,929 60% 72%Source: US Census Bureau 2000, Summary File 1 SOCPA – November 2007
SYRACUSE – ONONDAGA COUNTY PLANNING AGENCY ONONDAGA COUNTY TRENDS 2007
8
Table 7. Onondaga County College Enrollment
Geography Total 15 Years
and Older
Not Enrolled
Enrolled Percent Enrolled
15 to 17 Years
18 to 24 Years
25 to 34 Years
35 Years and Over
Clay 45,269 42,310 2,959 7% 0 1,058 1,071 830
Manlius 27,267 25,792 1,475 5% 10 549 502 414
Salina 25,023 23,440 1,583 6% 5 600 372 606
Cicero 21,405 20,227 1,178 6% 0 460 310 408
De Witt 19,266 18,113 1,153 6% 6 398 314 435
Camillus 18,596 17,529 1,067 6% 0 430 249 388
Onondaga 16,393 15,360 1,033 6% 7 443 246 337
Geddes 14,645 13,959 686 5% 0 304 177 205
Lysander 14,337 13,588 749 5% 0 371 170 208
Van Buren 10,167 9,621 546 5% 0 257 146 143
Skaneateles 5,793 5,408 385 7% 0 128 69 188
Pompey 4,878 4,674 204 4% 0 118 44 42
Elbridge 4,743 4,486 257 5% 0 148 41 68
LaFayette 4,648 4,371 277 6% 7 104 102 64
Tully 3,788 3,537 251 7% 0 149 45 57
Marcellus 2,072 1,865 207 10% 0 84 35 88
Fabius 1,881 1,808 73 4% 0 30 13 30
Otisco 1,492 1,412 80 5% 0 34 12 34
Spafford 1,322 1,269 53 4% 0 15 19 19
Town Total 243,000 228,769 14,216 72% 67 5,722 3,996 4599
City of Syracuse 116,022 95,182 20,840 18% 26 14,929 3,792 2,093
Onondaga County 359,007 323,951 35,056 10% 61 20,609 7,729 6,657
First suburban towns shown in italics. Source: US Census Bureau 2000, Summary File 3 SOCPA – November 2007
Table 8. Onondaga County Age Groups 1950 - 2000
Age 1950 1960 1970 1980 1990 2000 2010 2020 2030
0 to 4 34,372 50,324 41,213 30,973 35,006 29,917 28,242 27,505 25,274
5 to 9 25,931 43,706 46,336 32,041 33,051 33,986 27,965 27,397 25,469
10 to 14 20,299 36,721 48,029 38,432 29,689 34,481 27,696 26,528 25,389
15 to 19 22,646 28,717 44,203 46,481 33,865 33,632 35,943 31,748 30,876
20 to 24 29,139 25,087 37,081 46,475 39,711 29,695 36,257 31,364 30,189
25 to 29 29,622 27,112 29,326 39,854 40,740 26,902 28,385 27,575 24,800
30 to 34 26,855 29,723 24,694 34,876 40,709 31,586 25,228 27,906 23,802
35 to 44 46,921 58,702 51,732 49,462 69,087 73,667 51,467 48,322 47,788
45 to 54 40,961 46,316 52,230 48,171 45,272 62,535 63,484 45,734 42,926
55 to 64 33,987 36,526 38,850 46,307 41,003 38,641 53,148 53,126 38,623
65 to 74 20,879 26,631 25,232 29,899 35,095 32,167 30,755 41,619 40,931
75 and up 10,107 13,463 16,197 20,949 25,745 31,127 33,961 34,411 42,529
Total 343,627 424,946 457,051 465,858 470,921 460,294 444,499 425,213 400,584Source: US Census Bureau, 1950 - 2000 Cornell Institute for Social and Economic Research (CISER). Baseline Population Projections: NYsis Projects SEP02, 2010 - 2030 SOCPA - November 2007
SYRACUSE – ONONDAGA COUNTY PLANNING AGENCY ONONDAGA COUNTY TRENDS 2007
9
Components of Population Change
Natural Change
Onondaga County Births, Deaths, and Natural Change
1960-2005
0
1,000
2,000
3,000
4,000
5,000
6,000
7,000
8,000
9,000
10,000
11,000
12,000
1960 1965 1970 1975 1980 1985 1990 1995 2000 2005
Births Deaths Natural Change
Source: New York State Dept. of Health, Vital Statistics
Natural Change = Births - Deaths
SOCPA - July 2007
Figure 2. Onondaga County Births, Deaths, and Natural Change 1960 - 2005
Migration
Table 9. Central New York Residential Population and Components of Change 1990 - 2000
Geographic Area April 1, 1990 Census
Population
April 1, 2000 Census
Population
Population Change
Births Deaths Natural Increase
Net Migration Number Rate
New York State 17,990,778 18,976,457 985,679 2,736,382 1,630,467 1,105,915 -120,236 -0.67
Cayuga 82,313 81,963 -350 10,226 7,710 2,516 -2,866 -3.48
Madison 69,166 69,441 275 9,074 5,589 3,485 -3,210 -4.64
Oswego 121,785 122,377 592 16,809 10,016 6,793 -6,201 -5.09
Onondaga 468,973 458,336 -10,637 66,283 41,153 25,129 -35,766 -7.63
Syracuse MSA 1 742,237 732,117 -10,120 102,391 64,468 37,923 -48,043 -6.47
Central New York 2 791,200 780,716 -10,484 108,820 68,726 40,094 -50,578 -6.39
Source: US Census Bureau 2000 Prepared by: New York State Empire State Development 1. Census Bureau 2000 Syracuse Metropolitan Statistical Area (MSA) includes Cayuga, Madison, Onondaga, and Oswego Counties. 2. Central New York includes Cayuga, Madison, Onondaga, Oswego, and Cortland Counties. SOCPA - May 2007
SYRACUSE – ONONDAGA COUNTY PLANNING AGENCY ONONDAGA COUNTY TRENDS 2007
10
Table 10. Central New York Residential Population and Components of Change 2000 - 2006
Geographic Area April 1, 2000 Census
Population
April 1, 2006 Estimate
Population
Population Change
Births Deaths Natural Change
Net Migration Number Rate
New York State 18,976,821 19,306,183 329,362 1,576,125 974,346 601,779 -272,417 -1.44
Cayuga 81,963 81,243 -720 5,368 4,525 843 -1,563 -1.91
Madison 69,441 70,197 756 4,565 3,693 872 -116 -0.17
Onondaga 458,336 456,777 -1,559 35,435 25,383 10,052 -11,611 -2.53
Oswego 122,377 123,077 700 8,673 6,551 2,122 -1,422 -1.16
Syracuse MSA 1 650,154 650,051 -103 48,673 35,627 13,046 -13,149 -2.02
Central New York 2 780,716 779,777 -939 57,353 42,868 14,485 -15,424 -1.98
Source: US Census Bureau 2000 Prepared by: New York State Empire State Development 1 Census Bureau 2000 Syracuse Metropolitan Statistical Area (MSA) includes Cayuga, Madison, Onondaga, and Oswego Counties. 2. Central New York includes Cayuga, Madison, Onondaga, Oswego, and Cortland Counties. SOCPA - May 2007
County-to-County Flow
Table 11. Onondaga County County-to-County Flow Migration Totals
Geographic Area In-Migration Out-Migration Net
Other States 23,297 -44,069 -20,772
New York State 29,967 -31,950 -1,983
Total 53,264 -76,019 -22,755 Source: Census 2000 County-to-County Migration Flow Data SOCPA - May 2007
County Migrant General Characteristics
Table 12. Onondaga County Age Group Characteristics of 1995 to 2000 Migrants & Non-Movers
Age Groups in 1999 In Migration % of Total Out
Migration % of Total
Net Migration
Non Movers
Total 61,061 76,019 -14,958 367,461
5 to 14 years 8,398 13.8% 10,108 13.3% -1,710 60,312
15 to 19 6,330 10.4% 5,826 7.7% 504 26,538
20 to 24 12,107 19.8% 11,432 15.0% 675 17,923
25 to 34 15,264 25.0% 20,938 27.5% -5,674 43,377
35 to 44 9,938 16.3% 12,348 16.2% -2,410 64,370
45 to 54 4,557 7.5% 6,979 9.2% -2,422 57,626
55 to 64 1,867 3.1% 4,261 5.6% -2,394 36,513
65 to 74 1,174 1.9% 2,358 3.1% -1,184 31,358
75 to 84 950 1.6% 1,234 1.6% -284 22,550
85 + 476 0.8% 535 0.7% -59 6,894Source: US Census Bureau 2000 Prepared by: Policy Research Institute, The University of Kansas SOCPA - May 2007
SYRACUSE – ONONDAGA COUNTY PLANNING AGENCY ONONDAGA COUNTY TRENDS 2007
11
Table 13. Onondaga County Educational Attainment Characteristics of 1995 to 2000 Migrants & Non-Movers
Education Attainment in 1999 In Migration
% Out Migration
% Net Migration
Non Movers
Pop. Age 25 years and over 34,226 48,653 -14,427 262,688
Less than 9th grade 1,188 3.5% 1,268 2.6% -80 10,242
9th – 12
th grade, no diploma 2,533 7.4% 3,641 7.5% -1,108 28,595
High school graduate or equivalency 6,481 18.9% 8,731 17.9% -2,250 79928
Some college, no degree 5,555 16.2% 8,144 16.7% -2,589 47,933
Associate degree 3,135 9.2% 4,519 9.3% -1,384 26,723
Bachelor’s degree 8,631 25.2% 12,817 26.3% -4,186 40,494
Graduate or prof. Degree 6,703 19.6% 9,533 19.6% -2,830 28,773Source: US Census Bureau 2000 Prepared by: Policy Research Institute, The University of Kansas SOCPA - May 2007
Table 14. Onondaga County Income Characteristics of 1995 and 2000 Migrants & Non-Movers
Income of Persons in 1999 In Migration
% Out Migration
% Net Migration
Non Movers
%
Population age 16 and over 51,979 65,101 -13122 301,121
No income 5,666 10.90% 6,167 9.50% -501 23,646 7.90%
less than 4999 10,612 20.40% 8,343 12.80% 2,269 28,339 9.40%
$5,000 - $9,999 6,645 12.80% 6,557 10.10% 88 35,777 11.90%
$10,000 - $14,999 5,104 9.80% 5,797 8.90% -693 31,744 10.50%
$15,000 - $19,999 3,872 7.40% 5,443 8.40% -1,571 27,904 9.30%
$20,000 - $24,999 3,676 7.10% 5,294 8.10% -1,618 26,845 8.90%
$25,000 - $34,999 5,849 11.30% 9,138 14.00% -3,289 42,407 14.10%
$35,000 - $49,999 5,134 9.90% 8,125 12.50% -2,991 39,502 13.10%
$50,000 - $74,999 3,140 6.00% 5,970 9.20% -2,830 28,145 9.30%
$75,000 - $99,999 1,126 2.20% 1,930 3.00% -804 8,260 2.70%
$100,000 and over 1,155 2.20% 2,337 3.60% -1,182 8,552 2.80%Source: US Census Bureau 2000 Prepared by: Policy Research Institute, The University of Kansas SOCPA - May 2007
Table 15. Onondaga County Nativity Characteristics of 1995 - 2000 Migrants & Non-Movers
Nativity In Migration
% Out Migration
% Net Migration
Non Movers
Native 52,208 85.50% 70,975 93.40% -18,767 350,780
Foreign born, naturalized citizen 1,643 2.70% 2,365 3.10% -722 11,750
Foreign born, non-U.S. citizen 7,210 11.80% 2,679 3.50% 4,531 4,931
Source: US Census Bureau 2000 Prepared by: Policy Research Institute, The University of Kansas SOCPA - May 2007

SYRACUSE – ONONDAGA COUNTY PLANNING AGENCY ONONDAGA COUNTY TRENDS 2007
12
Population Change
Onondaga County Population Change
1950 - 2000
56,819 53,705
25,804 30,047 25,129
(3,898)
(35,766)(24,994)
(34,719)
24,490
-40,000
-30,000
-20,000
-10,000
0
10,000
20,000
30,000
40,000
50,000
60,000
70,000
80,000
90,000
1950-59 1960-69 1970-79 1980-89 1990-99
Natural Change Net Migration Population ChangeSource: US Census Bureau
SOCPA - July 2007This graph depicts natural change (difference between births and deaths), net migration (in and
out migration) and the resulting population change (gains and losses).
Figure 3. Onondaga County Population Change 1950 - 2000
Table 16. Onondaga County Percent Population Change 1950 - 2000
Geographic Area 1950-59 1960-69 1970-79 1980-89 1990-99 1950-2000
Town Total 72% 33% 7% 4% 2% 159%
City of Syracuse -2% -9% -14% -4% -11% -34%
Onondaga County Total* 24% 12% -2% 1% -2% 34%* Includes the Onondaga Indian Nation, not shown here. Source: US Census Bureau SOCPA – July 2007
SYRACUSE – ONONDAGA COUNTY PLANNING AGENCY ONONDAGA COUNTY TRENDS 2007
13
Population Estimates and Projections
County Population Estimates
Table 17. Onondaga County Population Estimates July 1, 2006
Geographic Area Estimate Base 2000
July 1, 2006
Change
Percent Change
Geddes 17,740 17,205 -535 -3.02%
Van Buren 12,667 12,473 -194 -1.53%
De Witt 24,937 24,638 -299 -1.20%
Salina 33,290 32,967 -323 -0.97%
Marcellus 6,319 6,292 -27 -0.43%
Otisco 2,561 2,559 -2 -0.08%
Clay 58,805 58,836 31 0.05%
Elbridge 6,091 6,096 5 0.08%
Camillus 23,152 23,330 178 0.77%
Skaneateles 7,323 7,380 57 0.78%
Fabius 1,974 1,998 24 1.22%
Tully 2,678 2,714 36 1.34%
Spafford 1,661 1,687 26 1.57%
Manlius 31,872 32,526 654 2.05%
LaFayette 4,835 4,964 129 2.67%
Onondaga 21,063 21,701 638 3.03%
Lysander 19,285 20,658 1,373 7.12%
Cicero 27,982 30,033 2,051 7.33%
Pompey 6,164 6,638 474 7.69%
Town Total 310,399 314,695 4,296 1.38%
City of Syracuse 146,464 140,658 -5,806 -3.96%
Onondaga County* 458,336 456,777 -1,559 -0.34%
* Includes the Onondaga Indian Nation, not shown here. First suburban towns shown in italics. Source: US Census Bureau, Annual Estimates of the Population SOCPA – July 2007
SYRACUSE – ONONDAGA COUNTY PLANNING AGENCY ONONDAGA COUNTY TRENDS 2007
14
County Population Projections
Onondaga County Population
Actual, Estimated, and Projections
300,000
325,000
350,000
375,000
400,000
425,000
450,000
475,000
500,000
1950 1960 1970 1980 1990 2000 2005 2010 2015 2020 2025
US Census Bureau Decennial Census and 2005 Estimate
Syracuse Metropolitan Transporation Council (SMTC) *
Linear Regression Extrapolation
Cornell Institute for Social and Economic Research (CISER)
Woods & Poole Economics, Inc.
* Syracuse Metropolitcan Transporation Council
(SMTC) Population Projections represent an average of
the Linear, CISER, and Woods & Poole Economics, Inc.
values. The 2020 Woods & Poole estimate was used to
calculate the 2025 projection.
SOCPA - April 2007
Table 18. Onondaga County Age Groups 1950 - 2000
Age 1950 1960 1970 1980 1990 2000 2010 2020 2030
0 to 4 34,372 50,324 41,213 30,973 35,006 29,917 28,242 27,505 25,274
5 to 9 25,931 43,706 46,336 32,041 33,051 33,986 27,965 27,397 25,469
10 to 14 20,299 36,721 48,029 38,432 29,689 34,481 27,696 26,528 25,389
15 to 19 22,646 28,717 44,203 46,481 33,865 33,632 35,943 31,748 30,876
20 to 24 29,139 25,087 37,081 46,475 39,711 29,695 36,257 31,364 30,189
25 to 29 29,622 27,112 29,326 39,854 40,740 26,902 28,385 27,575 24,800
30 to 34 26,855 29,723 24,694 34,876 40,709 31,586 25,228 27,906 23,802
35 to 44 46,921 58,702 51,732 49,462 69,087 73,667 51,467 48,322 47,788
45 to 54 40,961 46,316 52,230 48,171 45,272 62,535 63,484 45,734 42,926
55 to 64 33,987 36,526 38,850 46,307 41,003 38,641 53,148 53,126 38,623
65 to 74 20,879 26,631 25,232 29,899 35,095 32,167 30,755 41,619 40,931
75 and up 10,107 13,463 16,197 20,949 25,745 31,127 33,961 34,411 42,529
Total 343,627 424,946 457,051 465,858 470,921 460,294 444,499 425,213 400,584Source: US Census Bureau, 1950 - 2000 Cornell Institute for Social and Economic Research (CISER). Baseline Population Projections: NYsis Projects SEP02, 2010 - 2030 SOCPA - November 2007

SYRACUSE – ONONDAGA COUNTY PLANNING AGENCY ONONDAGA COUNTY TRENDS 2007
15
Households
Number and Size of Households
Table 19. Onondaga County Number of Households 1960 - 2000
Geography 1950 1960 1970 1980 1990 2000 Percent Change
1990 - 2000
Clay - 4,641 10,162 17,299 21,095 22,294 22%
Salina 5,409 9,006 11,352 13,370 14,166 14,401 6%
Manlius 2,921 5,242 7,242 9,633 11,481 12,553 19%
Cicero - 4,028 5,960 7,401 9,014 10,538 22%
Dewitt 4,194 6,375 8,422 9,211 9,729 10,068 6%
Camillus 1,826 4,702 7,182 7,992 8,917 9,315 12%
Onondaga 2,523 3,513 4,513 5,961 6,557 7,679 10%
Geddes 3,644 5,647 6,389 6,669 6,889 7,262 3%
Lysander - 2,745 3,282 4,497 5,839 7,139 30%
Van Buren - 2,375 3,157 4,322 5,234 5,288 21%
Skaneateles 1,572 1,951 2,393 2,705 2,871 2,881 6%
Marcellus 1,023 1,268 1,664 2,061 2,311 2,378 12%
Elbridge - 1,328 1,642 2,011 2,228 2,322 11%
Pompey - 904 1,178 1,370 1,827 2,154 33%
Lafayette - 876 1,186 1,476 1,724 1,826 17%
Tully - 488 563 802 886 1,030 10%
Otisco - 319 405 667 780 922 17%
Fabius - 401 446 591 612 686 4%
Spafford - 257 313 510 572 631 12%
Town Total 33,689 56,066 77,451 98,548 112,732 121,367 14%
City of Syracuse 63,204 67,830 67,671 66,691 64,945 59,482 -3%
Onondaga County* 96,893 124,090 145,322 165,407 177,898 181,153 8%
*Includes the Onondaga Indian Nation, not shown here. First suburb shown in italics. Source: US Census Bureau SOCPA – April 2007
SYRACUSE – ONONDAGA COUNTY PLANNING AGENCY ONONDAGA COUNTY TRENDS 2007
16
Table 20. Onondaga County Average Household and Family Size 1980 - 2000
Average Household Size 1980 1990 2000
City of Syracuse 2.38 2.33 2.29
Onondaga County 2.72 2.55 2.46
Average Family Size 1980 1990 2000
City of Syracuse 3.15 3.08 3.11
Onondaga County* 3.29 3.12 3.07 * Includes the Onondaga Indian Nation, not shown here. Source: US Census Bureau SOCPA
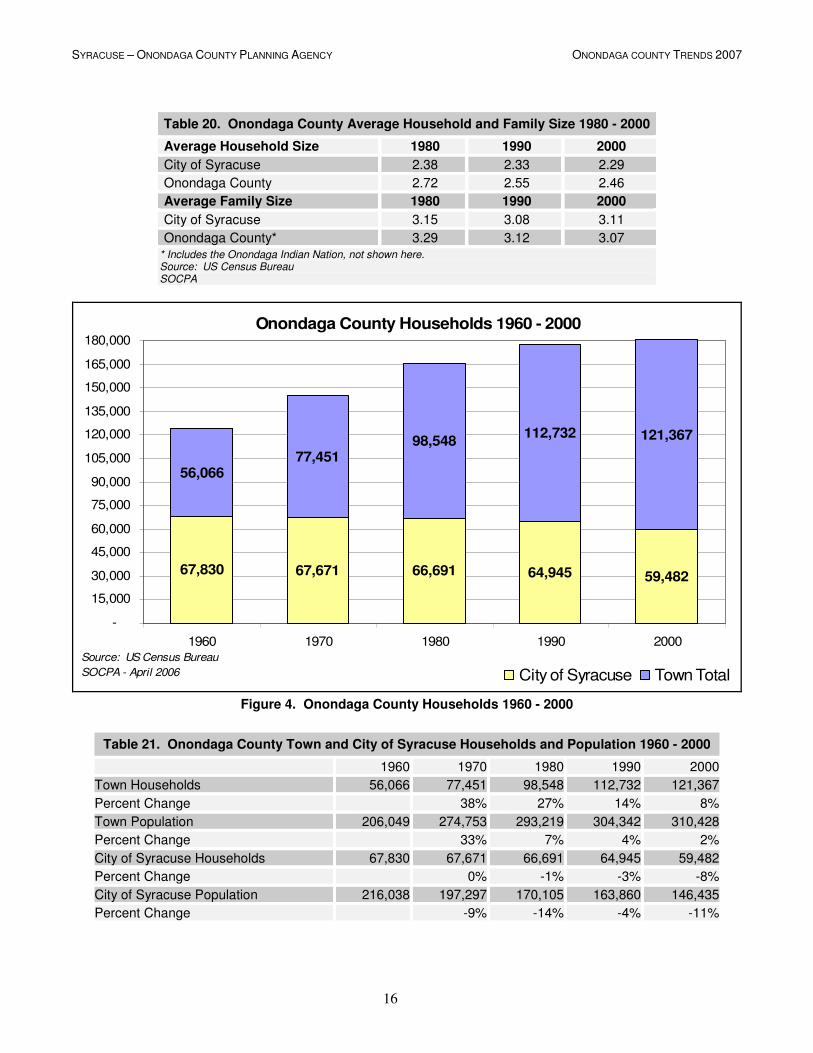
Onondaga County Households 1960 - 2000
67,830 67,671 66,691 64,945 59,482
56,06677,451
98,548112,732 121,367
-
15,000
30,000
45,000
60,000
75,000
90,000
105,000
120,000
135,000
150,000
165,000
180,000
1960 1970 1980 1990 2000
City of Syracuse Town TotalSource: US Census Bureau
SOCPA - April 2006
Figure 4. Onondaga County Households 1960 - 2000
Table 21. Onondaga County Town and City of Syracuse Households and Population 1960 - 2000
1960 1970 1980 1990 2000
Town Households 56,066 77,451 98,548 112,732 121,367
Percent Change 38% 27% 14% 8%
Town Population 206,049 274,753 293,219 304,342 310,428
Percent Change 33% 7% 4% 2%
City of Syracuse Households 67,830 67,671 66,691 64,945 59,482
Percent Change 0% -1% -3% -8%
City of Syracuse Population 216,038 197,297 170,105 163,860 146,435
Percent Change -9% -14% -4% -11%

SYRACUSE – ONONDAGA COUNTY PLANNING AGENCY ONONDAGA COUNTY TRENDS 2007
17
Household Characteristics
Table 22. Onondaga County Households and Families
Geography Total House-holds
% Family
% Married Couple Family
% With Own
Children Under
18 Years
% Female
No Husband Present
% Non-
family
% Living Alone
% 65
Years and Over
Avg. Pop-
ulation Per
House-hold
Avg. Pop-
ulation Per
Family
Clay 22,294 71.5 56.9 38 11 28.5 22.3 6.4 2.63 3.11
Salina 14,401 61.6 46.4 26 11.1 38.4 31.6 12.8 2.3 2.91
Manlius 12,553 70.8 60.2 34.5 8 29.2 25.3 10.9 2.51 3.04
Cicero 10,538 73 58.9 38.7 10.1 27 21.3 8.3 2.65 3.1
Dewitt 10,068 64.6 50.2 30 10.7 35.4 30.9 13.4 2.35 2.94
Camillus 9,315 70.8 58.1 30.5 9.8 29.2 25.1 12 2.48 2.99
Onondaga 7,679 71.8 60.4 35.1 8.1 28.2 23.5 11.2 2.64 3.15
Geddes 7,262 66.2 50.7 29 11.7 33.8 29.5 16.1 2.4 2.97
Lysander 7,139 75.7 64.5 39.8 7.9 24.3 19.9 7.7 2.7 3.12
Van Buren 5,288 64 50.6 29 9.7 36 30 11.4 2.37 2.95
Skaneateles 2,881 72.3 62.2 33.6 7.6 27.7 24.3 13 2.54 3.03
Marcellus 2,378 74.6 63.3 37.1 8 25.4 22.3 9.5 2.66 3.14
Elbridge 2,322 72.7 56.9 36.5 10.9 27.3 23.5 9.9 2.62 3.08
Pompey 2,154 81.8 72.4 41.4 5.5 18.2 14.7 5.6 2.86 3.17
LaFayette 1,826 73.3 60 35.7 9.5 26.7 21.8 8 2.64 3.09
Tully 1,030 72.3 59 37.8 9.3 27.7 22.2 9.3 2.59 3.04
Otisco 922 75.2 61.4 42.2 8.2 24.8 18.9 6.3 2.78 3.22
Fabius 686 75.2 65.2 40.7 7.7 24.8 18.8 6.7 2.87 3.3
Spafford 631 76.9 65 35 7.1 23.1 17.3 5.2 2.63 2.97
Town Total 121,36
City of Syracuse 59,482 51 27.5 27.5 19.3 49 38.2 11.9 2.29 3.11
County * 181,153 63.7 46.9 31.9 12.9 36.3 29.4 10.8 2.46 3.07
* Includes the Onondaga Indian Nation, not shown here. First suburban towns shown in italics. Source: US Census Bureau 2000, Summary File 1 SOCPA – November 2007
SYRACUSE – ONONDAGA COUNTY PLANNING AGENCY ONONDAGA COUNTY TRENDS 2007
18
Housing Units
Housing Units
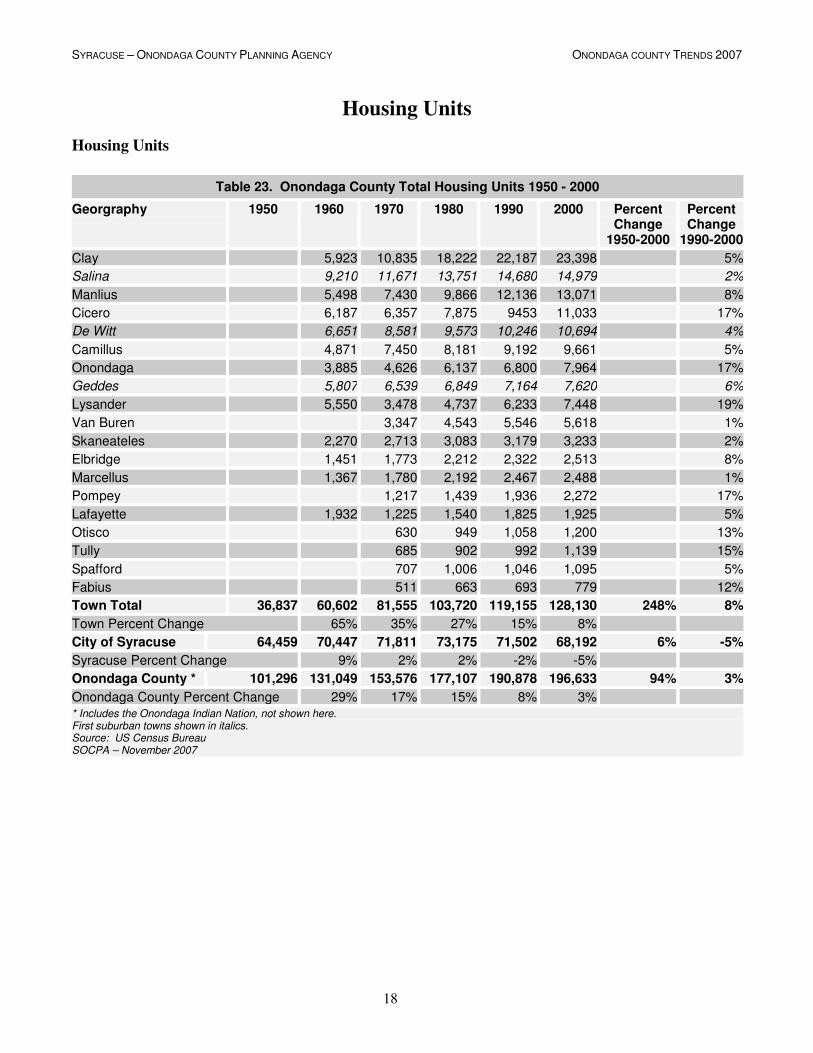
Table 23. Onondaga County Total Housing Units 1950 - 2000
Georgraphy 1950 1960 1970 1980 1990 2000 Percent Change
1950-2000
Percent Change
1990-2000
Clay 5,923 10,835 18,222 22,187 23,398 5%
Salina 9,210 11,671 13,751 14,680 14,979 2%
Manlius 5,498 7,430 9,866 12,136 13,071 8%
Cicero 6,187 6,357 7,875 9453 11,033 17%
De Witt 6,651 8,581 9,573 10,246 10,694 4%
Camillus 4,871 7,450 8,181 9,192 9,661 5%
Onondaga 3,885 4,626 6,137 6,800 7,964 17%
Geddes 5,807 6,539 6,849 7,164 7,620 6%
Lysander 5,550 3,478 4,737 6,233 7,448 19%
Van Buren 3,347 4,543 5,546 5,618 1%
Skaneateles 2,270 2,713 3,083 3,179 3,233 2%
Elbridge 1,451 1,773 2,212 2,322 2,513 8%
Marcellus 1,367 1,780 2,192 2,467 2,488 1%
Pompey 1,217 1,439 1,936 2,272 17%
Lafayette 1,932 1,225 1,540 1,825 1,925 5%
Otisco 630 949 1,058 1,200 13%
Tully 685 902 992 1,139 15%
Spafford 707 1,006 1,046 1,095 5%
Fabius 511 663 693 779 12%
Town Total 36,837 60,602 81,555 103,720 119,155 128,130 248% 8%
Town Percent Change 65% 35% 27% 15% 8%
City of Syracuse 64,459 70,447 71,811 73,175 71,502 68,192 6% -5%
Syracuse Percent Change 9% 2% 2% -2% -5%
Onondaga County * 101,296 131,049 153,576 177,107 190,878 196,633 94% 3%
Onondaga County Percent Change 29% 17% 15% 8% 3% * Includes the Onondaga Indian Nation, not shown here. First suburban towns shown in italics. Source: US Census Bureau SOCPA – November 2007

SYRACUSE – ONONDAGA COUNTY PLANNING AGENCY ONONDAGA COUNTY TRENDS 2007
19
Table 24. Onondaga County Year Structure Built
Geographic Area 1939 or
earlier
1940 to
1949
1950 to
1959
1960 to
1969
1970 to
1979
1980 to
1989
1990 to
2000
Total Units
Clay 989 1,051 3,069 4,706 6,313 4,949 2,321 23,398
Salina 2,103 1,804 4,220 2,760 2,002 1,268 822 14,979
Manlius 2,058 687 2,213 2,406 2,209 2,153 1,345 13,071
Cicero 1,009 773 2,129 1,810 1,368 1,838 2,106 11,033
De Witt 2,002 1,046 2,524 2,253 1,187 838 844 10,694
Camillus 1,015 481 2,847 2,247 1,253 1,018 805 9,666
Onondaga 1,406 668 1,337 1,027 1,366 1,012 1,136 7,952
Geddes 2,114 1,108 2,088 1,033 384 474 410 7,611
Lysander 1,350 375 775 662 1,250 1,446 1,590 7,448
Van Buren 1,024 314 838 1,037 1,177 857 371 5,618
Skaneateles 1,408 179 340 492 231 377 206 3,233
Elbridge 769 68 263 244 400 472 297 2,513
Marcellus 875 161 304 334 462 176 188 2,500
Pompey 549 74 213 308 231 451 446 2,272
La Fayette 329 130 314 350 248 368 186 1,925
Otisco 291 92 148 109 178 183 199 1,200
Tully 384 65 71 89 185 160 185 1,139
Spafford 346 79 82 128 161 127 172 1,095
Fabius 366 37 43 46 99 76 112 779
Town Total 20,387 9,192 23,818 22,041 20,704 18,243 13,741 128,126
City of Syracuse 32,764 8,154 9,978 7,419 5,697 2,549 1,635 68,196
Onondaga County * 53,172 17,348 33,894 29,574 26,422 20,814 15,409 196,633 * Includes the Onondaga Indian Nation, not shown here. First suburban towns shown in italics. Source: US Census Bureau 2000, Summary File 3 SOCPA - May 2007
SYRACUSE – ONONDAGA COUNTY PLANNING AGENCY ONONDAGA COUNTY TRENDS 2007
20
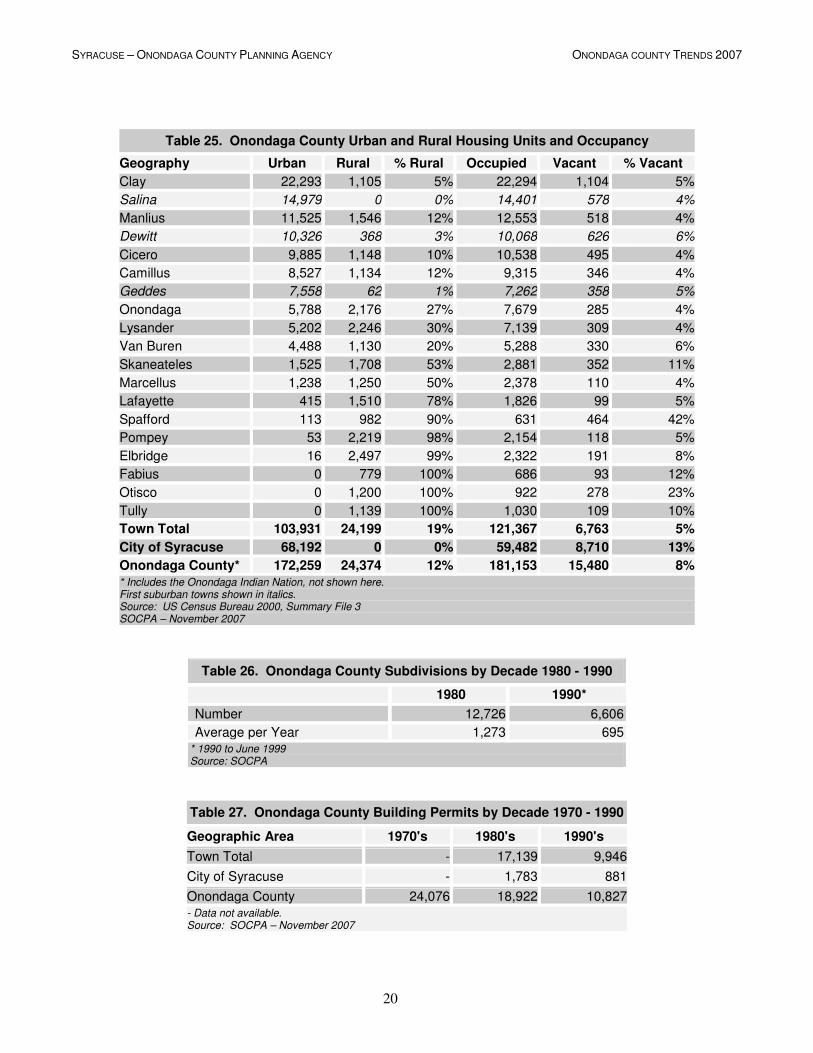
Table 25. Onondaga County Urban and Rural Housing Units and Occupancy
Geography Urban Rural % Rural Occupied Vacant % Vacant
Clay 22,293 1,105 5% 22,294 1,104 5%
Salina 14,979 0 0% 14,401 578 4%
Manlius 11,525 1,546 12% 12,553 518 4%
Dewitt 10,326 368 3% 10,068 626 6%
Cicero 9,885 1,148 10% 10,538 495 4%
Camillus 8,527 1,134 12% 9,315 346 4%
Geddes 7,558 62 1% 7,262 358 5%
Onondaga 5,788 2,176 27% 7,679 285 4%
Lysander 5,202 2,246 30% 7,139 309 4%
Van Buren 4,488 1,130 20% 5,288 330 6%
Skaneateles 1,525 1,708 53% 2,881 352 11%
Marcellus 1,238 1,250 50% 2,378 110 4%
Lafayette 415 1,510 78% 1,826 99 5%
Spafford 113 982 90% 631 464 42%
Pompey 53 2,219 98% 2,154 118 5%
Elbridge 16 2,497 99% 2,322 191 8%
Fabius 0 779 100% 686 93 12%
Otisco 0 1,200 100% 922 278 23%
Tully 0 1,139 100% 1,030 109 10%
Town Total 103,931 24,199 19% 121,367 6,763 5%
City of Syracuse 68,192 0 0% 59,482 8,710 13%
Onondaga County* 172,259 24,374 12% 181,153 15,480 8%
* Includes the Onondaga Indian Nation, not shown here. First suburban towns shown in italics. Source: US Census Bureau 2000, Summary File 3 SOCPA – November 2007
Table 26. Onondaga County Subdivisions by Decade 1980 - 1990
1980 1990*
Number 12,726 6,606
Average per Year 1,273 695 * 1990 to June 1999 Source: SOCPA
Table 27. Onondaga County Building Permits by Decade 1970 - 1990
Geographic Area 1970's 1980's 1990's
Town Total - 17,139 9,946
City of Syracuse - 1,783 881
Onondaga County 24,076 18,922 10,827- Data not available. Source: SOCPA – November 2007
SYRACUSE – ONONDAGA COUNTY PLANNING AGENCY ONONDAGA COUNTY TRENDS 2007
21
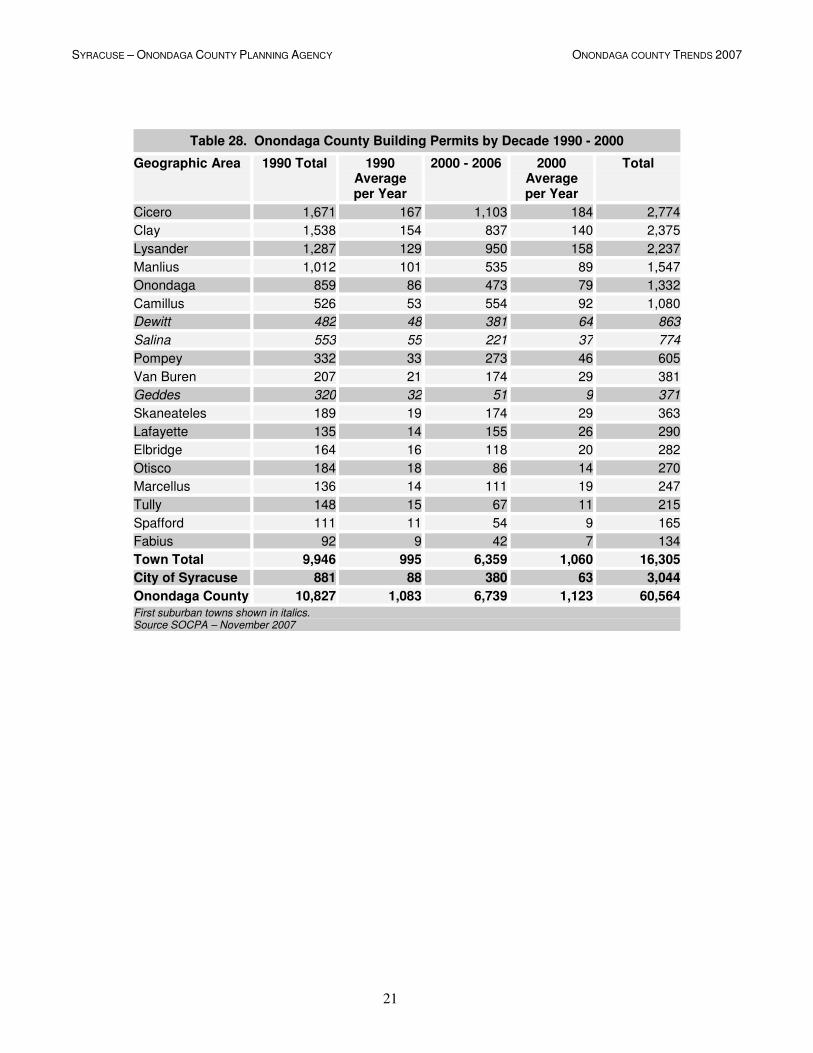
Table 28. Onondaga County Building Permits by Decade 1990 - 2000
Geographic Area 1990 Total 1990 Average per Year
2000 - 2006 2000 Average per Year
Total
Cicero 1,671 167 1,103 184 2,774
Clay 1,538 154 837 140 2,375
Lysander 1,287 129 950 158 2,237
Manlius 1,012 101 535 89 1,547
Onondaga 859 86 473 79 1,332
Camillus 526 53 554 92 1,080
Dewitt 482 48 381 64 863
Salina 553 55 221 37 774
Pompey 332 33 273 46 605
Van Buren 207 21 174 29 381
Geddes 320 32 51 9 371
Skaneateles 189 19 174 29 363
Lafayette 135 14 155 26 290
Elbridge 164 16 118 20 282
Otisco 184 18 86 14 270
Marcellus 136 14 111 19 247
Tully 148 15 67 11 215
Spafford 111 11 54 9 165
Fabius 92 9 42 7 134
Town Total 9,946 995 6,359 1,060 16,305
City of Syracuse 881 88 380 63 3,044
Onondaga County 10,827 1,083 6,739 1,123 60,564
First suburban towns shown in italics. Source SOCPA – November 2007

SYRACUSE – ONONDAGA COUNTY PLANNING AGENCY ONONDAGA COUNTY TRENDS 2007
22
Population and Housing Unit Density
Onondaga County Population and Housing Unit Density
587601
438
542
606 595
252245227
197168
130
0
50
100
150
200
250
300
350
400
450
500
550
600
650
1950 1960 1970 1980 1990 2000
Sq
uare
Miles
Housing Units per
Square Mile
Population per
Square Mile
Source: US Census Bureau
SOCPA - November 2007
Figure 5. Onondaga County Population and Housing Unit Density
SYRACUSE – ONONDAGA COUNTY PLANNING AGENCY ONONDAGA COUNTY TRENDS 2007
23
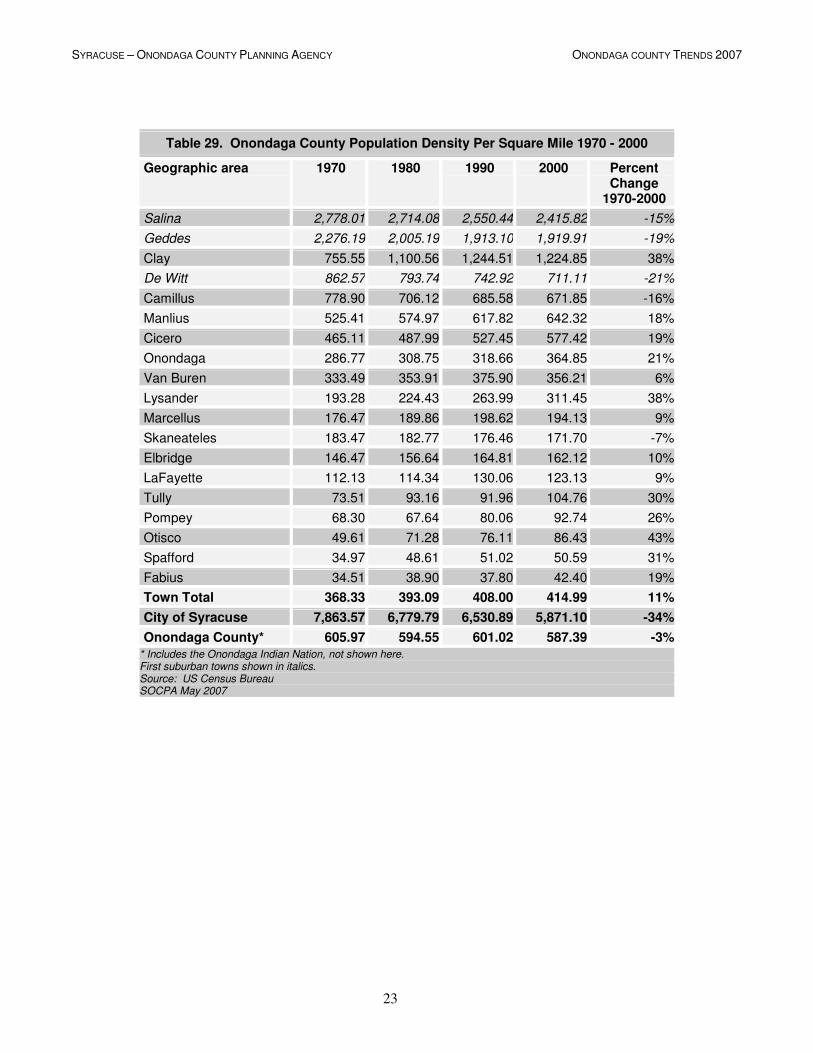
Table 29. Onondaga County Population Density Per Square Mile 1970 - 2000
Geographic area 1970 1980 1990 2000 Percent Change
1970-2000
Salina 2,778.01 2,714.08 2,550.44 2,415.82 -15%
Geddes 2,276.19 2,005.19 1,913.10 1,919.91 -19%
Clay 755.55 1,100.56 1,244.51 1,224.85 38%
De Witt 862.57 793.74 742.92 711.11 -21%
Camillus 778.90 706.12 685.58 671.85 -16%
Manlius 525.41 574.97 617.82 642.32 18%
Cicero 465.11 487.99 527.45 577.42 19%
Onondaga 286.77 308.75 318.66 364.85 21%
Van Buren 333.49 353.91 375.90 356.21 6%
Lysander 193.28 224.43 263.99 311.45 38%
Marcellus 176.47 189.86 198.62 194.13 9%
Skaneateles 183.47 182.77 176.46 171.70 -7%
Elbridge 146.47 156.64 164.81 162.12 10%
LaFayette 112.13 114.34 130.06 123.13 9%
Tully 73.51 93.16 91.96 104.76 30%
Pompey 68.30 67.64 80.06 92.74 26%
Otisco 49.61 71.28 76.11 86.43 43%
Spafford 34.97 48.61 51.02 50.59 31%
Fabius 34.51 38.90 37.80 42.40 19%
Town Total 368.33 393.09 408.00 414.99 11%
City of Syracuse 7,863.57 6,779.79 6,530.89 5,871.10 -34%
Onondaga County* 605.97 594.55 601.02 587.39 -3%
* Includes the Onondaga Indian Nation, not shown here. First suburban towns shown in italics. Source: US Census Bureau SOCPA May 2007
SYRACUSE – ONONDAGA COUNTY PLANNING AGENCY ONONDAGA COUNTY TRENDS 2007
24
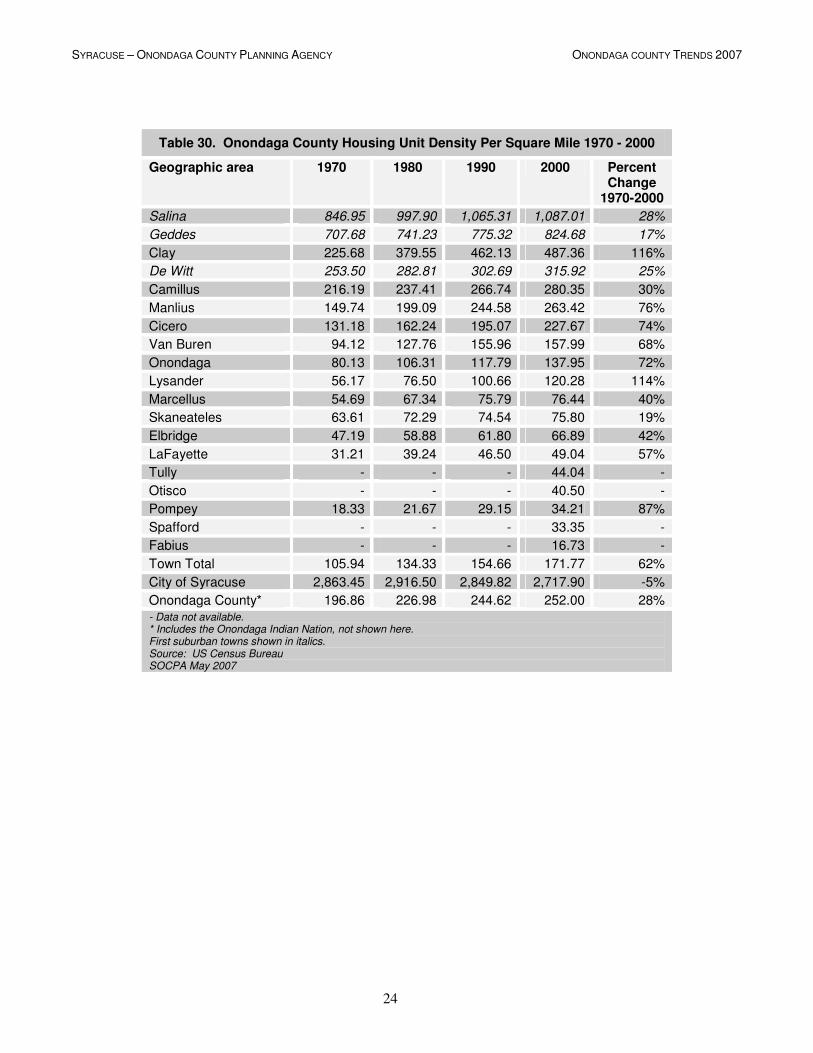
Table 30. Onondaga County Housing Unit Density Per Square Mile 1970 - 2000
Geographic area 1970 1980 1990 2000 Percent Change
1970-2000
Salina 846.95 997.90 1,065.31 1,087.01 28%
Geddes 707.68 741.23 775.32 824.68 17%
Clay 225.68 379.55 462.13 487.36 116%
De Witt 253.50 282.81 302.69 315.92 25%
Camillus 216.19 237.41 266.74 280.35 30%
Manlius 149.74 199.09 244.58 263.42 76%
Cicero 131.18 162.24 195.07 227.67 74%
Van Buren 94.12 127.76 155.96 157.99 68%
Onondaga 80.13 106.31 117.79 137.95 72%
Lysander 56.17 76.50 100.66 120.28 114%
Marcellus 54.69 67.34 75.79 76.44 40%
Skaneateles 63.61 72.29 74.54 75.80 19%
Elbridge 47.19 58.88 61.80 66.89 42%
LaFayette 31.21 39.24 46.50 49.04 57%
Tully - - - 44.04 -
Otisco - - - 40.50 -
Pompey 18.33 21.67 29.15 34.21 87%
Spafford - - - 33.35 -
Fabius - - - 16.73 -
Town Total 105.94 134.33 154.66 171.77 62%
City of Syracuse 2,863.45 2,916.50 2,849.82 2,717.90 -5%
Onondaga County* 196.86 226.98 244.62 252.00 28% - Data not available. * Includes the Onondaga Indian Nation, not shown here. First suburban towns shown in italics. Source: US Census Bureau SOCPA May 2007
SYRACUSE – ONONDAGA COUNTY PLANNING AGENCY ONONDAGA COUNTY TRENDS 2007
25
Urbanization
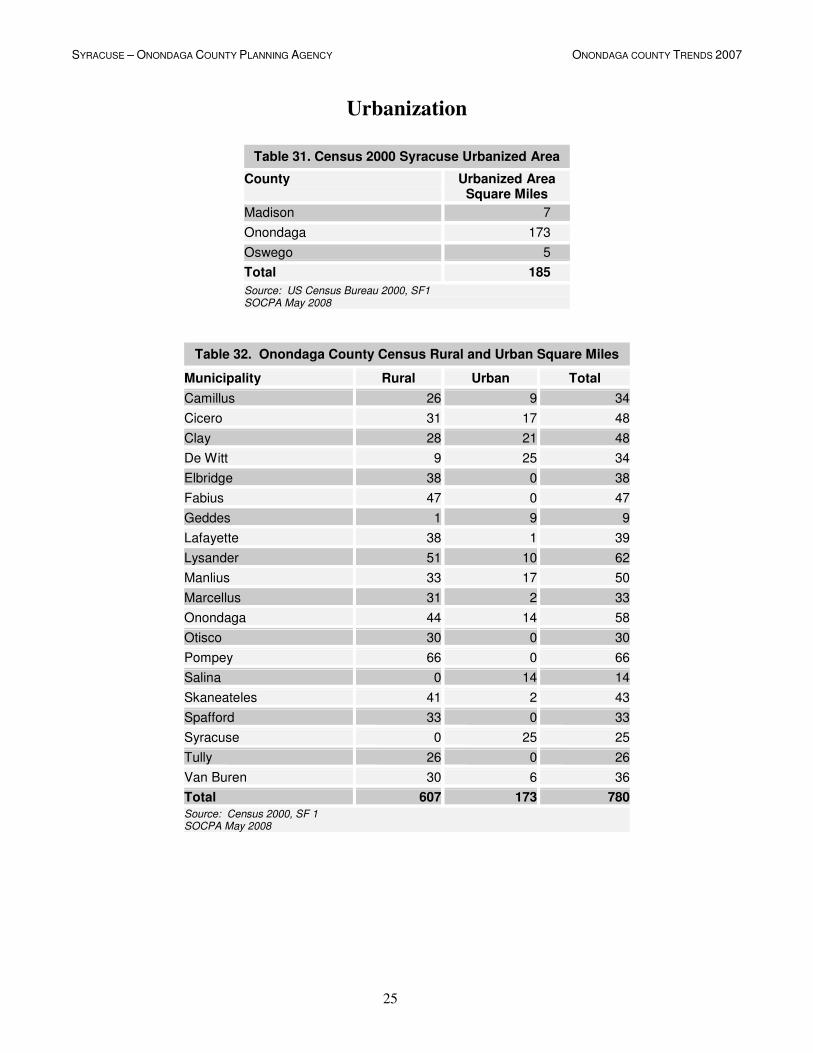
Table 31. Census 2000 Syracuse Urbanized Area
County Urbanized Area Square Miles
Madison 7
Onondaga 173
Oswego 5
Total 185
Source: US Census Bureau 2000, SF1 SOCPA May 2008
Table 32. Onondaga County Census Rural and Urban Square Miles
Municipality Rural Urban Total
Camillus 26 9 34
Cicero 31 17 48
Clay 28 21 48
De Witt 9 25 34
Elbridge 38 0 38
Fabius 47 0 47
Geddes 1 9 9
Lafayette 38 1 39
Lysander 51 10 62
Manlius 33 17 50
Marcellus 31 2 33
Onondaga 44 14 58
Otisco 30 0 30
Pompey 66 0 66
Salina 0 14 14
Skaneateles 41 2 43
Spafford 33 0 33
Syracuse 0 25 25
Tully 26 0 26
Van Buren 30 6 36
Total 607 173 780
Source: Census 2000, SF 1 SOCPA May 2008

SYRACUSE – ONONDAGA COUNTY PLANNING AGENCY ONONDAGA COUNTY TRENDS 2007
26
Table 33. Onondaga County Urbanized Areas, Population, and Households Changes 1950 - 2000
Census Urban Area sq. mi.
Percent Change
County Population
Percent Change
Households Percent Change
1950 43.6 - 341,719 - 96,893 -
1960 66.7 52.98 423,028 19.22 124,090 28.07
1970 96.2 44.23 472,835 10.53 145,322 17.11
1980 128 33.06 463,920 -1.92 165,407 13.82
1990 139.1 8.67 468,973 1.08 177,898 7.55
2000 184.4* 32.57 458,336 -2.32 181,153 1.83
Change: 140.8 322.94 116,617 25.44 84,260 46.51
* Includes areas in Oswego and Madison Counties. Source: US Census Bureau SOCPA May 2008
27
General Profile
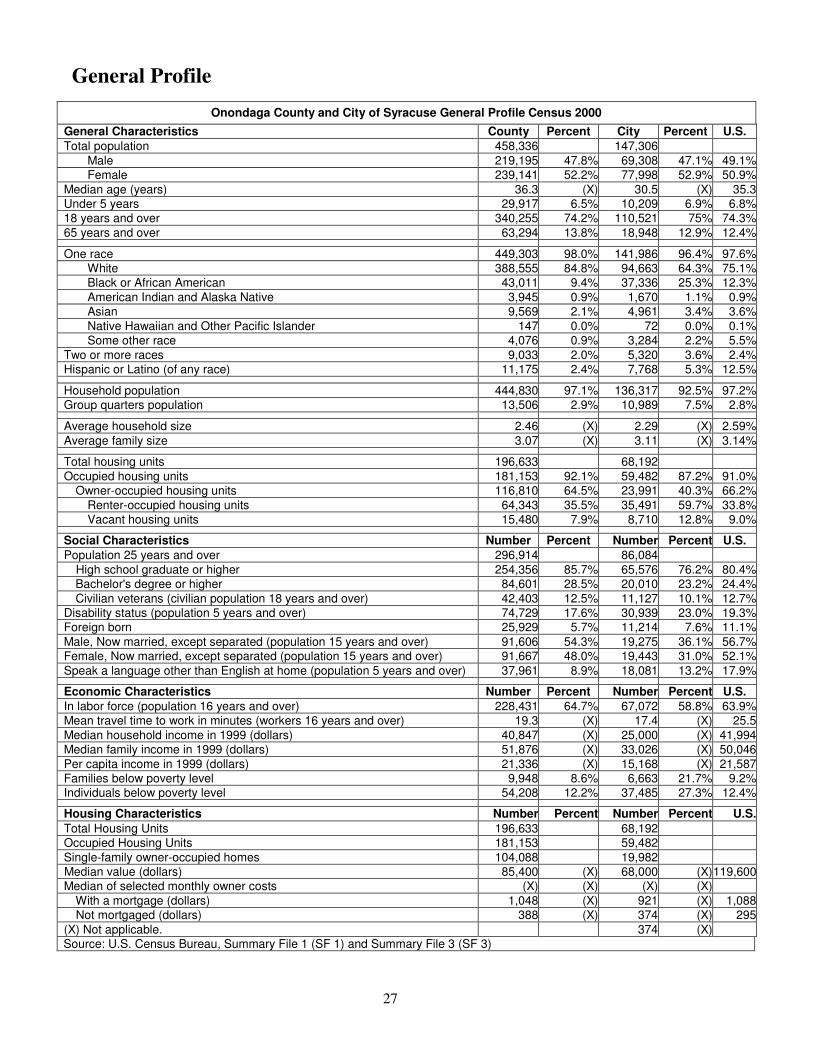
Onondaga County and City of Syracuse General Profile Census 2000
General Characteristics County Percent City Percent U.S. Total population 458,336 147,306
Male 219,195 47.8% 69,308 47.1% 49.1%Female 239,141 52.2% 77,998 52.9% 50.9%
Median age (years) 36.3 (X) 30.5 (X) 35.3Under 5 years 29,917 6.5% 10,209 6.9% 6.8%18 years and over 340,255 74.2% 110,521 75% 74.3%65 years and over 63,294 13.8% 18,948 12.9% 12.4%
One race 449,303 98.0% 141,986 96.4% 97.6%White 388,555 84.8% 94,663 64.3% 75.1%Black or African American 43,011 9.4% 37,336 25.3% 12.3%American Indian and Alaska Native 3,945 0.9% 1,670 1.1% 0.9%Asian 9,569 2.1% 4,961 3.4% 3.6%Native Hawaiian and Other Pacific Islander 147 0.0% 72 0.0% 0.1%Some other race 4,076 0.9% 3,284 2.2% 5.5%
Two or more races 9,033 2.0% 5,320 3.6% 2.4%Hispanic or Latino (of any race) 11,175 2.4% 7,768 5.3% 12.5%
Household population 444,830 97.1% 136,317 92.5% 97.2%Group quarters population 13,506 2.9% 10,989 7.5% 2.8%
Average household size 2.46 (X) 2.29 (X) 2.59%Average family size 3.07 (X) 3.11 (X) 3.14%
Total housing units 196,633 68,192 Occupied housing units 181,153 92.1% 59,482 87.2% 91.0%
Owner-occupied housing units 116,810 64.5% 23,991 40.3% 66.2%Renter-occupied housing units 64,343 35.5% 35,491 59.7% 33.8%Vacant housing units 15,480 7.9% 8,710 12.8% 9.0%
Social Characteristics Number Percent Number Percent U.S.
Population 25 years and over 296,914 86,084 High school graduate or higher 254,356 85.7% 65,576 76.2% 80.4%Bachelor's degree or higher 84,601 28.5% 20,010 23.2% 24.4%Civilian veterans (civilian population 18 years and over) 42,403 12.5% 11,127 10.1% 12.7%
Disability status (population 5 years and over) 74,729 17.6% 30,939 23.0% 19.3%Foreign born 25,929 5.7% 11,214 7.6% 11.1%Male, Now married, except separated (population 15 years and over) 91,606 54.3% 19,275 36.1% 56.7%Female, Now married, except separated (population 15 years and over) 91,667 48.0% 19,443 31.0% 52.1%Speak a language other than English at home (population 5 years and over) 37,961 8.9% 18,081 13.2% 17.9%
Economic Characteristics Number Percent Number Percent U.S.
In labor force (population 16 years and over) 228,431 64.7% 67,072 58.8% 63.9%Mean travel time to work in minutes (workers 16 years and over) 19.3 (X) 17.4 (X) 25.5Median household income in 1999 (dollars) 40,847 (X) 25,000 (X) 41,994Median family income in 1999 (dollars) 51,876 (X) 33,026 (X) 50,046Per capita income in 1999 (dollars) 21,336 (X) 15,168 (X) 21,587Families below poverty level 9,948 8.6% 6,663 21.7% 9.2%Individuals below poverty level 54,208 12.2% 37,485 27.3% 12.4%
Housing Characteristics Number Percent Number Percent U.S.
Total Housing Units 196,633 68,192Occupied Housing Units 181,153 59,482Single-family owner-occupied homes 104,088 19,982 Median value (dollars) 85,400 (X) 68,000 (X)119,600Median of selected monthly owner costs (X) (X) (X) (X)
With a mortgage (dollars) 1,048 (X) 921 (X) 1,088Not mortgaged (dollars) 388 (X) 374 (X) 295
(X) Not applicable. 374 (X) Source: U.S. Census Bureau, Summary File 1 (SF 1) and Summary File 3 (SF 3)

28
Maps
Onondaga County
29
Urban Development in Onondaga County 1960 – 2000

30
Syracuse Urban Areas 1950 - 2000
31
US Census Bureau 2000 Urbanized Areas
32
US Census Bureau 2000 Metropolitan Statistical Areas

33
Glossary
AGE GROUP – A collection of people.
AGE COHORT –Any group that enters a system in the same year or same time period. Birth/age is the most
common means for defining cohorts, but the concept can be used in other ways, e.g., marriage date, college
graduation date, or automobile mode date.
BABY BOOMER – A person born in the U.S. between 1946 and 1964.
CENTRAL CITY – In each metropolitan statistical area and consolidated metropolitan statistical area, the largest
place and, in some cases, one or more additional places are designated as ‘‘central cities.” The Syracuse
Metropolitan Statistical Area has two central cities: Auburn and Syracuse.
CENTRAL NEW YORK – As defined by NYS Department of Economic Development includes Cayuga,
Madison, Onondaga, Oswego, Cortland and Oneida Counties.
COUNTY-TO-COUNTY FLOW – These migration data come from the Census 2000 long-form question on
residence five years ago and contain the number of people who moved between counties. A data record was
produced for every combination of county-to-county migration flows in the United States of at least one person
between 1995 and 2000.2 Current county of residence is based on where the person was living on April 1st, 2000.
Previous county of residence is based on where the person was living five years earlier.
CENSUS –
AMERICAN COMMUNITY SURVEY (ACS) – This US Census Bureau survey replaces the decennial
census long form (see below) by providing annual (or multi-year average) estimates of selected social,
economic, and housing characteristics of the population for many geographic areas and subpopulations,
including the nation, states, and cities and counties of 250,000 or more, and eventually areas as small as census
tracts using multi-year averages. Sample size is about 800,000 addresses per year during the testing phase
(2000-2004); about three million housing units per year when fully implemented (planned for 2005). Data are
collected from about one-twelfth of the sample each month.
http://www.census.gov/population/www/socdemo/race/FS-race.html
CURRENT POPULATION SURVEY (CPS) – This US Census Bureau survey produces specific
socioeconomic and demographic estimates for the United States, and estimates for states for selected
characteristics and subpopulations. The annual sample size is about 100,000 addresses.
http://www.census.gov/population/www/socdemo/race/FS-race.html
DECENNIAL SURVEY - The census of population and housing, taken by the Census Bureau in each year
ending in zero. Article 1, Section 2 of the Constitution requires that a census be taken every 10 years for the
purpose of apportioning the U.S. House of Representatives. Other important uses of Census data include the
distribution of funds for government programs such as Medicaid; planning the right locations for schools, roads,
and other public facilities; helping real estate agents and potential residents learn about a neighborhood; and
identifying trends over time that can help predict future needs. Most Census data are available for many levels
of geography, including states, counties, cities and towns, ZIP codes, census tracts and blocks, and much more.
The 2000 and earlier decennial census are based on two forms: the short form that every person must fill out
and is, therefore, a 100 percent survey; and the long form with additional questions asked of a sample of
persons and housing units (generally one in six households).
http://factfinder.census.gov/jsp/saff/SAFFInfo.jsp?_pageId=sp4_decennial
ECONOMIC CENSUS - The collective name for the censuses of construction, manufactures, minerals,
minority- and women-owned businesses, retail trade, service industries, transportation, and wholesale trade,
conducted by the Census Bureau every five years in years ending in two and seven.

34
DENSITY – Population and housing unit density are computed by dividing the total population or number of
housing units within a geographic entity (for example, United States, state, county, place) by the land area of that
entity measured in square kilometers or square miles. Density is expressed as both ‘‘people (or housing units) per
square kilometer’’ and ‘‘people (or housing units) per square mile’’ of land area.
FIRST INNER RING SUBURB – In Onondaga County these are the towns suburbanized before 1950 and
include De Witt, Geddes, and Salina. Characterized by decreasing populations, higher population and housing
unit densities, and older housing stock.
HOUSEHOLD – A person or group of people who occupy a housing unit as their usual place of residence. The
number of households equals the number of occupied housing units in a census.
HOUSEHOLDER - The member of a household who lives at a housing unit and owns, is buying, or rents the
housing unit. If there is no such person present when the Census Bureau contacts the household, any household
member who is at least 15 years old can serve as the householder for the purposes of a census or survey.
HOUSING UNIT – A single-family house, townhouse, mobile home or trailer, apartment, group of rooms, or
single room that is occupied as a separate living quarters or, if vacant, is intended for occupancy as a separate
living quarters.
MIGRATION – A change of a household's or person's residence from 5 years ago.
DOMESTIC – Moves within the United States.
GROSS MIGRATION – The sum of in-migration and out-migration, or inflow and outflow, for an area for a
given period. The total amount of movement in and out of an area.
IMMIGRATION – Moves from one nation-state to another.
IN-MIGRATION – The number of migrants who moved into an area during a given period.
INTERCOUNTY – Moves between counties.
INTERNATIONAL – Moves between countries.
INTRACOUNTY – Moves within the same county.
NET IN-MIGRATION – More migrants entered an area than left it during that time.
NET MIGRATION – Difference between in-migration and out-migration, or inflow and outflow, during a
given time.
NET OUT-MIGRATION – More migrants left an area than entered it during that time.
OUT-MIGRATION – The number of migrants who moved out of an area during a given period.
RESIDENTIAL MOBILITY – Moves within a jurisdiction.
NATURAL CHANGE – The difference between births and deaths. Including the effects of migration (both in
and out) would give us Total Change.
POPULATION - All people living in a geographic area.
POPULATION ESTIMATES – Annual estimates are produced July 1 for each year after the last published
decennial census (2000), as well as for past decades. Existing data series such as births, deaths, and domestic and
international immigration are used to update the decennial census base counts.
POPULATION PROJECTIONS – Projections are estimates of the population for future dates. They illustrate
plausible courses of future population change based on assumptions about future births, deaths, international
migration, and domestic migration. Projected numbers are based on an estimated population consistent with the
most recent decennial census as enumerated, projected forward using a variant of the cohort-component method.
Notes: While projections and estimates may appear similar, there are some distinct differences between the two
35
measures. Estimates are for the past, while projections are based on assumptions about future demographic trends.
Estimates generally use existing data collected from various sources, while projections must assume what
demographic trends will be in the future.
METROPOLITAN AREA (MA) - Metropolitan areas (MA or metro areas) are defined by the Office of Budget
and Management. For the 2000 Census, metro areas were defined to include central counties with one or more
central cities of at least 50,000 residents or with an US Census Bureau-defined Urbanized Area of 50,000 or more
and total area population of at least 100,000. Outlying counties were included if they were both economically tied
to the central counties, as measured by daily commuting, and they displayed a level of "metropolitan character"
based on population density, urbanization, and population growth. A county with high "metropolitan character"
would be included with as little as 15 percent of its workers commuting. A county low in such attributes would be
regarded as nonmetro no matter how high the commuting linkage was to the central county or counties. Metro
areas were first defined in the 1950 decennial census using the same basic thresholds.
The definition of Metropolitan Area is changing. The Office of Management and Budget (OMB) was urged by
various sources in the last decade to delineate the entire land surface of the country into areas, and not leave the
territory outside of metro areas (nonmetro areas) as an undifferentiated residual, and in 2003 the Office of Budget
and Management introduced a new "core-based statistical area" system. Metro areas are now defined for all
urbanized areas (based on population density) regardless of the total area population. In addition, inclusion as an
outlying county is based on a single commuting threshold of 25 percent with no "metropolitan character" (based
on population density, urbanization, and population growth) requirement.
METROPOLITAN STATISTICAL AREA (MSA) - Metropolitan areas (MAs) that are not closely associated
with other MAs and are typically surrounded by non-metropolitan counties (referred to as county subdivisions in
New England).
RUST BELT - Urban areas in the Northeast and Middle West marked by the concentration of old, declining
industries, such as steel and textiles.
RURAL AREA - For Census 2000, all territory, population, and housing units located outside of urbanized areas
and urban clusters. Rural Areas basically includes open country and small settlements of less than 2,500 persons
URBAN AREA - Core census block groups or blocks that have a population density of at least 1,000 people per
square mile and surrounding census blocks that have an overall density of at least 500 people per square mile.
URBANIZED AREA – An urban area of 50,000 or more people. For the Census 2000 they were defined by
aggregations of block groups and census blocks. Urbanized areas have been delineated using the same basic
threshold (50,000 population) for each decennial census since 1950, but procedures for delineating the urban
fringe are more liberal today.
URBAN CLUSTER – An Urban area with fewer than 50,000 people, but more than 2,500. Added in the 2000
Census.