Embed Size (px)
Citation preview

2012-05-22
1
ETSF01: Software Engineering Process –
Economy and Quality
Dietmar Pfahl Lund University
ETSF01 / Lecture 1, 2012
Software Risks (from 12 surveys) Source: Top Ten Lists of Software Project Risks: Evidence from the Literature Survey by Tharwon Arnuphaptrairong, Proceedings of IMEC 2011, March 16-18, 2011, Hong Kong
2012-05-22
2
ETSF01 / Lecture 1, 2012
The Magic Triangle
Project
Quality and Scope
Time Effort (Cost)
Trade-offs!
ETSF01 / Lecture 1, 2012
Welcome to ETSF01!
• Mandatory for C and D students
• Requires ETSA01
• Size: 4 hp
• 6 Lectures – Last lecture: course review and
exam outlook • 1 Project • 5 Exercises (övningar)
– Related to project (à scheduled meetings with supervisor)
– Exam-relevant exercises to be done at home (à textbook)
• 1 Final exam
2012-05-22
3
ETSF01 / Lecture 1, 2012
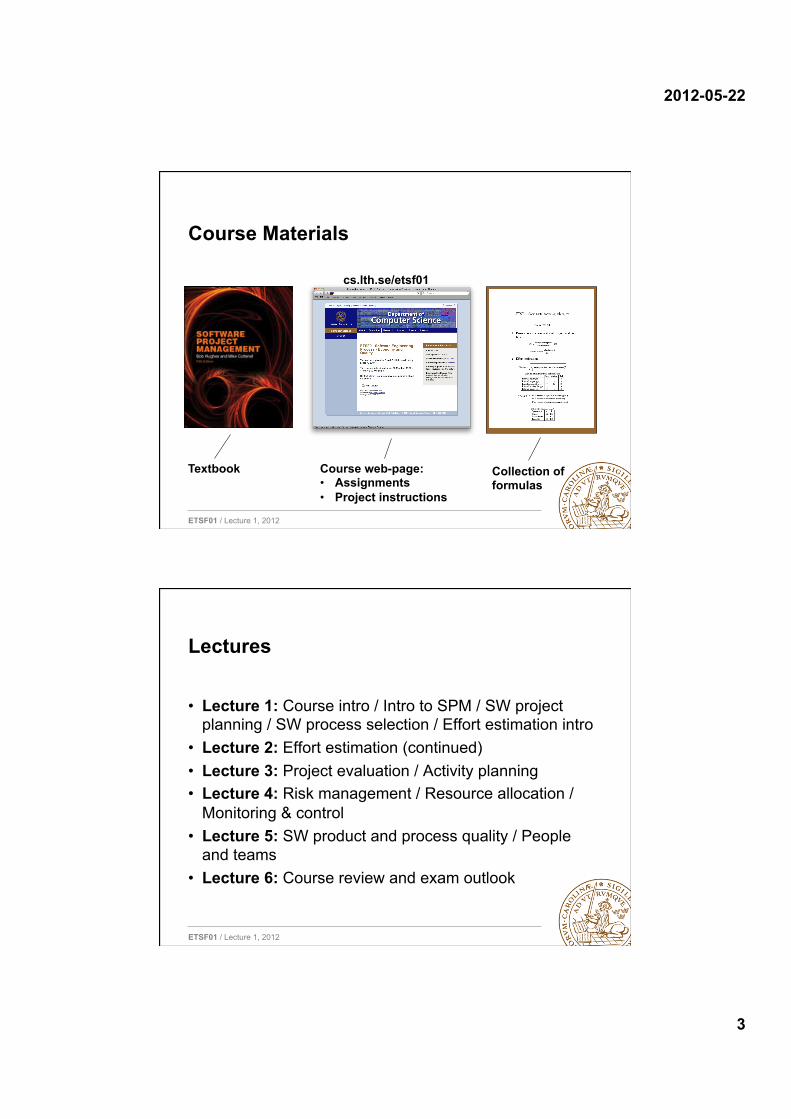
Course Materials
Course web-page: • Assignments • Project instructions
cs.lth.se/etsf01
Textbook Collection of formulas
ETSF01 / Lecture 1, 2012
Lectures
• Lecture 1: Course intro / Intro to SPM / SW project planning / SW process selection / Effort estimation intro
• Lecture 2: Effort estimation (continued) • Lecture 3: Project evaluation / Activity planning • Lecture 4: Risk management / Resource allocation /
Monitoring & control • Lecture 5: SW product and process quality / People
and teams • Lecture 6: Course review and exam outlook

2012-05-22
4
ETSF01 / Lecture 1, 2012
Final Exam
• Written ‘traditional’ exam: ‘open book’ – Last years’ examples are on course web
• More information will be given after the Easter break (Lecture 6)
ETSF01 / Lecture 1, 2012
Project
Objectives • connect theory to practice • give a concrete experience of
developing and using a tool for software cost estimation
• provide a group-learning setting focused on a realistic problem
Tasks • Task A: Design and
implementation of a tool for software effort estimation based on the Project Mission document (à Estimation by Analogy)
• Task B: Acceptance testing of a tool for software effort estimation developed by another development team.
The project comprises 50 hours per person and 85-90% of the total effort should be devoted to Task A. Each project team consists of 4-5 members.
ETSF01 Project Description
ETSF01 Project Mission (light-weight spec)
+

2012-05-22
5
ETSF01 / Lecture 1, 2012
Project – Schedule / Deliverables
• Wk1: Project Input / Group Forming • Wk2: Planning/Start of Iteration 1
• Wk3: End of Iteration 1 • Wk4: Start of Iteration 2 • Wk5: … • Wk6: End of Iteration 2 • Wk7: Acceptance Testing
Project Description Project Mission (PM)
Project Plan (PP) incl. Burndown Chart (BC1)
Burndown Chart (BC1) Tool Version 1 (TV1) User Manual (UM) draft Burndown Chart (BC2)
BC2, UM final, TV2 …
Acceptance Test Report (ATR) Retrospective Report (RR)
ETSF01 / Lecture 1, 2012
Information
• URL: cs.lth.se/etsf01 • Notice board: 2nd floor at the south-west elevator
(Building E) Group 01
Group 02
Group 03
Group 04
Group 05
Group 06
Group 07
Group 08
Group 09
Group 10
Group 11
Group 12
Group 13
Group 14
Group 15
Group 16
Group 17
Group 18
Group 19
Group 20
Group 21
Group 22
Group 23
Group 24
Thu 8-10 Thu 15-17 Fri 8-10 Fri 13-15
2012-05-22
6
ETSF01 / Lecture 1, 2012
Personnel
• Dietmar Pfahl, [email protected], 046-222 41 41, E:2408, Lectures, Projects, Exam
• Richard Berntsson Svensson, [email protected], 046-222 0368 E:2410, Projects
• Markus Borg, [email protected], 046-222 96 43, E:2418, Projects
• Mika Mäntylä, [email protected], 046-222 86 14, E:2406, Projects
• Lena Ohlsson, [email protected], 046-222 80 40, E:2179, Course Secretary
ETSF01 / Lecture 1, 2012
Student Representatives (kursombud)
• C: N. N. • C: N. N. • D: Julia Mauritsson • D: Peter Seimar

2012-05-22
7
ETSF01 / Lecture 1, 2012
Today’s Lecture (Part 1)
Chapters 1, 3, 4 Intro to SW project management SW project planning SW process selection
ETSF01 / Lecture 1, 2012
Plan with concrete People, activities, artifacts (Products)
Plan with concrete People, activities, artifacts (Products)
The six Ps in software engineering
• Product • Process • People • Program • Project • Plan
Process (= Project approach / method)
People (abstract, Roles)
Products (abstract)
Model World
Real World
Plan with concrete agents, activities, artifacts
Project Program
2012-05-22
8
ETSF01 / Lecture 1, 2012
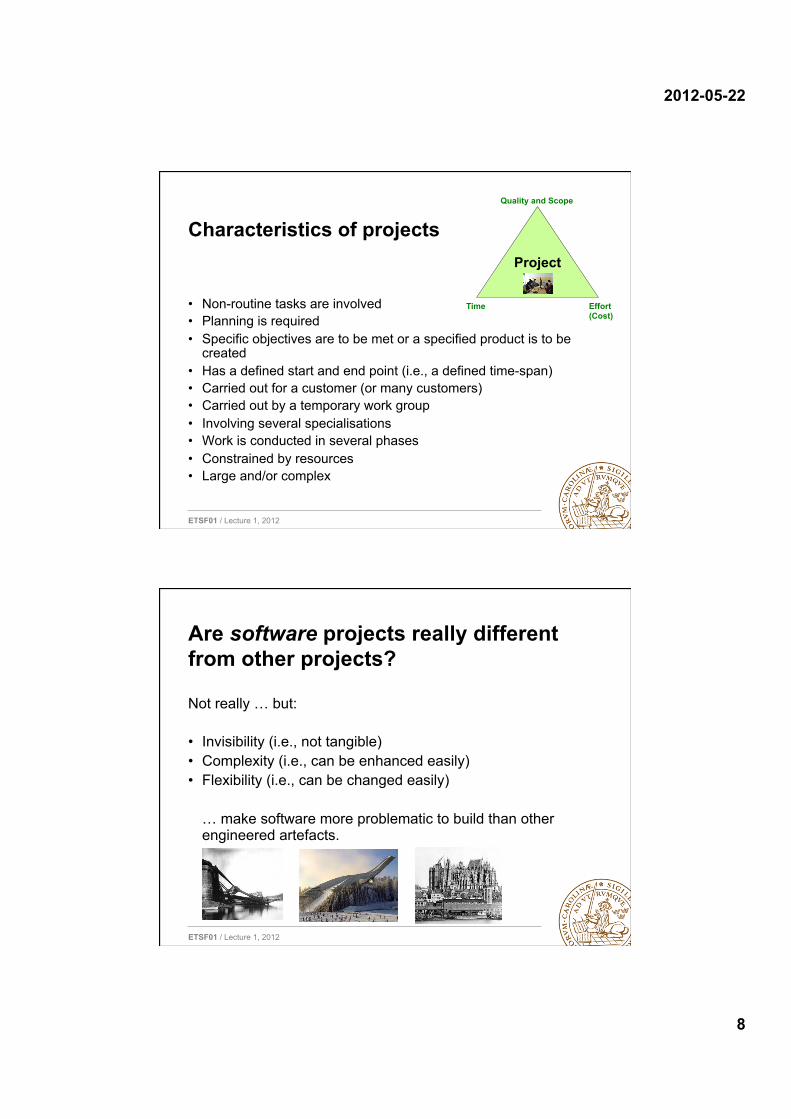
Characteristics of projects
• Non-routine tasks are involved • Planning is required • Specific objectives are to be met or a specified product is to be
created • Has a defined start and end point (i.e., a defined time-span) • Carried out for a customer (or many customers) • Carried out by a temporary work group • Involving several specialisations • Work is conducted in several phases • Constrained by resources • Large and/or complex
Project
Quality and Scope
Time Effort (Cost)
ETSF01 / Lecture 1, 2012
Are software projects really different from other projects?
Not really … but: • Invisibility (i.e., not tangible) • Complexity (i.e., can be enhanced easily) • Flexibility (i.e., can be changed easily)
… make software more problematic to build than other engineered artefacts.
2012-05-22
9
ETSF01 / Lecture 1, 2012
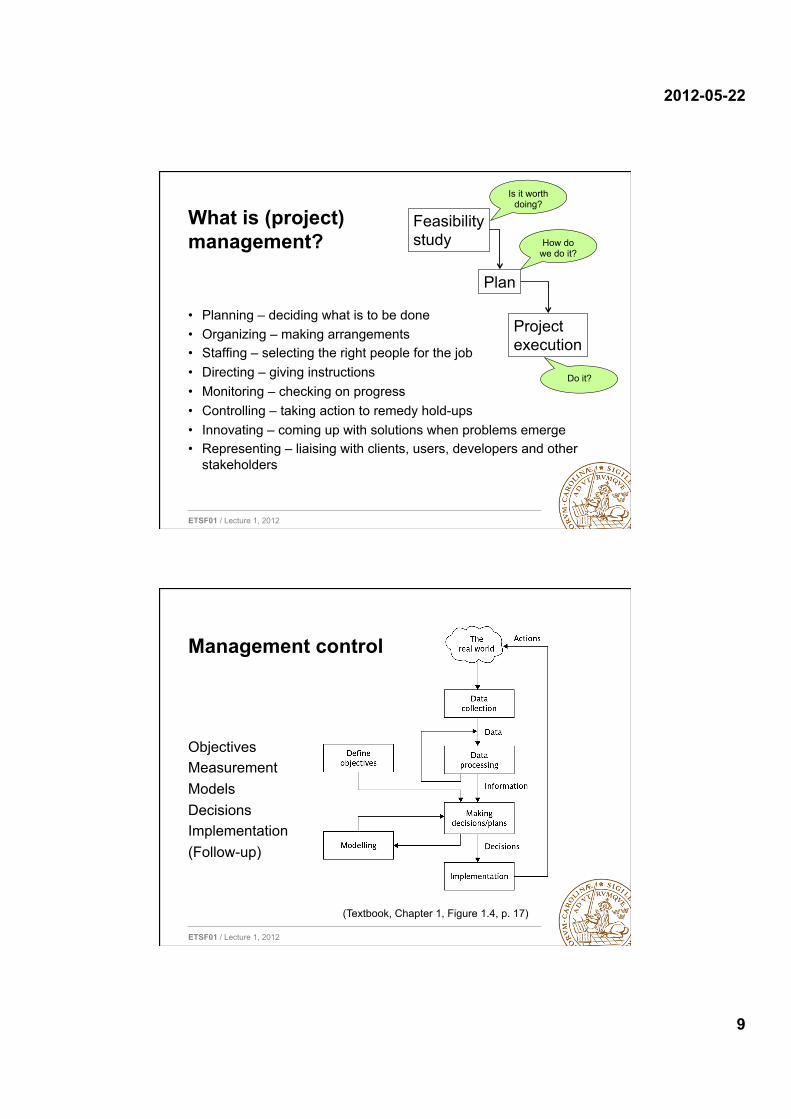
What is (project) management?
• Planning – deciding what is to be done • Organizing – making arrangements • Staffing – selecting the right people for the job • Directing – giving instructions • Monitoring – checking on progress • Controlling – taking action to remedy hold-ups • Innovating – coming up with solutions when problems emerge • Representing – liaising with clients, users, developers and other
stakeholders
Feasibility study
Plan
Project execution
Is it worth doing?
How do we do it?
Do it?
ETSF01 / Lecture 1, 2012
Management control
Objectives Measurement Models Decisions Implementation (Follow-up)
(Textbook, Chapter 1, Figure 1.4, p. 17)

2012-05-22
10
ETSF01 / Lecture 1, 2012
Project planning steps
0.Select project
1. Identify project objectives
2. Identify project infrastructure
3. Analyse project
characteristics
4. Identify products and activities
5. Estimate effort for activity
8. Review/ publicize plan
6. Identify activity risks
7. Allocate resources
9. Execute plan
10. Lower level planning
Review
Lower level detail
For each activity
(Textbook, Chapter 3, Figure 3.1, p. 51)
ETSF01 / Lecture 1, 2012
The software development life-cycle (ISO 12207)
(Textbook, Chapter 1, Figure 1.3, p. 7)
2012-05-22
11
ETSF01 / Lecture 1, 2012
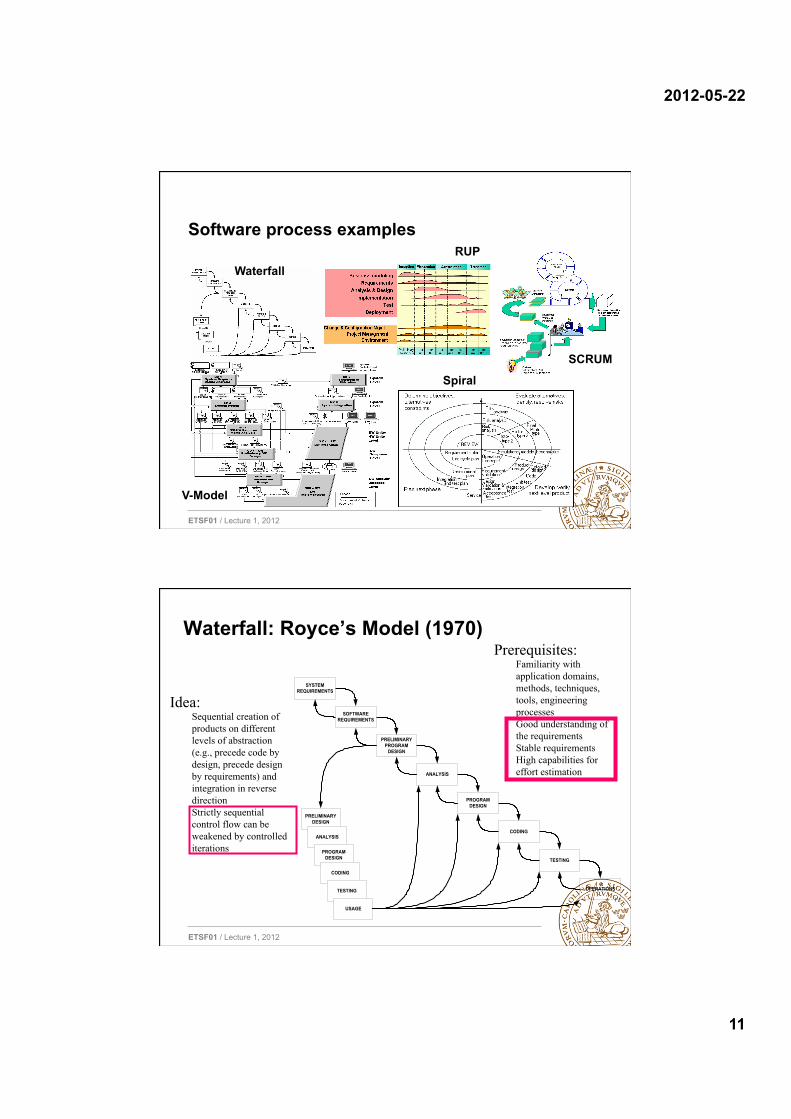
Software process examples
Waterfall
SCRUM
RUP
V-Model
Spiral
ETSF01 / Lecture 1, 2012
Waterfall: Royce’s Model (1970)
SYSTEM REQUIREMENTS
TESTING
CODING
PROGRAM DESIGN
ANALYSIS
PRELIMINARY PROGRAM
DESIGN
SOFTWARE REQUIREMENTS
OPERATIONS
PRELIMINARY DESIGN
ANALYSIS
PROGRAM DESIGN
CODING
TESTING
USAGE
Idea: Sequential creation of products on different levels of abstraction (e.g., precede code by design, precede design by requirements) and integration in reverse direction Strictly sequential control flow can be weakened by controlled iterations
Prerequisites: Familiarity with application domains, methods, techniques, tools, engineering processes Good understanding of the requirements Stable requirements High capabilities for effort estimation
2012-05-22
12
ETSF01 / Lecture 1, 2012
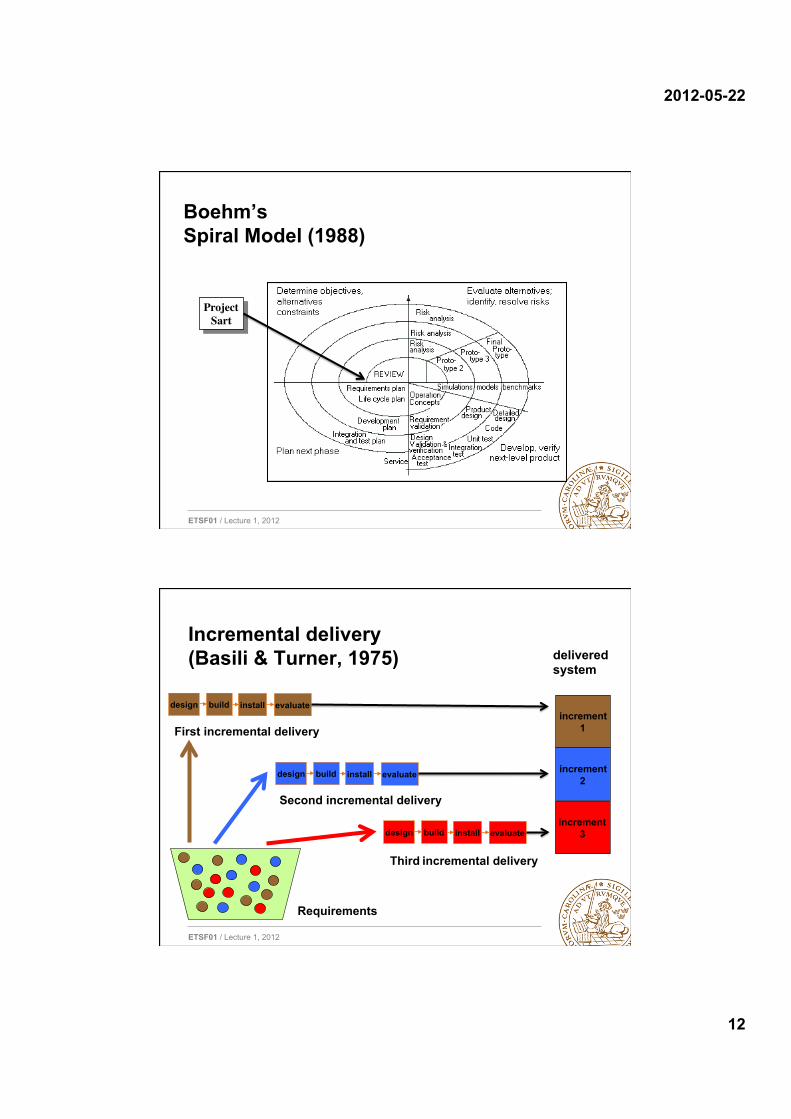
Boehm’s Spiral Model (1988)
Project Sart
ETSF01 / Lecture 1, 2012
Incremental delivery (Basili & Turner, 1975)
design build install evaluate
design build install evaluate
design build install evaluate
increment 1
increment 2
increment 3
First incremental delivery
Second incremental delivery
Third incremental delivery
delivered system
Requirements

2012-05-22
13
ETSF01 / Lecture 1, 2012
Rational Unified Process (RUP) (Jacobson, Rumbaugh, Booch, Kruchten, 1990s)
Iterations
Phases Process Workflows
Environment Project Management
Change & Configuration Mgmt
Elaboration Transition Inception Construction
Implementation Test
Analysis & Design
Deployment
Requirements Business modeling
Preliminary Iteration(s)
Iter. #1
Iter. #2
Iter. #n
Iter. #n+1
Iter. #n+2
Iter. #m
Iter. #m+1
Supporting Workflows
Organization along content
Organization along time
ETSF01 / Lecture 1, 2012
Extreme Programming – Evolutionary Process Model
2012-05-22
14
ETSF01 / Lecture 1, 2012
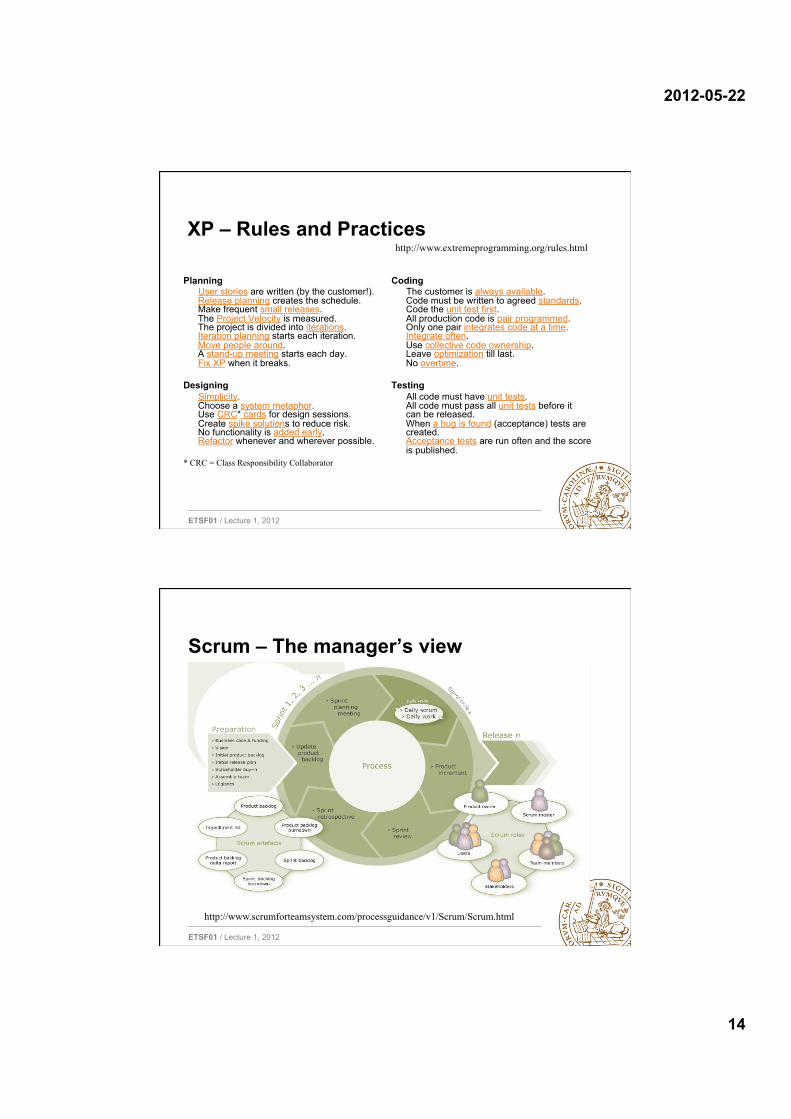
XP – Rules and Practices
Planning User stories are written (by the customer!). Release planning creates the schedule. Make frequent small releases. The Project Velocity is measured. The project is divided into iterations. Iteration planning starts each iteration. Move people around. A stand-up meeting starts each day. Fix XP when it breaks.
Designing
Simplicity. Choose a system metaphor. Use CRC* cards for design sessions. Create spike solutions to reduce risk. No functionality is added early. Refactor whenever and wherever possible.
Coding The customer is always available. Code must be written to agreed standards. Code the unit test first. All production code is pair programmed. Only one pair integrates code at a time. Integrate often. Use collective code ownership. Leave optimization till last. No overtime.
Testing
All code must have unit tests. All code must pass all unit tests before it can be released. When a bug is found (acceptance) tests are created. Acceptance tests are run often and the score is published.
http://www.extremeprogramming.org/rules.html
* CRC = Class Responsibility Collaborator
ETSF01 / Lecture 1, 2012
Scrum – The manager’s view
http://www.scrumforteamsystem.com/processguidance/v1/Scrum/Scrum.html

2012-05-22
15
ETSF01 / Lecture 1, 2012
Scrum – Roles: ”Pigs” and ”Chicken”
"Pig" roles • Pigs are the ones committed to the
project in the Scrum process; they are the ones with "their bacon on the line".
– Product Owner – Scrum Master (or
Facilitator) – Team
"Chicken" roles • Chicken roles are not part of the
actual Scrum process, but must be taken into account.
– Users – Stakeholders (customers,
vendors) – Managers
• Note: An important aspect of an Agile approach is the practice of involving users, business and stakeholders into part of the process. It is important for these people to be engaged and provide feedback into the outputs for review and planning of each sprint.
ETSF01 / Lecture 1, 2012
Scrum Sprints (= Iterations in XP)
Daily Scrum
Sprin
t Rev
iew
Mee
ting
Sprin
t Ret
rosp
ectiv
e Sp
rint P
lann
ing
Mee
ting
Sprin
t Pla
nnin
g M
eetin
g
15 min daily
~1 hour
1 day for a 4 week Sprint

2012-05-22
16
ETSF01 / Lecture 1, 2012
Sprint planning meeting
Sprint prioritization
• Analyze and evaluate product backlog
• Select sprint goal
Sprint planning
• Decide how to achieve sprint goal (design)
• Create sprint backlog (tasks) from product backlog items (user stories / features)
• Estimate sprint backlog in hours
Sprint goal
Business conditions
Team capacity
Sprint backlog
Product backlog
Technology
Current product
ETSF01 / Lecture 1, 2012
Sprint Planning Meeting
• Team selects items from the product backlog they commit to complete • Sprint backlog is created
– Tasks are identified and each is estimated (1-16 hours) – Collaboratively, not done alone by the Scrum Master
• Estimation technique could be ‘Planning Poker’ • High-level design is considered
As a vacation planner, I want to see photos of the hotels.
Code the middle tier (8 hours) Code the user interface (4) Write test fixtures (4) Code the foo class (6) Update performance tests (4)
Daily Scrum
Sprin
t Rev
iew
Mee
ting
Sprin
t Ret
rosp
ectiv
e Sp
rint P
lann
ing
Mee
ting
Sprin
t Pla
nnin
g M
eetin
g
15 min daily
~1 hour
1 day for a 4 week Sprint

2012-05-22
17
ETSF01 / Lecture 1, 2012
Daily Scrum
• Parameters – Daily – 15-minutes – Stand-up
• Not for problem solving – Whole world is invited – Only team members,
Scrum Master, product owner, can talk
• Helps avoid other unnecessary meetings
Daily Scrum
Sprin
t Rev
iew
Mee
ting
Sprin
t Ret
rosp
ectiv
e Sp
rint P
lann
ing
Mee
ting
Sprin
t Pla
nnin
g M
eetin
g
15 min daily
~1 hour
1 day for a 4 week Sprint
ETSF01 / Lecture 1, 2012
Daily Scrum – 3 Questions
NB: • These
questions are not status reports for the Scrum Master
• They are commitments in front of peers
What did you do yesterday? 1
What will you do today? 2
Is anything in your way? 3
Daily Scrum
Sprin
t Rev
iew
Mee
ting
Sprin
t Ret
rosp
ectiv
e Sp
rint P
lann
ing
Mee
ting
Sprin
t Pla
nnin
g M
eetin
g
15 min daily
~1 hour
1 day for a 4 week Sprint
2012-05-22
18
ETSF01 / Lecture 1, 2012
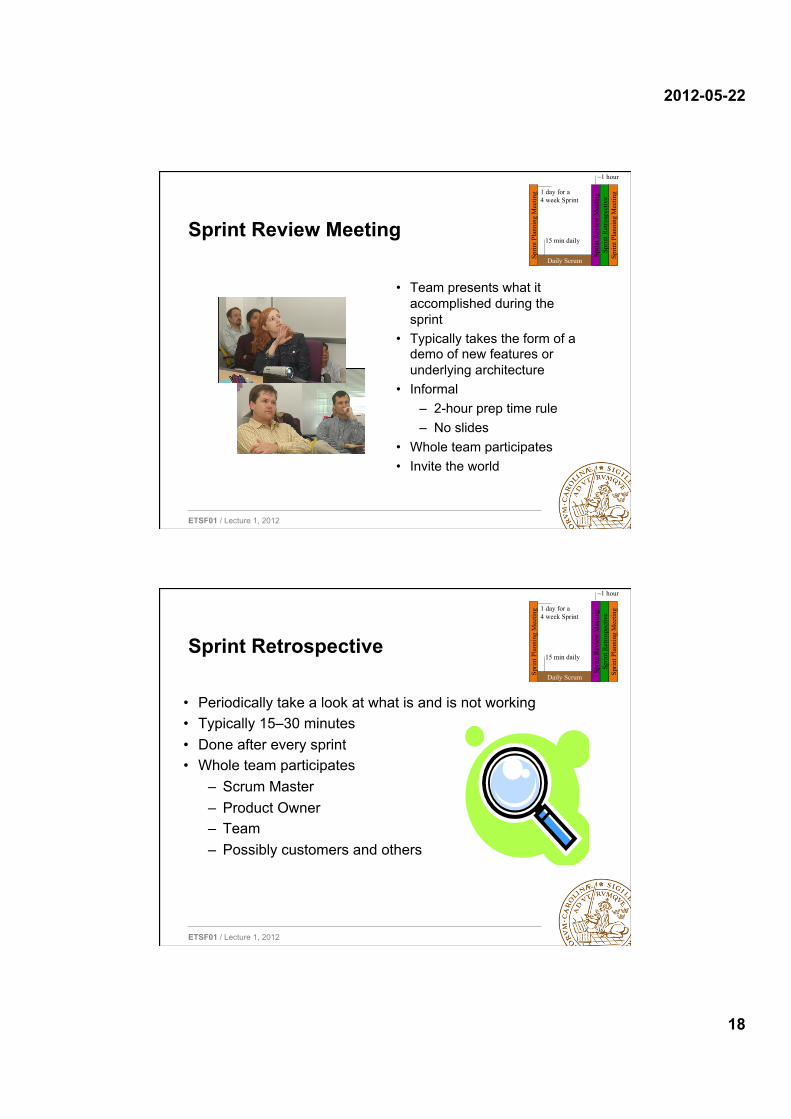
Sprint Review Meeting
• Team presents what it accomplished during the sprint
• Typically takes the form of a demo of new features or underlying architecture
• Informal – 2-hour prep time rule – No slides
• Whole team participates • Invite the world
Daily Scrum
Sprin
t Rev
iew
Mee
ting
Sprin
t Ret
rosp
ectiv
e Sp
rint P
lann
ing
Mee
ting
Sprin
t Pla
nnin
g M
eetin
g
15 min daily
~1 hour
1 day for a 4 week Sprint
ETSF01 / Lecture 1, 2012
Sprint Retrospective
• Periodically take a look at what is and is not working • Typically 15–30 minutes • Done after every sprint • Whole team participates
– Scrum Master – Product Owner – Team – Possibly customers and others
Daily Scrum
Sprin
t Rev
iew
Mee
ting
Sprin
t Ret
rosp
ectiv
e Sp
rint P
lann
ing
Mee
ting
Sprin
t Pla
nnin
g M
eetin
g
15 min daily
~1 hour
1 day for a 4 week Sprint

2012-05-22
19
ETSF01 / Lecture 1, 2012
Scrum – Main Artifacts
• Product backlog • Sprint backlog • Burndown chart
Backlog item Estimate
Allow a guest to make a reservation 3
As a guest, I want to cancel a reservation. 5
As a guest, I want to change the dates of a reservation. 3
As a hotel employee, I can run RevPAR reports (revenue-per-available-room) 8
Improve exception handling 8
... 30
... 50
Tasks!Code the user interface!
Code the middle tier!
Test the middle tier!
Write online help!
Write the foo class!
Mon!8!
16!
8!
12!
8!
Tues!4!
12!
16!
8!
Wed! Thur!
4!
11!
8!
4!
Fri!
8!
8!
Add error logging!
8!
10!
16!
8!
8!
ETSF01 / Lecture 1, 2012
Sprint Burndown Chart – Example
(per
son-
hour
s)

2012-05-22
20
ETSF01 / Lecture 1, 2012
‘Rules of thumb’ for selecting process
• IF uncertainty and complexity both low – THEN use waterfall process
• IF complexity is high but uncertainty is not – THEN use incremental process
• IF uncertainty is high – THEN use evolutionary/agile process
• IF schedule is tight/fixed – THEN use incremental or evolutionary/agile
approach • …
ETSF01 / Lecture 1, 2012
To be Agile or not to be Agile?
Source: Boehm, B.; Turner, R.; Observations on balancing discipline and agility, Proceedings of the Agile Development Conference, 2003. ADC 2003. Page(s):32-39
2012-05-22
21
ETSF01 / Lecture 1, 2012
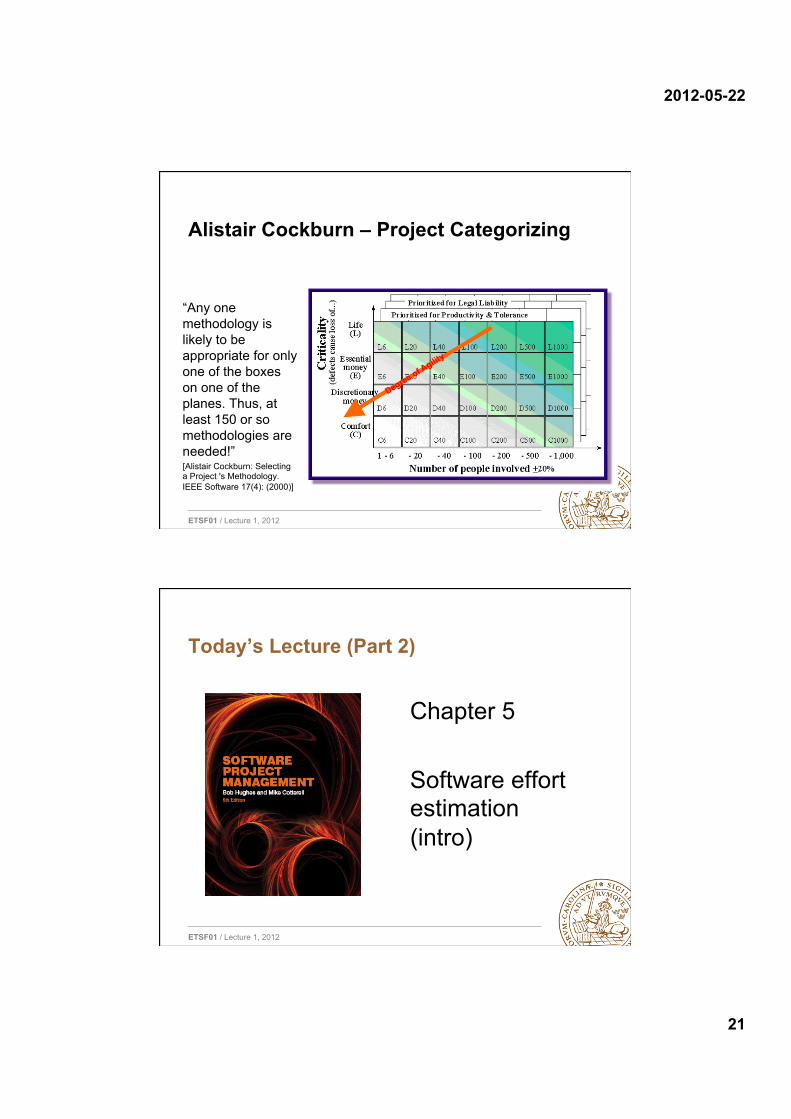
Alistair Cockburn – Project Categorizing
“Any one methodology is likely to be appropriate for only one of the boxes on one of the planes. Thus, at least 150 or so methodologies are needed!” [Alistair Cockburn: Selecting a Project 's Methodology. IEEE Software 17(4): (2000)]
Degree of Agility
ETSF01 / Lecture 1, 2012
Today’s Lecture (Part 2)
Chapter 5 Software effort estimation (intro)
2012-05-22
22
ETSF01 / Lecture 1, 2012
Cost/Schedule Estimation – Basic Idea
• Software cost/schedule estimation is the process of predicting the amount of effort (cost) required to build a software system and the time (schedule) to develop it.
• Project Cost:
– Hardware costs. – Travel and training costs. – Work costs (based on the effort spent by engineers).
• Project Schedule: – Elapsed time (in hours, days, weeks, months)
ETSF01 / Lecture 1, 2012
Typical problems with estimating
• Subjective nature of estimating – It may be difficult to produce evidence supporting assumptions
about cost (schedule) drivers • Political pressures
– Managers may wish to reduce estimated costs in order to win a project proposal
– Developers may wish to increase estimates to safeguard themselves from unforeseen (unforeseeable) risks
• Changing technologies – They involve risks (uncertainties), especially in the beginning when
there is a ‘learning curve’ • Projects differ
– Lessons learnt in one project may not be transferable to another
2012-05-22
23
ETSF01 / Lecture 1, 2012
Estimation Techniques – Main Types
Cost/Schedule Estimation Techniques
Expert Judgment Algorithmic/ Parametric Models
Empirical Factor Models: - COCOMO / COCOMO II - ESTIMACS - PRICE S - Softcost - DOTY - CheckPoint - etc.
Constraint Models: - SLIM - Jensen Model - COPMO - etc.
Analogy
Machine Learning: - Case-Based Reasoning - Collaborative Filtering - Classification Systems - etc.
Other
Parkinson’s Law Pricing-to-Win Top-Down Estimation Bottom-Up Estimation
- Delphi-Method - Planning Poker - …
ETSF01 / Lecture 1, 2012
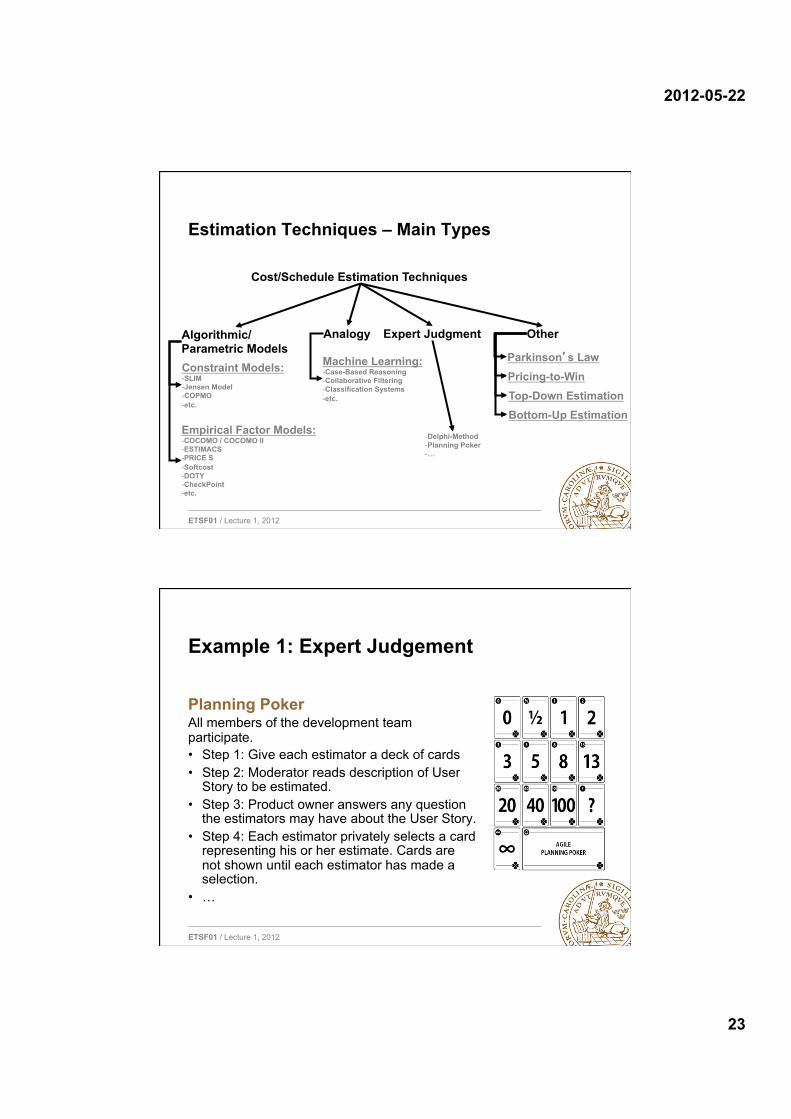
Example 1: Expert Judgement
Planning Poker All members of the development team participate. • Step 1: Give each estimator a deck of cards • Step 2: Moderator reads description of User
Story to be estimated. • Step 3: Product owner answers any question
the estimators may have about the User Story. • Step 4: Each estimator privately selects a card
representing his or her estimate. Cards are not shown until each estimator has made a selection.
• …
2012-05-22
24
ETSF01 / Lecture 1, 2012
Planning Poker (cont’d)
• Step 5: When everyone has made an estimate, the cards are simultaneously turned over.
• Step 6: If estimates differ, the highest and lowest estimates are explained by the estimators - otherwise the estimation is completed for this User Story.
• Step 7: The group discusses the story and their estimates for a few more minutes. The moderator can take any notes he/she thinks will be helpful when this story is being programmed and tested. After the discussion, each estimator re-estimates by selecting a card.
Note: In many cases, the estimates will already converge by the second round. But if they have not, continue to repeat the process. The goal is for the estimators to converge on a single estimate that can be used for the story. It rarely takes more than three rounds, but continue the process as long as estimates are moving closer together.
ETSF01 / Lecture 1, 2012
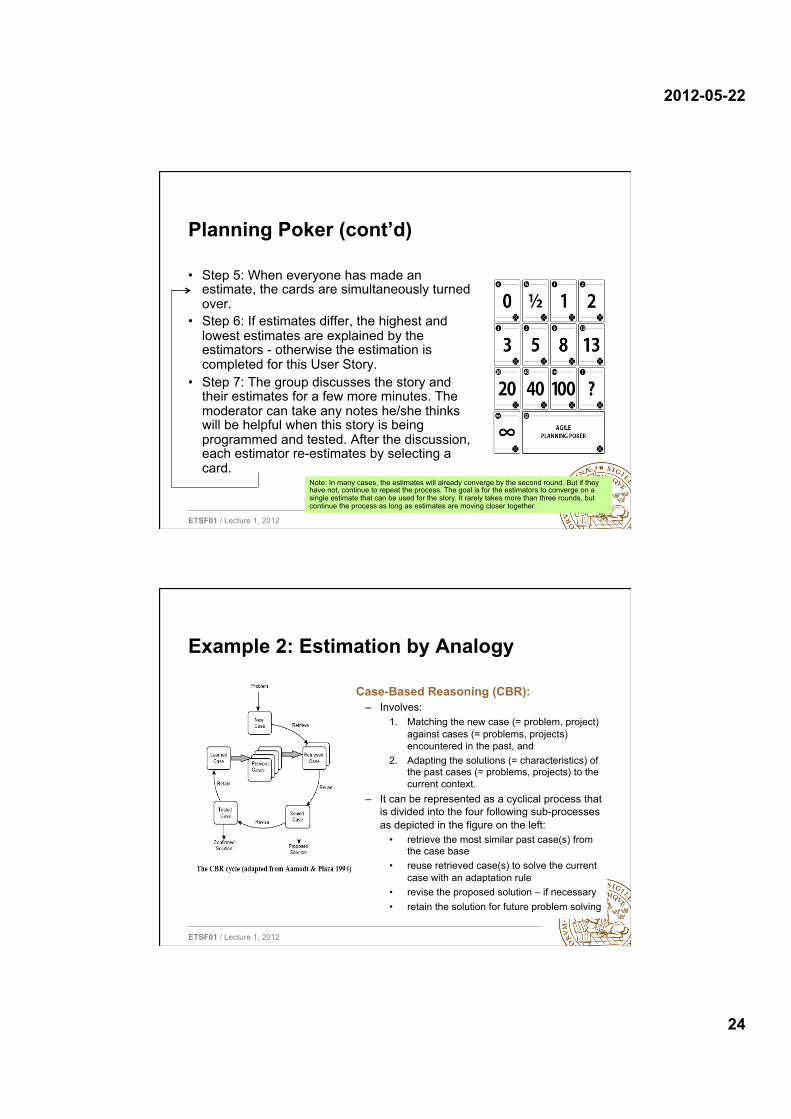
Example 2: Estimation by Analogy
Case-Based Reasoning (CBR): – Involves:
1. Matching the new case (= problem, project) against cases (= problems, projects) encountered in the past, and
2. Adapting the solutions (= characteristics) of the past cases (= problems, projects) to the current context.
– It can be represented as a cyclical process that is divided into the four following sub-processes as depicted in the figure on the left:
• retrieve the most similar past case(s) from the case base
• reuse retrieved case(s) to solve the current case with an adaptation rule
• revise the proposed solution – if necessary • retain the solution for future problem solving

2012-05-22
25
ETSF01 / Lecture 1, 2012
Example 2: Estimation by Analogy
Case-Based Reasoning (CBR): – Involves:
1. Matching the new case (= problem, project) against cases (= problems, projects) encountered in the past, and
2. Adapting the solutions (= characteristics) of the past cases (= problems, projects) to the current context.
– It can be represented as a cyclical process that is divided into the four following sub-processes as depicted in the figure on the left:
• retrieve the most similar past case(s) from the case base
• reuse retrieved case(s) to solve the current case with an adaptation rule
• revise the proposed solution – if necessary • retain the solution for future problem solving
Similarity Function
ETSF01 / Lecture 1, 2012
Example 2: Estimation by Analogy
Case-Based Reasoning (CBR): – Involves:
1. Matching the new case (= problem, project) against cases (= problems, projects) encountered in the past, and
2. Adapting the solutions (= characteristics) of the past cases (= problems, projects) to the current context.
– It can be represented as a cyclical process that is divided into the four following sub-processes as depicted in the figure on the left:
• retrieve the most similar past case(s) from the case base
• reuse retrieved case(s) to solve the current case with an adaptation rule
• revise the proposed solution – if necessary • retain the solution for future problem solving
Adaptation Rule
2012-05-22
26
ETSF01 / Lecture 1, 2012
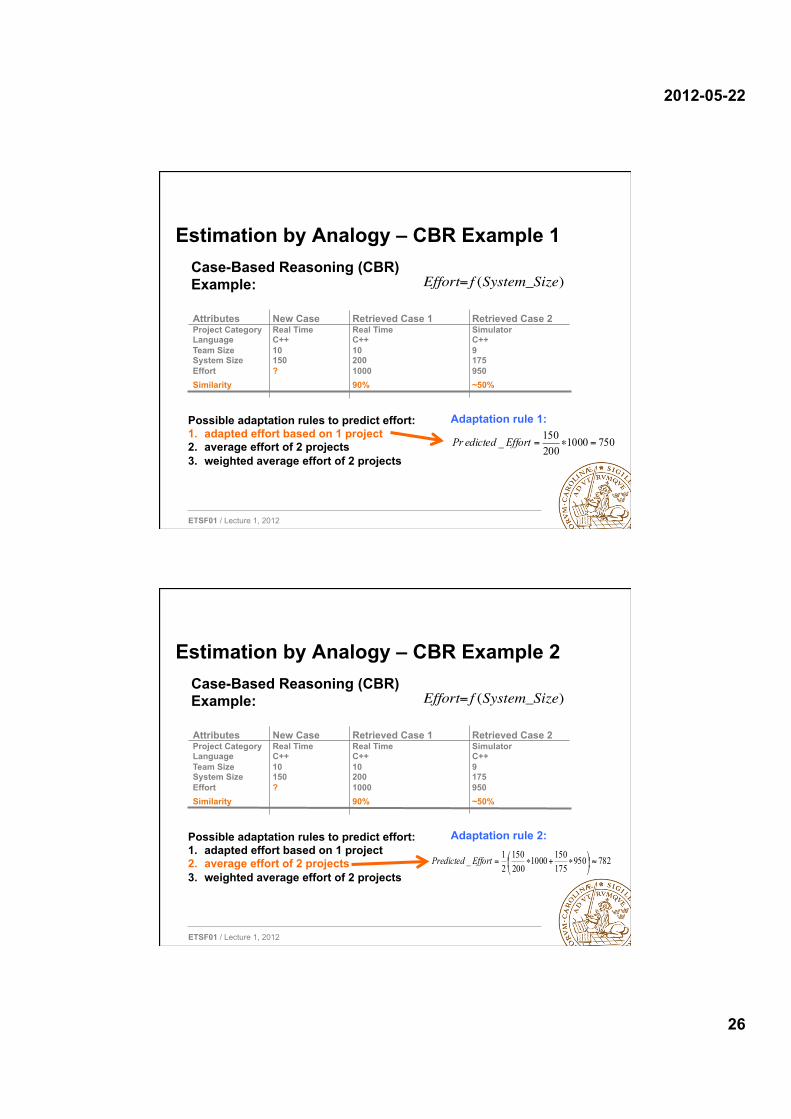
Estimation by Analogy – CBR Example 1 Case-Based Reasoning (CBR) Example:
Attributes New Case Retrieved Case 1 Retrieved Case 2 Project Category Real Time Real Time Simulator Language C++ C++ C++ Team Size 10 10 9 System Size 150 200 175 Effort ? 1000 950 Similarity 90% ~50%
Adaptation rule 1: 7501000
200150
=∗=Effort_edictedPr
Possible adaptation rules to predict effort: 1. adapted effort based on 1 project 2. average effort of 2 projects 3. weighted average effort of 2 projects
Effort= f (System_Size)
ETSF01 / Lecture 1, 2012
Estimation by Analogy – CBR Example 2 Case-Based Reasoning (CBR) Example:
Attributes New Case Retrieved Case 1 Retrieved Case 2 Project Category Real Time Real Time Simulator Language C++ C++ C++ Team Size 10 10 9 System Size 150 200 175 Effort ? 1000 950 Similarity 90% ~50%
Adaptation rule 2: Possible adaptation rules to predict effort: 1. adapted effort based on 1 project 2. average effort of 2 projects 3. weighted average effort of 2 projects
7829501751501000
200150
21_ ≈⎟
⎠
⎞⎜⎝
⎛ ∗+∗=EffortedictedPr
Effort= f (System_Size)

2012-05-22
27
ETSF01 / Lecture 1, 2012
Estimation by Analogy – CBR Example 3 Case-Based Reasoning (CBR) Example:
Attributes New Case Retrieved Case 1 Retrieved Case 2 Project Category Real Time Real Time Simulator Language C++ C++ C++ Team Size 10 10 9 System Size 150 200 175 Effort ? 1000 950 Similarity 90% ~50%
Adaptation rule 3:
Possible adaptation rules to predict effort: 1. adapted effort based on 1 project 2. average effort of 2 projects 3. weighted average effort of 2 projects
773145*950
175150
149*1000
200150_Pr ≈∗+∗=Effortedicted
Effort= f (System_Size)
ETSF01 / Lecture 1, 2012
Estimation by Analogy – CBR Examples Similarity(Pnew, P1): Distance Measure (Euclidean Distance) à Similarity = 1 – Distance
n
)P,P()P,P(cetandis
n
kjkik
ji
∑== 1
δ
⎪⎪⎪
⎩
⎪⎪⎪
⎨
⎧
≠=
⎟⎟
⎠
⎞
⎜⎜
⎝
⎛
−
−
=
jkik
jkik
kk
jkik
jkik
PPANDlcategoricakif,PPANDlcategoricakif,
continuouskifminmaxPP
)P,P(10
2
δ
P.,k Pnew,k P1,k δ(Pnew,k, P1,k) Project Category Real Time Real Time 0 Language C++ C++ 0 Team Size 10 10 0 System Size 150 200 0.04=(50/250)2
⇒ similarity(Pnew, P1) = 1 – distance(Pnew, P1) = 1 – sqrt(0.04/4) = 0.1 Note: We know that smallest system in DB has size=100 and largest system has size=350 à max – min = 250
2012-05-22
28
ETSF01 / Lecture 1, 2012
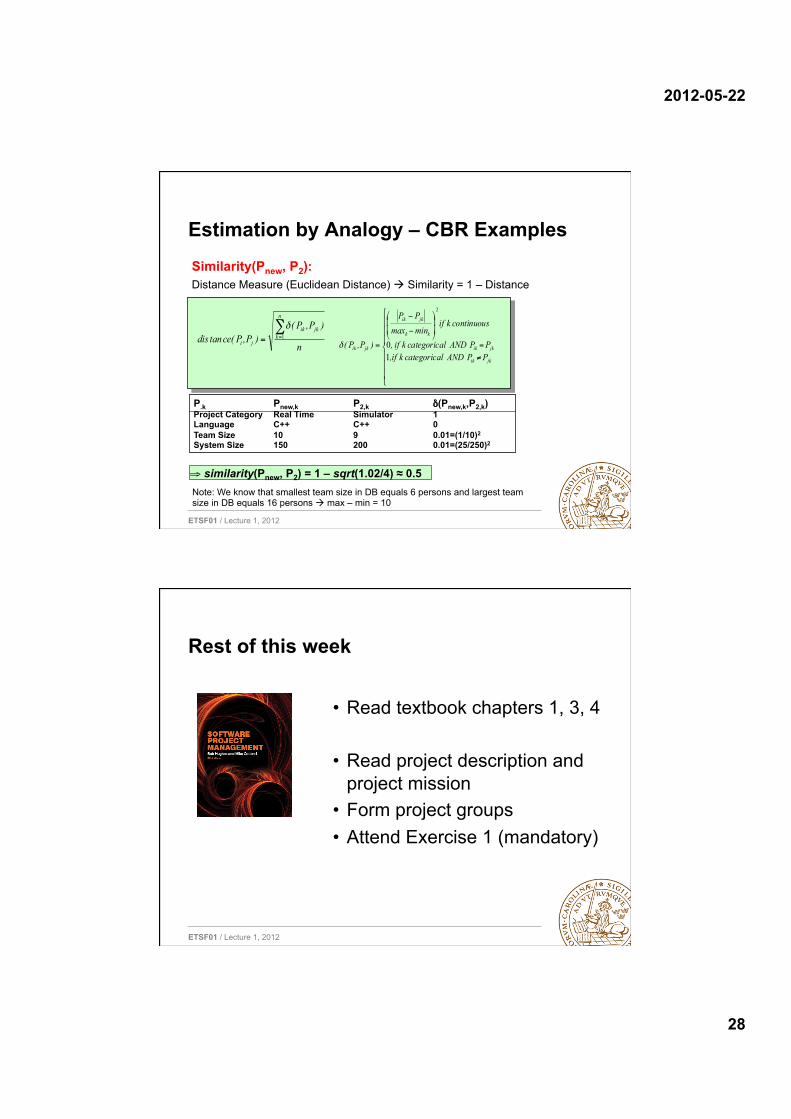
Estimation by Analogy – CBR Examples Similarity(Pnew, P2): Distance Measure (Euclidean Distance) à Similarity = 1 – Distance
n
)P,P()P,P(cetandis
n
kjkik
ji
∑== 1
δ
⎪⎪⎪
⎩
⎪⎪⎪
⎨
⎧
≠=
⎟⎟
⎠
⎞
⎜⎜
⎝
⎛
−
−
=
jkik
jkik
kk
jkik
jkik
PPANDlcategoricakif,PPANDlcategoricakif,
continuouskifminmaxPP
)P,P(10
2
δ
P.k Pnew,k P2,k δ(Pnew,k,P2,k) Project Category Real Time Simulator 1 Language C++ C++ 0 Team Size 10 9 0.01=(1/10)2
System Size 150 200 0.01=(25/250)2
⇒ similarity(Pnew, P2) = 1 – sqrt(1.02/4) ≈ 0.5 Note: We know that smallest team size in DB equals 6 persons and largest team size in DB equals 16 persons à max – min = 10
ETSF01 / Lecture 1, 2012
Rest of this week
• Read textbook chapters 1, 3, 4
• Read project description and project mission
• Form project groups • Attend Exercise 1 (mandatory)

2012-05-22
29
ETSF01 / Lecture 1, 2012
Next week
• Read textbook chapter 5 • Read Project Mission • Write & submit project plan (PP) • Meet project supervisors


![ETSF01 - Lecture 1 - ut · Lecture 11: Agile/Lean Methods Dietmar Pfahl email: dietmar.pfahl@ut.ee Fall 2014 ... System.out.println("main"); public double Balance { String[] args](https://img.pdfslide.us/doc/110x75/5af960327f8b9ad2208dc52a/etsf01-lecture-1-ut-11-agilelean-methods-dietmar-pfahl-email-dietmarpfahlutee.jpg)