Embed Size (px)
Citation preview
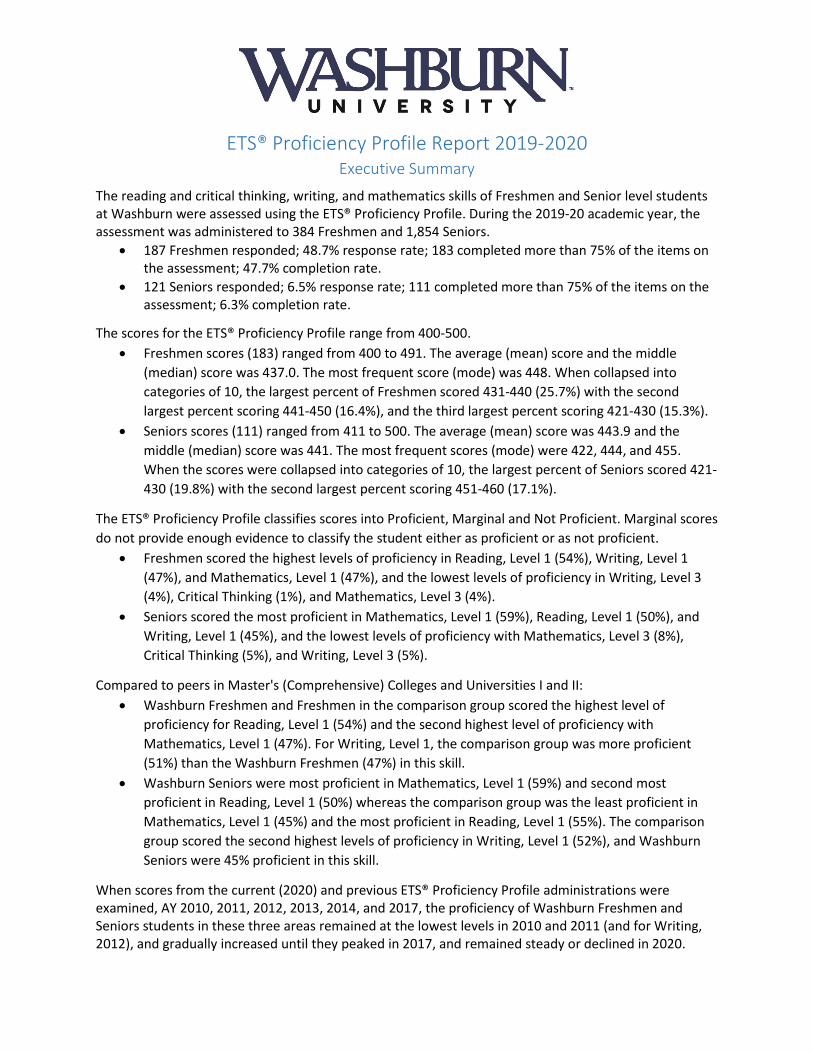
ETS® Proficiency Profile Report 2019-2020 Executive Summary
The reading and critical thinking, writing, and mathematics skills of Freshmen and Senior level students at Washburn were assessed using the ETS® Proficiency Profile. During the 2019‐20 academic year, the assessment was administered to 384 Freshmen and 1,854 Seniors.
• 187 Freshmen responded; 48.7% response rate; 183 completed more than 75% of the items on the assessment; 47.7% completion rate.
• 121 Seniors responded; 6.5% response rate; 111 completed more than 75% of the items on the assessment; 6.3% completion rate.
The scores for the ETS® Proficiency Profile range from 400‐500. • Freshmen scores (183) ranged from 400 to 491. The average (mean) score and the middle
(median) score was 437.0. The most frequent score (mode) was 448. When collapsed into categories of 10, the largest percent of Freshmen scored 431‐440 (25.7%) with the second largest percent scoring 441‐450 (16.4%), and the third largest percent scoring 421‐430 (15.3%).
• Seniors scores (111) ranged from 411 to 500. The average (mean) score was 443.9 and the middle (median) score was 441. The most frequent scores (mode) were 422, 444, and 455. When the scores were collapsed into categories of 10, the largest percent of Seniors scored 421‐430 (19.8%) with the second largest percent scoring 451‐460 (17.1%).
The ETS® Proficiency Profile classifies scores into Proficient, Marginal and Not Proficient. Marginal scores do not provide enough evidence to classify the student either as proficient or as not proficient.
• Freshmen scored the highest levels of proficiency in Reading, Level 1 (54%), Writing, Level 1 (47%), and Mathematics, Level 1 (47%), and the lowest levels of proficiency in Writing, Level 3 (4%), Critical Thinking (1%), and Mathematics, Level 3 (4%).
• Seniors scored the most proficient in Mathematics, Level 1 (59%), Reading, Level 1 (50%), and Writing, Level 1 (45%), and the lowest levels of proficiency with Mathematics, Level 3 (8%), Critical Thinking (5%), and Writing, Level 3 (5%).
Compared to peers in Master's (Comprehensive) Colleges and Universities I and II: • Washburn Freshmen and Freshmen in the comparison group scored the highest level of
proficiency for Reading, Level 1 (54%) and the second highest level of proficiency with Mathematics, Level 1 (47%). For Writing, Level 1, the comparison group was more proficient (51%) than the Washburn Freshmen (47%) in this skill.
• Washburn Seniors were most proficient in Mathematics, Level 1 (59%) and second most proficient in Reading, Level 1 (50%) whereas the comparison group was the least proficient in Mathematics, Level 1 (45%) and the most proficient in Reading, Level 1 (55%). The comparison group scored the second highest levels of proficiency in Writing, Level 1 (52%), and Washburn Seniors were 45% proficient in this skill.
When scores from the current (2020) and previous ETS® Proficiency Profile administrations were examined, AY 2010, 2011, 2012, 2013, 2014, and 2017, the proficiency of Washburn Freshmen and Seniors students in these three areas remained at the lowest levels in 2010 and 2011 (and for Writing, 2012), and gradually increased until they peaked in 2017, and remained steady or declined in 2020.
ETS® Proficiency Profile Report 2019‐2020 2 Washburn University, Office of Academic Affairs August 5, 2020
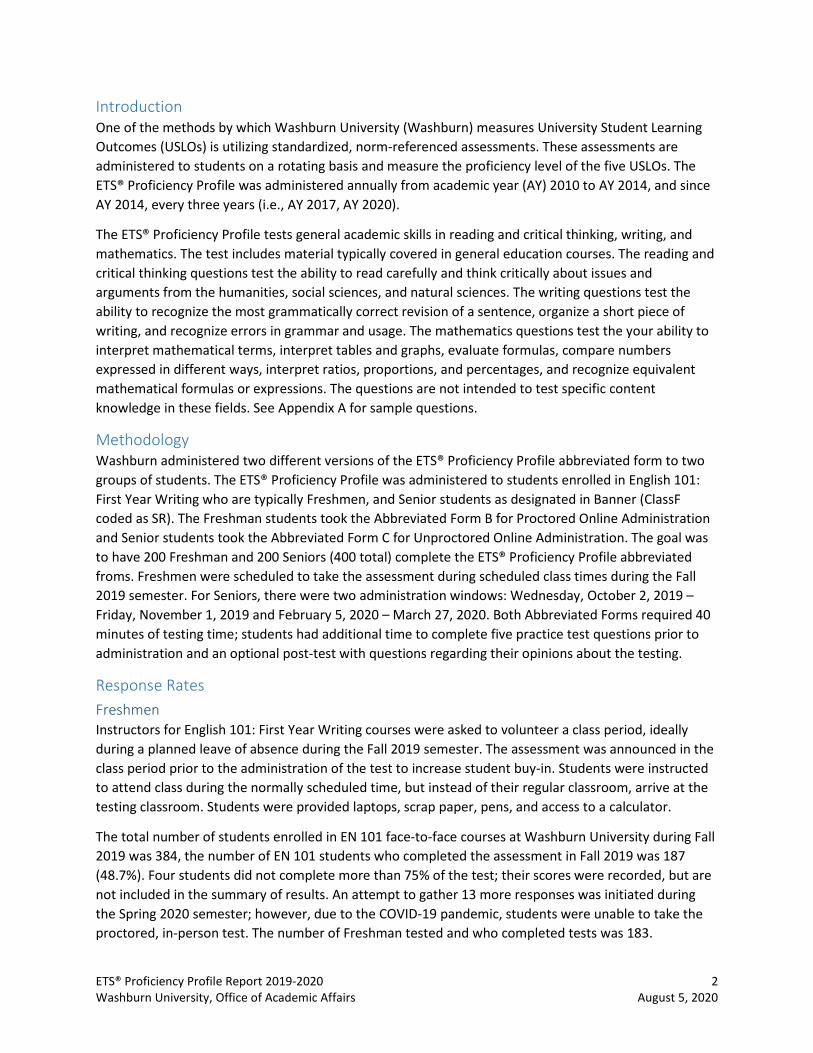
Introduction One of the methods by which Washburn University (Washburn) measures University Student Learning Outcomes (USLOs) is utilizing standardized, norm‐referenced assessments. These assessments are administered to students on a rotating basis and measure the proficiency level of the five USLOs. The ETS® Proficiency Profile was administered annually from academic year (AY) 2010 to AY 2014, and since AY 2014, every three years (i.e., AY 2017, AY 2020).
The ETS® Proficiency Profile tests general academic skills in reading and critical thinking, writing, and mathematics. The test includes material typically covered in general education courses. The reading and critical thinking questions test the ability to read carefully and think critically about issues and arguments from the humanities, social sciences, and natural sciences. The writing questions test the ability to recognize the most grammatically correct revision of a sentence, organize a short piece of writing, and recognize errors in grammar and usage. The mathematics questions test the your ability to interpret mathematical terms, interpret tables and graphs, evaluate formulas, compare numbers expressed in different ways, interpret ratios, proportions, and percentages, and recognize equivalent mathematical formulas or expressions. The questions are not intended to test specific content knowledge in these fields. See Appendix A for sample questions.
Methodology Washburn administered two different versions of the ETS® Proficiency Profile abbreviated form to two groups of students. The ETS® Proficiency Profile was administered to students enrolled in English 101: First Year Writing who are typically Freshmen, and Senior students as designated in Banner (ClassF coded as SR). The Freshman students took the Abbreviated Form B for Proctored Online Administration and Senior students took the Abbreviated Form C for Unproctored Online Administration. The goal was to have 200 Freshman and 200 Seniors (400 total) complete the ETS® Proficiency Profile abbreviated froms. Freshmen were scheduled to take the assessment during scheduled class times during the Fall 2019 semester. For Seniors, there were two administration windows: Wednesday, October 2, 2019 – Friday, November 1, 2019 and February 5, 2020 – March 27, 2020. Both Abbreviated Forms required 40 minutes of testing time; students had additional time to complete five practice test questions prior to administration and an optional post‐test with questions regarding their opinions about the testing.
Response Rates Freshmen Instructors for English 101: First Year Writing courses were asked to volunteer a class period, ideally during a planned leave of absence during the Fall 2019 semester. The assessment was announced in the class period prior to the administration of the test to increase student buy‐in. Students were instructed to attend class during the normally scheduled time, but instead of their regular classroom, arrive at the testing classroom. Students were provided laptops, scrap paper, pens, and access to a calculator.
The total number of students enrolled in EN 101 face‐to‐face courses at Washburn University during Fall 2019 was 384, the number of EN 101 students who completed the assessment in Fall 2019 was 187 (48.7%). Four students did not complete more than 75% of the test; their scores were recorded, but are not included in the summary of results. An attempt to gather 13 more responses was initiated during the Spring 2020 semester; however, due to the COVID‐19 pandemic, students were unable to take the proctored, in‐person test. The number of Freshman tested and who completed tests was 183.
ETS® Proficiency Profile Report 2019‐2020 3 Washburn University, Office of Academic Affairs August 5, 2020
Seniors For the first administration window in Fall 2019, 1,423 Seniors were sent initial emails to register; 260 registered. For the second administration window in Spring 2020, 1,025 Seniors were sent the initial email to register who were from the assessment population in Fall 2019, and an additional 431 who were new Spring 2020 seniors for a total of 1,456 (also excluding those 75 who had accessed the assessment in Fall 2019); 192 registered.
For the Fall 2019 administration window, 75 responded to the request to take the survey. A total of 70 answered 75% or greater of the test questions; five did not. For the Spring 2020 window, 46 responded to take the survey. A total of 41 answered 75% or greater of the tests questions; five did not.
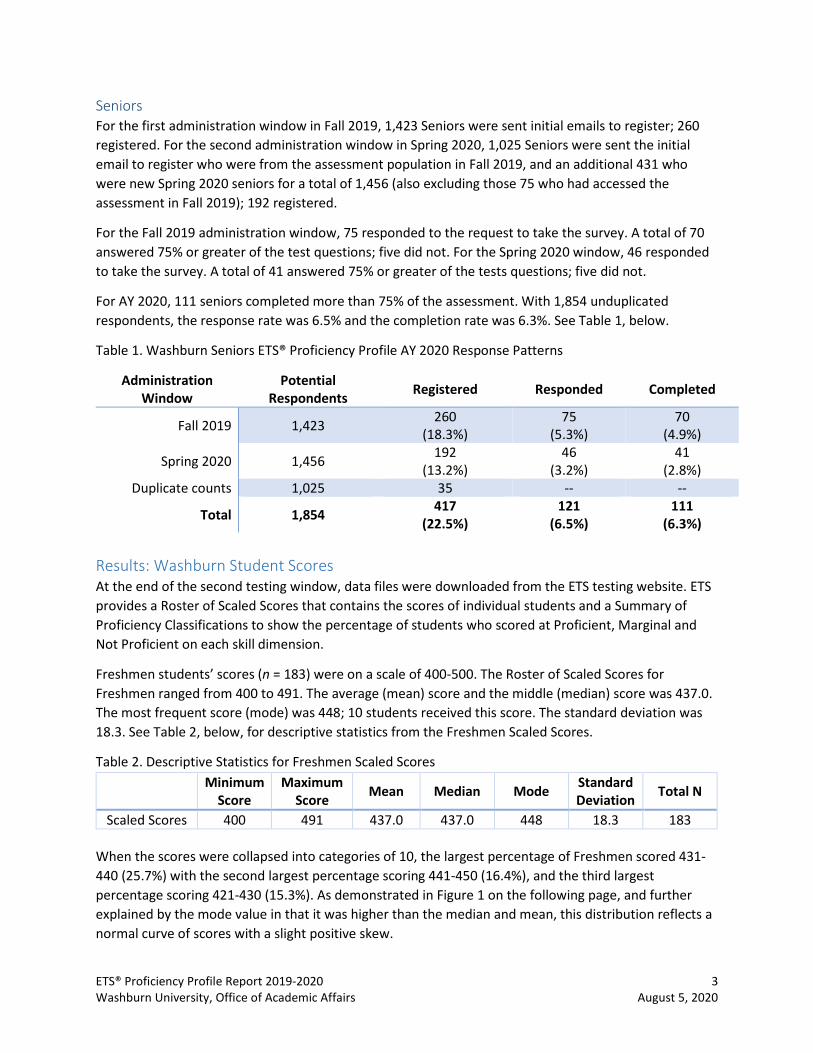
For AY 2020, 111 seniors completed more than 75% of the assessment. With 1,854 unduplicated respondents, the response rate was 6.5% and the completion rate was 6.3%. See Table 1, below.
Table 1. Washburn Seniors ETS® Proficiency Profile AY 2020 Response Patterns
Administration Window
Potential Respondents Registered Responded Completed
Fall 2019 1,423 260 (18.3%)
75 (5.3%)
70 (4.9%)
Spring 2020 1,456 192 (13.2%)
46 (3.2%)
41 (2.8%)
Duplicate counts 1,025 35 ‐‐ ‐‐
Total 1,854 417 (22.5%)
121 (6.5%)
111 (6.3%)
Results: Washburn Student Scores At the end of the second testing window, data files were downloaded from the ETS testing website. ETS provides a Roster of Scaled Scores that contains the scores of individual students and a Summary of Proficiency Classifications to show the percentage of students who scored at Proficient, Marginal and Not Proficient on each skill dimension.
Freshmen students’ scores (n = 183) were on a scale of 400‐500. The Roster of Scaled Scores for Freshmen ranged from 400 to 491. The average (mean) score and the middle (median) score was 437.0. The most frequent score (mode) was 448; 10 students received this score. The standard deviation was 18.3. See Table 2, below, for descriptive statistics from the Freshmen Scaled Scores.
Table 2. Descriptive Statistics for Freshmen Scaled Scores
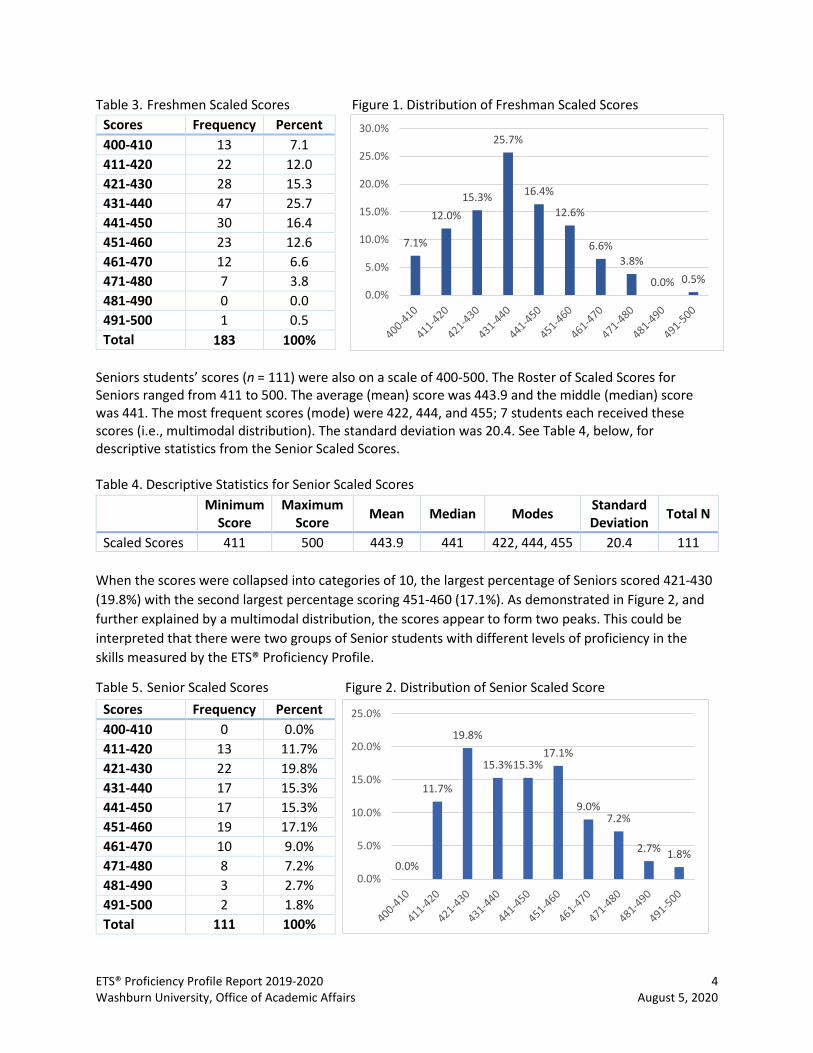
When the scores were collapsed into categories of 10, the largest percentage of Freshmen scored 431‐440 (25.7%) with the second largest percentage scoring 441‐450 (16.4%), and the third largest percentage scoring 421‐430 (15.3%). As demonstrated in Figure 1 on the following page, and further explained by the mode value in that it was higher than the median and mean, this distribution reflects a normal curve of scores with a slight positive skew.
Minimum Score
Maximum Score Mean Median Mode Standard
Deviation Total N
Scaled Scores 400 491 437.0 437.0 448 18.3 183
ETS® Proficiency Profile Report 2019‐2020 4 Washburn University, Office of Academic Affairs August 5, 2020
Table 3. Freshmen Scaled Scores Figure 1. Distribution of Freshman Scaled Scores
Seniors students’ scores (n = 111) were also on a scale of 400‐500. The Roster of Scaled Scores for Seniors ranged from 411 to 500. The average (mean) score was 443.9 and the middle (median) score was 441. The most frequent scores (mode) were 422, 444, and 455; 7 students each received these scores (i.e., multimodal distribution). The standard deviation was 20.4. See Table 4, below, for descriptive statistics from the Senior Scaled Scores. Table 4. Descriptive Statistics for Senior Scaled Scores
When the scores were collapsed into categories of 10, the largest percentage of Seniors scored 421‐430 (19.8%) with the second largest percentage scoring 451‐460 (17.1%). As demonstrated in Figure 2, and further explained by a multimodal distribution, the scores appear to form two peaks. This could be interpreted that there were two groups of Senior students with different levels of proficiency in the skills measured by the ETS® Proficiency Profile.
Table 5. Senior Scaled Scores Figure 2. Distribution of Senior Scaled Score
Scores Frequency Percent 400-410 13 7.1 411-420 22 12.0 421-430 28 15.3 431-440 47 25.7 441-450 30 16.4 451-460 23 12.6 461-470 12 6.6 471-480 7 3.8 481-490 0 0.0 491-500 1 0.5 Total 183 100%
Minimum Score
Maximum Score Mean Median Modes Standard
Deviation Total N
Scaled Scores 411 500 443.9 441 422, 444, 455 20.4 111
Scores Frequency Percent 400-410 0 0.0% 411-420 13 11.7% 421-430 22 19.8% 431-440 17 15.3% 441-450 17 15.3% 451-460 19 17.1% 461-470 10 9.0% 471-480 8 7.2% 481-490 3 2.7% 491-500 2 1.8% Total 111 100%
7.1%
12.0%15.3%
25.7%
16.4%
12.6%
6.6%3.8%
0.0% 0.5%0.0%
5.0%
10.0%
15.0%
20.0%
25.0%
30.0%
0.0%
11.7%
19.8%
15.3%15.3%17.1%
9.0%7.2%
2.7% 1.8%
0.0%
5.0%
10.0%
15.0%
20.0%
25.0%
ETS® Proficiency Profile Report 2019‐2020 5 Washburn University, Office of Academic Affairs August 5, 2020
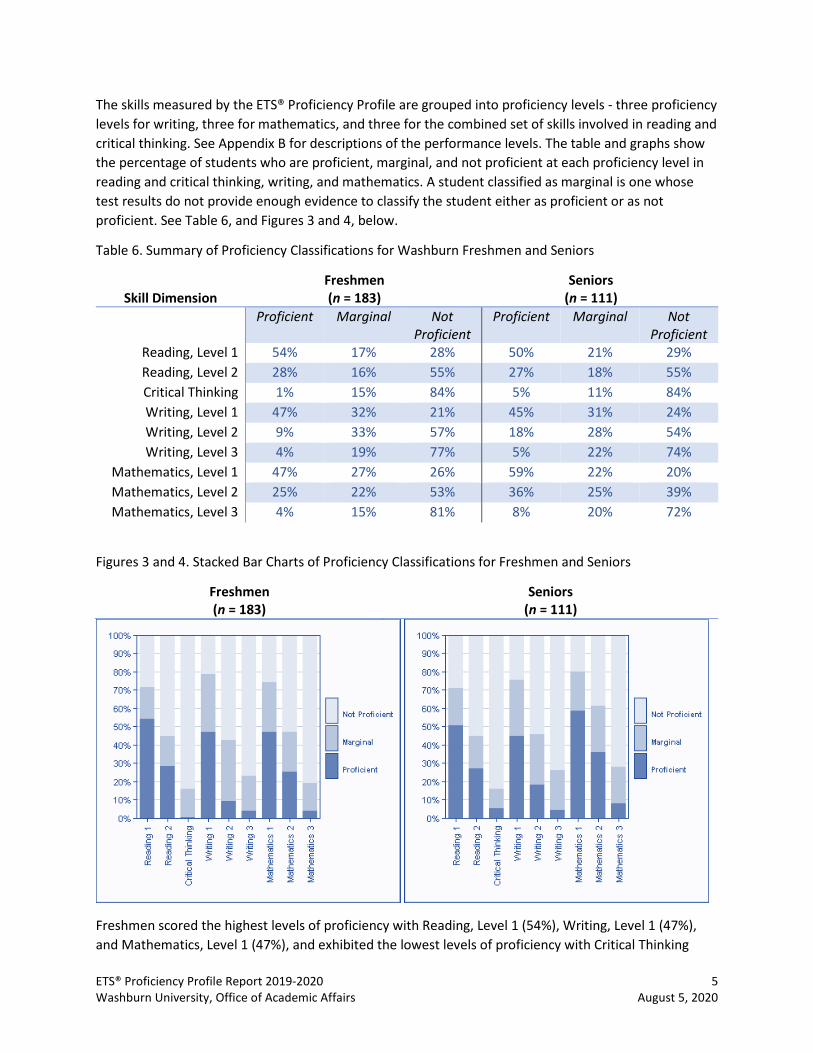
The skills measured by the ETS® Proficiency Profile are grouped into proficiency levels ‐ three proficiency levels for writing, three for mathematics, and three for the combined set of skills involved in reading and critical thinking. See Appendix B for descriptions of the performance levels. The table and graphs show the percentage of students who are proficient, marginal, and not proficient at each proficiency level in reading and critical thinking, writing, and mathematics. A student classified as marginal is one whose test results do not provide enough evidence to classify the student either as proficient or as not proficient. See Table 6, and Figures 3 and 4, below.
Table 6. Summary of Proficiency Classifications for Washburn Freshmen and Seniors
Skill Dimension Freshmen (n = 183)
Seniors (n = 111)
Proficient Marginal Not Proficient
Proficient Marginal Not Proficient
Reading, Level 1 54% 17% 28% 50% 21% 29% Reading, Level 2 28% 16% 55% 27% 18% 55% Critical Thinking 1% 15% 84% 5% 11% 84% Writing, Level 1 47% 32% 21% 45% 31% 24% Writing, Level 2 9% 33% 57% 18% 28% 54% Writing, Level 3 4% 19% 77% 5% 22% 74%
Mathematics, Level 1 47% 27% 26% 59% 22% 20% Mathematics, Level 2 25% 22% 53% 36% 25% 39% Mathematics, Level 3 4% 15% 81% 8% 20% 72%
Figures 3 and 4. Stacked Bar Charts of Proficiency Classifications for Freshmen and Seniors
Freshmen (n = 183)
Seniors (n = 111)
Freshmen scored the highest levels of proficiency with Reading, Level 1 (54%), Writing, Level 1 (47%), and Mathematics, Level 1 (47%), and exhibited the lowest levels of proficiency with Critical Thinking
ETS® Proficiency Profile Report 2019‐2020 6 Washburn University, Office of Academic Affairs August 5, 2020
(1%), Writing, Level 3 (4%), and Mathematics, Level 3 (4%). Seniors exhibited a similar pattern to the Freshmen regarding higher levels of proficiency in the same skill areas. Seniors scored the most proficient in Mathematics, Level 1 (59%), Reading, Level 1 (50%), and Writing, Level 1 (45%), and exhibited the lowest levels of proficiency with Critical Thinking (5%), Writing, Level 3 (5%), and Mathematics, Level 3 (8%).
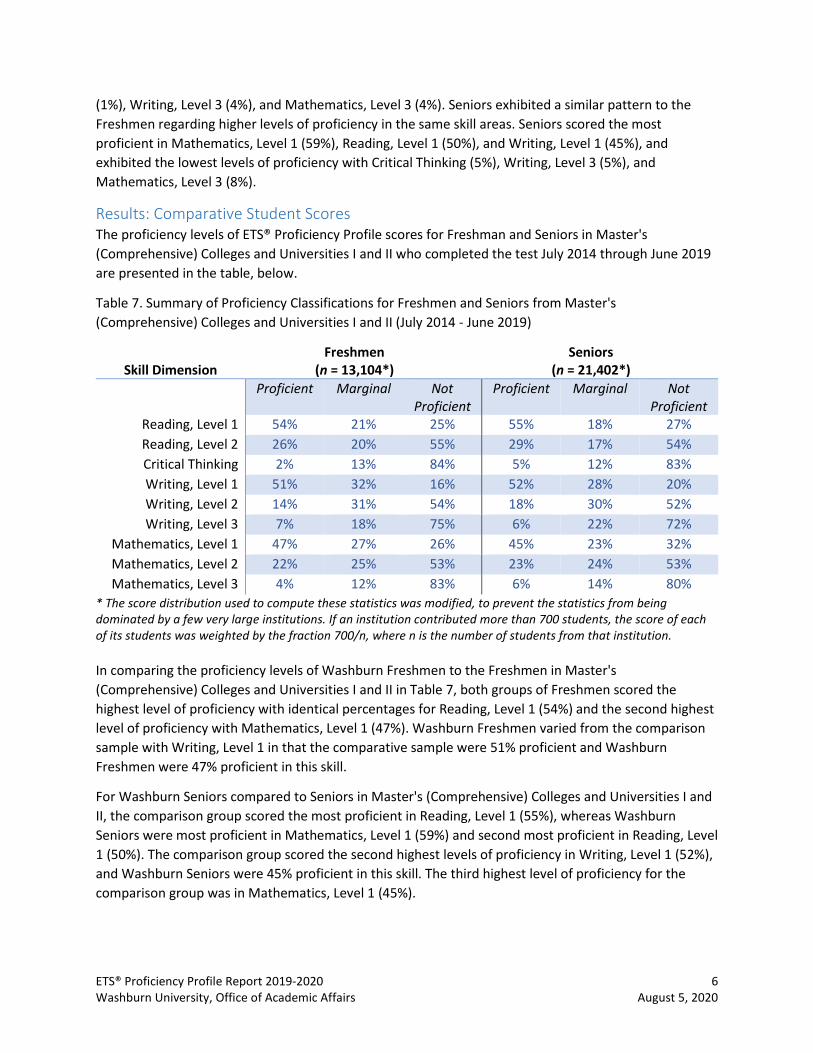
Results: Comparative Student Scores The proficiency levels of ETS® Proficiency Profile scores for Freshman and Seniors in Master's (Comprehensive) Colleges and Universities I and II who completed the test July 2014 through June 2019 are presented in the table, below.
Table 7. Summary of Proficiency Classifications for Freshmen and Seniors from Master's (Comprehensive) Colleges and Universities I and II (July 2014 ‐ June 2019)
Skill Dimension Freshmen
(n = 13,104*) Seniors
(n = 21,402*) Proficient Marginal Not
Proficient Proficient Marginal Not
Proficient Reading, Level 1 54% 21% 25% 55% 18% 27% Reading, Level 2 26% 20% 55% 29% 17% 54% Critical Thinking 2% 13% 84% 5% 12% 83% Writing, Level 1 51% 32% 16% 52% 28% 20% Writing, Level 2 14% 31% 54% 18% 30% 52% Writing, Level 3 7% 18% 75% 6% 22% 72%
Mathematics, Level 1 47% 27% 26% 45% 23% 32% Mathematics, Level 2 22% 25% 53% 23% 24% 53% Mathematics, Level 3 4% 12% 83% 6% 14% 80%
* The score distribution used to compute these statistics was modified, to prevent the statistics from being dominated by a few very large institutions. If an institution contributed more than 700 students, the score of each of its students was weighted by the fraction 700/n, where n is the number of students from that institution. In comparing the proficiency levels of Washburn Freshmen to the Freshmen in Master's (Comprehensive) Colleges and Universities I and II in Table 7, both groups of Freshmen scored the highest level of proficiency with identical percentages for Reading, Level 1 (54%) and the second highest level of proficiency with Mathematics, Level 1 (47%). Washburn Freshmen varied from the comparison sample with Writing, Level 1 in that the comparative sample were 51% proficient and Washburn Freshmen were 47% proficient in this skill.
For Washburn Seniors compared to Seniors in Master's (Comprehensive) Colleges and Universities I and II, the comparison group scored the most proficient in Reading, Level 1 (55%), whereas Washburn Seniors were most proficient in Mathematics, Level 1 (59%) and second most proficient in Reading, Level 1 (50%). The comparison group scored the second highest levels of proficiency in Writing, Level 1 (52%), and Washburn Seniors were 45% proficient in this skill. The third highest level of proficiency for the comparison group was in Mathematics, Level 1 (45%).

ETS® Proficiency Profile Report 2019‐2020 7 Washburn University, Office of Academic Affairs August 5, 2020
Results: Longitudinal Trends The ETS® Proficiency Profile was used to assess Washburn Freshmen and Senior students annually from AY 2010 to AY 2014, and since AY 2014, every three years. The longitudinal scores of Washburn Freshmen students from 2010‐2020 who scored in the proficiency classification for Reading, Writing and Mathematics are displayed in the figures below (Figures 5‐7).
Figure 5. Proficiency Classifications for Washburn Freshmen in Reading, 2010‐2020
Figure 6. Proficiency Classifications for Washburn Freshmen in Writing, 2010‐2020
Figure 7. Proficiency Classifications for Washburn Freshmen in Mathematics, 2010‐2020
48% 49%57% 57% 57% 56% 54%
21% 22%28% 29% 29%
33%28%
3% 2% 2% 1% 0% 3% 1%0%
10%
20%
30%
40%
50%
60%
2010 2011 2012 2013 2014 2017 2020
Reading, Level1 Reading, Level 2 Critical Thinking
43%48%
44%51%
54% 53%47%
9% 10%7%
11% 13% 13%9%
3% 5% 4% 3% 5% 4% 4%0%
10%
20%
30%
40%
50%
60%
2010 2011 2012 2013 2014 2017 2020
Writing, Level 1 Writing, Level 2 Writing, Level 3
39% 41%49% 48% 50%
56%
47%
14%20% 23% 25% 25% 28% 25%
5%7%
3% 4% 3%7% 4%
0%
10%
20%
30%
40%
50%
60%
2010 2011 2012 2013 2014 2017 2020
Math, Level 1 Math, Level 2 Math, Level 3
ETS® Proficiency Profile Report 2019‐2020 8 Washburn University, Office of Academic Affairs August 5, 2020
In general, the proficiency of Washburn Freshmen students in these three areas remained at the lowest levels in 2010 and 2011 (and for Writing, 2012), and gradually increased until they peaked in 2017, and remain steady or declined in 2020.
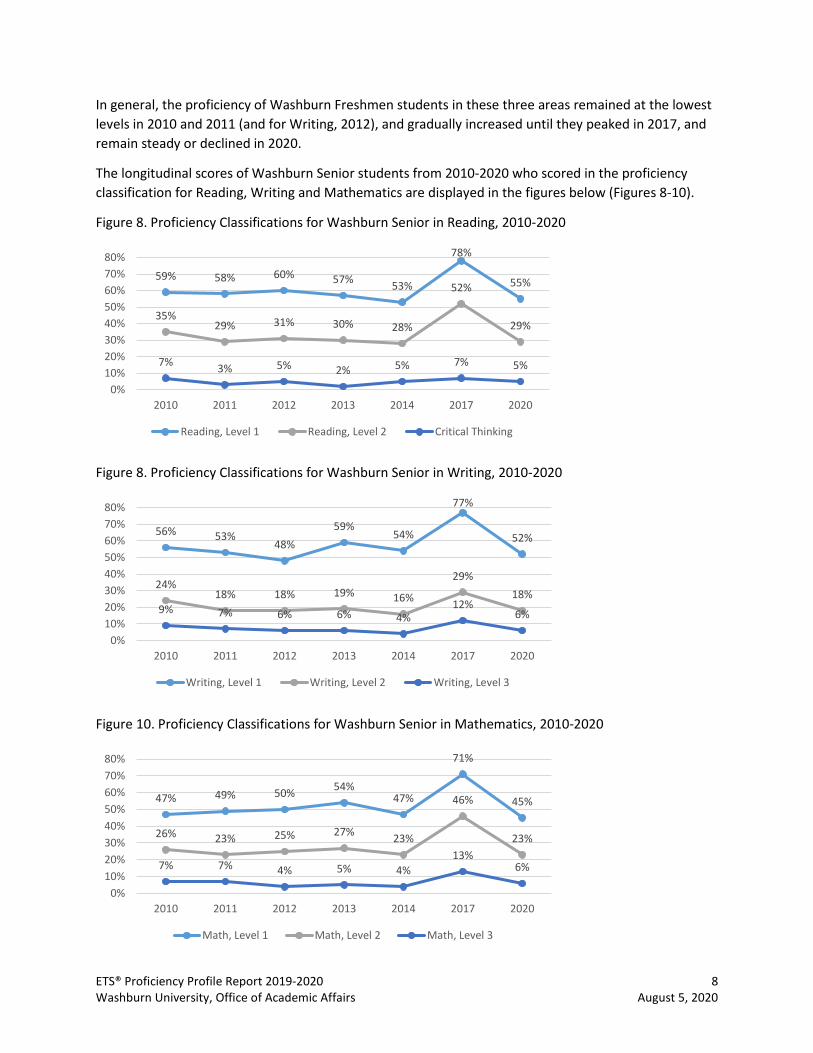
The longitudinal scores of Washburn Senior students from 2010‐2020 who scored in the proficiency classification for Reading, Writing and Mathematics are displayed in the figures below (Figures 8‐10).
Figure 8. Proficiency Classifications for Washburn Senior in Reading, 2010‐2020
Figure 8. Proficiency Classifications for Washburn Senior in Writing, 2010‐2020
Figure 10. Proficiency Classifications for Washburn Senior in Mathematics, 2010‐2020
59% 58% 60% 57% 53%
78%
55%
35%29% 31% 30% 28%
52%
29%
7% 3% 5% 2% 5% 7% 5%
0%10%20%30%40%50%60%70%80%
2010 2011 2012 2013 2014 2017 2020
Reading, Level 1 Reading, Level 2 Critical Thinking
56% 53%48%
59%54%
77%
52%
24%18% 18% 19% 16%
29%18%
9% 7% 6% 6% 4%12%
6%
0%10%20%30%40%50%60%70%80%
2010 2011 2012 2013 2014 2017 2020
Writing, Level 1 Writing, Level 2 Writing, Level 3
47% 49% 50% 54%47%
71%
45%
26% 23% 25% 27% 23%
46%
23%
7% 7% 4% 5% 4%13%
6%
0%10%20%30%40%50%60%70%80%
2010 2011 2012 2013 2014 2017 2020
Math, Level 1 Math, Level 2 Math, Level 3
ETS® Proficiency Profile Report 2019‐2020 9 Washburn University, Office of Academic Affairs August 5, 2020
Again, in general, the proficiency of Washburn Senior students in these three areas remained at the lowest levels in 2010 and 2011 (and for Writing, 2012), and gradually increased until they peaked in 2017, and declined in 2020.
Limitations One of the limitations of the ETS® Proficiency Profile Abbreviated form is that it provides group level information only. The Abbreviated form is constructed by dividing the Standard form into three parts, and packaging them in alternating sequence so that each part is taken by one‐third of the students. This sampling technique makes it possible to obtain reliable information about the group even when no individual student answers enough questions to provide reliable individual subscores. Each of the three Abbreviated forms includes:
• nine questions measuring critical thinking skills • nine questions measuring reading skills • nine questions measuring writing skills • nine questions measuring mathematics skills
On each Abbreviated form, the reading questions and the critical thinking questions represent all three of the academic contexts – humanities, social sciences and natural sciences – but the number of questions from each academic context in each subform can differ.
Caution should be used in generalizing the scores from the ETS® Proficiency Profile to all the skills students attained in Reading, Writing and Mathematics at Washburn and at the comparison group institutions. First, the Freshman and Seniors were not selected from randomly selected populations. In addition, the response rate was low, especially for Washburn Senior students, at 6.5% and the completion rate was 6.3%. This is likely not representative of all senior level students at Washburn. Second, the method of administration and the numbers of students assessed vary among institutions. These conditions impact the representativeness the student population scores.
Although longitudinal data collection and analysis can measure changes in skill levels over time, the data presented in this report possess limitations that prohibit comparative interpretations of the Freshman students to the Senior students over time. First, those students who took the test as Freshman are likely not present in the Senior group that took the test due to no matching nor purposive sampling techniques used to draw test takers from these populations. Second, the Freshman and Senior students’ participation was voluntary and the characteristics of these groups could vary in some important way from testing year to testing year.
Another consideration is student motivation when the assessment is taken in a nonproctored setting, such as the Washburn Seniors who voluntarily signed up and took the assessment when they chose to do so. If students are not motivated to do well, their scores will not reflect their actual skills.
ETS® Proficiency Profile Report 2019‐2020 10 Washburn University, Office of Academic Affairs August 5, 2020
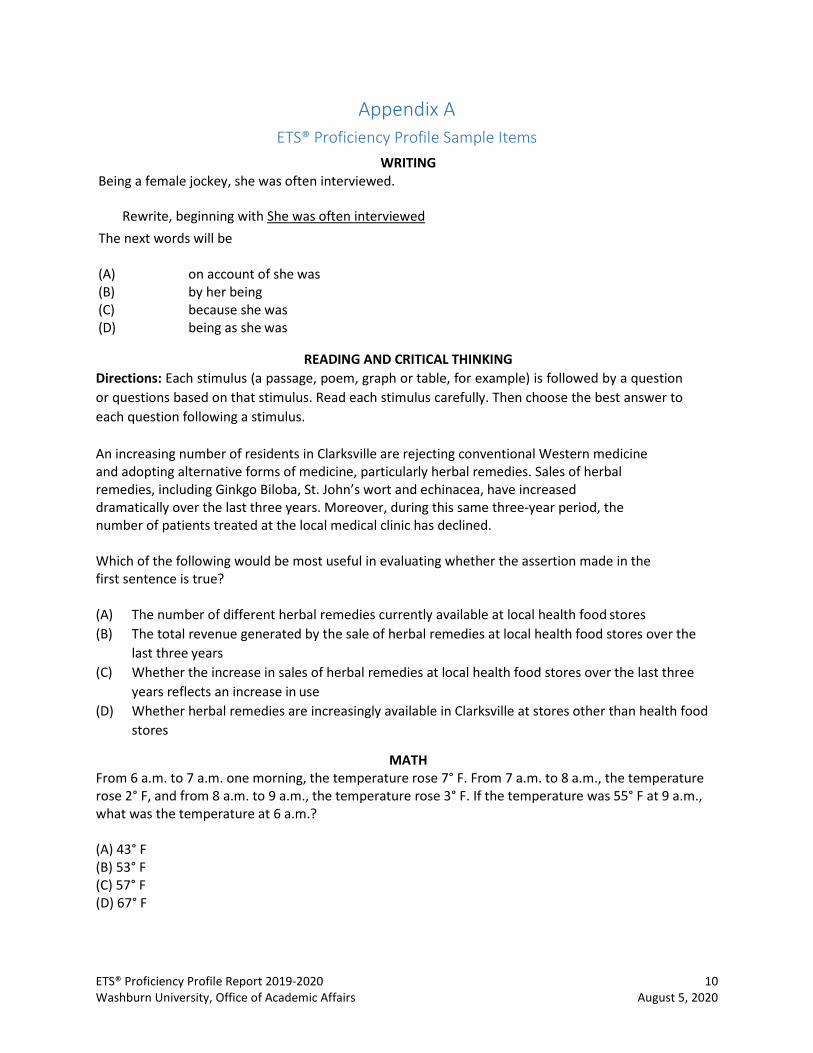
Appendix A ETS® Proficiency Profile Sample Items
WRITING Being a female jockey, she was often interviewed.
Rewrite, beginning with She was often interviewed The next words will be (A) on account of she was (B) by her being (C) because she was (D) being as she was
READING AND CRITICAL THINKING
Directions: Each stimulus (a passage, poem, graph or table, for example) is followed by a question or questions based on that stimulus. Read each stimulus carefully. Then choose the best answer to each question following a stimulus. An increasing number of residents in Clarksville are rejecting conventional Western medicine and adopting alternative forms of medicine, particularly herbal remedies. Sales of herbal remedies, including Ginkgo Biloba, St. John’s wort and echinacea, have increased dramatically over the last three years. Moreover, during this same three‐year period, the number of patients treated at the local medical clinic has declined. Which of the following would be most useful in evaluating whether the assertion made in the first sentence is true? (A) The number of different herbal remedies currently available at local health food stores (B) The total revenue generated by the sale of herbal remedies at local health food stores over the
last three years (C) Whether the increase in sales of herbal remedies at local health food stores over the last three
years reflects an increase in use (D) Whether herbal remedies are increasingly available in Clarksville at stores other than health food
stores
MATH From 6 a.m. to 7 a.m. one morning, the temperature rose 7° F. From 7 a.m. to 8 a.m., the temperature rose 2° F, and from 8 a.m. to 9 a.m., the temperature rose 3° F. If the temperature was 55° F at 9 a.m., what was the temperature at 6 a.m.? (A) 43° F (B) 53° F (C) 57° F (D) 67° F
ETS® Proficiency Profile Report 2019‐2020 11 Washburn University, Office of Academic Affairs August 5, 2020
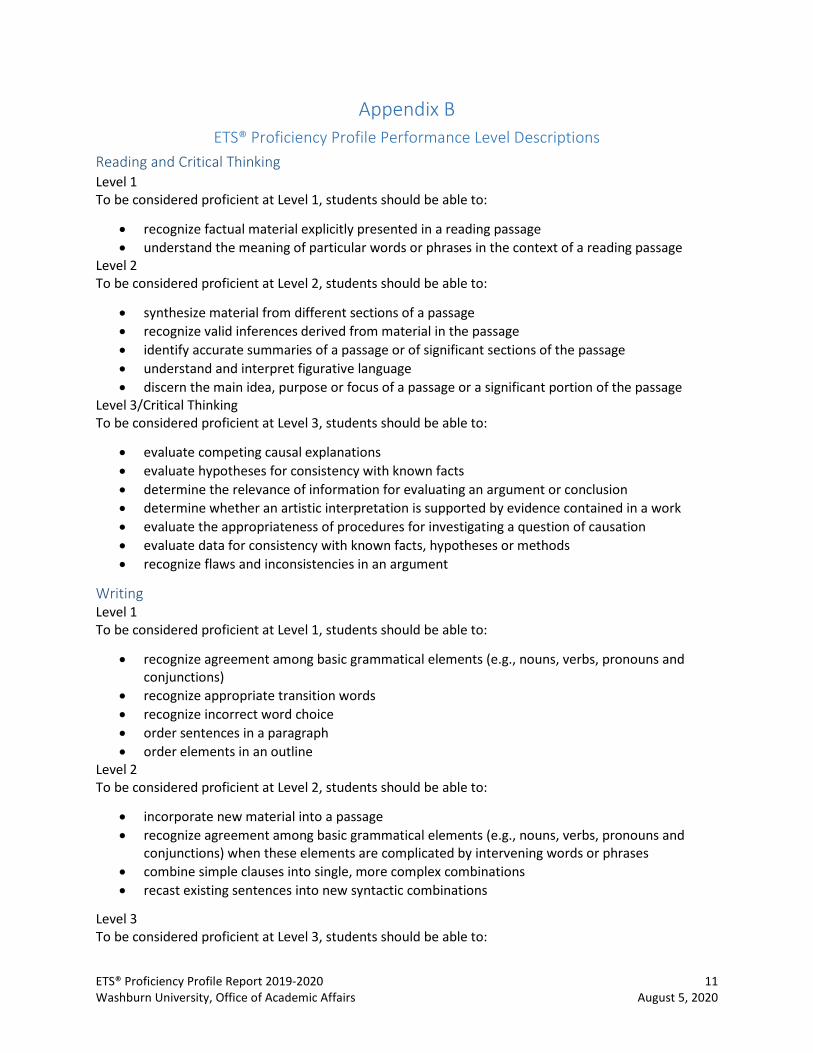
Appendix B
ETS® Proficiency Profile Performance Level Descriptions Reading and Critical Thinking Level 1 To be considered proficient at Level 1, students should be able to:
• recognize factual material explicitly presented in a reading passage • understand the meaning of particular words or phrases in the context of a reading passage
Level 2 To be considered proficient at Level 2, students should be able to:
• synthesize material from different sections of a passage • recognize valid inferences derived from material in the passage • identify accurate summaries of a passage or of significant sections of the passage • understand and interpret figurative language • discern the main idea, purpose or focus of a passage or a significant portion of the passage
Level 3/Critical Thinking To be considered proficient at Level 3, students should be able to:
• evaluate competing causal explanations • evaluate hypotheses for consistency with known facts • determine the relevance of information for evaluating an argument or conclusion • determine whether an artistic interpretation is supported by evidence contained in a work • evaluate the appropriateness of procedures for investigating a question of causation • evaluate data for consistency with known facts, hypotheses or methods • recognize flaws and inconsistencies in an argument
Writing Level 1 To be considered proficient at Level 1, students should be able to:
• recognize agreement among basic grammatical elements (e.g., nouns, verbs, pronouns and conjunctions)
• recognize appropriate transition words • recognize incorrect word choice • order sentences in a paragraph • order elements in an outline
Level 2 To be considered proficient at Level 2, students should be able to:
• incorporate new material into a passage • recognize agreement among basic grammatical elements (e.g., nouns, verbs, pronouns and
conjunctions) when these elements are complicated by intervening words or phrases • combine simple clauses into single, more complex combinations • recast existing sentences into new syntactic combinations
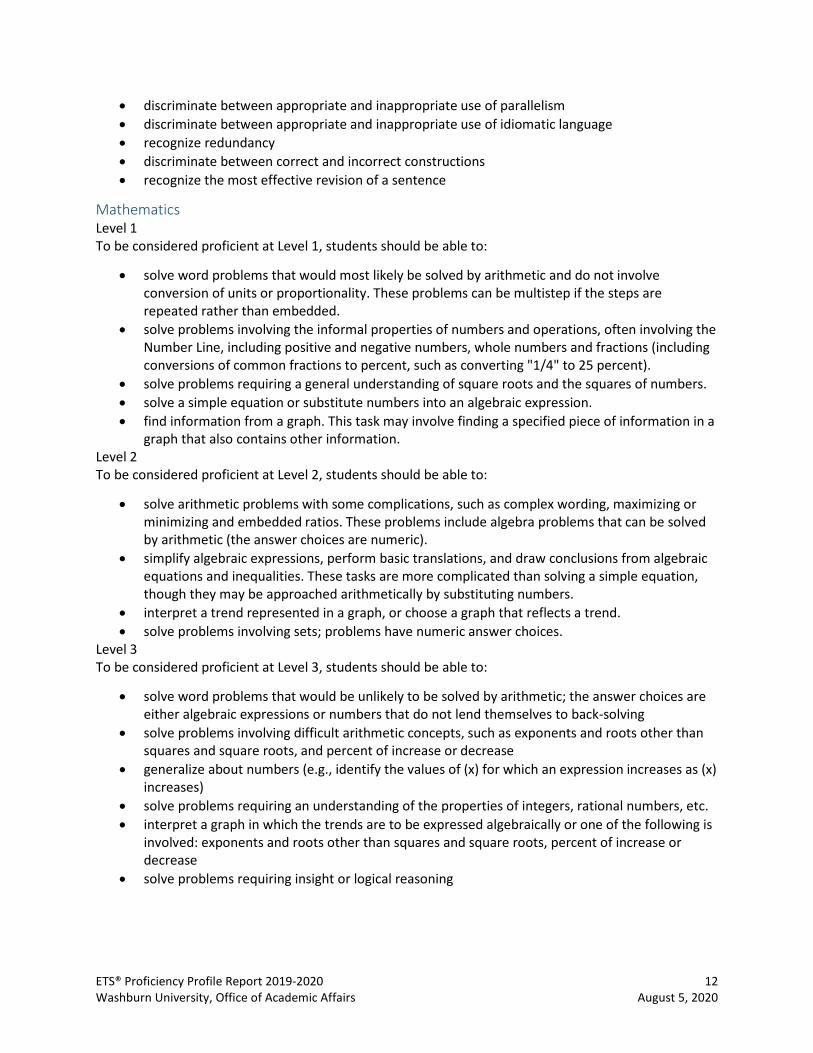
Level 3 To be considered proficient at Level 3, students should be able to:
ETS® Proficiency Profile Report 2019‐2020 12 Washburn University, Office of Academic Affairs August 5, 2020
• discriminate between appropriate and inappropriate use of parallelism • discriminate between appropriate and inappropriate use of idiomatic language • recognize redundancy • discriminate between correct and incorrect constructions • recognize the most effective revision of a sentence
Mathematics Level 1 To be considered proficient at Level 1, students should be able to:
• solve word problems that would most likely be solved by arithmetic and do not involve conversion of units or proportionality. These problems can be multistep if the steps are repeated rather than embedded.
• solve problems involving the informal properties of numbers and operations, often involving the Number Line, including positive and negative numbers, whole numbers and fractions (including conversions of common fractions to percent, such as converting "1/4" to 25 percent).
• solve problems requiring a general understanding of square roots and the squares of numbers. • solve a simple equation or substitute numbers into an algebraic expression. • find information from a graph. This task may involve finding a specified piece of information in a
graph that also contains other information. Level 2 To be considered proficient at Level 2, students should be able to:
• solve arithmetic problems with some complications, such as complex wording, maximizing or minimizing and embedded ratios. These problems include algebra problems that can be solved by arithmetic (the answer choices are numeric).
• simplify algebraic expressions, perform basic translations, and draw conclusions from algebraic equations and inequalities. These tasks are more complicated than solving a simple equation, though they may be approached arithmetically by substituting numbers.
• interpret a trend represented in a graph, or choose a graph that reflects a trend. • solve problems involving sets; problems have numeric answer choices.
Level 3 To be considered proficient at Level 3, students should be able to:
• solve word problems that would be unlikely to be solved by arithmetic; the answer choices are either algebraic expressions or numbers that do not lend themselves to back‐solving
• solve problems involving difficult arithmetic concepts, such as exponents and roots other than squares and square roots, and percent of increase or decrease
• generalize about numbers (e.g., identify the values of (x) for which an expression increases as (x) increases)
• solve problems requiring an understanding of the properties of integers, rational numbers, etc. • interpret a graph in which the trends are to be expressed algebraically or one of the following is
involved: exponents and roots other than squares and square roots, percent of increase or decrease
• solve problems requiring insight or logical reasoning