Embed Size (px)
Citation preview
To show the ability of the group taking the test
Dyersburg State Community College Cohort Name: Dyersburg State Exit Exam 2012-2013Abbreviated Close Date: 07/05/2013Test Description: Abbreviated Form B Student Level: All Number of students tested: 402 Number of students included in these statistics: 386Number of students excluded (see roster): 16
Possible Range Mean Score
95% Confidence Limits* for
MeanStandard Deviation
25th Percentile
50th Percentile
75th Percentile
Total Score 400 to 500 438.54 437 to 440 17.24 426 437 451
Critical Thinking 100 to 130 110.17 109 to 111 5.89 105 110 114Reading 100 to 130 117.05 116 to 118 6.84 111 119 122Writing 100 to 130 113.7 113 to 115 4.98 110 113 118Mathematics 100 to 130 110.92 110 to 112 4.92 108 111 113
Humanities 100 to 130 113.09 112 to 114 6.11 108 112 117Social Sciences 100 to 130 112.58 112 to 114 5.84 108 111 116Natural Sciences 100 to 130 114.55 114 to 115 5.64 111 116 120
Context-Based Subscores:
*The confidence limits are based on the assumption that the questions contributing to each scaled score are a sample from a much larger set of possible questions that could have been used to measure those same skills. If the group of students taking the test is a sample from some larger population of students eligible to be tested, the confidence limits include both sampling of students and sampling of questions as factors that could cause the mean score to vary. The confidence limits indicate the precision of the mean score of the students actually tested, as an estimate of the "true population mean" - the mean score that would result if all the students in the population could somehow be tested with all possible questions. These confidence limits were computed by a procedure that has a 95 percent probability of producing upper and lower limits that will surround the true population mean. The population size used in the calculation of the confidence limits for the mean scores in this report is 386.
Reports based on a sample of fewer than 50 test takers are representative of the performance of that sample only. Reports based on fewer than 50 test takers should not be considered representative of the larger group of like students, and inferences or generalizations about the larger population or subgroup should not be made based on such small samples.
ETS® Proficiency Profile
Summary of Scaled Scores
Skills Subscores:
Tennessee Higher Education Commission Page 1 of 1 9/19/2014
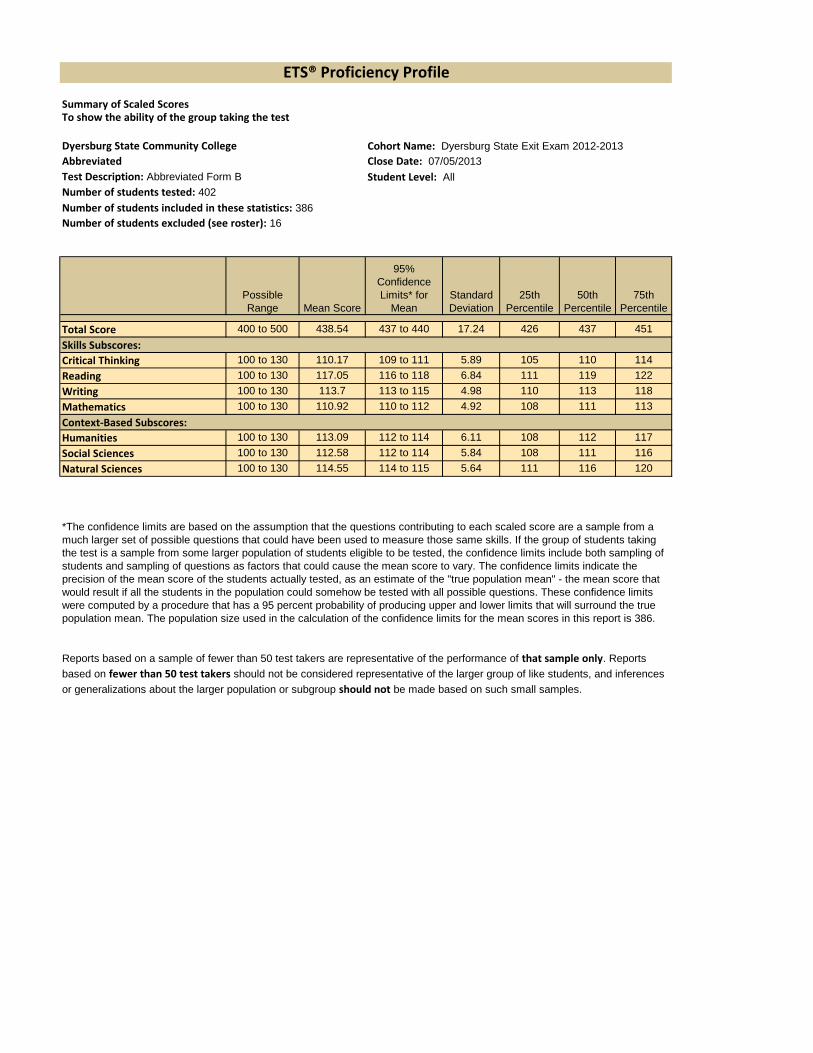
1515
All
297
286
96%
National Norm Comparison (Maximum 15 points in Years 1-3 and 10 points in Years 4-5)
Mean Score 2010-11 2011-12 2012-13 2013-14 2014-15Institution 440.1 439.1 438.5 439.5National 437.5 437.6 438.3 438.2Diff (I-Nat'l) 2.5 1.6 0.3 1.4 0.0% Institution to National Average 100% 100% 100% 100% 0%
Institutional Trends Comparison (Maximum 5 points in Years 4-5)Mean Score 2013-14 2014-15Institution 439.53 Yr Average 439.2Diff (I-Avg) 0.3 0.0% Institution to 3-Year Average 100% 0%
Institutional Comments:
Total Eligible Graduates:
No. Graduates Tested:
Percent Tested:
Recommended Points:
Graduates Tested: All or Sample?
Test Type: ETS Proficiency Profile
Maximum Points:
Tennessee Higher Education Commission 2010-15 Performance Funding
Standard 1A: General Education Assessment
Dyersburg State Community College
Year 4: 2013-14
The General Education standard is designed to provide incentives to institutions for improvements in the quality of their undergraduate general education program as measured by the performance of graduates on an approved standardized test of general education.
There were eleven graduates that answered fewer than 75% of the Exam questions. This is the difference in Total Eligible Graduates and Number of Graduates Tested as shown at the top of this page. The sub-scores from these eleven students are excluded from any statistical analysis and ETS reports. The roster has not been included since it contains scores by graduate name and ID. The roster is available upon request.
Office of Institutional
Advancement
DYERSBURG STATE COMMUNITY COLLEGE
Proficiency Profile Exam
Results 2013-2014
Table of Contents Page
Scaled Summary Report 1
Proficiency Classification 2
Academic Scaled Score Distributions 3
Skills Scaled Score Distributions 4
Total Scaled Score Distributions 5
Demographic
Age 6
Ethnicity 7
Gender 8
Major 9
Other QuestionsQuestion 1
If you could start college over, would you choose to attend this college?10
Question 2 What is your overall impression of the quality of education at this 2-year college? 11
Question 3Did you achieve your educational objective?
12Question 4 Which of the following best describes your present employment
situation? 13Question 5 Are you employed in the field in which you were educated? If not, why
[choose best response]. 14Question 6
What is your current weekly salary?15
Question 7 If you are NOT employed, which of the following best describes your employment status? 16
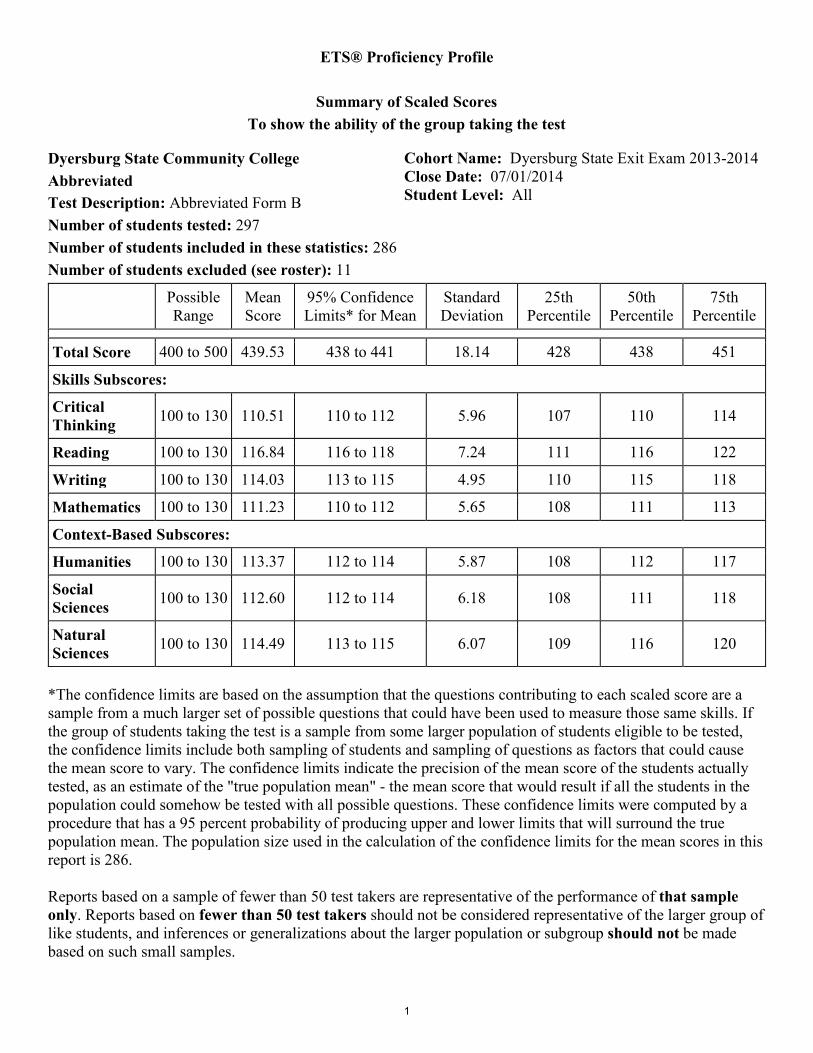
ETS® Proficiency Profile
Summary of Scaled Scores To show the ability of the group taking the test
Dyersburg State Community College Cohort Name: Dyersburg State Exit Exam 2013-2014 Close Date: 07/01/2014 Student Level: All
Abbreviated Test Description: Abbreviated Form B Number of students tested: 297 Number of students included in these statistics: 286 Number of students excluded (see roster): 11
Possible Range
Mean Score
95% Confidence Limits* for Mean
Standard Deviation
25th Percentile
50th Percentile
75th Percentile
Total Score 400 to 500 439.53 438 to 441 18.14 428 438 451
Skills Subscores:
Critical Thinking 100 to 130 110.51 110 to 112 5.96 107 110 114
Reading 100 to 130 116.84 116 to 118 7.24 111 116 122
Writing 100 to 130 114.03 113 to 115 4.95 110 115 118
Mathematics 100 to 130 111.23 110 to 112 5.65 108 111 113
Context-Based Subscores:
Humanities 100 to 130 113.37 112 to 114 5.87 108 112 117
Social Sciences 100 to 130 112.60 112 to 114 6.18 108 111 118
Natural Sciences 100 to 130 114.49 113 to 115 6.07 109 116 120
*The confidence limits are based on the assumption that the questions contributing to each scaled score are a sample from a much larger set of possible questions that could have been used to measure those same skills. If the group of students taking the test is a sample from some larger population of students eligible to be tested, the confidence limits include both sampling of students and sampling of questions as factors that could cause the mean score to vary. The confidence limits indicate the precision of the mean score of the students actually tested, as an estimate of the "true population mean" - the mean score that would result if all the students in the population could somehow be tested with all possible questions. These confidence limits were computed by a procedure that has a 95 percent probability of producing upper and lower limits that will surround the true population mean. The population size used in the calculation of the confidence limits for the mean scores in this report is 286. Reports based on a sample of fewer than 50 test takers are representative of the performance of that sample only. Reports based on fewer than 50 test takers should not be considered representative of the larger group of like students, and inferences or generalizations about the larger population or subgroup should not be made based on such small samples.
1
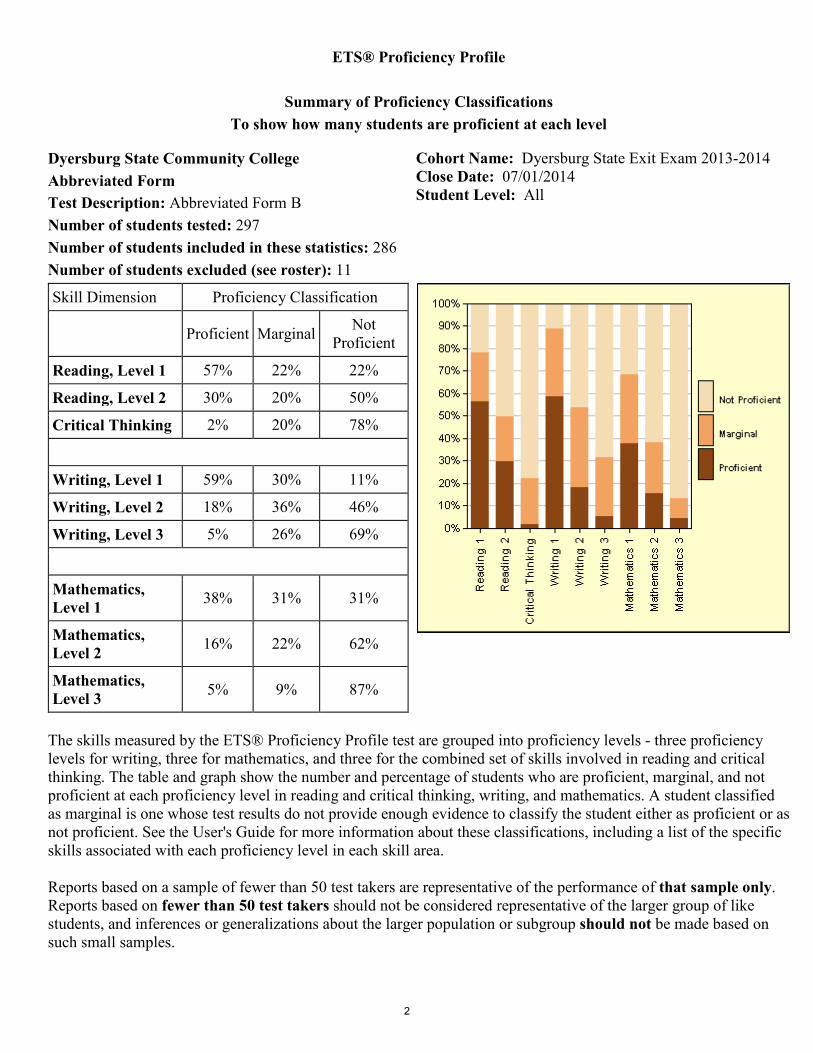
ETS® Proficiency Profile
Summary of Proficiency Classifications To show how many students are proficient at each level
Dyersburg State Community College Cohort Name: Dyersburg State Exit Exam 2013-2014 Close Date: 07/01/2014 Student Level: All
Abbreviated Form Test Description: Abbreviated Form B Number of students tested: 297 Number of students included in these statistics: 286 Number of students excluded (see roster): 11
Skill Dimension Proficiency Classification
Proficient Marginal Not Proficient
Reading, Level 1 57% 22% 22%
Reading, Level 2 30% 20% 50%
Critical Thinking 2% 20% 78%
Writing, Level 1 59% 30% 11%
Writing, Level 2 18% 36% 46%
Writing, Level 3 5% 26% 69%
Mathematics, Level 1 38% 31% 31%
Mathematics, Level 2 16% 22% 62%
Mathematics, Level 3 5% 9% 87%
The skills measured by the ETS® Proficiency Profile test are grouped into proficiency levels - three proficiency levels for writing, three for mathematics, and three for the combined set of skills involved in reading and critical thinking. The table and graph show the number and percentage of students who are proficient, marginal, and not proficient at each proficiency level in reading and critical thinking, writing, and mathematics. A student classified as marginal is one whose test results do not provide enough evidence to classify the student either as proficient or as not proficient. See the User's Guide for more information about these classifications, including a list of the specific skills associated with each proficiency level in each skill area. Reports based on a sample of fewer than 50 test takers are representative of the performance of that sample only. Reports based on fewer than 50 test takers should not be considered representative of the larger group of like students, and inferences or generalizations about the larger population or subgroup should not be made based on such small samples.
2
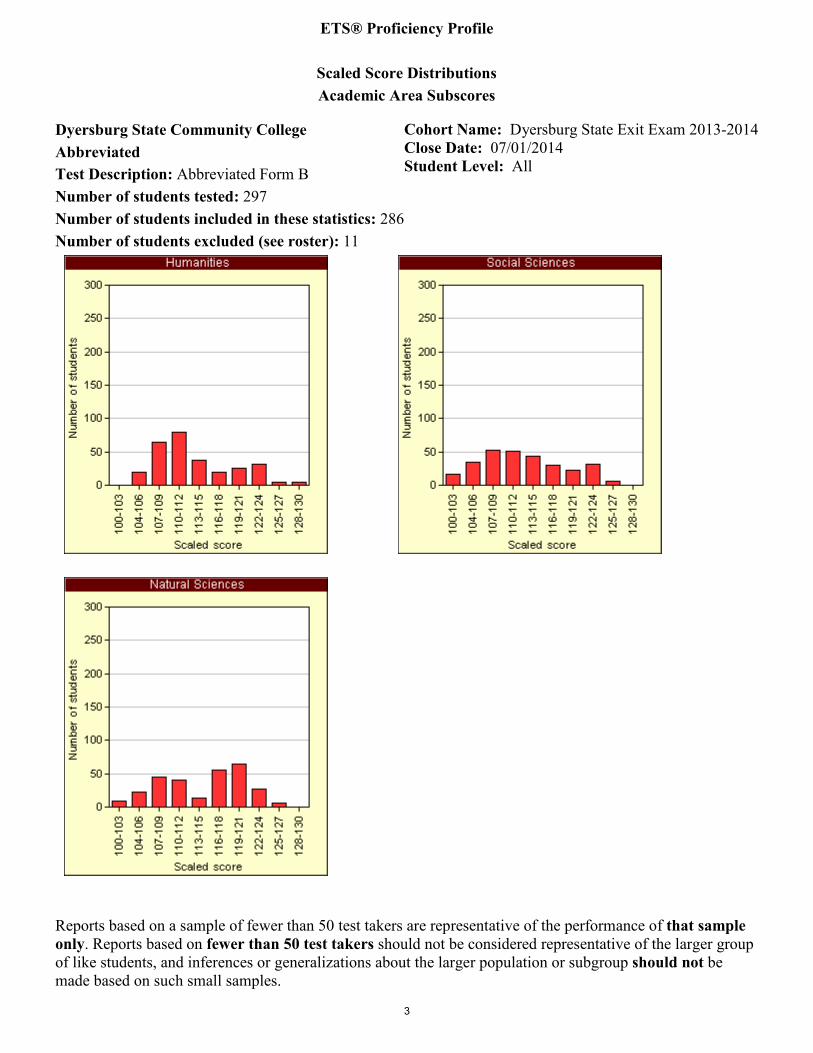
ETS® Proficiency Profile
Scaled Score Distributions Academic Area Subscores
Dyersburg State Community College Cohort Name: Dyersburg State Exit Exam 2013-2014 Close Date: 07/01/2014 Student Level: All
Abbreviated Test Description: Abbreviated Form B Number of students tested: 297 Number of students included in these statistics: 286 Number of students excluded (see roster): 11
Reports based on a sample of fewer than 50 test takers are representative of the performance of that sample only. Reports based on fewer than 50 test takers should not be considered representative of the larger group of like students, and inferences or generalizations about the larger population or subgroup should not be made based on such small samples.
3
ETS® Proficiency Profile
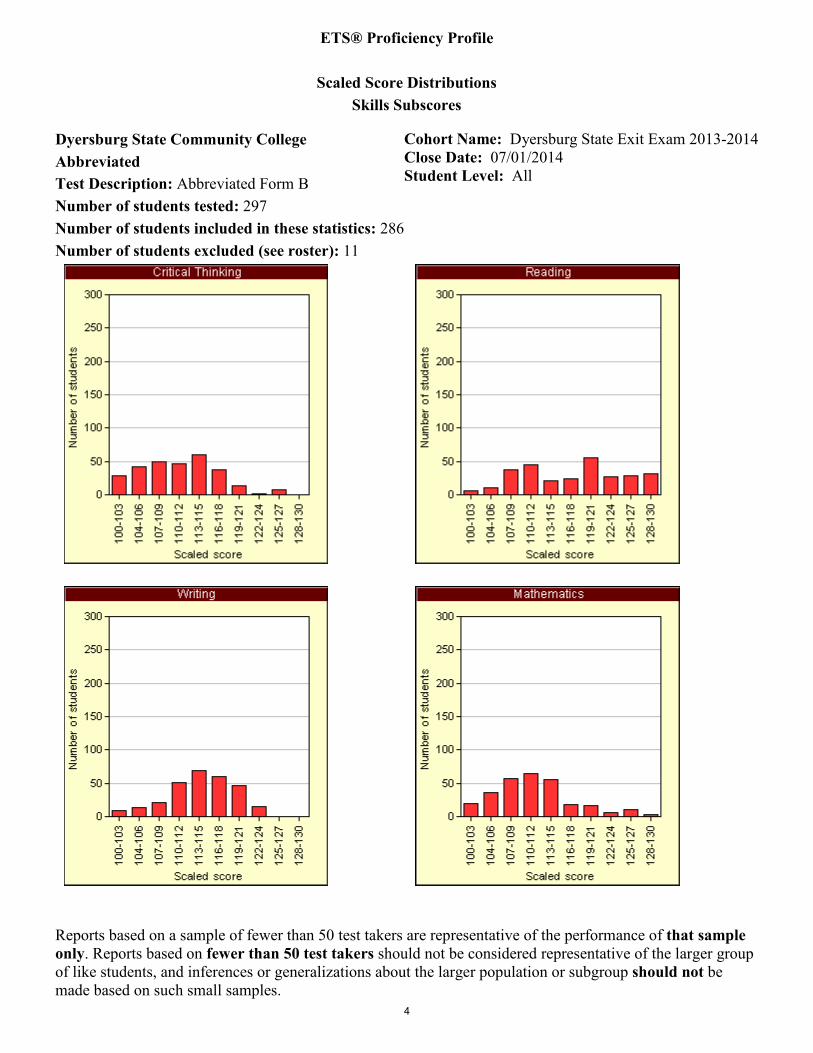
Scaled Score Distributions Skills Subscores
Dyersburg State Community College Cohort Name: Dyersburg State Exit Exam 2013-2014 Close Date: 07/01/2014 Student Level: All
Abbreviated Test Description: Abbreviated Form B Number of students tested: 297 Number of students included in these statistics: 286 Number of students excluded (see roster): 11
Reports based on a sample of fewer than 50 test takers are representative of the performance of that sample only. Reports based on fewer than 50 test takers should not be considered representative of the larger group of like students, and inferences or generalizations about the larger population or subgroup should not be made based on such small samples.
4
ETS® Proficiency Profile
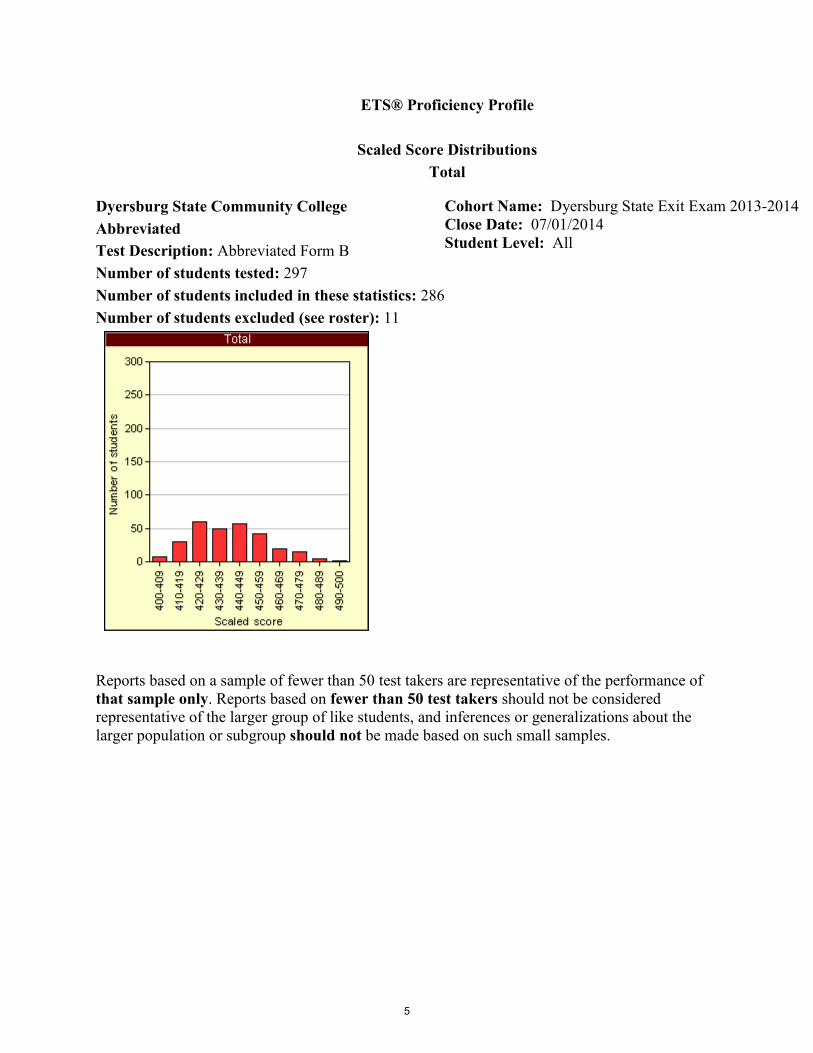
Scaled Score Distributions Total
Dyersburg State Community College Cohort Name: Dyersburg State Exit Exam 2013-2014 Close Date: 07/01/2014 Student Level: All
Abbreviated Test Description: Abbreviated Form B Number of students tested: 297 Number of students included in these statistics: 286 Number of students excluded (see roster): 11
Reports based on a sample of fewer than 50 test takers are representative of the performance of that sample only. Reports based on fewer than 50 test takers should not be considered representative of the larger group of like students, and inferences or generalizations about the larger population or subgroup should not be made based on such small samples.
5

ETS® Proficiency Profile
Demographic Analysis Report Age
Dyersburg State Community College Cohort Name: Dyersburg State Exit Exam 2013-2014 Close Date: 07/01/2014 Abbreviated
Test Description: Abbreviated Form B Number of students tested: 297 Number of students included in these statistics: 286 Number of students excluded (see roster): 11
Number Total Score
Critical Thinking Reading Writing Mathematics Humanities Social
Sciences Natural Sciences
Total Group 286 439.53
(18.14) 110.51 (5.96)
116.84 (7.24)
114.03 (4.95)
111.23 (5.65)
113.37 (5.87)
112.60 (6.18)
114.49 (6.07)
<20 14 438.86 (15.35)
108.71 (5.06)
116.00 (7.20)
113.93 (3.86)
112.79 (6.25)
112.57 (5.25)
110.71 (4.74)
113.36 (5.68)
20 - 29 170 440.05 (17.83)
110.52 (5.93)
116.68 (7.36)
114.38 (4.95)
111.46 (5.58)
113.28 (5.90)
112.25 (6.28)
114.79 (6.26)
30 - 39 53 440.83 (17.46)
111.06 (6.16)
118.58 (6.51)
113.81 (5.34)
111.02 (5.51)
114.66 (5.60)
114.25 (5.58)
114.19 (5.54)
40 - 49 31 438.35 (19.19)
110.52 (5.98)
117.45 (7.21)
113.45 (4.41)
109.90 (4.88)
113.00 (5.82)
114.00 (6.61)
114.48 (6.05)
50 - 59 16 433.44 (22.13)
110.19 (5.60)
112.81 (6.77)
112.56 (5.15)
110.81 (7.20)
111.94 (6.47)
110.13 (5.07)
113.50 (6.07)
60 - 69 2 Insufficient Data
>=70 0 Insufficient Data
The mean score is presented on the top of each cell, with the standard deviation below in parentheses. Reports based on a sample of fewer than 50 test takers are representative of the performance of that sample only. Reports based on fewer than 50 test takers should not be considered representative of the larger group of like students, and inferences or generalizations about the larger population or subgroup should not be made based on such small samples.
6

Dyersburg State Community College Cohort Name: Dyersburg State Exit Exam 2013-2014
Abbreviated Close Date: 07/01/2014
Test Description: Abbreviated Form B Number of students tested: 297 Number of students included in these statistics: 286 Number of students excluded (see roster): 11
Number Total Score
Critical Thinking Reading Writing Mathematics Humanities Social
SciencesNatural
Sciences439.53 110.51 116.84 114.03 111.23 113.37 112.6 114.49(18.14) (5.96) (7.24) (4.95) (5.65) (5.87) (6.18) (6.07)427.77 107.45 113.94 111.51 108.3 110.91 110.74 111.34(13.79) (4.85) (6.29) (4.54) (3.98) (4.84) (6.04) (5.45)
Black Hispanic 6
Hispanic 7
Latino 0
American Indian or Alaskan Native 1
Other/Decline 8
Asian, Asian American or Pacific Islander 1442.76 111.32 117.67 114.72 112.05 113.95 113.29 115.26(17.91) (6.09) (7.26) (4.68) (5.68) (6.00) (6.11) (6.11)
The mean score is presented on the top of each cell, with the standard deviation below in parentheses.
Insufficient Data
Insufficient Data
White 216
Reports based on a sample of fewer than 50 test takers are representative of the performance of that sample only. Reports based on fewer than 50 test takers should not be considered representative of the larger group of like students, and inferences or generalizations about the larger population or subgroup should not be made based on such small samples.
ETS® Proficiency Profile
Demographic Analysis ReportEthnicity
African American 47
Insufficient Data
Insufficient Data
Insufficient Data
Insufficient Data
Total Group 286
7
Dyersburg State Commu Cohort Name: Dyersburg State Exit Exam 2013-2014 Abbreviated Close Date: 07/01/2014 Test Description: Abbreviated Form B Number of students tested: 297 Number of students included in these statistics: 286 Number of students excluded (see roster): 11
Number Total Score
Critical Thinking Reading Writing Mathematics Humanities Social
SciencesNatural
Sciences439.53 110.51 116.84 114.03 111.23 113.37 112.6 114.49(18.14) (5.96) (7.24) (4.95) (5.65) (5.87) (6.18) (6.07)446.55 111.89 119.08 114.77 113.93 114.7 113.67 116.7(18.84) (6.30) (6.92) (5.26) (6.15) (6.36) (6.49) (5.89)436.45 109.98 115.78 113.84 109.89 112.7 112.15 113.55(17.36) (5.79) (7.14) (4.91) (4.94) (5.56) (5.96) (5.94)
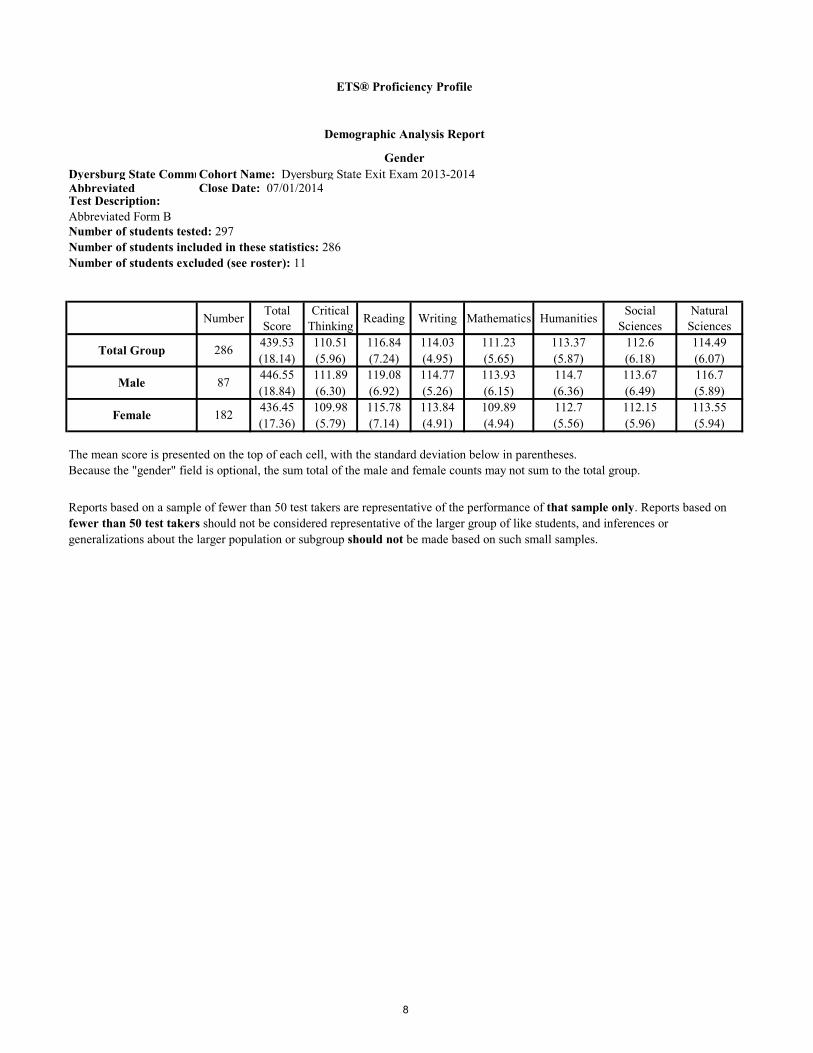
The mean score is presented on the top of each cell, with the standard deviation below in parentheses.Because the "gender" field is optional, the sum total of the male and female counts may not sum to the total group.
Male 87
Female 182
Reports based on a sample of fewer than 50 test takers are representative of the performance of that sample only. Reports based on fewer than 50 test takers should not be considered representative of the larger group of like students, and inferences or generalizations about the larger population or subgroup should not be made based on such small samples.
ETS® Proficiency Profile
Demographic Analysis Report
Gender
Total Group 286
8

Dyersburg State Community College Cohort Name: Dyersburg State Exit Exam 2013-2014 Abbreviated Close Date: 07/01/2014
Number of students tested: 297 Number of students included in these statistics: 286 Number of students excluded (see roster): 11
Number Total Score Critical Thinking Reading Writing Mathematics Humanities Social
SciencesNatural Sciences
439.53 110.51 116.84 114.03 111.23 113.37 112.6 114.49(18.14) (5.96) (7.24) (4.95) (5.65) (5.87) (6.18) (6.07)
Accounting 5Chemistry 3Communications 0
435.92 108.15 116.54 112.85 112.69 112.08 112.69 112.38(20.33) (5.27) (7.92) (4.22) (8.46) (7.37) (6.98) (6.02)436.53 110.71 115.94 113.53 109.12 114.29 111.41 114.59(17.28) (5.65) (7.79) (4.69) (3.48) (6.10) (6.78) (5.63)
Earth, Atmosphere & Marine Sciences 0Economics 1
440.93 110.54 116.21 115.18 111.68 113.14 112.5 114.21(20.72) (5.28) (8.56) (5.27) (6.07) (4.15) (7.63) (6.69)
Engineering & Engineering Technologies 1English 1Environmental Sciences 0Agriculture 4Foreign Languages & Literature 0Geological Sciences 0
443.74 112.05 117.38 115.46 111.85 113.74 114.18 115.1(16.30) (6.27) (7.18) (4.31) (4.62) (5.66) (5.79) (5.99)
History 4Liberal Studies 1Marketing 0Mathematical Sciences 0Music 3Philosophy 0Physics & Astronomy 0
439.85 110.13 117.69 114.41 110.94 113.13 113.37 114.26(15.68) (5.56) (6.55) (4.56) (5.38) (5.43) (6.16) (5.48)
Political Science 1442.13 112.25 117.44 115.13 110.25 114.56 113.44 115.63(13.74) (5.60) (6.64) (4.81) (2.56) (5.84) (5.76) (6.86)
Religion & Theology 0431.85 109.54 114.77 112.31 108.54 112 111.08 113.77(14.28) (5.58) (5.45) (3.60) (5.40) (4.67) (4.83) (6.77)
Sociology 4435.36 108.55 114.09 114.14 111.73 110.95 110.32 113.05(17.43) (4.94) (6.72) (4.88) (6.33) (5.14) (4.97) (6.18)
436 109.95 117.09 111.59 110.91 114.14 112.36 113.32(17.32) (6.03) (7.49) (5.20) (6.05) (5.60) (4.74) (6.64)
Other B 1Other C 1Anthropology & Archeology 0Architecture & Environmental Design 0Art & Art History 0Banking & Finance 0Biological Sciences 5
437.44 110.85 115.37 112.07 111.81 113.56 111.33 114.48(22.11) (6.14) (7.05) (5.05) (6.89) (6.74) (6.62) (4.63)
The mean score is presented on the top of each cell, with the standard deviation below in parentheses.
Insufficient DataInsufficient DataInsufficient Data
Business Administration 27
Reports based on a sample of fewer than 50 test takers are representative of the performance of that sample only. Reports based on fewer than 50 test takers should not be considered representative of the larger group of like students, and inferences or generalizations about the larger population or subgroup should not be made based on such small samples.
Other A 22
Insufficient DataInsufficient DataInsufficient DataInsufficient Data
Insufficient Data
Social Work 13
Insufficient Data
Undecided 22
Insufficient Data
Allied Health 54
Insufficient Data
Psychology 16
Insufficient DataInsufficient DataInsufficient DataInsufficient DataInsufficient DataInsufficient Data
Insufficient DataInsufficient DataInsufficient DataInsufficient Data
Health & Medical Sciences 39
Insufficient DataInsufficient Data
Education 28
Insufficient DataInsufficient Data
Insufficient DataInsufficient DataInsufficient Data
Computer & Information Sciences 13
Criminal Justice 17
Total Group 286
ETS® Proficiency Profile
Demographic Analysis Report
Major
Test Description: Abbreviated Form B
9

ETS® Proficiency Profile
Other Information Questions Report If you could start college over, would you choose to attend this college?
Dyersburg State Community College Cohort Name: Dyersburg State Exit Exam 2013-2014 Close Date: 07/01/2014 Abbreviated
Test Description: Abbreviated Form B Number of students tested: 297 Number of students included in these statistics: 286 Number of students excluded (see roster): 11
Number Total Score
Critical Thinking Reading Writing Mathematics Humanities
Social Sciences
Natural Sciences
Total Group 286 439.53
(18.14) 110.51 (5.96)
116.84 (7.24)
114.03 (4.95)
111.23 (5.65)
113.37 (5.87)
112.60 (6.18)
114.49 (6.07)
Strongly Agree 118 439.20
(18.51) 110.28 (6.00)
116.69 (7.56)
113.87 (5.13)
111.30 (5.58)
113.37 (6.11)
112.15 (6.35)
114.56 (6.10)
Agree 105 440.49 (18.10)
110.97 (5.68)
117.24 (6.81)
113.94 (4.81)
111.42 (6.14)
113.39 (5.47)
113.79 (5.83)
114.35 (6.06)
Neutral 35 437.71 (20.65)
109.34 (6.27)
116.46 (7.94)
114.57 (5.52)
110.60 (5.00)
113.77 (6.71)
111.14 (6.69)
113.69 (6.11)
Disagree 15 438.47 (10.78)
112.27 (6.64)
116.53 (5.18)
113.67 (3.82)
110.07 (4.74)
113.87 (4.79)
112.27 (5.45)
115.67 (5.91)
Strongly Disagree 12 440.33
(13.91) 109.58 (5.25)
116.17 (7.84)
114.92 (3.50)
112.33 (4.40)
111.42 (5.33)
111.33 (5.15)
115.50 (5.50)
No Response 1 Insufficient Data
The mean score is presented on the top of each cell, with the standard deviation below in parentheses. Reports based on a sample of fewer than 50 test takers are representative of the performance of that sample only. Reports based on fewer than 50 test takers should not be considered representative of the larger group of like students, and inferences or generalizations about the larger population or subgroup should not be made based on such small samples.
10
ETS® Proficiency Profile
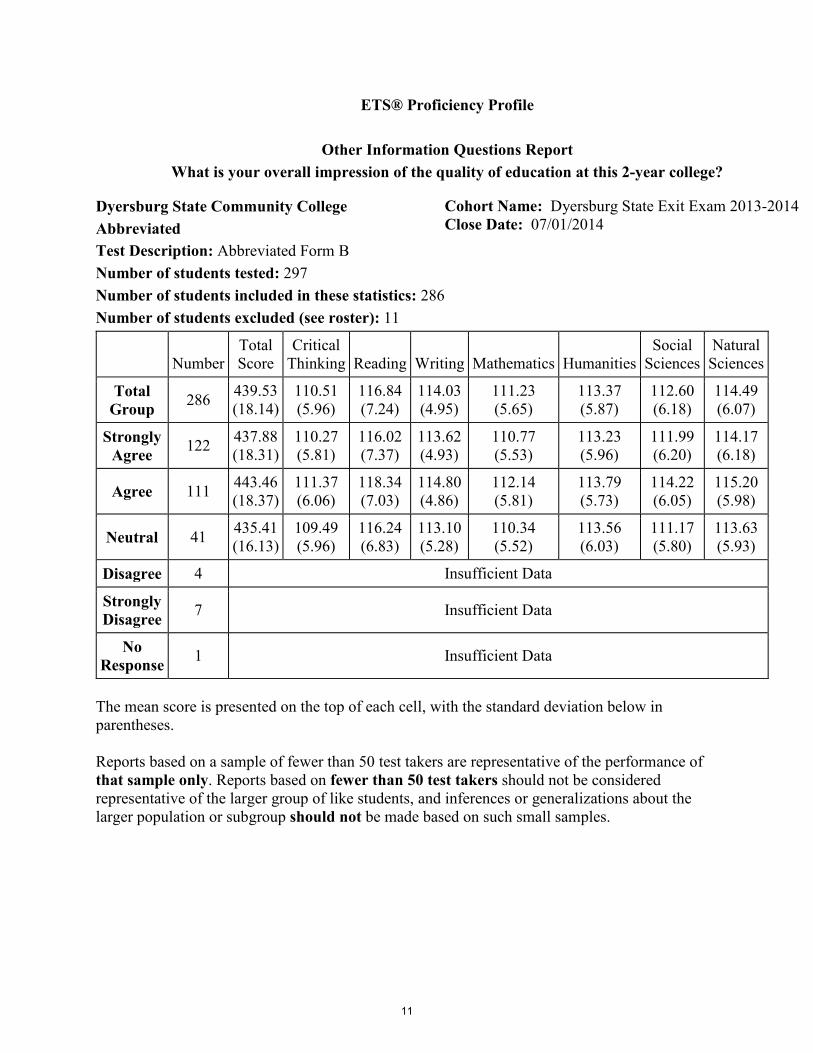
Other Information Questions Report What is your overall impression of the quality of education at this 2-year college?
Dyersburg State Community College Cohort Name: Dyersburg State Exit Exam 2013-2014 Close Date: 07/01/2014 Abbreviated
Test Description: Abbreviated Form B Number of students tested: 297 Number of students included in these statistics: 286 Number of students excluded (see roster): 11
Number Total Score
Critical Thinking Reading Writing Mathematics Humanities
Social Sciences
Natural Sciences
Total Group 286 439.53
(18.14) 110.51 (5.96)
116.84 (7.24)
114.03 (4.95)
111.23 (5.65)
113.37 (5.87)
112.60 (6.18)
114.49 (6.07)
Strongly Agree 122 437.88
(18.31) 110.27 (5.81)
116.02 (7.37)
113.62 (4.93)
110.77 (5.53)
113.23 (5.96)
111.99 (6.20)
114.17 (6.18)
Agree 111 443.46 (18.37)
111.37 (6.06)
118.34 (7.03)
114.80 (4.86)
112.14 (5.81)
113.79 (5.73)
114.22 (6.05)
115.20 (5.98)
Neutral 41 435.41 (16.13)
109.49 (5.96)
116.24 (6.83)
113.10 (5.28)
110.34 (5.52)
113.56 (6.03)
111.17 (5.80)
113.63 (5.93)
Disagree 4 Insufficient Data
Strongly Disagree 7 Insufficient Data
No Response 1 Insufficient Data
The mean score is presented on the top of each cell, with the standard deviation below in parentheses. Reports based on a sample of fewer than 50 test takers are representative of the performance of that sample only. Reports based on fewer than 50 test takers should not be considered representative of the larger group of like students, and inferences or generalizations about the larger population or subgroup should not be made based on such small samples.
11
ETS® Proficiency Profile
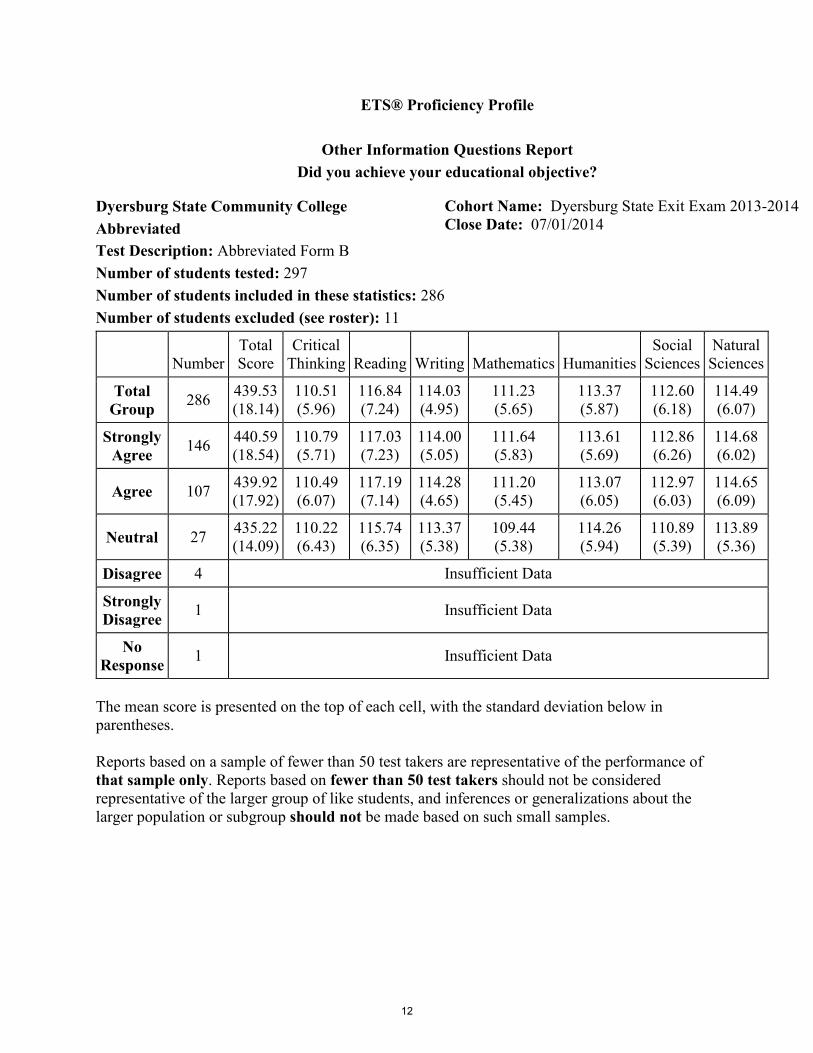
Other Information Questions Report Did you achieve your educational objective?
Dyersburg State Community College Cohort Name: Dyersburg State Exit Exam 2013-2014 Close Date: 07/01/2014 Abbreviated
Test Description: Abbreviated Form B Number of students tested: 297 Number of students included in these statistics: 286 Number of students excluded (see roster): 11
Number Total Score
Critical Thinking Reading Writing Mathematics Humanities
Social Sciences
Natural Sciences
Total Group 286 439.53
(18.14) 110.51 (5.96)
116.84 (7.24)
114.03 (4.95)
111.23 (5.65)
113.37 (5.87)
112.60 (6.18)
114.49 (6.07)
Strongly Agree 146 440.59
(18.54) 110.79 (5.71)
117.03 (7.23)
114.00 (5.05)
111.64 (5.83)
113.61 (5.69)
112.86 (6.26)
114.68 (6.02)
Agree 107 439.92 (17.92)
110.49 (6.07)
117.19 (7.14)
114.28 (4.65)
111.20 (5.45)
113.07 (6.05)
112.97 (6.03)
114.65 (6.09)
Neutral 27 435.22 (14.09)
110.22 (6.43)
115.74 (6.35)
113.37 (5.38)
109.44 (5.38)
114.26 (5.94)
110.89 (5.39)
113.89 (5.36)
Disagree 4 Insufficient Data
Strongly Disagree 1 Insufficient Data
No Response 1 Insufficient Data
The mean score is presented on the top of each cell, with the standard deviation below in parentheses. Reports based on a sample of fewer than 50 test takers are representative of the performance of that sample only. Reports based on fewer than 50 test takers should not be considered representative of the larger group of like students, and inferences or generalizations about the larger population or subgroup should not be made based on such small samples.
12
ETS® Proficiency Profile
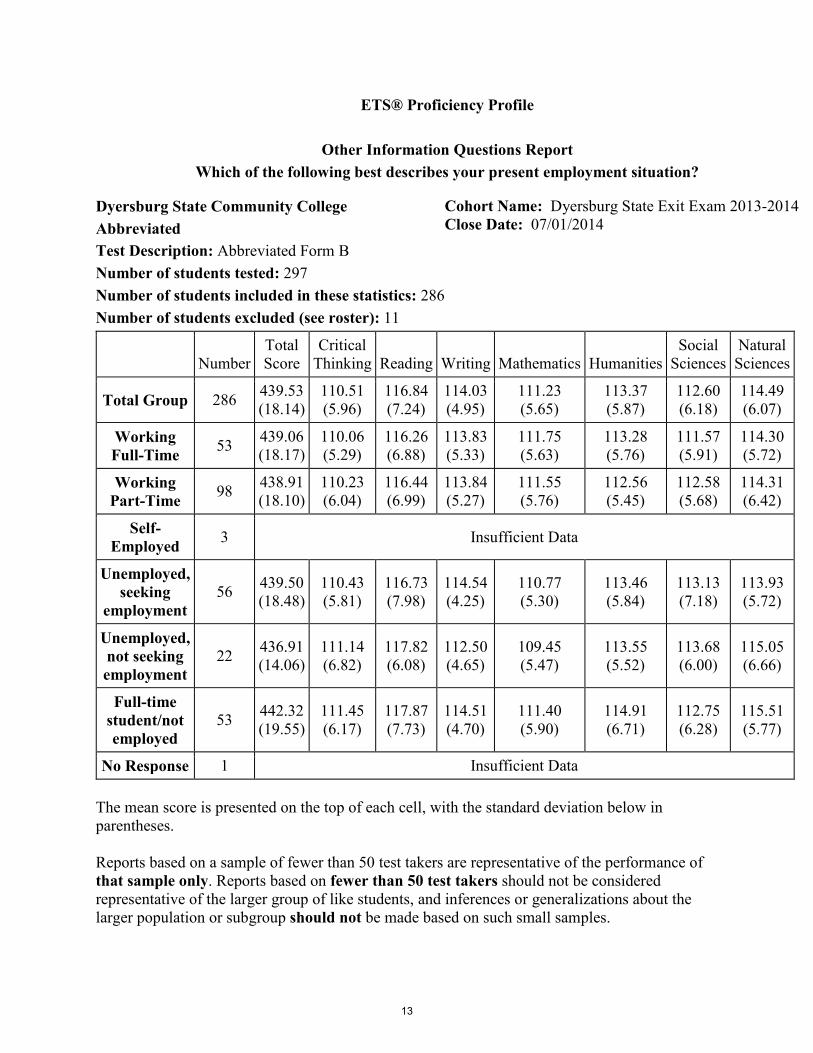
Other Information Questions Report Which of the following best describes your present employment situation?
Dyersburg State Community College Cohort Name: Dyersburg State Exit Exam 2013-2014 Close Date: 07/01/2014 Abbreviated
Test Description: Abbreviated Form B Number of students tested: 297 Number of students included in these statistics: 286 Number of students excluded (see roster): 11
Number Total Score
Critical Thinking Reading Writing Mathematics Humanities
Social Sciences
Natural Sciences
Total Group 286 439.53 (18.14)
110.51 (5.96)
116.84 (7.24)
114.03 (4.95)
111.23 (5.65)
113.37 (5.87)
112.60 (6.18)
114.49 (6.07)
Working Full-Time 53 439.06
(18.17) 110.06 (5.29)
116.26 (6.88)
113.83 (5.33)
111.75 (5.63)
113.28 (5.76)
111.57 (5.91)
114.30 (5.72)
Working Part-Time 98 438.91
(18.10) 110.23 (6.04)
116.44 (6.99)
113.84 (5.27)
111.55 (5.76)
112.56 (5.45)
112.58 (5.68)
114.31 (6.42)
Self-Employed 3 Insufficient Data
Unemployed, seeking
employment 56 439.50
(18.48) 110.43 (5.81)
116.73 (7.98)
114.54 (4.25)
110.77 (5.30)
113.46 (5.84)
113.13 (7.18)
113.93 (5.72)
Unemployed, not seeking employment
22 436.91 (14.06)
111.14 (6.82)
117.82 (6.08)
112.50 (4.65)
109.45 (5.47)
113.55 (5.52)
113.68 (6.00)
115.05 (6.66)
Full-time student/not employed
53 442.32 (19.55)
111.45 (6.17)
117.87 (7.73)
114.51 (4.70)
111.40 (5.90)
114.91 (6.71)
112.75 (6.28)
115.51 (5.77)
No Response 1 Insufficient Data
The mean score is presented on the top of each cell, with the standard deviation below in parentheses. Reports based on a sample of fewer than 50 test takers are representative of the performance of that sample only. Reports based on fewer than 50 test takers should not be considered representative of the larger group of like students, and inferences or generalizations about the larger population or subgroup should not be made based on such small samples.
13
ETS® Proficiency Profile
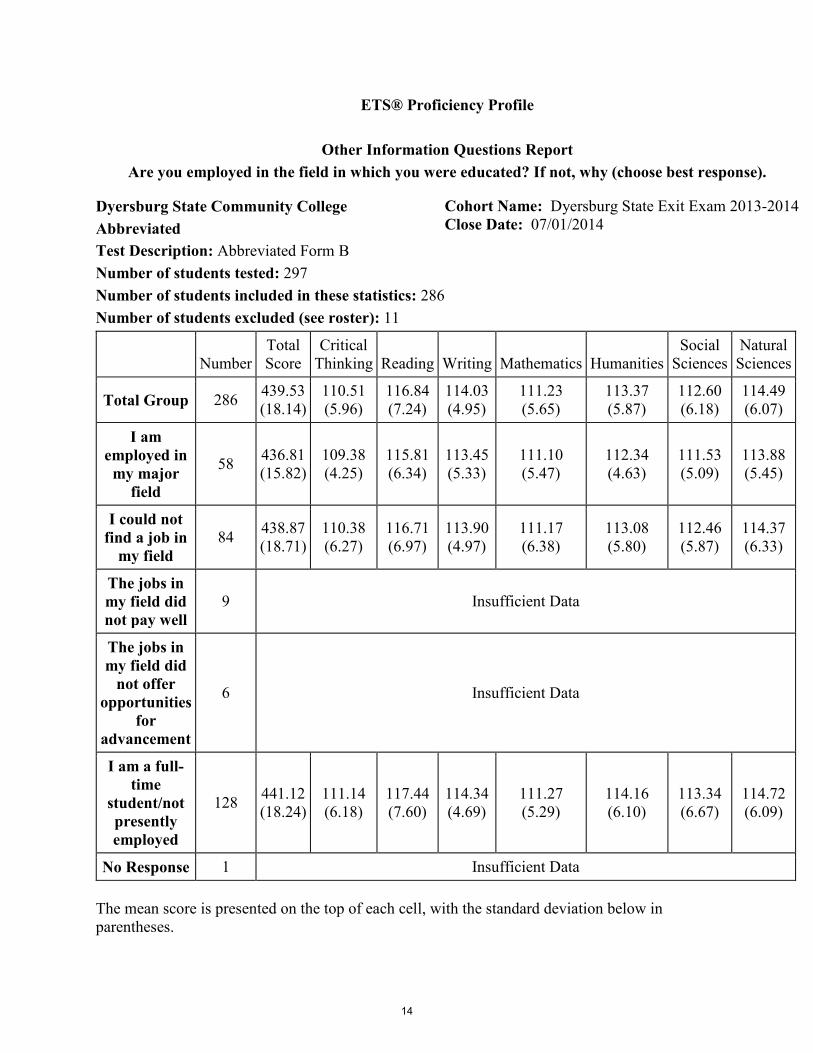
Other Information Questions Report Are you employed in the field in which you were educated? If not, why (choose best response).
Dyersburg State Community College Cohort Name: Dyersburg State Exit Exam 2013-2014 Close Date: 07/01/2014 Abbreviated
Test Description: Abbreviated Form B Number of students tested: 297 Number of students included in these statistics: 286 Number of students excluded (see roster): 11
Number Total Score
Critical Thinking Reading Writing Mathematics Humanities
Social Sciences
Natural Sciences
Total Group 286 439.53 (18.14)
110.51 (5.96)
116.84 (7.24)
114.03 (4.95)
111.23 (5.65)
113.37 (5.87)
112.60 (6.18)
114.49 (6.07)
I am employed in
my major field
58 436.81 (15.82)
109.38 (4.25)
115.81 (6.34)
113.45 (5.33)
111.10 (5.47)
112.34 (4.63)
111.53 (5.09)
113.88 (5.45)
I could not find a job in
my field 84 438.87
(18.71) 110.38 (6.27)
116.71 (6.97)
113.90 (4.97)
111.17 (6.38)
113.08 (5.80)
112.46 (5.87)
114.37 (6.33)
The jobs in my field did not pay well
9 Insufficient Data
The jobs in my field did
not offer opportunities
for advancement
6 Insufficient Data
I am a full-time
student/not presently employed
128 441.12 (18.24)
111.14 (6.18)
117.44 (7.60)
114.34 (4.69)
111.27 (5.29)
114.16 (6.10)
113.34 (6.67)
114.72 (6.09)
No Response 1 Insufficient Data
The mean score is presented on the top of each cell, with the standard deviation below in parentheses.
14
ETS® Proficiency Profile
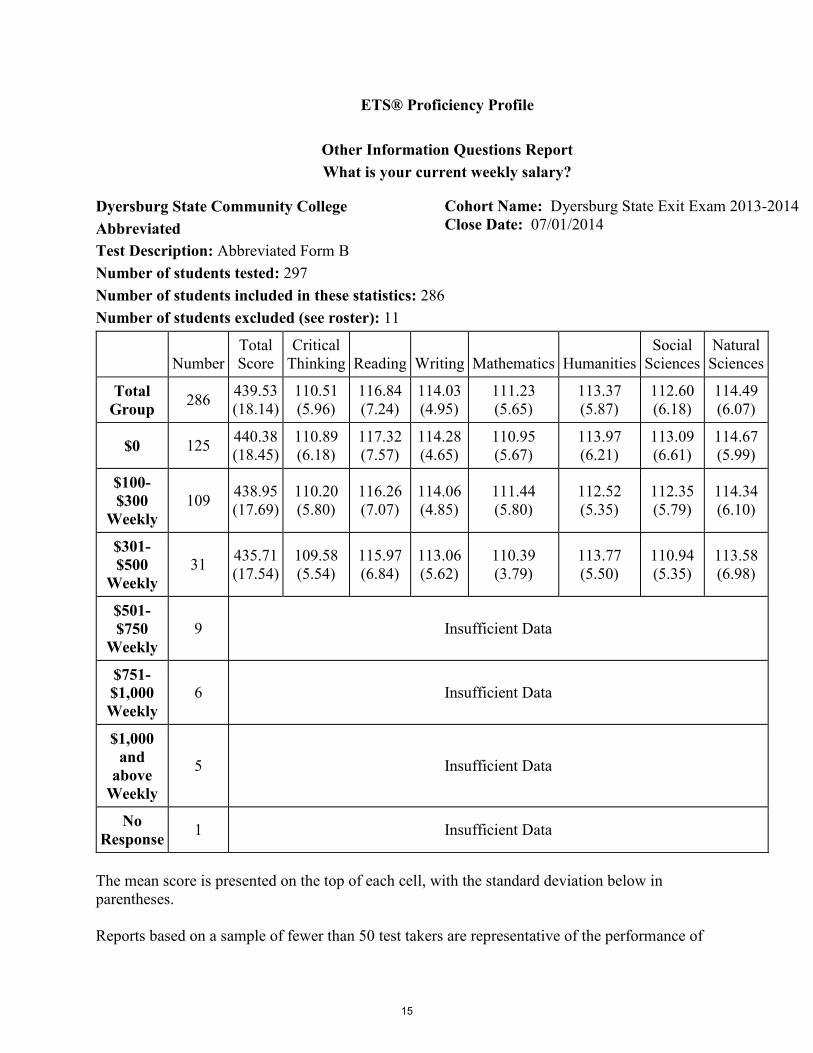
Other Information Questions Report What is your current weekly salary?
Dyersburg State Community College Cohort Name: Dyersburg State Exit Exam 2013-2014 Close Date: 07/01/2014 Abbreviated
Test Description: Abbreviated Form B Number of students tested: 297 Number of students included in these statistics: 286 Number of students excluded (see roster): 11
Number Total Score
Critical Thinking Reading Writing Mathematics Humanities
Social Sciences
Natural Sciences
Total Group 286 439.53
(18.14) 110.51 (5.96)
116.84 (7.24)
114.03 (4.95)
111.23 (5.65)
113.37 (5.87)
112.60 (6.18)
114.49 (6.07)
$0 125 440.38 (18.45)
110.89 (6.18)
117.32 (7.57)
114.28 (4.65)
110.95 (5.67)
113.97 (6.21)
113.09 (6.61)
114.67 (5.99)
$100-$300
Weekly 109 438.95
(17.69) 110.20 (5.80)
116.26 (7.07)
114.06 (4.85)
111.44 (5.80)
112.52 (5.35)
112.35 (5.79)
114.34 (6.10)
$301-$500
Weekly 31 435.71
(17.54) 109.58 (5.54)
115.97 (6.84)
113.06 (5.62)
110.39 (3.79)
113.77 (5.50)
110.94 (5.35)
113.58 (6.98)
$501-$750
Weekly 9 Insufficient Data
$751-$1,000 Weekly
6 Insufficient Data
$1,000 and
above Weekly
5 Insufficient Data
No Response 1 Insufficient Data
The mean score is presented on the top of each cell, with the standard deviation below in parentheses. Reports based on a sample of fewer than 50 test takers are representative of the performance of
15

Dyersburg State Community College Cohort Name: Dyersburg State Exit Exam 2013-2014 Abbreviated Close Date: 07/01/2014
Test Description: Abbreviated Form B
Number of students tested: 297 Number of students included in these statistics: 286 Number of students excluded (see roster): 11
Total Critical Social NaturalScore Thinking Sciences Sciences
439.53 110.51 116.84 114.03 111.23 113.37 112.6 114.49(18.14) (5.96) (7.24) (4.95) (5.65) (5.87) (6.18) (6.07)
438.77 110.31 116.43 113.87 111.15 113.29 112.43 114.09
(18.85) (5.84) (7.47) (5.09) (5.39) (6.01) (6.38) (6.02)436.2 109.07 116.6 113.07 110.63 111.7 112.17 114.45
(16.41) (5.04) (6.69) (4.59) (5.47) (5.15) (5.45) (5.79)
444.33 112.2 118.05 115.17 112.09 114.94 113.62 115.37
(16.62) (6.35) (6.84) (4.34) (6.28) (5.75) (6.07) (6.00)Enlisted or planning to enlist in the military service 1
Medical condition interrupting plans of employment or continuing education
2
Family situation interrupting plans of employment or continuing education
3
Participating in a volunteer service arrangement (such as Peace Corps, Mission work, etc)
4
No Response 1
The mean score is presented on the top of each cell, with the standard deviation below in parentheses.
Insufficient Data
Insufficient Data
Insufficient Data
Not seeking employment 60
Planning to transfer to another educational institution 81
Insufficient Data
Insufficient Data
Reports based on a sample of fewer than 50 test takers are representative of the performance of that sample only. Reports based on fewer than 50 test takers should not be considered representative of the larger group of like students, and inferences or generalizations about the larger population or subgroup should not be made based on such small samples.
Question 7
ETS® Proficiency Profile
Other Information Questions Report
If you are NOT employed, which of the following best describes your employment status?
Number Reading Writing Mathematics Humanities
Total Group 286
Seeking employment relating to my field of study at DSCC 134
16