Embed Size (px)
Citation preview
� Corresponding author. T
E-mail address: zhoujin_
0960-1481/$ - see front mat
doi:10.1016/j.renene.2004.0
el.: +86-29-8266-8738; fax: +86-29-8266-8725.
[email protected] (Z. Jin).
ter # 2003 Elsevier Ltd. All rights reserved.
1.014
Renewable Energy 29 (2004) 1537–1548
www.elsevier.com/locate/renene
Data bank
Estimation of daily diffuse solar radiationin China
Zhou Jin �, Wu Yezheng, Yan GangSchool of Energy and Power Engineering, Xi’an Jiaotong University, Xi’an 710049, China
Received 21 January 2004; accepted 25 January 2004
Abstract
Applying the measured global and diffuse solar radiation data from 78 meteorologicalstations in China, a countrywide general correlation model for calculating the daily diffuseradiation was derived on the basis of Liu and Jordan method. Two widely used statistics:root mean square error and mean bias error were used to assess the performance of thecorrelation. And the correlation shows good behavior when applied to most of the stations.Subsequently, with the measured data from the 78 stations, an analysis of geographical dis-tribution of solar energy resource in China was also presented in the form of clearness index(the ratio of global solar radiation to extraterrestrial radiation) percentage frequency, andresults show that the solar energy resource in western and northern China is relativelyabundant.# 2003 Elsevier Ltd. All rights reserved.
Keywords: Diffuse radiation; Global solar radiation; Correlation models; Geographical distribution
1. Introduction
China, as a developing country with a population of 1.3 billion, is the second
largest energy consumer in the world, and its energy structure is coal-based, with
coal consumption amounting to about 70% of total energy consumption. In an
environment of a rapidly expanding economy, China’s energy industry is con-
fronted with dual pressures from economic development and environmental protec-
tion. In order to have a sustainable development, renewable energy is being
seriously considered for satisfying part of the energy demand in China, as in the
Nomenclature
f eccentricity correction factor (dimensionless)F distribution frequency (%)H0 daily extraterrestrial radiation (MJ/m2)
H0 monthly average daily extraterrestrial radiation (MJ/m2)
Hd daily diffuse solar radiation (MJ/m2)Ht daily global solar radiation (MJ/m2)
H t monthly average daily global solar radiation (MJ/m2)
I0 solar contant (1367 W/m2)Kd daily global clearnessKt daily diffuse fractionMBE mean bias error (%)n number of day of year starting from the first of JanuaryN number of dataRMSE root mean square error (%)
S monthly average daily sunshine duration (h)
S0 monthly average daily maximum possible sunshine duration (h)
ws sunrise hour angle (v)
Z altitude of site (m)d solar declination (
v)
k latitude of site(v)
Z. Jin et al. / Renewable Energy 29 (2004) 1537–15481538
world. Solar energy, as a clean energy source and one kind of renewable energy, isabundant in China. More than two-thirds of area in China receives an annual solarradiation that exceeds 5.9 GJ/m2 with more than 2200 h sunshine per annum [1].Government targets for solar energy utilization are about 3% of total energy useby 2010 [1]. In this respect, the importance of solar radiation data for the designand efficient operation of solar energy systems and associated energy storage sys-tem has been recognized in recent years.
The global solar radiation can be divided into two components: (1) diffuse solarradiation, which results from scattering caused by gases in the Earth’s atmosphere,dispersed water droplets and particulates; and (2) direct solar radiation, which havenot been scattered. Global solar radiation is the algebraic sum of the two compo-nents. Values of global and diffuse radiations are essential for research and engin-eering applications. For China, horizontal global radiation data have beenrecorded at many meteorological stations, but the corresponding diffuse radiationrecords are scarce at some stations. Thus, the diffuse radiation must be estimatedthrough models and correlations. The first model originally developed by Liu andJordan [2] relates the diffuse solar radiation with global solar radiation based onthe data from 98 localities in the USA and Canada. Following the work by Liuand Jordan, many researchers [3–11] have studied the correlations with data in
1539Z. Jin et al. / Renewable Energy 29 (2004) 1537–1548
other regions. Some researchers have found [9] that the regression parameters inthe correlations determined by linear regression using the daily global and diffusesolar radiation at different sites often show remarkable similarity. However, whenthe monthly average daily global and diffuse radiation is used to form theregression correlations, the regression parameters have been found to vary substan-tially between sites and the accuracy of the correlation reduced [10,11].
The study of correlation between global and diffuse solar radiation is very lim-ited in China. Few attempts to develop models, through which the diffuse solarradiation can be estimated, have been found in China. Wenxian et al. [12,13] havestudied the relationship between direct and global solar radiation with the observeddata for only several stations in the Yunnan Province, China, and suggested a cor-relation to estimate the direct radiation, by which the diffuse radiation can beobtained by subtracting the direct radiation from the global radiation. Obviously,this study is valid only for the locality used in the analysis.
The objective of this paper are the follows: (1) to develop and test method toestimate the diffused solar radiation using global solar radiation based on the datain 78 locations in China, and (2) to analyze the geographical distribution of solarenergy resource in China.
2. Data used and methods of analysis
2.1. Database
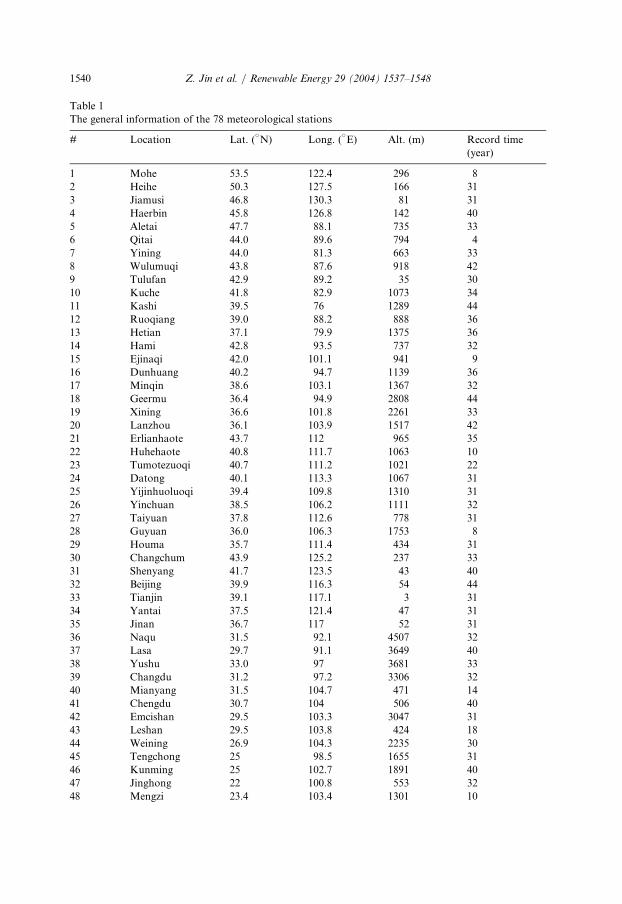
In this study, a database containing daily measured value of global and diffusesolar radiation, covering 78 meteorological stations in China was obtained fromChina Meteorological administration. Information for the meteorological stationsand the periods of the data considered are given in Table 1. These stations cover alatitudinal range from 15.9
vto 53.5
vand a longitudinal range from 76.0
vto 130.3
v,
and have largely varied altitude from 1 to 4507 m. All the major biomes withinChina are represented.
Valid measurements were extracted from the database from those days withcomplete records based on the following criteria: (1) Ht=H0 � 1:0 and (2)Hd=Ht � 1:0, where Ht is the daily global radiation, Hd is the daily diffuse radi-ation, and H0 is extraterrestrial radiation. These two criteria were used to removeobvious errors in the database.
2.2. Method
Based on the individual daily global and diffuse solar radiation data, the dailyglobal clearness Kt and the daily diffuse fraction Kd were calculated by
Kt ¼Ht
H0ð1Þ
Kd ¼ Hd
Htð2Þ
Z. Jin et al. / Renewable Energy 29 (2004) 1537–15481540
Table 1
The general information of the 78 meteorological stations
# L
ocation L at. (vN) L ong. (vE) A
lt. (m) Record time(year)
1 M
ohe 5 3.5 1 22.4 296 82 H
eihe 5 0.3 1 27.5 166 313 J
iamusi 4 6.8 1 30.3 81 314 H
aerbin 4 5.8 1 26.8 142 405 A
letai 4 7.7 88.1 735 336 Q
itai 4 4.0 89.6 794 47 Y
ining 4 4.0 81.3 663 338 W
ulumuqi 4 3.8 87.6 918 429 T
ulufan 4 2.9 89.2 35 3010 K
uche 4 1.8 82.9 1 073 3411 K
ashi 3 9.5 76 1 289 4412 R
uoqiang 3 9.0 88.2 888 3613 H
etian 3 7.1 79.9 1 375 3614 H
ami 4 2.8 93.5 737 3215 E
jinaqi 4 2.0 1 01.1 941 916 D
unhuang 4 0.2 94.7 1 139 3617 M
inqin 3 8.6 1 03.1 1 367 3218 G
eermu 3 6.4 94.9 2 808 4419 X
ining 3 6.6 1 01.8 2 261 3320 L
anzhou 3 6.1 1 03.9 1 517 4221 E
rlianhaote 4 3.7 1 12 965 3522 H
uhehaote 4 0.8 1 11.7 1 063 1023 T
umotezuoqi 4 0.7 1 11.2 1 021 2224 D
atong 4 0.1 1 13.3 1 067 3125 Y
ijinhuoluoqi 3 9.4 1 09.8 1 310 3126 Y
inchuan 3 8.5 1 06.2 1 111 3227 T
aiyuan 3 7.8 1 12.6 778 3128 G
uyuan 3 6.0 1 06.3 1 753 829 H
ouma 3 5.7 1 11.4 434 3130 C
hangchum 4 3.9 1 25.2 237 3331 S
henyang 4 1.7 1 23.5 43 4032 B
eijing 3 9.9 1 16.3 54 4433 T
ianjin 3 9.1 1 17.1 3 3134 Y
antai 3 7.5 1 21.4 47 3135 J
inan 3 6.7 1 17 52 3136 N
aqu 3 1.5 92.1 4 507 3237 L
asa 2 9.7 91.1 3 649 4038 Y
ushu 3 3.0 97 3 681 3339 C
hangdu 3 1.2 97.2 3 306 3240 M
ianyang 3 1.5 1 04.7 471 1441 C
hengdu 3 0.7 1 04 506 4042 E
mcishan 2 9.5 1 03.3 3 047 3143 L
eshan 2 9.5 1 03.8 424 1844 W
eining 2 6.9 1 04.3 2 235 3045 T
engchong 2 5 98.5 1 655 3146 K
unming 2 5 1 02.7 1 891 4047 J
inghong 2 2 1 00.8 553 3248 M
engzi 2 3.4 1 03.4 1 301 10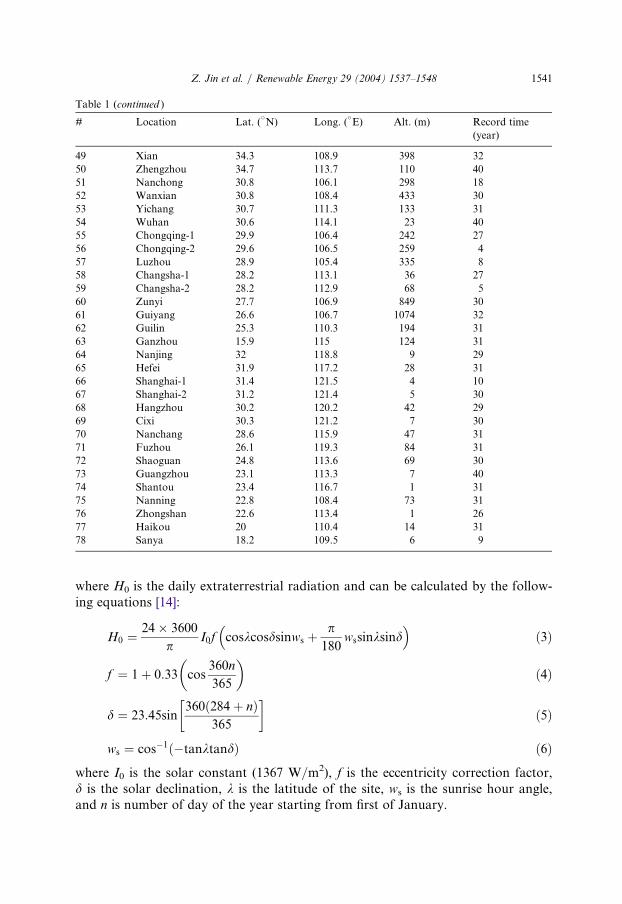
1541Z. Jin et al. / Renewable Energy 29 (2004) 1537–1548
where H0 is the daily extraterrestrial radiation and can be calculated by the follow-ing equations [14]:
H0 ¼24� 3600
pI0f coskcosdsinws þ
p180
wssinksind� �
ð3Þ
f ¼ 1 þ 0:33 cos360n
365
� �ð4Þ
d ¼ 23:45sin360ð284þ nÞ
365
� �ð5Þ
ws ¼ cos�1 �tanktandð Þ ð6Þ
where I0 is the solar constant (1367 W/m2), f is the eccentricity correction factor,d is the solar declination, k is the latitude of the site, ws is the sunrise hour angle,and n is number of day of the year starting from first of January.
Table 1 (continued )
#
Location L at. (vN) Long. (vE)
Alt. (m) Record time(year)
49
Xian 3 4.3 108.9 398 3250
Zhengzhou 3 4.7 113.7 110 4051
Nanchong 3 0.8 106.1 298 1852
Wanxian 3 0.8 108.4 433 3053
Yichang 3 0.7 111.3 133 3154
Wuhan 3 0.6 114.1 23 4055
Chongqing-1 2 9.9 106.4 242 2756
Chongqing-2 2 9.6 106.5 259 457
Luzhou 2 8.9 105.4 335 858
Changsha-1 2 8.2 113.1 36 2759
Changsha-2 2 8.2 112.9 68 560
Zunyi 2 7.7 106.9 849 3061
Guiyang 2 6.6 106.7 1074 3262
Guilin 2 5.3 110.3 194 3163
Ganzhou 1 5.9 115 124 3164
Nanjing 3 2 118.8 9 2965
Hefei 3 1.9 117.2 28 3166
Shanghai-1 3 1.4 121.5 4 1067
Shanghai-2 3 1.2 121.4 5 3068
Hangzhou 3 0.2 120.2 42 2969
Cixi 3 0.3 121.2 7 3070
Nanchang 2 8.6 115.9 47 3171
Fuzhou 2 6.1 119.3 84 3172
Shaoguan 2 4.8 113.6 69 3073
Guangzhou 2 3.1 113.3 7 4074
Shantou 2 3.4 116.7 1 3175
Nanning 2 2.8 108.4 73 3176
Zhongshan 2 2.6 113.4 1 2677
Haikou 2 0 110.4 14 3178
Sanya 1 8.2 109.5 6 9
Z. Jin et al. / Renewable Energy 29 (2004) 1537–15481542
To analyze the correlations between daily diffuse radiation and correspondingglobal radiation, constant or linear expressions depending on the daily clearnessindex are generally used:
Kd ¼ a0 for Kt � d0 ð7ÞKd ¼ b0 þ b1Kt for d0 < Kt � d1 ð8ÞKd ¼ c0 for Kt > d1 ð9Þ
where d0 and d1 are the range limits of the daily clearness index, a0, b0, b1 and c0are empirical coefficients.
In order to study the site dependence on the daily diffuse radiaion with datafrom the 78 stations, the following correlation was also used in this study when Kt
lies between d0 and d1:
Kd ¼ b2 þ b3k þ b4Zð Þ þ b5 þ b6k þ b7Zð ÞKt for d0 < kt � d1 ð10Þwhere k is the latitude, Z is the altitude in kilometer, and b2–b7 are empirical coeffi-cients.
2.3. Methods of model evaluation
The accuracy of the correlations was assessed by means of two widely used stat-istics: root mean square error (RMSE) and mean bias error (MBE). The followingexpressions for RMSE and MBE, as a percentage of the average value, were used:
RMSE ¼ 100
D
ffiffiffiffiffiffiffiffiffiffiffiffiffiffiffiffiffiffiffiffiffiffiffiffiffiffiffiffiffiffiffiffiffiffiffiffiffiffiffiXNi¼1
Die �Dimð Þ2=N
vuut ð11Þ
MBE ¼ 100
D
XNi¼1
Die �Dimð Þ=N" #
ð12Þ
where N is the number of data, Die is the ith estimated value, Dim is the ith mea-sured value and D is the mean of the measured values.
3. Results and discussion
3.1. Correlations between the daily diffuse radiation and the corresponding globalradiation
In order to obtain the general correlation between daily diffuse and global solarradiation, the daily data for all stations were pooled across all years and were ana-lyzed. The value of d0 and d1 was set to 0.20 and 0.75, respectively. The value of a0
was determined by averaging Kd for days when Kt was less than 0.20, and the valueof c0 was determined by averaging Kd for days when Kt was higher than 0.75. Thenempirical coefficients in Eqs. (8) and (10) were estimated by linear regression usingall data where Kt lies between 0.20 and 0.75.
1543Z. Jin et al. / Renewable Energy 29 (2004) 1537–1548
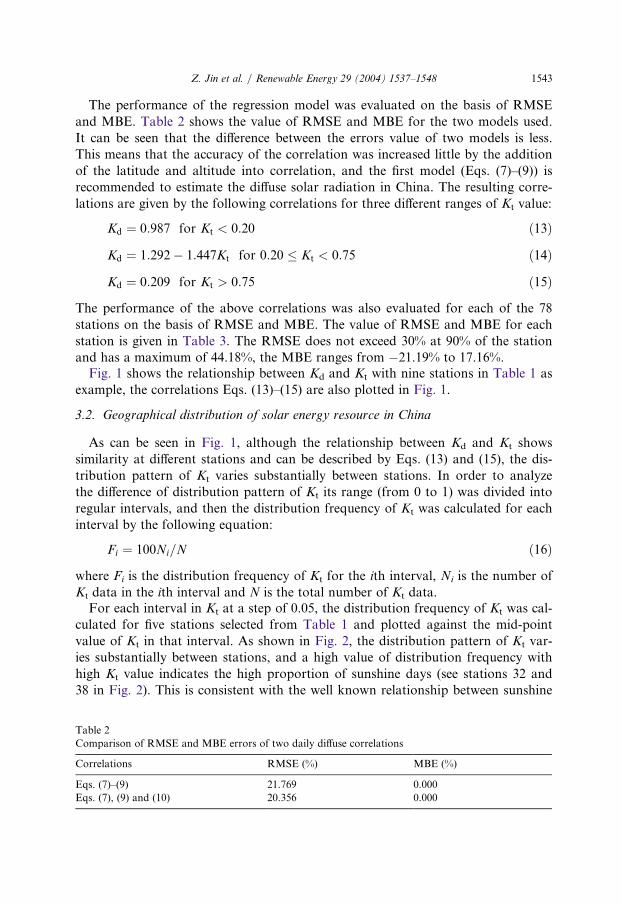
The performance of the regression model was evaluated on the basis of RMSE
and MBE. Table 2 shows the value of RMSE and MBE for the two models used.
It can be seen that the difference between the errors value of two models is less.This means that the accuracy of the correlation was increased little by the addition
of the latitude and altitude into correlation, and the first model (Eqs. (7)–(9)) isrecommended to estimate the diffuse solar radiation in China. The resulting corre-
lations are given by the following correlations for three different ranges of Kt value:
Kd ¼ 0:987 for Kt < 0:20 ð13Þ
Kd ¼ 1:292� 1:447Kt for 0:20 � Kt < 0:75 ð14Þ
Kd ¼ 0:209 for Kt > 0:75 ð15Þ
The performance of the above correlations was also evaluated for each of the 78
stations on the basis of RMSE and MBE. The value of RMSE and MBE for each
station is given in Table 3. The RMSE does not exceed 30% at 90% of the stationand has a maximum of 44.18%, the MBE ranges from �21.19% to 17.16%.
Fig. 1 shows the relationship between Kd and Kt with nine stations in Table 1 as
example, the correlations Eqs. (13)–(15) are also plotted in Fig. 1.
3.2. Geographical distribution of solar energy resource in China
As can be seen in Fig. 1, although the relationship between Kd and Kt shows
similarity at different stations and can be described by Eqs. (13) and (15), the dis-
tribution pattern of Kt varies substantially between stations. In order to analyzethe difference of distribution pattern of Kt its range (from 0 to 1) was divided into
regular intervals, and then the distribution frequency of Kt was calculated for eachinterval by the following equation:
Fi ¼ 100Ni=N ð16Þ
where Fi is the distribution frequency of Kt for the ith interval, Ni is the number of
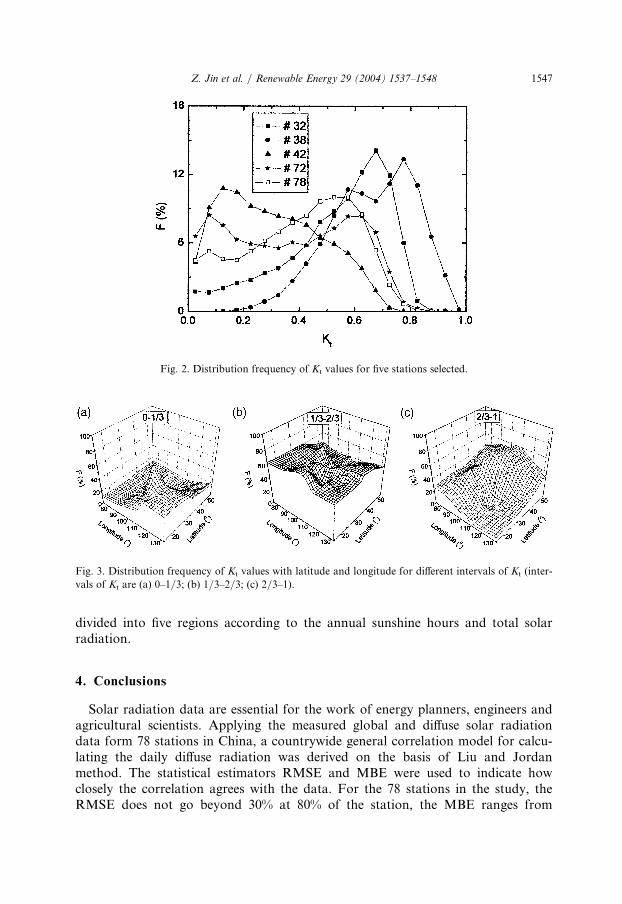
Kt data in the ith interval and N is the total number of Kt data.For each interval in Kt at a step of 0.05, the distribution frequency of Kt was cal-
culated for five stations selected from Table 1 and plotted against the mid-point
value of Kt in that interval. As shown in Fig. 2, the distribution pattern of Kt var-ies substantially between stations, and a high value of distribution frequency with
high Kt value indicates the high proportion of sunshine days (see stations 32 and38 in Fig. 2). This is consistent with the well known relationship between sunshine
Table 2
Comparison of RMSE and MBE errors of two daily diffuse correlations
Correlations R
MSE (%) M BE (%)Eqs. (7)–(9) 2
1.769 0 .000Eqs. (7), (9) and (10) 2
0.356 0 .000
Z. Jin et al. / Renewable Energy 29 (2004) 1537–15481544
Table 3
RMSE and MBE errors for each of the 78 stations for daily diffuse radiation correlations (Eqs.
(13)– (15))
#
Locations RMSE M BE1
Mohe 27.38 �4.382
Heibe 29.47 0.333
Jiamusi 28.22 7.294
Haerbin 25.81 8.075
Aletai 35.55 �5.106
Qitai 30.40 6.187
Yining 33.48 1.058
Wulumuqi 26.78 7.949
Tulufan 24.72 �7.7810
Kuche 31.84 � 21.1911
Kashi 27.22 � 10.7812
Ruoqiang 32.25 � 20.9513
Hetian 29.83 � 20.6114
Hami 31.79 � 12.5815
Ejinaqi 28.30 �0.8916
Dunhuang 32.48 � 17.0017
Minqin 29.96 �5.3218
Geermu 33.72 � 15.6719
Xining 24.95 �6.5820
Lanzhou 19.46 �4.5921
Erlianhaote 36.53 �4.3522
Huhehaote 29.91 � 11.2123
Tumotezuoqi 35.52 17.1624
Datong 23.63 0.1925
Yijnhuoluoqi 32.75 7.2126
Yinchuan 24.53 � 10.7027
Taiyunn 19.90 �1.2928
Guyuan 19.16 �5.0429
Houma 17.85 �1.9830
Changchun 24.89 1.9531
Shenyang 21.86 5.9032
Beijing 19.59 �2.8033
Tianjin 21.97 3.1634
Yantai 29.45 14.1735
Jinan 20.34 7.2936
Naqu 44.18 8.2437
Lasa 35.95 8.6638
Yushu 29.66 0.1539
Changdu 32.15 9.9540
Mianyang 10.33 �3.4141
Chengdu 10.52 �3.0442
Emcishan 19.31 �5.0143
Leshan 9.99 �1.1944
Weining 17.96 3.1545
Tengchong 21.01 5.9146
Kunming 21.18 6.5247
Jinghong 26.27 9.1148
Mengzi 22.19 6.81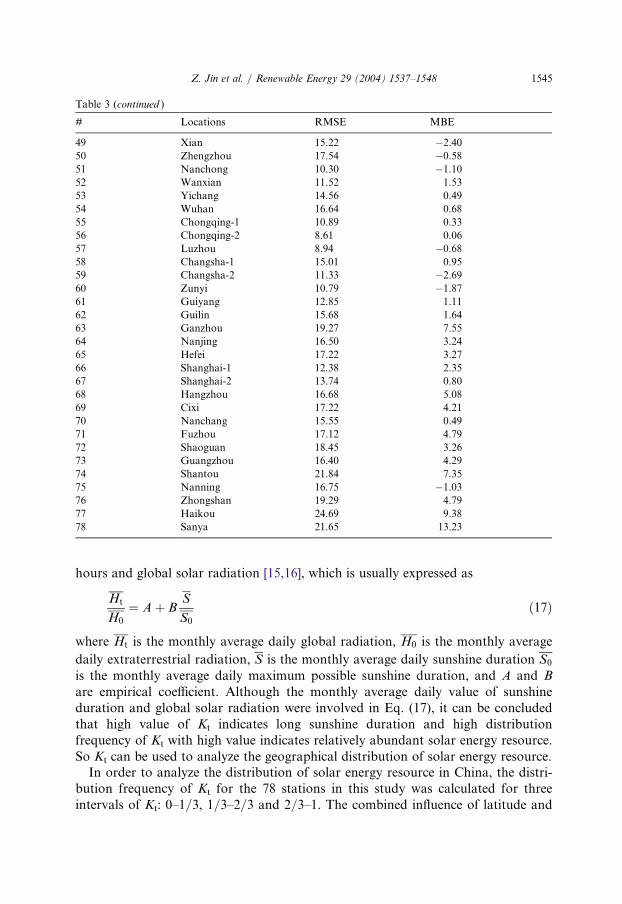
1545Z. Jin et al. / Renewable Energy 29 (2004) 1537–1548
hours and global solar radiation [15,16], which is usually expressed as
Ht
H0
¼ Aþ B SS0
ð17Þ
where Ht is the monthly average daily global radiation, H0 is the monthly average
daily extraterrestrial radiation, S is the monthly average daily sunshine duration S0is the monthly average daily maximum possible sunshine duration, and A and Bare empirical coefficient. Although the monthly average daily value of sunshineduration and global solar radiation were involved in Eq. (17), it can be concludedthat high value of Kt indicates long sunshine duration and high distributionfrequency of Kt with high value indicates relatively abundant solar energy resource.So Kt can be used to analyze the geographical distribution of solar energy resource.
In order to analyze the distribution of solar energy resource in China, the distri-bution frequency of Kt for the 78 stations in this study was calculated for threeintervals of Kt: 0–1/3, 1/3–2/3 and 2/3–1. The combined influence of latitude and
Table 3 (continued )
# L
ocations RMSE MBE49 X
ian 15.22 �2.4050 Z
hengzhou 17.54 �0.5851 N
anchong 10.30 �1.1052 W
anxian 11.52 1.5353 Y
ichang 14.56 0.4954 W
uhan 16.64 0.6855 C
hongqing-1 10.89 0.3356 C
hongqing-2 8.61 0.0657 L
uzhou 8.94 �0.6858 C
hangsha-1 15.01 0.9559 C
hangsha-2 11.33 �2.6960 Z
unyi 10.79 �1.8761 G
uiyang 12.85 1.1162 G
uilin 15.68 1.6463 G
anzhou 19.27 7.5564 N
anjing 16.50 3.2465 H
efei 17.22 3.2766 S
hanghai-1 12.38 2.3567 S
hanghai-2 13.74 0.8068 H
angzhou 16.68 5.0869 C
ixi 17.22 4.2170 N
anchang 15.55 0.4971 F
uzhou 17.12 4.7972 S
haoguan 18.45 3.2673 G
uangzhou 16.40 4.2974 S
hantou 21.84 7.3575 N
anning 16.75 �1.0376 Z
hongshan 19.29 4.7977 H
aikou 24.69 9.3878 S
anya 21.65 13.23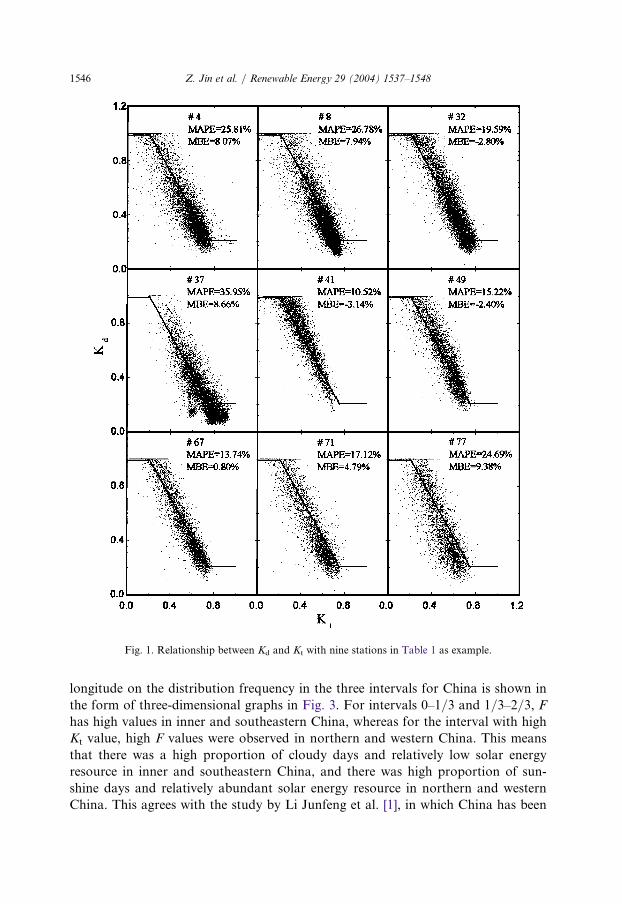
Z. Jin et al. / Renewable Energy 29 (2004) 1537–15481546
longitude on the distribution frequency in the three intervals for China is shown in
the form of three-dimensional graphs in Fig. 3. For intervals 0–1/3 and 1/3–2/3, F
has high values in inner and southeastern China, whereas for the interval with high
Kt value, high F values were observed in northern and western China. This means
that there was a high proportion of cloudy days and relatively low solar energy
resource in inner and southeastern China, and there was high proportion of sun-
shine days and relatively abundant solar energy resource in northern and western
China. This agrees with the study by Li Junfeng et al. [1], in which China has been
Fig. 1. Relationship between Kd and Kt with nine stations in Table 1 as example.
1547Z. Jin et al. / Renewable Energy 29 (2004) 1537–1548
divided into five regions according to the annual sunshine hours and total solarradiation.
4. Conclusions
Solar radiation data are essential for the work of energy planners, engineers andagricultural scientists. Applying the measured global and diffuse solar radiationdata form 78 stations in China, a countrywide general correlation model for calcu-lating the daily diffuse radiation was derived on the basis of Liu and Jordanmethod. The statistical estimators RMSE and MBE were used to indicate howclosely the correlation agrees with the data. For the 78 stations in the study, theRMSE does not go beyond 30% at 80% of the station, the MBE ranges from
Fig. 2. Distribution frequency of Kt values for five stations selected.
Fig. 3. Distribution frequency of Kt values with latitude and longitude for different intervals of Kt (inter-
vals of Kt are (a) 0–1/3; (b) 1/3–2/3; (c) 2/3–1).
Z. Jin et al. / Renewable Energy 29 (2004) 1537–15481548
�21.19% to 17.16%. The geographical distribution of solar energy resource inChina was demonstrated in the form of clearness index percentage frequency. It isfound that the solar energy resource in northern and western China is abundant,whereas it is relative low in inner and southeastern China.
Acknowledgements
This work was financially supported by the Doctoral Foundation of X’ian Jiao-tong University.
References
[1] Li J, Wan Y-H, Ohi JM. Renewable energy development in China: resource assessment, technology
status, and greenhouse gas mitigation potential. Applied Energy 1997;56:381–94.
[2] Liu BYH, Jordan RC. The inter-relationship and characteristic distribution of direct, diffuse and
total solar radiation. Solar Energy 1960;4(3):1–19.
[3] Orgill JF, Hollands KGT. Correlation equation for hourly diffuse radiation on a horizontal surface.
Solar Energy 1977;19(4):357–9.
[4] Erbs DG, Klein SA, Duffie JA. Estimation of the diffuse radiation fraction for hourly, daily and
monthly-average global radiation. Solar Energy 1982;28(4):293–302.
[5] Spencer JW. A comparison of methods for estimating hourly diffuse solar radiation from global
solar radiation. Solar Energy 1982;29(1):19–32.
[6] Lam JC, Li DHW. Correlation between global solar-radiation and its direct and diffuse compo-
nents. Building and Environment 1996;31(6):527–35.
[7] Louche A, Notton G, Poggi P, Simonnot G. Correlations for direct normal and global horizontal
irradiations on a French Mediterranean site. Solar Energy 1991;46(4):261–6.
[8] Vignola F, McDaniels DK. Beam-global correlations in the Northwest Pacific. Solar Energy
1986;36(5):409–18.
[9] Spitters CJT, Toussaint HAJM, Goudriaan J. Separating the diffuse and direct component of
global radiation and its implication for modeling canopy photosynthesis Part I. Components of
incoming radiation. Agriculture For Meteorology 1986;38:217–29.
[10] Gopinathan KK, Soler A. Diffuse radiation models and monthly average, daily, diffuse data for a
wide latitude range. Energy 1995;20(7):657–67.
[11] Roderick ML. Estimating the diffuse component from daily and monthly measurements of global
radiation. Agricultural and Forest Meteorology 1999;95:169–85.
[12] Lin W. General correlation for estimating the monthly average daily direct radiation incident on a
horizontal surface in Yunnan province, China. Solar Energy 1998;41(1):1–3.
[13] Lin W, Lu E, Gao W, et al. Distribution patterns of diffuse solar radiation in Yunnan province,
China. Energy Conversation and Management 1996;37(5):553–60.
[14] Duffie JA, Beckman WA. Solar engineering of thermal processes. New York: Wiley; 1991.
[15] Angstrom A. Solar and terrestrial radiation. Quarterly Journal of the Royal Meteorological Society
1924;50:121–6.
[16] Prescott JA. Evaporation for a water surface in relation to solar radiation. Transactions of the
Royal Society of Australia 1940;64:125–34.


![Optimum Photovoltaic Solar Cells Area Estimation for ... · the form of global and diffuse radiation on a horizontal surface [3]. Solar panels are positioned at an angle to the flat](https://img.pdfslide.us/doc/110x75/605d90d74ea5d47cd64ac5f2/optimum-photovoltaic-solar-cells-area-estimation-for-the-form-of-global-and.jpg)