Embed Size (px)
Citation preview
NREL/PR-550-44460
NREL is a national laboratory of the U.S. Department of Energy Office of Energy Efficiency and Renewable Energy operated by the Alliance for Sustainable Energy, LLC
Solar Resource Assessment WorkshopDenver, Colorado
Steve Wilcox, Ray George, Daryl MyersNational Renewable Energy Laboratory
October 29, 2008
Solar Radiation Data Sets
National Renewable Energy Laboratory Innovation for Our Energy Future
Overview of Solar Resource Data
• National Solar Radiation Database (NSRDB)
• State University of New York at Albany 10 km Gridded Data (“Perez”)
• Data Uncertainty• Typical Meteorological Year Data Sets• Measured Site Specific or Network Data
National Renewable Energy Laboratory Innovation for Our Energy Future
National Solar Radiation DatabaseOriginal NSRDB (1961-1990)• 239 sites based on NWS stations with a 30-year
period of record• Developed as an update to the SOLMET/ERSATZ
data set
• Serially complete sunup data set (some met data filled)
• 93% of solar data modeled
• Used widely by solar designers, building architects, and engineers
• Foundation for value added products (TMY2, data manuals)
National Renewable Energy Laboratory Innovation for Our Energy Future
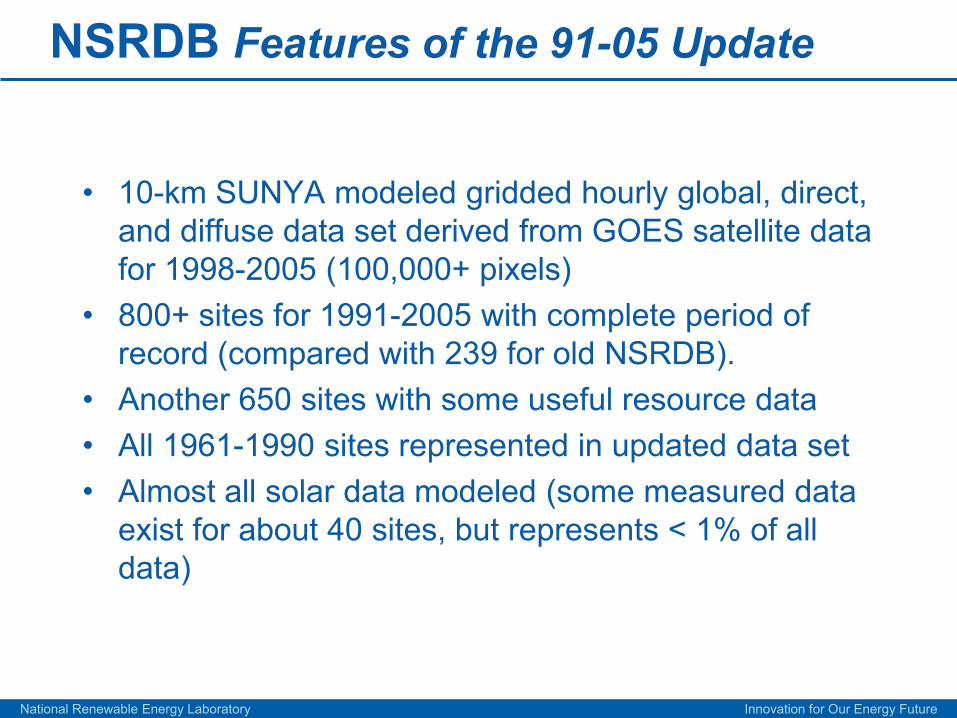
NSRDB Features of the 91-05 Update
• 10-km SUNYA modeled gridded hourly global, direct, and diffuse data set derived from GOES satellite data for 1998-2005 (100,000+ pixels)
• 800+ sites for 1991-2005 with complete period of record (compared with 239 for old NSRDB).
• Another 650 sites with some useful resource data• All 1961-1990 sites represented in updated data set• Almost all solar data modeled (some measured data
exist for about 40 sites, but represents < 1% of all data)
National Renewable Energy Laboratory Innovation for Our Energy Future
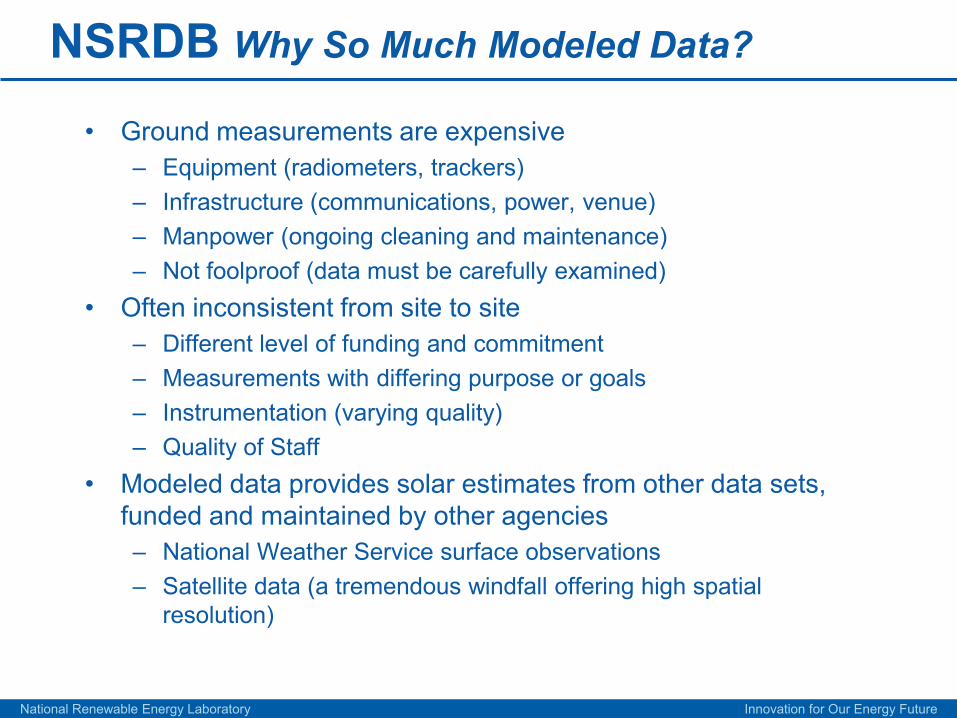
NSRDB Why So Much Modeled Data?
• Ground measurements are expensive– Equipment (radiometers, trackers)– Infrastructure (communications, power, venue)– Manpower (ongoing cleaning and maintenance)– Not foolproof (data must be carefully examined)
• Often inconsistent from site to site– Different level of funding and commitment– Measurements with differing purpose or goals– Instrumentation (varying quality)– Quality of Staff
• Modeled data provides solar estimates from other data sets, funded and maintained by other agencies– National Weather Service surface observations– Satellite data (a tremendous windfall offering high spatial
resolution)
National Renewable Energy Laboratory Innovation for Our Energy Future
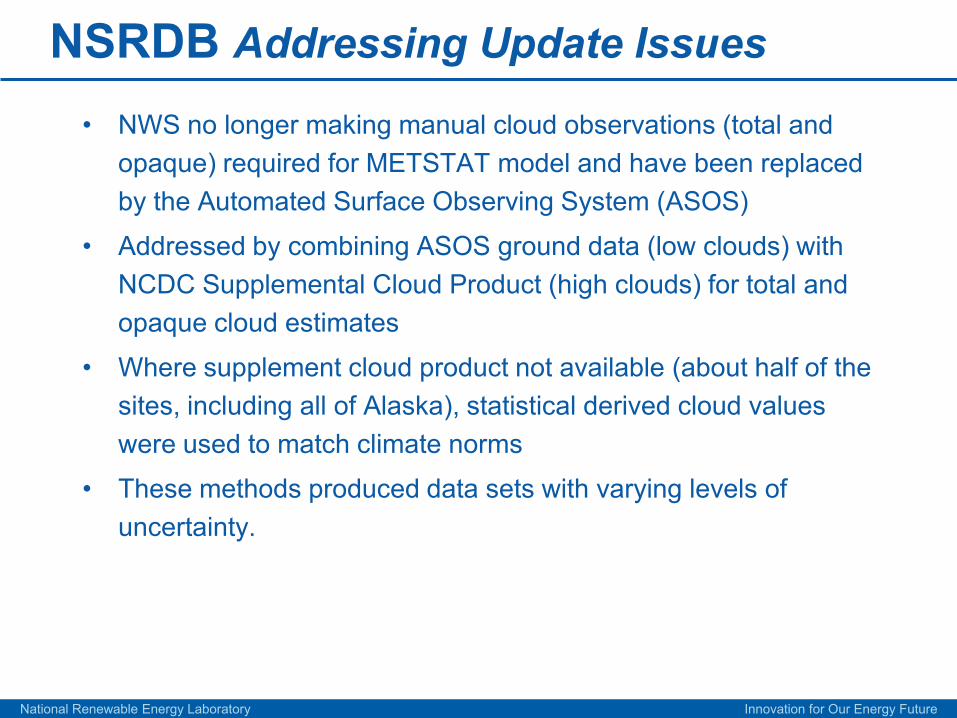
NSRDB Addressing Update Issues
• NWS no longer making manual cloud observations (total and opaque) required for METSTAT model and have been replaced by the Automated Surface Observing System (ASOS)
• Addressed by combining ASOS ground data (low clouds) with NCDC Supplemental Cloud Product (high clouds) for total and opaque cloud estimates
• Where supplement cloud product not available (about half of the sites, including all of Alaska), statistical derived cloud values were used to match climate norms
• These methods produced data sets with varying levels of uncertainty.
National Renewable Energy Laboratory Innovation for Our Energy Future
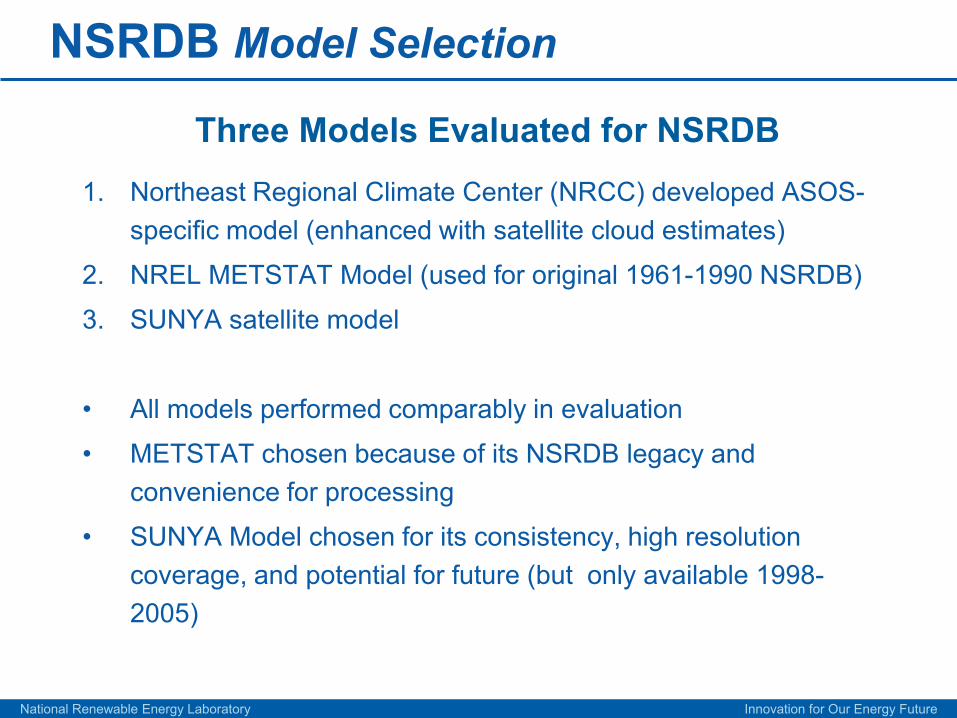
NSRDB Model Selection
1. Northeast Regional Climate Center (NRCC) developed ASOS-specific model (enhanced with satellite cloud estimates)
2. NREL METSTAT Model (used for original 1961-1990 NSRDB)
3. SUNYA satellite model
• All models performed comparably in evaluation
• METSTAT chosen because of its NSRDB legacy and convenience for processing
• SUNYA Model chosen for its consistency, high resolution coverage, and potential for future (but only available 1998-2005)
Three Models Evaluated for NSRDB
National Renewable Energy Laboratory Innovation for Our Energy Future
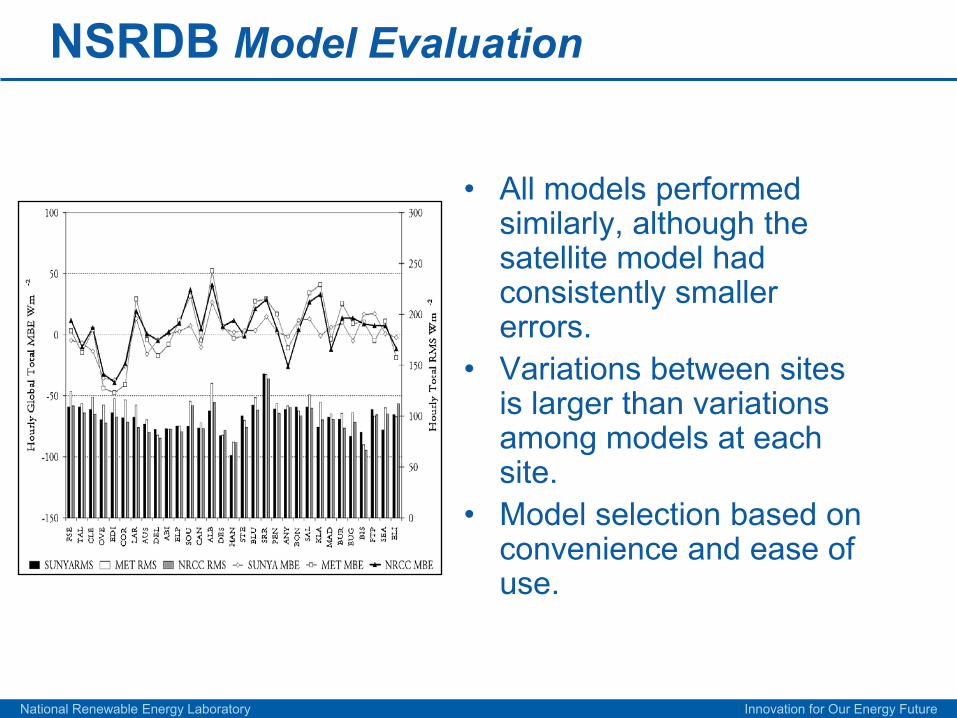
NSRDB Model Evaluation
• All models performed similarly, although the satellite model had consistently smaller errors.
• Variations between sites is larger than variations among models at each site.
• Model selection based on convenience and ease of use.
National Renewable Energy Laboratory Innovation for Our Energy Future
NSRDB Satellite-derived Data Sets
• Data (Global, Direct, Diffuse) from SUNYA Satellite model included for subset of years
• Provides enhanced spatial resolution (10-km grid)
• Required time-shifting of data to conform with the top-of-the hour, hourly integrated realm of the NSRDB
• Undoubtedly represents the future of solar resource assessment data sets
National Renewable Energy Laboratory Innovation for Our Energy Future
NSRDB Aerosols, Water Vapor, Ozone
• 10-km gridded data set for aerosols, water vapor, and ozone.
• Aerosols derived from NASA MISR and MODIS satellite data, surface AERONET (sun photometry), and legacy NSRDB DNI broadband estimates. Data formed as climatological means
• Water vapor derived from NASA Water Vapor Project (NVAP) or North American Regional Reanalysis (NARR) (1ºx1º, 0.5ºx0.5º, or 32-km cells interpolated to 10-km cells)
• Ozone from Total Ozone Mapping Scanner (TOMS) (1ºx1¼º cells interpolated to 10-km cells)
• For the ground stations, GIS used to select nearest cell
National Renewable Energy Laboratory Innovation for Our Energy Future
NSRDB Site Classifications
• Sites are segregated based on availability, quality, and completeness of data– Class I sites (221) have complete period of record for all
parameters for 1991-2005 and have data with the lowest uncertainty (±10-15%)
– Class II sites (637) have a complete period of record, but data are of higher uncertainty (±15-25%)
– Class III sites (596) are not serially complete, but have at least three years of solar and pertinent meteorological data from 1991-2005
• This classification scheme helps optimize the quality and quantity of data available for a wide range of applications.
National Renewable Energy Laboratory Innovation for Our Energy Future
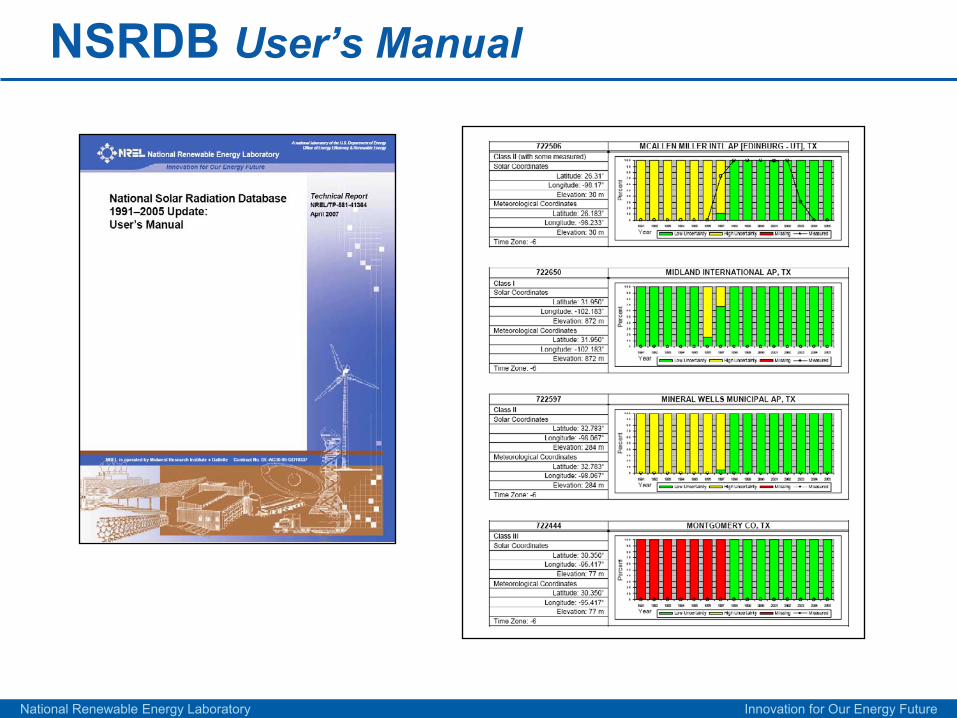
NSRDB User’s Manual
National Renewable Energy Laboratory Innovation for Our Energy Future
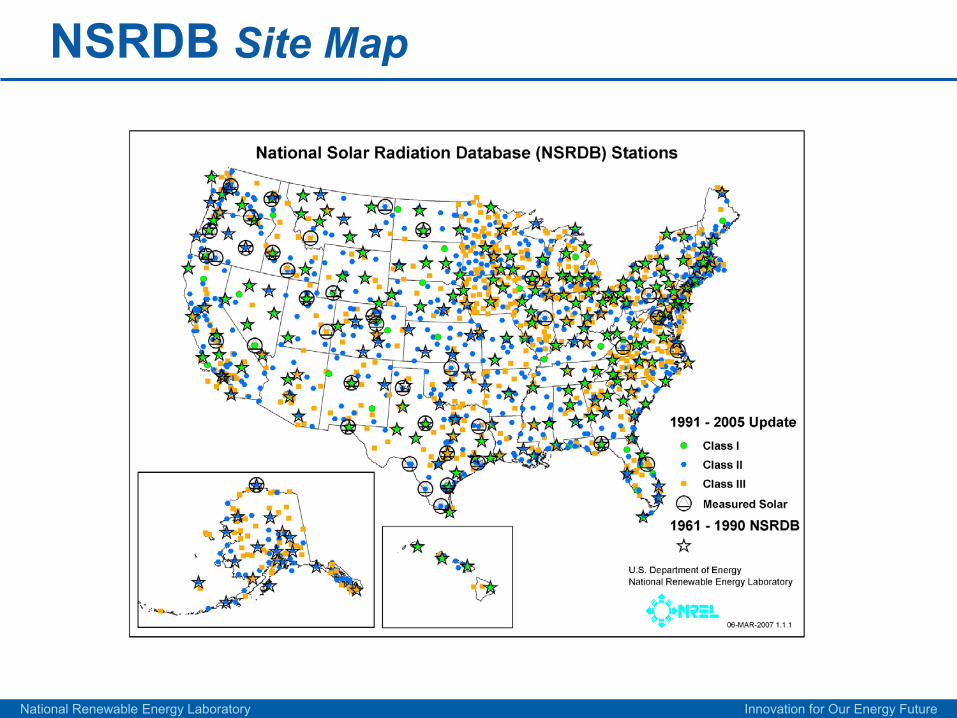
NSRDB Site Map
National Renewable Energy Laboratory Innovation for Our Energy Future
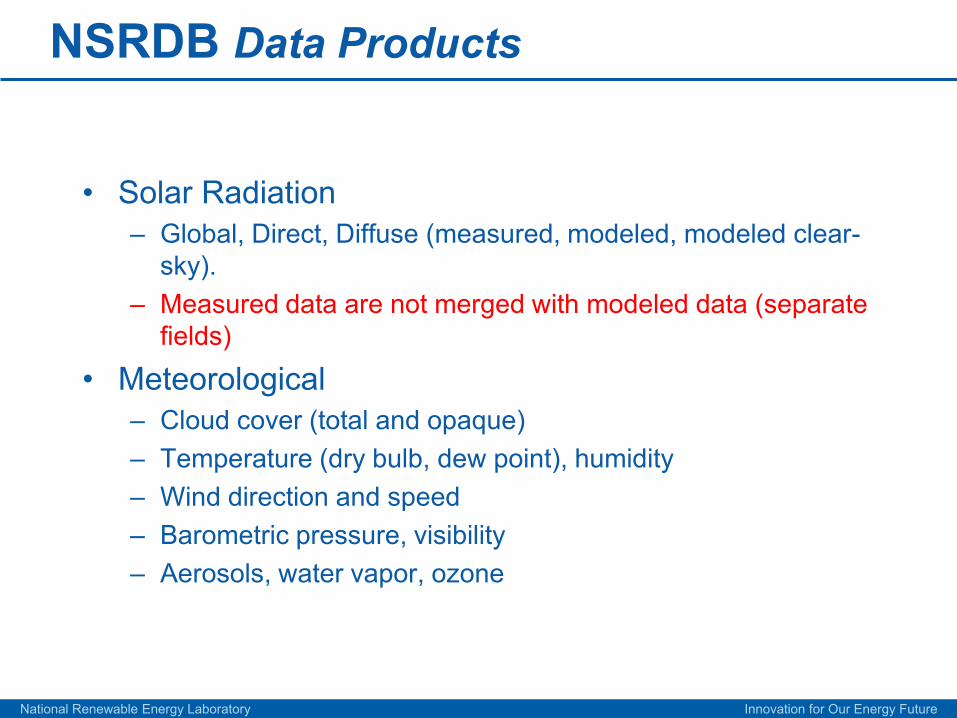
NSRDB Data Products
• Solar Radiation– Global, Direct, Diffuse (measured, modeled, modeled clear-
sky).– Measured data are not merged with modeled data (separate
fields)
• Meteorological– Cloud cover (total and opaque)– Temperature (dry bulb, dew point), humidity– Wind direction and speed– Barometric pressure, visibility – Aerosols, water vapor, ozone
National Renewable Energy Laboratory Innovation for Our Energy Future
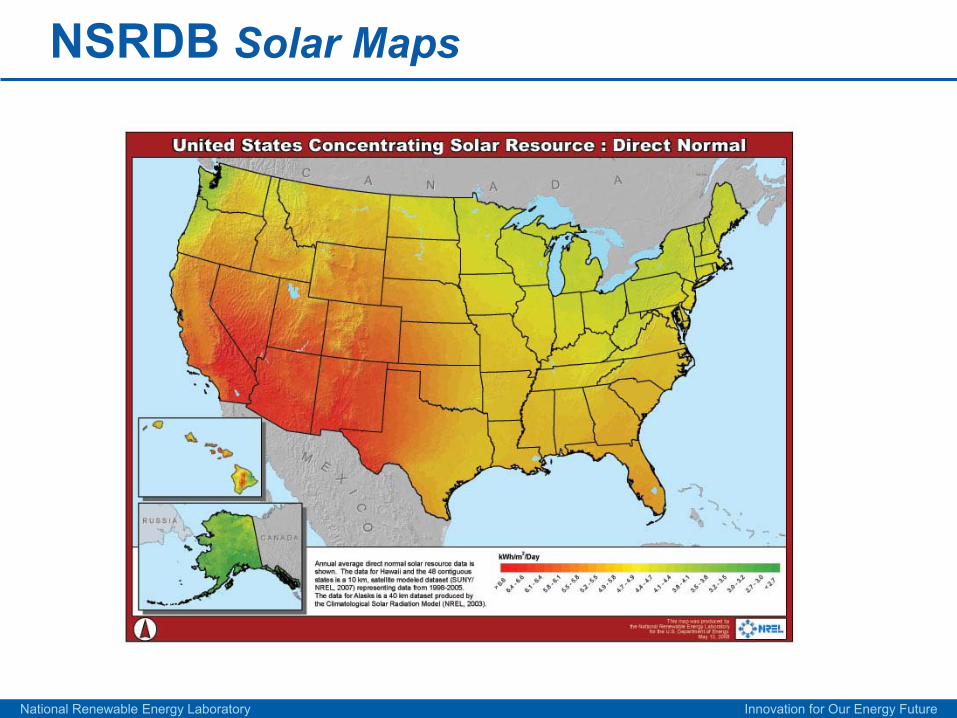
NSRDB Solar Maps
National Renewable Energy Laboratory Innovation for Our Energy Future
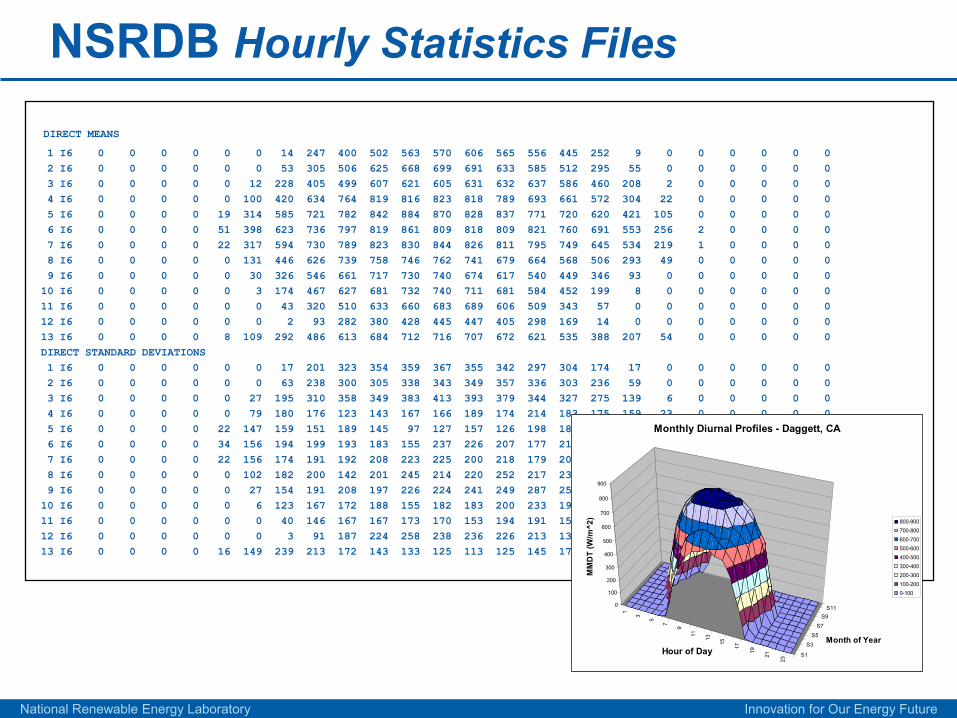
NSRDB Hourly Statistics Files
DIRECT MEANS
1 I6 0 0 0 0 0 0 14 247 400 502 563 570 606 565 556 445 252 9 0 0 0 0 0 02 I6 0 0 0 0 0 0 53 305 506 625 668 699 691 633 585 512 295 55 0 0 0 0 0 03 I6 0 0 0 0 0 12 228 405 499 607 621 605 631 632 637 586 460 208 2 0 0 0 0 04 I6 0 0 0 0 0 100 420 634 764 819 816 823 818 789 693 661 572 304 22 0 0 0 0 05 I6 0 0 0 0 19 314 585 721 782 842 884 870 828 837 771 720 620 421 105 0 0 0 0 06 I6 0 0 0 0 51 398 623 736 797 819 861 809 818 809 821 760 691 553 256 2 0 0 0 07 I6 0 0 0 0 22 317 594 730 789 823 830 844 826 811 795 749 645 534 219 1 0 0 0 08 I6 0 0 0 0 0 131 446 626 739 758 746 762 741 679 664 568 506 293 49 0 0 0 0 09 I6 0 0 0 0 0 30 326 546 661 717 730 740 674 617 540 449 346 93 0 0 0 0 0 010 I6 0 0 0 0 0 3 174 467 627 681 732 740 711 681 584 452 199 8 0 0 0 0 0 011 I6 0 0 0 0 0 0 43 320 510 633 660 683 689 606 509 343 57 0 0 0 0 0 0 012 I6 0 0 0 0 0 0 2 93 282 380 428 445 447 405 298 169 14 0 0 0 0 0 0 013 I6 0 0 0 0 8 109 292 486 613 684 712 716 707 672 621 535 388 207 54 0 0 0 0 0DIRECT STANDARD DEVIATIONS1 I6 0 0 0 0 0 0 17 201 323 354 359 367 355 342 297 304 174 17 0 0 0 0 0 02 I6 0 0 0 0 0 0 63 238 300 305 338 343 349 357 336 303 236 59 0 0 0 0 0 03 I6 0 0 0 0 0 27 195 310 358 349 383 413 393 379 344 327 275 139 6 0 0 0 0 04 I6 0 0 0 0 0 79 180 176 123 143 167 166 189 174 214 183 175 159 23 0 0 0 0 05 I6 0 0 0 0 22 147 159 151 189 145 97 127 157 126 198 186 178 182 79 0 0 0 0 06 I6 0 0 0 0 34 156 194 199 193 183 155 237 226 207 177 217 199 188 125 4 0 0 0 07 I6 0 0 0 0 22 156 174 191 192 208 223 225 200 218 179 206 225 177 125 3 0 0 0 08 I6 0 0 0 0 0 102 182 200 142 201 245 214 220 252 217 235 207 187 64 0 0 0 0 09 I6 0 0 0 0 0 27 154 191 208 197 226 224 241 249 287 256 188 87 1 0 0 0 0 010 I6 0 0 0 0 0 6 123 167 172 188 155 182 183 200 233 197 145 16 0 0 0 0 0 011 I6 0 0 0 0 0 0 40 146 167 167 173 170 153 194 191 156 42 0 0 0 0 0 0 012 I6 0 0 0 0 0 0 3 91 187 224 258 238 236 226 213 137 20 0 0 0 0 0 0 013 I6 0 0 0 0 16 149 239 213 172 143 133 125 113 125 145 177 230 211 91 1 0 0 0 0
1
3
5
7
9
11
13
15
17
19
21
23
S1
S3
S5
S7
S9S110
100
200
300
400
500
600
700
800
900
MM
DT
(W/m
^2)
Hour of DayMonth of Year
Monthly Diurnal Profiles - Daggett, CA
800-900700-800600-700500-600400-500300-400200-300100-2000-100
National Renewable Energy Laboratory Innovation for Our Energy Future
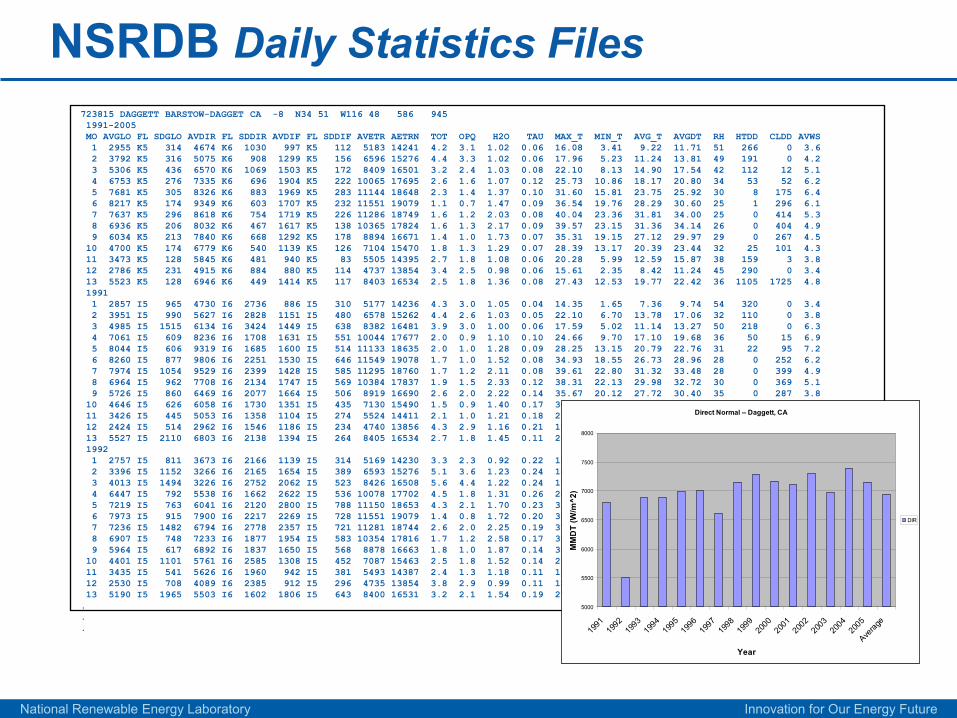
NSRDB Daily Statistics Files723815 DAGGETT BARSTOW-DAGGET CA -8 N34 51 W116 48 586 9451991-2005MO AVGLO FL SDGLO AVDIR FL SDDIR AVDIF FL SDDIF AVETR AETRN TOT OPQ H2O TAU MAX_T MIN_T AVG_T AVGDT RH HTDD CLDD AVWS1 2955 K5 314 4674 K6 1030 997 K5 112 5183 14241 4.2 3.1 1.02 0.06 16.08 3.41 9.22 11.71 51 266 0 3.62 3792 K5 316 5075 K6 908 1299 K5 156 6596 15276 4.4 3.3 1.02 0.06 17.96 5.23 11.24 13.81 49 191 0 4.23 5306 K5 436 6570 K6 1069 1503 K5 172 8409 16501 3.2 2.4 1.03 0.08 22.10 8.13 14.90 17.54 42 112 12 5.14 6753 K5 276 7335 K6 696 1904 K5 222 10065 17695 2.6 1.6 1.07 0.12 25.73 10.86 18.17 20.80 34 53 52 6.25 7681 K5 305 8326 K6 883 1969 K5 283 11144 18648 2.3 1.4 1.37 0.10 31.60 15.81 23.75 25.92 30 8 175 6.46 8217 K5 174 9349 K6 603 1707 K5 232 11551 19079 1.1 0.7 1.47 0.09 36.54 19.76 28.29 30.60 25 1 296 6.17 7637 K5 296 8618 K6 754 1719 K5 226 11286 18749 1.6 1.2 2.03 0.08 40.04 23.36 31.81 34.00 25 0 414 5.38 6936 K5 206 8032 K6 467 1617 K5 138 10365 17824 1.6 1.3 2.17 0.09 39.57 23.15 31.36 34.14 26 0 404 4.99 6034 K5 213 7840 K6 668 1292 K5 178 8894 16671 1.4 1.0 1.73 0.07 35.31 19.15 27.12 29.97 29 0 267 4.5
10 4700 K5 174 6779 K6 540 1139 K5 126 7104 15470 1.8 1.3 1.29 0.07 28.39 13.17 20.39 23.44 32 25 101 4.311 3473 K5 128 5845 K6 481 940 K5 83 5505 14395 2.7 1.8 1.08 0.06 20.28 5.99 12.59 15.87 38 159 3 3.812 2786 K5 231 4915 K6 884 880 K5 114 4737 13854 3.4 2.5 0.98 0.06 15.61 2.35 8.42 11.24 45 290 0 3.413 5523 K5 128 6946 K6 449 1414 K5 117 8403 16534 2.5 1.8 1.36 0.08 27.43 12.53 19.77 22.42 36 1105 1725 4.819911 2857 I5 965 4730 I6 2736 886 I5 310 5177 14236 4.3 3.0 1.05 0.04 14.35 1.65 7.36 9.74 54 320 0 3.42 3951 I5 990 5627 I6 2828 1151 I5 480 6578 15262 4.4 2.6 1.03 0.05 22.10 6.70 13.78 17.06 32 110 0 3.83 4985 I5 1515 6134 I6 3424 1449 I5 638 8382 16481 3.9 3.0 1.00 0.06 17.59 5.02 11.14 13.27 50 218 0 6.34 7061 I5 609 8236 I6 1708 1631 I5 551 10044 17677 2.0 0.9 1.10 0.10 24.66 9.70 17.10 19.68 36 50 15 6.95 8044 I5 606 9319 I6 1685 1600 I5 514 11133 18635 2.0 1.0 1.28 0.09 28.25 13.15 20.79 22.76 31 22 95 7.26 8260 I5 877 9806 I6 2251 1530 I5 646 11549 19078 1.7 1.0 1.52 0.08 34.93 18.55 26.73 28.96 28 0 252 6.27 7974 I5 1054 9529 I6 2399 1428 I5 585 11295 18760 1.7 1.2 2.11 0.08 39.61 22.80 31.32 33.48 28 0 399 4.98 6964 I5 962 7708 I6 2134 1747 I5 569 10384 17837 1.9 1.5 2.33 0.12 38.31 22.13 29.98 32.72 30 0 369 5.19 5726 I5 860 6469 I6 2077 1664 I5 506 8919 16690 2.6 2.0 2.22 0.14 35.67 20.12 27.72 30.40 35 0 287 3.8
10 4646 I5 626 6058 I6 1730 1351 I5 435 7130 15490 1.5 0.9 1.40 0.17 30.95 15.33 22.66 25.82 30 39 188 4.811 3426 I5 445 5053 I6 1358 1104 I5 274 5524 14411 2.1 1.0 1.21 0.18 21.78 6.33 13.40 16.96 33 141 13 4.212 2424 I5 514 2962 I6 1546 1186 I5 234 4740 13856 4.3 2.9 1.16 0.21 15.27 2.43 8.27 10.89 54 294 0 3.113 5527 I5 2110 6803 I6 2138 1394 I5 264 8405 16534 2.7 1.8 1.45 0.11 26.96 11.99 19.19 21.81 37 1194 1619 5.019921 2757 I5 811 3673 I6 2166 1139 I5 314 5169 14230 3.3 2.3 0.92 0.22 15.34 1.42 7.32 10.34 51 308 0 3.52 3396 I5 1152 3266 I6 2165 1654 I5 389 6593 15276 5.1 3.6 1.23 0.24 18.84 6.43 12.35 14.79 56 165 0 3.83 4013 I5 1494 3226 I6 2752 2062 I5 523 8426 16508 5.6 4.4 1.22 0.24 19.44 8.50 13.66 15.64 61 135 0 4.54 6447 I5 792 5538 I6 1662 2622 I5 536 10078 17702 4.5 1.8 1.31 0.26 28.80 12.43 20.50 23.32 38 9 77 5.35 7219 I5 763 6041 I6 2120 2800 I5 788 11150 18653 4.3 2.1 1.70 0.23 33.66 17.35 25.53 27.77 33 0 223 5.06 7973 I5 915 7900 I6 2217 2269 I5 728 11551 19079 1.4 0.8 1.72 0.20 35.47 18.97 27.20 29.46 27 0 267 5.47 7236 I5 1482 6794 I6 2778 2357 I5 721 11281 18744 2.6 2.0 2.25 0.19 37.96 22.41 30.20 32.16 30 0 367 5.98 6907 I5 748 7233 I6 1877 1954 I5 583 10354 17816 1.7 1.2 2.58 0.17 39.34 23.18 31.40 33.99 28 0 401 5.29 5964 I5 617 6892 I6 1837 1650 I5 568 8878 16663 1.8 1.0 1.87 0.14 36.76 19.30 27.78 30.90 29 0 291 4.7
10 4401 I5 1101 5761 I6 2585 1308 I5 452 7087 15463 2.5 1.8 1.52 0.14 29.27 13.94 21.03 23.98 41 4 106 4.211 3435 I5 541 5626 I6 1960 942 I5 381 5493 14387 2.4 1.3 1.18 0.11 19.54 4.16 11.27 14.94 33 194 0 3.612 2530 I5 708 4089 I6 2385 912 I5 296 4735 13854 3.8 2.9 0.99 0.11 12.69 0.41 6.04 8.73 55 365 0 3.513 5190 I5 1965 5503 I6 1602 1806 I5 643 8400 16531 3.2 2.1 1.54 0.19 27.26 12.38 19.52 22.17 40 1181 1732 4.6...
Direct Normal -- Daggett, CA
5000
5500
6000
6500
7000
7500
8000
1991
1992
1993
1994
1995
1996
1997
1998
1999
2000
2001
2002
2003
2004
2005
Averag
e
Year
MM
DT
(W/m
^2)
DIR
National Renewable Energy Laboratory Innovation for Our Energy Future
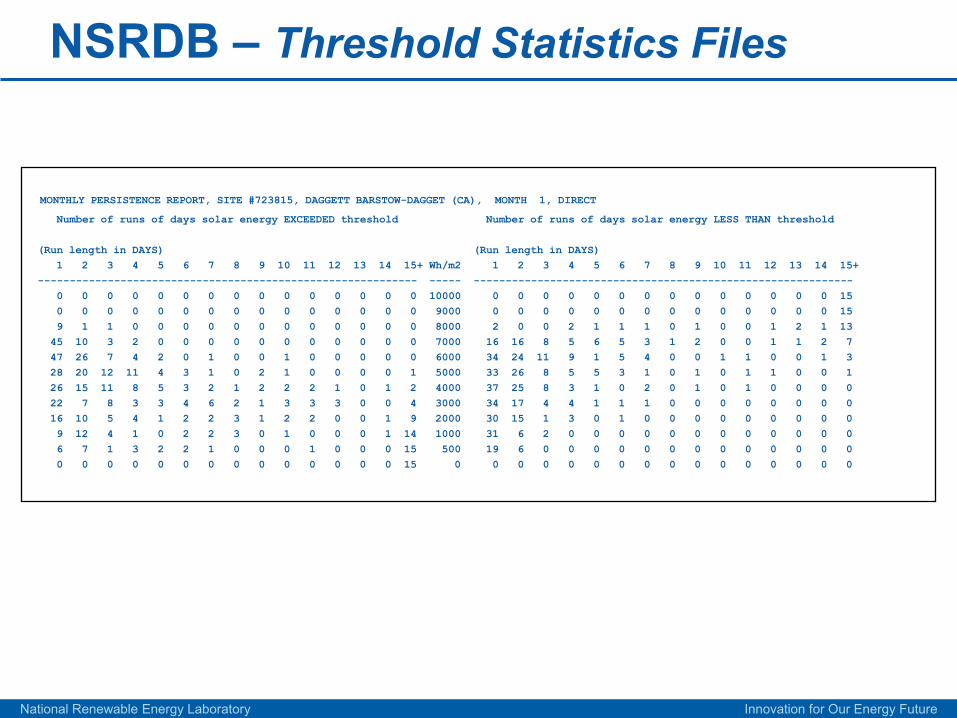
NSRDB – Threshold Statistics Files
MONTHLY PERSISTENCE REPORT, SITE #723815, DAGGETT BARSTOW-DAGGET (CA), MONTH 1, DIRECT
Number of runs of days solar energy EXCEEDED threshold Number of runs of days solar energy LESS THAN threshold
(Run length in DAYS) (Run length in DAYS)1 2 3 4 5 6 7 8 9 10 11 12 13 14 15+ Wh/m2 1 2 3 4 5 6 7 8 9 10 11 12 13 14 15+
------------------------------------------------------------ ----- ------------------------------------------------------------0 0 0 0 0 0 0 0 0 0 0 0 0 0 0 10000 0 0 0 0 0 0 0 0 0 0 0 0 0 0 150 0 0 0 0 0 0 0 0 0 0 0 0 0 0 9000 0 0 0 0 0 0 0 0 0 0 0 0 0 0 159 1 1 0 0 0 0 0 0 0 0 0 0 0 0 8000 2 0 0 2 1 1 1 0 1 0 0 1 2 1 1345 10 3 2 0 0 0 0 0 0 0 0 0 0 0 7000 16 16 8 5 6 5 3 1 2 0 0 1 1 2 747 26 7 4 2 0 1 0 0 1 0 0 0 0 0 6000 34 24 11 9 1 5 4 0 0 1 1 0 0 1 328 20 12 11 4 3 1 0 2 1 0 0 0 0 1 5000 33 26 8 5 5 3 1 0 1 0 1 1 0 0 126 15 11 8 5 3 2 1 2 2 2 1 0 1 2 4000 37 25 8 3 1 0 2 0 1 0 1 0 0 0 022 7 8 3 3 4 6 2 1 3 3 3 0 0 4 3000 34 17 4 4 1 1 1 0 0 0 0 0 0 0 016 10 5 4 1 2 2 3 1 2 2 0 0 1 9 2000 30 15 1 3 0 1 0 0 0 0 0 0 0 0 09 12 4 1 0 2 2 3 0 1 0 0 0 1 14 1000 31 6 2 0 0 0 0 0 0 0 0 0 0 0 06 7 1 3 2 2 1 0 0 0 1 0 0 0 15 500 19 6 0 0 0 0 0 0 0 0 0 0 0 0 00 0 0 0 0 0 0 0 0 0 0 0 0 0 15 0 0 0 0 0 0 0 0 0 0 0 0 0 0 0 0
National Renewable Energy Laboratory Innovation for Our Energy Future
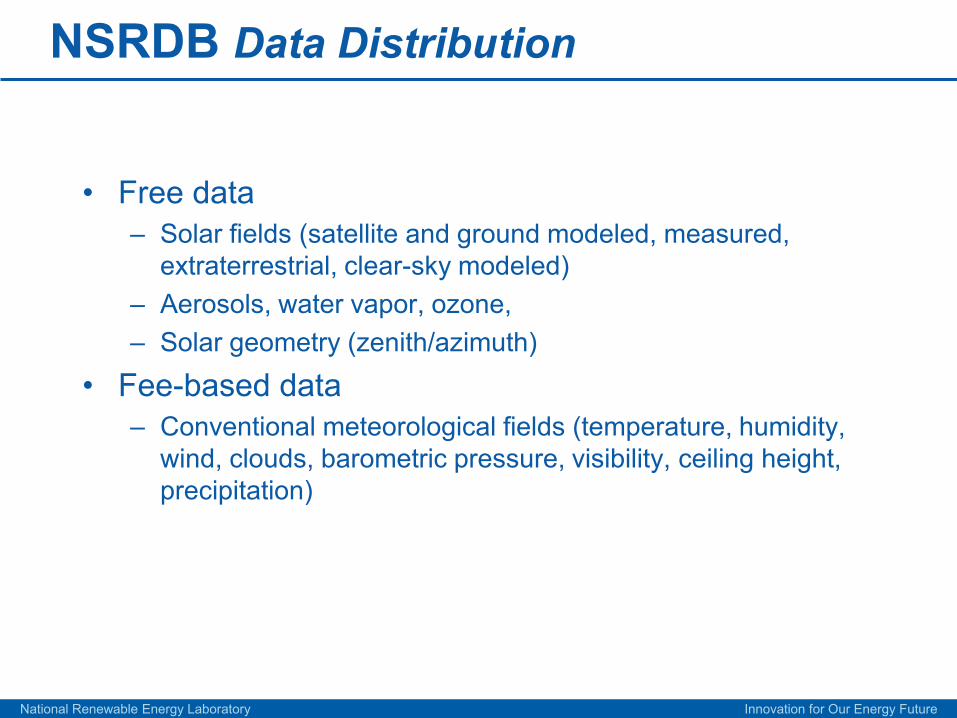
NSRDB Data Distribution
• Free data– Solar fields (satellite and ground modeled, measured,
extraterrestrial, clear-sky modeled)– Aerosols, water vapor, ozone, – Solar geometry (zenith/azimuth)
• Fee-based data– Conventional meteorological fields (temperature, humidity,
wind, clouds, barometric pressure, visibility, ceiling height, precipitation)
National Renewable Energy Laboratory Innovation for Our Energy Future
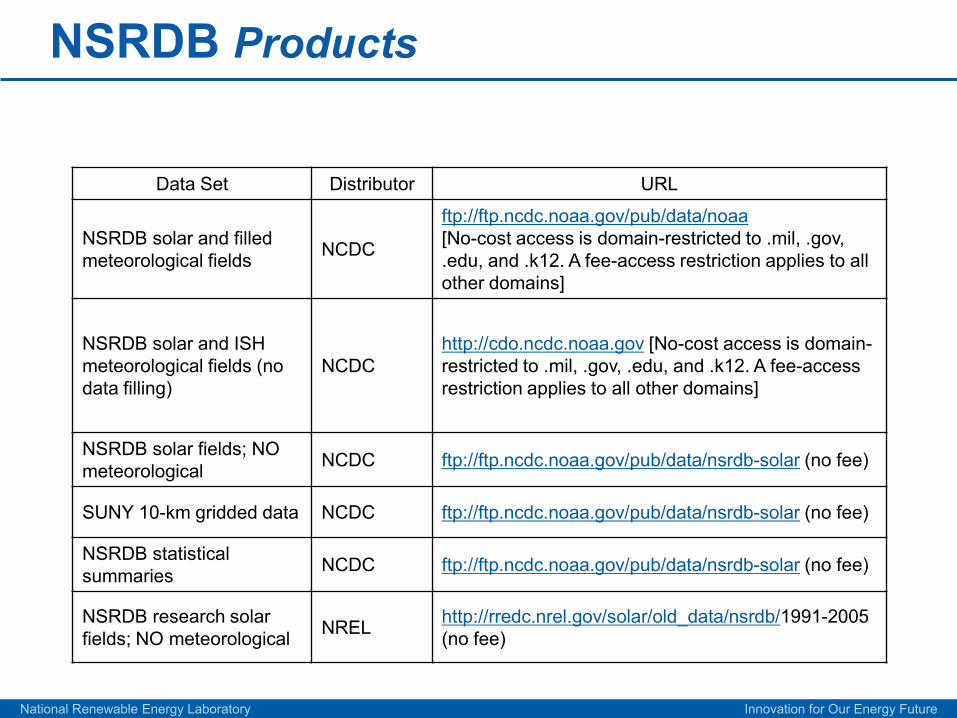
NSRDB Products
Data Set Distributor URL
NSRDB solar and filled meteorological fields NCDC
ftp://ftp.ncdc.noaa.gov/pub/data/noaa[No-cost access is domain-restricted to .mil, .gov, .edu, and .k12. A fee-access restriction applies to all other domains]
NSRDB solar and ISH meteorological fields (no data filling)
NCDChttp://cdo.ncdc.noaa.gov [No-cost access is domain-restricted to .mil, .gov, .edu, and .k12. A fee-access restriction applies to all other domains]
NSRDB solar fields; NO meteorological NCDC ftp://ftp.ncdc.noaa.gov/pub/data/nsrdb-solar (no fee)
SUNY 10-km gridded data NCDC ftp://ftp.ncdc.noaa.gov/pub/data/nsrdb-solar (no fee)
NSRDB statistical summaries NCDC ftp://ftp.ncdc.noaa.gov/pub/data/nsrdb-solar (no fee)
NSRDB research solar fields; NO meteorological NREL http://rredc.nrel.gov/solar/old_data/nsrdb/1991-2005
(no fee)
National Renewable Energy Laboratory Innovation for Our Energy Future
NSRDB Ongoing Updates
• NREL Plans to update the NSRDB with more recent data in the near future
• Currently negotiating an agreement to obtain the more recent SUNY data (now proprietary to Clean Power Research)
• More current data (i.e. 2006-present) is presently available from commercial sources.
National Renewable Energy Laboratory Innovation for Our Energy Future
SUNY Satellite Gridded Data
Ray George
National Renewable Energy Laboratory Innovation for Our Energy Future
NSRDB Data Uncertainty
Daryl Myers
National Renewable Energy Laboratory Innovation for Our Energy Future
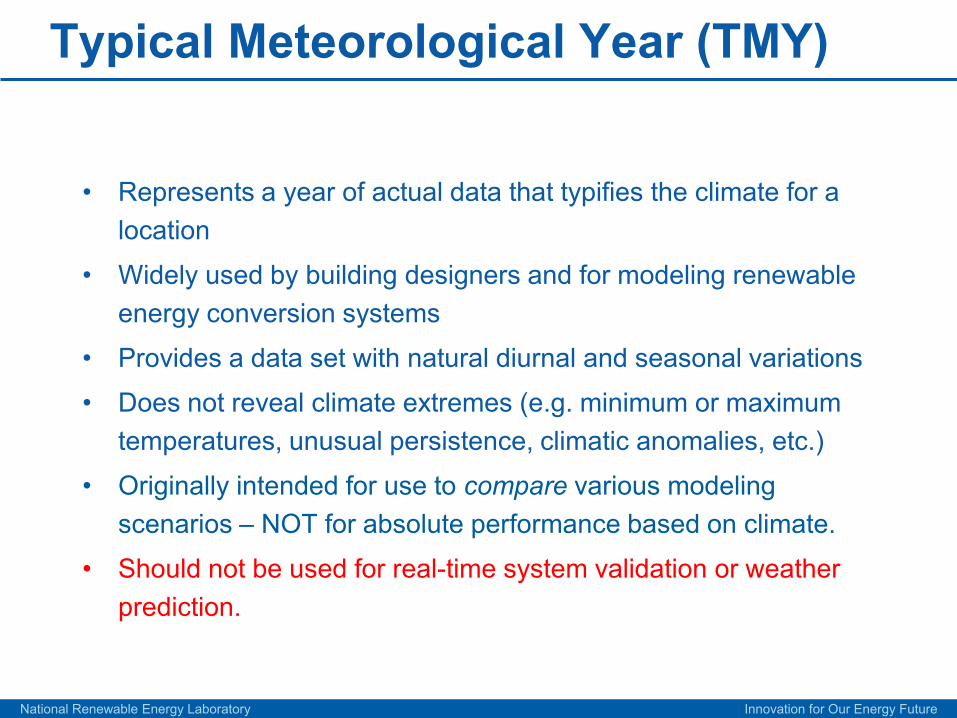
Typical Meteorological Year (TMY)
• Represents a year of actual data that typifies the climate for a location
• Widely used by building designers and for modeling renewable energy conversion systems
• Provides a data set with natural diurnal and seasonal variations
• Does not reveal climate extremes (e.g. minimum or maximum temperatures, unusual persistence, climatic anomalies, etc.)
• Originally intended for use to compare various modeling scenarios – NOT for absolute performance based on climate.
• Should not be used for real-time system validation or weather prediction.
National Renewable Energy Laboratory Innovation for Our Energy Future
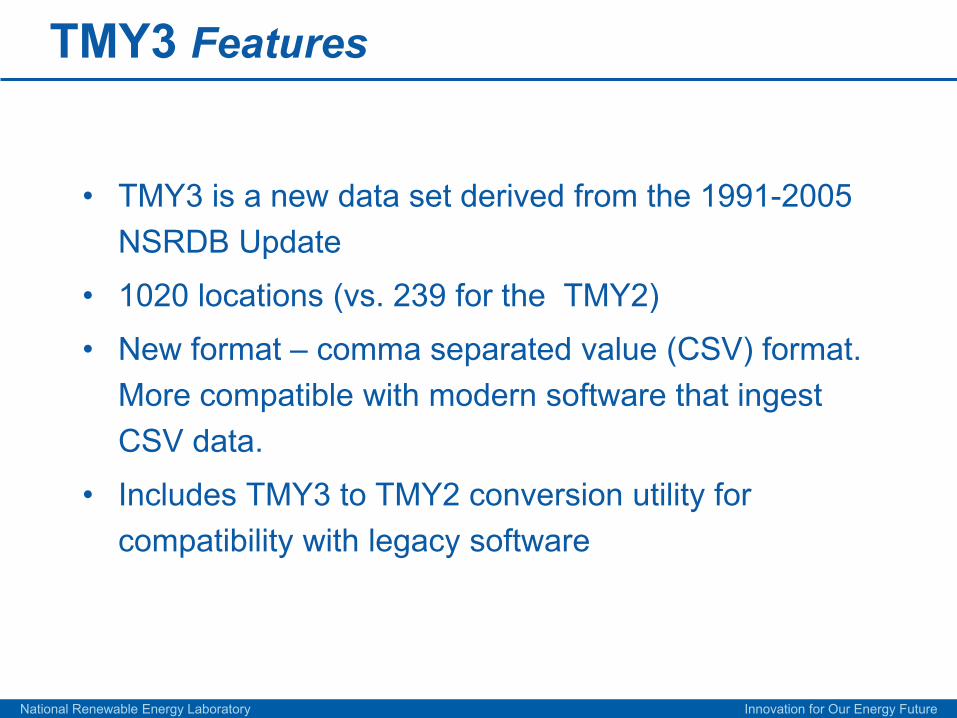
TMY3 Features
• TMY3 is a new data set derived from the 1991-2005 NSRDB Update
• 1020 locations (vs. 239 for the TMY2)
• New format – comma separated value (CSV) format. More compatible with modern software that ingest CSV data.
• Includes TMY3 to TMY2 conversion utility for compatibility with legacy software
National Renewable Energy Laboratory Innovation for Our Energy Future
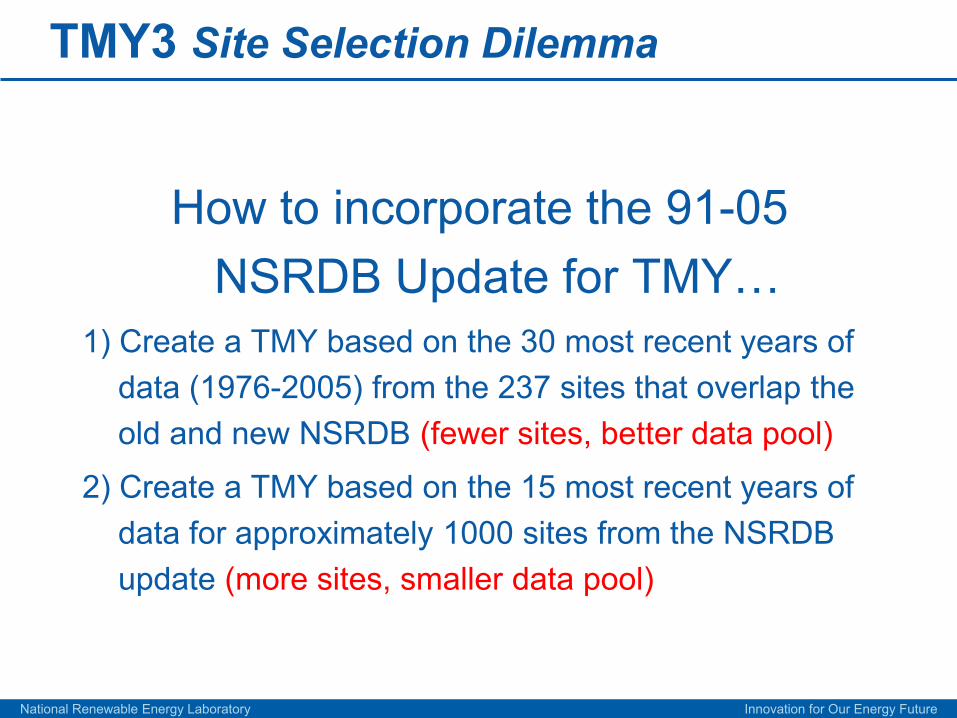
TMY3 Site Selection Dilemma
How to incorporate the 91-05 NSRDB Update for TMY…
1) Create a TMY based on the 30 most recent years of data (1976-2005) from the 237 sites that overlap the old and new NSRDB (fewer sites, better data pool)
2) Create a TMY based on the 15 most recent years of data for approximately 1000 sites from the NSRDB update (more sites, smaller data pool)
National Renewable Energy Laboratory Innovation for Our Energy Future
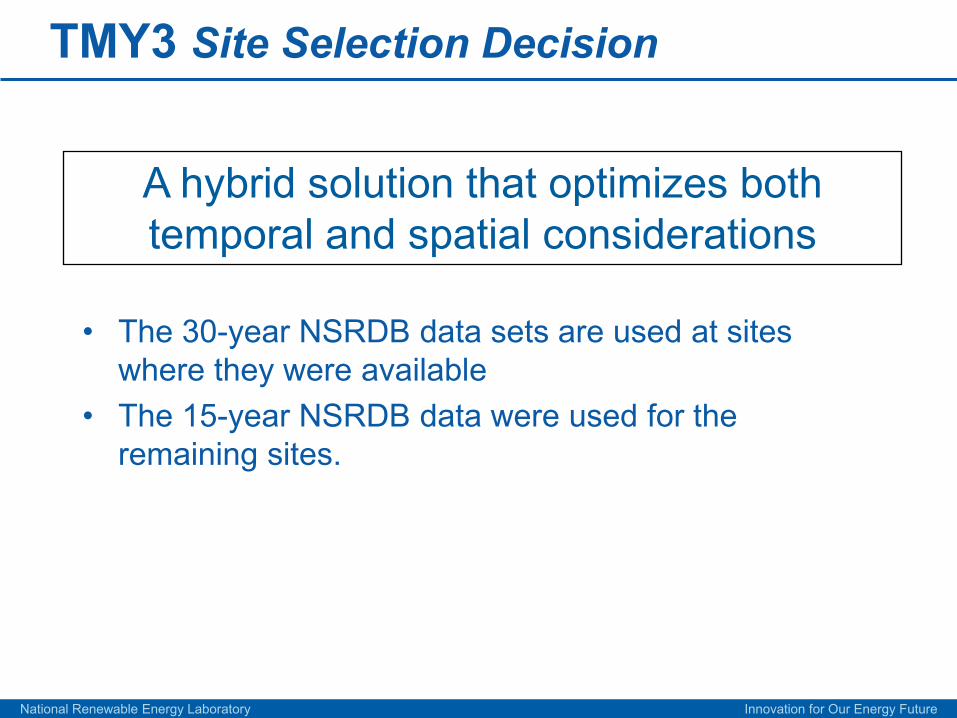
TMY3 Site Selection Decision
• The 30-year NSRDB data sets are used at sites where they were available
• The 15-year NSRDB data were used for the remaining sites.
A hybrid solution that optimizes both temporal and spatial considerations
National Renewable Energy Laboratory Innovation for Our Energy Future
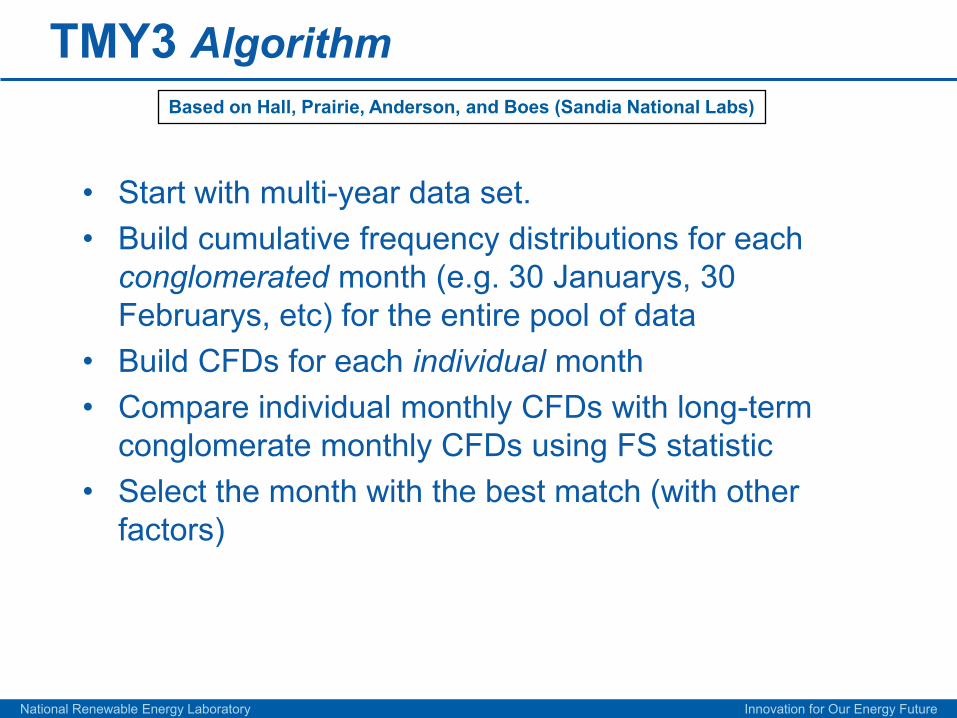
TMY3 Algorithm
• Start with multi-year data set. • Build cumulative frequency distributions for each
conglomerated month (e.g. 30 Januarys, 30 Februarys, etc) for the entire pool of data
• Build CFDs for each individual month• Compare individual monthly CFDs with long-term
conglomerate monthly CFDs using FS statistic• Select the month with the best match (with other
factors)
Based on Hall, Prairie, Anderson, and Boes (Sandia National Labs)
National Renewable Energy Laboratory Innovation for Our Energy Future
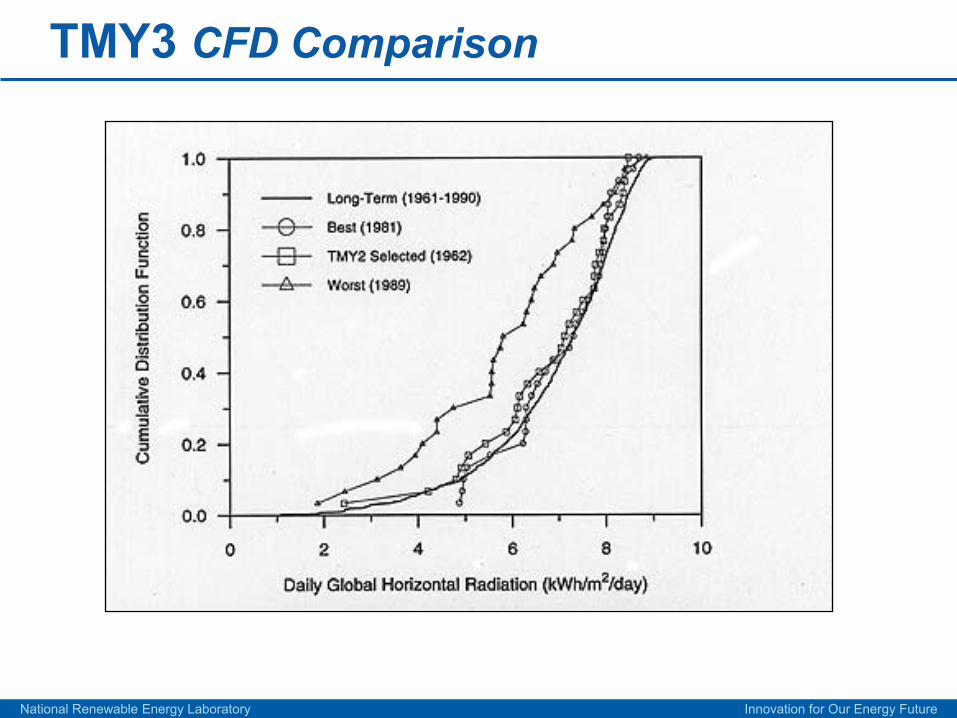
TMY3 CFD Comparison
National Renewable Energy Laboratory Innovation for Our Energy Future
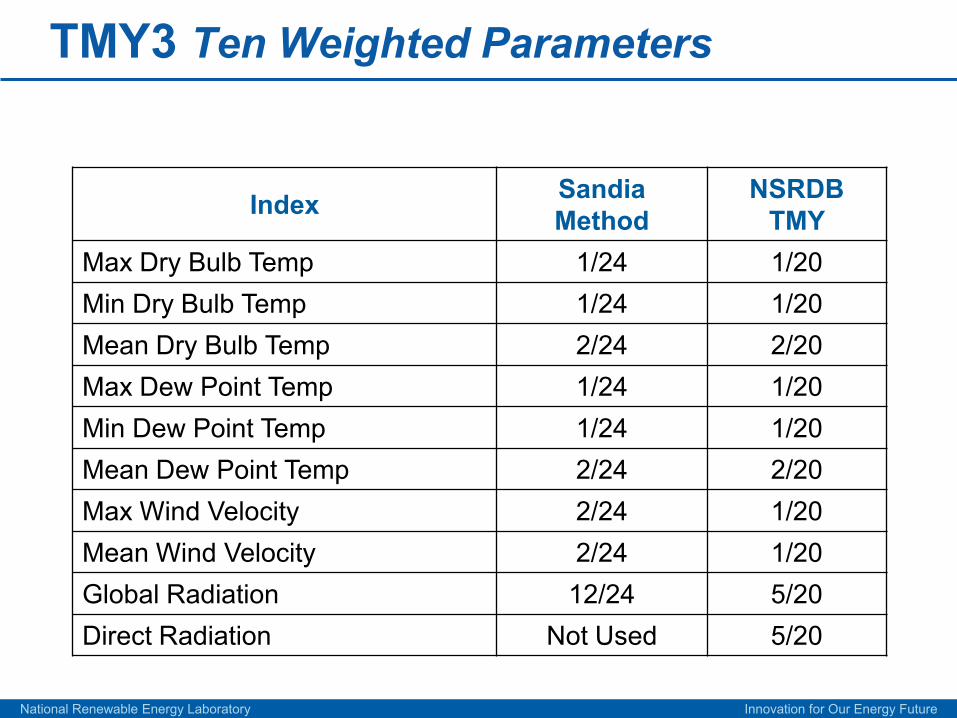
TMY3 Ten Weighted Parameters
Index SandiaMethod
NSRDBTMY
Max Dry Bulb Temp 1/24 1/20 Min Dry Bulb Temp 1/24 1/20 Mean Dry Bulb Temp 2/24 2/20 Max Dew Point Temp 1/24 1/20 Min Dew Point Temp 1/24 1/20 Mean Dew Point Temp 2/24 2/20 Max Wind Velocity 2/24 1/20 Mean Wind Velocity 2/24 1/20 Global Radiation 12/24 5/20 Direct Radiation Not Used 5/20
National Renewable Energy Laboratory Innovation for Our Energy Future
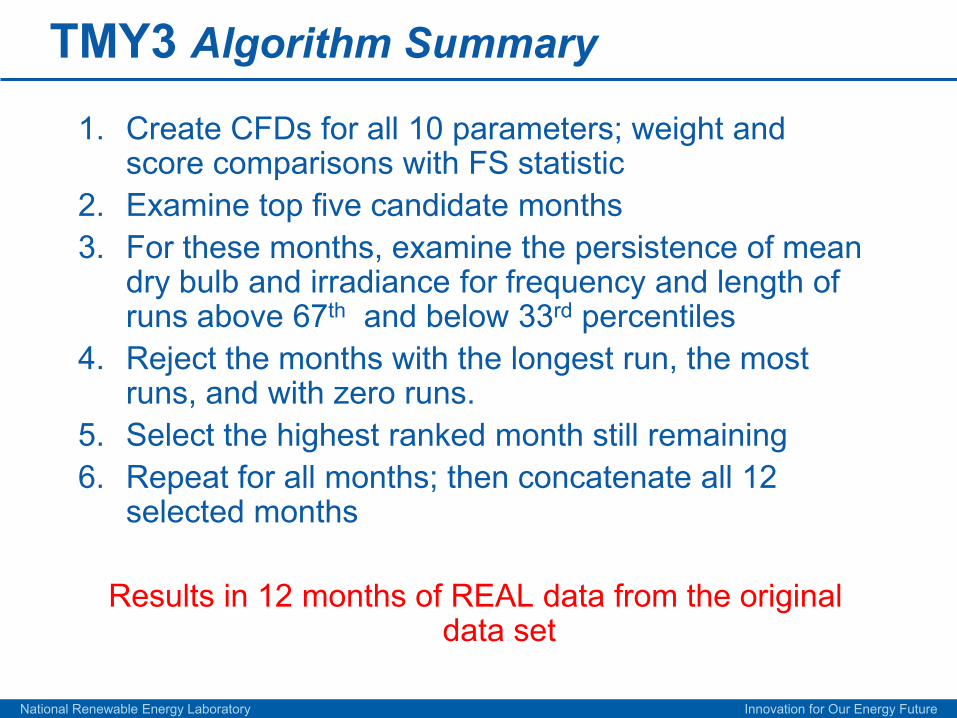
TMY3 Algorithm Summary
1. Create CFDs for all 10 parameters; weight and score comparisons with FS statistic
2. Examine top five candidate months3. For these months, examine the persistence of mean
dry bulb and irradiance for frequency and length of runs above 67th and below 33rd percentiles
4. Reject the months with the longest run, the most runs, and with zero runs.
5. Select the highest ranked month still remaining6. Repeat for all months; then concatenate all 12
selected months
Results in 12 months of REAL data from the original data set
National Renewable Energy Laboratory Innovation for Our Energy Future
TMY3 Volcanic Eruptions
We considered two significant eruptions:– El Chichón in Mexico – March 1982– Mount Pinatubo in the Philippines – June 1991
• Aerosols affected solar radiation for two to three years
• May 1982 to December 1984 and June 1991 to December 1994 are not included in the TMY3 data sets (atypical)
National Renewable Energy Laboratory Innovation for Our Energy Future
TMY3 Data Quality and Uncertainty
• NSRDB uncertainty is included with hourly records, and is with respect to the original modeled data, NOThow well it typifies a site and its climate.
• The NSRDB Site Class (I, II, III) are significant, and that information is carried through for the user to evaluate for a particular application
• The pool of source years is documented for each site (the more years, the greater the likelihood of finding a typical year)
• NREL does not rank site quality – the user must evaluate data quality for the particular application
National Renewable Energy Laboratory Innovation for Our Energy Future
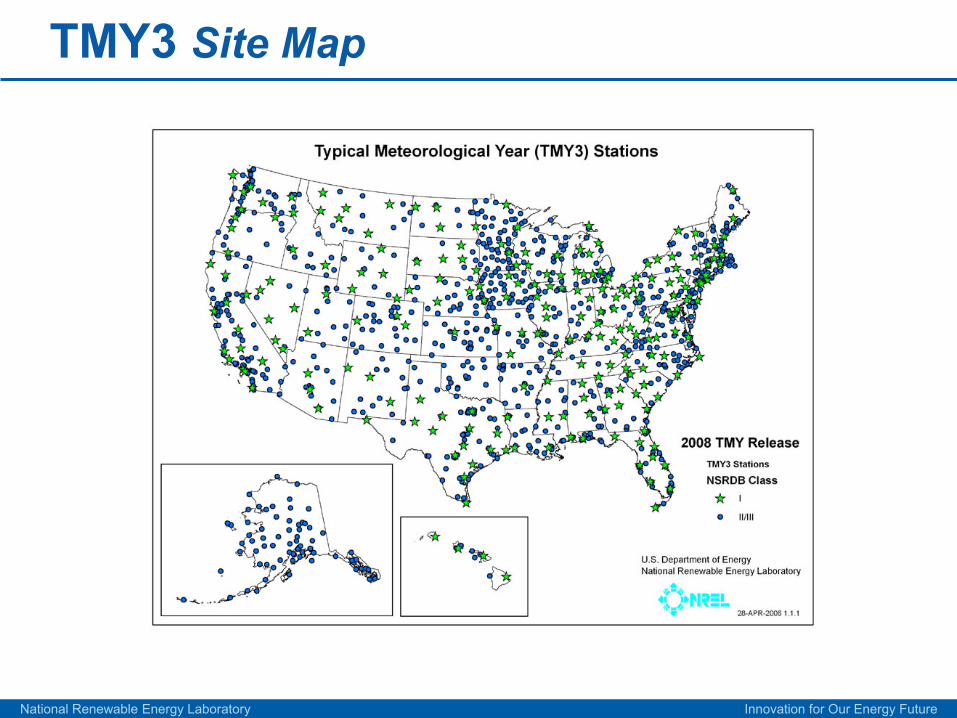
TMY3 Site Map
National Renewable Energy Laboratory Innovation for Our Energy Future
TMY3 Data Distribution
• Data available for unrestricted download from NREL (by site or entire data set)
• User’s Manual available on line• Conversion software (TMY3 to TMY2)
http://rredc.nrel.gov/solar/old_data/nsrdb/1991-2005/tmy3/
(Google NREL RREDC)
National Renewable Energy Laboratory Innovation for Our Energy Future
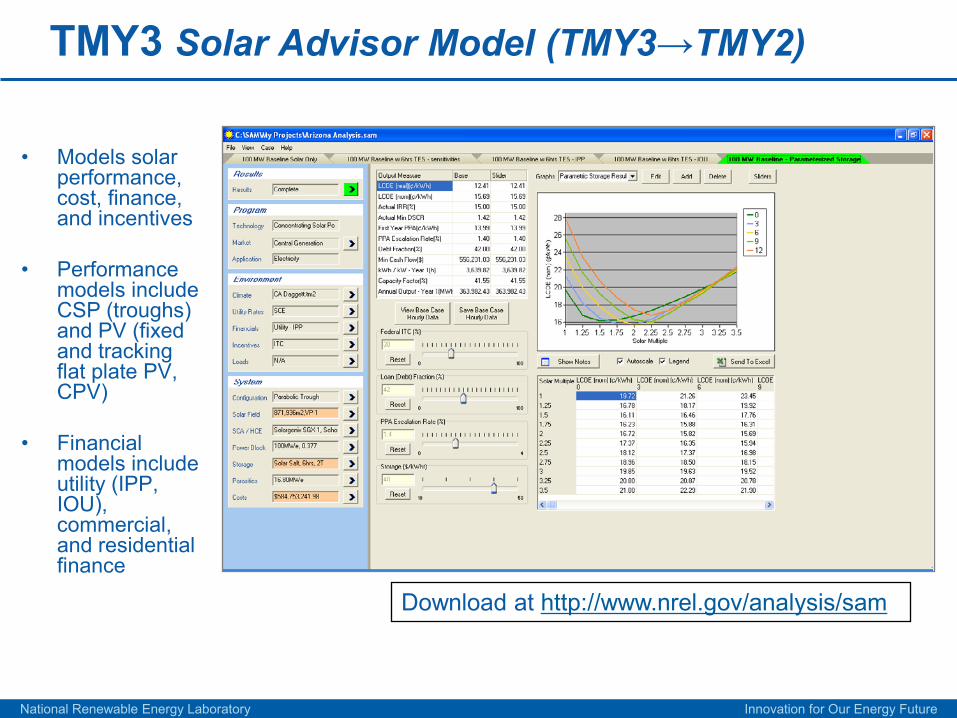
TMY3 Solar Advisor Model (TMY3→TMY2)
• Models solar performance, cost, finance, and incentives
• Performance models include CSP (troughs) and PV (fixed and tracking flat plate PV, CPV)
• Financial models include utility (IPP, IOU), commercial, and residential finance
Download at http://www.nrel.gov/analysis/sam
National Renewable Energy Laboratory Innovation for Our Energy Future
Solar MeasurementsUnderstand where you need to go before starting
• What is your purpose?– Prospecting, site selection, economic viability, performance
monitoring• What uncertainty do you need?
– Must be quantified (not just “as good as possible”)– Consider deficiencies of existing data sets for your application; will
measurements address the requirements?• What can you afford (or not afford)?
– How much data do you need (one year; decade…)– What resources exist to do measurements– Impacts on long-term success of the project
• What is your expertise?– Do your knowledge and expertise match the capabilities of the
equipment– Will you add or subtract from the credibility of your measurements
• What ancillary measurements may be required (Meteorological)
National Renewable Energy Laboratory Innovation for Our Energy Future
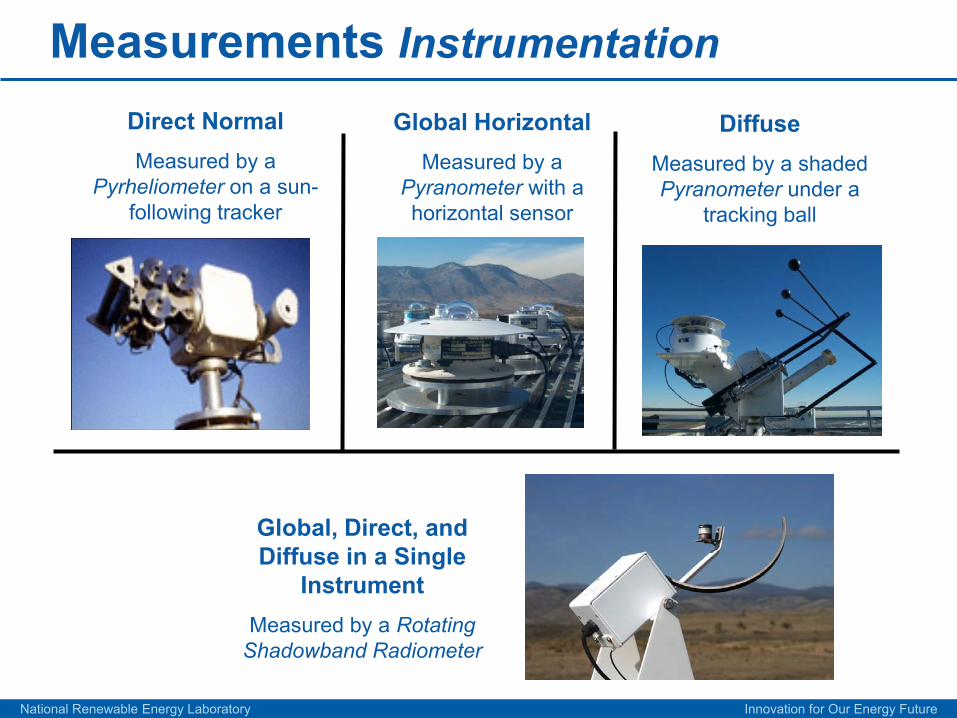
Measurements InstrumentationDirect NormalMeasured by a
Pyrheliometer on a sun-following tracker
Global HorizontalMeasured by a
Pyranometer with a horizontal sensor
DiffuseMeasured by a shaded Pyranometer under a
tracking ball
Global, Direct, and Diffuse in a Single
InstrumentMeasured by a Rotating
Shadowband Radiometer
National Renewable Energy Laboratory Innovation for Our Energy Future
Measurements What to measure
Most common solar measurements• Global Horizontal• Direct Normal• Diffuse Horizontal• Plane of Array
National Renewable Energy Laboratory Innovation for Our Energy Future
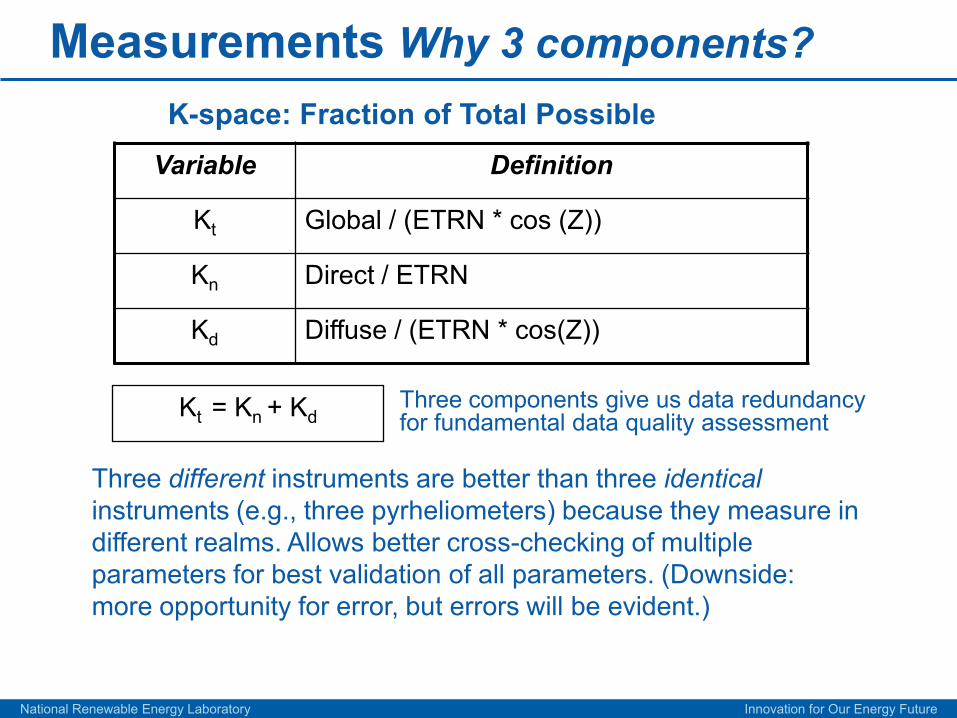
Measurements Why 3 components?
Three components give us data redundancy for fundamental data quality assessment
Variable Definition
Kt Global / (ETRN * cos (Z))
Kn Direct / ETRN
Kd Diffuse / (ETRN * cos(Z))
Kt = Kn + Kd
Three different instruments are better than three identicalinstruments (e.g., three pyrheliometers) because they measure in different realms. Allows better cross-checking of multiple parameters for best validation of all parameters. (Downside: more opportunity for error, but errors will be evident.)
K-space: Fraction of Total Possible
National Renewable Energy Laboratory Innovation for Our Energy Future
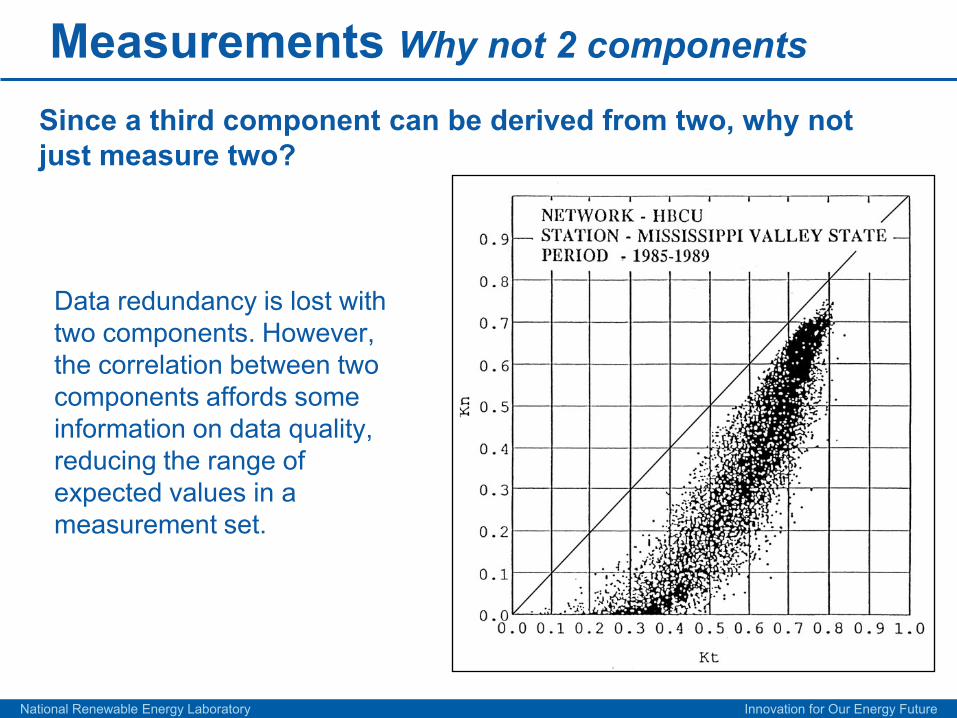
Measurements Why not 2 components
Data redundancy is lost with two components. However, the correlation between two components affords some information on data quality, reducing the range of expected values in a measurement set.
Since a third component can be derived from two, why not just measure two?
National Renewable Energy Laboratory Innovation for Our Energy Future
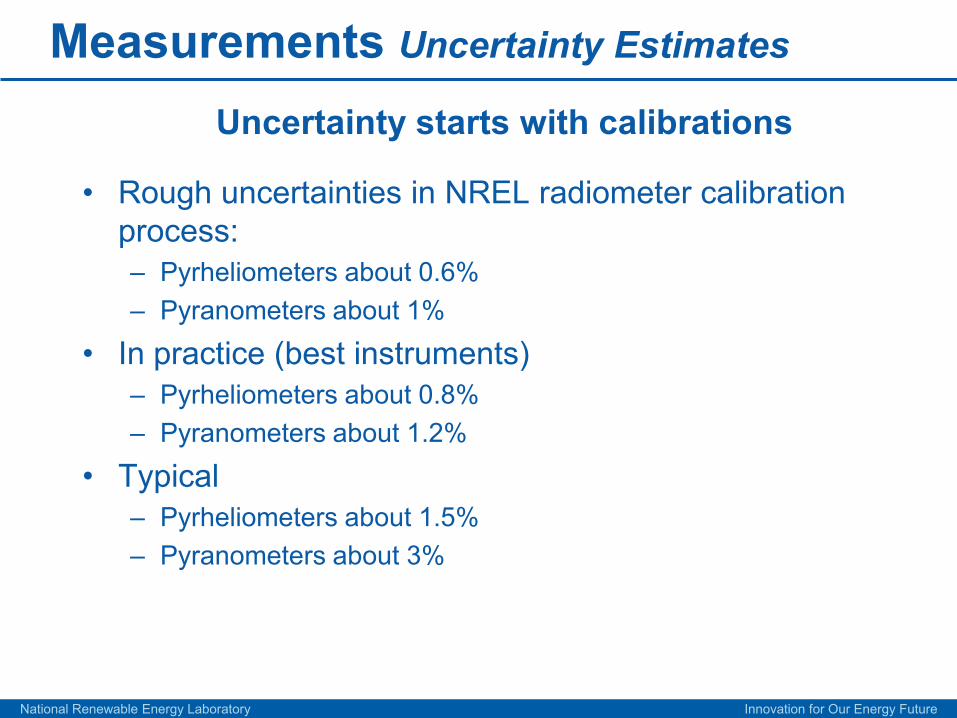
Measurements Uncertainty Estimates
• Rough uncertainties in NREL radiometer calibration process:– Pyrheliometers about 0.6%– Pyranometers about 1%
• In practice (best instruments)– Pyrheliometers about 0.8%– Pyranometers about 1.2%
• Typical– Pyrheliometers about 1.5%– Pyranometers about 3%
Uncertainty starts with calibrations
National Renewable Energy Laboratory Innovation for Our Energy Future
Measurements Uncertainty Estimates
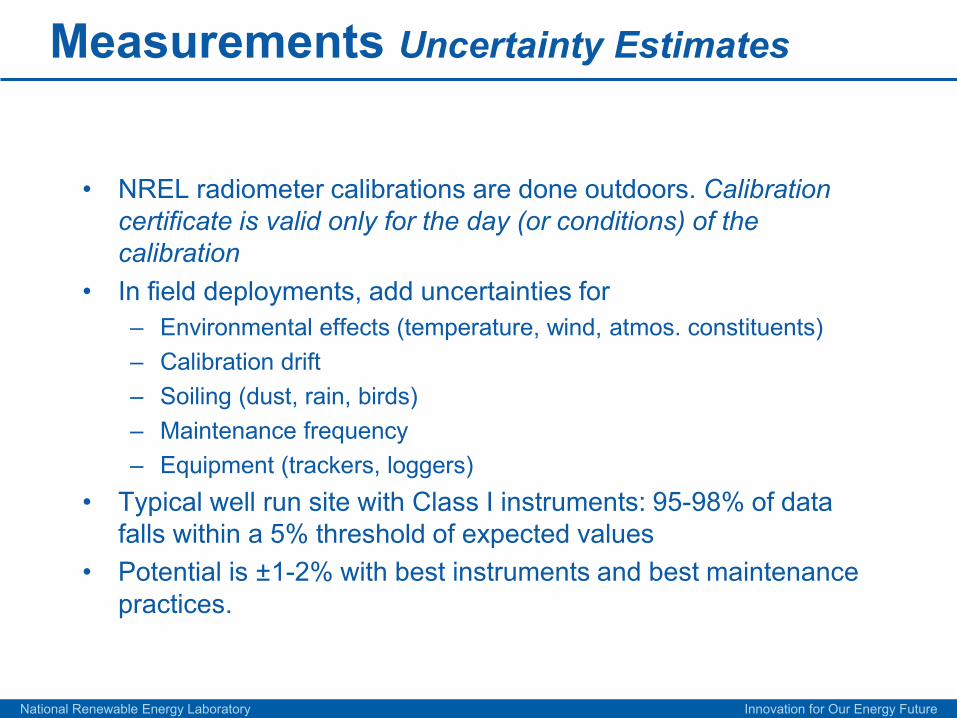
• NREL radiometer calibrations are done outdoors. Calibration certificate is valid only for the day (or conditions) of the calibration
• In field deployments, add uncertainties for – Environmental effects (temperature, wind, atmos. constituents)– Calibration drift– Soiling (dust, rain, birds)– Maintenance frequency– Equipment (trackers, loggers)
• Typical well run site with Class I instruments: 95-98% of data falls within a 5% threshold of expected values
• Potential is ±1-2% with best instruments and best maintenance practices.
National Renewable Energy Laboratory Innovation for Our Energy Future
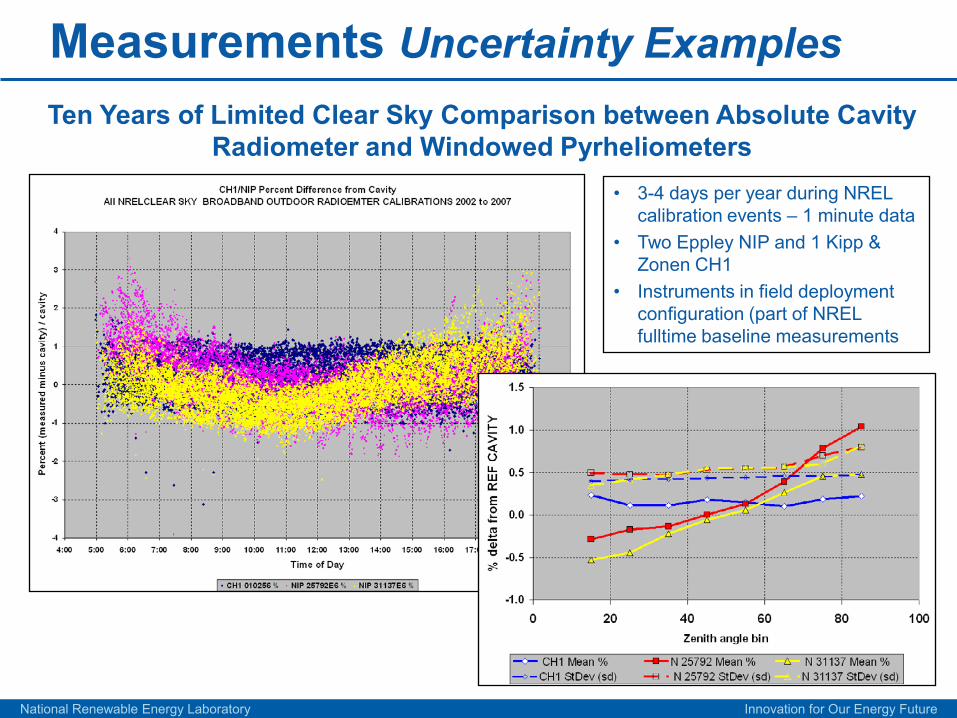
Measurements Uncertainty ExamplesTen Years of Limited Clear Sky Comparison between Absolute Cavity
Radiometer and Windowed Pyrheliometers• 3-4 days per year during NREL
calibration events – 1 minute data• Two Eppley NIP and 1 Kipp &
Zonen CH1• Instruments in field deployment
configuration (part of NREL fulltime baseline measurements
National Renewable Energy Laboratory Innovation for Our Energy Future
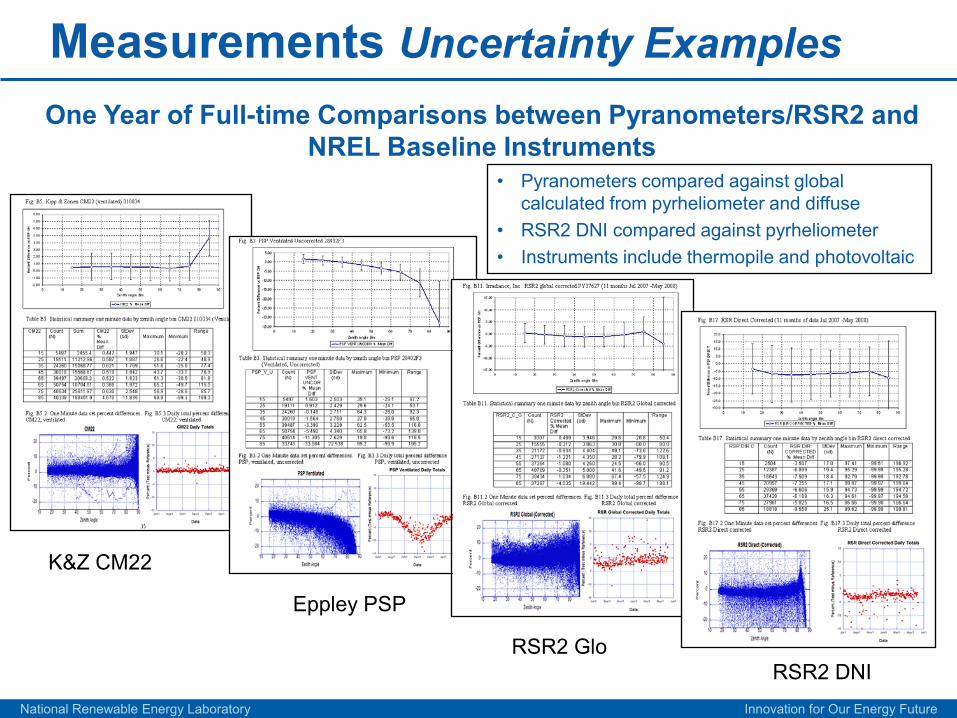
Measurements Uncertainty ExamplesOne Year of Full-time Comparisons between Pyranometers/RSR2 and
NREL Baseline Instruments• Pyranometers compared against global
calculated from pyrheliometer and diffuse• RSR2 DNI compared against pyrheliometer• Instruments include thermopile and photovoltaic
K&Z CM22
Eppley PSP
RSR2 GloRSR2 DNI
National Renewable Energy Laboratory Innovation for Our Energy Future
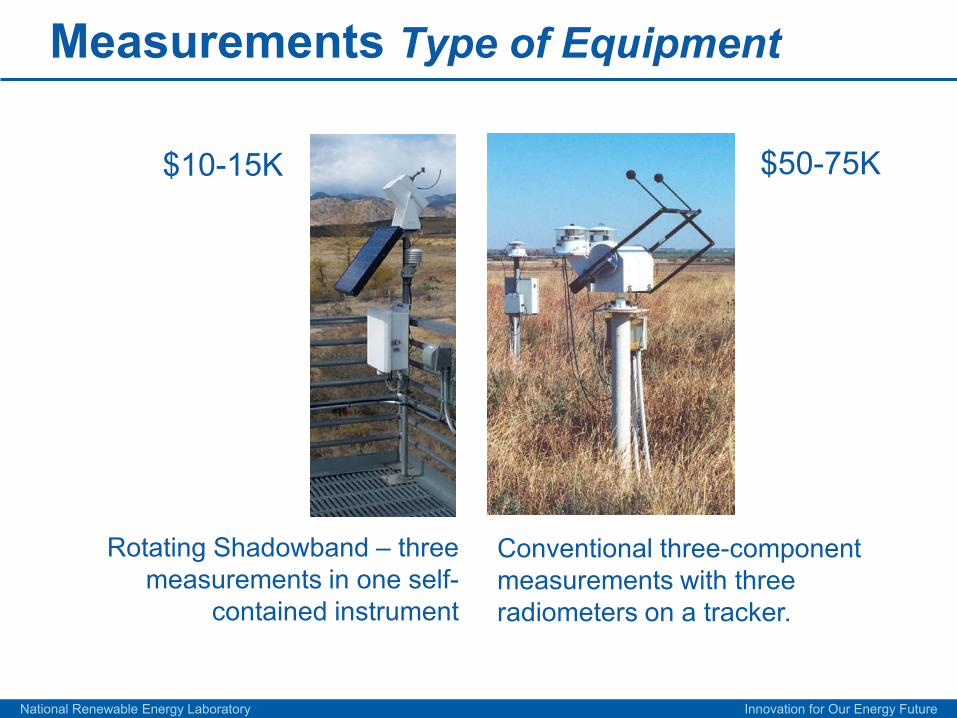
Measurements Type of Equipment
Rotating Shadowband – three measurements in one self-
contained instrument
Conventional three-component measurements with three radiometers on a tracker.
$10-15K $50-75K
National Renewable Energy Laboratory Innovation for Our Energy Future
Measurements Equipment Maintenance
Thermopile Instruments (with clear domes or windows)– Daily cleaning and tracker inspection; maintenance log
Rotating Shadowband– 2-3 times per week– cleaning and mechanical inspection; maintenance log
Calibrations– Annually
_____________________________________________________
But why?• Removes uncertainty due to soiling and sensor drift
– Soiling usually causes lower measurements, but can be higher, and the effects are variable and difficult to quantify
• Increases confidence in system operation and resulting data– You cannot be certain of what’s happening when you’re not there.
• You need to be able to justify your uncertainty claims
National Renewable Energy Laboratory Innovation for Our Energy Future
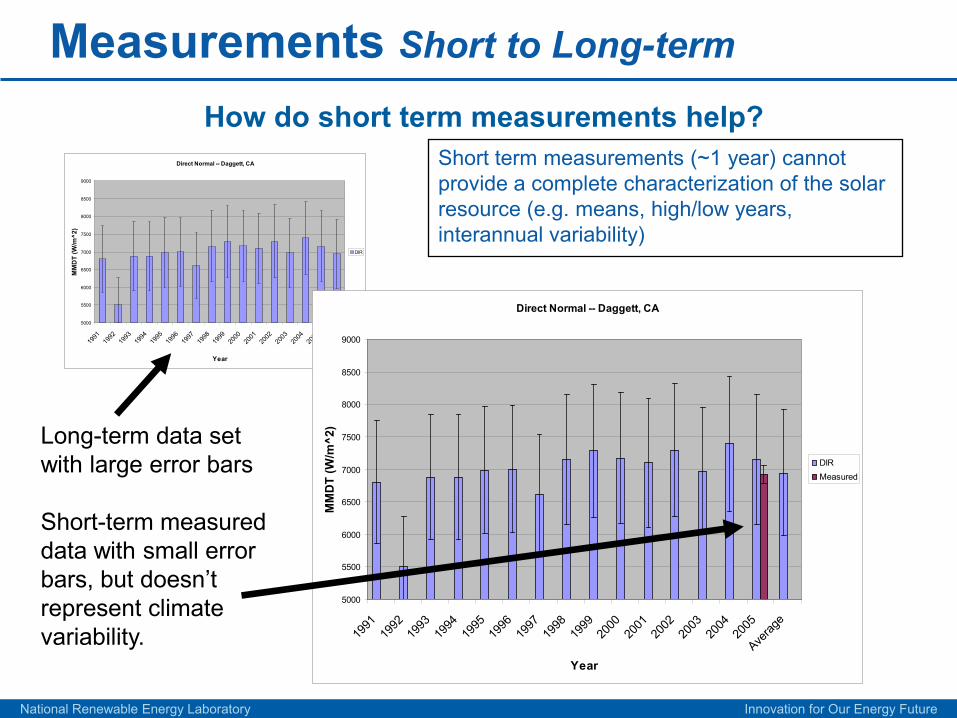
Measurements Short to Long-term
Short term measurements (~1 year) cannot provide a complete characterization of the solar resource (e.g. means, high/low years, interannual variability)
Direct Normal -- Daggett, CA
5000
5500
6000
6500
7000
7500
8000
8500
9000
1991
1992
1993
1994
1995
1996
1997
1998
1999
2000
2001
2002
2003
2004
2005
Averag
e
Year
MM
DT
(W/m
^2)
DIR
How do short term measurements help?
Direct Normal -- Daggett, CA
5000
5500
6000
6500
7000
7500
8000
8500
9000
1991
1992
1993
1994
1995
1996
1997
1998
1999
2000
2001
2002
2003
2004
2005
Averag
e
Year
MM
DT
(W/m
^2)
DIRMeasured
Long-term data set with large error bars
Short-term measured data with small error bars, but doesn’t represent climate variability.
National Renewable Energy Laboratory Innovation for Our Energy Future
Measurements Short to Long-term
Direct Normal -- Daggett, CA
5000
5500
6000
6500
7000
7500
8000
8500
9000
1991
1992
1993
1994
1995
1996
1997
1998
1999
2000
2001
2002
2003
2004
2005
Averag
e
Year
MM
DT
(W/m
^2)
DIRCalibrated
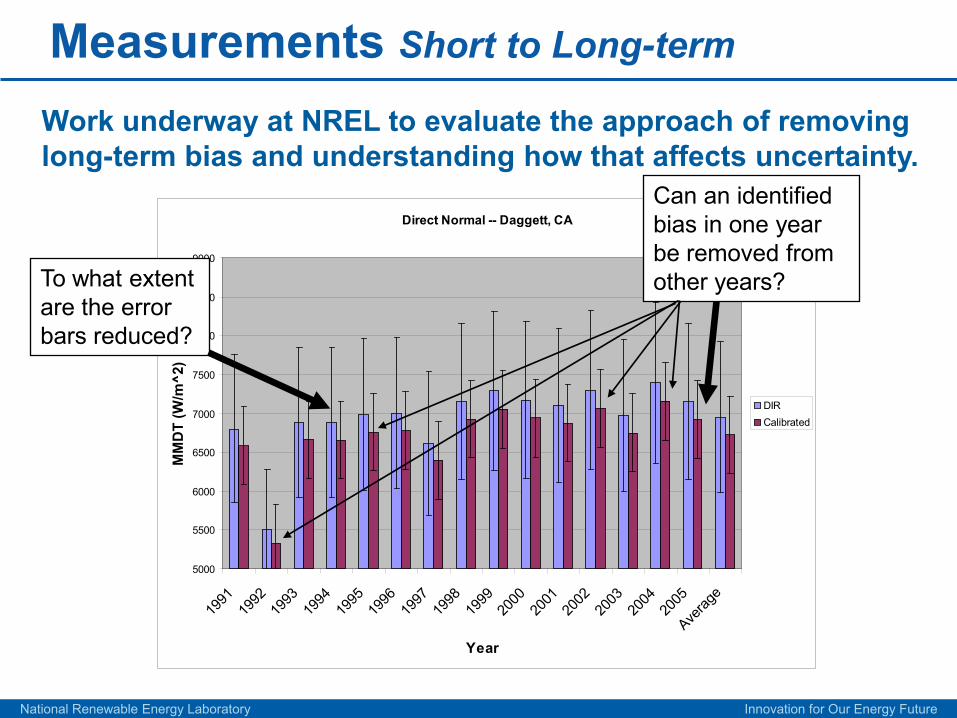
Can an identified bias in one year be removed from other years?To what extent
are the error bars reduced?
Work underway at NREL to evaluate the approach of removing long-term bias and understanding how that affects uncertainty.
National Renewable Energy Laboratory Innovation for Our Energy Future
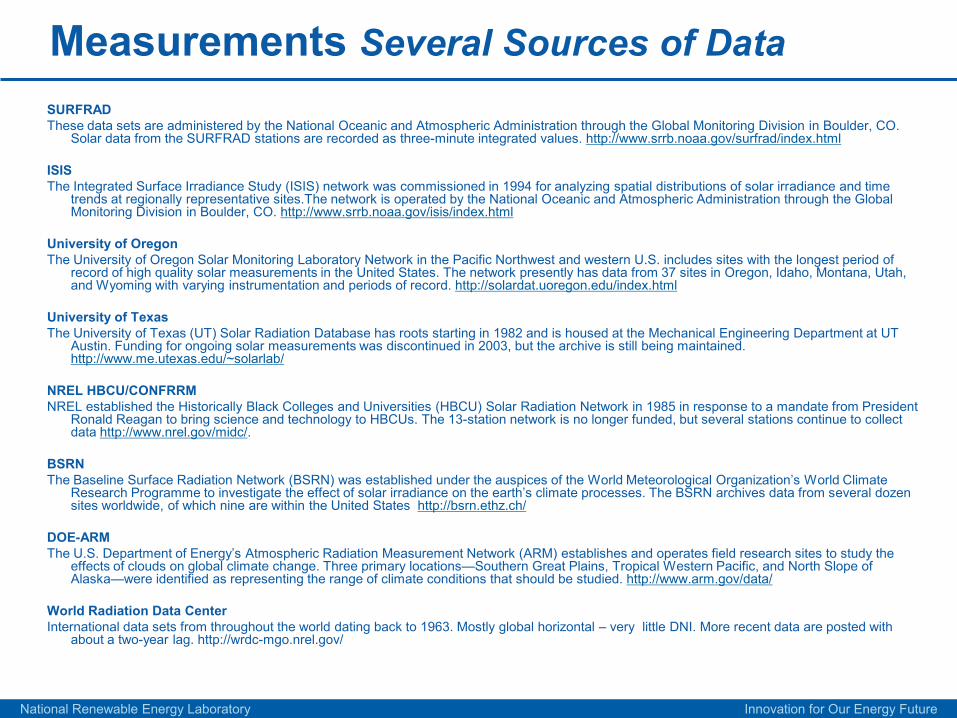
Measurements Several Sources of DataSURFRADThese data sets are administered by the National Oceanic and Atmospheric Administration through the Global Monitoring Division in Boulder, CO.
Solar data from the SURFRAD stations are recorded as three-minute integrated values. http://www.srrb.noaa.gov/surfrad/index.html
ISISThe Integrated Surface Irradiance Study (ISIS) network was commissioned in 1994 for analyzing spatial distributions of solar irradiance and time
trends at regionally representative sites.The network is operated by the National Oceanic and Atmospheric Administration through the Global Monitoring Division in Boulder, CO. http://www.srrb.noaa.gov/isis/index.html
University of OregonThe University of Oregon Solar Monitoring Laboratory Network in the Pacific Northwest and western U.S. includes sites with the longest period of
record of high quality solar measurements in the United States. The network presently has data from 37 sites in Oregon, Idaho, Montana, Utah, and Wyoming with varying instrumentation and periods of record. http://solardat.uoregon.edu/index.html
University of TexasThe University of Texas (UT) Solar Radiation Database has roots starting in 1982 and is housed at the Mechanical Engineering Department at UT
Austin. Funding for ongoing solar measurements was discontinued in 2003, but the archive is still being maintained. http://www.me.utexas.edu/~solarlab/
NREL HBCU/CONFRRMNREL established the Historically Black Colleges and Universities (HBCU) Solar Radiation Network in 1985 in response to a mandate from President
Ronald Reagan to bring science and technology to HBCUs. The 13-station network is no longer funded, but several stations continue to collect data http://www.nrel.gov/midc/.
BSRNThe Baseline Surface Radiation Network (BSRN) was established under the auspices of the World Meteorological Organization’s World Climate
Research Programme to investigate the effect of solar irradiance on the earth’s climate processes. The BSRN archives data from several dozen sites worldwide, of which nine are within the United States http://bsrn.ethz.ch/
DOE-ARMThe U.S. Department of Energy’s Atmospheric Radiation Measurement Network (ARM) establishes and operates field research sites to study the
effects of clouds on global climate change. Three primary locations—Southern Great Plains, Tropical Western Pacific, and North Slope of Alaska—were identified as representing the range of climate conditions that should be studied. http://www.arm.gov/data/
World Radiation Data CenterInternational data sets from throughout the world dating back to 1963. Mostly global horizontal – very little DNI. More recent data are posted with
about a two-year lag. http://wrdc-mgo.nrel.gov/
National Renewable Energy Laboratory Innovation for Our Energy Future
Measurements Expertise
SOLRMAPThe Solar Resource and Meteorological
Assessment Project
Collaboration between NREL and industry for high quality solar measurements