Embed Size (px)
Citation preview
Estimating the incidence of a housing affordability gap across the Cambridge travel-to-work areaAndreas Culora, Christian van Stolk
For more information on this publication, visit www.rand.org/t/RRA754-1
Published by the RAND Corporation, Santa Monica, Calif., and Cambridge, UK
© Copyright 2020 RAND Corporation
R® is a registered trademark.
RAND Europe is a not-for-profit research organisation that helps to improve policy and decision making through research and analysis. RAND’s publications do not necessarily reflect the opinions of its research clients and sponsors.
Limited Print and Electronic Distribution Rights This document and trademark(s) contained herein are protected by law. This representation of RAND intellectual property is provided for noncommercial use only. Unauthorized posting of this publication online is prohibited. Permission is given to duplicate this document for personal use only, as long as it is unaltered and complete. Permission is required from RAND to reproduce, or reuse in another form, any of its research documents for commercial use. For information on reprint and linking permissions, please visit www.rand.org/pubs/permissions.
Support RAND Make a tax-deductible charitable contribution at www.rand.org/giving/contribute
www.rand.org
www.randeurope.org
ii
Preface
Housing affordability as a concept tries to understand the relationship between average household income and the cost of housing in a given place. This is important as a vibrant local economy requires workers from all income levels to contribute to an economy. If certain groups of workers are priced out of the market, it can create shortages in the supply of labour and indeed impede local growth.
This report commissioned by Cambridge Ahead, a membership organisation consisting of large employers in the Cambridge area that aims to be a catalyst for the success of Cambridge and quality of life across the city region, looks at housing affordability in the Cambridge travel-to-work area.
An earlier report by Savills suggests that if households have an income between £25,000 and £45,000, they will spend about 30% of their income on housing in Cambridge. This is the threshold that the report’s authors use to assess housing affordability. This RAND Europe report does not aim to re-examine what housing affordability is. It simply tries to estimate how many households in Cambridge’s travel-to-work area are below this threshold. This requires an estimation of household incomes in the area.
The report finds that close to 50% of households fall below this threshold. This would indicate that they would financially struggle to live in Cambridge.
The report wants to start the discussion on how we can better assess and measure housing affordability. We welcome readers to suggest ways in which our estimates can be improved. The report does not make recommendations on what could or should be done to address the issue of housing affordability. However, to some many of these recommendations are perhaps obvious and focus for example on issues such as the supply of (affordable) housing in Cambridge.
Housing affordability is a pertinent issue as Cambridge remains one of the fastest growing areas in Europe. It also faces competition from strong economic centres such as London and other parts of the research triangle. So, creating the right environment for workers to live and work sustainably in the area is a key factor in the success of Cambridge going forward.
Christian van Stolk, Executive Vice President RAND Europe
iii
Summary
Almost half of the households living in the Cambridge travel-to-work area are estimated to fall into the housing affordability gap experienced by those earning £45,000 or less
In this study, it has been estimated that 203,235 households, or 48.4 per cent of all households living in the Cambridge travel-to-work area have an income that is below £45,000. Pre-existing research has identified a housing affordability gap where households living in Cambridge that earn between £25,000 and £45,000 spend more than 30 per cent of their income on housing costs, and struggle to access housing that meets their needs given their income. Thus, findings from this study indicate that almost half of the households living in the travel-to-work area fall into this affordability gap and are vulnerable to spending large amounts of their income on housing costs.
The number and proportion of households that fall into the affordability gap varies at a local level, with particularly high levels in Forest Heath, Harlow and St Edmundsbury
Geospatial analysis indicates that the housing affordability gap is especially prevalent within the travel-to-work area among neighbourhoods in the areas of Forest Heath, St Edmundsbury and Harlow. In Cambridgeshire, the incidence of the housing affordability gap is higher in neighbourhoods on the northern and eastern sides of the city of Cambridge and many parts of East Cambridgeshire, while the incidence of the affordability gap is relatively lower in neighbourhoods on the fringes of the city of Cambridge across South Cambridgeshire.
iv
Table of contents
Preface ..................................................................................................................................................... ii
Summary ................................................................................................................................................ iii
Figures ..................................................................................................................................................... v
Tables ..................................................................................................................................................... vi
Abbreviations ......................................................................................................................................... vii
Acknowledgements ............................................................................................................................... viii
1. Introduction ........................................................................................................................... 1
2. Aim of the study ..................................................................................................................... 4
3. Methodological approach ........................................................................................................ 5
3.1. Step 1: Understanding the relationship between UK-level individual and household income .. 6
3.2. Step 2: Constructing a household income distribution for the Cambridge TTWA .................. 6
3.3. Step 3: Aligning microdata on household income and population size .................................... 7
3.4. Step 4: Adjusting population microdata from individual to household level ............................ 8
3.5. Step 5: Estimating households falling into the affordability gap .............................................. 8
3.6. Limitations ............................................................................................................................. 9
4. Results ................................................................................................................................. 11
4.1. Understanding household income and population size across the Cambridge travel-to-work area ....................................................................................................................................... 11
4.2. Estimating households in the Cambridge travel-to-work area that fall into the housing affordability gap .................................................................................................................... 12
5. Conclusion ........................................................................................................................... 15
References .............................................................................................................................................. 16
Annex A. Household estimates by MSOA ................................................................................. 18
v
Figures
Figure 1. Understanding of the affordability gap in Cambridge ................................................................ 2
Figure 2. Individual and household income distribution for the Cambridge TTWA ................................ 7
Figure 3. Households falling into the housing affordability gap by Cambridge TTWA MSOAs ............. 14
vi
Tables
Table 1. List of ONS datasets used and purpose in the analysis ................................................................ 5
Table 2. Data on household and individual income distributions for the UK ........................................... 6
Table 3. Calculating average household size across authority districts within the Cambridge TTWA ........ 8
Table 4. Data used to adjust household population estimates ................................................................... 9
Table 5. Key descriptive statistics across the whole of the Cambridge TTWA ......................................... 11
Table 6. Estimated households falling into the housing affordability gap across the Cambridge TTWA . 12
Table 7. Estimated households falling into the affordability gap by MSOA ............................................ 18
vii
Abbreviations
ASHE Annual Survey of Hours and Earnings
MSOA Middle Layer Super Output Area
ONS Office for National Statistics
TTWA Travel-to-work area
viii
Acknowledgements
The authors would like to thank the quality assurance reviewers at RAND Europe, Barbara Janta and William Phillips, for their valuable comments on an earlier draft of this report. We would also like to thank our sponsors at Cambridge Ahead for supporting the study and providing useful insights throughout the development of this work. The views presented in this report are the authors. Any remaining errors are our own.
1
1. Introduction
‘Housing affordability’ and ‘affordable housing’ are highly contested terms with many definitions and metrics both across and within countries. At the European level, the affordability of housing is defined and measured by assessing the proportion of disposable household income that is spent on housing costs – if this proportion is at 40 per cent or more, housing costs are deemed to ‘overburden’ the household (Eurostat, 2020). In the UK, affordable housing is broadly defined as ‘housing for sale or rent, for those whose needs are not met by the market’ (Ministry of Housing, Communities and Local Government 2019). This can include: affordable housing for rent, starter homes, discounted market sales housing, and other affordable routes into homeownership (e.g. shared ownership). At the same time, the main method of measuring housing affordability in the UK is the use of house price-income ratios.
Other approaches to measuring housing affordability, aside from those described above, exist, e.g. residual income left for housing (Meen 2018). One of the main reasons that a variety of approaches exist is that income is just one of a number of factors that affect the affordability of housing for a given individual or household. Other factors that may influence what constitutes affordable housing include: ownership of assets (e.g. a business, other residential properties); availability of familial financial support; access to a pension; and access to financial support from the state among others. Approaches to measuring housing affordability have also sought to account for recent changes to housing markets and economies, e.g. rising proportions of households living in the private rented sector, changing welfare systems (Padley & Marshall 2018). As a result, assessing housing affordability on income alone may not be a completely accurate representation of the ability of a population in a given location to access housing that meets their needs.
As mentioned above, for the purposes of data collection and monitoring, the Office for National Statistics (ONS) undertakes analyses of housing affordability using house price-income ratios. According to the latest ONS data, the house price-income ratio across England as of 2019 was 7.8. In other words, households could expect to spend approximately 7.8 times their annual earnings on purchasing a home (Henretty 2019). This represented a slight decrease on the 2018 ratio, which was 8.0. At the same time, however, the latest data from Eurostat (for 2018) shows that 15.1 per cent of households in the UK were overburdened by housing costs, representing a noticeable increase on 2017 (12.4 per cent).1 This indicates that more households around the UK are spending a considerable proportion of their disposable income on housing costs, despite the slight improvement in the relationship between house prices and income in recent years.
1 See Eurostat housing cost overburden rate data.
RAND Europe
2
What constitutes ‘affordable housing’ may vary substantially at local levels too. Taking the UK as an example, it is well established that London and other towns and cities in the south east of England have particularly high house price-income ratios compared with other parts of the UK (Henretty 2019). Indeed, these locations are often widely mentioned in domestic policy and public debates around the issue of housing affordability (or a lack of).2 While the example often offered in these debates is London, Cambridge also features prominently as an area where housing affordability is particularly problematic, despite efforts to increase the provision of affordable housing for its population.3
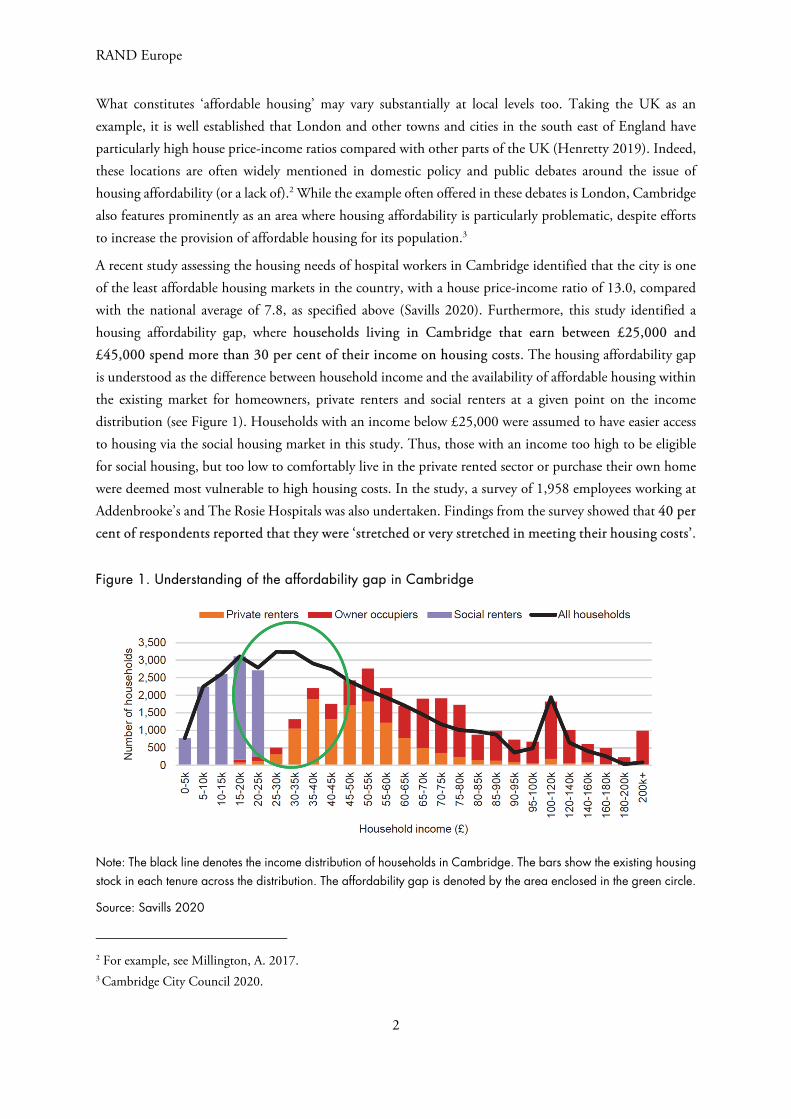
A recent study assessing the housing needs of hospital workers in Cambridge identified that the city is one of the least affordable housing markets in the country, with a house price-income ratio of 13.0, compared with the national average of 7.8, as specified above (Savills 2020). Furthermore, this study identified a housing affordability gap, where households living in Cambridge that earn between £25,000 and £45,000 spend more than 30 per cent of their income on housing costs. The housing affordability gap is understood as the difference between household income and the availability of affordable housing within the existing market for homeowners, private renters and social renters at a given point on the income distribution (see Figure 1). Households with an income below £25,000 were assumed to have easier access to housing via the social housing market in this study. Thus, those with an income too high to be eligible for social housing, but too low to comfortably live in the private rented sector or purchase their own home were deemed most vulnerable to high housing costs. In the study, a survey of 1,958 employees working at Addenbrooke’s and The Rosie Hospitals was also undertaken. Findings from the survey showed that 40 per cent of respondents reported that they were ‘stretched or very stretched in meeting their housing costs’.
Figure 1. Understanding of the affordability gap in Cambridge
Note: The black line denotes the income distribution of households in Cambridge. The bars show the existing housing stock in each tenure across the distribution. The affordability gap is denoted by the area enclosed in the green circle.
Source: Savills 2020
2 For example, see Millington, A. 2017. 3 Cambridge City Council 2020.
Estimating the incidence of a housing affordability gap across the Cambridge travel-to-work area
3
It is within this context that Cambridge Ahead, an organisation of influential employers4 in the Cambridge area who promote sustainable economic growth and quality of life in Cambridge, seeks to understand the incidence of this housing affordability gap that exists among households living in the Cambridge travel-to-work area (TTWA). One of the core projects of Cambridge Ahead is to influence policies affecting housing in Cambridge, which includes a consideration of how demographic and labour market changes may impact the local housing market.5 A major concern in the context of the Cambridge housing and labour market is ensuring that those working in the city can afford suitable accommodation that meets their need within a reasonable distance from their place of work. Thus, the geographical area of interest in this study is the TTWA, a unit created to represent self-contained areas where people live and work (Prothero 2016).
4 See Cambridge Ahead 2020a for more information. 5 Cambridge Ahead 2020b.
RAND Europe
4
2. Aim of the study
The sole aim of this study is to use open access datasets to estimate the number and proportion of households across the Cambridge TTWA with an income that is less than £45,000.
A key point to note is that, where relevant, the study will focus on all households with an income below £45,000, not just those with an income between £25,000 and £45,000. Receiving state support for housing does not necessarily indicate that households with an income below £25,000 would not spend a disproportionately high amount of their income on housing costs.
Estimating the incidence of a housing affordability gap across the Cambridge travel-to-work area
5
3. Methodological approach
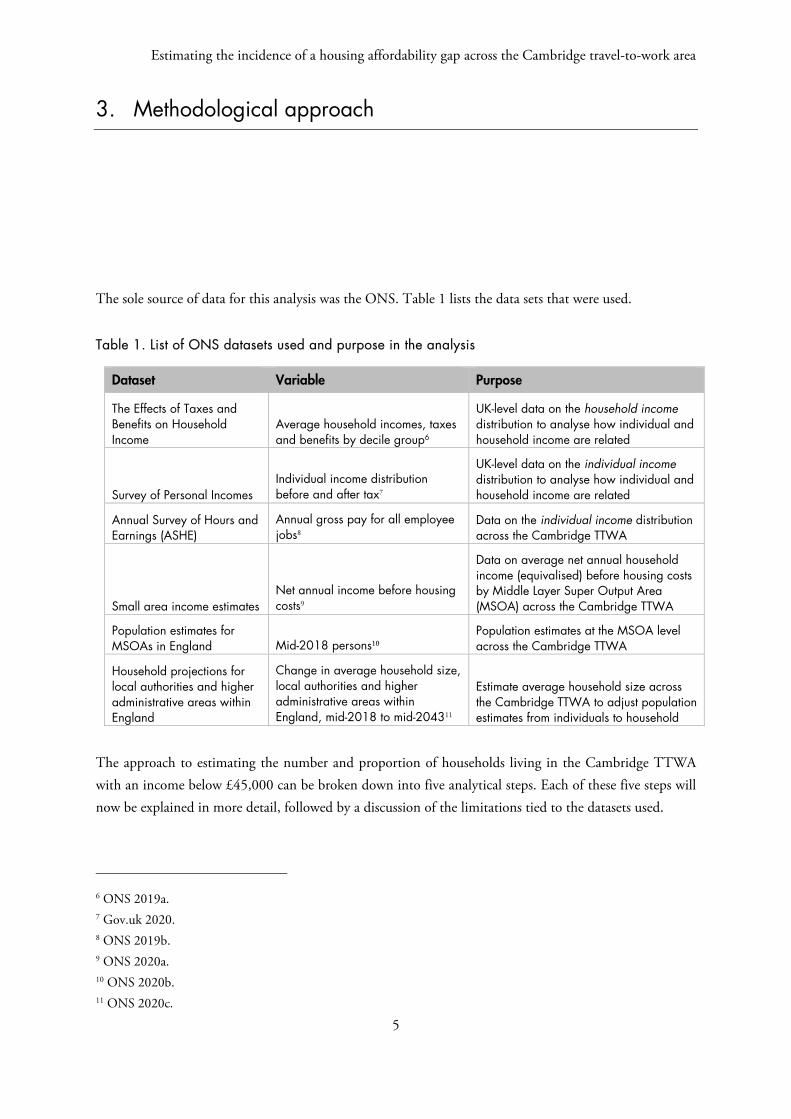
The sole source of data for this analysis was the ONS. Table 1 lists the data sets that were used.
Table 1. List of ONS datasets used and purpose in the analysis
The approach to estimating the number and proportion of households living in the Cambridge TTWA with an income below £45,000 can be broken down into five analytical steps. Each of these five steps will now be explained in more detail, followed by a discussion of the limitations tied to the datasets used.
6 ONS 2019a. 7 Gov.uk 2020. 8 ONS 2019b. 9 ONS 2020a. 10 ONS 2020b. 11 ONS 2020c.
Dataset Variable Purpose
The Effects of Taxes and Benefits on Household Income
Average household incomes, taxes and benefits by decile group6
UK-level data on the household income distribution to analyse how individual and household income are related
Survey of Personal Incomes Individual income distribution before and after tax7
UK-level data on the individual income distribution to analyse how individual and household income are related
Annual Survey of Hours and Earnings (ASHE)
Annual gross pay for all employee jobs8
Data on the individual income distribution across the Cambridge TTWA
Small area income estimates Net annual income before housing costs9
Data on average net annual household income (equivalised) before housing costs by Middle Layer Super Output Area (MSOA) across the Cambridge TTWA
Population estimates for MSOAs in England Mid-2018 persons10
Population estimates at the MSOA level across the Cambridge TTWA
Household projections for local authorities and higher administrative areas within England
Change in average household size, local authorities and higher administrative areas within England, mid-2018 to mid-204311
Estimate average household size across the Cambridge TTWA to adjust population estimates from individuals to household
RAND Europe
6
3.1. Step 1: Understanding the relationship between UK-level individual and household income
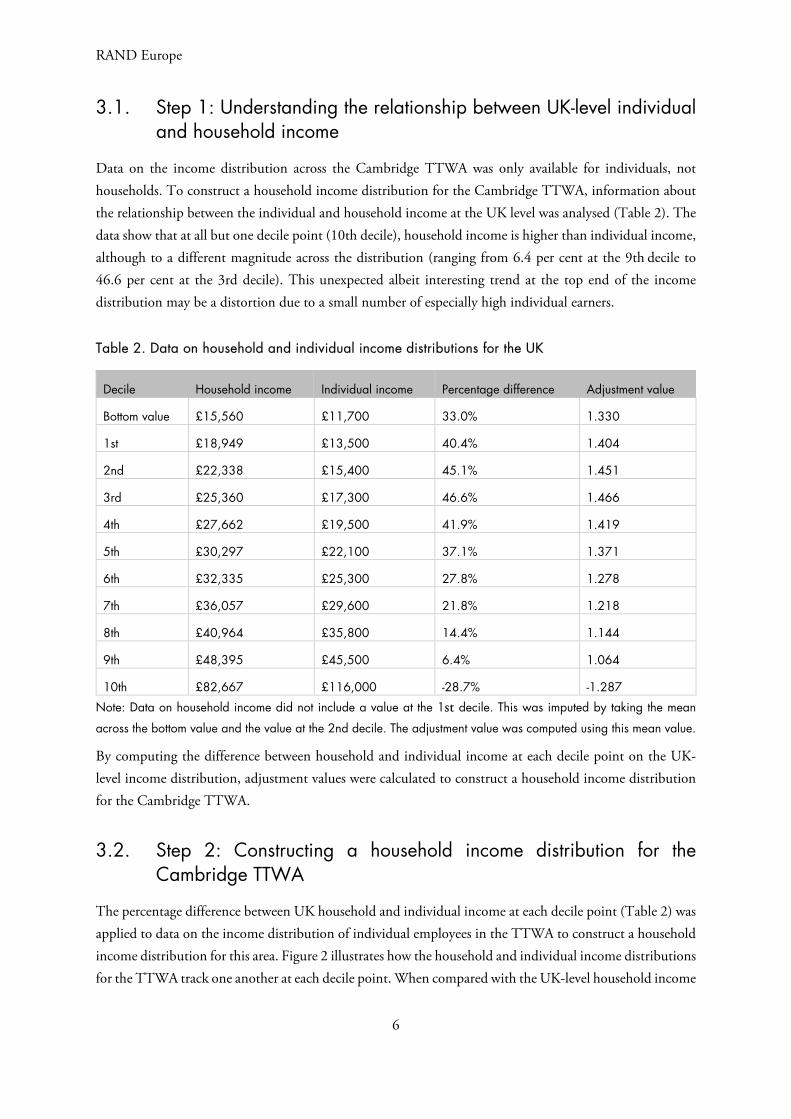
Data on the income distribution across the Cambridge TTWA was only available for individuals, not households. To construct a household income distribution for the Cambridge TTWA, information about the relationship between the individual and household income at the UK level was analysed (Table 2). The data show that at all but one decile point (10th decile), household income is higher than individual income, although to a different magnitude across the distribution (ranging from 6.4 per cent at the 9th decile to 46.6 per cent at the 3rd decile). This unexpected albeit interesting trend at the top end of the income distribution may be a distortion due to a small number of especially high individual earners.
Table 2. Data on household and individual income distributions for the UK
Decile Household income Individual income Percentage difference Adjustment value
Bottom value £15,560 £11,700 33.0% 1.330
1st £18,949 £13,500 40.4% 1.404
2nd £22,338 £15,400 45.1% 1.451
3rd £25,360 £17,300 46.6% 1.466
4th £27,662 £19,500 41.9% 1.419
5th £30,297 £22,100 37.1% 1.371
6th £32,335 £25,300 27.8% 1.278
7th £36,057 £29,600 21.8% 1.218
8th £40,964 £35,800 14.4% 1.144
9th £48,395 £45,500 6.4% 1.064
10th £82,667 £116,000 -28.7% -1.287
Note: Data on household income did not include a value at the 1st decile. This was imputed by taking the mean
across the bottom value and the value at the 2nd decile. The adjustment value was computed using this mean value.
By computing the difference between household and individual income at each decile point on the UK-level income distribution, adjustment values were calculated to construct a household income distribution for the Cambridge TTWA.
3.2. Step 2: Constructing a household income distribution for the Cambridge TTWA
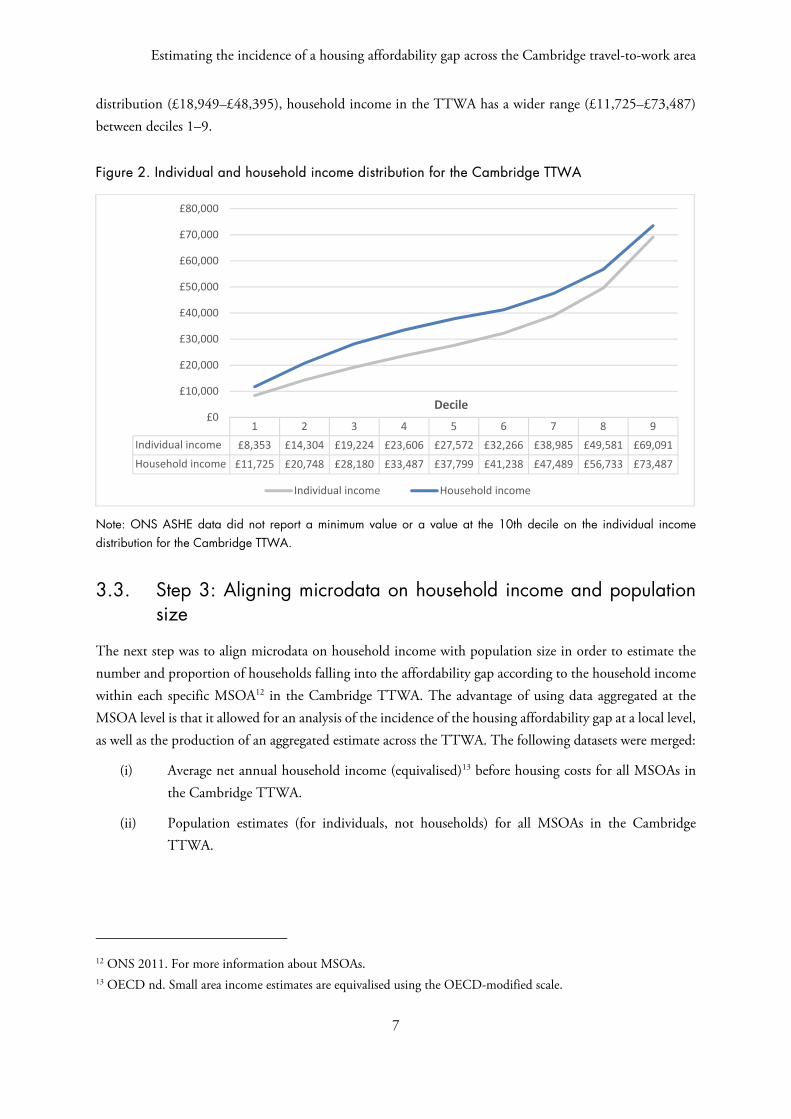
The percentage difference between UK household and individual income at each decile point (Table 2) was applied to data on the income distribution of individual employees in the TTWA to construct a household income distribution for this area. Figure 2 illustrates how the household and individual income distributions for the TTWA track one another at each decile point. When compared with the UK-level household income
Estimating the incidence of a housing affordability gap across the Cambridge travel-to-work area
7
distribution (£18,949–£48,395), household income in the TTWA has a wider range (£11,725–£73,487) between deciles 1–9.
Figure 2. Individual and household income distribution for the Cambridge TTWA
Note: ONS ASHE data did not report a minimum value or a value at the 10th decile on the individual income distribution for the Cambridge TTWA.
3.3. Step 3: Aligning microdata on household income and population size
The next step was to align microdata on household income with population size in order to estimate the number and proportion of households falling into the affordability gap according to the household income within each specific MSOA12 in the Cambridge TTWA. The advantage of using data aggregated at the MSOA level is that it allowed for an analysis of the incidence of the housing affordability gap at a local level, as well as the production of an aggregated estimate across the TTWA. The following datasets were merged:
(i) Average net annual household income (equivalised)13 before housing costs for all MSOAs in the Cambridge TTWA.
(ii) Population estimates (for individuals, not households) for all MSOAs in the Cambridge TTWA.
12 ONS 2011. For more information about MSOAs. 13 OECD nd. Small area income estimates are equivalised using the OECD-modified scale.
1 2 3 4 5 6 7 8 9
Individual income £8,353 £14,304 £19,224 £23,606 £27,572 £32,266 £38,985 £49,581 £69,091
Household income £11,725 £20,748 £28,180 £33,487 £37,799 £41,238 £47,489 £56,733 £73,487
£0
£10,000
£20,000
£30,000
£40,000
£50,000
£60,000
£70,000
£80,000
Decile
Individual income Household income
RAND Europe
8
Only MSOAs based in local authority districts falling within the Cambridge TTWA were merged and included in the final dataset for analysis (including: Cambridge; East Cambridgeshire; East Hertfordshire; Forest Heath; Harlow; North Hertfordshire; South Cambridgeshire; St Edmundsbury; Uttlesford).14
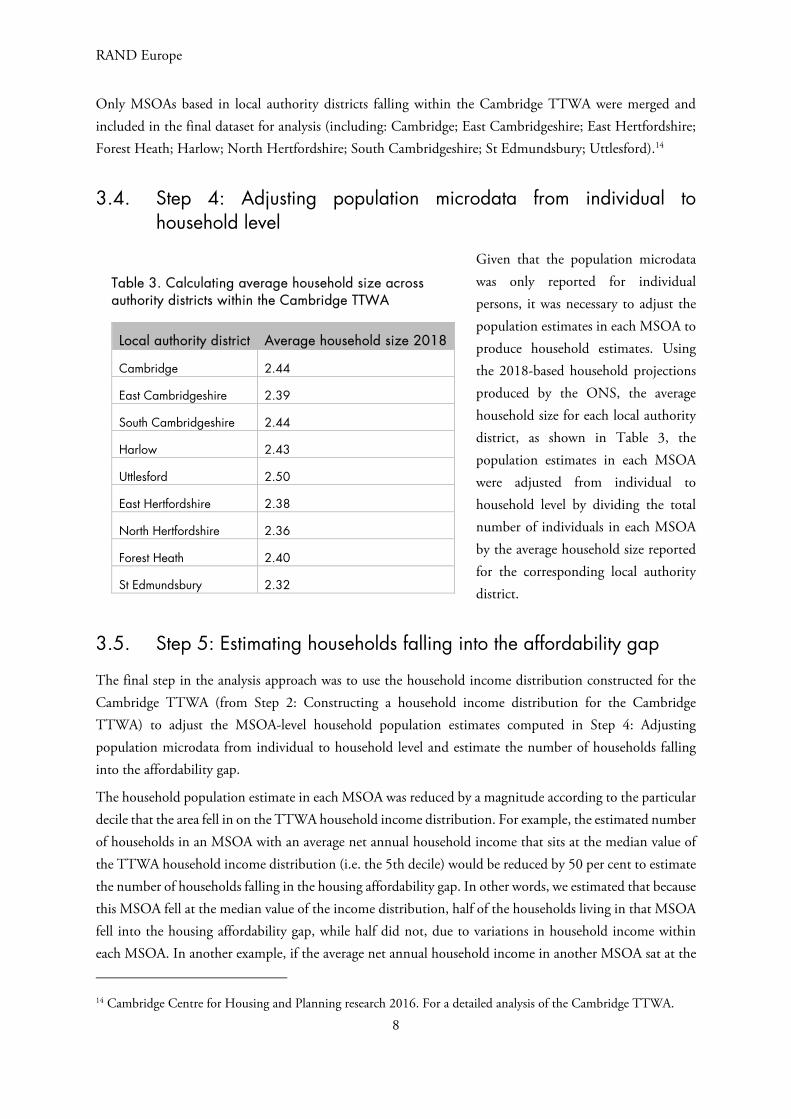
3.4. Step 4: Adjusting population microdata from individual to household level
Given that the population microdata was only reported for individual persons, it was necessary to adjust the population estimates in each MSOA to produce household estimates. Using the 2018-based household projections produced by the ONS, the average household size for each local authority district, as shown in Table 3, the population estimates in each MSOA were adjusted from individual to household level by dividing the total number of individuals in each MSOA by the average household size reported for the corresponding local authority district.
3.5. Step 5: Estimating households falling into the affordability gap
The final step in the analysis approach was to use the household income distribution constructed for the Cambridge TTWA (from Step 2: Constructing a household income distribution for the Cambridge TTWA) to adjust the MSOA-level household population estimates computed in Step 4: Adjusting population microdata from individual to household level and estimate the number of households falling into the affordability gap.
The household population estimate in each MSOA was reduced by a magnitude according to the particular decile that the area fell in on the TTWA household income distribution. For example, the estimated number of households in an MSOA with an average net annual household income that sits at the median value of the TTWA household income distribution (i.e. the 5th decile) would be reduced by 50 per cent to estimate the number of households falling in the housing affordability gap. In other words, we estimated that because this MSOA fell at the median value of the income distribution, half of the households living in that MSOA fell into the housing affordability gap, while half did not, due to variations in household income within each MSOA. In another example, if the average net annual household income in another MSOA sat at the
14 Cambridge Centre for Housing and Planning research 2016. For a detailed analysis of the Cambridge TTWA.
Table 3. Calculating average household size across authority districts within the Cambridge TTWA
Local authority district Average household size 2018
Cambridge 2.44
East Cambridgeshire 2.39
South Cambridgeshire 2.44
Harlow 2.43
Uttlesford 2.50
East Hertfordshire 2.38
North Hertfordshire 2.36
Forest Heath 2.40
St Edmundsbury 2.32
Estimating the incidence of a housing affordability gap across the Cambridge travel-to-work area
9
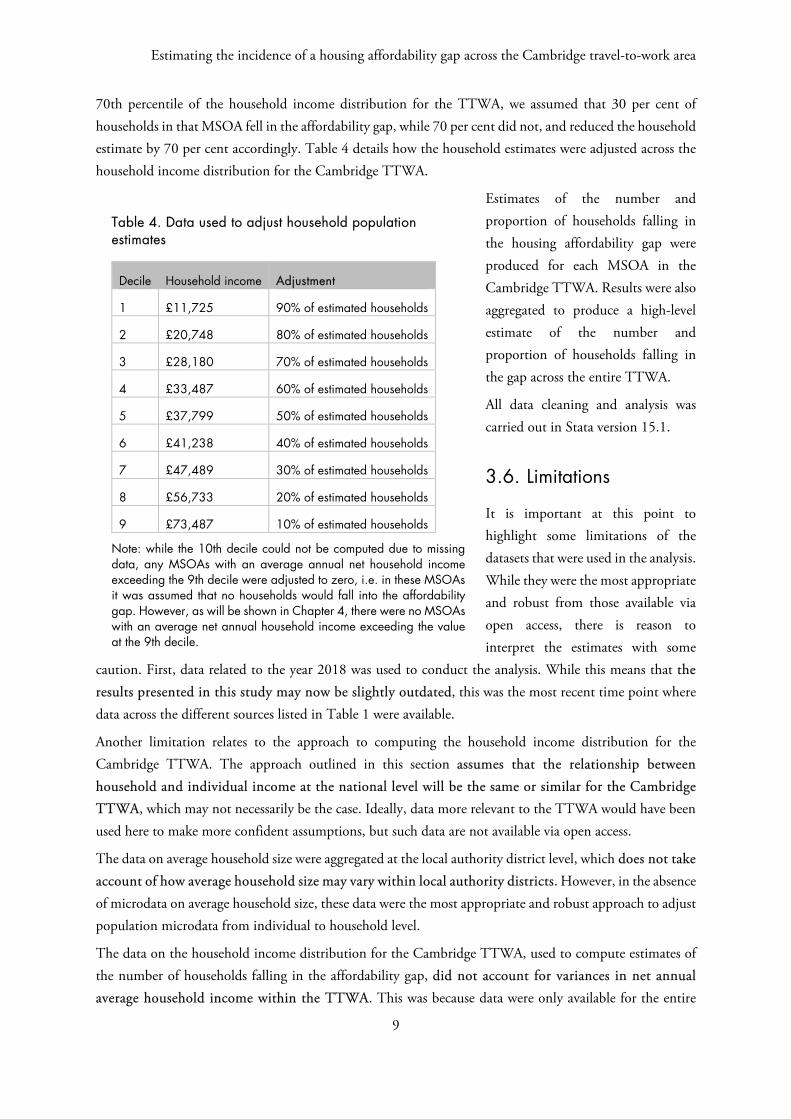
70th percentile of the household income distribution for the TTWA, we assumed that 30 per cent of households in that MSOA fell in the affordability gap, while 70 per cent did not, and reduced the household estimate by 70 per cent accordingly. Table 4 details how the household estimates were adjusted across the household income distribution for the Cambridge TTWA.
Estimates of the number and proportion of households falling in the housing affordability gap were produced for each MSOA in the Cambridge TTWA. Results were also aggregated to produce a high-level estimate of the number and proportion of households falling in the gap across the entire TTWA.
All data cleaning and analysis was carried out in Stata version 15.1.
3.6. Limitations
It is important at this point to highlight some limitations of the datasets that were used in the analysis. While they were the most appropriate and robust from those available via open access, there is reason to interpret the estimates with some
caution. First, data related to the year 2018 was used to conduct the analysis. While this means that the results presented in this study may now be slightly outdated, this was the most recent time point where data across the different sources listed in Table 1 were available.
Another limitation relates to the approach to computing the household income distribution for the Cambridge TTWA. The approach outlined in this section assumes that the relationship between household and individual income at the national level will be the same or similar for the Cambridge TTWA, which may not necessarily be the case. Ideally, data more relevant to the TTWA would have been used here to make more confident assumptions, but such data are not available via open access.
The data on average household size were aggregated at the local authority district level, which does not take account of how average household size may vary within local authority districts. However, in the absence of microdata on average household size, these data were the most appropriate and robust approach to adjust population microdata from individual to household level.
The data on the household income distribution for the Cambridge TTWA, used to compute estimates of the number of households falling in the affordability gap, did not account for variances in net annual average household income within the TTWA. This was because data were only available for the entire
Table 4. Data used to adjust household population estimates
Decile Household income Adjustment
1 £11,725 90% of estimated households
2 £20,748 80% of estimated households
3 £28,180 70% of estimated households
4 £33,487 60% of estimated households
5 £37,799 50% of estimated households
6 £41,238 40% of estimated households
7 £47,489 30% of estimated households
8 £56,733 20% of estimated households
9 £73,487 10% of estimated households
Note: while the 10th decile could not be computed due to missing data, any MSOAs with an average annual net household income exceeding the 9th decile were adjusted to zero, i.e. in these MSOAs it was assumed that no households would fall into the affordability gap. However, as will be shown in Chapter 4, there were no MSOAs with an average net annual household income exceeding the value at the 9th decile.
RAND Europe
10
TTWA, not local areas within the TTWA that could have been used to produce more precise local estimates of the incidence of the affordability gap. Thus, there is a degree of uncertainty with regard to how accurately the total number of households in each MSOA were adjusted to compute the estimated number of households falling within the affordability gap. This is especially pertinent as there are likely to be some disparities in affluence when comparing parts of Cambridgeshire with other areas of the TTWA. However, in the absence of locally specific microdata on income distributions, the approach outlined here represents the most robust method for estimating households falling into the affordability gap.
Finally, the estimates produced in this study do not take into account other factors that may affect housing affordability. First, the analysis does not include household-level financial factors that may affect the affordability of housing in the TTWA, e.g. ownership of assets, access to pensions, financial support from the state or social housing. As a result, it is possible that the approach outlined in this section may overestimate the number of households falling into the housing affordability gap, given that households on lower incomes but with access to resources such as those listed above may be less likely to fall into the affordability gap. Second, the analysis does not account for differential house prices and rental costs within the TTWA, which are likely to fluctuate at a local level, affecting the relative affordability of housing for those residing in the TTWA. Finally, the analysis does not account for some demographic differences (e.g. household composition, age, socio-economic background) that may vary across the TTWA and influence the number and proportion of households falling into the affordability gap. Nonetheless, income remains a central element of the assessment of housing affordability. Furthermore, the approach outlined in this section ensures that the results are comparable with the Savills study that provides some context for this study.
Estimating the incidence of a housing affordability gap across the Cambridge travel-to-work area
11
4. Results
4.1. Understanding household income and population size across the Cambridge travel-to-work area
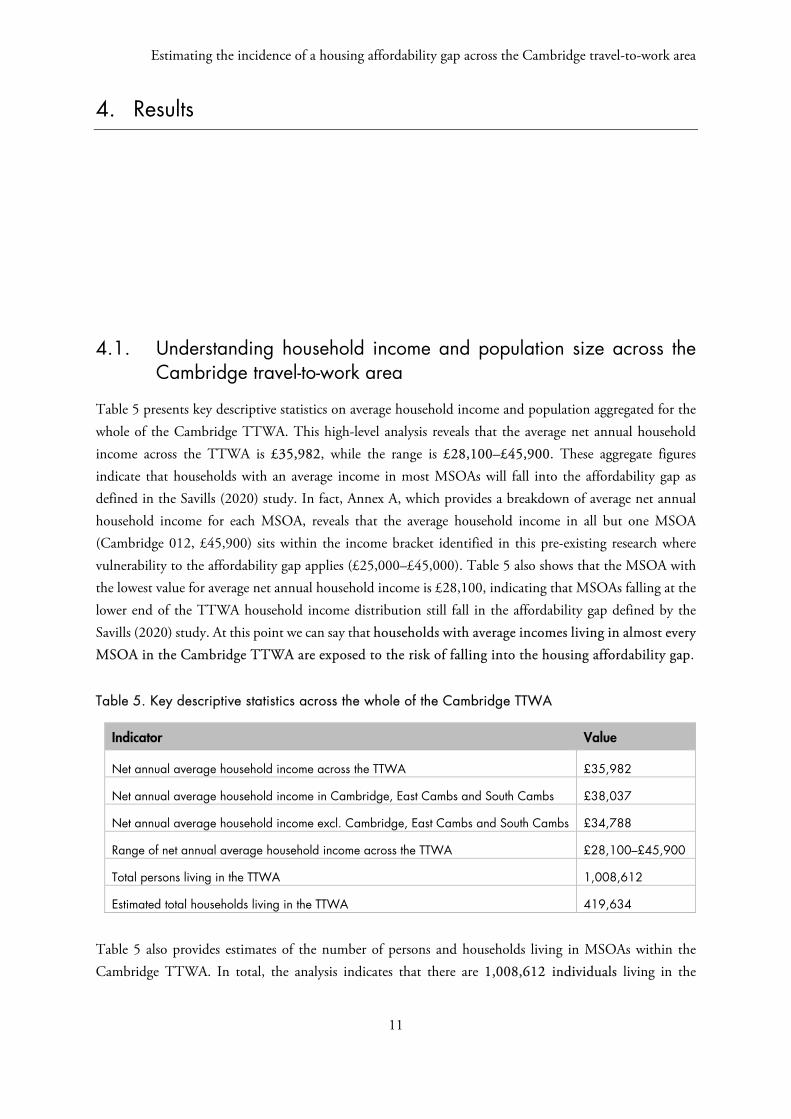
Table 5 presents key descriptive statistics on average household income and population aggregated for the whole of the Cambridge TTWA. This high-level analysis reveals that the average net annual household income across the TTWA is £35,982, while the range is £28,100–£45,900. These aggregate figures indicate that households with an average income in most MSOAs will fall into the affordability gap as defined in the Savills (2020) study. In fact, Annex A, which provides a breakdown of average net annual household income for each MSOA, reveals that the average household income in all but one MSOA (Cambridge 012, £45,900) sits within the income bracket identified in this pre-existing research where vulnerability to the affordability gap applies (£25,000–£45,000). Table 5 also shows that the MSOA with the lowest value for average net annual household income is £28,100, indicating that MSOAs falling at the lower end of the TTWA household income distribution still fall in the affordability gap defined by the Savills (2020) study. At this point we can say that households with average incomes living in almost every MSOA in the Cambridge TTWA are exposed to the risk of falling into the housing affordability gap.
Table 5. Key descriptive statistics across the whole of the Cambridge TTWA
Indicator Value
Net annual average household income across the TTWA £35,982
Net annual average household income in Cambridge, East Cambs and South Cambs £38,037
Net annual average household income excl. Cambridge, East Cambs and South Cambs £34,788
Range of net annual average household income across the TTWA £28,100–£45,900
Total persons living in the TTWA 1,008,612
Estimated total households living in the TTWA 419,634
Table 5 also provides estimates of the number of persons and households living in MSOAs within the Cambridge TTWA. In total, the analysis indicates that there are 1,008,612 individuals living in the
RAND Europe
12
TTWA. Furthermore, the approach to adjusting population estimates from the individual to household level (explained in Chapter 3) reveals that there are an estimated 419,634 households living in the TTWA.
The next step is to combine the data presented in this section with data on the household income distribution for the Cambridge TTWA (the distribution can be found in Chapter 3) to produce estimates of the number and proportion of households that fall within the housing affordability gap.
4.2. Estimating households in the Cambridge travel-to-work area that fall into the housing affordability gap
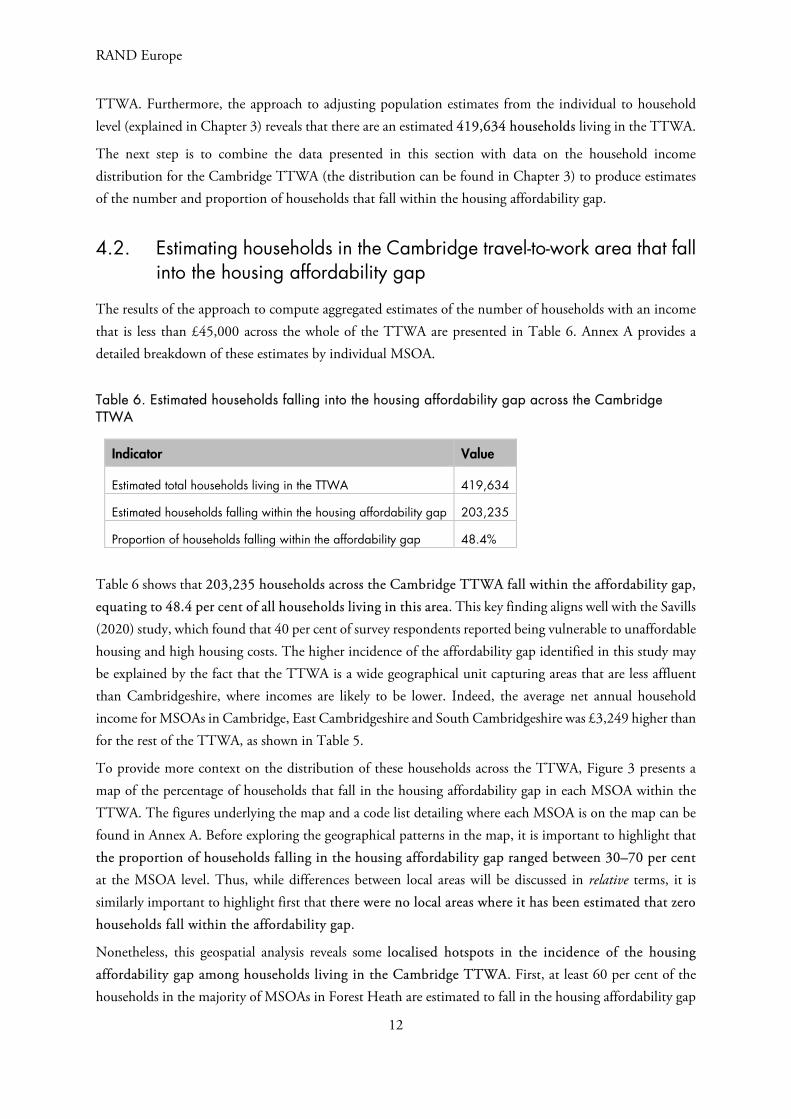
The results of the approach to compute aggregated estimates of the number of households with an income that is less than £45,000 across the whole of the TTWA are presented in Table 6. Annex A provides a detailed breakdown of these estimates by individual MSOA.
Table 6. Estimated households falling into the housing affordability gap across the Cambridge TTWA
Indicator Value
Estimated total households living in the TTWA 419,634
Estimated households falling within the housing affordability gap 203,235
Proportion of households falling within the affordability gap 48.4%
Table 6 shows that 203,235 households across the Cambridge TTWA fall within the affordability gap, equating to 48.4 per cent of all households living in this area. This key finding aligns well with the Savills (2020) study, which found that 40 per cent of survey respondents reported being vulnerable to unaffordable housing and high housing costs. The higher incidence of the affordability gap identified in this study may be explained by the fact that the TTWA is a wide geographical unit capturing areas that are less affluent than Cambridgeshire, where incomes are likely to be lower. Indeed, the average net annual household income for MSOAs in Cambridge, East Cambridgeshire and South Cambridgeshire was £3,249 higher than for the rest of the TTWA, as shown in Table 5.
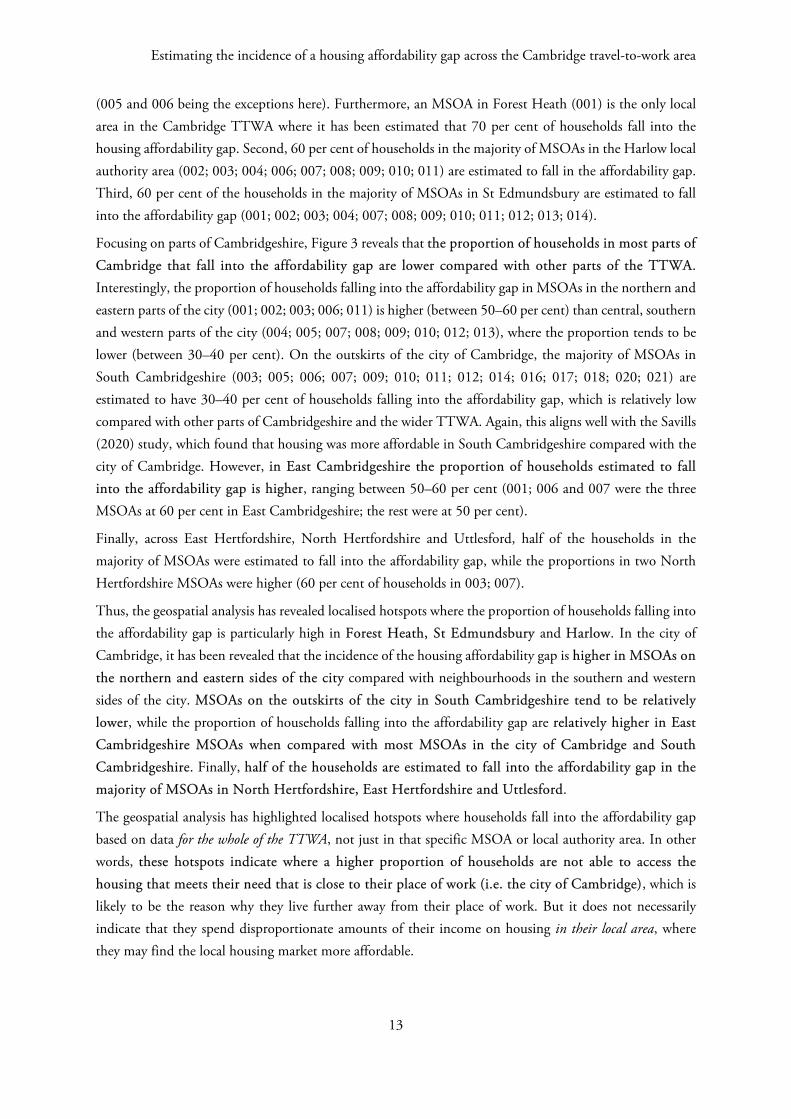
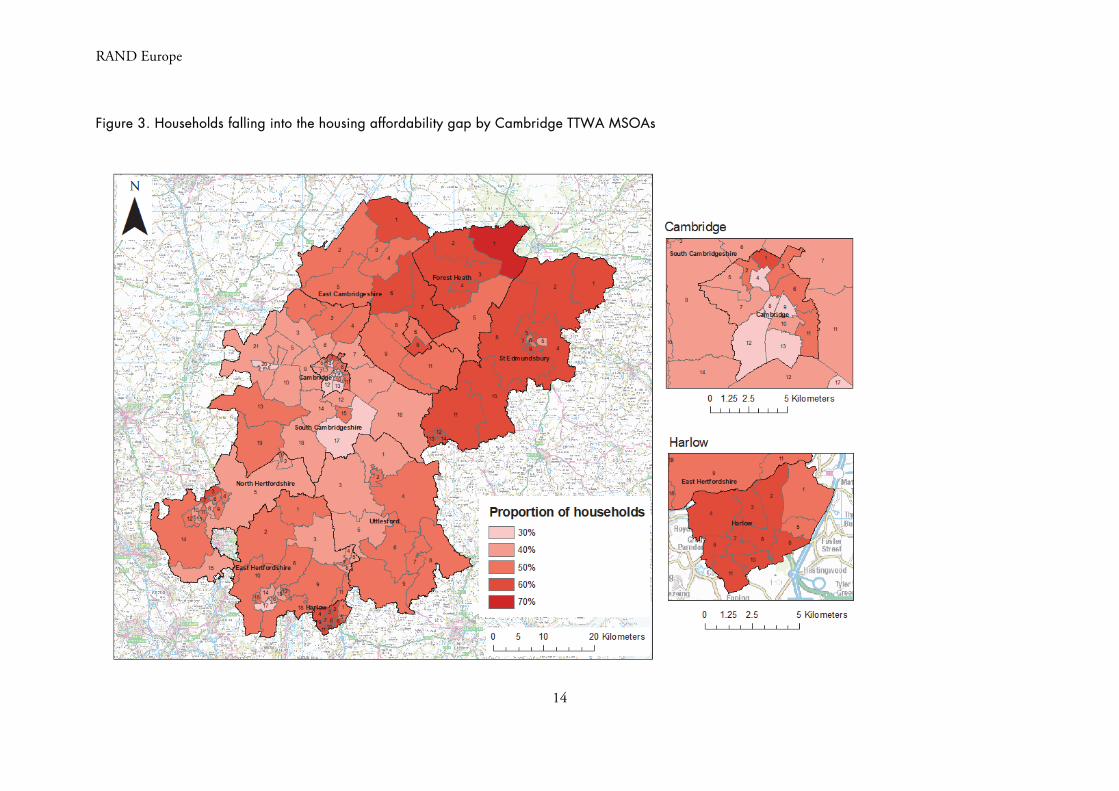
To provide more context on the distribution of these households across the TTWA, Figure 3 presents a map of the percentage of households that fall in the housing affordability gap in each MSOA within the TTWA. The figures underlying the map and a code list detailing where each MSOA is on the map can be found in Annex A. Before exploring the geographical patterns in the map, it is important to highlight that the proportion of households falling in the housing affordability gap ranged between 30–70 per cent at the MSOA level. Thus, while differences between local areas will be discussed in relative terms, it is similarly important to highlight first that there were no local areas where it has been estimated that zero households fall within the affordability gap.
Nonetheless, this geospatial analysis reveals some localised hotspots in the incidence of the housing affordability gap among households living in the Cambridge TTWA. First, at least 60 per cent of the households in the majority of MSOAs in Forest Heath are estimated to fall in the housing affordability gap
Estimating the incidence of a housing affordability gap across the Cambridge travel-to-work area
13
(005 and 006 being the exceptions here). Furthermore, an MSOA in Forest Heath (001) is the only local area in the Cambridge TTWA where it has been estimated that 70 per cent of households fall into the housing affordability gap. Second, 60 per cent of households in the majority of MSOAs in the Harlow local authority area (002; 003; 004; 006; 007; 008; 009; 010; 011) are estimated to fall in the affordability gap. Third, 60 per cent of the households in the majority of MSOAs in St Edmundsbury are estimated to fall into the affordability gap (001; 002; 003; 004; 007; 008; 009; 010; 011; 012; 013; 014).
Focusing on parts of Cambridgeshire, Figure 3 reveals that the proportion of households in most parts of Cambridge that fall into the affordability gap are lower compared with other parts of the TTWA. Interestingly, the proportion of households falling into the affordability gap in MSOAs in the northern and eastern parts of the city (001; 002; 003; 006; 011) is higher (between 50–60 per cent) than central, southern and western parts of the city (004; 005; 007; 008; 009; 010; 012; 013), where the proportion tends to be lower (between 30–40 per cent). On the outskirts of the city of Cambridge, the majority of MSOAs in South Cambridgeshire (003; 005; 006; 007; 009; 010; 011; 012; 014; 016; 017; 018; 020; 021) are estimated to have 30–40 per cent of households falling into the affordability gap, which is relatively low compared with other parts of Cambridgeshire and the wider TTWA. Again, this aligns well with the Savills (2020) study, which found that housing was more affordable in South Cambridgeshire compared with the city of Cambridge. However, in East Cambridgeshire the proportion of households estimated to fall into the affordability gap is higher, ranging between 50–60 per cent (001; 006 and 007 were the three MSOAs at 60 per cent in East Cambridgeshire; the rest were at 50 per cent).
Finally, across East Hertfordshire, North Hertfordshire and Uttlesford, half of the households in the majority of MSOAs were estimated to fall into the affordability gap, while the proportions in two North Hertfordshire MSOAs were higher (60 per cent of households in 003; 007).
Thus, the geospatial analysis has revealed localised hotspots where the proportion of households falling into the affordability gap is particularly high in Forest Heath, St Edmundsbury and Harlow. In the city of Cambridge, it has been revealed that the incidence of the housing affordability gap is higher in MSOAs on the northern and eastern sides of the city compared with neighbourhoods in the southern and western sides of the city. MSOAs on the outskirts of the city in South Cambridgeshire tend to be relatively lower, while the proportion of households falling into the affordability gap are relatively higher in East Cambridgeshire MSOAs when compared with most MSOAs in the city of Cambridge and South Cambridgeshire. Finally, half of the households are estimated to fall into the affordability gap in the majority of MSOAs in North Hertfordshire, East Hertfordshire and Uttlesford.
The geospatial analysis has highlighted localised hotspots where households fall into the affordability gap based on data for the whole of the TTWA, not just in that specific MSOA or local authority area. In other words, these hotspots indicate where a higher proportion of households are not able to access the housing that meets their need that is close to their place of work (i.e. the city of Cambridge), which is likely to be the reason why they live further away from their place of work. But it does not necessarily indicate that they spend disproportionate amounts of their income on housing in their local area, where they may find the local housing market more affordable.
RAND Europe
14
Figure 3. Households falling into the housing affordability gap by Cambridge TTWA MSOAs
Estimating the incidence of a housing affordability gap across the Cambridge travel-to-work area
15
5. Conclusion
The overall aim of this study was to use openly available datasets to estimate the number and proportion of households across the Cambridge TTWA with an income that is £45,000 or less. Pre-existing research has identified that households with an income between £25,000 and £45,000 are vulnerable to falling into a housing affordability gap where they spend 30 per cent or more of their income on housing costs. In a recent study, analysis revealed that 40 per cent of survey respondents working in Cambridge hospitals fell within this affordability gap. This study has estimated that 203,235, or 48.4 per cent of all households living in the TTWA have an income that is below £45,000, and thus fall within this housing affordability gap. The results from this study align well with pre-existing research, although it is plausible that the aggregate estimate produced in this study is higher, due to the fact that the TTWA is a wider geographical unit that captures less affluent areas compared with the city of Cambridge and surrounding areas.
Furthermore, the study has identified that the incidence of households falling within this affordability gap is somewhat geographically uneven across the TTWA. Indeed, the incidence of the affordability gap is especially high among MSOAs in Forest Heath, St Edmundsbury and Harlow. In parts of Cambridgeshire more specifically, the incidence of the housing affordability gap is higher in the northern and eastern sides of the city of Cambridge and parts of East Cambridgeshire, while MSOAs on the fringes of the city of Cambridge in South Cambridgeshire tend to have lower numbers of households falling into the affordability gap.
It is important to reiterate that while the datasets used in the analysis were the most appropriate, accurate and robust from those that are available via open access, the estimates produced in this study should be interpreted with some caution due to the limitations and uncertainties already discussed in Chapter 3.
Nonetheless, these findings raise profound questions for local decision makers with regard to the supply of housing to meet the diverse needs of individuals and family households in the Cambridge TTWA, rates of housebuilding, the delivery of affordable and social housing, and the inclusion of households vulnerable to deprivation stemming from, or related to, high housing costs.
RAND Europe
16
References
Cambridge Ahead. 2020a. As of 6 November 2020: https://www.cambridgeahead.co.uk/about-us/
———. b. As of 6 November 2020: https://www.cambridgeahead.co.uk/our-projects/housing/
Cambridge Centre for Housing and Planning Research. 2016. ‘Experimental Review of the Cambridge Travel to Work Area (TTWA) as a Tool for Informing Local Housing Policy – Including a Study of the Ely Housing Market in the Context of the Cambridge TTWA.’ As of 6 November 2020: https://www.cchpr.landecon.cam.ac.uk/Research/Start-Year/2015/Refining-the-recent-release-of-the-ONS-Travel-To-Work-Areas/Experimental-review-of-the-Cambridge-Travel-to-Work-Area
Cambridge City Council 2020. ‘Affordable Housing Programme.’ As of 6 November 2020: https://www.cambridge.gov.uk/affordable-housing-programme
Eurostat. 2020. ‘Housing Cost Overburden Rate.’ As of 2 November 2020: https://ec.europa.eu/eurostat/statistics-explained/index.php/Glossary:Housing_cost_overburden_rate
Gov.uk. 2020. ‘Percentile Points for Total Income Before and After Tax.’ As of 6 November 2020: https://www.gov.uk/government/statistics/percentile-points-for-total-income-before-and-after-tax-1992-to-2011
Henretty, Nigel. 2019. ‘Housing Affordability in England and Wales: 2019.’ As of 2 November 2020: https://www.ons.gov.uk/peoplepopulationandcommunity/housing/bulletins/housingaffordabilityinenglandandwales/2019
Meen, Geoffrey. 2018. ‘How Should Housing Affordability be Measured?’ As of 2 November 2020: http://housingevidence.ac.uk/wp-content/uploads/2018/09/R2018_02_01_How_to_measure_affordability.pdf
Millington, Alison. 2017. ‘The UK’s Least Affordable Cities.’ As of 6 November 2020: https://www.independent.co.uk/life-style/uk-least-affordable-cities-house-prices-london-oxford-a7606326.html
Ministry of Housing, Communities and Local Government. 2019. National Planning Policy Framework. As of 2 November 2020: https://assets.publishing.service.gov.uk/government/uploads/system/uploads/attachment_data/file/810197/NPPF_Feb_2019_revised.pdf
Estimating the incidence of a housing affordability gap across the Cambridge travel-to-work area
17
OECD nd. ‘What are Equivalence Scales?’ As of 6 November 2020: http://www.oecd.org/els/soc/OECD-Note-EquivalenceScales.pdf
Office for National Statistics. 2011. ‘Census Geography.’ As of 6 November 2020: https://www.ons.gov.uk/methodology/geography/ukgeographies/censusgeography
———. 2019a. ‘The Effects of Taxes and Benefits on Household Income, Disposable Income Estimate: 2019.’ As of 6 November 2020: https://www.ons.gov.uk/peoplepopulationandcommunity/personalandhouseholdfinances/incomeandwealth/datasets/householddisposableincomeandinequality
———. 2019b. ‘Earnings and Hours Worked, Work and Residence-Based Travel to Work Area: ASHE Tables 11 and 12.’ As of 6 November 2020: https://www.ons.gov.uk/datasets/ashe-tables-11-and-12/editions/time-series/versions/1
———. 2020a. ‘Income estimates for Small Areas, England and Wales.’ As of 6 November 2020: https://www.ons.gov.uk/employmentandlabourmarket/peopleinwork/earningsandworkinghours/datasets/smallareaincomeestimatesformiddlelayersuperoutputareasenglandandwales
———. 2020b. ‘Middle Super Output Area Population Estimates (National Statistics).’ As of 6 November 2020: https://www.ons.gov.uk/peoplepopulationandcommunity/populationandmigration/populationestimates/datasets/middlesuperoutputareamidyearpopulationestimatesnationalstatistics
———. 2020c. ‘Household Projections for England: Detailed Data for Modelling and Analysis.’ As of 6 November 2020: https://www.ons.gov.uk/peoplepopulationandcommunity/populationandmigration/populationprojections/datasets/householdprojectionsforenglanddetaileddataformodellingandanalysis
Prothero, Richard. 2016. ‘Travel to Work Area Analysis in Great Britain: 2016.’ As of 2 November 2020: https://www.ons.gov.uk/employmentandlabourmarket/peopleinwork/employmentandemployeetypes/articles/traveltoworkareaanalysisingreatbritain/2016
Padley, M. & L. Marshall. 2018. ‘Defining and Measuring Housing Affordability Using the Minimum Income Standard.’ Housing Studies 34 (8): 1307–29.
Savills. 2020. Assessing the Housing Need of Hospital Workers: A Report for Cambridge University Hospitals NHS Foundation Trust (CUH).
RAND Europe
18
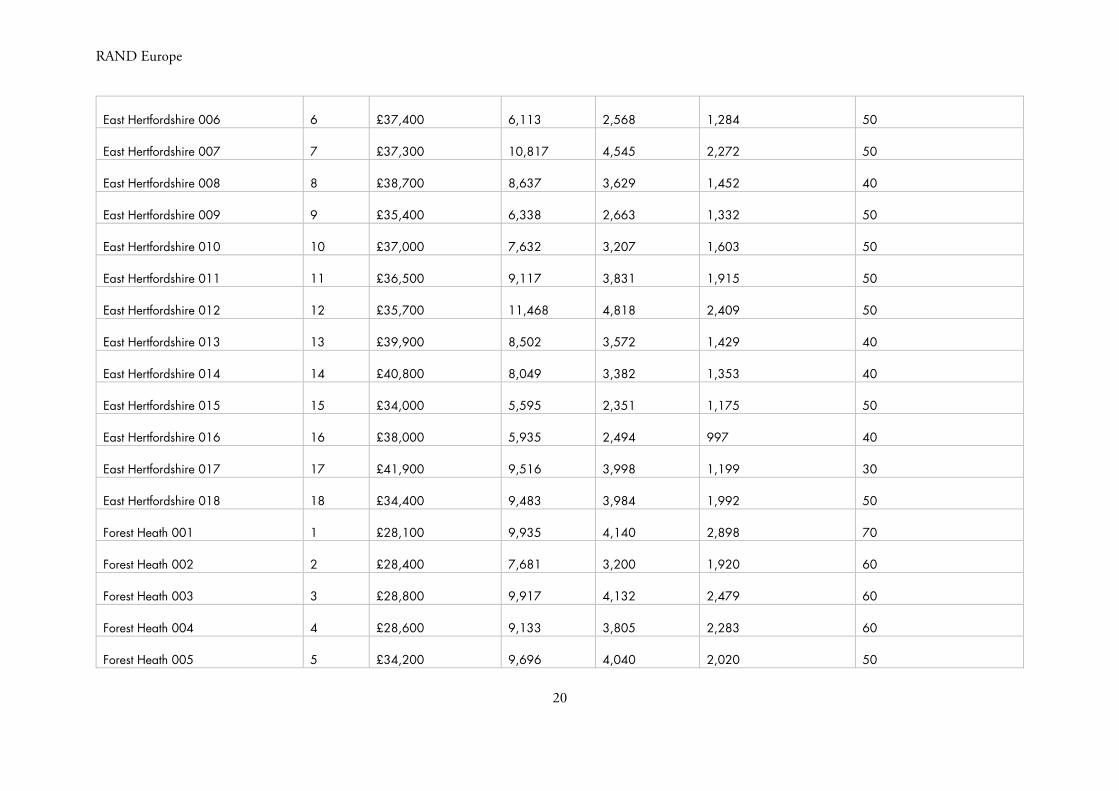
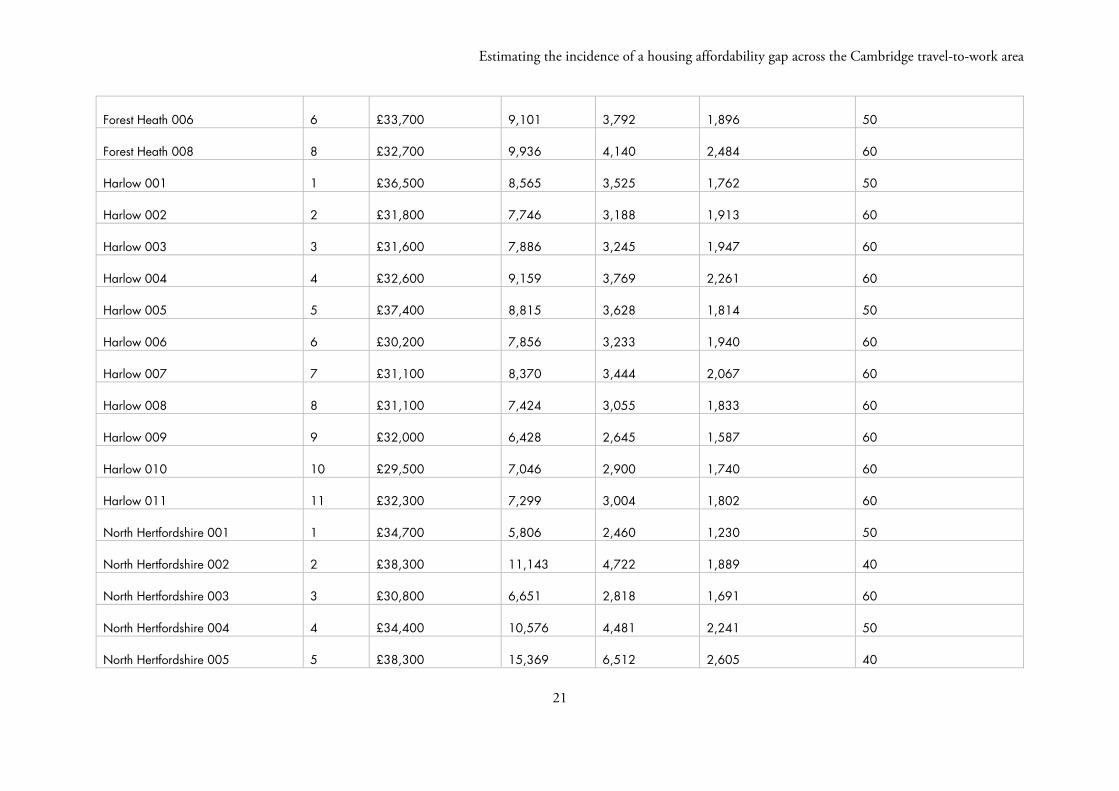
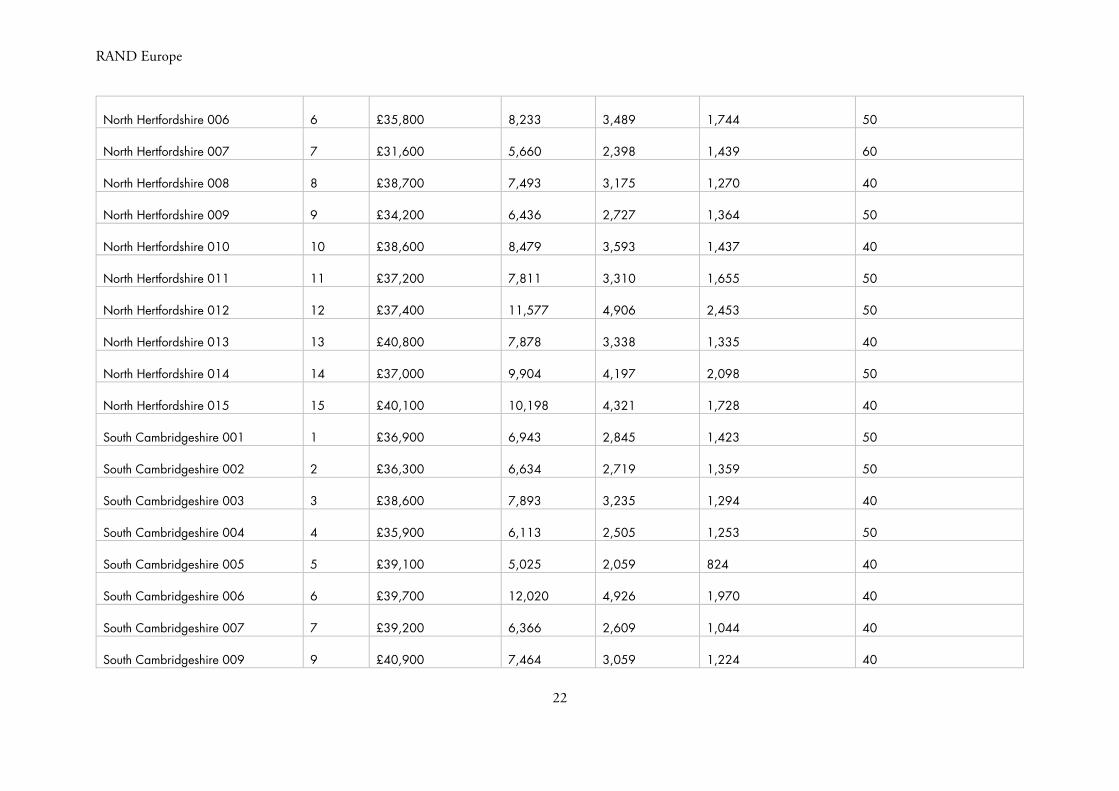
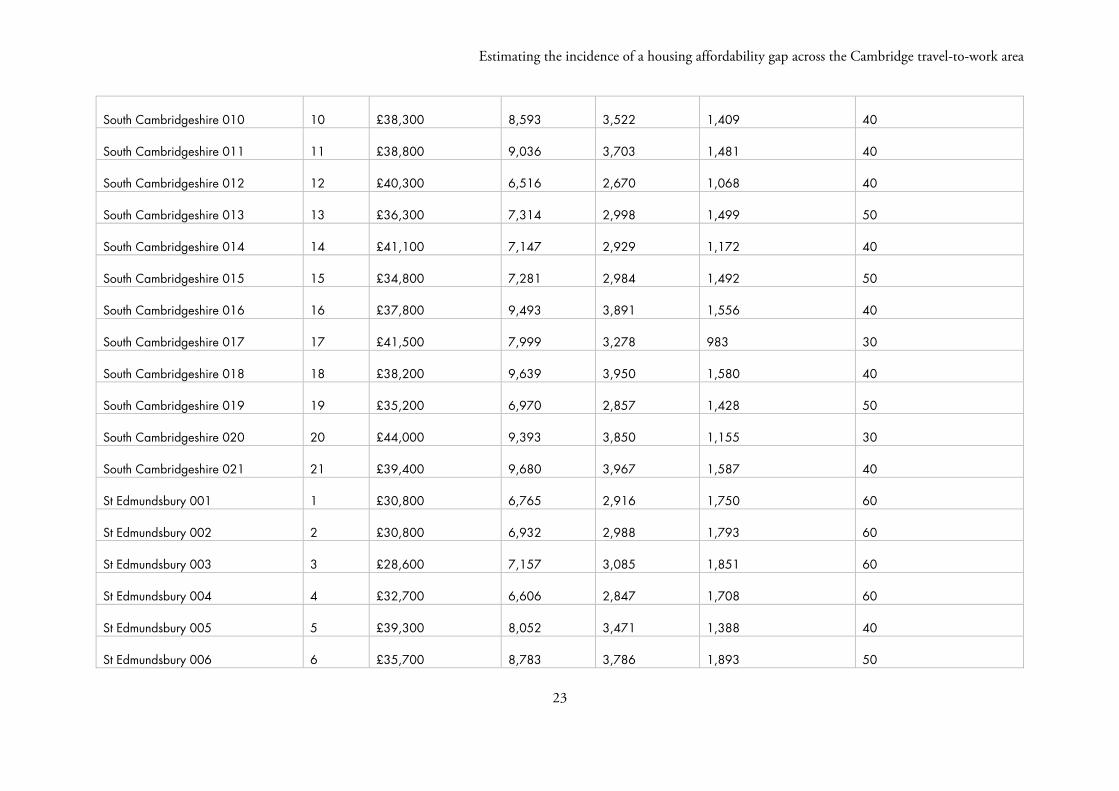
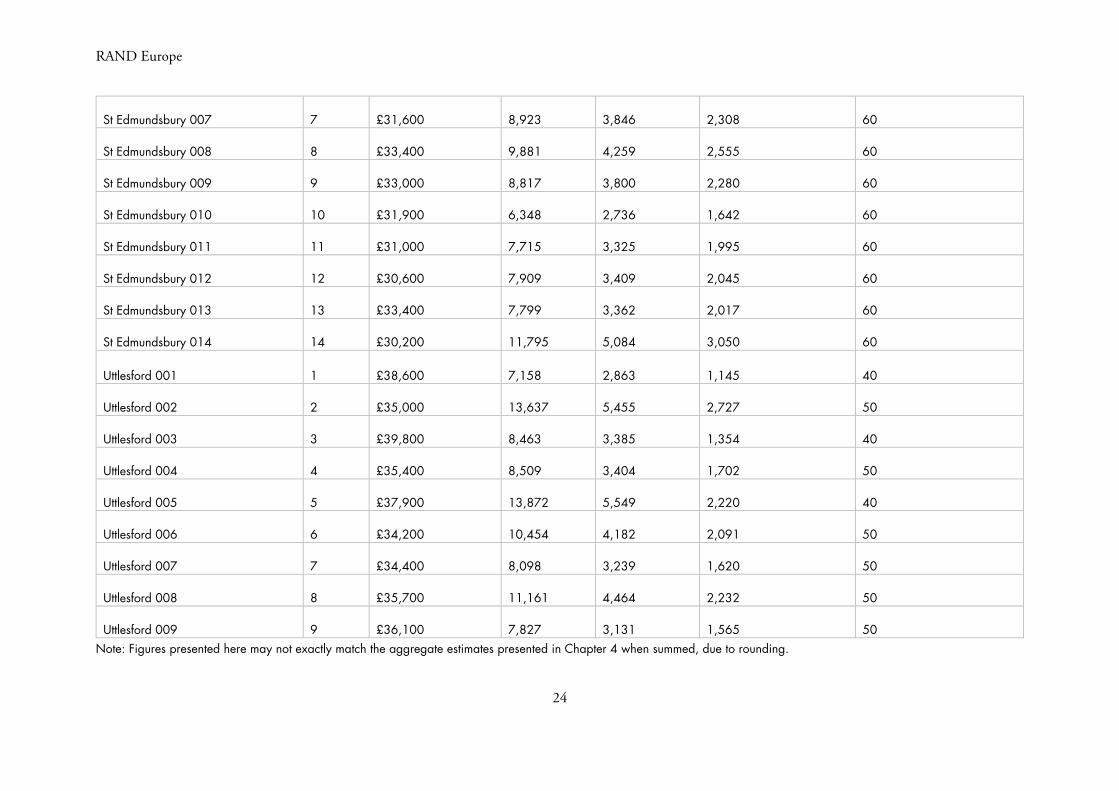
Annex A. Household estimates by MSOA
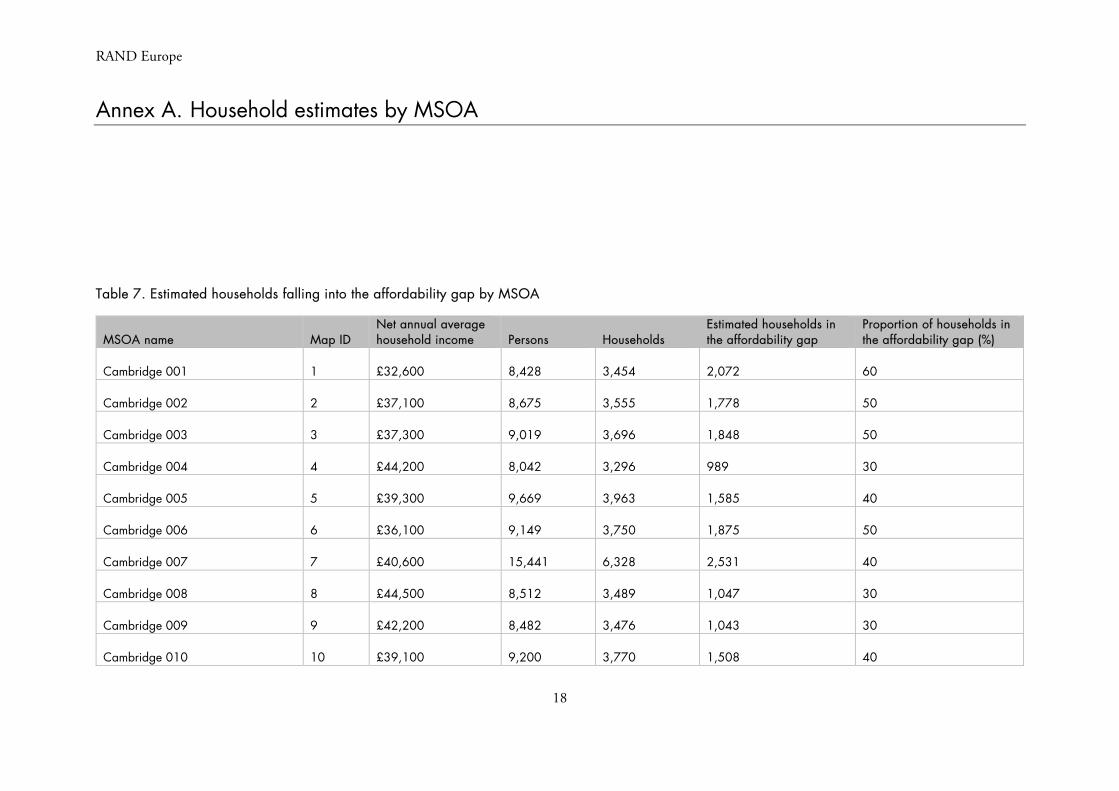
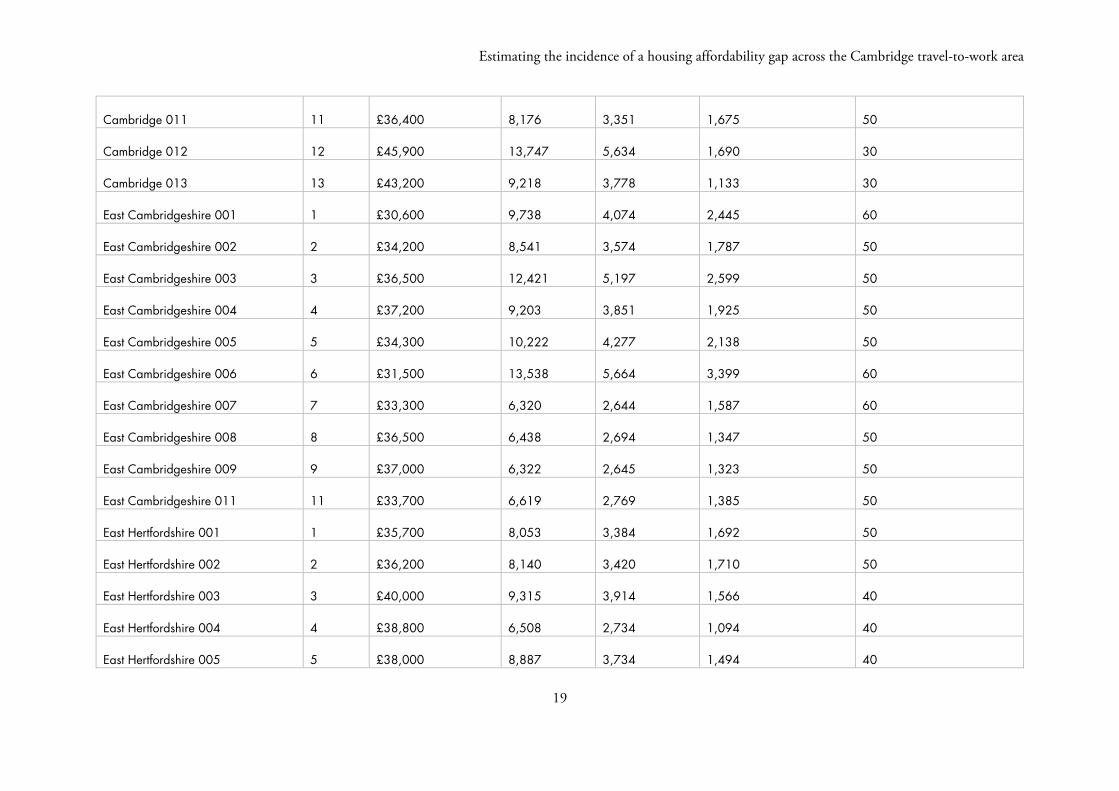
Table 7. Estimated households falling into the affordability gap by MSOA
MSOA name Map ID Net annual average household income Persons Households
Estimated households in the affordability gap
Proportion of households in the affordability gap (%)
Cambridge 001 1 £32,600 8,428 3,454
2,072 60
Cambridge 002 2 £37,100 8,675 3,555
1,778 50
Cambridge 003 3 £37,300 9,019 3,696
1,848 50
Cambridge 004 4 £44,200 8,042 3,296
989 30
Cambridge 005 5 £39,300 9,669 3,963
1,585 40
Cambridge 006 6 £36,100 9,149 3,750
1,875 50
Cambridge 007 7 £40,600 15,441 6,328
2,531 40
Cambridge 008 8 £44,500 8,512 3,489
1,047 30
Cambridge 009 9 £42,200 8,482 3,476
1,043 30
Cambridge 010 10 £39,100 9,200 3,770
1,508 40
Estimating the incidence of a housing affordability gap across the Cambridge travel-to-work area
19
Cambridge 011 11 £36,400 8,176 3,351
1,675 50
Cambridge 012 12 £45,900 13,747 5,634
1,690 30
Cambridge 013 13 £43,200 9,218 3,778
1,133 30
East Cambridgeshire 001 1 £30,600 9,738 4,074
2,445 60
East Cambridgeshire 002 2 £34,200 8,541 3,574
1,787 50
East Cambridgeshire 003 3 £36,500 12,421 5,197
2,599 50
East Cambridgeshire 004 4 £37,200 9,203 3,851
1,925 50
East Cambridgeshire 005 5 £34,300 10,222 4,277
2,138 50
East Cambridgeshire 006 6 £31,500 13,538 5,664
3,399 60
East Cambridgeshire 007 7 £33,300 6,320 2,644
1,587 60
East Cambridgeshire 008 8 £36,500 6,438 2,694
1,347 50
East Cambridgeshire 009 9 £37,000 6,322 2,645
1,323 50
East Cambridgeshire 011 11 £33,700 6,619 2,769
1,385 50
East Hertfordshire 001 1 £35,700 8,053 3,384
1,692 50
East Hertfordshire 002 2 £36,200 8,140 3,420
1,710 50
East Hertfordshire 003 3 £40,000 9,315 3,914
1,566 40
East Hertfordshire 004 4 £38,800 6,508 2,734
1,094 40
East Hertfordshire 005 5 £38,000 8,887 3,734
1,494 40
RAND Europe
20
East Hertfordshire 006 6 £37,400 6,113 2,568
1,284 50
East Hertfordshire 007 7 £37,300 10,817 4,545
2,272 50
East Hertfordshire 008 8 £38,700 8,637 3,629
1,452 40
East Hertfordshire 009 9 £35,400 6,338 2,663
1,332 50
East Hertfordshire 010 10 £37,000 7,632 3,207
1,603 50
East Hertfordshire 011 11 £36,500 9,117 3,831
1,915 50
East Hertfordshire 012 12 £35,700 11,468 4,818
2,409 50
East Hertfordshire 013 13 £39,900 8,502 3,572
1,429 40
East Hertfordshire 014 14 £40,800 8,049 3,382
1,353 40
East Hertfordshire 015 15 £34,000 5,595 2,351
1,175 50
East Hertfordshire 016 16 £38,000 5,935 2,494
997 40
East Hertfordshire 017 17 £41,900 9,516 3,998
1,199 30
East Hertfordshire 018 18 £34,400 9,483 3,984
1,992 50
Forest Heath 001 1 £28,100 9,935 4,140
2,898 70
Forest Heath 002 2 £28,400 7,681 3,200
1,920 60
Forest Heath 003 3 £28,800 9,917 4,132
2,479 60
Forest Heath 004 4 £28,600 9,133 3,805
2,283 60
Forest Heath 005 5 £34,200 9,696 4,040
2,020 50
Estimating the incidence of a housing affordability gap across the Cambridge travel-to-work area
21
Forest Heath 006 6 £33,700 9,101 3,792
1,896 50
Forest Heath 008 8 £32,700 9,936 4,140
2,484 60
Harlow 001 1 £36,500 8,565 3,525
1,762 50
Harlow 002 2 £31,800 7,746 3,188
1,913 60
Harlow 003 3 £31,600 7,886 3,245
1,947 60
Harlow 004 4 £32,600 9,159 3,769
2,261 60
Harlow 005 5 £37,400 8,815 3,628
1,814 50
Harlow 006 6 £30,200 7,856 3,233
1,940 60
Harlow 007 7 £31,100 8,370 3,444
2,067 60
Harlow 008 8 £31,100 7,424 3,055
1,833 60
Harlow 009 9 £32,000 6,428 2,645
1,587 60
Harlow 010 10 £29,500 7,046 2,900
1,740 60
Harlow 011 11 £32,300 7,299 3,004
1,802 60
North Hertfordshire 001 1 £34,700 5,806 2,460
1,230 50
North Hertfordshire 002 2 £38,300 11,143 4,722
1,889 40
North Hertfordshire 003 3 £30,800 6,651 2,818
1,691 60
North Hertfordshire 004 4 £34,400 10,576 4,481
2,241 50
North Hertfordshire 005 5 £38,300 15,369 6,512
2,605 40
RAND Europe
22
North Hertfordshire 006 6 £35,800 8,233 3,489
1,744 50
North Hertfordshire 007 7 £31,600 5,660 2,398
1,439 60
North Hertfordshire 008 8 £38,700 7,493 3,175
1,270 40
North Hertfordshire 009 9 £34,200 6,436 2,727
1,364 50
North Hertfordshire 010 10 £38,600 8,479 3,593
1,437 40
North Hertfordshire 011 11 £37,200 7,811 3,310
1,655 50
North Hertfordshire 012 12 £37,400 11,577 4,906
2,453 50
North Hertfordshire 013 13 £40,800 7,878 3,338
1,335 40
North Hertfordshire 014 14 £37,000 9,904 4,197
2,098 50
North Hertfordshire 015 15 £40,100 10,198 4,321
1,728 40
South Cambridgeshire 001 1 £36,900 6,943 2,845
1,423 50
South Cambridgeshire 002 2 £36,300 6,634 2,719
1,359 50
South Cambridgeshire 003 3 £38,600 7,893 3,235
1,294 40
South Cambridgeshire 004 4 £35,900 6,113 2,505
1,253 50
South Cambridgeshire 005 5 £39,100 5,025 2,059
824 40
South Cambridgeshire 006 6 £39,700 12,020 4,926
1,970 40
South Cambridgeshire 007 7 £39,200 6,366 2,609
1,044 40
South Cambridgeshire 009 9 £40,900 7,464 3,059
1,224 40
Estimating the incidence of a housing affordability gap across the Cambridge travel-to-work area
23
South Cambridgeshire 010 10 £38,300 8,593 3,522
1,409 40
South Cambridgeshire 011 11 £38,800 9,036 3,703
1,481 40
South Cambridgeshire 012 12 £40,300 6,516 2,670
1,068 40
South Cambridgeshire 013 13 £36,300 7,314 2,998
1,499 50
South Cambridgeshire 014 14 £41,100 7,147 2,929
1,172 40
South Cambridgeshire 015 15 £34,800 7,281 2,984
1,492 50
South Cambridgeshire 016 16 £37,800 9,493 3,891
1,556 40
South Cambridgeshire 017 17 £41,500 7,999 3,278
983 30
South Cambridgeshire 018 18 £38,200 9,639 3,950
1,580 40
South Cambridgeshire 019 19 £35,200 6,970 2,857
1,428 50
South Cambridgeshire 020 20 £44,000 9,393 3,850
1,155 30
South Cambridgeshire 021 21 £39,400 9,680 3,967
1,587 40
St Edmundsbury 001 1 £30,800 6,765 2,916
1,750 60
St Edmundsbury 002 2 £30,800 6,932 2,988
1,793 60
St Edmundsbury 003 3 £28,600 7,157 3,085
1,851 60
St Edmundsbury 004 4 £32,700 6,606 2,847
1,708 60
St Edmundsbury 005 5 £39,300 8,052 3,471
1,388 40
St Edmundsbury 006 6 £35,700 8,783 3,786
1,893 50
RAND Europe
24
St Edmundsbury 007 7 £31,600 8,923 3,846
2,308 60
St Edmundsbury 008 8 £33,400 9,881 4,259
2,555 60
St Edmundsbury 009 9 £33,000 8,817 3,800
2,280 60
St Edmundsbury 010 10 £31,900 6,348 2,736
1,642 60
St Edmundsbury 011 11 £31,000 7,715 3,325
1,995 60
St Edmundsbury 012 12 £30,600 7,909 3,409
2,045 60
St Edmundsbury 013 13 £33,400 7,799 3,362
2,017 60
St Edmundsbury 014 14 £30,200 11,795 5,084
3,050 60
Uttlesford 001 1 £38,600 7,158 2,863
1,145 40
Uttlesford 002 2 £35,000 13,637 5,455
2,727 50
Uttlesford 003 3 £39,800 8,463 3,385
1,354 40
Uttlesford 004 4 £35,400 8,509 3,404
1,702 50
Uttlesford 005 5 £37,900 13,872 5,549
2,220 40
Uttlesford 006 6 £34,200 10,454 4,182
2,091 50
Uttlesford 007 7 £34,400 8,098 3,239
1,620 50
Uttlesford 008 8 £35,700 11,161 4,464
2,232 50
Uttlesford 009 9 £36,100 7,827 3,131
1,565 50
Note: Figures presented here may not exactly match the aggregate estimates presented in Chapter 4 when summed, due to rounding.