Embed Size (px)
Citation preview
OECD Journal: Financial Market Trends
Volume 2016/1
© OECD 2016
1
Estimating the size and incidenceof bank resolution costs for selected
banks in OECD countries
byMarianna Blix Grimaldi, Jörg Hofmeister, Sebastian Schich and Daniel Snethlage*
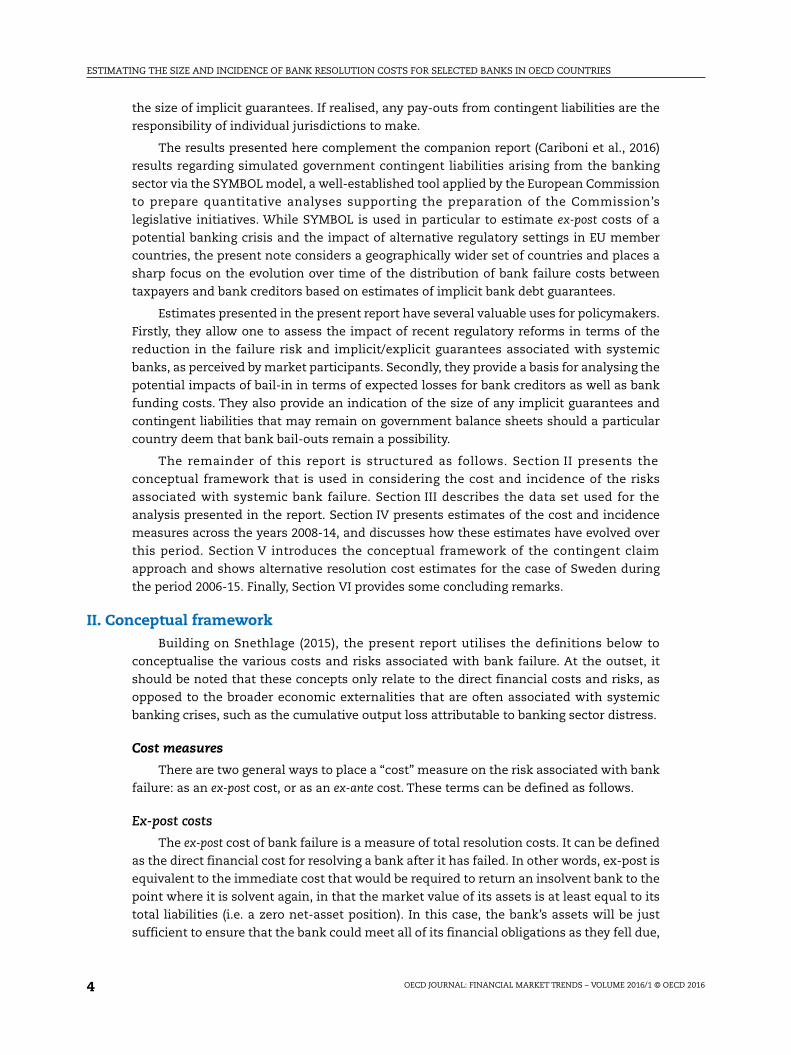
This report provides estimates of the costs associated with bank resolution both interms of the expected costs that might arise should a bank fail (i.e. as “ex-post”costs), as well as the cost associated with the likelihood that a solvent bank mightfail (i.e. as “ex-ante” costs) over the next year. It finds that expected resolution costs(ex-post costs) have dropped recently due to higher average capital ratios and alower level of bank liabilities as a percentage of GDP. The annualised value of theseexpected resolution costs (ex-ante costs), which increased sharply after 2008, hassince subsided, but remains well above its 2008 level. Overall, the estimatesproduced in this report support the notion that recent financial sector reforms havehad an impact on reducing the costs associated with bank failure, including theexpected costs to taxpayers. However, estimates are in most cases yet to return topre-crisis levels.
* Marianna Blix Grimaldi is Senior Analyst at the Swedish National Debt Office. At the time of writing,Jörg Hofmeister was Risk Analyst at the Swedish National Debt Office. Sebastian Schich is PrincipalEconomist in the OECD Directorate of Financial and Enterprise Affairs. Daniel Snethlage is at theNew Zealand Treasury. The authors are grateful for excellent data assistance from Oana Toader, PhDstudent at the Université d’Orléans. The present report was presented to the OECD's Committee onFinancial Markets in October 2015 and the current version reflects the discussion at that meetingand additional comments subsequently received in writing. The article is published on theresponsibility of the Secretary-General of the OECD; it was released in June 2016. The opinionsexpressed and arguments employed herein do not necessarily reflect the official views of theOrganisation or of the governments of its member countries. This document and any map includedherein are without prejudice to the status of or sovereignty over any territory, to the delimitation ofinternational frontiers and boundaries and to the name of any territory, city or area.

ESTIMATING THE SIZE AND INCIDENCE OF BANK RESOLUTION COSTS FOR SELECTED BANKS IN OECD COUNTRIES
OECD JOURNAL: FINANCIAL MARKET TRENDS – VOLUME 2016/1 © OECD 20162
Executive summary
Since the onset of the global financial crisis, the issue of bank resolution has received
continued attention from policymakers and market participants alike. This report provides
estimates of the costs associated with bank resolutions – both in terms of the expected
costs that might arise, should a bank fail, (i.e. as “ex-post” costs), as well as the annualised
cost associated with the likelihood that a solvent bank might fail (i.e. as “ex-ante” costs).
Besides assessing the magnitude of these costs, this report also provides estimates of the
share of resolution costs that would be borne by bank creditors and taxpayers. Taxpayers
are expected to be concerned only if implicit government guarantees are perceived to be
material.
There are many ways in which these cost estimates could be produced. The present
report uses two different estimation strategies. The first approach uses cross-sectional
information for some specific years and is based on the binomial options pricing model, as
applied by Snethlage (2015) to systemically important banks in New Zealand. The second
approach uses contingent claim analysis to draw inferences from financial market data
available at relatively high frequency, measuring the risk and costs associated with bank
failures over time. In this report, the contingent claim analysis has been applied by the
Swedish National Debt Office to produce estimates for large Swedish banks that are
presented as a case study. A third approach, based on the European Commission’s SYMBOL
model, is applied to European banks in the companion article “Reducing and sharing the
burden of bank failures” (Cariboni et al., 2016).
The results in the present report are based on a sample of 212 large and medium-sized
banks based in 25 OECD countries across the years 2008-14. The main findings are as
follows:
● Expected resolution costs (ex-post costs) for all banks in the sample have averaged at
just over 7% of GDP over the sample period. However, this measure dropped to 6% of GDP
as at 2014 due to higher average capital ratios and a lower level of bank liabilities as a
percentage of GDP.
● The annualised value of these expected resolution costs (ex-ante costs) increased
sharply after 2008, reaching a peak of 0.24% of GDP in 2012. While this measure has since
subsided, it remains well above its 2008 level.
● Estimated implicit guarantees rose significantly between 2008 and 2009, reflecting
increases in the risk of bank failure and the likelihood of government support. Total
implicit guarantees are estimated at 0.15% of sample countries’ GDP as at 2014, below
the estimated peak of 0.18% of GDP in 2012.
● Taxpayers, as opposed to bank creditor, estimated exposures to bank resolution costs
(implicit contingent liabilities) have declined steadily since 2009 to around 4% of GDP, but

ESTIMATING THE SIZE AND INCIDENCE OF BANK RESOLUTION COSTS FOR SELECTED BANKS IN OECD COUNTRIES
OECD JOURNAL: FINANCIAL MARKET TRENDS – VOLUME 2016/1 © OECD 2016 3
continue to represent over half of the total exposure to estimated resolution costs for
banks in the sample.
Overall, the estimates produced in this report support the notion that recent financial
sector reforms have had an impact on reducing the costs associated with bank failure,
including the expected costs to taxpayers. However, estimates are in most cases yet to
return to pre-crisis levels. We would expect these indicators to continue to improve as
reforms bed in and crisis-affected economies continue to recover, though continued
monitoring of these measures would help verify whether this will be the case.
I. IntroductionEvents over recent years have illustrated that systemic banking failures can entail
substantial fiscal costs and that the expectation of government support creates
distortionary implicit guarantees for systemically important banks.
In response, the regulatory reform agenda has focussed on reducing taxpayers’
exposure to the costs of banking failures, and on reducing implicit guarantees of bank debt.
The policy rationale for transferring bank failure risk to creditors is well established.
Among other things, the use of bail-outs as opposed to bail-ins, reinforce expectations that
implicit guarantees exist, which in the case of bank debt can have severe adverse real
economic costs (see e.g. Denk et al, 2015). Providing a viable alternative to bail-outs also
help to reduce implicit contingent liabilities on sovereign balance sheets.
It is important to realise though, that the reduction or elimination of implicit
guarantees does not eliminate the direct costs associated with bank failure (see also
especially the companion report “Reducing and sharing the burden of bank failures”,
Cariboni et al., 2016). Regardless of how banks are resolved, bank failures will entail a cost
that must be borne by somebody. Bail-in tools developed in recent years aim at ensuring
that creditors – not taxpayers – are liable for the cost of resolving failed banks. They
transfer risk, but do not eliminate it.
The present report is motivated by an interest in understanding both the magnitude
and the incidence of the various costs and risks associated with bank failure and in
monitoring how they evolve over time as regulatory reforms are designed and gradually
implemented. The report presents estimates of these quantities from two different
estimation strategies. The first approach uses cross-sectional information for some
specific years and is based on the binomial options pricing model, as applied by Snethlage
(2015) to systemically important banks in New Zealand. The second approach uses
contingent claim analysis to draw inferences from financial market data available at
relatively high frequency, measuring the risk and costs associated with bank failures over
time. In particular, the contingent claim analysis is applied to Sweden as a case study. The
advantage of using two different strategies to track estimates of the magnitude of bank
failure resolution costs over time is that the results obtained will be less dependent on the
strengths and weaknesses of any particular model.
When looking at the expected incidence of bank failure resolution costs between
taxpayers and bank creditors, the report bases its estimates on publically available
information contained in bank credit ratings. However, it is acknowledged that the
likelihood of taxpayer support for a given bank in a given jurisdiction is highly uncertain
and subjective, and that communication of estimates is challenging.1 Accordingly, the
estimates discussed here should not be seen as official estimates and judgements around
ESTIMATING THE SIZE AND INCIDENCE OF BANK RESOLUTION COSTS FOR SELECTED BANKS IN OECD COUNTRIES
OECD JOURNAL: FINANCIAL MARKET TRENDS – VOLUME 2016/1 © OECD 20164
the size of implicit guarantees. If realised, any pay-outs from contingent liabilities are the
responsibility of individual jurisdictions to make.
The results presented here complement the companion report (Cariboni et al., 2016)
results regarding simulated government contingent liabilities arising from the banking
sector via the SYMBOL model, a well-established tool applied by the European Commission
to prepare quantitative analyses supporting the preparation of the Commission’s
legislative initiatives. While SYMBOL is used in particular to estimate ex-post costs of a
potential banking crisis and the impact of alternative regulatory settings in EU member
countries, the present note considers a geographically wider set of countries and places a
sharp focus on the evolution over time of the distribution of bank failure costs between
taxpayers and bank creditors based on estimates of implicit bank debt guarantees.
Estimates presented in the present report have several valuable uses for policymakers.
Firstly, they allow one to assess the impact of recent regulatory reforms in terms of the
reduction in the failure risk and implicit/explicit guarantees associated with systemic
banks, as perceived by market participants. Secondly, they provide a basis for analysing the
potential impacts of bail-in in terms of expected losses for bank creditors as well as bank
funding costs. They also provide an indication of the size of any implicit guarantees and
contingent liabilities that may remain on government balance sheets should a particular
country deem that bank bail-outs remain a possibility.
The remainder of this report is structured as follows. Section II presents the
conceptual framework that is used in considering the cost and incidence of the risks
associated with systemic bank failure. Section III describes the data set used for the
analysis presented in the report. Section IV presents estimates of the cost and incidence
measures across the years 2008-14, and discusses how these estimates have evolved over
this period. Section V introduces the conceptual framework of the contingent claim
approach and shows alternative resolution cost estimates for the case of Sweden during
the period 2006-15. Finally, Section VI provides some concluding remarks.
II. Conceptual frameworkBuilding on Snethlage (2015), the present report utilises the definitions below to
conceptualise the various costs and risks associated with bank failure. At the outset, it
should be noted that these concepts only relate to the direct financial costs and risks, as
opposed to the broader economic externalities that are often associated with systemic
banking crises, such as the cumulative output loss attributable to banking sector distress.
Cost measures
There are two general ways to place a “cost” measure on the risk associated with bank
failure: as an ex-post cost, or as an ex-ante cost. These terms can be defined as follows.
Ex-post costs
The ex-post cost of bank failure is a measure of total resolution costs. It can be defined
as the direct financial cost for resolving a bank after it has failed. In other words, ex-post is
equivalent to the immediate cost that would be required to return an insolvent bank to the
point where it is solvent again, in that the market value of its assets is at least equal to its
total liabilities (i.e. a zero net-asset position). In this case, the bank’s assets will be just
sufficient to ensure that the bank could meet all of its financial obligations as they fell due,

ESTIMATING THE SIZE AND INCIDENCE OF BANK RESOLUTION COSTS FOR SELECTED BANKS IN OECD COUNTRIES
OECD JOURNAL: FINANCIAL MARKET TRENDS – VOLUME 2016/1 © OECD 2016 5
provided it could access the necessary liquidity in the interim. It is useful to distinguish
between bail-in and bail-out.
If a failed bank is resolved through a bail-in of bank creditors, the ex-post cost is
equivalent to the total value of debt that is written down or written off, less the fair value
of any equity that is received in exchange for bailed-in debt. The ex-post cost may also
include pay-outs made by deposit guarantee schemes, resolution funds, or national
treasuries that involve losses being borne on behalf of creditors.
If a bank is resolved through a bail-out, the ex-post cost is equivalent to the total
amount of equity capital provided less the fair value of this equity at the point of bail-out.
In reality, this fair value will be very difficult to assess, even if equity is subsequently sold
off.2 However, this definition of cost presents a theoretical value of the cost to taxpayer of
bailing out a failed bank.
For the large part, the ex-post cost of bank failure is the same regardless of whether a
bank is resolved through bail-out or bail-in. However, this assumes that choice of
resolution tool does not affect the size of the total losses faced by the bank. Both bail-out
and bail-in may, in certain circumstances, have different effects on financial markets,
other financial institutions, and broader economic activity. This, in turn, may affect the
extent of losses faced by the failed bank and therefore the ex-post cost of its failure.
Ex-ante costs
Bank failures do not occur often but with some regularity throughout modern banking.
As such, the ex-post measure defined above is a relatively poor measure of the amount of
risk that exists outside of banking crises. However, even if a bank does not fail in a given
period, this does not mean that there was no risk ex-ante that a bank might have failed in
that period. This financial risk – like any financial risk – has an associated financial cost to
whoever bears the risk. So even if failure does not end up occurring in a given period, there
was risk – and therefore a cost – that was borne by somebody (either explicitly or
implicitly).
The ex-ante cost of bank failure refers to the amount of financial risk associated with
the fact that a bank might fail in a given 12-month period. In other words, it represents the
value of a bank’s expected ex-post cost defined above that is adjusted for the risk-adjusted
probability of bank failure occurring in that 12-month period.
In theory, the financial risk associated with bank failure is borne by a bank’s unsecured
creditors, who bear the ex-ante cost of that bank’s failure. To be willing to bear this risk,
creditors are in turn compensated through a yield or interest rate on their investment in
the bank that is higher than what they would expect to receive on an equivalent risk-free
investment. As such, the ex-ante cost is effectively transferred back to the bank through a
higher funding cost that reflects the risk that the bank may fail in a given period. Even
then, banks may pass much of this cost onto borrowers through marginally higher interest
rates on lending.
The situation where the ex-ante cost of bank failure is borne by banks and their
borrowers can be seen as desirable, as it acts to mitigate moral hazard. This is because
those who create (deliberately or inadvertently) risk in the banking sector also face the cost
of the risk that they create. It is well established that the avoidance of moral hazard helps
promote the soundness and efficiency of the banking system.

ESTIMATING THE SIZE AND INCIDENCE OF BANK RESOLUTION COSTS FOR SELECTED BANKS IN OECD COUNTRIES
OECD JOURNAL: FINANCIAL MARKET TRENDS – VOLUME 2016/1 © OECD 20166
Incidence measures
The cost measures defined above do not attempt to reflect the incidence of the risk of
bank failure across taxpayers and bank creditors. We define “implicit contingent liability”
and, “implicit guarantee” to represent taxpayers’ share of the ex-post and ex-ante costs,
respectively.
Implicit contingent liability
The implicit contingent liability associated with the failure of a given systemic bank
refers to the implicit risk to sovereign balance sheet that crystallises in the event that
governments choose to provide extraordinary public support to a failed or failing bank.3
Payments made by industry-funded resolution funds or deposit insurance schemes are not
considered to be part of this implicit contingent liability given that they represent explicit
exposures, and that costs are, in the first instance, borne by industry, over time.4
The expected size of this contingent liability can be thought of as the expected fiscal
cost of a systemic bank failure, should a bank fail. In other words, this cost represents the
portion of ex-post cost that governments would expect to bear, on average, in the event of a
bank’s failure. As such, the size of the fiscal contingent liability is some percentage
(between 0% and 100%) of the total ex-post cost of bank failure.
Implicit guarantee
Historically, systemic banks have often benefited from implicit government guarantees.
When there is an implicit guarantee for a systemically important bank, sovereign balance
sheets are seen as effectively bearing the financial risk of that bank’s failure on behalf of that
bank’s creditors. As such, the implicit guarantee can be thought of as some percentage
(between 0% and 100%) of the ex-ante costs of bank failure that is borne (implicitly) by
taxpayers instead of investors. Alternatively, the implicit guarantee can be thought of as the
ex-ante value of the fiscal contingent liability defined above. In either case, the implicit
guarantee measures taxpayers’ implicit share of the financial risk of bank failure.
Because implicit guarantees reduce creditors’ exposure to risk, they reduce the
compensation that creditors require on their investments, resulting in an implicit taxpayer
subsidy for systemic banks. This bank’s funding cost does not fully reflect the level of risk
banks take and may encourage greater risk taking that would be the case without implicit
guarantees. It may also provide a competitive advantage for those banks deemed to be
implicitly guaranteed, as earlier work by the OECD Committee on Financial Markets (CMF)
concluded.
It is now well-established that implicit guarantees can result in an implicit subsidy for
banks on their cost of funding. The distinction between the two measures is that the
implicit guarantee reflects the implicit cost to taxpayers, whereas the implicit subsidy
reflects the benefit this implicit guarantee brings to banks. So while the size of this implicit
subsidy and the size of the underlying implicit guarantee are closely related, they need not
be the same. For example, if an implicit guarantee results in credit rating uplifts, this may
offer banks additional funding cost benefits than what can directly be attributable to the
credit risk borne implicitly by taxpayers.
ESTIMATING THE SIZE AND INCIDENCE OF BANK RESOLUTION COSTS FOR SELECTED BANKS IN OECD COUNTRIES
OECD JOURNAL: FINANCIAL MARKET TRENDS – VOLUME 2016/1 © OECD 2016 7
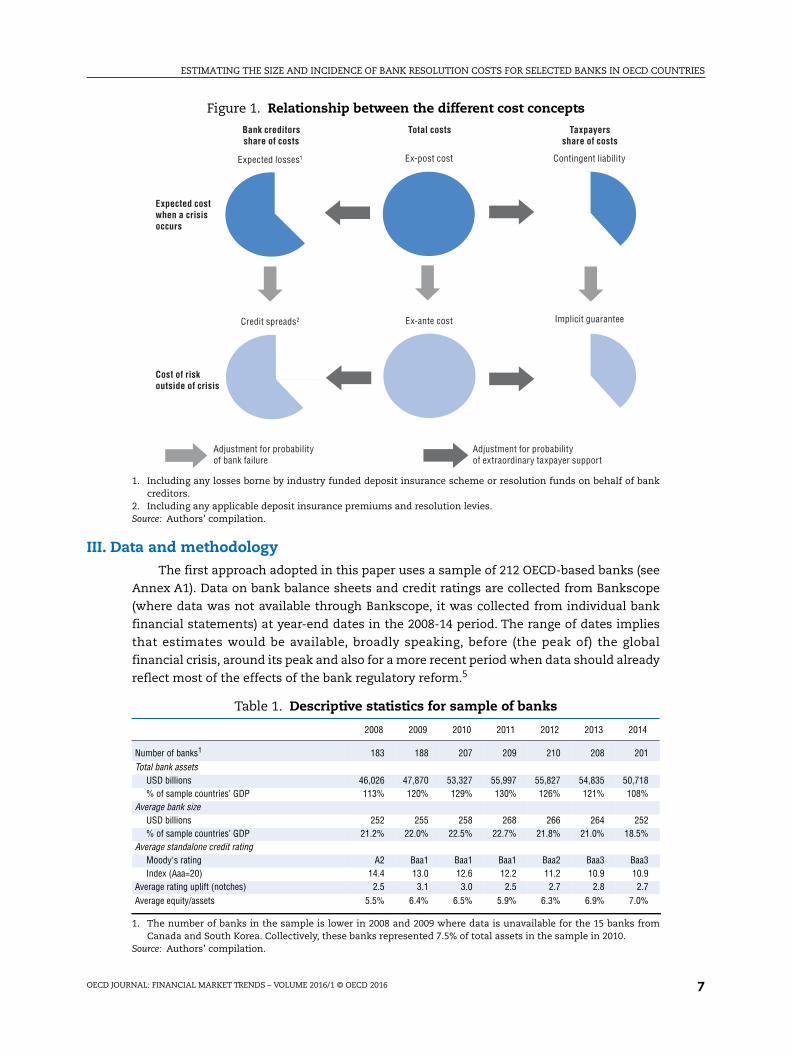
III. Data and methodologyThe first approach adopted in this paper uses a sample of 212 OECD-based banks (see
Annex A1). Data on bank balance sheets and credit ratings are collected from Bankscope
(where data was not available through Bankscope, it was collected from individual bank
financial statements) at year-end dates in the 2008-14 period. The range of dates implies
that estimates would be available, broadly speaking, before (the peak of) the global
financial crisis, around its peak and also for a more recent period when data should already
reflect most of the effects of the bank regulatory reform.5
Figure 1. Relationship between the different cost concepts
1. Including any losses borne by industry funded deposit insurance scheme or resolution funds on behalf of bankcreditors.
2. Including any applicable deposit insurance premiums and resolution levies.Source: Authors’ compilation.
Ex-post cost
Ex-ante cost Implicit guarantee
Contingent liabilityExpected losses1
Credit spreads2
Adjustment for probabilityof extraordinary taxpayer support
Adjustment for probabilityof bank failure
Expected costwhen a crisisoccurs
Cost of riskoutside of crisis
Bank creditorsshare of costs
Total costs Taxpayersshare of costs
Table 1. Descriptive statistics for sample of banks
2008 2009 2010 2011 2012 2013 2014
Number of banks1 183 188 207 209 210 208 201Total bank assets
USD billions 46,026 47,870 53,327 55,997 55,827 54,835 50,718% of sample countries’ GDP 113% 120% 129% 130% 126% 121% 108%
Average bank sizeUSD billions 252 255 258 268 266 264 252% of sample countries’ GDP 21.2% 22.0% 22.5% 22.7% 21.8% 21.0% 18.5%
Average standalone credit ratingMoody's rating A2 Baa1 Baa1 Baa1 Baa2 Baa3 Baa3Index (Aaa=20) 14.4 13.0 12.6 12.2 11.2 10.9 10.9
Average rating uplift (notches) 2.5 3.1 3.0 2.5 2.7 2.8 2.7Average equity/assets 5.5% 6.4% 6.5% 5.9% 6.3% 6.9% 7.0%
1. The number of banks in the sample is lower in 2008 and 2009 where data is unavailable for the 15 banks fromCanada and South Korea. Collectively, these banks represented 7.5% of total assets in the sample in 2010.
Source: Authors’ compilation.
ESTIMATING THE SIZE AND INCIDENCE OF BANK RESOLUTION COSTS FOR SELECTED BANKS IN OECD COUNTRIES
OECD JOURNAL: FINANCIAL MARKET TRENDS – VOLUME 2016/1 © OECD 20168
The estimates are generated using an adaptation of the binomial options pricing
model of Cox, Ross, and Rubenstein (1979), where the risk of bank failure is seen as
analogous to that under a financial option on a bank’s assets that pays off if the bank
becomes insolvent. Following Snethlage (2015), this enables the various cost concepts to be
estimated as follows:6
E(ex-post cost) = E(loss-given-default) × total liabilities (1)
Ex-ante cost = E(ex-post cost) × risk-neutral probability of failure (2)
Implicit contingent liability = E(ex-post cost) × probability of bail-out (3)
Implicit guarantee = ex-ante cost × probability of bail-out (4)
Cost estimates are firstly calculated on a per-bank basis, and then aggregated across banks
for a given country. Country-level estimates expressed as a percentage of domestic GDP are
summarised in Annex A3.7 These estimates are then averaged across countries both on a
GDP-weighted and an evenly-weighted basis for reference.
IV. Cost estimates
Expected ex-post costs
The expected ex-post costs for the banks in the sample are estimated by multiplying
each bank’s total liabilities by an estimate of the loss-given-default (LGD) that bank is
expected to face in resolution. The expected loss rate for a given bank is not directly
observable, so it is necessary to develop an approach to estimate a banks’ LGD based on
bank characteristics. The first approach used in this report is summarised in Box 1 and
discussed in details in Annex A2. The contingent claim approach is addressed in Section V
with a technical summary in Annex A4.
Estimates of expected ex-post costs according to the first approach are presented in
Figure 3 below. These costs have stayed relatively constant across the sample period, given
that expected loss rates given failure, and bank liabilities as a percentage of GDP have
stayed relatively steady over the sample period. However, general increases in bank capital
ratios and reductions in the size of major banks across European countries in particular
have contributed to a noticeable decline in those expected resolution costs in recent years.
Ex-ante costs
To measure the level of risk associated with the likelihood of banks failing in a given
period, we estimate ex-ante costs by multiplying expected ex-post cost for a given bank by
that bank’s risk-neutral probability of failure (RNPF).8 Using RNPFs accounts firstly for the
likelihood of that bank failing. It also accounts for risk aversion, reflecting the tendency for
bank failures to coincide with downturns in markets and broader economic activity.
Because the risk of bank failure entails a degree of systematic risk (i.e. non-diversifiable
risk), the risk of bank failure “costs” more to society than expected losses alone. It is
therefore important to adjust for this systematic risk when estimating the ex-ante costs
associated with bank failure. For this reason, this paper uses RNPFs to account for this
systematic/non-diversifiable risk. The methodology used to estimate these RNPFs across
credit ratings, and across the sample period, is summarised in Box 2. In the contingent
claim approach, RNPFs are derived endogenously and therefore does not need to be
estimated outside the model. We will return to this later in the report.
ESTIMATING THE SIZE AND INCIDENCE OF BANK RESOLUTION COSTS FOR SELECTED BANKS IN OECD COUNTRIES
OECD JOURNAL: FINANCIAL MARKET TRENDS – VOLUME 2016/1 © OECD 2016 9
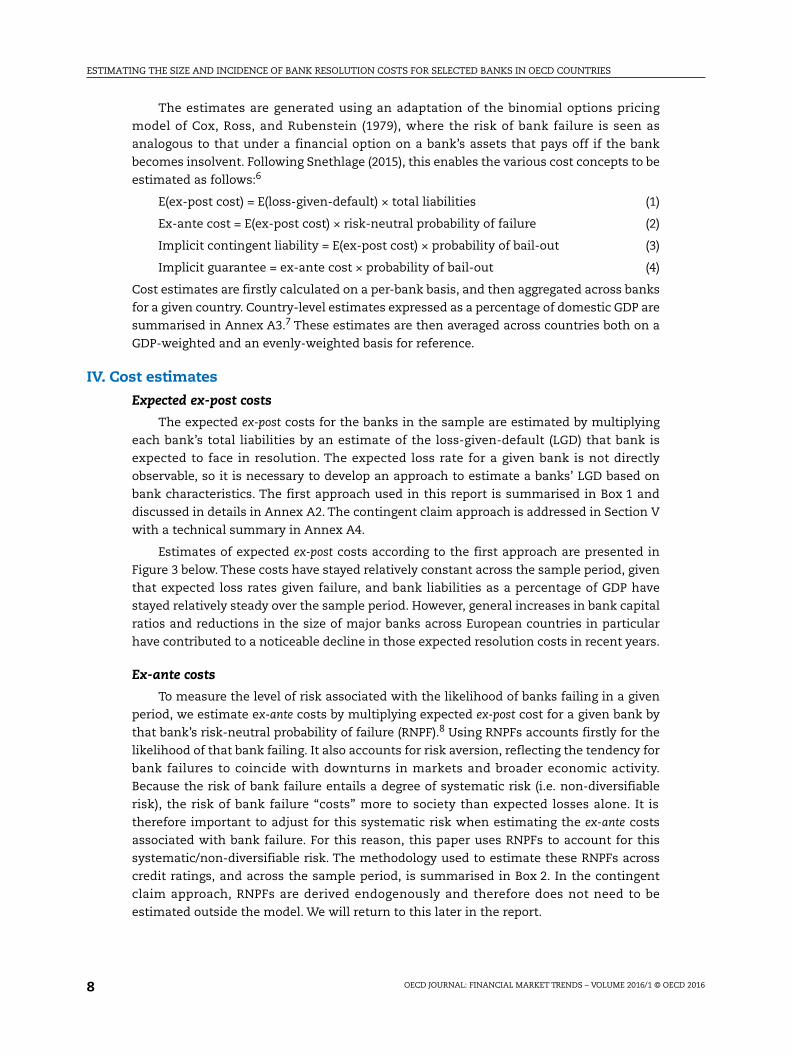
Box 1. Estimating bank-specific expected loss rates1
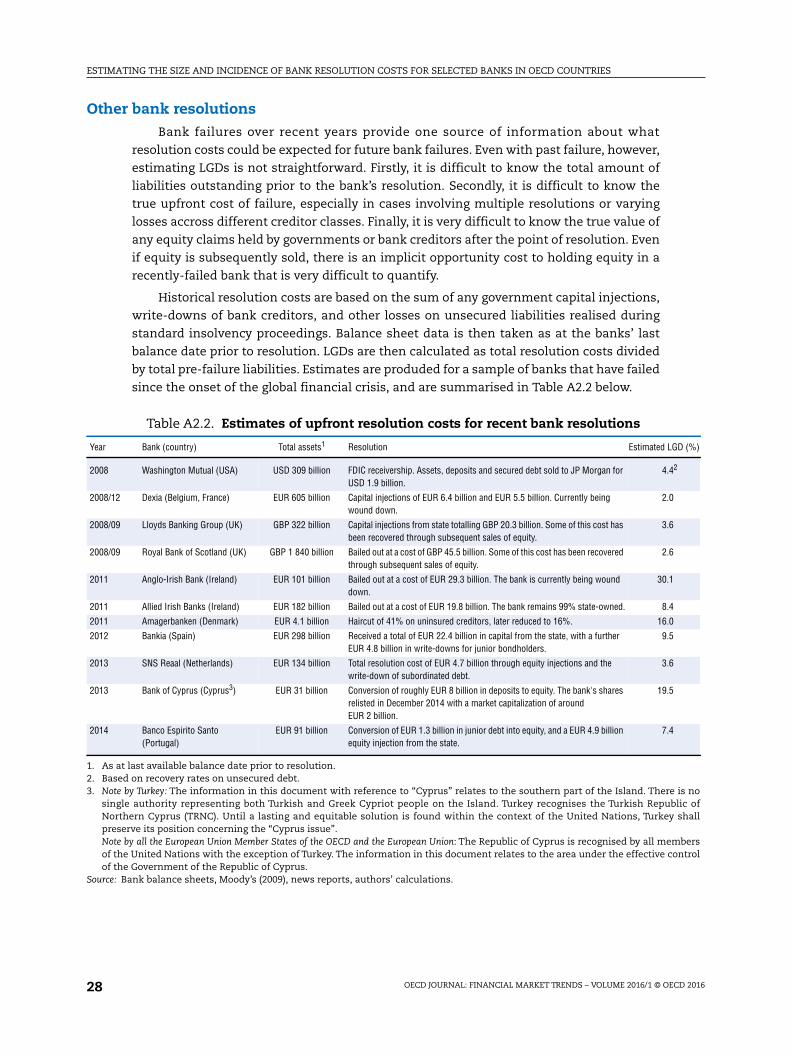
To provide a systematic basis for estimating LGDs for OECD-headquartered banks, thispaper draws on both historical loss rates for failed banks (a backward-looking view), andcredit spreads based on bank bond prices (a forward-looking view). A more in-depthdiscussion of this information is presented in Annex A2. For the purpose of this paper,bank-specific LGDs are estimated using the following specification:
In basic terms this specification means that, the larger the bank is, and the higher thebank’s capital ratio, the lower the loss rate for a given bank is expected to be as apercentage of total assets. Larger banks are generally expected to face lower loss ratesgiven greater diversification geographically and across exposures and business lines.Banks that are better capitalised are also expected to face lower loss rates given that, forany given shock, there is more capital available to absorb losses (though the impact of debtis largely reflected in the probability of failure as opposed to the cost of failure if failureoccurs). Unfortunately, we were not able to identify a specification that could account forstructural differences in the riskiness of bank assets across banks and across countries.
Figure 2. Estimates of LGDs from recent bank resolutions
Source: Authors’ calculations.
As illustrated in Figure 2, the specification above appears to provide a reasonable fit for theloss rates experienced in recent notable bank failures. However, the cases of Anglo-IrishBank and Bank of Cyprus2 highlight that even if expected LGDs are relatively low, the actuallosses experienced can be much higher in particularly severe failure scenarios.
1. The negative relationship between size and LGDs implies that mergers between banks would ceteris paribusreduce the estimated ex-post costs. However, this does not account for impact that higher banking sectorconcentration could have on the indirect costs of bank failure to the broader economy and financial systemas well as the effect on risk-taking by larger banks that tend to benefit from more substantial implicitguarantees. Greater risk-taking might not only affect the probability of default but also the LGD. Despitethese shortcomings of the approach adopted here, we believe that it provides a somewhat more realisticdescription of LGD in practise than the standard approach of just assuming a fixed rate of LGD.
2. Note by Turkey: The information in this document with reference to “Cyprus” relates to the southern part of theIsland. There is no single authority representing both Turkish and Greek Cypriot people on the Island. Turkeyrecognises the Turkish Republic of Northern Cyprus (TRNC). Until a lasting and equitable solution is foundwithin the context of the United Nations, Turkey shall preserve its position concerning the “Cyprus issue”.Note by all the European Union Member States of the OECD and the European Union: The Republic of Cyprus isrecognised by all members of the United Nations with the exception of Turkey. The information in thisdocument relates to the area under the effective control of the Government of the Republic of Cyprus.
35
0
%
5
10
15
20
25
30
“Actual” LGD Modelled LGD
RBS
Anglo-Irish
Bank of Cyprus
Amagerbanken
WaMuLloyds
SNS
Banco Esperito Santo
Bank size (log USD)
Allied Irish BanksBankia
Dexia

ESTIMATING THE SIZE AND INCIDENCE OF BANK RESOLUTION COSTS FOR SELECTED BANKS IN OECD COUNTRIES
OECD JOURNAL: FINANCIAL MARKET TRENDS – VOLUME 2016/1 © OECD 201610
Estimates of the ex-ante cost of bank failure derived from the first approach are
summarised in Figure 4 below. The estimated cost of bank failure risk exhibited a
significant increase between 2008 and 2009, largely due to an increase in the probability of
failure across this period. The increase between 2010 and 2013 was driven largely by
further increases in bank failure risk in the European Union, in particular among countries
such as Greece, Portugal, and Italy. The reduction in measured risk between 2013 and 2014
is largely attributable to a reduction in expected resolution costs, though a reduction in the
probability of failure reflected in improving bank credit ratings was also a factor.
Figure 3. Estimates for aggregate expected ex-postAs a percentage of GDP, averaged across OECD countries
Source: Authors’ calculations.
Figure 4. Estimates for aggregate ex-ante costs of bank failureAs a percentage of GDP, averaged across OECD countries
Source: Authors’ calculations.
14
12
10
8
6
4
2
0
%
2008 2009 2010 2011 2012 2013 2014
Evenly weighted GDP weighted
0.6
0
%
2008 2009 2010 2011 2012 2013 2014
0.1
0.2
0.3
0.4
0.5
Evenly weighted GDP weighted

ESTIMATING THE SIZE AND INCIDENCE OF BANK RESOLUTION COSTS FOR SELECTED BANKS IN OECD COUNTRIES
OECD JOURNAL: FINANCIAL MARKET TRENDS – VOLUME 2016/1 © OECD 2016 11
Implicit guarantees
Implicit guarantees can be thought as the share of the ex-ante costs of bank failure that
governments bear on behalf of banks and their creditors. Translating ex-ante cost estimates
into implicit guarantee estimates therefore requires an adjustment for the expected
Box 2. Estimating bank-specific risk-neutral default probabilities
To estimate a bank’s risk-neutral probability of failure (RNPF) in a given period, we maptheir standalone credit rating against the estimates of risk-neutral default probabilities inHull, Predescu, and White (2005). These estimates were produced based on the basicintuition that the spread between the yield of a corporate bond and a risk-free securitywith similar maturity and liquidity represents the market’s assessment of the credit riskassociated with that bond. This credit risk can be broken down into two components: thebond’s probability of default, and the bond’s expected loss-given-default. Because ofinvestors’ aversion to systematic risk, the probability of default built into bond prices isanalogous to the RNPF defined above. Standalone credit ratings are used given that we areinterested in the implied probability of failure, which may be higher than the impliedprobability of default in the case of expectations of extraordinary government support.
The RNPFs used in this paper are presented in Figure 5 below. Note that this analysisassumes a fixed relationship between credit ratings and RNPFs. Using a time-varyingrelationship would see estimated RNPFs fluctuate over time with market sentiment, butmay not provide as accurate an estimate of the level of long-term risk.
Figure 5. Estimates of RNPFs across credit ratings
Source: Hull, Predescu, and White (2005).
These probabilities are based on data between 1970 and 2003. To test their applicability,we estimate RNPFs over the period July 2010 to June 2015 using Bloomberg compositeindices for liquid US dollar corporate bonds across AAA, AA, A, BBB, BB, and B creditratings. On a monthly basis, we take the spread between five-year index rate and the five-year US dollar swap rate. We then divide this spread by the 60% rule-of-thumb LGD forcorporate bonds to estimate a monthly RNPF for each credit rating. Averaging thesemonthly across the sample yields very similar RNPF estimates to those produced by Hullet al. We therefore consider the Hull et al. probabilities to be suitable for the purposes ofthe present analysis.
25
0
%
5
10
15
20
AAA AA A+ A- BBB BB+ BB- B CCC+ CCC- C

ESTIMATING THE SIZE AND INCIDENCE OF BANK RESOLUTION COSTS FOR SELECTED BANKS IN OECD COUNTRIES
OECD JOURNAL: FINANCIAL MARKET TRENDS – VOLUME 2016/1 © OECD 201612
probability of extraordinary taxpayer support to prevent unsecured creditors bearing losses
in the event of a bank’s failure (i.e. the probability of bail-out).
The probability of a given bank being bailed out cannot be directly observed. In reality
it is highly uncertain what actions future governments will take in a crisis. The present
paper does not attempt to make a subjective judgement around the likelihood of bailout for
given banks in given jurisdictions. Instead, we follow Snethlage (2015) in backing out an
implied probability of bail-out from the credit rating uplifts banks receive for the likelihood
of government support in the event of their failure. This methodology is summarised in
Box 3.
Box 3. Estimating bank-specific probability of bail-out
The likelihood of taxpayer support for banks is extremely subjective and highlyuncertain. However, it is now well-established that bank credit ratings can provide usefulinformation about the level of (perceived) implicit government support for banks (see, forexample, Haldane, 2010; Schich and Lindh, 2012). This situation reflects the observationthat credit rating agencies factor in the likelihood of government support into corporatecredit ratings, and provide ratings uplifts to those banks for which government support isconsidered likely.
Bank credit rating uplifts are calculated for each bank in the sample as the number ofnotches between a bank’s standalone credit profile and a bank’s long-term issuer rating(where this is not available, we use senior unsecured debt ratings. If this is not available,we use long-term foreign currency deposit ratings). If data is unavailable, or if standaloneratings are higher than long-term issuer ratings, ratings uplift is set to zero.
To translate ratings’ uplifts into estimated bail-out probabilities, this paper uses therelationship from Snethlage (2015), which is presented in the chart below. Theseprobabilities are based on the ratio between the implied probability of failure (based onstandalone credit ratings) and the implied probability of default (based on “all-in” creditratings).
Figure 6. Estimates of bail-out probabilities based on credit rating uplifts
Source: Snethlage (2015).
100
0
%
0 1 2 3 4 5 6
20
40
60
80
ESTIMATING THE SIZE AND INCIDENCE OF BANK RESOLUTION COSTS FOR SELECTED BANKS IN OECD COUNTRIES
OECD JOURNAL: FINANCIAL MARKET TRENDS – VOLUME 2016/1 © OECD 2016 13
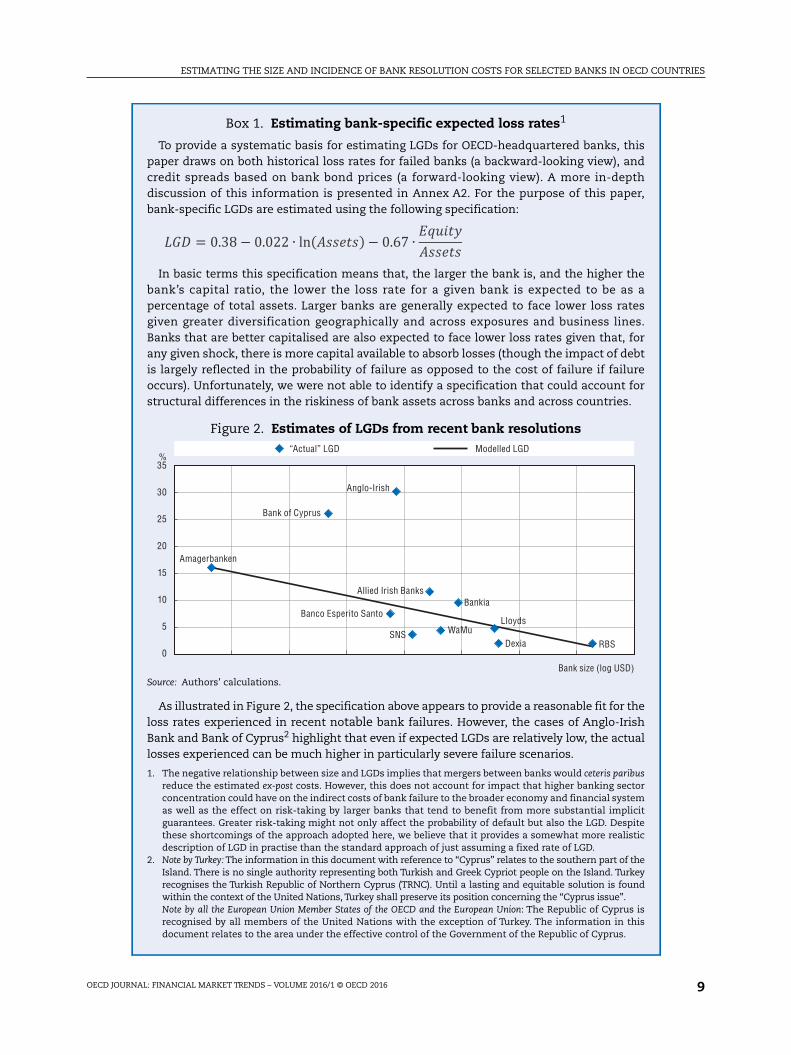
Estimates of implicit guarantees aggregated across our sample OECD banks are
presented in Figure 7 below. The estimated risk to taxpayers associated with implicit bank
guarantees almost doubled between 2008 and 2010, due to increasing bank failure risk, and
increases in expectations of public support for banks. Implicit guarantees continued to rise
between 2010 and 2013, largely due to an increase in the aggregate risk of bank failure as
implied by declining bank credit ratings. However, implicit guarantees have since fallen to
below the levels seen in 2010, noticeably in countries which have been among the early
adopters of bail-in regimes.9
In general, changes in implicit guarantees under this methodology are driven by four
factors:
● Probability of government support (p(bail-out)) – if governments are seen as more supportive
of banks (e.g. due to past actions to support banks), this increases banks’ credit ratings
uplifts and therefore the estimates of implicit guarantees. Similarly, if governments are
seen as less likely to bail-out banks (e.g. due to a reduction in sovereign
creditworthiness, or announcements around bail-in policies), ratings uplifts and
estimated implicit guarantees will decrease.
● Risk-neutral probability of failure (RNPF) – if the risk-adjusted likelihood of bank failure
increases, so too does the present value of potential government support and therefore
the estimated size of implicit guarantees.
● Loss-given-default (LGD) – if banks expected loss rates in insolvency increase (e.g. due to
falling capital ratios or shrinking balance sheets), so too does the expected cost of bank
resolution and therefore the estimated size of implicit guarantees.
● Bank liabilities to GDP – if bank’s indebtedness grows relative to the size of the economy,
so too do expected resolution costs and therefore estimates of implicit guarantees
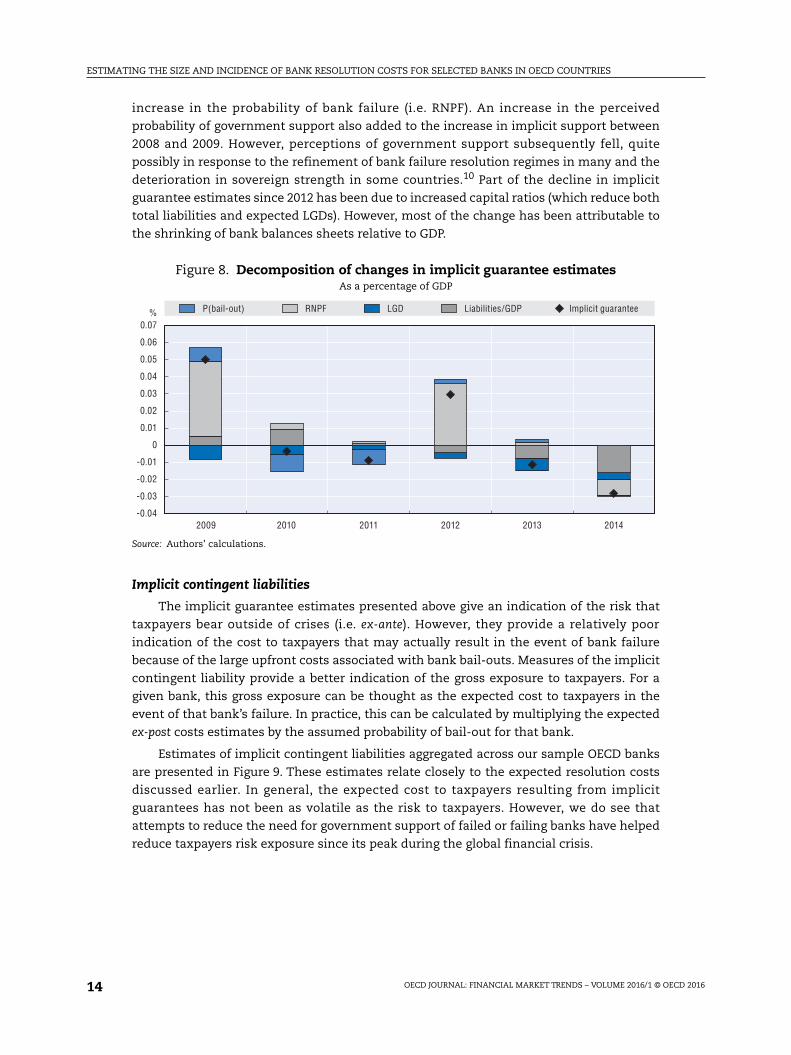
To examine what has been driving changes in estimated implicit guarantees between
2008 and 2014, Figure 8 decomposes the change in total implicit guarantees (as a
percentage of GDP) into changes in these four components. The large increases in
estimated implicit guarantees between 2008-09 and 2011-12 were mostly driven by an
Figure 7. Estimates of implicit guaranteesAs a percentage of GDP, averaged across OECD countries
Source: Authors’ calculations.
0.40
0
%
2008 2009 2010 2011 2012 2013 2014
0.05
0.10
0.15
0.20
0.25
0.30
0.35
Evenly weighted GDP weighted
ESTIMATING THE SIZE AND INCIDENCE OF BANK RESOLUTION COSTS FOR SELECTED BANKS IN OECD COUNTRIES
OECD JOURNAL: FINANCIAL MARKET TRENDS – VOLUME 2016/1 © OECD 201614
increase in the probability of bank failure (i.e. RNPF). An increase in the perceived
probability of government support also added to the increase in implicit support between
2008 and 2009. However, perceptions of government support subsequently fell, quite
possibly in response to the refinement of bank failure resolution regimes in many and the
deterioration in sovereign strength in some countries.10 Part of the decline in implicit
guarantee estimates since 2012 has been due to increased capital ratios (which reduce both
total liabilities and expected LGDs). However, most of the change has been attributable to
the shrinking of bank balances sheets relative to GDP.
Implicit contingent liabilities
The implicit guarantee estimates presented above give an indication of the risk that
taxpayers bear outside of crises (i.e. ex-ante). However, they provide a relatively poor
indication of the cost to taxpayers that may actually result in the event of bank failure
because of the large upfront costs associated with bank bail-outs. Measures of the implicit
contingent liability provide a better indication of the gross exposure to taxpayers. For a
given bank, this gross exposure can be thought as the expected cost to taxpayers in the
event of that bank’s failure. In practice, this can be calculated by multiplying the expected
ex-post costs estimates by the assumed probability of bail-out for that bank.
Estimates of implicit contingent liabilities aggregated across our sample OECD banks
are presented in Figure 9. These estimates relate closely to the expected resolution costs
discussed earlier. In general, the expected cost to taxpayers resulting from implicit
guarantees has not been as volatile as the risk to taxpayers. However, we do see that
attempts to reduce the need for government support of failed or failing banks have helped
reduce taxpayers risk exposure since its peak during the global financial crisis.
Figure 8. Decomposition of changes in implicit guarantee estimatesAs a percentage of GDP
Source: Authors’ calculations.
0.07
-0.04
%
-0.03
-0.02
-0.01
0
0.01
0.02
0.03
0.04
0.05
0.06
2009 2010 2011 2012 2013 2014
P(bail-out) LGDRNPF Liabilities/GDP Implicit guarantee

ESTIMATING THE SIZE AND INCIDENCE OF BANK RESOLUTION COSTS FOR SELECTED BANKS IN OECD COUNTRIES
OECD JOURNAL: FINANCIAL MARKET TRENDS – VOLUME 2016/1 © OECD 2016 15
V. Bank resolution costs under the contingent claim approach11
This section draws on results from an alternative estimation approach, the so-called
“contingent claim approach”, using a subset of the data considered in the first approach.12
The contingent claim approach uses information contained in financial market prices.13
The use of financial market price data conveys a number of attractive features. Market
prices reflect the aggregate expectations of actual investors in the market and, at least for
larger banks, they are almost continuously available. Thus, they can provide a timely and
forward-looking measure of risks. In addition to that, if considering this approach, the
probability of bank failure, as well as the ex-post cost of bank failure, are derived
endogenously and do not need to be estimated outside the model.14 Besides, under this
approach, the definition of bank failure is explicit, that is a bank fails when the market
value of its assets falls below a critical threshold.15
Like in the binomial approach – the first approach presented in this report, the ex-ante
cost of bank failures is computed through multiplying the probability of bank failure by the
loss that the bank would make if failure were to occur. Although the market value of bank
assets is not directly observable, it can be derived from the equity value, whereas the
uncertainty surrounding the asset values can be computed from the volatility of equity.
Data on the market value of bank equity and its volatility are readily available for most of
the OECD countries.
An application of the contingent claim approach to the Swedish bank sector
The contingent claim approach is applied to Sweden as a complement to the binomial
approach used before. The contingent claim approach requires equity values and equity
volatility data, which are available at daily frequency.16 Sweden is a good example also
because its banking sector is large as a share of GDP, thus making a banking failure
potentially very costly; although the banking sector is well capitalised by international
standards. It is worth noticing that the results shown here may not fully reflect the impact
of the regulatory reforms that were launched in the wake of the global financial crisis to
limit resolution costs and implicit bank guarantees.17
Figure 9. Estimates of implicit contingent liabilitiesAs a percentage of GDP, averaged across OECD countries
Source: Authors’ calculations.
12
0
%
2008 2009 2010 2011 2012 2013 2014
2
4
6
8
10
Evenly weighted GDP weighted
ESTIMATING THE SIZE AND INCIDENCE OF BANK RESOLUTION COSTS FOR SELECTED BANKS IN OECD COUNTRIES
OECD JOURNAL: FINANCIAL MARKET TRENDS – VOLUME 2016/1 © OECD 201616
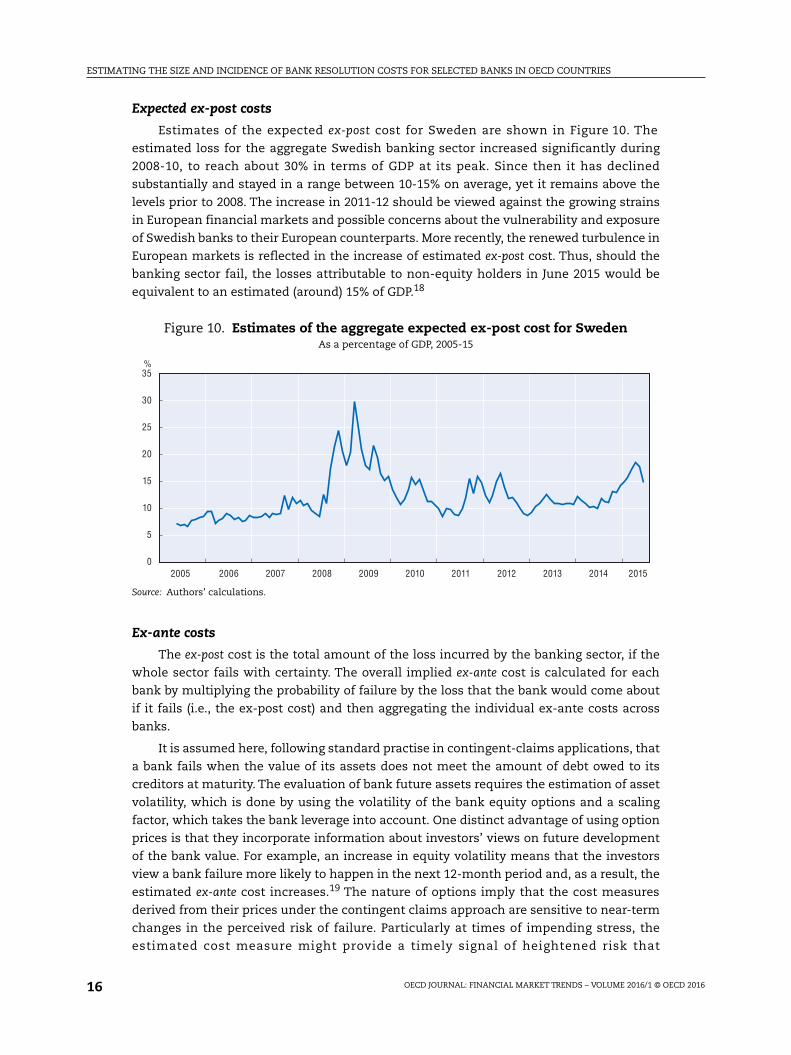
Expected ex-post costs
Estimates of the expected ex-post cost for Sweden are shown in Figure 10. The
estimated loss for the aggregate Swedish banking sector increased significantly during
2008-10, to reach about 30% in terms of GDP at its peak. Since then it has declined
substantially and stayed in a range between 10-15% on average, yet it remains above the
levels prior to 2008. The increase in 2011-12 should be viewed against the growing strains
in European financial markets and possible concerns about the vulnerability and exposure
of Swedish banks to their European counterparts. More recently, the renewed turbulence in
European markets is reflected in the increase of estimated ex-post cost. Thus, should the
banking sector fail, the losses attributable to non-equity holders in June 2015 would be
equivalent to an estimated (around) 15% of GDP.18
Ex-ante costs
The ex-post cost is the total amount of the loss incurred by the banking sector, if the
whole sector fails with certainty. The overall implied ex-ante cost is calculated for each
bank by multiplying the probability of failure by the loss that the bank would come about
if it fails (i.e., the ex-post cost) and then aggregating the individual ex-ante costs across
banks.
It is assumed here, following standard practise in contingent-claims applications, that
a bank fails when the value of its assets does not meet the amount of debt owed to its
creditors at maturity. The evaluation of bank future assets requires the estimation of asset
volatility, which is done by using the volatility of the bank equity options and a scaling
factor, which takes the bank leverage into account. One distinct advantage of using option
prices is that they incorporate information about investors’ views on future development
of the bank value. For example, an increase in equity volatility means that the investors
view a bank failure more likely to happen in the next 12-month period and, as a result, the
estimated ex-ante cost increases.19 The nature of options imply that the cost measures
derived from their prices under the contingent claims approach are sensitive to near-term
changes in the perceived risk of failure. Particularly at times of impending stress, the
estimated cost measure might provide a timely signal of heightened risk that
Figure 10. Estimates of the aggregate expected ex-post cost for SwedenAs a percentage of GDP, 2005-15
Source: Authors’ calculations.
35
30
25
20
15
10
5
0
%
2005 2006 2007 2008 2009 2010 2011 2012 2013 2014 2015
ESTIMATING THE SIZE AND INCIDENCE OF BANK RESOLUTION COSTS FOR SELECTED BANKS IN OECD COUNTRIES
OECD JOURNAL: FINANCIAL MARKET TRENDS – VOLUME 2016/1 © OECD 2016 17
complements the measure derived under the binomial approach, which is less noisy but
adapts more slowly to changing market conditions.
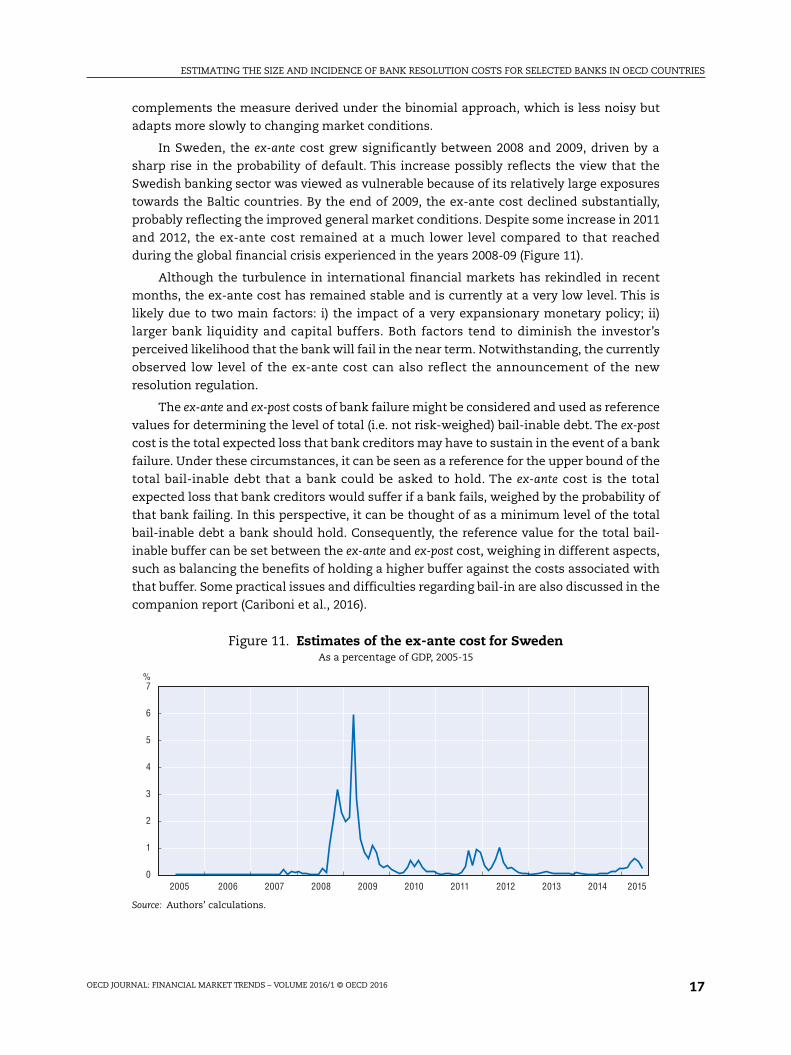
In Sweden, the ex-ante cost grew significantly between 2008 and 2009, driven by a
sharp rise in the probability of default. This increase possibly reflects the view that the
Swedish banking sector was viewed as vulnerable because of its relatively large exposures
towards the Baltic countries. By the end of 2009, the ex-ante cost declined substantially,
probably reflecting the improved general market conditions. Despite some increase in 2011
and 2012, the ex-ante cost remained at a much lower level compared to that reached
during the global financial crisis experienced in the years 2008-09 (Figure 11).
Although the turbulence in international financial markets has rekindled in recent
months, the ex-ante cost has remained stable and is currently at a very low level. This is
likely due to two main factors: i) the impact of a very expansionary monetary policy; ii)
larger bank liquidity and capital buffers. Both factors tend to diminish the investor’s
perceived likelihood that the bank will fail in the near term. Notwithstanding, the currently
observed low level of the ex-ante cost can also reflect the announcement of the new
resolution regulation.
The ex-ante and ex-post costs of bank failure might be considered and used as reference
values for determining the level of total (i.e. not risk-weighed) bail-inable debt. The ex-post
cost is the total expected loss that bank creditors may have to sustain in the event of a bank
failure. Under these circumstances, it can be seen as a reference for the upper bound of the
total bail-inable debt that a bank could be asked to hold. The ex-ante cost is the total
expected loss that bank creditors would suffer if a bank fails, weighed by the probability of
that bank failing. In this perspective, it can be thought of as a minimum level of the total
bail-inable debt a bank should hold. Consequently, the reference value for the total bail-
inable buffer can be set between the ex-ante and ex-post cost, weighing in different aspects,
such as balancing the benefits of holding a higher buffer against the costs associated with
that buffer. Some practical issues and difficulties regarding bail-in are also discussed in the
companion report (Cariboni et al., 2016).
Figure 11. Estimates of the ex-ante cost for SwedenAs a percentage of GDP, 2005-15
Source: Authors’ calculations.
7
6
5
4
3
2
1
0
%
2005 2006 2007 2008 2009 2010 2011 2012 2013 2014 2015
ESTIMATING THE SIZE AND INCIDENCE OF BANK RESOLUTION COSTS FOR SELECTED BANKS IN OECD COUNTRIES
OECD JOURNAL: FINANCIAL MARKET TRENDS – VOLUME 2016/1 © OECD 201618
Comparing the results of the two approaches for the Swedish banking sector
For the ex-ante cost, the forward looking nature of the contingent claim approach
means that it can be used as an early warning indicator. Thus, signalling rising risks ahead
of financial turbulence, although the signal may become noisy from time to time. By
contrast, the binomial approach is more stable or slower-moving over time and it does not
reflect information about future developments of bank risks and resolution costs in a
timely manner. In addition to that, it may not completely account for country
heterogeneities that can be significant during periods of financial stress.
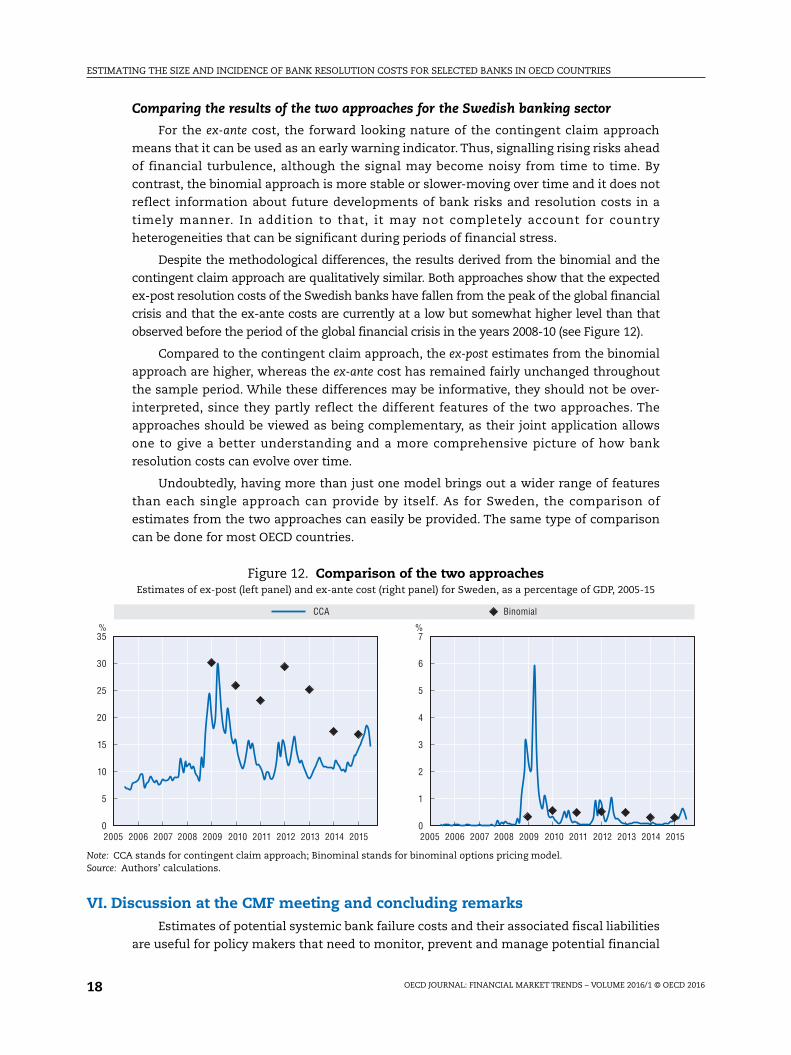
Despite the methodological differences, the results derived from the binomial and the
contingent claim approach are qualitatively similar. Both approaches show that the expected
ex-post resolution costs of the Swedish banks have fallen from the peak of the global financial
crisis and that the ex-ante costs are currently at a low but somewhat higher level than that
observed before the period of the global financial crisis in the years 2008-10 (see Figure 12).
Compared to the contingent claim approach, the ex-post estimates from the binomial
approach are higher, whereas the ex-ante cost has remained fairly unchanged throughout
the sample period. While these differences may be informative, they should not be over-
interpreted, since they partly reflect the different features of the two approaches. The
approaches should be viewed as being complementary, as their joint application allows
one to give a better understanding and a more comprehensive picture of how bank
resolution costs can evolve over time.
Undoubtedly, having more than just one model brings out a wider range of features
than each single approach can provide by itself. As for Sweden, the comparison of
estimates from the two approaches can easily be provided. The same type of comparison
can be done for most OECD countries.
VI. Discussion at the CMF meeting and concluding remarksEstimates of potential systemic bank failure costs and their associated fiscal liabilities
are useful for policy makers that need to monitor, prevent and manage potential financial
Figure 12. Comparison of the two approachesEstimates of ex-post (left panel) and ex-ante cost (right panel) for Sweden, as a percentage of GDP, 2005-15
Note: CCA stands for contingent claim approach; Binominal stands for binominal options pricing model.Source: Authors’ calculations.
35
0
%
2005 2006 2007 2008 2009 2010 2011 2012 2013 2014 2015
5
10
15
20
25
30
7
0
%
2005 2006 2007 2008 2009 2010 2011 2012 2013 2014 2015
1
2
3
4
5
6
CCA Binomial

ESTIMATING THE SIZE AND INCIDENCE OF BANK RESOLUTION COSTS FOR SELECTED BANKS IN OECD COUNTRIES
OECD JOURNAL: FINANCIAL MARKET TRENDS – VOLUME 2016/1 © OECD 2016 19
crises. They are also helpful for empirically assessing the effects of bank regulatory reform.
Furthermore, they can be pivotal for evaluating the transparency of policy institutions.
There is, however, no single best measure of systemic bank failure costs, as earlier
discussions by the OECD Committee on Financial Markets (CMF) had already concluded. In
fact, it is exactly that insight which motivated CMF delegates to suggest the Secretariat
explores alternatives to empirical measures of the value of implicit guarantees, broadening
the perspective by including the public finance dimension.
The two approaches described in this report provide different measures of resolution
costs and they well complement each other by bringing out different perspectives on how
risk may unfold. Both approaches are structural models, developed as part of the well-
known and widely used stream of option-pricing techniques. The companion report
(Cariboni et al., 2016) SYMBOL model is a simulation-based model. It uses bank balance
sheet data to simulate the loss distribution of a given sample of banks, explicitly
accounting for the regulatory setting in the European Union. Despite the fact that the
methodological approaches of the two reports are considerably different, they both
recognise the potential for significant resolution costs of bank failure and the possibility of
some public finance costs arising in the case of the materialisation of tail risks. Those
potential costs are time-variant but they will not be zero, as long as market participants
perceive bailing out and the possibility of public support as material. That means that
some public finance exposures to the private financial sector might still remain.
The CMF discussed at length the two reports. It was strongly supportive of the work on
financial sector guarantees and contingent fiscal liabilities and it especially emphasised
the usefulness of the horizontal comparison and diversity of methodologies applied in the
two reports. Delegates expressed their view that the work done is relevant for a range of
policy issues. The measures discussed were recognised as being very helpful for identifying
and monitoring resolution costs as well as for measuring progress made in reducing these
costs over time, as regulatory reforms are gradually being implemented. The use of these
measures for additional and broader policy purposes were also discussed. Some
Committee members considered whether the estimates of resolution costs could be used
as a reference tool for determining the total amount of bail-inable debt and thus as one
possible input in the setting of TLAC/MREL requirements. There was also a suggestion to
use the estimates to measure the potential impact on bank funding costs if/when market
expectations of bail-in bed in. One more issue that delegates touched on was the use of the
resolution costs measures for external communication purposes. Some members
expressed their concern about national authorities publishing estimates of implicit
guarantees because it would embed existing perceptions of public guarantees remaining in
place, despite the advancement made in the regulatory and supervisory areas. Other
members pointed out that the understanding of the impact of external communication
around bail-in/bail-out issues in bank failure resolution cases is at an early stage and it is
perhaps less advanced than in other areas such as monetary and fiscal policy. The
understanding gained in the latter areas could help furthering knowledge regarding the
communication on the issue of implicit guarantees. It was recognised that the issue of
external communication of estimates of implicit contingent liabilities is an important
issue. Yet far more needs to be done to fully understand the possible impact on market
behaviour and incentives. The CMF finally suggested follow-up work on how the results of
this report could be communicated and used in day-to-day policy.

ESTIMATING THE SIZE AND INCIDENCE OF BANK RESOLUTION COSTS FOR SELECTED BANKS IN OECD COUNTRIES
OECD JOURNAL: FINANCIAL MARKET TRENDS – VOLUME 2016/1 © OECD 201620
Notes
1. The relevance of this observation has been underscored by interventions from delegates to theOECD Committee on Financial Markets (CMF) in previous discussions on the broader subject area.
2. This is because the fair value of equity will be equal to the present value of any dividends paid andproceeds arising from the sale of equity. Determining the fair risk-adjusted discount rate tocompute this present value is far from straightforward.
3. This could include support through capital injections, asset purchases and/or debt guarantees.
4. There is a risk that taxpayers will ultimately be liable for some of this cost should industry fundingbe insufficient. However, we do not attempt to quantify such risks as part of the implicitcontingent liability measure.
5. It should be noted that the comparability of results for different dates is complicated where thesample of banks available in different years is changing due to failures and/or mergers.
6. The implicit contingent liability and implicit guarantee estimates assume that no costs would bemet by deposit insurance funds or resolution funds in the event of a taxpayer-funded bail-out.
7. GDP data is collected from the OECD Economic Outlook database.
8. Note that we differentiate between a bank’s probability of failure and their probability of defaultgiven that failure can occur without a bank defaulting should the government intervene by bailing-out or putting a bank in resolution.
9. The results found here are similar to those in Arslanalp and Liao (2015), who use a similarmethodology to estimate the fiscal contingent liabilities arising from implicit guarantees.
10. Earlier OECD discussions on the topic concluded that in some countries part of the decline in theestimated value of implicit bank debt guarantees reflected a deterioration of the strength of thesovereign seen as providing the guarantee. This interpretation is consistent with recent theoreticalwork that explains how the value of a bank debt guarantee depends on the strength and size ofboth the bank and the guarantor (Estrella and Schich, 2015).
11. The views expressed in this section do not necessarily reflect the official views of the SwedishNational Debt Office.
12. This section uses data for the four largest Swedish banks and results are presented as a case study.Balance sheet data are at consolidated level.
13. There are various reasonable alternatives for estimating resolution costs. For the Swedish case,besides from being suitable from an analytical perspective, an important reason for choosing thisspecific method considered here is that it has been applied before by several internationalinstitutions to the case of the Swedish banking sector, including the IMF, e.g. in its FinancialStability Assessment Program in 2012 (see IMF Sweden Country Report 2012).
14. See, for example, IMF (2014).
15. The methodological details of this approach are presented in Annex A4. As regards the criticalthreshold, a common approach is to set it equal to the value of the short-term plus 50 per cent oflong -term borrowing (see e.g. IMF (2014) and Moody’s KMV). Other approaches include Noss andSowerbutt (2012), who choose the level of the minimum capital requirement as the criticalthreshold. Alternatively, one could also choose the level of TLAC as critical threshold.
16. Together with the equity values and volatility of equity, the contingent claim approach uses bankliabilities from balance sheet data as an input.
17. This section uses data for the four largest Swedish banks and results are presented as a case study.Balance sheet data are at consolidated level. It should be noted that the estimates in this sectiondo not reflect the implementation of the EU Bank Recovery and Resolution Directive (BRRD) which,in Sweden, will enter into force in February 2016 and whose aim is to reduce bank implicitguarantees. For this reason, this section provides an estimate of the ex-ante and ex-post costs asdefined previously in the report, and it does not attempt to estimate implicit guarantees or implicitcontingent liabilities.
18. The ex-ante and ex-post cost are computed on a five year horizon.
19. When option prices are not available, an alternative is to use the historical equity prices.
ESTIMATING THE SIZE AND INCIDENCE OF BANK RESOLUTION COSTS FOR SELECTED BANKS IN OECD COUNTRIES
OECD JOURNAL: FINANCIAL MARKET TRENDS – VOLUME 2016/1 © OECD 2016 21
References
Arslanalp, S. and Y. Liao (2015), “Contingent liabilities from banks: How to track them?”, IMF WorkingPaper no. 15/255, www.imf.org/external/pubs/cat/longres.aspx?sk=43443.0.
Avgouleas, E. and C. Goodhart (2015), “Critical Reflections on Bank Bail-ins”, Journal of FinancialRegulation, Vol. 1, No. 1, 03.2015, pp. 3-29.
Balla, E., E. Prescott and J. Walter (2015), “Did the financial reforms of the early 1990s fail? Acomparison of bank failures and FDIC losses in the 1986-92 and 2007-13 periods”, Federal ReserveBank of Richmond Working Paper 15-05, https://www.richmondfed.org/-/media/richmondfedorg/publications/research/working_papers/2015/pdf/wp15-05.pdf.
Black, F. and M. Scholes (1973), “The pricing of options and corporate liabilities”, Journal of PoliticalEconomy No. 81, pp.637-654.
Cox, J. C, S. A. Ross and M. Rubinstein (1979) “Option pricing: A simplified approach,” Journal of FinancialEconomics No. 7, pp. 229-263, www.dms.umontreal.ca/~morales/docs/cox_rubinstein_ross.pdf.
Cariboni, J., A. Fontana, S. Langedijk, S. Maccaferri, A. Pagano, M. Petracco Giudici, M. Rancan andS. Schich (2016), “Reducing and sharing the burden of bank failures”, OECD Journal: FinancialMarket Trends, Vol. 2015/2.
Denk, O., S. Schich and B. Cournède (2015), “Why Implicit Bank Debt Guarantees Matter: SomeEmpirical Evidence”, OECD Journal: Financial Market Trends, Vol. 2014/2, DOI: http://dx.doi.org/10.1787/fmt-2014-5js3bfznx6vj.
Estrella, A. and S. Schich (2015), “Valuing guaranteed bank debt: Role of strength and size of the bankand the guarantor”, Journal of Economic & Financial Studies, Vol. 03, No.5 (October), DOI: http://dx.doi.org/10.18533/jefs.v3i05.165.
Haldane, A. G. (2010), The $100 billion question. Speech presented at the Institute of Regulation and Risk,Hong Kong, 30 March, www.bis.org/review/r100406d.pdf.
Hull, J., M. Predescu and A. White (2005) “Bond prices, default probabilities and risk premiums”,University of Toronto Working Paper, http://papers.ssrn.com/sol3/papers.cfm?abstract_id=2173148.
International Monetary Fund (2014), Global Financial Stability Report, April, www.imf.org/external/pubs/FT/GFSR/2014/01/pdf/text.pdf.
Juncker, J.-C., D. Tusk, J. Dijsselbloem, M. Draghi, and M. Schulz (2015), Completing Europe’s Economic andMonetary Union, European Commission, February, http://ec.europa.eu/priorities/economic-monetary-union/docs/5-presidents-report_en.pdf
Laeven, L. and F. Valencia (2013), “Systemic banking crises database.” IMF Economic Review 6 (2),pp.225-270.
Merton, R. (1974), “On the pricing of corporate debt: The risk structure of interest rates”, Journal ofFinance 29, pp. 449-70.
Moody’s Investor Services (2009), Corporate default and recovery rates, 1920-2008, https://www.moodys.com/sites/products/DefaultResearch/2007400000578875.pdf.
Noss, J. and R. Sowerbutts (2012), “The implicit subsidy of banks”, Bank of England Financial StabilityPaper No. 15, www.bankofengland.co.uk/financialstability/Documents/fpc/fspapers/fs_paper15.pdf.
Schich, S. and S. Lindh (2012), “Implicit guarantees for bank debt: Where do we stand?”, OECD Journal:Financial Market Trends, Vol. 2012/1, DOI: http://dx.doi.org/10.1787/fmt-2012-5k91hbvfkm9v.
Shaeck, Klaus (2008), “Bank Liability Structure, FDIC LOSS, and Time to Failure: A Qantile RegressionApproach”, Journal of Financial Services Research 33:163-179.
Snethlage, D. (2015) “Towards putting a price on the risk of bank failure.” New Zealand Treasuryworking paper 15/03, www.treasury.govt.nz/publications/research-policy/wp/2015/15-03/twp15-03.pdf.
ESTIMATING THE SIZE AND INCIDENCE OF BANK RESOLUTION COSTS FOR SELECTED BANKS IN OECD COUNTRIES
OECD JOURNAL: FINANCIAL MARKET TRENDS – VOLUME 2016/1 © OECD 201622
ANNEX A1
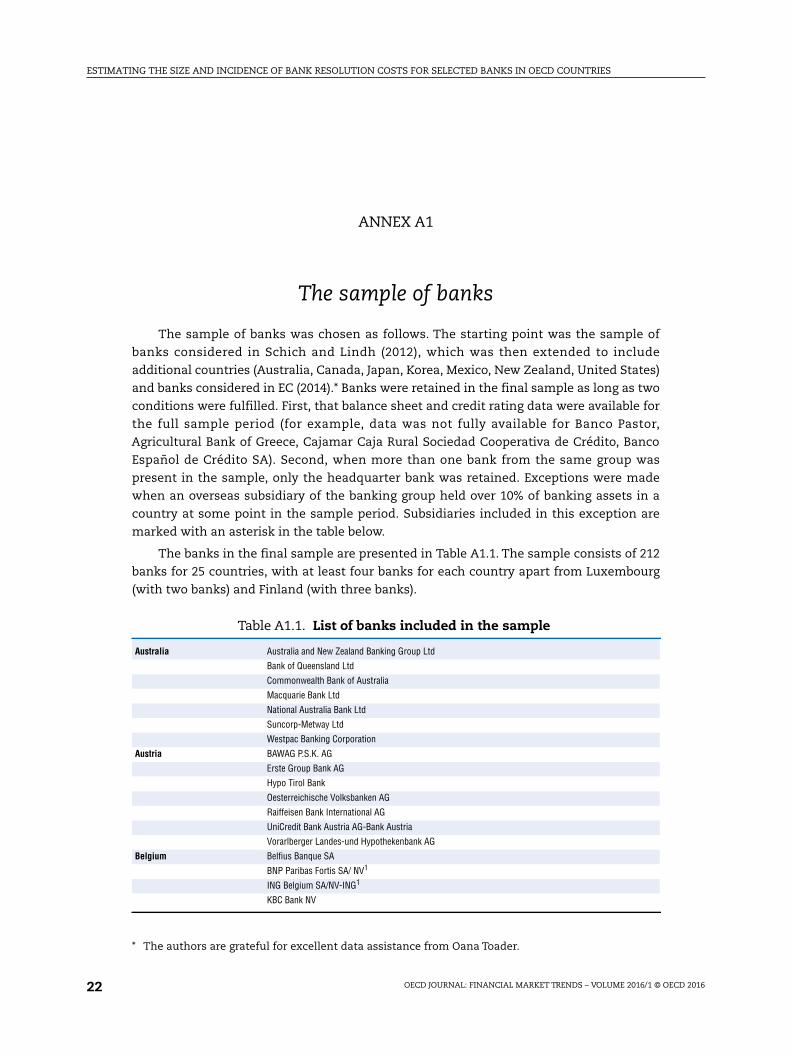
The sample of banks
The sample of banks was chosen as follows. The starting point was the sample of
banks considered in Schich and Lindh (2012), which was then extended to include
additional countries (Australia, Canada, Japan, Korea, Mexico, New Zealand, United States)
and banks considered in EC (2014).* Banks were retained in the final sample as long as two
conditions were fulfilled. First, that balance sheet and credit rating data were available for
the full sample period (for example, data was not fully available for Banco Pastor,
Agricultural Bank of Greece, Cajamar Caja Rural Sociedad Cooperativa de Crédito, Banco
Español de Crédito SA). Second, when more than one bank from the same group was
present in the sample, only the headquarter bank was retained. Exceptions were made
when an overseas subsidiary of the banking group held over 10% of banking assets in a
country at some point in the sample period. Subsidiaries included in this exception are
marked with an asterisk in the table below.
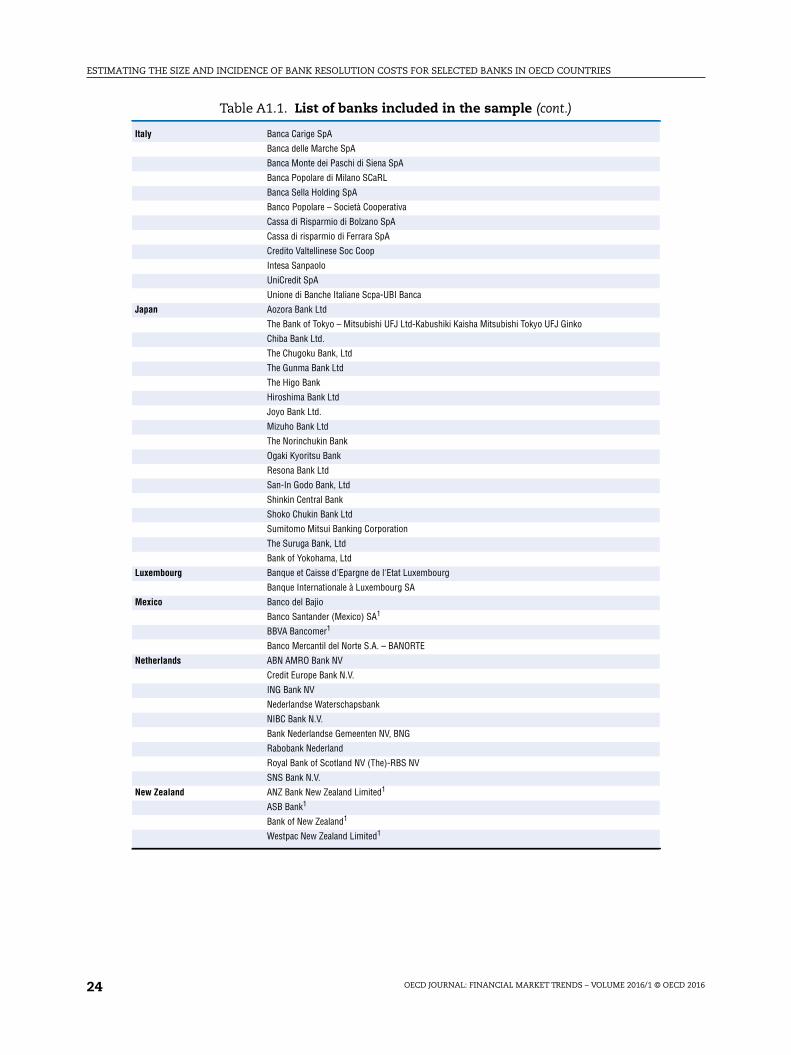
The banks in the final sample are presented in Table A1.1. The sample consists of 212
banks for 25 countries, with at least four banks for each country apart from Luxembourg
(with two banks) and Finland (with three banks).
* The authors are grateful for excellent data assistance from Oana Toader.
Table A1.1. List of banks included in the sample
Australia Australia and New Zealand Banking Group Ltd
Bank of Queensland Ltd
Commonwealth Bank of Australia
Macquarie Bank Ltd
National Australia Bank Ltd
Suncorp-Metway Ltd
Westpac Banking Corporation
Austria BAWAG P.S.K. AG
Erste Group Bank AG
Hypo Tirol Bank
Oesterreichische Volksbanken AG
Raiffeisen Bank International AG
UniCredit Bank Austria AG-Bank Austria
Vorarlberger Landes-und Hypothekenbank AG
Belgium Belfius Banque SA
BNP Paribas Fortis SA/ NV1
ING Belgium SA/NV-ING1
KBC Bank NV

ESTIMATING THE SIZE AND INCIDENCE OF BANK RESOLUTION COSTS FOR SELECTED BANKS IN OECD COUNTRIES
OECD JOURNAL: FINANCIAL MARKET TRENDS – VOLUME 2016/1 © OECD 2016 23
Canada Bank of Montreal
Bank of Nova Scotia (The)
Canadian Imperial Bank of Commerce
National Bank of Canada
Royal Bank of Canada
Toronto Dominion Bank
Denmark Danske Bank A/S
Jyske Bank A/S
Nordea Bank Danmark A/S
Nykredit Bank A/S
Spar Nord Bank
Sydbank A/S
Finland Aktia Bank Plc
Nordea Bank Finland Plc1
Pohjola Bank plc
France Credit Agricole CIB SA
Banque Fédérative du Crédit Mutuel
Banque PSA Finance SA
BNP Paribas SA
BPCE SA
Crédit Agricole S.A.
Dexia Crédit Local SA
RCI Banque SA
Société Générale SA
Germany Bayerische Landesbank
Commerzbank AG
DekaBank Deutsche Girozentrale AG
Deutsche Apotheker- und Aerztebank eG
Deutsche Bank AG
Deutsche Pfandbriefbank AG
Deutsche Postbank AG
DZ Bank AG-Deutsche Zentral-Genossenschaftsbank
HSH Nordbank AG
Hypothekenbank Frankfurt AG
Landesbank Baden-Wuerttemberg
Landesbank Berlin AG
Landesbank Hessen-Thueringen Girozentrale
Münchener Hypothekenbank eG
Norddeutsche Landesbank Girozentrale
Sparkasse KölnBonn
Volkswagen Bank GmbH
Portigon AG
WGZ-Bank AG
Greece Alpha Bank AE
Eurobank Ergasias SA
National Bank of Greece SA
Piraeus Bank SA
Ireland Allied Irish Banks plc
Bank of Ireland
Depfa Bank Plc
Permanent TSB Plc
Ulster Bank Ireland Limited1
Table A1.1. List of banks included in the sample (cont.)
ESTIMATING THE SIZE AND INCIDENCE OF BANK RESOLUTION COSTS FOR SELECTED BANKS IN OECD COUNTRIES
OECD JOURNAL: FINANCIAL MARKET TRENDS – VOLUME 2016/1 © OECD 201624
Italy Banca Carige SpA
Banca delle Marche SpA
Banca Monte dei Paschi di Siena SpA
Banca Popolare di Milano SCaRL
Banca Sella Holding SpA
Banco Popolare – Società Cooperativa
Cassa di Risparmio di Bolzano SpA
Cassa di risparmio di Ferrara SpA
Credito Valtellinese Soc Coop
Intesa Sanpaolo
UniCredit SpA
Unione di Banche Italiane Scpa-UBI Banca
Japan Aozora Bank Ltd
The Bank of Tokyo – Mitsubishi UFJ Ltd-Kabushiki Kaisha Mitsubishi Tokyo UFJ Ginko
Chiba Bank Ltd.
The Chugoku Bank, Ltd
The Gunma Bank Ltd
The Higo Bank
Hiroshima Bank Ltd
Joyo Bank Ltd.
Mizuho Bank Ltd
The Norinchukin Bank
Ogaki Kyoritsu Bank
Resona Bank Ltd
San-In Godo Bank, Ltd
Shinkin Central Bank
Shoko Chukin Bank Ltd
Sumitomo Mitsui Banking Corporation
The Suruga Bank, Ltd
Bank of Yokohama, Ltd
Luxembourg Banque et Caisse d'Epargne de l'Etat Luxembourg
Banque Internationale à Luxembourg SA
Mexico Banco del Bajio
Banco Santander (Mexico) SA1
BBVA Bancomer1
Banco Mercantil del Norte S.A. – BANORTE
Netherlands ABN AMRO Bank NV
Credit Europe Bank N.V.
ING Bank NV
Nederlandse Waterschapsbank
NIBC Bank N.V.
Bank Nederlandse Gemeenten NV, BNG
Rabobank Nederland
Royal Bank of Scotland NV (The)-RBS NV
SNS Bank N.V.
New Zealand ANZ Bank New Zealand Limited1
ASB Bank1
Bank of New Zealand1
Westpac New Zealand Limited1
Table A1.1. List of banks included in the sample (cont.)

ESTIMATING THE SIZE AND INCIDENCE OF BANK RESOLUTION COSTS FOR SELECTED BANKS IN OECD COUNTRIES
OECD JOURNAL: FINANCIAL MARKET TRENDS – VOLUME 2016/1 © OECD 2016 25
Norway DNB Bank ASA
Nordea Bank Norge ASA1
Sparebank 1 Nord-Norge
SpareBank 1 SMN
SpareBank 1 SR-Bank ASA
Sparebanken More
Sparebanken Sor
Sparebanken Vest
Storebrand Bank ASA
Portugal Banco BPI SA
Banco Comercial Português, SA
Banco Espirito Santo SA
BANIF – Banco Internacional do Funchal, SA
Caixa Economica Montepio Geral
Caixa Geral de Depositos
South Korea Busan Bank
Daegu Bank Ltd.
Hana Bank
Industrial Bank of Korea
KB Kookmin Bank
Korea Development Bank
Korea Exchange Bank
Shinhan Bank
Woori Bank
Spain Banca March SA
Banco Bilbao Vizcaya Argentaria SA
Banco de Sabadell SA
Banco de Valencia SA
Banco Popular Espanol SA
Banco Santander SA
Bankia, SA
Bankinter SA
Caixabank. S.A.
Caja Laboral Popular Coop de credito
Ibercaja Banco SAU
Sweden Landshypotek Bank AB
Länsförsäkringar Bank AB (Publ)
Nordea Bank AB (publ)
Skandinaviska Enskilda Banken AB
Svenska Handelsbanken
Swedbank AB
Switzerland Banque Cantonale Vaudoise
Clientis AG
Credit Suisse AG
EFG Bank AG
Raiffeisen Schweiz Genossenschaft
St. Galler Kantonalbank AG
UBS AG
Zuger Kantonalbank
Turkey Akbank T.A.S.
Turkiye Garanti Bankasi A.S.
Turkiye is Bankasi A.S.
Yapi Ve Kredi Bankasi A.S.
Table A1.1. List of banks included in the sample (cont.)

ESTIMATING THE SIZE AND INCIDENCE OF BANK RESOLUTION COSTS FOR SELECTED BANKS IN OECD COUNTRIES
OECD JOURNAL: FINANCIAL MARKET TRENDS – VOLUME 2016/1 © OECD 201626
United Kingdom Bank of Scotland Plc
Barclays Bank Plc
Co-operative Bank Plc (The)
Coventry Building Society
HSBC Bank plc
Leeds Building Society
Lloyds Bank Plc
National Westminster Bank Plc
Nationwide Building Society
Principality Building Society
Royal Bank of Scotland Plc (The)
Skipton Building Society
Standard Chartered Bank
West Bromwich Building Society
Yorkshire Building Society
United States BancorpSouth Bank
Bank of America, NA
Bank of Hawaii
Bank of New York Mellon (The)
Branch Banking and Trust Company
Citibank NA
Comerica Bank
Discover Bank
First National Bank of Omaha
FirstMerit Bank NA
Frost Bank
Goldman Sachs Bank USA
JP Morgan Chase Bank, NA
Morgan Stanley Bank, NA
New York Community Bank
Old National Bank
People's United Financial, Inc
Regions Bank
Silicon Valley Bank
State Street Bank and Trust Company
Synovus Bank
TCF National Bank
Trustmark National Bank
Webster Bank NA
Wells Fargo Bank, NA
1. Included as foreign-owned subsidiary holding over 10% of domestic banking assets.Source: Authors’ calculations.
Table A1.1. List of banks included in the sample (cont.)
ESTIMATING THE SIZE AND INCIDENCE OF BANK RESOLUTION COSTS FOR SELECTED BANKS IN OECD COUNTRIES
OECD JOURNAL: FINANCIAL MARKET TRENDS – VOLUME 2016/1 © OECD 2016 27
ANNEX A2
Estimating bank-specific loss-given-default
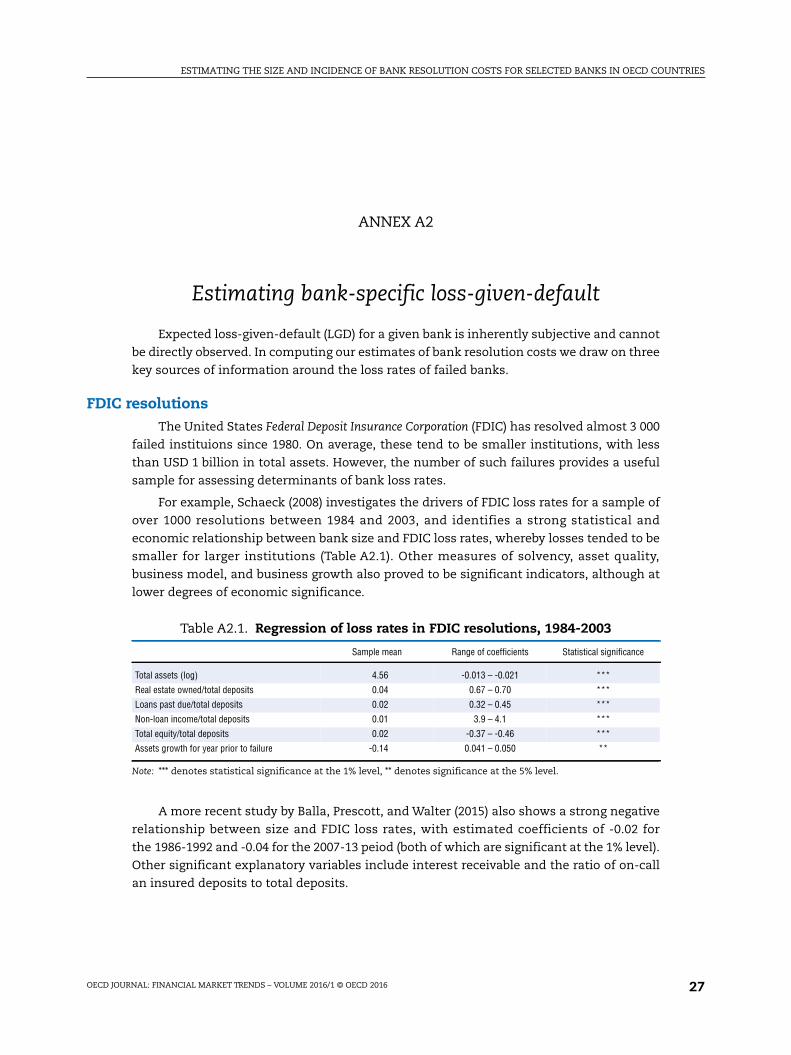
Expected loss-given-default (LGD) for a given bank is inherently subjective and cannot
be directly observed. In computing our estimates of bank resolution costs we draw on three
key sources of information around the loss rates of failed banks.
FDIC resolutionsThe United States Federal Deposit Insurance Corporation (FDIC) has resolved almost 3 000
failed instituions since 1980. On average, these tend to be smaller institutions, with less
than USD 1 billion in total assets. However, the number of such failures provides a useful
sample for assessing determinants of bank loss rates.
For example, Schaeck (2008) investigates the drivers of FDIC loss rates for a sample of
over 1000 resolutions between 1984 and 2003, and identifies a strong statistical and
economic relationship between bank size and FDIC loss rates, whereby losses tended to be
smaller for larger institutions (Table A2.1). Other measures of solvency, asset quality,
business model, and business growth also proved to be significant indicators, although at
lower degrees of economic significance.
A more recent study by Balla, Prescott, and Walter (2015) also shows a strong negative
relationship between size and FDIC loss rates, with estimated coefficients of -0.02 for
the 1986-1992 and -0.04 for the 2007-13 peiod (both of which are significant at the 1% level).
Other significant explanatory variables include interest receivable and the ratio of on-call
an insured deposits to total deposits.
Table A2.1. Regression of loss rates in FDIC resolutions, 1984-2003
Sample mean Range of coefficients Statistical significance
Total assets (log) 4.56 -0.013 – -0.021 ***
Real estate owned/total deposits 0.04 0.67 – 0.70 ***
Loans past due/total deposits 0.02 0.32 – 0.45 ***
Non-loan income/total deposits 0.01 3.9 – 4.1 ***
Total equity/total deposits 0.02 -0.37 – -0.46 ***
Assets growth for year prior to failure -0.14 0.041 – 0.050 **
Note: *** denotes statistical significance at the 1% level, ** denotes significance at the 5% level.
ESTIMATING THE SIZE AND INCIDENCE OF BANK RESOLUTION COSTS FOR SELECTED BANKS IN OECD COUNTRIES
OECD JOURNAL: FINANCIAL MARKET TRENDS – VOLUME 2016/1 © OECD 201628
Other bank resolutionsBank failures over recent years provide one source of information about what
resolution costs could be expected for future bank failures. Even with past failure, however,
estimating LGDs is not straightforward. Firstly, it is difficult to know the total amount of
liabilities outstanding prior to the bank’s resolution. Secondly, it is difficult to know the
true upfront cost of failure, especially in cases involving multiple resolutions or varying
losses accross different creditor classes. Finally, it is very difficult to know the true value of
any equity claims held by governments or bank creditors after the point of resolution. Even
if equity is subsequently sold, there is an implicit opportunity cost to holding equity in a
recently-failed bank that is very difficult to quantify.
Historical resolution costs are based on the sum of any government capital injections,
write-downs of bank creditors, and other losses on unsecured liabilities realised during
standard insolvency proceedings. Balance sheet data is then taken as at the banks’ last
balance date prior to resolution. LGDs are then calculated as total resolution costs divided
by total pre-failure liabilities. Estimates are produded for a sample of banks that have failed
since the onset of the global financial crisis, and are summarised in Table A2.2 below.
Table A2.2. Estimates of upfront resolution costs for recent bank resolutions
Year Bank (country) Total assets1 Resolution Estimated LGD (%)
2008 Washington Mutual (USA) USD 309 billion FDIC receivership. Assets, deposits and secured debt sold to JP Morgan forUSD 1.9 billion.
4.42
2008/12 Dexia (Belgium, France) EUR 605 billion Capital injections of EUR 6.4 billion and EUR 5.5 billion. Currently beingwound down.
2.0
2008/09 Lloyds Banking Group (UK) GBP 322 billion Capital injections from state totalling GBP 20.3 billion. Some of this cost hasbeen recovered through subsequent sales of equity.
3.6
2008/09 Royal Bank of Scotland (UK) GBP 1 840 billion Bailed out at a cost of GBP 45.5 billion. Some of this cost has been recoveredthrough subsequent sales of equity.
2.6
2011 Anglo-Irish Bank (Ireland) EUR 101 billion Bailed out at a cost of EUR 29.3 billion. The bank is currently being wounddown.
30.1
2011 Allied Irish Banks (Ireland) EUR 182 billion Bailed out at a cost of EUR 19.8 billion. The bank remains 99% state-owned. 8.4
2011 Amagerbanken (Denmark) EUR 4.1 billion Haircut of 41% on uninsured creditors, later reduced to 16%. 16.0
2012 Bankia (Spain) EUR 298 billion Received a total of EUR 22.4 billion in capital from the state, with a furtherEUR 4.8 billion in write-downs for junior bondholders.
9.5
2013 SNS Reaal (Netherlands) EUR 134 billion Total resolution cost of EUR 4.7 billion through equity injections and thewrite-down of subordinated debt.
3.6
2013 Bank of Cyprus (Cyprus3) EUR 31 billion Conversion of roughly EUR 8 billion in deposits to equity. The bank's sharesrelisted in December 2014 with a market capitalization of aroundEUR 2 billion.
19.5
2014 Banco Espirito Santo(Portugal)
EUR 91 billion Conversion of EUR 1.3 billion in junior debt into equity, and a EUR 4.9 billionequity injection from the state.
7.4
1. As at last available balance date prior to resolution.2. Based on recovery rates on unsecured debt.3. Note by Turkey: The information in this document with reference to “Cyprus” relates to the southern part of the Island. There is no
single authority representing both Turkish and Greek Cypriot people on the Island. Turkey recognises the Turkish Republic ofNorthern Cyprus (TRNC). Until a lasting and equitable solution is found within the context of the United Nations, Turkey shallpreserve its position concerning the “Cyprus issue”.Note by all the European Union Member States of the OECD and the European Union: The Republic of Cyprus is recognised by all membersof the United Nations with the exception of Turkey. The information in this document relates to the area under the effective controlof the Government of the Republic of Cyprus.
Source: Bank balance sheets, Moody’s (2009), news reports, authors’ calculations.
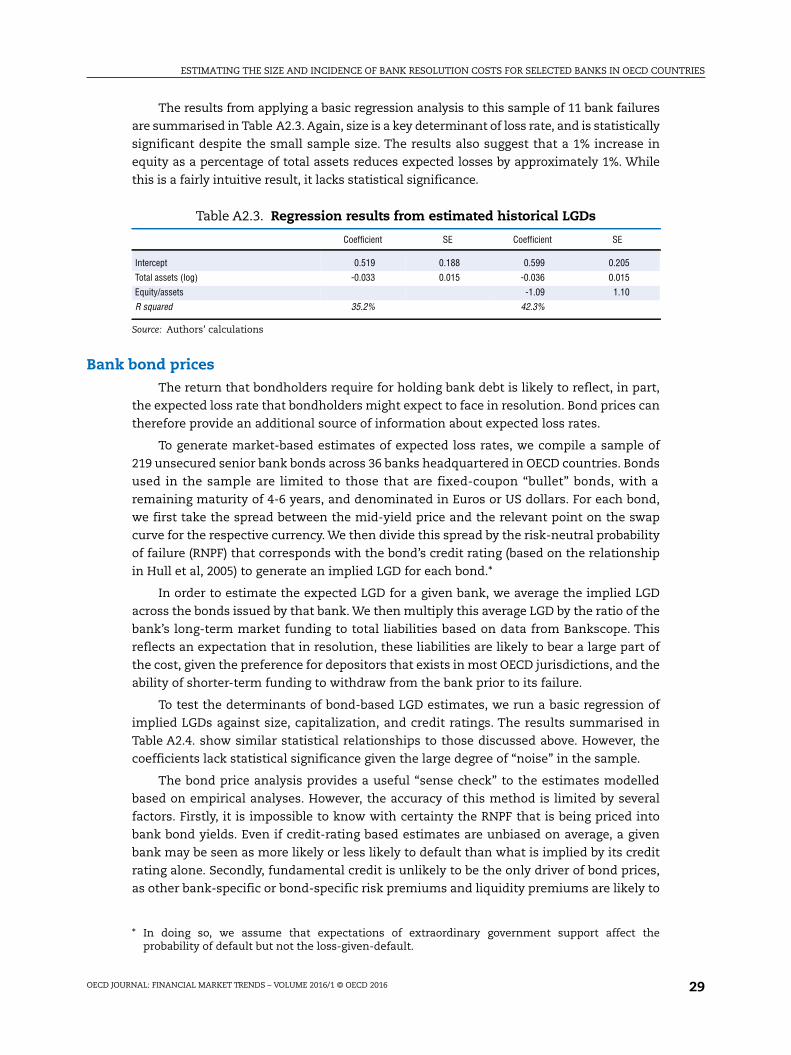
ESTIMATING THE SIZE AND INCIDENCE OF BANK RESOLUTION COSTS FOR SELECTED BANKS IN OECD COUNTRIES
OECD JOURNAL: FINANCIAL MARKET TRENDS – VOLUME 2016/1 © OECD 2016 29
The results from applying a basic regression analysis to this sample of 11 bank failures
are summarised in Table A2.3. Again, size is a key determinant of loss rate, and is statistically
significant despite the small sample size. The results also suggest that a 1% increase in
equity as a percentage of total assets reduces expected losses by approximately 1%. While
this is a fairly intuitive result, it lacks statistical significance.
Bank bond pricesThe return that bondholders require for holding bank debt is likely to reflect, in part,
the expected loss rate that bondholders might expect to face in resolution. Bond prices can
therefore provide an additional source of information about expected loss rates.
To generate market-based estimates of expected loss rates, we compile a sample of
219 unsecured senior bank bonds across 36 banks headquartered in OECD countries. Bonds
used in the sample are limited to those that are fixed-coupon “bullet” bonds, with a
remaining maturity of 4-6 years, and denominated in Euros or US dollars. For each bond,
we first take the spread between the mid-yield price and the relevant point on the swap
curve for the respective currency. We then divide this spread by the risk-neutral probability
of failure (RNPF) that corresponds with the bond’s credit rating (based on the relationship
in Hull et al, 2005) to generate an implied LGD for each bond.*
In order to estimate the expected LGD for a given bank, we average the implied LGD
across the bonds issued by that bank. We then multiply this average LGD by the ratio of the
bank’s long-term market funding to total liabilities based on data from Bankscope. This
reflects an expectation that in resolution, these liabilities are likely to bear a large part of
the cost, given the preference for depositors that exists in most OECD jurisdictions, and the
ability of shorter-term funding to withdraw from the bank prior to its failure.
To test the determinants of bond-based LGD estimates, we run a basic regression of
implied LGDs against size, capitalization, and credit ratings. The results summarised in
Table A2.4. show similar statistical relationships to those discussed above. However, the
coefficients lack statistical significance given the large degree of “noise” in the sample.
The bond price analysis provides a useful “sense check” to the estimates modelled
based on empirical analyses. However, the accuracy of this method is limited by several
factors. Firstly, it is impossible to know with certainty the RNPF that is being priced into
bank bond yields. Even if credit-rating based estimates are unbiased on average, a given
bank may be seen as more likely or less likely to default than what is implied by its credit
rating alone. Secondly, fundamental credit is unlikely to be the only driver of bond prices,
as other bank-specific or bond-specific risk premiums and liquidity premiums are likely to
Table A2.3. Regression results from estimated historical LGDs
Coefficient SE Coefficient SE
Intercept 0.519 0.188 0.599 0.205
Total assets (log) -0.033 0.015 -0.036 0.015
Equity/assets -1.09 1.10
R squared 35.2% 42.3%
Source: Authors’ calculations
* In doing so, we assume that expectations of extraordinary government support affect theprobability of default but not the loss-given-default.

ESTIMATING THE SIZE AND INCIDENCE OF BANK RESOLUTION COSTS FOR SELECTED BANKS IN OECD COUNTRIES
OECD JOURNAL: FINANCIAL MARKET TRENDS – VOLUME 2016/1 © OECD 201630
be at play. Furthermore, bond prices may be relatively insensitive to a bank’s funding
structures if the likelihood of failure is seen a low (even though funding structure would
affect loss rates should failure occur, they could evolve substantially prior to failure).
Approach usedTo construct a single specification for producing resolution cost estimates, we start by
taking the average estimated slope coefficients for log size and capital-to-asset ratios from
the three regression analyses presented above. We then set the intercept value to minimise
the average difference between modelled LGDs and “actual” from the recent bank failures
presented in Table A2.2. This results in the following:
In the few cases where data is unavailable for a given bank at a given point in time, the
LGD for that bank is set to 10% in line with the sample average. Furthermore, a minimum
LGD of 1% is applied to account for the possibilities of very low or even negative LGD
estimates for banks with characteristics that are outside of the sample considered in the
linear regression models described above.
Unfortunately, we were unable to include in the specifications characteristics that
reflect the riskiness of a bank’s assets. In practice, factors such as the “culture” of lending,
the quality of the legal and insolvency system, and the state of the macroeconomic
environment may influence LGDs. We believe that the simple estimations considered here
to determine LGD are nonetheless a preferable approach to just assuming a fixed rate of
LGD, as is commonly done.
Table A2.4. Comparison of modelled and bond price-implied LGD estimates(average across country)
Country Coefficient Standard error Coefficient Standard error
Intercept 0.329 0.174 0.329 0.177
Total assets (log) -0.014 0.013 -0.013 0.015
Equity/assets -0.707 0.480 -0.709 0.488
Credit rating -0.001 0.006
R squared 9.2% 9.3%
Source: Bloomberg, authors’ calculations.
= 0.38 0.022 ln( ) 0.67
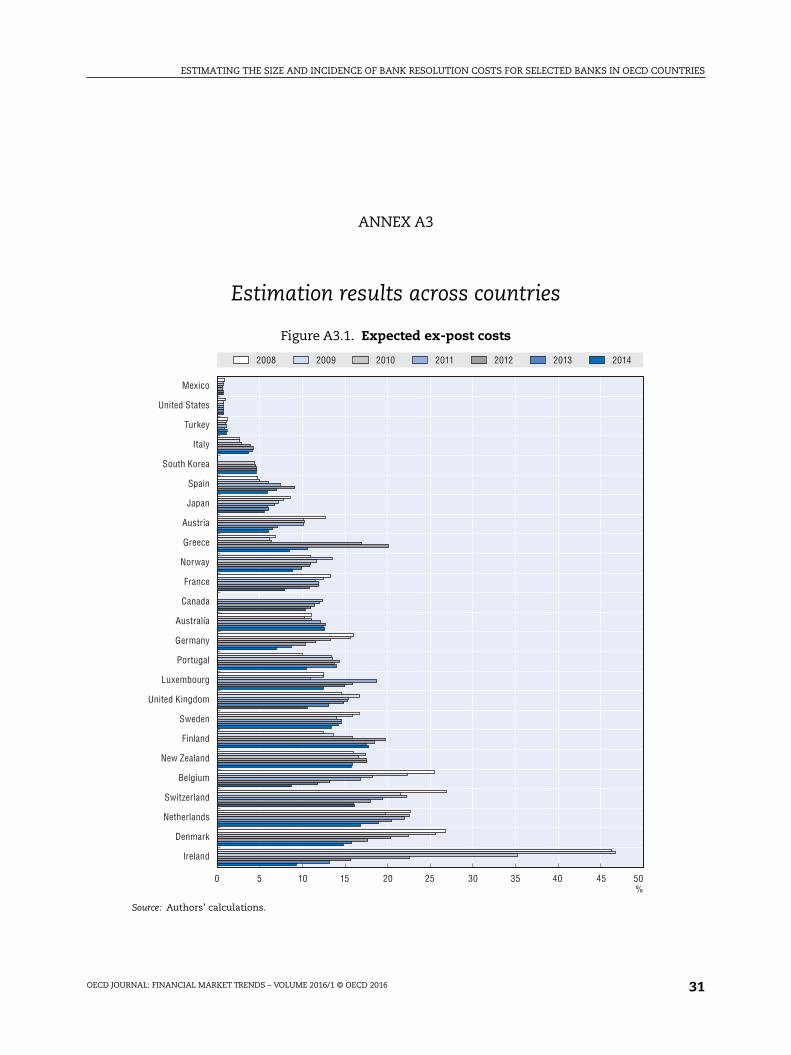
ESTIMATING THE SIZE AND INCIDENCE OF BANK RESOLUTION COSTS FOR SELECTED BANKS IN OECD COUNTRIES
OECD JOURNAL: FINANCIAL MARKET TRENDS – VOLUME 2016/1 © OECD 2016 31
ANNEX A3
Estimation results across countries
Figure A3.1. Expected ex-post costs
Source: Authors’ calculations.
0 5 10 15 20 25 30 35 40 45 50%
2008 2009 2010 2011 2012 2013 2014
Ireland
Denmark
Netherlands
Switzerland
Belgium
New Zealand
Finland
Sweden
United Kingdom
Luxembourg
Portugal
Germany
Australia
Canada
France
Norway
Greece
Austria
Japan
Spain
South Korea
Italy
Turkey
United States
Mexico
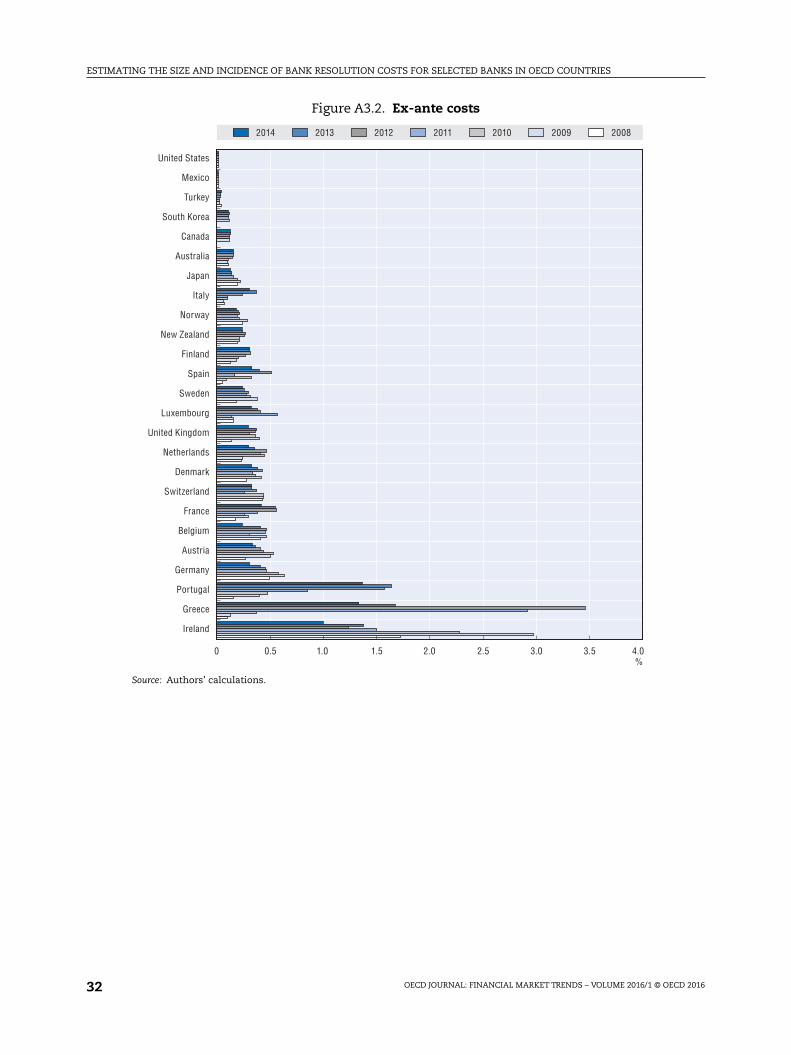
ESTIMATING THE SIZE AND INCIDENCE OF BANK RESOLUTION COSTS FOR SELECTED BANKS IN OECD COUNTRIES
OECD JOURNAL: FINANCIAL MARKET TRENDS – VOLUME 2016/1 © OECD 201632
Figure A3.2. Ex-ante costs
Source: Authors’ calculations.
0 0.5 1.0 1.5 2.0 2.5 3.0 3.5 4.0%
2008200920102011201220132014
Ireland
United States
Greece
Portugal
Germany
Austria
Belgium
France
Switzerland
Denmark
Netherlands
United Kingdom
Luxembourg
Sweden
Spain
Finland
New Zealand
Norway
Italy
Japan
Australia
Canada
South Korea
Turkey
Mexico
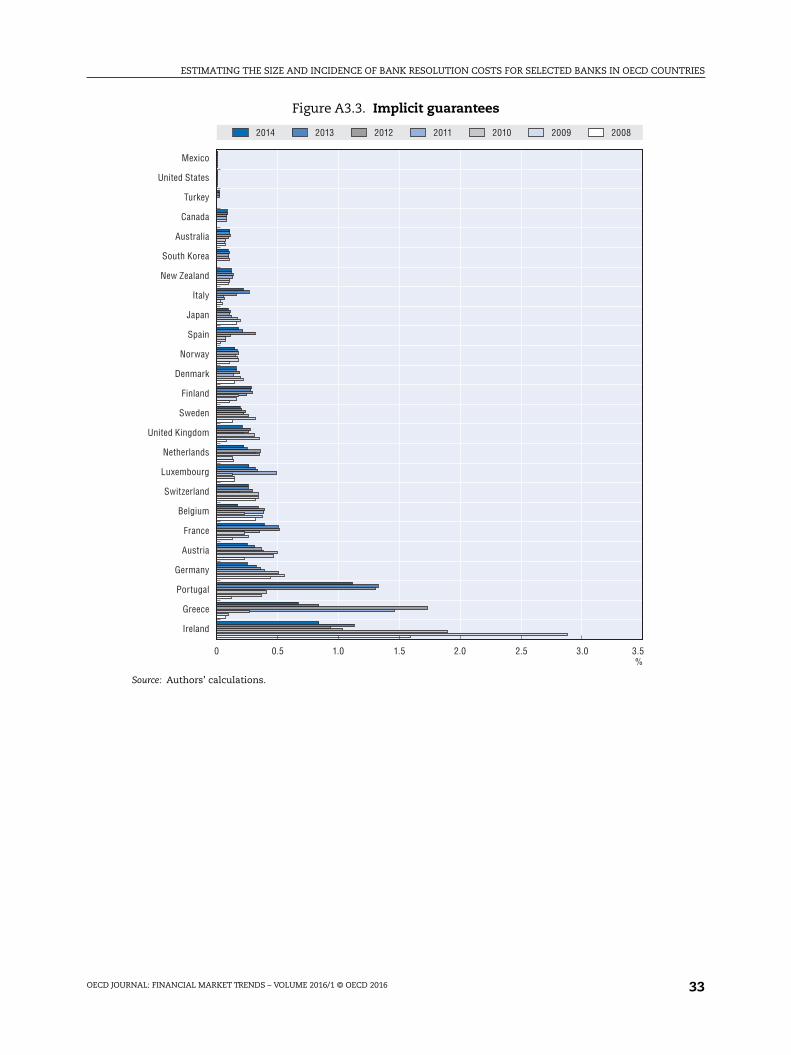
ESTIMATING THE SIZE AND INCIDENCE OF BANK RESOLUTION COSTS FOR SELECTED BANKS IN OECD COUNTRIES
OECD JOURNAL: FINANCIAL MARKET TRENDS – VOLUME 2016/1 © OECD 2016 33
Figure A3.3. Implicit guarantees
Source: Authors’ calculations.
0 0.5 1.0 1.5 2.0 2.5 3.0 3.5%
2008200920102011201220132014
Ireland
Mexico
Greece
Portugal
Germany
Austria
France
Belgium
Switzerland
Luxembourg
Netherlands
United Kingdom
Sweden
Finland
Denmark
Norway
Spain
Japan
Italy
New Zealand
South Korea
Australia
Canada
Turkey
United States

ESTIMATING THE SIZE AND INCIDENCE OF BANK RESOLUTION COSTS FOR SELECTED BANKS IN OECD COUNTRIES
OECD JOURNAL: FINANCIAL MARKET TRENDS – VOLUME 2016/1 © OECD 201634
Figure A3.4. Implicit contingent liabilities Source: Authors’ calculations
Source: Authors’ calculations.
0 10 20 30 40 50%
2008200920102011201220132014
Ireland
Mexico
Finland
Switzerland
Netherlands
Belgium
Luxembourg
Sweden
United Kingdom
Denmark
Portugal
Germany
France
Norway
New Zealand
Australia
Austria
Greece
Canada
Japan
Spain
South Korea
Italy
United States
Turkey
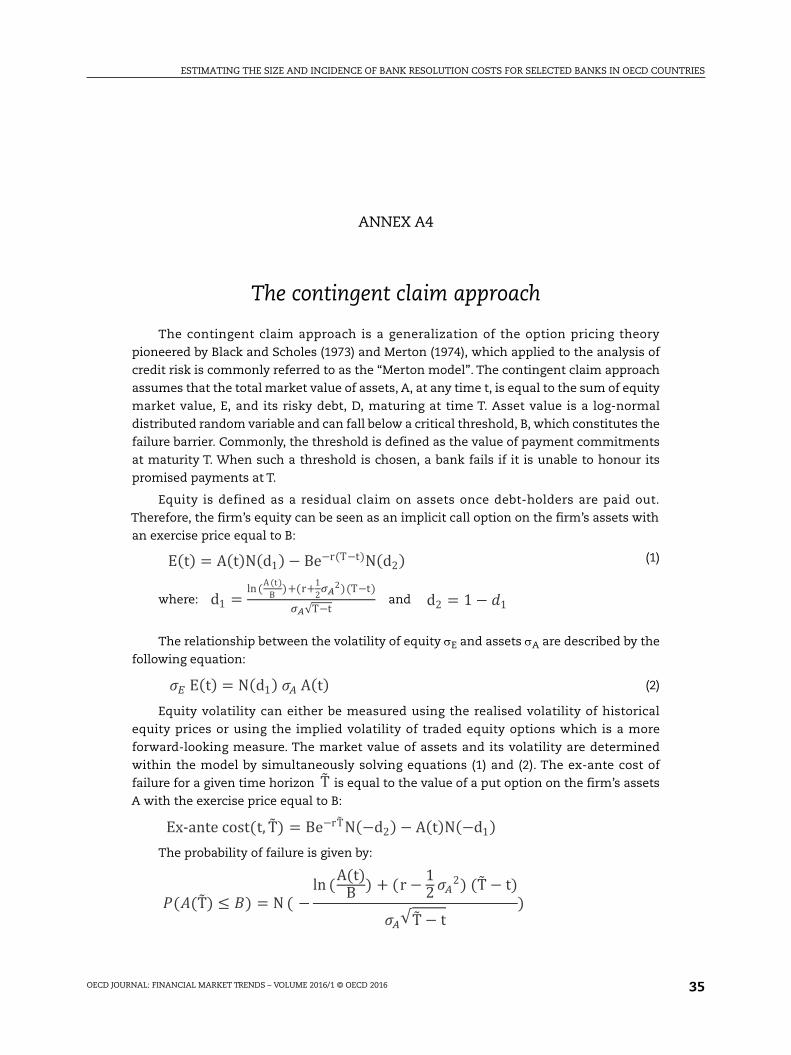
ESTIMATING THE SIZE AND INCIDENCE OF BANK RESOLUTION COSTS FOR SELECTED BANKS IN OECD COUNTRIES
OECD JOURNAL: FINANCIAL MARKET TRENDS – VOLUME 2016/1 © OECD 2016 35
ANNEX A4
The contingent claim approach
The contingent claim approach is a generalization of the option pricing theory
pioneered by Black and Scholes (1973) and Merton (1974), which applied to the analysis of
credit risk is commonly referred to as the “Merton model”. The contingent claim approach
assumes that the total market value of assets, A, at any time t, is equal to the sum of equity
market value, E, and its risky debt, D, maturing at time T. Asset value is a log-normal
distributed random variable and can fall below a critical threshold, B, which constitutes the
failure barrier. Commonly, the threshold is defined as the value of payment commitments
at maturity T. When such a threshold is chosen, a bank fails if it is unable to honour its
promised payments at T.
Equity is defined as a residual claim on assets once debt-holders are paid out.
Therefore, the firm’s equity can be seen as an implicit call option on the firm’s assets with
an exercise price equal to B:
(1)
where: and
The relationship between the volatility of equity E and assets A are described by the
following equation:
(2)
Equity volatility can either be measured using the realised volatility of historical
equity prices or using the implied volatility of traded equity options which is a more
forward-looking measure. The market value of assets and its volatility are determined
within the model by simultaneously solving equations (1) and (2). The ex-ante cost of
failure for a given time horizon is equal to the value of a put option on the firm’s assets
A with the exercise price equal to B:
The probability of failure is given by:
E(t) = A(t)N(d1) Be r(T t)N(d2)
d1 =ln(
A(t)
B)+(r+
1
22)(T t)
T td2 = 1 1
E(t) = N(d1) A(t)
T
Ex-antecost(t, T) = Be rTN( d2) A(t)N( d1)
( (T) ) = N (ln (
A(t)B) + (r
12
2) (T t)
T t)

ESTIMATING THE SIZE AND INCIDENCE OF BANK RESOLUTION COSTS FOR SELECTED BANKS IN OECD COUNTRIES
OECD JOURNAL: FINANCIAL MARKET TRENDS – VOLUME 2016/1 © OECD 201636
Given the ex-ante cost and the probability of failure, the ex-post must be equal to the
following:
Note that the specification in the basic model described above does not account for
skewness and kurtosis of equity returns. These shortcomings of the Merton model can be
addressed in several ways. In the analysis of the Swedish bank sector presented in the
main text (Section V), this is done by using the observed volatility smile.
Ex-postcost(t, T) =Ex-antecost(t, T)
( (T) )
From:OECD Journal: Financial Market Trends
Access the journal at:http://dx.doi.org/10.1787/19952872
Please cite this article as:
Blix Grimaldi, Marianna, et al. (2016), “Estimating the size and incidence of bank resolution costs forselected banks in OECD countries”, OECD Journal: Financial Market Trends, published online first.
DOI: http://dx.doi.org/10.1787/fmt-2016-5jlvbslktw7j
This work is published under the responsibility of the Secretary-General of the OECD. The opinions expressed and argumentsemployed herein do not necessarily reflect the official views of OECD member countries.
This document and any map included herein are without prejudice to the status of or sovereignty over any territory, to thedelimitation of international frontiers and boundaries and to the name of any territory, city or area.
You can copy, download or print OECD content for your own use, and you can include excerpts from OECD publications,databases and multimedia products in your own documents, presentations, blogs, websites and teaching materials, providedthat suitable acknowledgment of OECD as source and copyright owner is given. All requests for public or commercial use andtranslation rights should be submitted to [email protected]. Requests for permission to photocopy portions of this material forpublic or commercial use shall be addressed directly to the Copyright Clearance Center (CCC) at [email protected] or theCentre français d’exploitation du droit de copie (CFC) at [email protected].