Embed Size (px)
Citation preview
Please cite this paper as:
Moïsé, E. et al. (2013), “Estimating the Constraints toAgricultural Trade of Developing Countries”, OECD TradePolicy Papers, No. 142, OECD Publishing.http://dx.doi.org/10.1787/5k4c9kwfdx8r-en
OECD Trade Policy Papers No. 142
Estimating the Constraintsto Agricultural Trade ofDeveloping Countries
Evdokia Moïsé, Claire Delpeuch,Silvia Sorescu, Novella Bottini,Arthur Foch
JEL Classification: F13, O13, O19, Q17
OECD TRADE POLICY PAPERS
The OECD Trade Policy Paper series is designed to make available to a wide readership
selected studies by OECD staff or by outside consultants. This series continues that
originally entitled OECD Trade Policy Working Papers.
This document and any map included herein are without prejudice to the status of or
sovereignty over any territory, to the delimitation of international frontiers and boundaries
and to the name of any territory, city or area.
This document has been declassified on the responsibility of the Working Party of the
Trade Committee under the OECD reference number COM/DCD/TAD(2012)16/FINAL.
This document has been produced with the financial assistance of the European Union. The
views expressed therein can in no way be taken to reflect the official opinion of the
European Union.
Comments on the series are welcome and should be sent to [email protected].
OECD TRADE POLICY PAPERS
are published on www.oecd.org/trade
With the financial assistance of the European Union
© OECD (2013)
You can copy, download or print OECD content for your own use, and you can include excerpts from OECD publications, databases and multimedia products in your own documents, presentations, blogs, websites and teaching materials, provided that suitable acknowledgment of OECD as source and copyright owner is given. All requests for commercial use and translation rights should be submitted to [email protected].
Abstract
Estimating the Constraints to
Agricultural Trade of Developing Countries
Agricultural trade is widely considered as an important contributor to developing
countries‘ economic growth, poverty alleviation and food security. This report identifies and
analyses some of the most important supply-side constraints to developing countries‘ exports
of agricultural products, in order to inform prioritisation and sequencing of domestic policy
reforms as well as targeting of donor interventions. The analysis is supplemented by case
studies of Aid for Trade programmes supporting agricultural trade expansion in Indonesia,
Zambia and Mozambique. The report confirms that developing countries‘ agricultural exports
are highly responsive to the quality of transport and trade-related infrastructure, while tariffs
still have a significant negative impact. The analysis also highlights the importance of
complementary policies such as education and political stability on developing countries‘
agricultural trade performance. In the poorest countries of the sample, significant trade
expansion could be achieved by easing constraints related to governance and infrastructure
quality, as well as by lifting constraints related to the efficient use of existing freshwater
resources. The case studies illustrate the impact on agricultural exports of constraints related to
standards and conformity assessment or access to credit, in particular as regards small and
medium agricultural producers, processors and traders. They also show the contribution of
donor supported programmes promoting private sector initiatives to poverty reduction through
increased employment and the promotion of production adapted to local endowments.
Keywords: binding constraints; trade expansion; developing countries agricultural trade; aid
for trade; poverty reduction; food security.
JEL classification: F13, O13, O19, Q17
Acknowledgements
The report benefitted from discussions and comments at the September 2012 OECD joint
meeting on Aid for Trade of the Development Assistance Committee and the Working Party
of the Trade Committee, as well as at the November 2012 meeting of the OECD joint Working
Party on Agriculture and Trade. The analysis was undertaken with funding by the European
Union.
ESTIMATING THE CONSTRAINTS TO AGRICULTURAL TRADE OF DEVELOPING COUNTRIES – 3
OECD TRADE POLICY PAPER N°142 © OECD 2013
Table of contents
Executive Summary ........................................................................................................................... 5
I. Introduction .............................................................................................................................. 7
II. Estimating the impact of the various supply-side constraints to agricultural trade:
What kind of constraints restrict agricultural trade and why? ............................................... 10
II.a Productive capacity constraints .............................................................................................. 10 II.b Trade related constraints ........................................................................................................ 13 II.c Institutional and regulatory inefficiencies .............................................................................. 24 II.d. Complementary policies ........................................................................................................ 25
III. The link to poverty reduction and food security ..................................................................... 26
IV. An empirical assessment ......................................................................................................... 28
Model specification and econometric strategy .............................................................................. 28 Results for the ―developing countries only‖ specification ............................................................. 31 Comparative results for the ―full sample‖ ..................................................................................... 33 A more informative way of ranking constraints ............................................................................ 34
V. Case study – Indonesia: Addressing the challenges of standards
and conformity assessment .................................................................................................... 35
Background .................................................................................................................................... 36 The challenge of standards-related requirements .......................................................................... 38 Interventions by the government of Indonesia to address supply-side constraints
in the agro-food and fisheries export sectors ................................................................................. 43 Aid for Trade programmes targeting the agro-food and fisheries sectors in Indonesia ................. 45
VI. Case study – Zambia: Enhancing access to credit................................................................... 48
Background .................................................................................................................................... 48 Constraints and challenges of agricultural financing in Zambia.................................................... 49 Aid for Trade interventions ........................................................................................................... 53
VII. Case study – Mozambique: Improving the cashew value chain to reduce poverty................. 55
Background .................................................................................................................................... 55 Constraints and challenges in the cashew value chain ................................................................... 57 The road to recovery ...................................................................................................................... 58
VIII. Conclusion ......................................................................................................................... 61
References ........................................................................................................................................ 63
Annex 1. Model and estimation method ........................................................................................ 71 Annex 2. Variables specification and data sources ........................................................................ 74 Annex 3. Country coverage ........................................................................................................... 76 Annex 4. Sub-groups of developing countries ............................................................................... 79 Annex 5. Regression results........................................................................................................... 80 Annex 6. Robustness checks .......................................................................................................... 83

4 – ESTIMATING THE CONSTRAINTS TO AGRICULTURAL TRADE OF DEVELOPING COUNTRIES
OECD TRADE POLICY PAPER N°142 © OECD 2013
Tables
Table 1. The Maize market: from Techiman, Ghana to Ouagadougou
and Kantchari, Burkina Faso ............................................................................................ 14
Table 2. Effects of convergence from the poorest developing countries
to the better-off developing countries .............................................................................. 34
Table 3. Rejections of Indonesian Fishery Products in the European Union ................................. 44
Table 4. Impact of growth of cashew processing on smallholder producers ................................. 61
Table A3.1 Exporters in the ―developing countries only‖ sample ...................................................... 76
Table A3.2 Exporters in the ―full sample‖ .......................................................................................... 77
Table A3.3 Importers .......................................................................................................................... 78
Table A4.1 Poorest and better-off developing countries..................................................................... 79
Table A5.1 Regression outputs for the ―developing countries only‖ sample ..................................... 80
Table A5.2. Regression outputs for the ―full sample ........................................................................... 81
Table A6.1. Regression outputs for the ―developing countries only‖ sample
(with constraints on the MR terms) .................................................................................. 83
Table A6.2. Regression outputs for the ―developing countries only‖ sample
(with MR terms for other trade costs variables) ............................................................... 84
Table A6.3. Regression outputs for the two steps gravity ................................................................... 85
Figures
Figure 1. The Aid for Trade Agenda ................................................................................................. 8
Figure 2. Indonesia‘s total agro-food exports by region.................................................................. 37
Figure 3. Percentage of Zambian MSMEs that use banking services,
services from informal and formal providers and that do not use any services ............... 50
Figure 4. Percentage of MSMEs and of large enterprises using various types
of financial services in Zambia ....................................................................................... 51
Boxes
Box 1. The particular case of organic products ........................................................................... 40
ESTIMATING THE CONSTRAINTS TO AGRICULTURAL TRADE OF DEVELOPING COUNTRIES – 5
OECD TRADE POLICY PAPER N°142 © OECD 2013
Executive Summary
Trade can be a powerful engine for economic growth, poverty reduction, and
development. However, harnessing that power is often difficult for developing countries,
particularly the least developed ones, notably because of domestic supply-side constraints
such as lack of trade-related infrastructure and obstacles restraining their productive
capacity. As trade-related needs of developing countries are numerous, while political
impetus and financial resources are scarce, prioritisation is crucial to sequence trade reforms
and to guide aid-for-trade interventions.
This report identifies and analyses some of the most important supply-side factors
constraining developing countries‘ agricultural exports in order to inform prioritisation and
sequencing of domestic policy reforms as well as targeting of donor interventions. It follows
past OECD work under the Aid for Trade Initiative to understand, identify and quantify
constraints to trade expansion in developing countries.
The paper reviews potential constraints to agricultural trade as highlighted in economic
literature. Next it presents a quantitative analysis of the impact of potential supply-side
constraints to developing countries‘ exports of agricultural products. Using a cross-sectional
gravity model, trade is regressed on the various trade impediments typically introduced in
such models, augmented with a set of possible supply-side constraints to agricultural trade
identified in literature. The latter include productive capacity constraints related to access to
agricultural inputs and electricity, and trade-specific constraints, such as tariffs or transport
and logistics quality. The model also controls for elements of comparative advantage –
arable land and water resources – as well as complementary policies, including institutional
and governance issues. The insights of this econometric exercise are supplemented by three
case studies of Aid for Trade programmes supporting agricultural trade expansion in
Indonesia, Zambia and Mozambique. The case studies aim to add to the quantitative
evidence by highlighting the importance of some variables that could not be captured in the
quantitative exercise because of data limitations.
The report confirms that some of the insights of previous work on constraints to overall
trade performance (Hallaert et al., 2011, Estimating the Constraints to Trade of Developing
Countries) are equally valid in the case of agricultural trade, but also identifies a number of
specific obstacles to this sector.
According to the quantitative analysis, developing countries‘ agricultural exports are
highly responsive to the quality of transport and trade-related infrastructure. A 10%
improvement in the transport and trade-related infrastructure quality has the potential
of increasing developing countries agricultural exports by 30%. This finding
confirms a large body of literature which highlights the impact of efficient and
accessible transport on countries‘ capacity to explore market access opportunities for
their agricultural products.
Tariffs are found to have a significant negative impact on agricultural trade. On
average, a reduction of tariffs by 10% would increase trade value by about 3.7%.
In line with evidence from the literature, the analysis also highlights the importance
of complementary policies such as education and political stability. A 10%
improvement in the secondary education enrolment rate would generate a 7.2%
6 – ESTIMATING THE CONSTRAINTS TO AGRICULTURAL TRADE OF DEVELOPING COUNTRIES
OECD TRADE POLICY PAPER N°142 © OECD 2013
increase in agricultural trade value. Aid interventions aiming at upgrading skills
could contribute to agricultural modernisation and improve the market participation
of smallholders.
Focusing on the poorest countries in the sample, it appears that significant trade
expansion could be achieved by easing constraints related to governance and
infrastructure quality. Agricultural exports of these countries could more than double
if political stability or the quality of infrastructure were brought to the level observed
in the richest developing countries.
In addition, important gains in these countries can also be obtained from lifting
constraints related to freshwater availability. This is because poor countries lag far
behind better off developing countries in this respect. While not much can be done
with respect to water availability, nor is it desirable to distort resource allocation by
subsidising water consumption, this suggests an important role for aid for trade in
terms of helping address the regulatory and infrastructure burdens that prevent a
more efficient use of existing water resources. Such efficiency gains could in
addition enable greater participation of the private sector in irrigation systems. Thus,
while infrastructure often attracts the largest amounts of aid for trade, this finding
emphasises the importance of alleviating bottlenecks in other areas.
Although data limitations have not allowed for assessing the impact of all trade
cost-related constraints, such as standards and conformity assessment or access to
credit, case studies illustrate how strongly these constraints affect the agricultural
trade performance of developing countries, in particular as regards small and
medium agricultural producers, processors and traders. In the case of standards and
conformity assessment, the wide range of actions necessary to upgrade efficiently
implementation, monitoring and certification capacities is difficult to bring to
fruition without long-term commitment and extensive planning. Satisfactory access
to finance appears as a prerequisite not only for undertaking export activities but also
for addressing a number of productive capacity constraints that limit agricultural
growth.
Finally, case studies have illustrated how donor supported programmes promoting
private sector initiatives can make a significant contribution to poverty reduction
through increased employment and the promotion of production adapted to local
endowments.
The exercise conducted in this report is of course not sufficient in itself to direct aid
flows or prioritise domestic reforms. Policy conclusions for aid for trade investments
should be drawn by comparing these outcomes with the cost and feasibility of lifting
the different constraints identified. Serious preparatory field work to identify the
most relevant, country-specific approach to building supply, production and
marketing capacities is thus paramount to the success of such endeavours.
ESTIMATING THE CONSTRAINTS TO AGRICULTURAL TRADE OF DEVELOPING COUNTRIES – 7
OECD TRADE POLICY PAPER N°142 © OECD 2013
I. Introduction
Trade can be a powerful engine for economic growth, poverty reduction, and
development. However, harnessing that power is often difficult for developing countries,
particularly the least developed ones, mainly because of domestic supply-side constraints
such as lack of trade-related infrastructure and obstacles restraining their productive
capacity. The Trade Committee (TC) and Development Assistance Committee (DAC) work
under the Aid-for-Trade Initiative has been successful in drawing attention to the importance
of addressing supply-side constraints to trade and development. Over the last three years, a
series of reports have highlighted the importance of prioritising trade-related needs, which
compete for political momentum and scarce financial resources, in accordance with country
specificities. These reports sought to better understand, identify and quantify the constraints
to trade expansion in partner countries; emphasised the importance of complementary
policies in maximising the impact of trade policy reforms on trade and economic growth;
and discussed how Aid for Trade, together with pro-active policy reform and government
action, can help relax the constraints that prevent developing countries from improving trade
performance and benefitting from the global marketplace.1
More specifically, the report ―Binding Constraints to Trade Expansion‖ shows that
trade-related needs of developing countries are numerous, while political impetus and
financial resources are scarce and may not be available consistently over time. Furthermore,
proper sequencing is needed to ensure front-loading of some prerequisite actions without
which other reforms are bound to fail. Prioritisation is therefore crucial to sequence trade
reforms2 and to guide aid-for-trade interventions. In order to identify which needs should be
tackled first, so as to match concerned countries‘ specific circumstances in accordance with
the call by WTO DG Lamy3, the report proposed to adapt the growth diagnostics procedure
developed by Haussmann et al. (2005) to trade expansion. The report ―Increasing the Impact
of Trade Expansion on Growth‖ argues that Aid for Trade should go beyond support to trade
expansion, but also help developing countries address the constraints that prevent trade
opportunities from translating into economic growth. It shows that most but not all trade
reforms had a positive impact on economic growth, often for lack of compatible policies that
would make trade reform sustainable, or of complementary policies that would increase the
growth impact of trade expansion. Finally, the report ―Estimating the Constraints to Trade of
Developing Countries‖ sought to identify the most important supply-side constraints to trade
expansion and estimate their relative severity for trade and economic growth.
1. ―Binding Constraints to Trade Expansion: Aid for Trade Objectives and Diagnostics‖, OECD Trade
Policy Working Paper No. 94; ―Increasing the Impact of Trade Expansion on Growth: Lessons from
Trade Reforms for the Design of Aid for Trade‖, OECD Trade Policy Working Paper No. 100; and
―Estimating the Constraints to Trade of Developing Countries‖, OECD Trade Policy Working Paper
No. 116.
2. In this report, ―trade reform‖ is defined as encompassing all reforms and measures that affect the
tradable sector. This approach is consistent with the recommendations of the Task Force on Aid for
Trade (WTO, 2006): ―the scope of Aid for Trade should be defined in a way that is […] broad enough
to reflect the diverse trade needs identified by countries‖.
3. As highlighted by the Second Global Review of Aid for Trade held in 2009. WTO Director General
Lamy (2009) stressed: ―We also learnt that Aid for Trade needs to factor in specificities; for example,
those of middle-income countries and the types of financing available to them; or those of landlocked
countries, small economies, remote islands or countries emerging out of conflict.‖
8 – ESTIMATING THE CONSTRAINTS TO AGRICULTURAL TRADE OF DEVELOPING COUNTRIES
OECD TRADE POLICY PAPER N°142 © OECD 2013
The present report seeks to deepen the analysis of constraints to trade expansion by
introducing a sectoral focus: the question here is to identify and analyse the most important
supply-side constraints inhibiting developing countries‘ performance in agricultural exports
in order to inform the potential contribution of aid for trade in supporting agricultural trade.
The report uses the term ―supply-side‖ constraints by contrast to ―market access‖ constraints
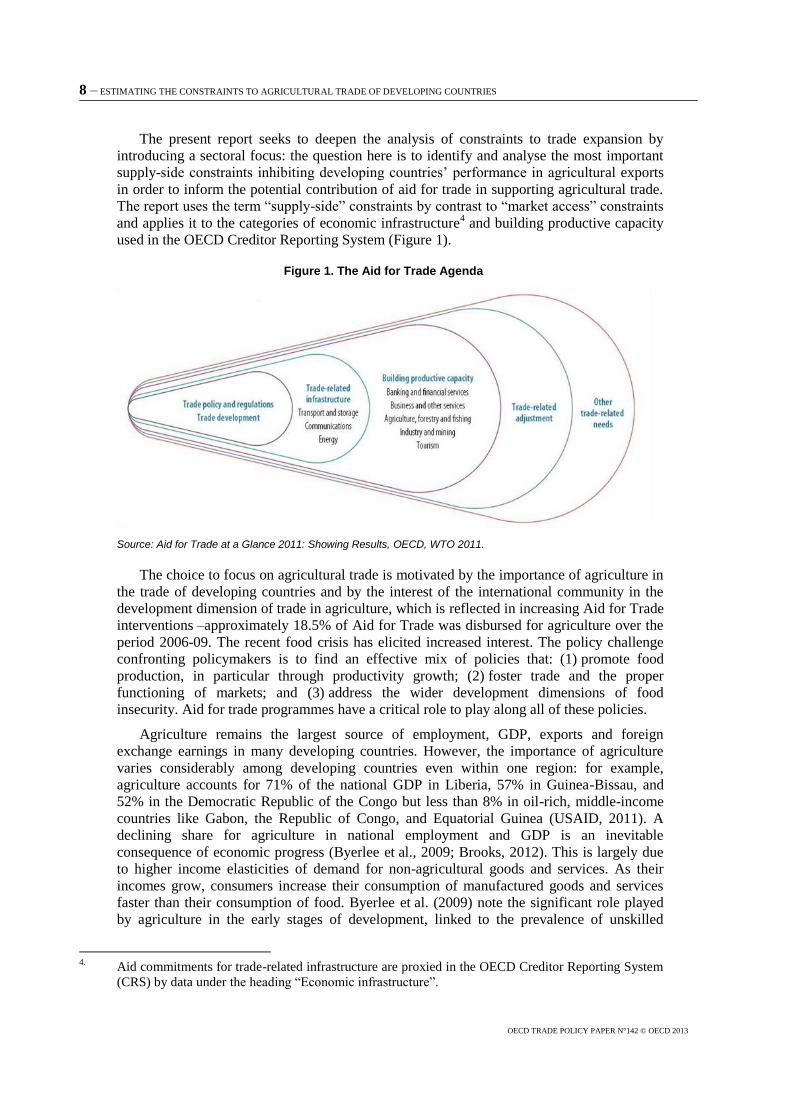
and applies it to the categories of economic infrastructure4 and building productive capacity
used in the OECD Creditor Reporting System (Figure 1).
Figure 1. The Aid for Trade Agenda
Source: Aid for Trade at a Glance 2011: Showing Results, OECD, WTO 2011.
The choice to focus on agricultural trade is motivated by the importance of agriculture in
the trade of developing countries and by the interest of the international community in the
development dimension of trade in agriculture, which is reflected in increasing Aid for Trade
interventions –approximately 18.5% of Aid for Trade was disbursed for agriculture over the
period 2006-09. The recent food crisis has elicited increased interest. The policy challenge
confronting policymakers is to find an effective mix of policies that: (1) promote food
production, in particular through productivity growth; (2) foster trade and the proper
functioning of markets; and (3) address the wider development dimensions of food
insecurity. Aid for trade programmes have a critical role to play along all of these policies.
Agriculture remains the largest source of employment, GDP, exports and foreign
exchange earnings in many developing countries. However, the importance of agriculture
varies considerably among developing countries even within one region: for example,
agriculture accounts for 71% of the national GDP in Liberia, 57% in Guinea-Bissau, and
52% in the Democratic Republic of the Congo but less than 8% in oil-rich, middle-income
countries like Gabon, the Republic of Congo, and Equatorial Guinea (USAID, 2011). A
declining share for agriculture in national employment and GDP is an inevitable
consequence of economic progress (Byerlee et al., 2009; Brooks, 2012). This is largely due
to higher income elasticities of demand for non-agricultural goods and services. As their
incomes grow, consumers increase their consumption of manufactured goods and services
faster than their consumption of food. Byerlee et al. (2009) note the significant role played
by agriculture in the early stages of development, linked to the prevalence of unskilled
4.
Aid commitments for trade-related infrastructure are proxied in the OECD Creditor Reporting System
(CRS) by data under the heading ―Economic infrastructure‖.
ESTIMATING THE CONSTRAINTS TO AGRICULTURAL TRADE OF DEVELOPING COUNTRIES – 9
OECD TRADE POLICY PAPER N°142 © OECD 2013
labour and the fact that the weak business climate in terms of infrastructure (roads,
electricity, communications) and institutions (legal, financial, regulatory) constrains private
investments in the formal manufacturing and services industries. Brooks (2012) highlights
the importance of choosing the appropriate mix of agricultural and non-agricultural policy
instruments, in order to achieve satisfactory rural development. On the other hand, business
climate and institutional constraints may not only influence the capacity of developing
countries to evolve into a more balanced mix of agricultural, manufacturing and services
activities, but also restrain the trade expansion of the agricultural sector, and this will be the
focus of this paper.
While agriculture declines relative to other sectors as incomes per capita improve in a
growing economy, growth in agriculture has a disproportionate effect on poverty. According
to the World Bank‘s World Development Report 2008 on Agriculture for Development, 70%
of poor people live in rural areas and are dependent on agriculture for their living. An
estimated 2.5 billion persons depend on this activity worldwide. Cervantes-Godoy and
Dewbre (2010), seeking to identify shared characteristics among developing countries that
had been particularly successful in reducing extreme poverty over the last twenty to twenty-
five years, find that, while economic growth in general was a necessary pre-condition and an
important contributor to poverty reduction, agricultural growth had played the most
important role in the majority of the reviewed countries. Brooks (2012) highlights the
contribution of agricultural growth in reducing poverty in particular through smallholder
development.
The primary objective of the present report is to identify the most important supply-side
constraints to agricultural export expansion in developing countries. The core of the analysis
rests on a cross-sectional gravity model, in which trade is regressed on various trade
impediments identified in the literature, such as different measures of physical, cultural and
administrative distance, augmented with a set of possible supply-side constraints to
agricultural trade, as reviewed in the following Section II. In addition, the model controls for
the impact of market-access constraints, a number of comparative advantage elements, and
complementary policies.
The insights of the econometric work are supplemented by three case studies aiming at
supplementing the econometric evidence and highlighting the importance of some variables
that the quantitative work could not capture because of data limitations.
The remainder of the paper is organised as follows. Section II reviews potential
constraints to agricultural trade as they appear in the economic literature. Section III
reviews the links between agricultural trade and poverty reduction and food security.
Section IV presents the econometric strategy, discusses data issues and analyses the results
highlighting the most important supply-side constraints to agricultural exports. Sections V
to VII present country case studies illustrating the mechanisms highlighted by the
econometric work and the importance of some variables that the econometric work could
not capture because of data limitations. Section VIII concludes.
10 – ESTIMATING THE CONSTRAINTS TO AGRICULTURAL TRADE OF DEVELOPING COUNTRIES
OECD TRADE POLICY PAPER N°142 © OECD 2013
II. Estimating the impact of the various supply-side constraints to agricultural
trade: What kind of constraints restrict agricultural trade and why?
The potential contribution of aid in supporting trade in agriculture and fostering food
security goes well beyond direct support to the agricultural sector and to agricultural
policies. It can also help by supporting trade policy and regulation, and trade development
(GTZ, 2010). Support to trade policy and regulation can be channeled to developing the
capacity of public and private stakeholders at national and regional levels; supporting the
adoption, where appropriate, of international standards as a basis of domestic regulation, as
well as the regional harmonisation of standards and quality assurance systems which best
reflect the specific climatic, geographical and technological circumstances in the concerned
countries; and reducing trade barriers that affect regional as well as international agricultural
trade and exacerbate informal trade (Lesser and Moïsé, 2009).
Trade development can also be supported through the promotion of market information
systems; the enhancement of agricultural services and accessibility of inputs at the national
level, as well as the regional level where such services are not affordable or viable
nationally; and practical trade promotion measures, such as marketing structures and
initiatives. Within this large range of possible activities and reforms, the quantification of the
effect of various supply-side constraints to developing countries‘ agricultural trade can offer
useful insights for the prioritisation of aid for trade actions and for supporting the dialogue
between donor and recipient countries.
The array of potential constraints to agricultural trade in developing countries to be
investigated in this report was identified taking into consideration the following:
the initial list of constraints to overall trade, highlighted in the paper ―Estimating the
constraints to trade of developing countries‖ (Hallaert, Cavazos Cepeda and Kang,
2011), including complementary policies related to governance and education;
the possible supply-side constraints specific to the agricultural sector in developing
countries; and
trade policy issues specific to agricultural trade, such as tariffs as well as the
non-tariff measures applied to agricultural products.
What follows therefore attempts to cover what is known on potential supply-side
constraints to agricultural trade, which can be broadly divided into productive capacity
constraints related to the access to agricultural inputs or electricity, and trade-related
constraints, such as transport and logistics quality or trade facilitation. The impact of trade
policy aspects (tariffs and non-tariff measures) and complementary policies, such as
governance issues or education on agricultural trade of developing countries5 is also
investigated.
II.a Productive capacity constraints
The capacity of developing countries to expand agricultural trade is first of all related to
their ability to produce and thus to factors affecting agricultural productivity. While the
agricultural supply capacity of a country is first of all determined by comparative advantage
factors, such as rural labour and machinery, arable land or fresh water availability which are
not amenable to aid interventions, productive capacity is often significantly restricted by a
5. Note, however, that all the variables reviewed in Section II have not been included in the quantitative
analysis because of data availability issues.
ESTIMATING THE CONSTRAINTS TO AGRICULTURAL TRADE OF DEVELOPING COUNTRIES – 11
OECD TRADE POLICY PAPER N°142 © OECD 2013
number of constraints which can and should be addressed by policy and aid interventions.
Institutional and regulatory issues as well as lack of infrastructure indeed often result in
sub-optimal access to agricultural inputs, such as fertilisers and improved seeds, modern
machinery, adequate irrigation systems and energy, appropriate storage capacity, or
agricultural extension services. The 2012 Interagency Report to the Mexican G20 Presidency
(G20, 2012) estimates that ―a successful strategy for sustainable agricultural productivity
growth requires significant improvements in macroeconomic, structural and agricultural
policies and institutions to provide the necessary incentives to farmers and the private sector
to increase investments”. Azam et al. (2012) find that in Cambodia capital endowment
variables, such as land per worker and ownership of agricultural implements play an
important role in generating food surpluses that can then be marketed, but so does the
possibility to prove land ownership through a title, in particular for smallholders. Brambilla
and Porto (2011) illustrate in rural Zambia the importance of access to and use of improved
inputs (including higher yield seeds and more effective pesticides and fertilisers),
agricultural extension services6, and access to credit, which would allow farmers to better
combine factors of production and boost farm output.7 Similarly, poor access to, and
application of agricultural inputs often due to credit access limitations are shown by the West
Africa Trade Hub to have an important impact on yield and export potential8 (USAID
WATH 2011). Along the same lines, Nin-Pratt (2009) estimates that addressing agricultural
productivity factors, such as access to higher yielding seeds, fertilisers, equipment and
knowledge would allow West African countries to increase agricultural productivity for rice
by a factor of 2, for cotton by 2.6, for maize and coarse grain by 3, and for other crops by as
much as 10 to 50%.
Energy is also an important input for agricultural production, processing and marketing,
even if agriculture is not the predominant user of energy in developing countries. Utz (2011)
highlights that the direct energy use in agricultural production (i.e. energy for primary
production, such as land preparation, cultivation, irrigation, harvest, post harvest and storage,
excluding the energy required for transformation / processing, commercialisation and
transport by agro-industries) accounts for only 4 to 8% of total final energy demand
nationally in developing countries (compared to an even smaller proportion of around 3 to
5% in OECD countries). However, energy appears as a key driver for increasing productivity
and modernising agricultural production. It is often a critical requirement for mechanical
energy, irrigation pumps, post harvest cooling, modern drying, milling or pressing, or
indirectly for the production of fertilisers and agrochemicals. Hallaert et al. (2011) find that
electricity appears to be the main constraint to developing countries‘ trade expansion. The
constraint, which refers to all sectors, including manufacturing trade, is more related to the
reliability of electricity supply than to its availability. This finding is further corroborated by
Ferro et al. (2011), who estimate that a 10% increase in aid targeting energy could increase
manufacturing exports by 6.8%.
6. Agricultural extension services are defined as systems that should facilitate the access of farmers, their
organisations and other market actors to knowledge, information and technologies; facilitate their
interaction with partners in research, education, agri-business, and other relevant institutions; and
assist them to develop their own technical, organisational and management skills and practices
(Christoplos, 2010).
7. According to the authors, cotton marketing reforms in the country allowed yields per hectare to
increase by 14.1%.
8. WATH used isoprice maps, which provide images depicting the special distribution of commodity
prices and allow an assessment of the degree to which transaction costs between markets suppress the
flow of commodities from surplus to deficit areas.
12 – ESTIMATING THE CONSTRAINTS TO AGRICULTURAL TRADE OF DEVELOPING COUNTRIES
OECD TRADE POLICY PAPER N°142 © OECD 2013
Mechanical, electrical and thermal energy shortages in many developing countries
restrict agricultural production, processing and marketing by exacerbating reliance on human
and animal sources of energy inputs, or by preventing the development of needed irrigation
schemes, storage and refrigeration capacity and processing services. Sims and Kienzle
(2006) show that a typical farm family relying on human power can only cultivate
1.5 hectares per year, 4 hectares if animal power is available and over 8 hectares supported
by tractor power. The shortage of cold and dry storage facilities is partially responsible for
high post-harvest losses related to spoilage, together with low quality packing and inefficient
handling and transport. USAID (2011) estimates that post-harvest losses related to poor
storage9 represent approximately 20% of market logistics costs and more than 85% of
avoidable market costs in West Africa. The lack of high-quality warehousing limits bulking
which would enable contracts with larger buyers and improve negotiating capacity.
However, controlled temperature storage is among the most energy-intensive activities in the
agro-food industry. In many rural areas reliable connection to the national grid is
economically and logistically unfeasible, so that farmers need to resort to decentralised
power production, based on renewable energy, fossil fuel or hybrid systems. Rising energy
prices have a significant impact on production costs.
Access to water is also a major determinant of land productivity, and irrigated land
productivity is more than double that of rain-fed land (Utz, 2011). This is both a matter of
increasing agricultural yields during the main harvest season and through improved
possibilities for year-round cultivation, but also opening up previously barren lands for
cultivation. Access to irrigation reduces the risk of crop failure, encouraging the adoption of
higher-yielding varieties of food crops, diversification into higher-value cash crops,
application of fertilisers and pest management, and intensification of farm labour and
practices (Van Koppen et al., 2005). According to the World Development Report 2008
(World Bank, 2007), irrigated land does not exceed 4% of total agricultural land in
Sub-Saharan Africa, compared with 29% in East Asia and 39% in South Asia. In areas where
farmers mostly rely on rain-fed agriculture, water availability is one of the most binding
constraints on agricultural production. Azam et al. (2012) indicate that actions to intensify
cropping patterns through irrigation during the dry season could greatly improve market
participation and commercialisation by smallholders in Cambodia. Fresh water resources
may be adequate in particular regions, but a number of regulatory and infrastructure
impediments often obstruct their use for productive purposes. For example, fresh water
resources, including local groundwater or surface water are often transboundary, so that their
management is seriously hampered by the lack of coordinated regional strategies (Nin-Pratt
et al., 2009).
Finally, limited organisational capacity and lack of critical mass appears as an important
constraint (USAID WATH 2011). In developing countries, markets for agricultural inputs
and outputs, finance and other services, are often poorly developed, with small volumes
traded, prone to large seasonal variability in demand and supply and significant difficulties
in enforcing interpersonal contracts (Poulton et al., 2006). Smallholders also face
considerable difficulties acquiring skills, including with respect to basic hygiene standards,
merchandising, sampling or promotion techniques. Small operators cannot meet the size of
orders or quality requirements from big buyers and often fail to cooperate efficiently so as to
accumulate large quantities of agricultural commodities and move them efficiently to final
demand markets. The absence of trade and producer organisations limits smallholders‘
9. i.e. storage lacking properly designed granaries with cement floors, controlled air flows, limited
access to vermin, proper preservation techniques such as sacks stacked off the floor on palettes and
regular use of pesticides and fungicides.
ESTIMATING THE CONSTRAINTS TO AGRICULTURAL TRADE OF DEVELOPING COUNTRIES – 13
OECD TRADE POLICY PAPER N°142 © OECD 2013
bargaining power, weakens the horizontal and vertical integration of value chains and
hinders the potential development of sustainable and efficient commercially oriented
production and trade. The fact that a succession of small traders take limited amounts of
cereals one small step at a time along the value chain, rather than from the farm gate directly
to the consumption market, adds costs at each stage, through handling, repackaging and
intermediaries‘ profit margins. The inability to supply consistent amounts of product finally
results in uncompetitive, expensive and under-capacity processing as much as the lack of
access to affordable processing equipment.
II.b Trade related constraints
The importance of barriers other than tariffs is well established in the economic
literature. However, the specificity of the agricultural sector, where, for example, tariffs are
greater than in the manufactured goods sector (Hoekman and Nicita, 2011) and where
tariff-rate quotas and other market interventions further complicate the policy picture (Orden
et al., 2012), suggests that the respective severity of different sources of trade costs might
differ from what Hallaert et al. (2011) found as regards overall trade expansion10
.
The effect of different types of NTMs on food staples has been quantified by Cadot and
Gourdon (2012). The authors calculated the effects of NTMs on 5000 different food staples
in 30 African countries, using World Bank, UNCTAD and African Development Bank data,
coded according to the 2009 MAST nomenclature.11
They find that, while quantitative
restrictions and prohibitions have receded, TBT and SPS measures are on the rise and do not
correspond to local monitoring and testing capabilities. SPS measures would, on average,
raise the price of food staples by anything between 12 and 25%, depending on the estimation
method, and quantitative restrictions, where they are applied, add another 19%. The authors
suggest that product-specific effects of SPS regulations can add up to 42% on rice import
prices in Kenya, or 29% on edible oil import prices in Uganda. Such price increases have
the potential to affect significantly the real income of poor households and limit trade and
consumption volumes. Brenton et al. (World Bank, 2012) estimate that various NTM factors
constraining East-African agricultural trade, combined with significant post-harvest losses,
count for the major part of the consumer price, typically leaving less than 20% in the hands
of African smallholder farmers.
In West Africa, USAID (2011) considers that if transaction costs affecting agricultural
products were reduced by 10% of the farm gate price, production and the real income of
farmers would each increase by 4%, while consumer food prices would fall by 8%. USAID‘s
Agribusiness and Trade Promotion (ATP) project in West Africa estimates that transport and
logistics account for approximately 59% and 18% of the end market price for maize and
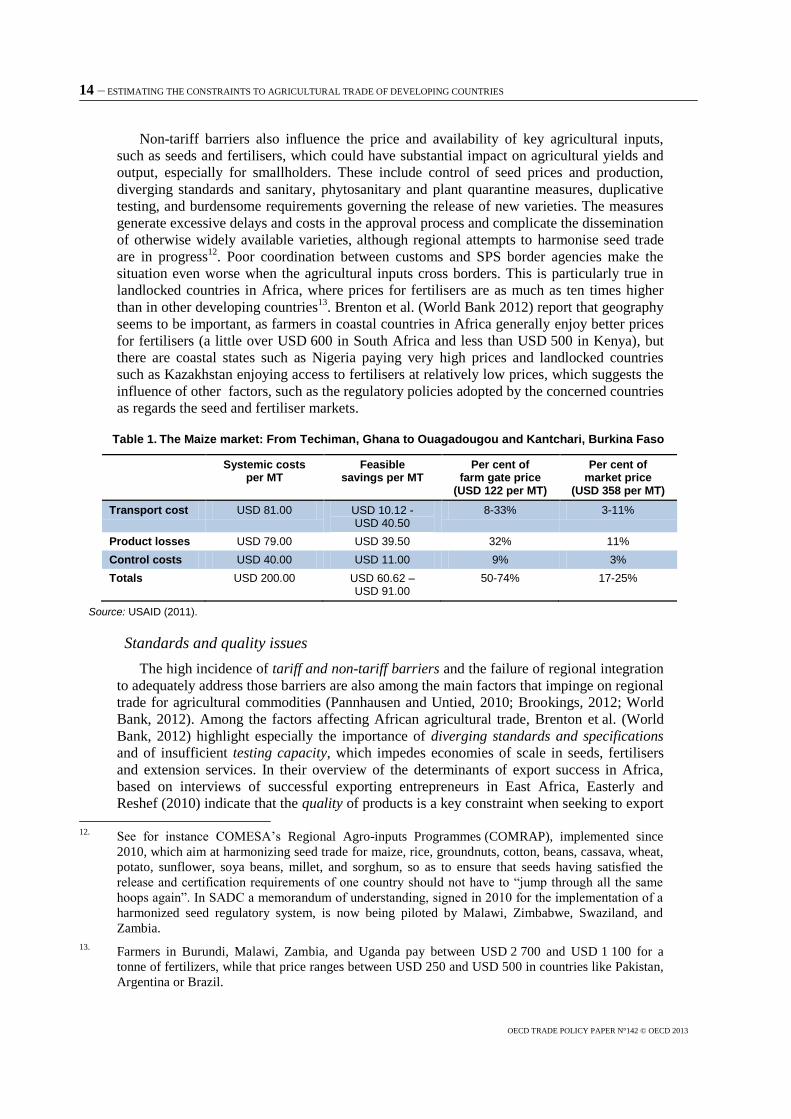
livestock respectively. According to ATP research (Table 1), direct transport costs accounted
for USD 81 per metric tonne (MT) of maize, while product losses due to storage and
handling problems between the farm and the end market added another USD 79 per MT.
Finally, control procedures, including the acquisition of SPS certificates or paying bribes at
the border was estimated at USD 40 per MT of maize.
10.
According to Hallaert et al. (2011), electricity availability appears to be the main constraint to trade
expansion of developing countries, followed by transportation problems and access to credit.
11. UNCTAD‘s Multi-Agency Support Team. The authors run regressions of country-level product prices
on binary variables marking the application of various types of NTMs, using a panel of 1 260
country-product pairs. Interaction terms between NTMs and either region or country dummies provide
tentative estimates of their price-raising effect in Africa or in specific countries.
14 – ESTIMATING THE CONSTRAINTS TO AGRICULTURAL TRADE OF DEVELOPING COUNTRIES
OECD TRADE POLICY PAPER N°142 © OECD 2013
Non-tariff barriers also influence the price and availability of key agricultural inputs,
such as seeds and fertilisers, which could have substantial impact on agricultural yields and
output, especially for smallholders. These include control of seed prices and production,
diverging standards and sanitary, phytosanitary and plant quarantine measures, duplicative
testing, and burdensome requirements governing the release of new varieties. The measures
generate excessive delays and costs in the approval process and complicate the dissemination
of otherwise widely available varieties, although regional attempts to harmonise seed trade
are in progress12
. Poor coordination between customs and SPS border agencies make the
situation even worse when the agricultural inputs cross borders. This is particularly true in
landlocked countries in Africa, where prices for fertilisers are as much as ten times higher
than in other developing countries13
. Brenton et al. (World Bank 2012) report that geography
seems to be important, as farmers in coastal countries in Africa generally enjoy better prices
for fertilisers (a little over USD 600 in South Africa and less than USD 500 in Kenya), but
there are coastal states such as Nigeria paying very high prices and landlocked countries
such as Kazakhstan enjoying access to fertilisers at relatively low prices, which suggests the
influence of other factors, such as the regulatory policies adopted by the concerned countries
as regards the seed and fertiliser markets.
Table 1. The Maize market: From Techiman, Ghana to Ouagadougou and Kantchari, Burkina Faso
Systemic costs per MT
Feasible savings per MT
Per cent of farm gate price
(USD 122 per MT)
Per cent of market price
(USD 358 per MT)
Transport cost USD 81.00 USD 10.12 - USD 40.50
8-33% 3-11%
Product losses USD 79.00 USD 39.50 32% 11%
Control costs USD 40.00 USD 11.00 9% 3%
Totals USD 200.00 USD 60.62 –USD 91.00
50-74% 17-25%
Source: USAID (2011).
Standards and quality issues
The high incidence of tariff and non-tariff barriers and the failure of regional integration
to adequately address those barriers are also among the main factors that impinge on regional
trade for agricultural commodities (Pannhausen and Untied, 2010; Brookings, 2012; World
Bank, 2012). Among the factors affecting African agricultural trade, Brenton et al. (World
Bank, 2012) highlight especially the importance of diverging standards and specifications
and of insufficient testing capacity, which impedes economies of scale in seeds, fertilisers
and extension services. In their overview of the determinants of export success in Africa,
based on interviews of successful exporting entrepreneurs in East Africa, Easterly and
Reshef (2010) indicate that the quality of products is a key constraint when seeking to export
12.
See for instance COMESA‘s Regional Agro-inputs Programmes (COMRAP), implemented since
2010, which aim at harmonizing seed trade for maize, rice, groundnuts, cotton, beans, cassava, wheat,
potato, sunflower, soya beans, millet, and sorghum, so as to ensure that seeds having satisfied the
release and certification requirements of one country should not have to ―jump through all the same
hoops again‖. In SADC a memorandum of understanding, signed in 2010 for the implementation of a
harmonized seed regulatory system, is now being piloted by Malawi, Zimbabwe, Swaziland, and
Zambia.
13. Farmers in Burundi, Malawi, Zambia, and Uganda pay between USD 2 700 and USD 1 100 for a
tonne of fertilizers, while that price ranges between USD 250 and USD 500 in countries like Pakistan,
Argentina or Brazil.
ESTIMATING THE CONSTRAINTS TO AGRICULTURAL TRADE OF DEVELOPING COUNTRIES – 15
OECD TRADE POLICY PAPER N°142 © OECD 2013
to OECD markets, in particular the EU and US markets, more than trade costs, which seem
to matter more when exporting regionally. This is also clearly highlighted in the case study
on Indonesia (Section V). Sellers do not try to develop a reputation for markets they perceive
as being less demanding. In some market segments the price differential between high
quality and low quality products14
does not seem sufficient to justify small traders‘
investment in becoming familiar with standards and certification and making use of national
public-sector laboratory testing and certification services. The varying quality of many
agricultural commodities often restricts commercial exchanges to strictly immediate
contacts, because of the lack of trust as to the quality shipped and pushes intermediaries to
inspect and re-pack consignments at each transfer stage. Furthermore, the perceived risk of
low-quality agro-food products exacerbates the shortage of formal credit in the sector.
Sanitary and phytosanitary (SPS), quality or environmental standards and their
enforcement at the border influence developing countries‘ agricultural trade not only as
regards the access of their products to regional and international markets but also the
availability of the necessary inputs to agricultural production. An effective standards system
would support the trade orientation of agricultural production by providing technical
reference and supporting claims for value addition. Such a system implies technical norms
and regulations which are both responsive to international demand and adapted to local
circumstances, but also sufficient capacity to ensure compliance with those norms and
regulations. In many developing countries relevant agencies lack adequate expertise and
equipment, both at the standard-setting and at the enforcement stage, including at the border.
They also lack clearly defined mandates, resulting in overlapping, uncoordinated activities,
for which existing resources are spread too thin, and generating confusion, delays and
duplicative expenses. As documented by Brenton et al. (World Bank 2012), capacities are
often built with donor support, but they cannot be sustained without sufficient financing, and
budgetary constraints impel regulatory agencies to focus on maximising revenue from their
inspection and certification activities, rather than assisting trade. The authors report that only
28 out of a total of 56 entry points in Tanzania are endowed with Plant Health Service (PHS)
inspectors, mainly international airports, major sea and lake ports, and selected border posts.
All of them lack basic pest inspection tools and only six are equipped with a computer.
The recent economic literature on standards suggests that, while stronger or more
harmonised standards are clearly associated with increased trade in manufacturing supply
chains, this is less clear-cut in the case of agricultural trade. Agricultural trade increases, and
in particular the movement of agricultural products from low-income to middle-income
countries for intermediate processing, are often associated with weaker standards.
Agricultural producers that are unable to meet the higher product standards required in
developed country markets are pushed ―upstream‖ in the supply chain (Ferrantino, 2012). On
the other hand, van Tongeren et al. (2009) find that although meeting the standards‘
requirements generates additional production costs, standards may also expand trade as they
enhance demand for a good through better information about the good or by enhancing the
good‘s characteristics and attractiveness for the consumer. The costs of compliance with
applicable standards will frequently shape the decision of producers whether or not to
attempt to meet elaborate standards, sell to developed economies at higher unit values and
possibly retain more steps of the production process at home.
Agricultural standards are generally set in industrialised countries, largely driven by the
fact that nearly 80% of processed food exports from developing countries go to markets in
developed countries (Jayasuriya et al., 2006). Developing countries‘ markets for agro-food
14.
For instance, 10% price premium for high quality cereals in West Africa (USAID, 2011).
16 – ESTIMATING THE CONSTRAINTS TO AGRICULTURAL TRADE OF DEVELOPING COUNTRIES
OECD TRADE POLICY PAPER N°142 © OECD 2013
products are increasingly shaped by those standards and Cadot and Gourdon (2012) show
that low-income countries generally apply SPS and technical regulations more extensively
than supported by their limited monitoring and testing capabilities. On the other hand,
agricultural commodities need standards for categorising purity, moisture content,
germination rates, packaging etc., which most African countries currently lack (USAID,
2011). Giovannucci and Purcell (2008) estimated that the rejection of agricultural imports
due to poor compliance with importing countries‘ standards cost low- and middle-income
countries about USD 1.6 billion in 2000-01. A growing part among those standards
addresses health and environmental concerns, relating to higher value added, ready-to-eat
processed food products.
Important differences among standards applied in different industrialised countries in
areas such as aflatoxin content or pesticide residues can increase the compliance cost for
exporting countries (Mohanty, 2007). At the same time, despite similar agro-ecological
conditions for pests and diseases, many regions in Africa or Asia lack regionally harmonised
SPS and food safety standards which would facilitate the free movement of food across
borders and reduce the costs of food safety controls with respect to plant health, pests, and
diseases. The Brookings Africa Growth Initiative (Brookings, 2012) stresses that food
safety, fair trade and organic certification standards as well as labour, environmental and
labelling standards and certification measures diverge quite considerably among ECOWAS
members. In East Africa, food producing companies in Kenya often find it easier to meet the
strict technical regulations for exporting to the Japanese, European, or Singapore markets,
than the widely diverging and poorly administered regulations in other African countries15
(World Bank, 2012).
In addition to agricultural standards set and implemented by government authorities
(mainly sanitary and phytosanitary -SPS- regulations), an increasing number of agricultural
trade standards is privately set by groups or firms and apply primarily to their specific needs,
in particular value chain management needs, or the need to reduce the importing firm‘s
exposure to risk. Private standards usually have a larger scope or require higher levels of
performance than the baseline government regulations (they can apply to such areas as
quality, process management, packaging requirements, or social concerns) and, as they
evolve more rapidly than government regulations, they can be more difficult to follow and
implement (Giovannucci and Purcell, 2008). Although voluntary, private standards are
becoming the basic de facto entry requirement for trade with many of the large-scale
operators and leading production and distribution chains. Standards going beyond basic entry
requirements can represent important opportunities for increased market share or price for
many agricultural products, but they can also entail significant challenges for developing
country producers and exporters faced with capacity constraints at the production and
processing levels.
For the private sector, constraints linked to the compliance with applicable public and
private standards relate mainly to expertise, equipment and information. Producers and
traders in developing countries have poor awareness and understanding of applicable
standards and of their relevance. Accessing a particular market will entail collecting and
digesting relevant information and data on the applicable requirements, a time and resource
consuming operation, especially given the scarcity of institutions in developing countries to
15.
A series of regional standards‘ harmonization processes are currently put in place in Africa, such as
COMESA‘s Green Pass and similar endeavors by ECOWAS, SADC and EAC to harmonize standards
for maize, rice, wheat and other cereals and encourage recognition of conformity assessment
procedures, but none is yet implemented.
ESTIMATING THE CONSTRAINTS TO AGRICULTURAL TRADE OF DEVELOPING COUNTRIES – 17
OECD TRADE POLICY PAPER N°142 © OECD 2013
facilitate standards awareness and adoption. Implementation of the more sophisticated
standards will call for specific expertise that developing countries producers often lack and
that would need to be acquired through investment in new processes and infrastructure, and
training for personnel. Compliance with the more sophisticated standards may in addition
require equipment for internal testing and controls, laboratory testing, analysis and
certification of products, all of which are in short supply in most developing countries. Lack
of testing and inspection services or their concentration in capitals far from the border and
food producing areas is an additional cost factor, especially for SMEs. Shortage in required
equipment will call for specific investments which introduce a capital-bias into the food
processing export sectors of developing countries (Jayasuriya et al., 2006). As an illustration,
Mohanty (2007) states that establishing a moderately-sized laboratory in India for testing and
analyzing samples of spices costs approximately 4 million Indian rupees (USD 88 000),
while compliance costs range from 5 to 15% of the fob value of agricultural products in
general. In Thailand compliance costs for a substantial number of firms can reach up to 5%
of sales; in the case of a few firms, it exceeds 15% of total sales. USAID‘s West Africa
Trade Hub has calculated that, among key trading corridors between Burkina Faso, Ghana
and Benin, the cost of obtaining an SPS certificate for maize (or paying a bribe at the border
when such a certificate is not on hand) is USD 40 per tonne, equivalent to 9% of the farm
gate price (USAID WATH, 2011).
Smallholder farmers and SMEs, including small and medium producers and processors,
which form the bulk of producers and processors in developing countries, will face particular
challenges. Those companies often lack the internal capacity and the economies of scale to
establish effective quality assurance and traceability systems (Giovannucci and Purcell,
2008). Hillary (1995) shows that the impossibility to employ specific staff to deal with
standards, as large businesses may be able to do, restricts the capacity of SMEs to monitor
changing legal requirements and interpret and implement necessary controls. Finally SMEs
will tend to focus on immediate economic survival rather than potential benefits derived over
the long term (Yapp and Fairman, 2004). Thus, unless these sectors can make standard
compliance cost effective and guarantee traceability for the buyers, many producers and
processors will be marginalised and excluded from competitive markets both regionally and
internationally with consequences for economic growth, poverty alleviation, and even food
security (Giovannucci and Purcell, 2008).
Trading costs and inefficient value chains
Trade transaction costs, including procedural barriers at the border and high
transportation costs appear quite significant among the constraining factors identified in the
economic literature on agricultural trade (Biau et al., 2008; Cadot et al., 2009; Easterly and
Reshef, 2010; Dorosh et al., 2010; Freund and Rocha, 2011; USAID, 2011; World Bank,
2012). High trade costs related to transportation, border procedures compliance, or lack of
competition may be less in the case of agro-food products which are part of simpler supply
chains than manufactures, but they will likely have a greater proportional impact on the price
of most agricultural products, especially unprocessed ones, because of their low value-to-
weight ratio. Agricultural products, which are often perishable, suffer particularly from
delays, which may be one of the most significant contributing factors to post-harvest
losses16
, in addition to inefficient harvesting, packaging and storage. The disproportionate
16.
The African Postharvest Losses Information System (APHLIS) has estimated that physical losses for
grain (before processing) could be between 10–20%, representing losses of USD 1.6 billion per year,
or about 13.5% of the total value of grain production (USD 11 billion) for Eastern and Southern
Africa alone.
18 – ESTIMATING THE CONSTRAINTS TO AGRICULTURAL TRADE OF DEVELOPING COUNTRIES
OECD TRADE POLICY PAPER N°142 © OECD 2013
impact of trade costs on low value, perishable products appears clearly in the case of
Cameroon, where domestic handling and transport costs for fresh cassava dispatched over a
130 km distance can account for 21–35% of total final value, compared with less than 12%
for cotton lint transported over 1 200 km (World Bank, 2012).
Cadot et al. (2009) find that although farmers‘ capacity to switch from subsistence to
market-oriented agriculture is heavily influenced by risk and price instability17
, the most
significant constraints come from high transaction costs related to transportation and
anti-competitive practices, and from insufficient market information. Likewise, Balat et al.
(2009) point to marketing, transport and intermediation costs in agricultural supply chains as
the most significant factors preventing the adoption of high-return crops that would have
offered farmers the benefit of higher export prices and enhanced global market access
opportunities. As the authors show, farmers focusing on export crops are on average less
poor than farmers more oriented towards subsistence activities, but trading costs and
inefficient value chains block significant opportunities for poverty reduction. According to
USAID (2011), direct transport costs, such as fees paid to transport-service operators, as well
as losses in transit, are the factors weighing the most on the movement of commodities along
transport corridors, followed by market logistics costs.
There is an extensive debate as to what are the key factors explaining transportation
costs. For some authors these are mainly related to poor road, rail or port infrastructure
(Nkuepo, 2012), as well as to regulatory and procedural barriers at the border or during
transit, including inconsistent and unpredictable implementation of applicable rules and
procedures. In African countries, multiple road blocks cause significant delays and offer rent
seeking opportunities18
. Until recently institutional, regulatory and procedural measures,
generally grouped under the label of trade facilitation used to receive less attention in
assistance projects than infrastructure. Aid for trade facilitation represented only 0.46% of
total disbursements in 2009, or 0.48% of total disbursements on average during 2006-09
(OECD Aid for Trade at a Glance, 2011). Brenton et al. (2012) note that, although generally
less costly, trade facilitation reforms were not as high in the aid for trade agenda because
they require political momentum and their effects are less visible as they are more difficult to
measure. Their weaker representation among assistance projects can also be explained by the
fact that they attracted a lower priority among recipient country requests.
Although transportation and logistics costs vary across products and countries, smaller
markets are more heavily affected. Nordas et al. (2006) point to the difficulties generated by
the lower frequency of transport services, as well as the difficulty to ensure backhaul freight,
which result in agricultural exports to developed countries bearing twice the shipping cost.
Port efficiency can be associated with both technical factors (such as the efficiency and
productivity of cranes and other port equipment) and with management factors, including the
ownership and operation of port assets and services, such as berths, warehouses, etc. In
addition to poor road quality and uncompetitive transport and freight forwarding services,
the lack of efficient and affordable cold storage and warehousing inflate transportation costs
even further. Port productivity also plays an important role19
. World Bank estimates that
17.
The OECD Committee of Agriculture pursues extensive work on risk management in agriculture. See
in particular document TAD/CA/APM/WP(2011)25.
18. According to the latest, 18th Road Governance Report of UEMOA bribery dropped overall by 19%
but the number of controls increased by 10% compared to the previous quarter, so that a roadworthy
and legal truck still pays about 35 000 FCFA (about USD 65) on average per trip in West Africa. The
report counts 38 roadblocks between Abidjan and Bamako, a distance of about 1 100 kilometres.
19. In Africa, six of the 90 total ports, three in Egypt and three in South Africa, handle 50% of total trade.
ESTIMATING THE CONSTRAINTS TO AGRICULTURAL TRADE OF DEVELOPING COUNTRIES – 19
OECD TRADE POLICY PAPER N°142 © OECD 2013
between 29 and 48% of the delivered price of grain, fruits and vegetables imports into
Central America come from logistics costs (Schwartz, 2011).
The impact of high transportation and delivery costs is more acute for farmers living in
remote areas with poor infrastructure or transportation. A number of studies have focused on
the impact of rural roads on neighbouring communities (Jacoby, 2000; Renkow, Hallstrom
and Karanja, 2004; Mu and van de Walle, 2007; Jacoby and Minten, 2009). Those studies
find that rural roads reduce poverty in connected villages, by integrating labour and goods
markets, thus providing new economic opportunities to their inhabitants, improving access to
food and securing higher profits for farmers thanks to cheaper agricultural inputs and higher
farm gate prices for their crops. Stifel and Minten (2008) find, in the case of Madagascar,
that isolation implies lower agricultural productivity and increased poverty, while Dercon
et al. (2008) using household data from Ethiopia find that the proximity of a road is a major
factor in reducing poverty. Dorosh et al. (2008) find that in sub-Saharan Africa agricultural
production and proximity to urban markets is highly correlated. Jedwab and Moradi (2012)
find that rail transportation infrastructure built in colonial Ghana between 1901 and 1923 had
a strong effect on cocoa production and on demographic growth and urbanisation, which
persists even after the complete displacement of rail by other means of transport. The
resulting improved connectivity had large and persistent welfare effects as districts
connected to the railway system are now more developed despite thirty years of marked
decline in railway transportation. Diop et al. (2005) stress in particular the importance of
reducing rural transport costs, which effectively delink farmers from national and
international markets and depress farm gate prices, discouraging specialisation in
commercial products. Based on a household survey and a diagnostic study of constraints to
trade in Rwanda, the authors estimate the transport cost from the farm-gate in Rwanda to the
port in Mombasa to about 80% of the producer price. Half of it, i.e. 40% of the farm gate
price is represented by rural transport costs alone, from the farm gate to the capital, Kigali.
According to the World Bank‘s Rural Accessibility Index, only 34% of the rural
population in Sub-Saharan Africa lives within 2 kilometres of a road that is passable in all
weather (Brookings, 2012). The region has some of the worst connectivity in the world, with
only 128 metres of road per 1 000 residents and a road density of only 16.8 kilometres per
1 000 square kilometres, compared with 700 metres of road per 1 000 residents and a density
of 37 km per 1 000 sq km in other low-income regions. Roads account for 80 to 90% of all
freight and passenger movement in Africa, so road density is an effective proxy of how well
connected areas of a country are. Most of the roads in rural areas are unpaved, bringing
vehicle operating costs to about 50% higher than on good quality roads20
and maintenance
projects are often neglected and underfunded, resulting in significant loss of road networks,
even though such projects are significantly more cost-effective than creating new
infrastructure, or rehabilitating decrepit infrastructure (Biau et al., 2008). For many farmers,
roads are not accessible or totally inadequate and head carrying is the only available mode of
transport. According to UNECA (2010) the fact that only about 30% of African roads are
paved, combined with the continent‘s low port productivity, explains why shipping a vehicle
from Addis Ababa to Abidjan costs USD 5 000, while it would cost USD 1 500 to ship from
Japan to Abidjan. Landlocked countries that depend on neighbours‘ road networks to bring
products to global markets are particularly affected.
Brenton et al. (World Bank, 2012) on the other hand underscore that high transportation
costs affecting agricultural trade in East Africa have more to do with the lack of modern and
20.
Observations drawn from the 2005 World Bank Diagnostic Trade Integration Study about the impact
of the lack of road maintenance on vehicle operating costs.
20 – ESTIMATING THE CONSTRAINTS TO AGRICULTURAL TRADE OF DEVELOPING COUNTRIES
OECD TRADE POLICY PAPER N°142 © OECD 2013
competitive transport services than with transport infrastructure problems. They estimate
that, along the major international trade corridors, road infrastructure has greatly improved
and is no longer the primary reason for high transport costs. USAID (2010) and USAID
(2011) reach a similar conclusion for West Africa, although both reports stress that, outside
the main regional network, road quality is uneven and much lower. On the other hand, the
operation of transport cartels, nurtured by outdated trucking regulations and cross-border
restrictions21
significantly increases prices for transport services and exacerbates informality
in the trucking sector22
. It also removes the incentive to invest into new, more efficient trucks
and prevents the modernisation of old and unroadworthy trucking fleets, impacting further
on the cost and timeliness of transport and damaging road infrastructure. Raballand et al.
(2010) dispute the capital importance of roads, which are often underused and generally
expensive to build and maintain relative to the economic development they produce, failing
to reduce poverty as much as expected. They stress the relatively high vehicle operating
costs due to poor economies of scale and the cartelisation of the trucking industry, which
prevents cost savings from being passed on to farmers. The study demonstrates that from a
cost-benefit perspective the additional cost of extending an all-weather road two more
kilometres to the farmer‘s door outweighs the benefits in most cases. Reaching a Rural
Access Index (RAI)23
of 50% would be beyond the financial resources of many countries,
whereas the average value in other regions is around 65% already.
Brenton et al. (World Bank, 2012) also stress the constraint of inefficient distribution
services with burdensome entry requirements, lengthy registration procedures, poor market
information and high numbers of intermediaries. The structure of export value chains has a
significant impact on poverty and welfare in rural areas, in particular as regards
concentration in the distribution sector, which tends marginalise small-scale farmers. Porto
et al. (2011) find that greater competition among processors and traders of crops benefits
smallholders through higher farm gate prices.
USAID (2011) also considers that regulatory and competition inefficiencies along the
value chain, which diminish the competitiveness of regional cereals and livestock suppliers,
are key barriers to food trade, which drive cross-border trade from formal into informal
channels. The report points in particular at small scale and multiple intermediaries, the
inadequacy of trade information systems, poor product quality, limited access to credit and
lack of appropriate storage. Among them, the most burdensome factor, according to Freund
and Rocha (2010), is bureaucratic delays, with customs and port delays coming second and
transit delays third. World Bank (2011) estimates that the effect of crossing national borders
on relative prices of a range of agricultural commodities24
is equivalent to pushing the two
markets an additional 174 km further apart in the case of the Burundi–Rwanda border,
21.
Including queuing systems for trucks to be allocated freight within national shares, allowing to charge
fees for administering queues and to obtain bribes; and bans on cabotage (i.e. carriage of freight
entirely within a country by a truck from another country).
22. Between 80-95% of West Africa‘s trucking capacity lies in the informal sector.
23. The RAI is used as a basis for estimating the proportion of the rural population which has adequate
access to the transport system. It measures the number of rural people living within two km of an
all-season road as a proportion of the total rural population. An all-season road is a road that is
passable all year round by the prevailing means of rural transport (typically a pick-up or a truck which
is not four-wheel-drive). Occasional interruptions of short duration during inclement weather
(e.g. heavy rainfall) are accepted, particularly on light traffic roads.
24. Beef, fish, maize, maize flour, beans, palm oil, and cassava flour, based on FAO prices of agricultural
goods.
ESTIMATING THE CONSTRAINTS TO AGRICULTURAL TRADE OF DEVELOPING COUNTRIES – 21
OECD TRADE POLICY PAPER N°142 © OECD 2013
1 824 km further apart in the case of the Burundi–DRC border, and an extra 1 549 km in the
case of the DRC–Rwanda border. Border barriers include multiple fees, permission
requirements, redundant documentation and burdensome border procedures. Documents
such as certificates of origin and import/export permits, usually issued in capital, are difficult
to obtain for small cross-border traders in remote regions (Lesser and Moise, 2009).
Supply-side and market access constraints act as important incentives to trade informally
rather than formally; addressing those constraints could not only reduce the incentives to
informal trade but also enhance the total volume of actual trade flows. Formal regional trade
seems particularly below potential in Africa, where it represented only about 10% of total
trade in 2010, compared to roughly 17% in Asia and more than 60% in the EU. The
―missing‖ volumes may be trade that did not take place, but also represent informal trade,
which is not captured by official statistics and which is quite widespread in Africa.
According to Lesser and Moise (2009), informal trade concerns more particularly staple food
commodities and low quality consumer goods and could represent as much as
USD 231 million worth of goods, or 86% of official export volumes, in the case of a country
like Uganda in 2006. This could be particularly significant, considering that intra-African
trade is what drove much of Sub-Saharan African export growth over last 15 years,
representing an increase of 13% per year on average, during a period where export share to
destinations outside Sub-Saharan Africa steadily declined from 71% in 1994 to 53% in 2008.
Market information and access to finance
Another central factor influencing transaction costs for agricultural trade relates to the
collection of market information, including the identification of potential markets and
buyers; information about the prices of products at the local markets and at the level of the
final consumer; about quality requirements and consumer taste and demand; but also about
the legislative framework covering product safety and quality (Cadot et al., 2009; USAID,
2011; Azam et al., 2012). Based on research in Cambodia, Azam et al. (2012) stress that the
farmers‘ capacity to participate or not in agricultural trade is affected by both fixed and
variable transaction costs and by institutional factors, while the decision on how much to
trade is affected by variable costs only. In particular, the lack of accurate and reliable market
information on crops supply, demand and stocks discourages farmers and traders from taking
additional risks, such as expanding production and exporting to new markets. It can also
produce ill-defined and uncoordinated policy responses which contribute to food price
volatility.
The lack of reliable information on standards and their implementation not only
compromises the ability to position agro-food products in target markets, but also limits
agricultural producers to low-return market segments. Siringoringo et al. (2009) show that
although concrete information on prospective foreign markets is essential before exporting
can occur –firms using relevant, accurate and timely information are in a better position to
respond to export problems–, this is a serious challenge for SMEs in developing countries,
who often lack the internal resources to acquire essential information, digest it and use
effectively the vast quantity of general information and flood of statistical data that are
routinely handed to them in response to their enquiries.
Farmers also face difficulties as regards the negotiation of marketing conditions and
price. In order to overcome size constraints, increase their bargaining power, allow
economies of scale and lower marketing and negotiation costs, smallholders need to organise
in farmers associations and cooperatives. As with transportation costs, poor market
information and bargaining capacity tend to be more constraining for small-scale producers
and traders living in remote areas. Poor communication and transportation infrastructure
22 – ESTIMATING THE CONSTRAINTS TO AGRICULTURAL TRADE OF DEVELOPING COUNTRIES
OECD TRADE POLICY PAPER N°142 © OECD 2013
limit farmers‘ capacity to collect market information and increase the role and power of
intermediaries. Price-information systems established by national governments, for instance
with respect to West African cereals markets, are of varying data quality and timeliness,
rarely include information from markets in neighbouring countries and are not typically
available to the private sector in user-friendly, market-supporting ways that alleviate
inequality of access to price information. Smallholders failing to access publicly available
information on market prices typically establish contacts through mobile phones for
undifferentiated low-quality commodities (USAID, 2011). However, new technologies, in
particular the increasing coverage and decreasing cost of mobile phones25
, contribute
significantly in overcoming those constraints, especially in more remote markets and those
without paved roads. Second generation market information systems already operate, such as
the online Esoko26
model, which provides a platform for the quick and affordable exchange
of agribusiness information in and out of rural areas using mobile phones.
In West Africa, farmers list access to finance27
as among the most important problems
they face, in addition to logistics and access to land issues (USAID, 2011). Likewise, Azam
et al. (2012) state the lack of rural credit and insurance as one of the major obstacles for
converting from smallholder, subsistence farming to commercial farming in Cambodia.
Access to finance is a critical problem not only for farmers and processors but also for their
suppliers along the vertical chain - such as for equipment and agricultural inputs (e.g., seeds,
chemicals) - and logistics providers. It is particularly acute for small-scale agro-food traders,
most of whom operate in the informal sector. Farmers‘ and agro-food traders‘ limited means
to finance the storage or trade of their products, lack of access to futures markets or crop
insurance schemes for harvest failures, limited and expensive access to bank credit, obliges
them to operate solely with their own capital. This limits considerably the volumes they can
trade and encourages a quick stock rotation in order to maximise turnover. Linguistic and
family bonds, which are prevalent in informal trade, make up for the non-availability of
credit, but they are often insufficient for long distance trade, for which credit and guarantees
are required in order to reproduce equivalent levels of trust. The challenge is even more
significant for agricultural exporters, who often state lack of access to credit as the single
biggest factor constraining their growth (Cardno, 2010).
Financial institutions in many developing countries have a weak capital base, limited
knowledge and experience in managing counterparty risks and limited correspondent
banking relationships (Nkuepo, 2012). Financing trade is complicated further by the lack of
efficient payment mechanisms to cover insurance requirements and customs guarantees for
transiting consignments, as also shown by the case study on the cashew nut sector in
Mozambique, as well as by the non-convertibility of certain currencies. Agricultural
financing providers include a broad array of public, private and community based
25.
Brenton et al. (2012) report that, thanks to mobile phones, agricultural prices dispersion across
markets was reduced by 10% in Niger between 2001 and 2006.
26. Esoko was put together by a partnership of IFC, IFPRI, USAID, CIRAD, IFAD, FAO and GIZ. The
system relies on individuals feeding prices for standardized commodities through mobile phones to a
server that makes these data available to others on their mobile phones. It allows access to prices,
stock, offers and harvest information, communication with clients and members, tracking stock and
inventory, finding buyers and sellers and pulling interactive data from the field.
27. Agricultural finance refers to funding and financial services including equity and quasi-equity
instruments (e.g. convertible loans); short-, medium- and long-term loans; leasing and other
specialized instruments and insurance and risk management products (e.g. weather, crop and livestock
insurance) covering the entire agribusiness product cycle (ranging from project preparation, through
implementation, production and processing, and, finally, to the distribution of agro-food products).
ESTIMATING THE CONSTRAINTS TO AGRICULTURAL TRADE OF DEVELOPING COUNTRIES – 23
OECD TRADE POLICY PAPER N°142 © OECD 2013
organisations, including government development banks and specialised funds, such as
pension and equity trust funds; bi-lateral and multi-lateral donors; development finance
institutions (DFIs) and sovereign investment funds; hybrid social funds; private sector equity
investors and funds; commercial banks; leasing companies; rural and micro-finance
institutions; and, finally, community-based lending societies. However, despite this wide
range of sources of financing, agribusiness financing represents a very small percentage of
the total supply of credit, for example only 5% on average in West Africa (USAID, 2011).
Local financial institutions are reluctant to lend for agricultural projects, particularly to
smallholders, because of their low familiarity with the agricultural sector, their perception
that agricultural risk is highly linked to seasonality and weather conditions, and the shortage
of available security. This is clearly highlighted in the case study on Zambia. The difficulty
of verifying titles and property rights in rural areas raises issues in providing collateral, but
in some parts of Africa financial institutions increasingly accept ―warrants‖ 28
. Warrantage is
used for smallholder farming in francophone Africa, Burkina Faso, Mali, Niger and Senegal
and is increasingly receiving the support of the World Bank, EU, FAO, USAID and other
donor and microfinance institutions. On the other hand, farmers often lack the formal
educational background to be able to present well-prepared documents and financial
statements to loan officers and their remoteness from urban centres and dispersed demand
due to low population densities considerably increases transaction costs for service providers
(USAID, 2011).
A promising initiative is the Making Finance Work for Africa (MFW4A) partnership29
,
aiming to establish a common platform for the harmonisation and facilitation of financial
sector development and knowledge sharing in Africa, so as to unleash the full potential of
Africa's financial sector in order to drive economic development and reduce poverty across
the continent. The Partnership brings together donor partners, African governments, the
private sector, and other financial sector stakeholders30
to promote country and region-led
financial sector development projects. Their agricultural sector donor mapping and
agricultural finance assessments seek to ascertain which initiatives are being supported by a
range of donors—whether already implemented or planned for the future, so as to identify
overlaps and gaps in implementation. Ferro et al. (2011) estimate that banking services are
quite amenable to aid-for-trade support.31
However, as shown by the case study on Zambia,
the sustainability of alternative funding programmes is not easy to achieve and works better
in combination with mentoring programmes to improve concerned firms‘ market operations.
28.
Receipts from regional warehouse receipt schemes (WRS) which bulk and secure commodities, that
indicate the deposited goods‘ value and can be used as collateral. The use of warrants as collateral for
agricultural finance is called warrantage.
29. A G8 initiative launched in October 2007 with the involvement of the AfDB.
30. Existing institutions that operate within the agricultural sector include the African Development
Bank (AfDB), the Alliance for a Green Revolution in Africa (AGRA), the World Bank and its private
sector arm, the International Finance Corporation (IFC) which finances private sector investment,
mobilizes capital in the international financial markets, and provides advisory services to businesses
and governments, USAID and its implementing agencies, Germany‗s KfW Bankengruppe (KfW
Banking Group) and France‗s Agence Française de Developpement.
31. A 10% increase in aid to banking services would bring about a 4.7% increase in manufacturing
exports
24 – ESTIMATING THE CONSTRAINTS TO AGRICULTURAL TRADE OF DEVELOPING COUNTRIES
OECD TRADE POLICY PAPER N°142 © OECD 2013
II.c Institutional and regulatory inefficiencies
In addition to the removal of production and trade-related constraints, developing
countries which managed to harness agricultural growth and trade to reduce poverty, seem to
have benefited in particular from an improvement of the country‘s general macroeconomic
context and the reduction of regulatory and trade policy distortions such as high export taxes,
overvalued exchange rates and inefficient state interventions in the agricultural markets
(Cervantes-Godoy and Dewbre, 2010). The overview of the determinants of export success
in Africa from Easterly and Reshef (2010) shows that successful export performance relies
on overcoming or addressing distortions in the general economy, such as detrimental
macroeconomic policies, bureaucracy and poor rule of law. Brenton et al. (World Bank,
2012) highlight the damaging impact of unpredictable and discretionary regulatory
environments with export and import bans32
, variable tariffs and quotas, restrictive rules of
origin, price controls, lack of transparency and poor communication.
Agricultural trade policies appear at the centre of many regulatory constraints. Although
regional agreements address a wide array of regulatory barriers33
, for instance by prohibiting
export-licensing regimes, establishing duty-free status for certain products, offering
inter-state road transit insurance34
and promoting harmonisation and mutual recognition of
standards, these achievements are poorly implemented in practice. In addition, national
policies are mostly inconsistent, implemented unevenly and create an opaque business
environment. A number of African countries impose export authorisations by the provincial
administrator, regional governor or local chamber of commerce for certain types of
commodities despite the prohibition at the regional level. They also assess duties on
commodities or impose VAT payment when crossing borders on goods that are normally
duty or VAT free under regional schemes. Transit bonds, providing insurance which allows
goods in transit to move freely through the region are often not recognised, obliging road
transporters to buy new insurance at each crossing, and a similar situation applies to SPS and
veterinary certificates of neighbouring countries.
However, according to a West Africa Trade Hub Technical Report (USAID, 2011) the
most important trade policy constraint is often the widespread application of seasonal
import/export bans. The report notes that the enhancement of regional trade is often
sacrificed to a national agenda of food self-sufficiency, despite guidelines codified in
regional agreements on the elimination of tariff and non-tariff barriers, signed by all, but
lacking implementation. Reports from the Permanent Inter-State Committee for Drought
Control (CILSS) and FEWS-NET35
are not always followed and the determinations are made
32.
Import bans during good harvest years to ensure domestic production is consumed first, and export
restrictions or bans during periods of low yields. Quantitative restrictions and bans reduce output
prices and limit farmer‘s incentives to produce, keeping output below potential in the case of export
restrictions, while import bans will increase consumer prices in food deficit areas. The authors
highlight the effect of uncoordinated and non-transparent implementation of such measures on price
stability.
33. See for instance the ECOWAS Trade Liberalisation Scheme, which applies to agricultural products
since its inception in 1979. Under the scheme unprocessed livestock, fish and plant products are
totally exempt from import duties and taxes and from quantitative restrictions.
34. For instance the Inter-State Road Transit (ISRT) Convention and Logbook in ECOWAS established a
regional insurance scheme and ISRT Bond.
35. The Famine Early Warning Systems Network (FEWS NET) is a USAID-funded activity that
collaborates with international, regional and national partners to provide timely and rigorous early
warning and vulnerability information on emerging and evolving food security issues in Africa,
ESTIMATING THE CONSTRAINTS TO AGRICULTURAL TRADE OF DEVELOPING COUNTRIES – 25
OECD TRADE POLICY PAPER N°142 © OECD 2013
on the basis of political factors or manipulation of market data. This results in reducing the
predictability of market dynamics and trends, increasing investment risk, hampering the
ability of the private sector to allocate resources efficiently and generating incentives for
informal trade with its extensive opportunities for bribery and corruption.
Yet, open food trade policies can bring significant benefits not only to the exporting
countries, through higher production, exports and trade, but also at the regional level, by
allowing flows from surplus to deficit areas and helping lower domestic prices and smooth
seasonal fluctuations in net food importing countries. USAID (2011) reports that Uganda‘s
open and consistent trade policies benefit not only its immediate neighbours36
, but also the
continent more widely, through Ugandan maize and beans procurements from the World
Food Program (WFP), aimed at covering periodic food shortages in Kenya, Burundi,
Tanzania, Sudan, DR Congo, and Rwanda. These open trade policies and the marketing
opportunities they have created for Ugandan producers encourage increased production from
maize and beans farmers and promote efforts to meet WFP‘s quality and quantity
requirements.
II.d. Complementary policies
The importance of complementary policies is highlighted in Hallaert et al. (2011). In
particular, education and training are important factors influencing developing countries
trade performance through their impact on labour productivity. Besides the high transport
costs and poor market integration generated by poor physical infrastructure, a major obstacle
for converting from smallholder, subsistence farming to commercial farming according to
Azam et al. (2012) is the low level of formal education and training in new techniques.
Subsistence farmers may find themselves unable to share in the market-based growth for
lack of skill and labour, which would suggest that aid interventions upgrading skills through
better extension services, could greatly improve market participation and commercialisation
by smallholders. Ngo (2006) confirms the importance of literacy and numeracy skills as
pre-conditions for agricultural growth. Calculating the effect of educational attainment on
rice productivity in Vietnam, the author finds that the returns to literacy and to holding upper
secondary diplomas on rice yields are 38% and 31% respectively.
The most important effect of education on agricultural growth seems to be through its
role in modernising agriculture, rather than its impact on traditional agriculture (Alene and
Manyong, 2007). The authors show that formal education and extension services have higher
productivity-enhancing effects for farmers cultivating improved varieties and applying a
package of new inputs than for farmers using largely traditional technology, which can be
formalised and passed on from generation to generation. This suggests that that the
generation and dissemination of improved agricultural technologies should be coupled with
formal farmer education to have a maximum impact on agricultural productivity and that
formal farmer education not only enhances agricultural productivity following modernisation
and the adoption of new technologies, but also promotes technology adoption itself.
Central America, Haiti and Afghanistan. This information helps decision makers act to mitigate food
insecurity through contingency and response planning efforts.
36. Kenya receives annually around 120 000 tonnes of maize, Rwanda another 50 000 tonnes and
southern Sudan is becoming a growing market for Ugandan products. The WFP purchased
109 000 tonnes of food from Uganda in 2010 (World Bank, 2012).
26 – ESTIMATING THE CONSTRAINTS TO AGRICULTURAL TRADE OF DEVELOPING COUNTRIES
OECD TRADE POLICY PAPER N°142 © OECD 2013
Finally, conflicts and political instability are also important obstacles to consider
(Nkuepo, 2012). The prevalence of regional conflict is highlighted in particular as an
important constraint that impinges on regional trade for agricultural commodities in a
number of recent studies (Pannhausen and Untied, 2010; Brookings, 2012; World Bank,
2012).
III. The link to poverty reduction and food security
A distinction should be made between the role of agriculture and that of agricultural
trade in economic development, poverty reduction and food security. An abundant economic
literature, reviewed by Cervantes-Godoy and Dewbre (2010), and more recently the analysis
of Agricultural Policies for Poverty Reduction (OECD, 2012b) have focused on the former,
discussing the process of structural transformation of economies, from the least developed,
in which economic activity is largely based on agriculture, to high-income countries where
industry and services sectors dominate. Several studies conclude that agricultural growth is
more poverty reducing than growth in non-agricultural sectors, and suggest a strong link
with the labour intensity of agricultural production, which is also highlighted in our case
study on the cashew nut sector in Mozambique. OECD (2012b) nevertheless highlights the
importance of anticipating structural changes in agriculture, including labour movements
from a modernising agricultural sector, where technical change reduces labour demand, to
growing non-agricultural sectors.
Given the important share of poor people involved in agriculture, improved agricultural
performance will increase the income of a significant proportion of poor people, and may
also translate into an increase of the purchasing power of poor consumers. Among the four
―transmission mechanisms‖ between agricultural growth and poverty reduction highlighted
by a 2004 DFID paper, it is worth noting agriculture‘s contribution to the generation of
economic opportunity in the non-farm sector37
. Viewing agricultural and rural development
as an important stepping stone for economic development in general, the G8 pledged in 2009
to substantially increase aid to agriculture and food security including through pledges to
commit USD 20 billion over three years.
The links between agricultural trade, poverty reduction and food security are complex.
Agricultural growth affects poverty and overall economic growth directly and indirectly
through linkages with the non-agricultural sector; at the same time, reinforcing economic
activity in rural areas has a significant impact on the disproportionately large number of poor
living in those areas (see empirical studies on Ethiopia by Diao and Nin-Pratt, 2007; on
Ghana by Breisinger et al., 2008; and findings by Datt and Ravallion, 1998; Christiansen,
Demery, and Küh, 2006, who find that agricultural growth had an impact 13.8 times larger
than non-agricultural growth on poverty). Nin-Pratt et al. (2009) consider poor growth in
agriculture to be a key factor behind the overall weak performance of West African
economies. The authors stress the mismatch between the old-fashioned, low productivity and
high risk production patterns that are still prevalent in the region and the role of the
agricultural sector as the main provider of employment, rural livelihoods, export revenues,
and more generally national income. Azam et al. (2012) consider that increasing the
commercialisation of agricultural products and expanding the market participation of rural
poor raises living standards and reduces the vulnerability of rural populations. However, the
37.
DFID (2004), Agriculture, Growth and Poverty Reduction refers also to the direct impact of improved
agricultural performance on rural incomes; the impact of cheaper food for both urban and rural poor;
and agriculture‘s support of economic transition from primarily agricultural activities towards a
broader base of manufacturing and services.
ESTIMATING THE CONSTRAINTS TO AGRICULTURAL TRADE OF DEVELOPING COUNTRIES – 27
OECD TRADE POLICY PAPER N°142 © OECD 2013
positive impact of agricultural trade expansion on smallholders is not straightforward, as the
distribution of benefits will depend on a number of additional factors, such as the producers‘
organisational capacity and their access to information on demand and on prices (see above,
sections II.a and II.b).
A number of recent studies (Pannhausen and Untied, 2010; Brookings, 2012; World
Bank, 2012) note the significant contribution of regional trade to food security through the
trade of commodities from surplus to shortage areas and the possibility to make the most out
of different seasons, rainfall patterns and production increases or declines generated by
climate change. They also highlight the role regional trade can play to enhance
socio-economic development and reinforce countries‘ integration into the global economy by
creating economies of scale, establishing and strengthening product value chains (production
and distribution of seeds and fertilisers, advisory services, grains storage, transport and
logistics, distribution and retailing, processing), facilitating transfer of technology and
knowledge, stimulating infrastructure development and attracting FDI.
Enhanced trade of agricultural products can contribute to food security38
. This can be
done by improving poor people‘s access to food and by increasing returns to poor farmers
for the food they produce through the expansion of food markets and the growth of
agricultural production in surplus zones, in addition to any efforts to improve productivity in
deficit areas. Brenton et al. (World Bank 2012) show that if existing regional trade
agreements and efforts for policy and regulatory harmonisation in Africa had succeeded in
removing barriers to regional trade in food staples, food security would be improved by
linking farmers to consumers across borders which often artificially separate food surplus
areas from food deficit ones39
. This would mitigate the effects of periodic national food
shortages and of escalating global food prices. Regional trade in food staples could help
moderate price volatility in African food staple markets, but existing barriers make it very
difficult to trade with neighbours. Most food demand is currently supplied from outside the
continent40
and this demand, which is expected to double by 2020, can significantly burden
import bills. The gravity framework employed in the following section for assessing the
constraints to exporting agricultural products provides evidence for the importance of
stronger regional integration in ensuring regional trade in agricultural products. The gravity
model identifies partial equilibrium effects of such constraints. Meanwhile, the linkages
between agricultural trade, poverty and food security need to be analyzed through a more
complex conceptual framework that considers the dynamics of such interactions. Such an
analysis focused on a wide range of developing countries remains subject to strong data
limitations.
One of the most important paths for enhancing food security is to address poverty
challenges through the improvement of rural incomes (Brooks, 2012). The author suggests
that the strategy for strengthening rural incomes and facilitating smallholder adjustment is
not only to improve agricultural productivity but also to promote a more diversified rural
38.
Food security implies both physical and economic access to sufficient food to meet dietary needs for a
productive and healthy life (USAID definition) and is determined by availability, access, utilization
and stability of supply, as defined by FAO.
39. The authors provide the example of Northern Mozambique, which produces large amounts of maize,
but is far from the main area of national consumption in the south of the country. That production
could usefully address the persistent food shortages of nearby Southern Malawi. Likewise, Kenya‘s
maize deficit makes it dependent on imports, especially from Tanzania.
40. FAO estimates that, contrary to Asian countries, just 5% of all grain imported by African countries
originates from regional sources.
28 – ESTIMATING THE CONSTRAINTS TO AGRICULTURAL TRADE OF DEVELOPING COUNTRIES
OECD TRADE POLICY PAPER N°142 © OECD 2013
economy that offers additional sources of income. For many agricultural producers, the
importance of barriers will determine not only the volume they trade but also the likelihood
that they may envisage exportation at all (Nordas et al., 2006), with significant implications
for employment opportunities. The expansion of food markets has employment
repercussions beyond mere farm work, not only supporting jobs in rural areas, but also jobs
in processing, transport, distribution and retailing.
IV. An empirical assessment
Drawing on the overview of the various supply-side constraints reviewed above, and
building on the gravity model literature, this section explores the relative impact of various
constraints on developing countries‘ exports of agricultural products, with a view to
prioritising and sequencing domestic reform and aid-for-trade programmes to maximise their
trade potential.
Model specification and econometric strategy
The classical cross-sectional gravity approach, in which the value of trade is regressed on
a number of time-invariant trade impediments such as different measures of physical,
cultural and administrative distance, is augmented with a series of key explanatory variables,
reflecting trade related and productive capacity constraints identified in the preceding
section. In addition, variables are introduced to control for complementary policies, such as
education or governance, and a number of comparative advantage factors which are not
directly amenable to aid interventions -- areas which are likely to impact both the productive
and trade capacities of a country.
Data availability has been a significant challenge in developing the database of key
explanatory variables. As data availability varied across countries, key explanatory variables
were selected with the dual objective of covering as many important constraints as possible
but also of maximising the total country coverage to avoid selection bias.
The key explanatory variables include:41
Two constraints on the productive capacity: (i) access to fertilisers is proxied by
fertiliser consumption (taken from the WB‘s World Development Indicators, WDI)
although the proxy is imperfect in that it also reflects demand-side factors. Access to
fertilisers is, itself, a reflection of a number of regulatory and business environment
issues as access to fertilisers is likely to be influenced by access to credit and
insurance, contract enforcement institutions and the development of the inputs
sector. And (ii) electricity availability is proxied by total electric power consumption
(also from WB‘s WDI), although, again, the variable reflects demand-side factors as
well. Data limitations did not allow for the inclusion of agricultural machinery.
An index of infrastructure quality which reflects the quality of a number of trade,
transport, logistics and connectivity related infrastructure elements, such as ports,
railroads, roads or information technology. This index is a sub-component of the
World Bank‘s Logistics Performance Index.
Two aspects of trade policy: (i) an index of tariff trade restrictiveness for agricultural
products, referred to as the TTRI, which is compiled as the bilateral average of the
tariffs imposed by a country on its imports weighted by this country‘s bilateral
41.
Data sources and descriptions for the variables included in the model estimation are presented in
Annex 2.
ESTIMATING THE CONSTRAINTS TO AGRICULTURAL TRADE OF DEVELOPING COUNTRIES – 29
OECD TRADE POLICY PAPER N°142 © OECD 2013
import composition; and (ii) an index of NTM restrictiveness for agricultural
products, referred to as NTMRI, similarly compiled, as a bilateral weighted average
of NTMs tariff-equivalents, including, among others, price and quality control
measures, technical regulations and monopolistic measures. These indices, drawn
from Kee, Nicita and Olarreaga (2009), provide the best country coverage available
to date for both tariffs and NTMs. Their computation is described in more detail in
Annex 2. The advantage of weighted indicators of trade barriers is that they give a
more realistic view of the actual constraints faced by individual countries in practice.
However, a key drawback is that such indicators mask the impact of prohibitive
tariffs and, more generally, tend to give a lower weight to a barrier, the higher it is.
An alternative specification was thus tested in which tariffs are directly introduced
instead of the TTRI, but the results were comparable.
Two variables which reflect a country‘s comparative advantage for agricultural
production: (i) agricultural land availability and (ii) renewable internal fresh water
resources (both taken from the WB‘s WDI). As in the case of the level of fertiliser
consumption, the indicator for freshwater resources availability can also be a good
proxy for a wider set of constraints across the agricultural value chains. The
inclusion of comparative advantage factors offers a more accurate perspective to the
relative impact of supply-side constraints, even though they cannot themselves be
directly addressed by means of aid for trade or policy interventions.
Two complementary policies: (i) education – proxied by the primary and secondary
school gross enrolment rates taken from the World Bank World Development
indicators, and (ii) governance quality – proxied by an index of political stability and
absence of violence taken from the World Bank World Governance Indicators.
The data limitations referred above did not allow the inclusion of additional constraints
identified in the preceding section, such as information on the business environment or the
availability of credit for the agricultural sector as well as other comparative
advantage-related variables such as rural labour or availability of agricultural machinery.
Unfortunately, when available, such information covered only very restricted sub-samples of
countries; its inclusion therefore induced important selection effects on the results. Likewise,
it was not possible to include more disaggregated information on rail and road transport
networks, or on NTMs, differentiating between TBT and SPS requirements, for which data is
very sparse in the case of developing countries. For this reason, these aspects are further
explored the case studies that follow in sections V, VI and VII.
The focus of the paper being to explore the impact of constraints for developing
countries, exporters in the baseline specification only include developing countries (as
defined by the World Bank income categories low-income, lower-middle income and
higher-middle income countries). This is referred to as the ―developing countries only‖
specification. The dataset then includes bilateral trade flows between 64 developing
countries and their trading partners (the trading partners including both developed and
developing countries). The sample of countries is listed in Annex 3. It includes a
representative set of countries from all continents, a number of landlocked countries, least
developed countries (LDCs) and major emerging economies.
In addition, the model is also run on a larger dataset (referred to as the ―full sample‖) that
includes both developing and developed countries as exporters and where the supply-side
constraints are interacted with a dummy variable that denotes developing countries, so as to
test for a disproportionate impact of the key explanatory variables on developing countries.
When these interacted terms are significant, the non-interacted terms capture the effect of
constraints on developed countries‘ exports while the effect on developing countries‘ exports
30 – ESTIMATING THE CONSTRAINTS TO AGRICULTURAL TRADE OF DEVELOPING COUNTRIES
OECD TRADE POLICY PAPER N°142 © OECD 2013
is given by the sum of the interacted and the non-interacted coefficients. The chief reason to
expect a potentially disproportionate effect of some constraints in developing countries is the
fact that constraints are likely to interact with each other, with some constraints increasing or
inhibiting the effect of others. For example, poor infrastructure quality might inhibit the
impact of market access barriers, as high tariffs imposed by trading partners will not make
much difference in cases where goods cannot reach the port of export. Conversely, conflict
will exacerbate transport difficulties in a country with already poor infrastructure. It would
have been interesting to test these interactions themselves, but, in practice, data availability
does not allow to do so. However, we test for potentially disproportionate effects in
developing countries, where such bottlenecks are more likely to be present. In this
specification, the sample includes 33 additional developed countries as exporters, the list of
which is given in Annex 3.42
The dependent variable is bilateral agricultural trade in value.43
The model is estimated
using a cross-sectional dataset rather than a panel, as two of the key explanatory variables,
the TTRI and NTMRI, are available only for two very close periods (2005-06 and 2008). In
this setting, the model is not run for one specific year, but over a 5-year average for the
period 2003-07.44
This strategy maximises the country coverage and mitigates the problem
of measurement errors.
The traditional gravity model establishes a link between bilateral trade flows, the sizes of
two economies (proxied by their GDPs), and various measures of physical and cultural
distance between country pairs taken to reflect bilateral trade costs. This traditional
specification of the model has however been revised to account for the fact that (i) trade
between two countries is affected not only by absolute bilateral trade costs but relatively to
the trade costs among all country-pairs, and (ii) the sizes of other economies matter too – this
is often referred to as ―multilateral resistance‖. The easiest way of controlling for
―multilateral resistance‖ and obtaining unbiased coefficient estimates is to use country or
country-pair specific fixed effects (Eaton and Kortum, 2002; Feenstra, 2004). The key
drawback of this estimation method is that it precludes the inclusion in the model of
explanatory variables that vary only in the country or country-pair dimensions, such as our
key explanatory variables. We therefore adopt Baier and Bergstrand‘s (2009) alternative
approach, which consists in computing ―multilateral resistance‖ (MR) terms based on
bilateral trade cost data between all country pairs and the size of one economy relative to the
size of all others (see Annex 1 for details).45
Three sets of robustness checks are run as alternative ways to account for the
―multilateral resistance terms‖ and are described in Annex 1 (outputs are reported in Annex
42.
The list of importer countries is also given in Annex 3.
43. The dataset is based on reported bilateral import flows, which are considered to be more reliable than
reported export flows (as countries have an incentive to report imports better than exports in view of
collecting tariff revenues). Data come from the WITS COMTRADE database. We also verify that
results are consistent when looking at disaggregated trade using product-level trade data. In this case,
the nomenclature used is SITC Revision3 at the most detailed level available (SITC 5-digit or SITC
4-digit level, where no further disaggregation is available in the nomenclature). The main advantage
of this estimation strategy is a more precise estimation of the effect of tariffs on export flows as we
use bilateral applied tariff at product level instead of the aggregated index TTRI.
44. The composition of the 5-year averages varies across variables and countries as data was not available
for all years between 2002 and 2007 for all variables and countries.
45. Following Baier, Bergstrand and Mariutto (2011) and Hoekman and Nicita (2011) no constraints are
imposed on the bilateral trade costs variables and its related MR term.
ESTIMATING THE CONSTRAINTS TO AGRICULTURAL TRADE OF DEVELOPING COUNTRIES – 31
OECD TRADE POLICY PAPER N°142 © OECD 2013
6). The results for the key explanatory variables remain stable across these alternative
specifications. Following the literature, as the model is run at the agricultural sector level, the
size of the economy (i.e. GDP) is replaced by the size of the sector, proxied by the value of
agricultural production in exporting countries and by the value of expenditure on agricultural
products in importing countries (Anderson and Yotov, 2010).
When the gravity model is estimated in a log-normal specification, zero trade
observations are discarded. However, just as it is interesting to observe the level of trade
between two countries, it is also interesting to observe the fact that some countries do not
trade at all in some products. This is all the more important when seeking to identify
constraints to trade. In line with the recent developments in the literature, this issue is
addressed by (i) adding 1 to all trade flows when estimating the model using Ordinary Least
Squares (OLS) and (ii) estimating the model using a Poisson Maximum Likelihood
Estimation (Poisson) instead of OLS (Santos Silva and Tenreyro, 2006).
Results for the “developing countries only” specification
The estimated coefficients (OLS and Poisson) and the corresponding elasticities are
reported in Annex 5 for the ―developing countries only‖ specification (see Annex 1 for
details on the calculation of elasticities).46
According to these outputs, it appears that
developing countries‘ agricultural exports are particularly sensitive to the quality of transport
and trade-related infrastructure, followed by political stability, education, fresh water
availability and tariffs.47
Results for the classical gravity variables are generally in line with the literature.
Distance remains an important impediment to bilateral trade, while sharing a border or a
common language increases trade flows between two countries.48
Obviously, countries with
higher agricultural production levels tend to trade more, while landlocked countries tend to
trade less. In line with the empirical evidence (Behar and Venables, 2010), being landlocked
reduces trade volumes by 40% (for importers) and 60% (for exporters). This result is
particularly informative for Sub-Saharan Africa where 40% of people live in landlocked
countries (Ndulu et al., 2007).
As expected, the quality of transport and trade-related infrastructure yields a positive
impact on developing countries‘ exports. Bouet et al. (2008) underline the fact that
quantifying the impact of separate types of infrastructure on trade remains difficult mainly
owing to the interactive nature of different types of infrastructure. Using an aggregate index
accounting for the quality of roads, ports and telecommunications is therefore appropriate in
this perspective. Although data did not allow comparing the effect of this index with the
effects of each of these components, the results confirms the significance of their combined
46.
We report heteroskedasticity robust standard errors. The inclusion of key variables of interest adds to
the total number of explanatory variables typically introduced in the classical gravity model. This
could possibly raise multicollinearity issues. However, the regressors‘ correlation matrix shows that
there are no powerful correlations between any pair of explanatory variables. In addition, introducing
the key variables of interest one by one in the regression raises results that are similar to those found
with the full regression presented in the paper, both in terms of sign and significance of the
coefficients.
47. We base our discussion of results on the coefficients obtained from the Poisson estimation as it better
takes into account the observations where trade is equal to zero and deals with potential
heteroskedasticity issues.
48. The fact of sharing a border is a significant constraint only in the OLS regression.
32 – ESTIMATING THE CONSTRAINTS TO AGRICULTURAL TRADE OF DEVELOPING COUNTRIES
OECD TRADE POLICY PAPER N°142 © OECD 2013
impact on trade: a 10% increase in the index of transport infrastructure quality would raise
exports by 30%.49
The results also point to the importance of complementary policies, such as the quality of
governance and education which have a positive and significant impact on exports. A 10%
improvement in the index of political stability and absence of violence or in the secondary
school enrolment rate seem to be associated with increases in trade value of 8.5% and, 7.2%
respectively, most probably both through their positive impact on agricultural productivity
and market participation of agricultural producers, as highlighted in section II.d. While this
is not surprising, in light of the existing evidence presented in the previous section, the
magnitude of these effects is noticeable. Indeed, political instability interrupts production
processes, can lead to the destruction of productive assets and transport systems, and
undermines investors‘ confidence. It further weakens the incentives to build state capacities
which include the power to enforce contracts and regulate markets, with negative outcomes
on the market economy and development (Besley and Persson, 2011). As for education, its
beneficial effects on farmers‘ ability to acquire new skills that contribute to improving their
productivity are well known. The case studies on Indonesia and Zambia highlight the
importance of literacy, numeracy and technical skills in farmers‘ capacity to seek agricultural
credit and to implement SPS and quality standards. The efficiency of extension services is
likely to increase with education, which is also likely to improve farmers‘ market
participation perspectives.
Unsurprisingly, comparative advantage variables are also found to have a significant
impact on countries‘ capacity to export. Greater availability of fresh water by 10% would
increase trade by 3.9%. The availability of agricultural land is positive but not statistically
significant. Policy implications for reforms and aid for trade in this respect are only indirect
since endowments in arable land and water resources are more or less a given. However,
domestic reforms supported by aid for trade can enable producers and exporters to use
natural resource endowments more efficiently, productively and in a sustainable manner.
With regard to trade policy, tariffs are found to have a significant negative impact on
agricultural trade. A decrease of 10% in the tariff trade restrictiveness would lead, on
average, to a 3.7% increase in agricultural exports. This is in line with the findings of other
studies that consider overall trade (Hoekman and Nicita, 2011; Hallaert et al., 2011). Being
part of a regional trade agreement proves to have a significant and important positive impact
on trade. This can reflect the fact that being part of a trade agreement does not only imply the
benefit of preferential tariffs but also of other economic gains (i.e. FTAs can promote
economic cooperation by offering a political forum of discussion) (Martin et al., 2010).
Together with the results for common border and language, this points to the importance of
stronger regional integration for boosting agricultural exports. Contrary to expectations, the
effect of the NTMRI term is found to be positive and significant. Data and measurement
issues could explain the difficulty in finding results that match expectations regarding the
impact of NTMs. Nevertheless, as underlined in Section I, recent studies suggest that, in the
case of agricultural products trade, NTMs (especially SPS standards) can enhance rather than
49.
It was not possible to disaggregate this index into its different components (e.g. roads, railways, port
quality, etc.) because, owing to the poor country coverage of these variables, the results did not prove
robust across specifications. The inclusion of such variables would induce major changes in the
country coverage. We tried to control as well for different trade facilitation indicators (such as cost of
export or the efficiency of the clearance processes by the border control agencies) and although some
tests would suggest a significant impact on trade flows, the results were not robust to different checks.
ESTIMATING THE CONSTRAINTS TO AGRICULTURAL TRADE OF DEVELOPING COUNTRIES – 33
OECD TRADE POLICY PAPER N°142 © OECD 2013
reduce trade, as they diminish information asymmetries (van Tongeren et al., 2009; Crivelli
and Gröschl, 2012)50
.
It proved difficult to capture robust impacts on exports of the productive capacity
variables (electricity and fertilisers). Fertiliser consumption is found to have a negative and
non-significant impact in the baseline Poisson specification, while its effect is found to be
positive and significant using an OLS estimator (in this case a 10% increase in fertiliser
consumption would increase exports by 2.1%, on average). Similarly, the coefficient for
electricity consumption is not significant in the Poisson nor in the OLS regressions. These
inconsistencies might be explained by the fact that these two variables remain imperfect
proxies for the patterns of fertiliser and electricity availability in the agricultural sector.
Lower values of fertiliser consumption can point to a more efficient use of fertilisers in
particular regions, allowing for a reduction of such inputs while obtaining the same amount
of agricultural output. Meanwhile, for many developing countries the intensity of fertiliser
use remains still extremely low when compared to some developed countries (Hernandez
and Torero, 2011) and low fertiliser use appears as one of the factors explaining lagging
agricultural productivity growth in regions such as Sub-Saharan Africa (Morris et al., 2007).
Similarly, national electricity consumption imperfectly reflects the availability of electricity
for the agricultural sector since, as stated in the previous section, the agricultural sector is not
the predominant consumer of energy in developing countries.
Although most of the key explanatory variables introduced in the regressions can be
considered as fixed in the short term, as their values vary very little over time and we have
used their average over the 2003-07 period, endogeneity issues could still arise since the
regression is based on cross-sectional data. The direction of causation should thus be very
carefully interpreted. Nevertheless, these results support a strong correlation between the key
explanatory variables and trade flows.
Comparative results for the “full sample”
The results for the ―full sample‖ specification, which considers both developing and
developed countries as exporters, are reported in Annex 5. Results are very much in line with
the results for the ―developing countries only‖ specification, although the magnitude of
elasticities slightly differs for some variables. In addition to constituting a necessary
robustness check of previous results, this specification gives interesting insights into the
specificity of the constraints faced by developing countries as compared to those faced by
developed countries.51
It appears that tariffs, NTMRI, primary school enrolment, governance
and fresh water availability have a more significant impact in developing countries than in
rich countries. The fact that the coefficient of the developing country dummy is negative
despite controlling for the size of the sector and various constraints, suggests that there are
still constraints that we have not managed to capture.
Data limitations did not allow robust results to be obtained when investigating the
potentially different effects of constraints on specific sub-groups of countries such as
50.
The results for the whole sample, of a negative and non-significant coefficient for developed
countries, seem to further confirm this interpretation.
51. The Chow test reported in Annex 4 confirms that the difference in the coefficients for the two groups
(developing countries versus developed countries) is statistically significant.
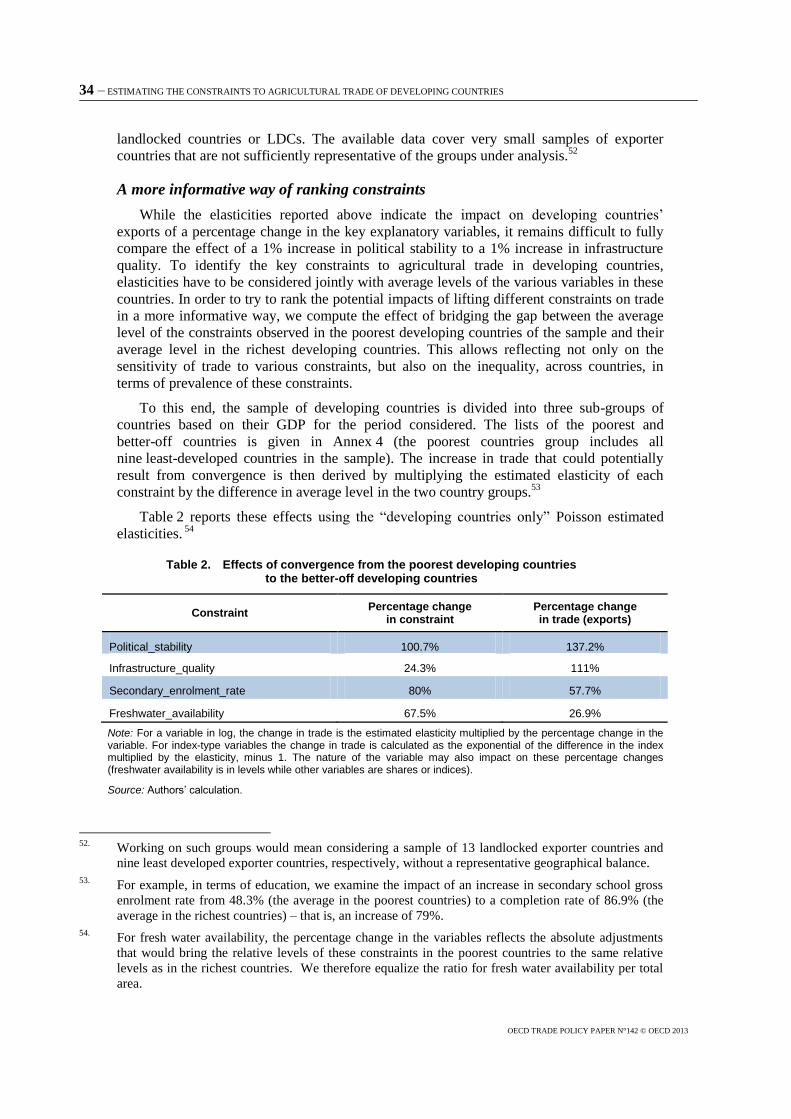
34 – ESTIMATING THE CONSTRAINTS TO AGRICULTURAL TRADE OF DEVELOPING COUNTRIES
OECD TRADE POLICY PAPER N°142 © OECD 2013
landlocked countries or LDCs. The available data cover very small samples of exporter
countries that are not sufficiently representative of the groups under analysis.52
A more informative way of ranking constraints
While the elasticities reported above indicate the impact on developing countries‘
exports of a percentage change in the key explanatory variables, it remains difficult to fully
compare the effect of a 1% increase in political stability to a 1% increase in infrastructure
quality. To identify the key constraints to agricultural trade in developing countries,
elasticities have to be considered jointly with average levels of the various variables in these
countries. In order to try to rank the potential impacts of lifting different constraints on trade
in a more informative way, we compute the effect of bridging the gap between the average
level of the constraints observed in the poorest developing countries of the sample and their
average level in the richest developing countries. This allows reflecting not only on the
sensitivity of trade to various constraints, but also on the inequality, across countries, in
terms of prevalence of these constraints.
To this end, the sample of developing countries is divided into three sub-groups of
countries based on their GDP for the period considered. The lists of the poorest and
better-off countries is given in Annex 4 (the poorest countries group includes all
nine least-developed countries in the sample). The increase in trade that could potentially
result from convergence is then derived by multiplying the estimated elasticity of each
constraint by the difference in average level in the two country groups.53
Table 2 reports these effects using the ―developing countries only‖ Poisson estimated
elasticities. 54
Table 2. Effects of convergence from the poorest developing countries to the better-off developing countries
Constraint Percentage change
in constraint Percentage change in trade (exports)
Political_stability 100.7% 137.2%
Infrastructure_quality 24.3% 111%
Secondary_enrolment_rate 80% 57.7%
Freshwater_availability 67.5% 26.9%
Note: For a variable in log, the change in trade is the estimated elasticity multiplied by the percentage change in the variable. For index-type variables the change in trade is calculated as the exponential of the difference in the index multiplied by the elasticity, minus 1. The nature of the variable may also impact on these percentage changes (freshwater availability is in levels while other variables are shares or indices).
Source: Authors’ calculation.
52.
Working on such groups would mean considering a sample of 13 landlocked exporter countries and
nine least developed exporter countries, respectively, without a representative geographical balance.
53. For example, in terms of education, we examine the impact of an increase in secondary school gross
enrolment rate from 48.3% (the average in the poorest countries) to a completion rate of 86.9% (the
average in the richest countries) – that is, an increase of 79%.
54. For fresh water availability, the percentage change in the variables reflects the absolute adjustments
that would bring the relative levels of these constraints in the poorest countries to the same relative
levels as in the richest countries. We therefore equalize the ratio for fresh water availability per total
area.
ESTIMATING THE CONSTRAINTS TO AGRICULTURAL TRADE OF DEVELOPING COUNTRIES – 35
OECD TRADE POLICY PAPER N°142 © OECD 2013
Table 2 shows that the gap between low- and high- income countries is particularly large
in terms of political stability and enrolment in secondary education. With regards to the
impact on trade, it suggests that the largest boost for the poorest countries would come from
improvements in infrastructure and political stability. The high elasticity of trade to
infrastructure quality indeed means that bridging a however moderate gap in infrastructure
quality between the poorest and the richest countries could more than double the poorest
countries‘ agricultural exports. The same is true for bridging the more important gap in
political stability. Educational and social reforms that increase participation in secondary
school would also significantly improve trade performance and favour a more sustainable
social and economic development. It is interesting to note the sizes of the effects of enhanced
political stability and education relative to the improvements in infrastructure, which often
attract the largest amount of aid for trade. Although there is a very large inequality in the
volume of freshwater availability between the two country sub-groups, the impact on trade is
much smaller due to a relatively low elasticity.
This ranking exercise is not sufficient in itself to direct aid flows or prioritise domestic
reforms. Policy conclusions for aid for trade investments should be drawn by comparing
these outcomes with the cost and feasibility of actually achieving the improvements being
discussed. The econometric approach, while suffering from data limitations, serves to
highlight the relative importance of different constraints to agricultural development in
developing countries, and the need to take into account country-specific circumstances in
designing aid for trade programmes. The three case studies presented in Sections V to VII
below seek to highlight these considerations.
V. Case study – Indonesia: Addressing the challenges of standards
and conformity assessment
This case study analyses the challenges faced by Indonesia in capitalising on its large
agricultural export potential to the European Union. This potential has not been fully
exploited as regards fisheries and processed agro-food products, mainly due to the difficulty
of Indonesian exporters to conform to public and private standards applied in foreign
markets, in particular EU markets. The study reviews actions undertaken by the government
in order to overcome those supply-side constraints and discusses the responses brought by
several Aid for Trade programmes in support of these actions.
Indonesia has been quite actively involved in the Aid for Trade Initiative, as illustrated
by the country‘s replies to the Aid for Trade questionnaire and the two case stories submitted
to the WTO/OECD for the Third Global Review on Aid for Trade55
. Indonesia‘s replies to
the questionnaire show that trade policy and regulation, and in particular adaptation and
compliance with regulation and standards, was a major priority in Indonesia‘s trade strategy.
This was confirmed during interviews with Indonesian officials in late 2011, who outlined
that improving the capacity of exporters to comply with foreign market requirements was of
paramount importance for Indonesia. One of the case stories submitted to the WTO/OECD
focuses on the Trade Support Program, financed and implemented by the European
Commission in 2006, with the objective to help Indonesia overcome the supply side
constraints faced by the exporters of fisheries and processed agro-food products, who seek to
meet standard and regulatory requirements in the EU market. This case study reviews the
relevant literature in order to assess the success of this endeavour, while pointing at
remaining challenges. The remainder of this section is structured as follows: after a
55.
Available at: www.oecd.org/dataoecd/9/8/47713306.pdf and
www.oecd.org/countrylist/0,3349,en_21571361_46750445_46846376_1_1_1_1,00.html#I:
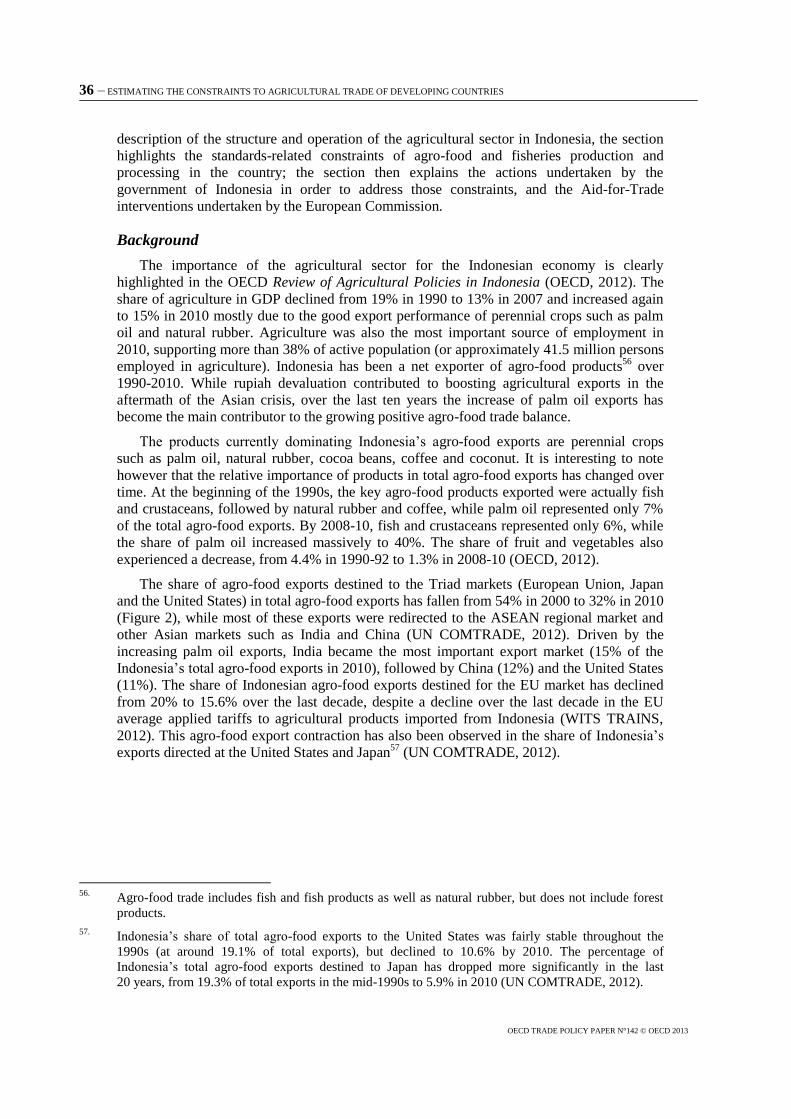
36 – ESTIMATING THE CONSTRAINTS TO AGRICULTURAL TRADE OF DEVELOPING COUNTRIES
OECD TRADE POLICY PAPER N°142 © OECD 2013
description of the structure and operation of the agricultural sector in Indonesia, the section
highlights the standards-related constraints of agro-food and fisheries production and
processing in the country; the section then explains the actions undertaken by the
government of Indonesia in order to address those constraints, and the Aid-for-Trade
interventions undertaken by the European Commission.
Background
The importance of the agricultural sector for the Indonesian economy is clearly
highlighted in the OECD Review of Agricultural Policies in Indonesia (OECD, 2012). The
share of agriculture in GDP declined from 19% in 1990 to 13% in 2007 and increased again
to 15% in 2010 mostly due to the good export performance of perennial crops such as palm
oil and natural rubber. Agriculture was also the most important source of employment in
2010, supporting more than 38% of active population (or approximately 41.5 million persons
employed in agriculture). Indonesia has been a net exporter of agro-food products56
over
1990-2010. While rupiah devaluation contributed to boosting agricultural exports in the
aftermath of the Asian crisis, over the last ten years the increase of palm oil exports has
become the main contributor to the growing positive agro-food trade balance.
The products currently dominating Indonesia‘s agro-food exports are perennial crops
such as palm oil, natural rubber, cocoa beans, coffee and coconut. It is interesting to note
however that the relative importance of products in total agro-food exports has changed over
time. At the beginning of the 1990s, the key agro-food products exported were actually fish
and crustaceans, followed by natural rubber and coffee, while palm oil represented only 7%
of the total agro-food exports. By 2008-10, fish and crustaceans represented only 6%, while
the share of palm oil increased massively to 40%. The share of fruit and vegetables also
experienced a decrease, from 4.4% in 1990-92 to 1.3% in 2008-10 (OECD, 2012).
The share of agro-food exports destined to the Triad markets (European Union, Japan
and the United States) in total agro-food exports has fallen from 54% in 2000 to 32% in 2010
(Figure 2), while most of these exports were redirected to the ASEAN regional market and
other Asian markets such as India and China (UN COMTRADE, 2012). Driven by the
increasing palm oil exports, India became the most important export market (15% of the
Indonesia‘s total agro-food exports in 2010), followed by China (12%) and the United States
(11%). The share of Indonesian agro-food exports destined for the EU market has declined
from 20% to 15.6% over the last decade, despite a decline over the last decade in the EU
average applied tariffs to agricultural products imported from Indonesia (WITS TRAINS,
2012). This agro-food export contraction has also been observed in the share of Indonesia‘s
exports directed at the United States and Japan57
(UN COMTRADE, 2012).
56.
Agro-food trade includes fish and fish products as well as natural rubber, but does not include forest
products.
57. Indonesia‘s share of total agro-food exports to the United States was fairly stable throughout the
1990s (at around 19.1% of total exports), but declined to 10.6% by 2010. The percentage of
Indonesia‘s total agro-food exports destined to Japan has dropped more significantly in the last
20 years, from 19.3% of total exports in the mid-1990s to 5.9% in 2010 (UN COMTRADE, 2012).
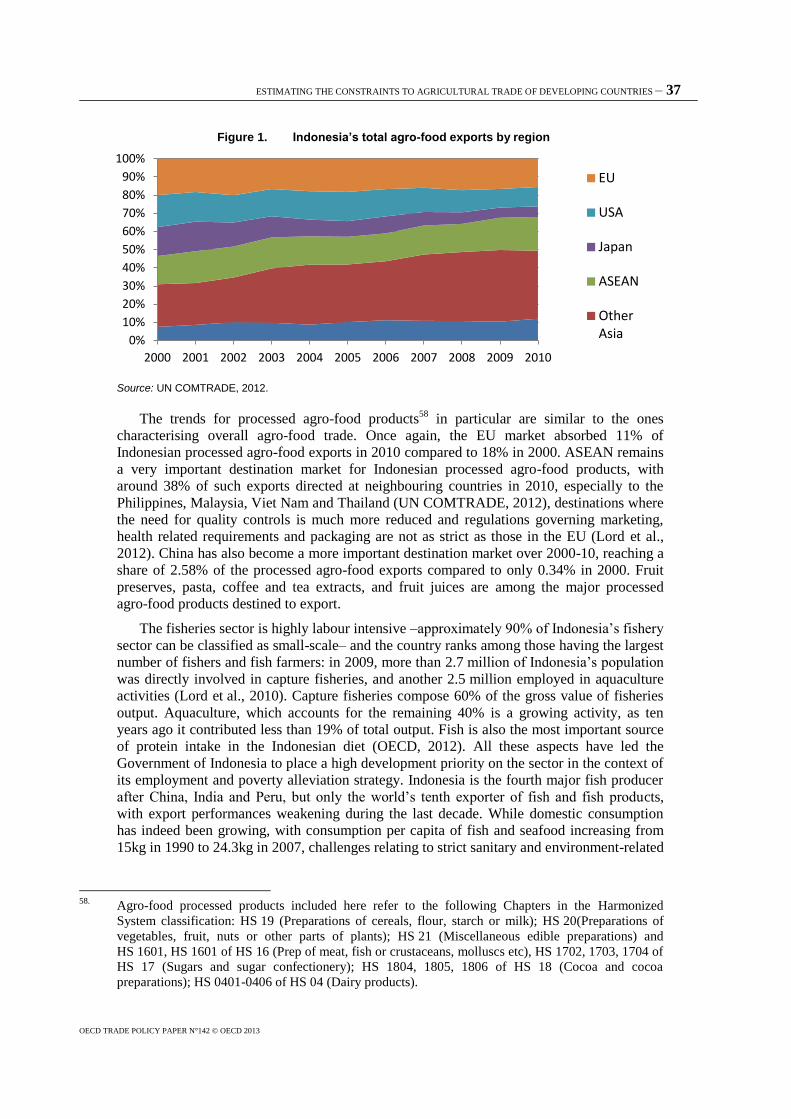
ESTIMATING THE CONSTRAINTS TO AGRICULTURAL TRADE OF DEVELOPING COUNTRIES – 37
OECD TRADE POLICY PAPER N°142 © OECD 2013
Figure 1. Indonesia’s total agro-food exports by region
Source: UN COMTRADE, 2012.
The trends for processed agro-food products58
in particular are similar to the ones
characterising overall agro-food trade. Once again, the EU market absorbed 11% of
Indonesian processed agro-food exports in 2010 compared to 18% in 2000. ASEAN remains
a very important destination market for Indonesian processed agro-food products, with
around 38% of such exports directed at neighbouring countries in 2010, especially to the
Philippines, Malaysia, Viet Nam and Thailand (UN COMTRADE, 2012), destinations where
the need for quality controls is much more reduced and regulations governing marketing,
health related requirements and packaging are not as strict as those in the EU (Lord et al.,
2012). China has also become a more important destination market over 2000-10, reaching a
share of 2.58% of the processed agro-food exports compared to only 0.34% in 2000. Fruit
preserves, pasta, coffee and tea extracts, and fruit juices are among the major processed
agro-food products destined to export.
The fisheries sector is highly labour intensive –approximately 90% of Indonesia‘s fishery
sector can be classified as small-scale– and the country ranks among those having the largest
number of fishers and fish farmers: in 2009, more than 2.7 million of Indonesia‘s population
was directly involved in capture fisheries, and another 2.5 million employed in aquaculture
activities (Lord et al., 2010). Capture fisheries compose 60% of the gross value of fisheries
output. Aquaculture, which accounts for the remaining 40% is a growing activity, as ten
years ago it contributed less than 19% of total output. Fish is also the most important source
of protein intake in the Indonesian diet (OECD, 2012). All these aspects have led the
Government of Indonesia to place a high development priority on the sector in the context of
its employment and poverty alleviation strategy. Indonesia is the fourth major fish producer
after China, India and Peru, but only the world‘s tenth exporter of fish and fish products,
with export performances weakening during the last decade. While domestic consumption
has indeed been growing, with consumption per capita of fish and seafood increasing from
15kg in 1990 to 24.3kg in 2007, challenges relating to strict sanitary and environment-related
58.
Agro-food processed products included here refer to the following Chapters in the Harmonized
System classification: HS 19 (Preparations of cereals, flour, starch or milk); HS 20(Preparations of
vegetables, fruit, nuts or other parts of plants); HS 21 (Miscellaneous edible preparations) and
HS 1601, HS 1601 of HS 16 (Prep of meat, fish or crustaceans, molluscs etc), HS 1702, 1703, 1704 of
HS 17 (Sugars and sugar confectionery); HS 1804, 1805, 1806 of HS 18 (Cocoa and cocoa
preparations); HS 0401-0406 of HS 04 (Dairy products).
0%
10%
20%
30%
40%
50%
60%
70%
80%
90%
100%
2000 2001 2002 2003 2004 2005 2006 2007 2008 2009 2010
EU
USA
Japan
ASEAN
Other Asia
38 – ESTIMATING THE CONSTRAINTS TO AGRICULTURAL TRADE OF DEVELOPING COUNTRIES
OECD TRADE POLICY PAPER N°142 © OECD 2013
standards remain high when exporting to key markets such as the European Union, the
United States or Japan (OECD, 2012).
The EU market absorbed 10% of Indonesia‘s total fisheries exports59
in 2010. Another
34% of Indonesian fisheries exports went to the United States and 24.1% to Japan in 2010,
while approximately 11.6% were destined to ASEAN countries. In the last decade Indonesia
lost one third of its EU market share due to external competition from large exporters like
Ecuador and China, as well as internal inertia in addressing applicable standards and
certification requirements (Lord et al., 2010). Consequently, there seems to be considerable
scope for Indonesia to increase the amount of fishery products exported to the EU market.
Lord et al. (2010) estimated that if Indonesia had managed to expand its share of fish and
fish products exports to the EU market in proportion to the EU share of world imports, its
foreign exchange revenue from fishery exports would have more than doubled. Such an
increase in exports could produce economy-wide impacts due to the additional employment
and reinforce linkages with downstream and supporting industries.
The reduction in the share of Indonesian exports to EU markets can seem thus
paradoxical given the country‘s favourable economic and commercial features. The food
industry has a huge potential, as EU demand for imports of fisheries products and agro-food
processed products is projected to grow by nearly 8% and 3.5% a year respectively between
2010 and 2015 (Lord et al., 2010). Indonesia is in a particularly favourable position in that it
has both the world‘s largest catch of the species consumed by the EU and a large variety of
tropical and exotic fruits, prepared vegetables and fruits, and condiments and seasonings for
which a strong demand exists in the EU.60
Moreover, Indonesia has the possibility to use
trade preferences under the Generalized System of Preferences (GSP) to promote its
agricultural exports to the EU. However, while 40% of the total EU imports from Indonesia
would be eligible to preferential treatment under the GSP, only around 23% are actually
covered under the GSP scheme and the majority of the products are non-agricultural (Lord
et al., 2010).
The challenge of standards-related requirements
While conformity to standards is a global difficulty affecting all exporters around the
world, evidence suggests that the decline of Indonesian processed agro-food exports to EU
and other Triad markets is mostly due to the difficulties of Indonesian exporters in
conforming to applicable food safety and quality standards, and certification requirements
for products and management systems (Lord et al. 2010). Beyond mandatory requirements,
private standards, such as GLOBALG.A.P61
certification, are now a de facto prerequisite for
doing business with most European agro-food companies.
59.
Fisheries exports includes here the following Chapters in the Harmonized System classification:
Chapter 03 (Fish and crustacean, mollusc and other aquatic invertebrates) and part of HS 16 covering
HS 1604 (Prepared or preserved fish; caviar and caviar substitutes prepared from fish eggs) and
HS 1605 (Crustaceans, molluscs and other aquatic invertebrates, prepared or preserved).
60. The fruit subsector is the most dependent on foreign supplies and one of the fastest growing markets
in the EU. The average import growth rate reached 4% in 2009 (Lord et al., 2010).
61. GLOBALG.A.P (formerly EUREPGAP) is a private sector body that sets voluntary standards for the
certification of production processes of agricultural (including aquaculture) products around the globe.
It results from the effort of several European supermarket chains and their major suppliers to
harmonize supply chain standards for good agricultural practice (GAP) in order to bring conformity to
different retailers‘ supplier standards. It is now the world‘s most widely implemented farm
certification scheme. For further detail see:
ESTIMATING THE CONSTRAINTS TO AGRICULTURAL TRADE OF DEVELOPING COUNTRIES – 39
OECD TRADE POLICY PAPER N°142 © OECD 2013
H.E. Mr. Erwidodo, Indonesia‘s ambassador to the WTO and former chairman of the
Committee on Trade and Development, stresses the particular challenges the country faces in
meeting standards in foreign markets62
. The ambassador estimates that, while poor
infrastructure (in particular highways, roads, public transportation and electricity) and high
logistical costs (in cargo handling, storage and warehousing, packaging, maritime and air
freight transport, rail and road transport and other supporting services) are major obstacles to
the promotion of agricultural trade in domestic Indonesian markets, low quality of processed
agricultural export products, lack of standards at the local level and challenges in conformity
with foreign standards are the main constraint to exports promotion on foreign markets. He
argues that, due to this constraint, Indonesian processed agricultural products do not enjoy
the price premium to which they could lay claim, cannot upgrade to new, more profitable
market segments, but they are also subject to automatic detention in some of their export
destinations, mainly the US and EU markets. Indonesia‘s difficulty to meet developed
market standards relegates the country to the production of raw materials and products which
have relatively small value-added (nearly 40% of the country‘s total non-fuel exports were in
the form of unprocessed goods in 2009) and produce few economic linkages generating
growth in the wider economy. It has increasingly allowed other fast-growing ASEAN
economies, where, contrary to Indonesia, upgrading to industrial processing activities had
already occurred, to use Indonesia‘s natural resources in their unprocessed forms to move up
the value chains and produce greater quantities of processed and high-tech products.
According to Soesastro and Basri (2005) standards-related challenges for Indonesian
exports are to a large extent linked to supply-side difficulties, in particular in the fisheries
and processed agro-food sectors, where many products fail to meet the high standards
applied to them in global markets63
. The difficulties in meeting standards requirements for
processed agro-food and fisheries products in the EU market relate essentially to export
quality and infrastructure constraints. Some of them, which affect not only agro-food but
also manufacturing industries, relate to testing and accreditation difficulties, while others are
specific to the agro-food industries and mainly relate to SPS requirements. Overcoming these
obstacles would not only permit Indonesian exporters to gain greater access to the EU
market, but also expand exports to other developed markets.
One of the major constraints, common to all Indonesian industries exporting into the
European Union, is their poor access to satisfactory testing and certification facilities and
agencies. Indonesian laboratories lack the capacity to test and assess the conformity of
products with EU requirements, primarily due to the shortage of qualified technical experts
and of the necessary equipment and physical infrastructure. Shortcomings in quality
assurance, calibration and method verification limit the ability of laboratories to perform the
whole array of testing and analysis required by the European Union. Certificates issued by
local certification bodies for Good Agricultural Practices (GAP)64
, Good Handling
www.globalgap.org/cms/front_content.php?client=1&changelang=1&parent=&subid=&idcat=9
62. 2011 interview with the OECD Secretariat. See also Oktaviani and Erwidodo (2005).
63. 2011 interview with Dr.Tahlim Sudaryanto, Assistant Minister for International Cooperation in the
Ministry of Agriculture of the Republic of Indonesia.
64. GAP promote basic food safety principles to minimize biological, chemical and physical hazards
associated with crops from seed through harvest storage. They specifically address the following
topics: site selection; adjacent land use; water; fertilizers; herbicides/pesticides; hygiene; field, facility
and worker hygiene; product cooling; and transportation.
40 – ESTIMATING THE CONSTRAINTS TO AGRICULTURAL TRADE OF DEVELOPING COUNTRIES
OECD TRADE POLICY PAPER N°142 © OECD 2013
Practices (GHdP), Good Manufacturing Practices (GMP)65
and Hazard Analysis Critical
Control Point (HACCP)66
, are not always recognised internationally, as most of these bodies
develop their own criteria rather than following internationally harmonised criteria. This
creates important problems for the accreditation of national certification bodies, which is
vital for demonstrating conformity to management system standards67
. The high cost of
accreditation, which most certification bodies are unable to afford further complicates things.
Box 1. The particular case of organic products
Certification issues are clearly highlighted in a case study on organic certification systems undertaken by the Indonesian Agricultural Sciences Association (IASA, 2011). While it is widely recognised by firms and farmers that certification is an important factor for developing the trust required for price premiums to organic agriculture products, Indonesia faces difficulties in organising standardisation for organic food products and organic farm products. Organic standards are set by individual practitioners, traders and handlers, re-packers or individual producers of certain products who use them for internal purposes only, but few generally acceptable standards exist that are elaborated and approved at the national level through the wide participation of practitioners of the organic agriculture movement. This fragmentation and the related lack of any legal protection or quality signs make both certification and labelling impossible for most of these standards, according to IASA.
Indonesia has only a few officially recognised and legally accredited certification bodies that certify organic products, though their number has increased in recent years. Most of these certification bodies only provide certifications for the recently adopted basic national standards for the domestic market, which are different from those applied by foreign certification agencies. As suggested by IASA (2011), this is problematic for the promotion of Indonesian products in international markets.
As an example, while there are numerous laboratories, public and private, involved in the
testing of fisheries products68
and all are in principle required to be accredited in accordance
with ISO 1702569
, most of them are not accredited for the entire scope of the testing
performed and their competence in regards to certain test parameters is not recognised
internationally, generating serious obstacles for the detection of antibiotics and heavy metals
in products designated for export. Certificates issued nationally by bodies lacking
accreditation and on the basis of divergent domestic standards are of little use to companies
willing to export on foreign markets. For those companies the only available path to export is
to use international certification bodies, an extremely costly proposition that most companies
65.
GMP begin from the harvest and storage stage and serve to guide people working in contact with
food, its packaging materials, and work environment to conform to basic sanitation and hygiene
practices so as to protect against food contamination from both direct or indirect sources.
66. HACCP is a systematic analysis for potential food safety risks within, for example, a post-harvest or
processing operation.
67. Accreditation implies costs for the initial set-up and the maintenance of quality systems, but improves
the national and global reputation and image of the laboratory and stimulates a continuous
improvement of data quality and laboratory effectiveness. It allows laboratories to obtain contracts
from public and private organizations that only deal with accredited laboratories, as well as from
organizations that do not mandate accreditation but give preference to accredited laboratories in
competitive situations. For further details, see:
www.labcompliance.com/tutorial/iso17025/default.aspx.
68. Such as 39 provincial fishery laboratories, 53 laboratories under the Ministry of Marine Affairs and
Fisheries (MMAF) dealing with fishery diseases in aquaculture, the Balai Besar Industri Agro (BBIA)
research centre for agriculture industry, private laboratories and the laboratories of fishery companies.
69. ISO 17025 is the global quality standard for testing and calibration laboratories used as the basis for
accreditation from accreditation bodies.
ESTIMATING THE CONSTRAINTS TO AGRICULTURAL TRADE OF DEVELOPING COUNTRIES – 41
OECD TRADE POLICY PAPER N°142 © OECD 2013
simply cannot afford. In 2011, an Indonesian processing company operating in the fisheries
sector and seeking to access European markets would have to face about USD 10 000 of
costs associated with certification and audit to British Retail Consortium‘s standards70
.
In the area of fruit processing, quality and health safety testing of fruit juices for
pesticides, heavy metals and against microbiological criteria, operated by external
laboratories is also extremely costly. It is however the only possibility for small-scale farms,
which, contrary to larger companies, cannot afford to operate in-house quality testing
laboratories, due to the importance of analytical equipment and operational costs. As a result,
most small-scale farms do not conduct the required tests and are therefore unable to certify
the respect of required hygiene and product safety criteria.
An EU inspection mission conducted in 2009 in several official laboratories71
discovered
shortcomings regarding proficiency tests and the use of standard methods. While tests for
histamine and heavy metals reported unsatisfactory results, the analytical method used for
histamine detection was not the method required by the European Union and was not
validated against that method. Moreover, most laboratories, especially those located in
remote provinces, were unable to comply with EU requirements when performing testing for
health certificates, because they lack competent personnel, especially with regard to the
analytical measurement of heavy metals, histamine and antibiotics, or, in the case of
processors laboratories, sufficient expertise with quality assurance applications. Finally, the
equipment in many laboratories is not calibrated and, where calibration is conducted as
required, inexperienced technical staff is often unable to interpret the calibration certificate.
Export quality and infrastructure problems specific to the agro-food industries are mainly
related to SPS requirements in the EU market and could be classified in four categories,
which will be further detailed in the following paragraphs:
poor knowledge of EU mandatory requirements and applicable standards and
practices among producers and processors;
lack of sufficient financial, technical and managerial resources for the agro-food
value chains to implement the requirements;
infrastructure and equipment shortages; and
insufficient enforcement capacity among the supervising authorities.
Awareness of the required specifications for agro-food products destined for export is
quite limited, in particular among Indonesian small and medium-size enterprises, which
concentrate the bulk of food production in the country72
(Alimi, 2007). Information on
foreign standards is difficult to access because the distribution channels are opaque: small
producers do not have direct access to information on EU regulations and the information
channels from the Ministry of Marine Affairs and Fisheries (MMAF) to the companies are
quite slow, in particular among producers and processors based in remote areas. Even in
cases where the information is adequately communicated, the information content is
complex and highly technical, making it unintelligible to enterprises having limited training
and understanding in order to digest it. Poor awareness of GAP, GHdP and EU regulations
and restrictions on antibiotics among small, family sized aquaculture businesses located in
remote areas, largely explains the widespread use of antibiotics for disease prevention in
70.
www.brcglobalstandards.com/GlobalStandards/About.aspx.
71 . ec.europa.eu/food/fvo/rep_details_en.cfm?rep_id=2226
72. With the exception of palm oil, which is mainly produced by large industrial plantations and mills.
42 – ESTIMATING THE CONSTRAINTS TO AGRICULTURAL TRADE OF DEVELOPING COUNTRIES
OECD TRADE POLICY PAPER N°142 © OECD 2013
fishery farming. Farmers lack information on production process controls, disease
prevention, application of medicines and feed, applicable Indonesian and EU regulations,
resulting in a 20% rate of EU border inspection of products originating from Indonesia (Lord
et al., 2010).
Many processing agro-food SMEs are unable to provide the required quality, not only
due to the shortage of qualified staff but also because of excessive costs associated with
standards conformity, and the inability to pay for the service offered by laboratories or
access the credit needed for such a purpose. SMEs in Indonesia face in particular difficulties
providing reliable supplies as regards the presence of contaminants. As a consequence,
Indonesian processors exporting to the European Union cannot guarantee73
that requirements
on permissible concentration thresholds for contaminants that are contained in food
regulations ―from farm to fork‖ are being met. Likewise, the fishery supply chain lacks
traceability at the level of farmers and fishery vessels. In both wild sea catch and fish or
shrimp farming the product is collected by middlemen and generally sold to the fishery
processors74
, who then export to the EU market. Middlemen, who are essentially family run
SMEs, collect from several fishery vessels and farmers and usually mix the products from
different sources, so that the traceability requirement cannot be met. Although the MMAF
promotes implementation of GHdP, most middlemen have still insufficient understanding
and quality assurance capacity, while controls undertaken by the Ministry itself and the local
authorities are still inadequate. Fishery processors are required to audit their suppliers in
regard to GHdP, but audits are rarely performed due to the shortage of competent auditors
deployed by the local authorities.
Quality and food safety problems are also due to the shortage of infrastructure and
equipment meant to preserve the appropriate temperature and hygiene conditions. In the
fisheries sector, the lack of an appropriate cooling chain on boats and at the harbour during
collection and transport to processors, and the presence of antibiotics result in fishery
products failing EU hygiene and sanitary norms. Implementation and certification of GAqP
and GHdP in the wild catch supply chain is problematic, especially at the level of SMEs. The
Indonesian fishing fleet consists mostly of small fishing boats75
, which have problems in
complying with the strict hygienic requirements due to insufficient knowledge about hygiene
and limited space on the boats. Proper storage of the catch with ice is usually not ensured –
block ice factories supplying fishery vessels sometimes do not meet the necessary sanitary
standards – and the control of hygienic conditions is poor. Only a small percentage of the
operating fishing vessels are inspected by the MMAF, the competent authority as regards
conformity with EU requirements. Proper detection of antibiotic residues by processors prior
to incoming inspections requires the purchase of costly screening methods that only large
companies can afford.
Fruit farming, mainly undertaken in small farms76
, faces similar constraints at the
harvesting, pre-processing and sorting stages. The size of the farms, poor awareness and
training on GAP and HACCP and financial constraints for acquiring the necessary
73.
Most processors only have the capacity to perform visual inspections.
74. However, fish processors prefer purchasing directly from farmers or fishing vessels, as long as the
supplier can provide sufficiently large amounts of products.
75. However, seven large freezer vessels are operating in Indonesia. On these freezer vessels the catch is
processed on board ready for export.
76. However, some large farms exist, which are specialized in certain fruit types, such as pineapple in Sumatra.
ESTIMATING THE CONSTRAINTS TO AGRICULTURAL TRADE OF DEVELOPING COUNTRIES – 43
OECD TRADE POLICY PAPER N°142 © OECD 2013
equipment, do not facilitate the implementation of required hygiene regulations77
and the
application of process steps meant to avoid contamination from soil, water, fertiliser, plant
protection and biocide products and ensure the sterilisation of storage containers and
vehicles. Since only visual inspections can be performed during purchasing, the risk of
exceeding allowed contaminant level in the final product is high. Consequently, Indonesian
fruit juice exporters prefer not to rely on small and medium size farms and to operate their
own farms or to purchase fruit pulp from foreign suppliers. The processing steps, when fruit
is peeled, cut in pieces, and blended to pulp or juice, raise challenges for proper
pasteurisation, sterilisation and bottling in accordance with GMP and HACCP. Beyond
equipment shortages and financial constraints for adapting premises to GMP requirements78
,
the implementation of these practices is complicated by the perception that the HACCP
system is too administrative, too complicated and too expensive.
Finally, there is often insufficient control of producers and products from the Ministry of
Agriculture and the MMAF, and this is problematic as merchandise not conforming to EU
requirements may be exported and then rejected at the border with important financial
implications due to merchandise destruction or repatriation.
Interventions by the government of Indonesia to address supply-side constraints in
the agro-food and fisheries export sectors
The current 2010-14 strategic plan for agriculture covers four priority objectives of
agricultural policy: (a) achieve food self-sufficiency, (b) enhance diversification of
production and consumption, (c) raise the competitiveness and value added of production,
and (d) increase farmers‘ welfare. In addition to the above four, two other priorities gained
importance during the last decade, namely ensuring the environmental sustainability of
production, as well as improving governance structures and accountability (OECD, 2012).
In order to achieve these objectives, the government and local authorities in Indonesia
have taken a series of steps aimed at addressing supply-side constraints and facilitating and
improving the compliance of exporters to EU requirements. These steps range from
institutional and regulatory interventions to the promotion of good practices, and the
provision of direct material and financial support to firms. Most of the interventions
covering processed agro-food and fisheries products were directed at the fisheries sector,
most likely because demand for Indonesia‘s processed fisheries products in global markets
is relatively higher than for its agro-food products and because these products offer greater
opportunities for small and medium sized farms in moving to higher-value activities.
Important efforts have been undertaken to raise awareness and provide partial support for
building capacity and overcoming financial and equipment constraints. On the other hand,
interventions to address the general challenge of access to satisfactory testing and
certification facilities were more limited.
The most important institutional intervention was an extensive restructuring of the
testing and certification sector undertaken by the MMAF with the aim of reducing the
number of testing laboratories and achieving higher efficiency and better quality among
them (Lord et al., 2010). At the same time the authorities in charge of quality and food
safety controls for fishery products, previously divided into three Directorates with poorly
defined responsibilities, were brought under a single Fish Quarantine and Inspection
77.
For instance, EU regulations on maximum pesticides residue.
78. Such as the requirement that tables, walls, ceilings, doors and equipment are designed so that they do
not easily accumulate dirt and are easy to clean.
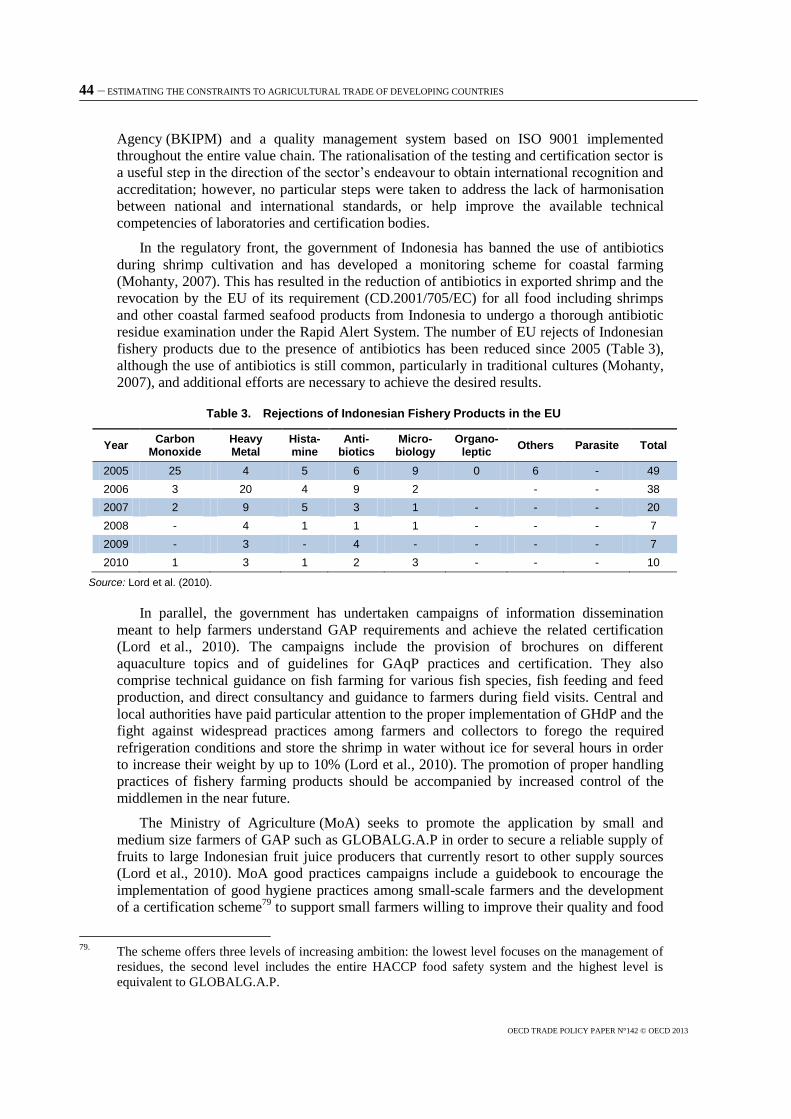
44 – ESTIMATING THE CONSTRAINTS TO AGRICULTURAL TRADE OF DEVELOPING COUNTRIES
OECD TRADE POLICY PAPER N°142 © OECD 2013
Agency (BKIPM) and a quality management system based on ISO 9001 implemented
throughout the entire value chain. The rationalisation of the testing and certification sector is
a useful step in the direction of the sector‘s endeavour to obtain international recognition and
accreditation; however, no particular steps were taken to address the lack of harmonisation
between national and international standards, or help improve the available technical
competencies of laboratories and certification bodies.
In the regulatory front, the government of Indonesia has banned the use of antibiotics
during shrimp cultivation and has developed a monitoring scheme for coastal farming
(Mohanty, 2007). This has resulted in the reduction of antibiotics in exported shrimp and the
revocation by the EU of its requirement (CD.2001/705/EC) for all food including shrimps
and other coastal farmed seafood products from Indonesia to undergo a thorough antibiotic
residue examination under the Rapid Alert System. The number of EU rejects of Indonesian
fishery products due to the presence of antibiotics has been reduced since 2005 (Table 3),
although the use of antibiotics is still common, particularly in traditional cultures (Mohanty,
2007), and additional efforts are necessary to achieve the desired results.
Table 3. Rejections of Indonesian Fishery Products in the EU
Year Carbon
Monoxide Heavy Metal
Hista-mine
Anti-biotics
Micro- biology
Organo-leptic
Others Parasite Total
2005 25 4 5 6 9 0 6 - 49
2006 3 20 4 9 2 - - 38
2007 2 9 5 3 1 - - - 20
2008 - 4 1 1 1 - - - 7
2009 - 3 - 4 - - - - 7
2010 1 3 1 2 3 - - - 10
Source: Lord et al. (2010).
In parallel, the government has undertaken campaigns of information dissemination
meant to help farmers understand GAP requirements and achieve the related certification
(Lord et al., 2010). The campaigns include the provision of brochures on different
aquaculture topics and of guidelines for GAqP practices and certification. They also
comprise technical guidance on fish farming for various fish species, fish feeding and feed
production, and direct consultancy and guidance to farmers during field visits. Central and
local authorities have paid particular attention to the proper implementation of GHdP and the
fight against widespread practices among farmers and collectors to forego the required
refrigeration conditions and store the shrimp in water without ice for several hours in order
to increase their weight by up to 10% (Lord et al., 2010). The promotion of proper handling
practices of fishery farming products should be accompanied by increased control of the
middlemen in the near future.
The Ministry of Agriculture (MoA) seeks to promote the application by small and
medium size farmers of GAP such as GLOBALG.A.P in order to secure a reliable supply of
fruits to large Indonesian fruit juice producers that currently resort to other supply sources
(Lord et al., 2010). MoA good practices campaigns include a guidebook to encourage the
implementation of good hygiene practices among small-scale farmers and the development
of a certification scheme79
to support small farmers willing to improve their quality and food
79.
The scheme offers three levels of increasing ambition: the lowest level focuses on the management of
residues, the second level includes the entire HACCP food safety system and the highest level is
equivalent to GLOBALG.A.P.
ESTIMATING THE CONSTRAINTS TO AGRICULTURAL TRADE OF DEVELOPING COUNTRIES – 45
OECD TRADE POLICY PAPER N°142 © OECD 2013
safety management. Other programmes complement capacity building on GAP to farmers
with fruit juice processing equipment and capacity building to processing companies, such as
in context of a pilot project in Kuningan, West Java, led by the Ministry of Industry in
cooperation with external consultants.
More generally, a series of interventions by the government took the form of direct
support to processing firms in order to help them improve the quality of their equipment,
often in combination to awareness and capacity building projects. For instance, in addition to
actions in the fisheries sector aimed at improving awareness of appropriate hygiene
conditions during the collection, handling and transport of fishery products, the government
of Indonesia has provided assistance to selected fishermen and farmers in specific regions to
obtain access to refrigeration equipment, such as ice box or cold storage equipments (Alimi,
2007; interview with Dr. T. Sudaryanto, 2011).
In the agro-food sector, the MoA is promoting a model for grouping the large number of
existing small-scale farmers into farming groups, in order to increase the competitive
advantage of small farmers due to economies of scale, facilitate farmers‘ access to bank
loans and increase the quality and safety of their produce by implementing a food quality and
safety management system (Lord et al., 2010). To encourage farmers‘ participation to this
model, the MoA provides financial incentives in the form of a revolving fund allowing
farmers group to access loans up to IDR 100 million for investment.
Aid for Trade programmes targeting the agro-food and fisheries sectors in
Indonesia
The Trade Support Program (TSP)80
financed and implemented by the European
Commission (EC) in 2004 targeted some of the shortfalls of government interventions to
address the supply-side constraints of Indonesian processed agro-food and fisheries exports
to the EU market. Three out of four components of the TSP81
focused on harmonisation
problems between national and international standards, and on the lack of capacities of
laboratories and certification bodies, aspects that were insufficiently addressed by
government actions. Their actions sought to support the identification, adaptation and
dissemination of EU technical standards to the local processing industry, together with the
improvement of quality control processes and sanitary/phytosanitary compliance of
Indonesian exports. The related case story submitted by the Republic of Indonesia for the
third Global Review on Aid for Trade considers that the extensive discussions between the
EU and the government of Indonesia, aimed at ensuring that the amount of EUR 9.4 million
and three-year capacity building programme would be targeted at problems and issues linked
to national priorities, were a decisive factor in the success of the programme.
The second component of the TSP aimed at reinforcing management, IT and human
resources systems within the National Standardisation Body (Badan Standardisasi Nasional,
BSN), harmonising Indonesian standards with EU and international standards, and
disseminating these standards to the local industry. The TSP provided technical assistance to
BSN in order to improve the institutional and human capacities of this relatively new agency,
including steps to improve the computer hardware, software, network and internet facility, as
well as to update the website of BSN‘s standards information system. It also provided
80.
See Aid for Trade Case Story: Indonesia, Trade Support Programme, submitted in January 2011,
available at: www.oecd.org/aidfortrade/47450410.pdf.
81. The remaining (first) component of the programme had a wider scope and aimed at improving
WTO-related knowledge of government officials and various domestic stakeholders (private sector
and civil society).
46 – ESTIMATING THE CONSTRAINTS TO AGRICULTURAL TRADE OF DEVELOPING COUNTRIES
OECD TRADE POLICY PAPER N°142 © OECD 2013
training programmes to the members of the 76 standards-related technical committees of the
BSN, particularly on TBT notification requirements. In order to help Indonesia harmonise its
standards with those of the European Union and other international bodies (such as ISO), the
TSP organised several train-the-trainers programmes and study visits to Europe in
association with the German National Standards body (DIN). Finally, the TSP provided
assistance to SMEs in the standards area, including in the form of a dedicated guide on
standards (European Union, 2008).
The objective of the third component of the programme was to improve the access of
Indonesian companies to up-to-date technical conformity data and recognised testing
certificates in selected industrial sectors, including the agro-food and fisheries sectors.
Support was mainly directed to six of the research and development centres82
of the Agency
for Research and Development of Industry (ARDI), which provide conformity assessment
and testing services to the domestic industry. Support included training and laboratory
management techniques and testing procedures according to international standards, as well
as support to marketing of services to the industry and facilitation of contacts with
international laboratories. The Centre for Agro-based Industry (Balai Besar Industri Agro,
BBIA)83
was provided technical assistance on chemical and microbiological food testing
methods and on developing HACCP, GMP, and ISO 2200084
(European Union, 2008).
BBIA‘s objectives were redefined and measurable targets were set.
The last component of the programme was specifically focused on the fisheries sector,
identified as an activity with significant export potential. EU requirements for virus-free and
antibiotic-free shrimp imports since September 2001 created important difficulties for
Indonesia because of the lack of capacity by MMAF to exercise control over the entire
seafood chain, in particular to analyse the quantity of antibiotic residues in shrimp, and by
domestic fisheries laboratories to support this process (European Union, 2008). The TSP
promoted training programmes and purchase of equipment in order to upgrade the testing
capacity of MMAF‘s fishery laboratories and allow them to meet applicable EU health and
safety regulations.
Several of the TSP actions have been implemented to date. The final evaluation of the
TSP (European Union, 2008) shows that in the standardisation area results included
140 workstations with printers and scanners, and 4 servers installed and connected with the
local network; the BSN website was also substantially improved to include two languages
(Indonesian and English); BSN personnel have been equipped with IT equipment needed for
their jobs, and about 40 training courses, 6 road shows, 5 regional workshops, and
2 dissemination workshops were organised, covering both technical and management aspects
of standards issues. In parallel, and in order to improve standards development, 83 standards
technical committee members received training, four study visits to Europe were organised,
and 20 assistance missions to SMEs in the standards area were also undertaken by the
Indonesian Chamber of Commerce and Industry (KADIN), and finally a Guide to assist
SMEs on standards was prepared. Outcomes in the area of conformity assessment and
certification included the maintenance and improvement, through training and coaching, of
82.
Centres for Chemicals and Packaging, for Pulp and Paper, for Textiles, for Ceramics, for Material and
Technical Products and for Agro-Based Industry.
83. See the Centre‘s official website: www.bbia.go.id/.
84. ISO 22000 is a standard developed by the International Organization for Standardization dealing with
food safety.
ESTIMATING THE CONSTRAINTS TO AGRICULTURAL TRADE OF DEVELOPING COUNTRIES – 47
OECD TRADE POLICY PAPER N°142 © OECD 2013
the Quality Management System (QMS)85
of test laboratories in order to fulfil
ISO 17025:2005 requirements86
; and the upgrading of BBIA‘s expertise and operating
methods so as to improve its efficiency, profitability and the quality of services provided to
Indonesian producers and exporters (European Union, 2008). On the other hand, the
Indonesian National Accreditation Committee (KAN) that is placed under the umbrella of
BSN and has the authority to provide accreditation services to conformity assessment
institutions lacks international recognition in a number of its activities and would require
substantial capacity building in order to expand such recognition in new fields in the future.
The TSP component focusing on fisheries allowed the training of central and provincial
level laboratories in management and technical quality assurance according to ISO 17025. In
2006 for instance, a programme for analytical testing of heavy metals in fishery products
involved participants from 6 provincial laboratories and the National Reference
Laboratory (NCQC). Training sessions and direct technical assistance sessions were also
provided to 10 provincial laboratories and the NCQC, to strengthen QMS. Testing and
analysis in compliance with EU requirements is now possible not only thanks to new
equipment for fishery laboratories, purchased with TSP funds, but also thanks to the
restructuring of the MMAF authority in charge of food safety controls in fisheries and to the
revision of its operating legal and regulatory framework in line with EU requirements.
Finally, training on development and implementation of food safety management systems
was provided to processing companies, and a market orientation programme for Indonesian
SMEs was implemented to assist companies to understand and respond to the practices and
consumer requirements in Europe.
The implementation of the actions described above and the design of the programme so
as to address Indonesia‘s most important needs as regards processed agro-food and fisheries
supply to the European markets suggest that positive impacts may be generated in the near
future. However, the 2008 evaluation of the programme concluded that, despite progress
observed in the capacity of competent authorities, much remains to be done. While it might
still be too early to assess long term impacts, because capacity building programmes need
time to generate effects on the ground, it appears that the project was insufficiently endowed
with financial resources in view of its extremely ambitious objectives. Important delays to
the programme‘s implementation until the second quarter of 2006 led to the compression of
some activities for a much shorter implementation period and the impossibility for others to
be completed before the end of the project, foreseen for end 2007. An agreed four-month
extension of the implementation phase until April 2008 proved insufficient and led to the
conclusion in the programme evaluation that the implementation period of roughly thirty
months was too short to achieve efficient trade related capacity building (European Union,
2008). Implementation of technical assistance activities requires a long-term commitment
and needs time for planning and delivery.
Another major problem of the TSP, detected at the evaluation phase, was the lack of
balance in the allocation of budget funds among the different components. While the
standard-setting component was overloaded in regard to the rather small staff of BSN, the
remainder of the programme was completely under budgeted. Indeed, that component got by
far the largest financial resources from TSP, i.e. EUR 2 706 539 (or approximately 30% of
the entire budget), but the BSN was not able to absorb all allocated funds. At the end of
April 2008 only 79% was spent. In contrast, support for BBIA was insufficient to cover the
85.
A QMS can be expressed as the organizational structure, procedures, processes and resources needed
to implement quality management.
86. General requirements for the competence of testing and calibration laboratories.
48 – ESTIMATING THE CONSTRAINTS TO AGRICULTURAL TRADE OF DEVELOPING COUNTRIES
OECD TRADE POLICY PAPER N°142 © OECD 2013
Centre‘s needs and other centres have not been covered at all, including the National Agency
for Drug and Food Control (BPOM).Likewise, the fisheries component was particularly
underfunded: EUR 720 000 were allocated to the purchase of laboratory equipment, the
remaining budget of EUR 400 000 was too small to pay for sufficient technical expert
support to the Indonesian administration.
The 2008 evaluation has led to the adoption of a TSP II project. The purpose of TSP II
was to further upgrade the infrastructure for implementing and controlling quality, so as to
support Indonesia's access to international markets, taking into account the lessons learned
during the evaluation of the TSP I. The budget of the project, which started in
December 2009, has been significantly increased to EUR 15 million. TSP II focuses
specifically on establishing a cohesive legal, regulatory and institutional framework to
support export quality infrastructure.
The case study illustrates the wide range of actions that may be required in order to
upgrade efficiently capacities to implement, monitor and certify conformity with
internationally harmonised standards. Although a number of actions have been undertaken,
both directly by the government of Indonesia and with donor support, many of the
constraints faced by Indonesian agricultural exporters have been addressed in an insufficient
manner. Assessments of those actions point to the need for long-term commitment, and for
sufficient planning and delivery time necessary for obtaining satisfactory results.
VI. Case study – Zambia: Enhancing access to credit
The case study of Zambia highlights the challenges of access to finance for agricultural
producers, processors and traders, especially smallholders and emerging commercial
farmers. The particular risks of the agricultural sector, exacerbated by a particularly
risk-averse financial services sector and unpredictable government policies limit access to
agricultural finance to a narrow group of large farmers and preclude smaller farmers from the
possibility to finance the modernisation of their production and the expansion of their trade.
The study discusses actions put in place by Aid for Trade programmes aimed at enhancing
access to agricultural credit. The remainder of the section is structured as follows: a
description of the structure of the agricultural sector in Zambia and of the specific constraints
burdening the financing of agricultural production and trade; and a discussion of the aid-for-
trade interventions meant to address those constraints.
Background
Zambia is a landlocked country with a population of 14.3 million, a per capita GDP of
USD 1 600 and 64% of the population living below the poverty line (CIA World Factbook).
Agriculture occupies 85% of the labour force and represents 21.4% of the country‘s GDP.
The country has one of the best land and water endowments in Africa, and following
agricultural reforms since the mid-1990s the agricultural sector is growing at a yearly
average of 4.5%, in particular in the direction of export crops. However, the significant
agricultural potential is still largely untapped and is the key priority in the government
growth and poverty reduction programme. The sector seems to suffer both from policy
distortions and the country‘s landlocked situation, reliance on rain-fed agriculture and
vulnerability to droughts and flooding. Resources to the agricultural sector have sharply
declined since the agricultural reforms in the 1990s, with 2006 figures only 20% of their
1986 level, and the private sector not having filled the gap left by the suppression of certain
government interventions. A small number of large commercial farms, concentrated along
the railway, coexist with emerging commercial farms facing difficulties to access input and
ESTIMATING THE CONSTRAINTS TO AGRICULTURAL TRADE OF DEVELOPING COUNTRIES – 49
OECD TRADE POLICY PAPER N°142 © OECD 2013
output markets (referred to in this paper as ―emergent farmers‖) and subsistence
smallholders, who represent approximately 40% of rural households (Bonaglia, 2008).
Export-oriented agriculture, involving essentially emergent commercial farmers, faces
numerous challenges, including inconsistent implementation of agricultural sector
liberalisation policies, under-developed markets that limit production, low agricultural
productivity and poor or non-existent infrastructure including telecommunications, roads and
power facilities. Business surveys and donors‘ diagnostic studies have identified poor access
to finance as one the main constraints to agricultural development and small-scale rural
agribusiness competitiveness (USAID, 2008; USAID 2011; Taylor et al., 2009; Melzer et al.
2010; Zambia Business Survey, 2010). The challenge of agricultural financing complicates
the government and donors attempt since the mid-2000s to reorient smallholders towards a
more business-minded approach and facilitate their access to markets.
Constraints and challenges of agricultural financing in Zambia87
Large commercial farms and processors have relatively easy access to credit and other
financial services, including insurance. This easy access has enabled them to thrive thanks to
the use of agricultural financing in order to acquire and maintain advanced agricultural
technology, equipment and irrigation systems. At the same time, their growth and close links
to the financial sector have helped the growth and liquidity of the latter. The intermediate
category of small, emerging commercial farmers generally has satisfactory levels of literacy
and land ownership and has some experience with formal credit, such as commercial credit
from an agro-dealer, loans from a micro-finance institution or contract farming88
with a large
buyer. They may enter into contract or cooperative relations with large farmers to gain
access to export markets thanks to those farmers‘ commercial networks.
The remaining rural populations are largely unbanked. Among rural micro, small and
medium enterprises (MSMEs) only 5% use formal bank services, compared to 20% of
MSMEs in urban areas. Even when informal financial services are included the share
remains still low: 85% of them have no access to any type of financial services, compared to
59% of urban MSMEs (Figure 3). Most of these populations are effectively unbankable,
because of the very high levels of real and perceived risk related to Zambian smallholder
agriculture and the very large extent of informality. Furthermore, an estimated 17% of
Zambians do not have an official identity document, required in order to open a bank
account. Most small Zambian farmers do not have clear title to land or other property that
can be used for collateral, nor do they have a business license, or no credit history, while
many of them are illiterate or innumerate, complicating dealings with financial institutions.
87.
Information on the agricultural financing constraints in Zambia is drawn to a large extent from Taylor
et al. (2009), Melzer et al. (2010), Zambia Business Survey (2010) and USAID (2011).
88. ―Contract farming‖, or ―outgrower schemes‖ are interlinked transactions whereby small farmers
receive external inputs, such as seed, fertilizers, sprays, tools or other equipment on credit by large
agricultural buyers, against the commitment to sell the buyer the entire crop at a previously agreed
price.
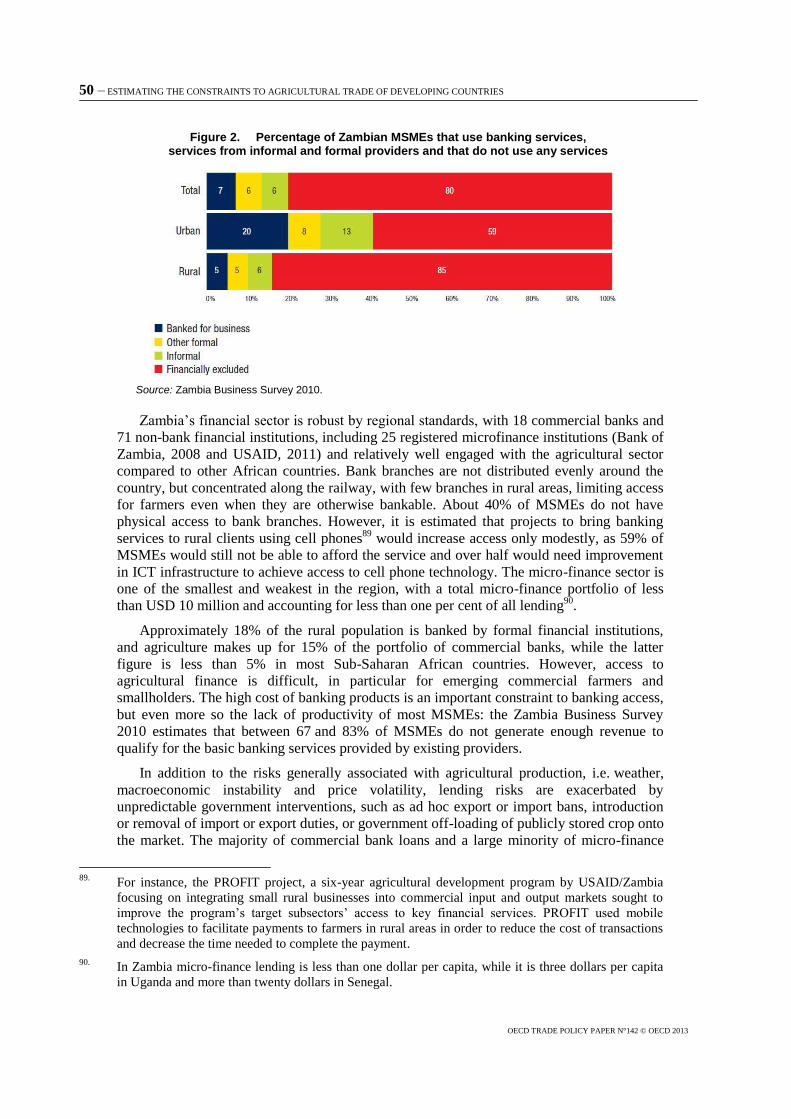
50 – ESTIMATING THE CONSTRAINTS TO AGRICULTURAL TRADE OF DEVELOPING COUNTRIES
OECD TRADE POLICY PAPER N°142 © OECD 2013
Figure 2. Percentage of Zambian MSMEs that use banking services, services from informal and formal providers and that do not use any services
Source: Zambia Business Survey 2010.
Zambia‘s financial sector is robust by regional standards, with 18 commercial banks and
71 non-bank financial institutions, including 25 registered microfinance institutions (Bank of
Zambia, 2008 and USAID, 2011) and relatively well engaged with the agricultural sector
compared to other African countries. Bank branches are not distributed evenly around the
country, but concentrated along the railway, with few branches in rural areas, limiting access
for farmers even when they are otherwise bankable. About 40% of MSMEs do not have
physical access to bank branches. However, it is estimated that projects to bring banking
services to rural clients using cell phones89
would increase access only modestly, as 59% of
MSMEs would still not be able to afford the service and over half would need improvement
in ICT infrastructure to achieve access to cell phone technology. The micro-finance sector is
one of the smallest and weakest in the region, with a total micro-finance portfolio of less
than USD 10 million and accounting for less than one per cent of all lending90
.
Approximately 18% of the rural population is banked by formal financial institutions,
and agriculture makes up for 15% of the portfolio of commercial banks, while the latter
figure is less than 5% in most Sub-Saharan African countries. However, access to
agricultural finance is difficult, in particular for emerging commercial farmers and
smallholders. The high cost of banking products is an important constraint to banking access,
but even more so the lack of productivity of most MSMEs: the Zambia Business Survey
2010 estimates that between 67 and 83% of MSMEs do not generate enough revenue to
qualify for the basic banking services provided by existing providers.
In addition to the risks generally associated with agricultural production, i.e. weather,
macroeconomic instability and price volatility, lending risks are exacerbated by
unpredictable government interventions, such as ad hoc export or import bans, introduction
or removal of import or export duties, or government off-loading of publicly stored crop onto
the market. The majority of commercial bank loans and a large minority of micro-finance
89.
For instance, the PROFIT project, a six-year agricultural development program by USAID/Zambia
focusing on integrating small rural businesses into commercial input and output markets sought to
improve the program‘s target subsectors‘ access to key financial services. PROFIT used mobile
technologies to facilitate payments to farmers in rural areas in order to reduce the cost of transactions
and decrease the time needed to complete the payment.
90. In Zambia micro-finance lending is less than one dollar per capita, while it is three dollars per capita
in Uganda and more than twenty dollars in Senegal.
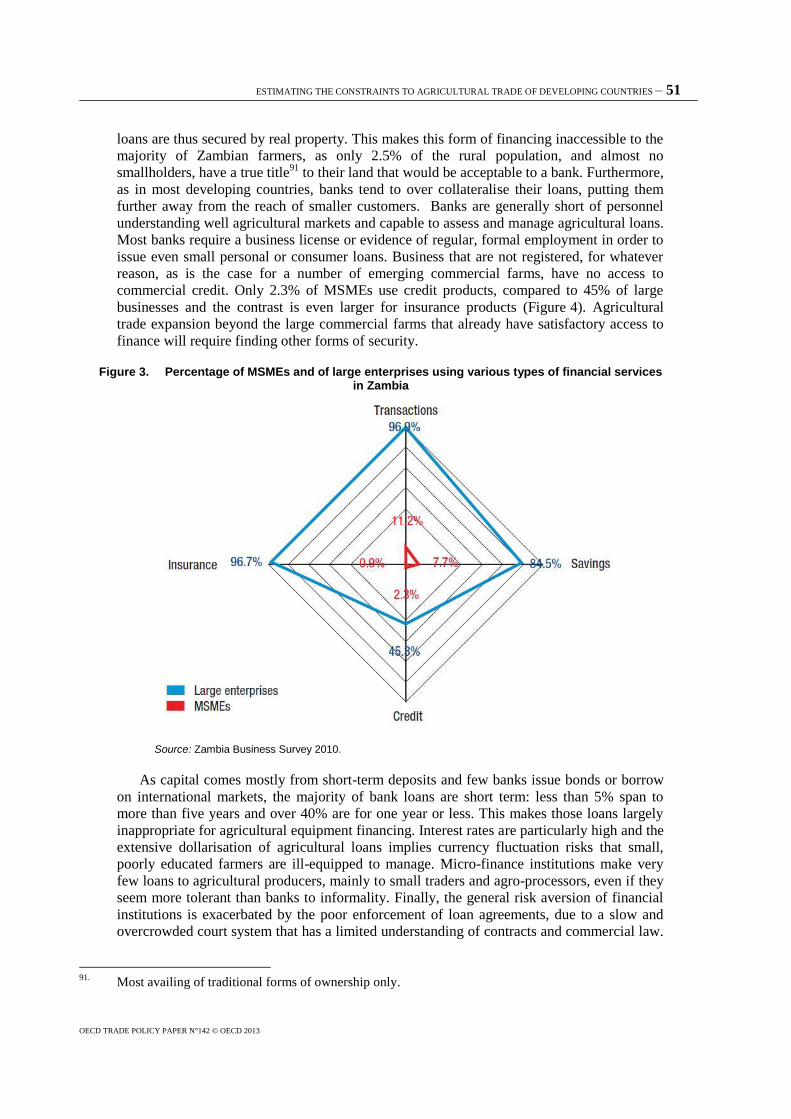
ESTIMATING THE CONSTRAINTS TO AGRICULTURAL TRADE OF DEVELOPING COUNTRIES – 51
OECD TRADE POLICY PAPER N°142 © OECD 2013
loans are thus secured by real property. This makes this form of financing inaccessible to the
majority of Zambian farmers, as only 2.5% of the rural population, and almost no
smallholders, have a true title91
to their land that would be acceptable to a bank. Furthermore,
as in most developing countries, banks tend to over collateralise their loans, putting them
further away from the reach of smaller customers. Banks are generally short of personnel
understanding well agricultural markets and capable to assess and manage agricultural loans.
Most banks require a business license or evidence of regular, formal employment in order to
issue even small personal or consumer loans. Business that are not registered, for whatever
reason, as is the case for a number of emerging commercial farms, have no access to
commercial credit. Only 2.3% of MSMEs use credit products, compared to 45% of large
businesses and the contrast is even larger for insurance products (Figure 4). Agricultural
trade expansion beyond the large commercial farms that already have satisfactory access to
finance will require finding other forms of security.
Figure 3. Percentage of MSMEs and of large enterprises using various types of financial services in Zambia
Source: Zambia Business Survey 2010.
As capital comes mostly from short-term deposits and few banks issue bonds or borrow
on international markets, the majority of bank loans are short term: less than 5% span to
more than five years and over 40% are for one year or less. This makes those loans largely
inappropriate for agricultural equipment financing. Interest rates are particularly high and the
extensive dollarisation of agricultural loans implies currency fluctuation risks that small,
poorly educated farmers are ill-equipped to manage. Micro-finance institutions make very
few loans to agricultural producers, mainly to small traders and agro-processors, even if they
seem more tolerant than banks to informality. Finally, the general risk aversion of financial
institutions is exacerbated by the poor enforcement of loan agreements, due to a slow and
overcrowded court system that has a limited understanding of contracts and commercial law.
91.
Most availing of traditional forms of ownership only.
52 – ESTIMATING THE CONSTRAINTS TO AGRICULTURAL TRADE OF DEVELOPING COUNTRIES
OECD TRADE POLICY PAPER N°142 © OECD 2013
Non-performing loans in the agricultural sector exceed 37%, against 13% across all other
sectors of the economy.
The agricultural insurance sector has developed quite strongly in Zambia in the last
decade, but is still essentially limited to large commercial farms. In order to enlarge their
market the insurers are now seeking to expand their offer to emergent farmers but cash
shortage and limited awareness among this population makes the expansions of the
agricultural insurance market a slow process.
Farm equipment such as tractors and irrigation equipment is mostly financed through
finance leasing, whereby farmers use capital goods that are formally owned by the leasing
company. The extension of operating leases to emergent farmers that have difficulty
accessing any kind of credit is only a recent, still circumscribed development. However the
financial leasing sector has seriously contracted since 2008, following tax law amendments
which reduced its attractiveness.
In some subsectors such as tobacco and cotton, interlinked transactions whereby external
inputs are provided on credit by the ginning or processing companies (―contract farming‖ or
―outgrower schemes‖) largely compensate for smallholders‘ shortage of credit, which
seriously limits the affordability and use of various external inputs required (Delpeuch and
Vandeplas, 2012). Contract farming involving small scale growers has been the most
important route to expansion of production in these sectors and the cotton outgrower
schemes now involve some 220 000 small farmers (Bonaglia, 2008). Similar schemes are
established in horticulture and paprika, with extensive donor support. However, the whole
contract farming system suffers from inefficient enforcement of the interlinking contracts.
When coordination and informal mechanisms to enforce contracts are unaffordable by the
companies providing such credit, high rates of loan non-repayment have been witnessed as
farmers engage in side-selling of the concerned commodities to other high-bidding buyers at
harvest, instead of the company that has pre-financed the agricultural inputs (Delpeuch and
Vandeplas, 2012). As a result the sustainability of the contacts is reduced, related risk
premiums rise and contract farming loses ground.
Furthermore, the 2010 Agricultural Credit Act introduced a system of warehouse receipts
setting up rules for the issuance, sale, trade and transfer of warehouse receipts. Reliable
warehouse receipts are important trading instruments allowing the transfer of ownership
without physical delivery; encouraging the use of warehouses for storage thus reducing post-
harvest losses which can be quite high at the smallholder level due to theft and spoilage; and
providing a means for promoting quality control and assuring grain quality. They also enable
farmer groups to bulk their crop into economic lot sizes that can be sold further down the
marketing chain to processors, millers and other large traders, developing a greater direct
involvement of smallholders. Used as collateral, warehouse receipts provide easier access to
commodity finance, help reduce trade margins and seasonal price variability and enhance the
involvement of the financial sector in agricultural marketing. Confidence in the reliability of
the receipts is an absolute prerequisite for such schemes to succeed and the lack of
confidence has led to the failure of previous attempts to introduce a warehouse receipt
system in Zambia92
.
92.
The Zambian Agricultural Commodities Association (ZACA), a large-scale, donor funded scheme,
failed to gain the confidence of banks and other lenders and closed its doors in 2006.
ESTIMATING THE CONSTRAINTS TO AGRICULTURAL TRADE OF DEVELOPING COUNTRIES – 53
OECD TRADE POLICY PAPER N°142 © OECD 2013
Aid for Trade interventions
The concerns about inadequate sources of finance and capital have led USAID/Zambia to
pursue the provision of financial and business development services for the private sector as
one of the components of their Market Access, Trade and Enabling Policies (MATEP)
project that ran in Zambia between 2005 and 2010. Noting that local demand, beyond basic
food needs, was limited and that only exports would allow Zambia to raise the incomes of its
rural population, MATEP aimed at enhancing the competitiveness of small- and medium-
scale agriculture and natural products producers and processors under Zambia‘s 2004-10
Country Strategic Plan. The project sought to achieve a raise in exports93
from a
USD 405 million baseline to a USD 600 million target by providing better access to markets,
production technologies, finance and business development services (BDS), and through
initiatives to improve the enabling environment and reduce barriers to trade and investment.
Within this framework, a finance component was established in the form of a USD 2 million
investment fund managed by the Zambia Agribusiness Technical Assistance
Centre (ZATAC), in order to provide credit for small and medium-sized enterprises and
ultimately help those enterprises access formal sector credit.
The MATEP investment fund (MIF) was set to provide, on a revolving fund basis,
export-oriented and tourism companies short-term (one year or less) export credit for trade
finance and other working capital requirements; and medium-term loans (up to three years)
for capital investments in plant and equipment as well as working capital. The medium-term
facility was designed to promote increased access to commercial financial markets for
MATEP clients by transferring both the loan and the risk to commercial lending institutions,
such as commercial banks, within the tenure period of the loan. MATEP sought to help
clients establish strong credit track records and export performance so that they could
become clients of formal financial institutions in the future. In addition, the programme was
meant to create a demonstration effect that would encourage commercial banks and other
sources of capital to lend to or invest in companies that ―graduate‖ from the fund. The MIF
was aimed as a complement to commercial financial services and its credit facilities were
priced in line with prevailing lending rates in the commercial banking sector, based on
market surveys periodically conducted by MATEP.
Furthermore, MATEP‘s financial services were accompanied, where required, with
technical assistance in business plan preparation, market information and market
development services, in order to overcome the constraint of targeted businesses‘ inability to
articulate good written business plans. This involved business consultancy to coach
entrepreneurs to develop promising business concepts into fully-fledged bankable business
plans. MATEP has supported three SMEs to prepare business plans in the textiles, wood
processing and aquaculture sub-sectors.
The investment fund disbursed a total of USD 3 049 816, of which USD 2 311 741 went
for short-term export financing and another USD 958 059 was provided for medium-term
financing. A total of 33 loans have been disbursed servicing 17 sub-sectors, including, in the
agricultural field, canned horticultural produce, processed beef, horticulture (cucumbers),
honey, molasses, groundnuts, organic cotton, paprika, poultry, seed and soy cake.
Furthermore, in order to increase the capital available to clients, MATEP sought to leverage
resources from commercial financial institutions and managed to secure USD 5 006 970
from the Zambia State Insurance Corporation (ZSIC), the ZATAC Investment Fund and
93.
In eight core agro-food value chains, horticulture/floriculture, coffee, livestock, cotton, honey,
paprika/chili, maize/seed and cassava, and on tourism.
54 – ESTIMATING THE CONSTRAINTS TO AGRICULTURAL TRADE OF DEVELOPING COUNTRIES
OECD TRADE POLICY PAPER N°142 © OECD 2013
Barclays Bank Zambia Ltd., benefitting mainly paprika processing, horticultural canning and
groundnuts grading and processing.
MATEP‘s final assessment judged the finance component quite successful, despite the
poor relative performance of the rest of the project94
. MATEP‘s impact in terms of increased
exports was primarily linked to the financial support it provided, in the form of both small
grants and larger loans from the MATEP investment fund. The observation that the second
most valuable intervention had been technical assistance to exporting companies, such as
help in designing marketing brochures, upgrading labelling and packaging to meet
international expectations, and developing new and better products has led the assessment
team to conclude that financial support and technical assistance are more powerful in
combination, with finance providing incentives and technical assistance helping ensure
efficient use of the funds. MATEP also provided capacity building and technical assistance
to ZATAC so as to enable it to continue operating the investment fund in the future.
A number of exporting firms received loans that allowed them to expand their
businesses. Some loans from MIF seem to have had a very substantial positive impact on the
firms that received them. For example Freshpikt, a canned fruit and vegetables manufacturer,
reported that it would not have survived without the USD 150 000 initial loan it received
from MATEP, which in turn positioned the company to receive a much larger loan from the
Zambia State Insurance Corporation (ZSIC). Freshpikt continues to grow and reports that it
now consistently exports about USD 1.2 million per year. The additional external financing
MATEP was able to leverage for its clients contributed to a total financing facility of
USD 19.1 million.
On the other hand, the Fund seems to have paid insufficient attention to the
creditworthiness of borrowers, so that 60% of the loans outstanding at the term of the project
were in default and the cost of pursuing them could easily exceed their recoverable value.
That could mean a loss of some USD 2 million, an amount roughly equal to USAID‘s initial
investment. Of the total short-term loans disbursed, USD 1 254 311 have been repaid,
representing 41% of the total funds disbursed. A further 42% were performing loans in
repayment (USD 1 263 288 of disbursed capital) and 17% were non-performing
(USD 532 217). Of the medium term loans disbursed USD 209 275 have been repaid (23%
of total disbursed). Debt rescheduling has been necessary for many of the MATEP loans.
Managing the loan portfolio under conditions of poor credit quality was more expensive than
anticipated and the project did not provide sufficient resources to allow constant contact with
borrowers, including unannounced on-site visits, periodic financial reviews, verification of
sales orders, and efficient legal action for delinquent loans.
While MATEP‘s financial component successfully responded, within its limited means
to the clearly identified, fundamental need for affordable and responsive credit, the overall
problem of access to agricultural credit remains unsolved and more work is needed to further
alleviate this constraint. Although the situation seems to be improving slowly, interest rates
remain relatively high, repayment periods are short, and banks often take months to reach a
decision on whether to grant a loan, which is a major issue for agricultural producers.
MATEP staff and beneficiaries estimated that the fund ―could easily have been
USD 10 million‖, but the challenge of ensuring creditworthiness and sustainability has not
yet found a credible solution. The end-of-program evaluation report suggested inviting
94.
Mainly due to the lack of support and commitment by concerned partners and the weak monitoring
and evaluation of its performance indicators, especially as regards the trade policy and tourism
components.
ESTIMATING THE CONSTRAINTS TO AGRICULTURAL TRADE OF DEVELOPING COUNTRIES – 55
OECD TRADE POLICY PAPER N°142 © OECD 2013
commercial banks to co-invest in the fund and participate in its management, as a means of
transferring knowledge and building the capacity of local banks to offer trade finance.
The case study highlights the impediments jeopardising satisfactory access to finance for
agricultural producers, processors and traders. The constraints are now well understood by
partner governments and the donor community, but the actions undertaken to address them
are confronted with several challenges. The balance between extending credit solutions to
farmers otherwise excluded from commercial sources of finance and ensuring the
sustainability of alternative funding programmes through stronger creditworthiness controls
is not easy to achieve.
VII. Case study – Mozambique: improving the cashew value chain to reduce poverty
The case study of Mozambique illustrates how programmes focusing on increasing
employment and promoting production that is adapted to local endowments can make a
significant contribution to poverty reduction in developing countries. It underscores the
interest of targeting the SME sector, which is a major creator of employment opportunities in
poor countries. The active involvement of the private sector was particularly relevant in this
case, providing ownership and local buy-in consistent with the whole approach of Aid for
Trade. The project design relied on the initiative, and willingness to incur risks, of small and
medium private entrepreneurs, supported by donor know-how. The decision to opt for a
business support structure that was owned by the participating processing industries and
which provided services usually assumed by the donors themselves, helped to sharpen the
private entrepreneurs‘ sense for business opportunities and to enhance ownership of the
programme.
The study demonstrates the importance of serious preparatory field work to collect
relevant market insights and identify the most efficient, country-specific approach to
building supply, production and marketing capacities. It also shows that the emergence of
(partly private and commercial) standards that focus on food safety, produce traceability as
well as social and environmental compliance can successfully be introduced in developing
countries.
Background
Mozambique is one of poorest countries in the world (ranking 184 out of 187 in UNDP‘s
2011 Human Development Report). Although the country experienced sustained economic
growth since the end of civil war in 1992, at an average of 8% per year during the 1994-2005
period, GDP per capita was USD 418.4 in 2009 and the share of the population living below
USD 1.25 per day was 60% in 2008. Since the turn of the century the country offered a
variety of investment and export opportunities, including in energy, mining and agriculture
and fisheries, the business climate however remained challenging. Although the World
Bank‘s Doing Business 2011 report notes that several business climate reforms were
achieved in Mozambique, the country still ranks poorly in terms of the ease of doing
business.
Cashew nuts are an important crop for the country. Around 42% of Mozambican farmers
own cashew trees, for most of them between 10 to 20 trees on average, while in the main
cashew growing districts the share of farmers owning cashew trees reaches 60% to 80%,
mainly inherited after independence. Cashew trees can be grown in marginal lands which are
unsuitable for other crops. They are relatively easy and inexpensive to maintain, require
neither large agricultural plots, nor intensive farming care other than simple but regular plant
protection measures, and can yield above 10 kg per tree, providing cash to farmers and
56 – ESTIMATING THE CONSTRAINTS TO AGRICULTURAL TRADE OF DEVELOPING COUNTRIES
OECD TRADE POLICY PAPER N°142 © OECD 2013
improving rural income. They can also provide supplementary crops in subsistence
production, especially in drought years, when food is scarce. Most smallholders are
semi-subsistence farmers, growing in parallel maize, cassava, beans, ground nuts or other
crops for home consumption, as harvesting does not coincide with peak labour demands for
other food crops.
In the 1970s, Mozambique was the leading cashew nut producer in the world, exporting
in 1974 240 000 tonnes of cashew nuts, of which 210 000 tonnes were processed within the
country. The sector involved millions of smallholder farmers and more than
10 000 processing workers, making it the fourth largest employer after the railways, sugar
and textiles. But by late 1990s the post-independence civil war, a slowing economy and poor
policy decisions had destroyed the sector.
After Mozambique‘s independence in 1975 and with the outbreak of the civil conflict,
cashew nut production started to decline. Abandon and neglect gradually led to the spread of
pests and diseases, the over-maturing and halt of replanting of cashew trees, and
uncontrolled forest fires which affected important parts of cashew orchards. Processing
capacity also deteriorated, both physically and in terms of human expertise. Following
independence the government banned the export of raw cashew nuts to stimulate domestic
processing. Mozambique became the first African country to process cashews on a large
scale and by 1980 the country had 14 processing factories, but the ban kept raw nut prices at
the farm gate artificially low, while the severe inefficiencies of the processing sector were
not addressed. Total production dropped to as little as 22 000 tonnes in 1990, and Vietnam,
India, West African countries and Brazil supplanted Mozambique as leading suppliers,
profiting from the significant growth in cashew nuts demand in the world market.
The government began to loosen restrictions on raw cashew production in the late 1980s,
following World Bank advice. The ban on exporting raw cashews was lifted in 1991 and
replaced with an export quota and export tax. The quota was subsequently removed, and the
export tax on raw nuts came down from 60% in 1991 to 14% in 1999. As the domestic
processing industry and its marketing capacities had declined too much to be able to match
prices offered by exporters, most raw nuts were sold to Indian processors. Factories shut
down, eliminating many jobs and reducing the domestic demand for raw nuts. McMillan
et al. (2002) estimated that efficiency gains generated by the removal of the export
restrictions amounted to approximately USD 6.6 million annually, or about 0.14% of
Mozambique GDP, largely offset by the costs of unemployment in the processing industry,
corresponding to an estimated 7 000 to 10 000 workers, or around USD 6.1 million. The
additional income accruing to the farmers was around USD 5.3 million, or USD 5.30 per
year for the average cashew-growing household, but 90% of the cashew processing workers
appeared still unemployed in 2001. By 2002, production had recovered to only
50 000 tonnes, or 5% of the world‘s total, of which none were processed locally, and the
Mozambican cashew industry was worth around USD 80 000. Even then cashew nuts
remained one of Mozambique‘s leading exports and were a source of income for almost one
million families or approximately five million people (McMillan et al. 2002).
This moment of zero domestic value addition is the reference point against which to read
the results from the cashew nut value chain project described below, and aimed at enhancing
employment and income, both for the primary producers of cashew nuts and for workers in
cashew nut processing factories.
ESTIMATING THE CONSTRAINTS TO AGRICULTURAL TRADE OF DEVELOPING COUNTRIES – 57
OECD TRADE POLICY PAPER N°142 © OECD 2013
Constraints and challenges in the cashew value chain
Endeavours to revive the cashew sector after independence consisted mainly of industrial
and trade policies, with little attempts to identify and address the supply-side constraints of
the sector, including the low productivity of smallholder farms, the lack of capacity for
quality processing, and the important market imperfections for commercialising and
exporting the commodity.
The important geographic fragmentation of the cashew value chain, reinforced by the
significant transport costs due to the country‘s poor infrastructure, offered little opportunities
to obtain a better price at the farm gate. Storage capacity is also important and farmers who
can afford to store their raw cashew and sell them towards the end of the season could obtain
a much higher price. Small-scale traders operating in distinct areas of 5 to 8 villages, usually
at a distance from main roads, would purchase the whole local production, ranging from 5 to
12 tonnes annually, and resell to larger traders or wholesalers located in bigger towns on
main trading routes. These larger traders varied greatly in size, handling between 50 and
400 tonnes annually and supplied the raw nuts directly to a small number of exporters, based
in Maputo or Nacala, in the cashew growing area, for export mainly to India‘s processing
facilities. At the same time, world prices for the commodity, although stable over the long
term, were highly volatile in the short term. Smallholders lacked the necessary information
and organisation that would allow them to improve their negotiating power and control the
marketing and exporting of the nuts.
As regards processing, the move to mechanise an important part of the processing of raw
cashew nuts in the 1960s was inconsistent with Mozambique‘s comparative advantage in
labour-intensive activities. The processing sector was structured around large-scale
processing plants, with a capacity of around 10 000 tonnes, which relied on mechanical
technology for roasting, extraction and shelling, although cleaning, sizing and grading
remained labour-intensive manual operations. The required equipment required high capital
investment of around USD 600 per tonne, and the operating cost was USD 1.30 per kilogram
of output, with machines vulnerable to breakdown and shortage of spare parts.
Mechanical processing operations achieved lower quality than manual operations, which
preserve a considerably higher percentage of whole nuts. Yet, Mozambique could only
regain and preserve its position in an increasingly competitive world market by offering high
quality and specialty products (for instance produced through eco-and social-friendly
processes), for which consumers around the world would be willing to pay a premium. The
sector would further need to communicate efficiently about its first-rate quality products by
means of appropriate quality and environmental labelling, certification, branding, marketing,
and export promotion. At the same time, post-independence Mozambique suffered from a
shortage of the sophisticated management skills that would have been necessary in order to
run the old large-scale plants.
Finally, working capital availability was and continues to be a major constraint for local
entrepreneurs who would be otherwise interested in entering the sector. Currently only 5% of
the population in Mozambique has access to financial services and a mere 2% has access to
credit. Micro-finance institutions serve mainly small traders with loans up to USD 500, while
the totality of the country‘s ten commercial banks cover the needs of no more than 7-8% of
small and medium-sized enterprises (Bais, 2010). The lack of capital for year-round
operations constraints the plants‘ ability to maintain stable commercial relations with
prospective buyers and limits employment opportunities.
58 – ESTIMATING THE CONSTRAINTS TO AGRICULTURAL TRADE OF DEVELOPING COUNTRIES
OECD TRADE POLICY PAPER N°142 © OECD 2013
The road to recovery
The second attempt to revive the cashew nut sector in Mozambique resulted from the
involvement of TechnoServe, an NGO which focuses on private sector development in
developing countries by locating emerging entrepreneurs and nurturing them through
training, mentoring and networking95
. The NGO started working in Mozambique in the late
1990s by seeking to identify promising industries that could generate income and economic
growth for the country. Despite the disappointing results of the first attempts to revive the
sector, it was quickly obvious that the cashew nut industry still bore significant potential,
because of Mozambique‘s history in cashew production, its excellent environmental
conditions and its low labour cost. Thanks to the growing demand for quality cashew kernels
worldwide, cashew production and processing could offer a promising tool for lifting
smallholders out of poverty.
With initial funding from USAID, TechnoServe undertook analysis of the cashew sector
in order to decide on a competitive strategy. It opted for an increase of revenue rather than of
quantities, by seeking to upgrade the sector to a quality niche. At the heart of the NGO‘s
competitive strategy, and meant to secure the impact and sustainability of TechnoServe‘s
support operations, was the collaboration with local entrepreneurs able to build viable
businesses. Such entrepreneurs were more likely than cooperatives to provide small-scale
farmers with a reliable buyer and to create spill-over and example effects to the benefit of the
larger economy.
An efficient production and processing approach
The chosen strategic approach involved three important elements: (a) locating factories
near farms, in order to reduce transportation costs and increase supplier loyalty and
commitment. This implied (b) several smaller processing plants rather than a few large-scale
ones, and (c) made it possible to privilege labour-intensive manual processing, which was
better suited to the small units while securing better quality outputs when workers are
properly trained and motivated. It was noted that value addition by processing could cause
prices per unit weight or volume to leap by 100% or more, while the presence of local
processing facilities would help raise farm gate prices for the raw nuts due to enhanced
competition in the producing areas (SECO 2011).
The small-scale plants had a capacity of around 1 000 tonnes; they used manual shelling
technology for a capital cost of USD 140 per tonne, and operating cost of USD 0.56 per
kilogram of output, i.e. much better suited to Mozambique‘s endowments. The lower
investment and operating costs of these smaller plants made them more feasible for local
entrepreneurs. Each plant would employ around 200 workers, enjoying an official minimum
wage salary96
, one month paid vacation, all insurance, health and pension entitlements, one
meal a day and child care. Furthermore, each plant would provide a reliable market for raw
cashew nuts from about 10 000 small-scale farmer families and pay a premium price for
quality. TechnoServe trained local farmers to operate cashew farms and helped them
organise under a collective name to increase their selling power.
95.
TechnoServe indicates its mission is ―to help entrepreneurial men and women in poor rural areas of
the developing world to build businesses that create income, opportunity and economic growth for
their families, their communities and their countries‖ www.technoserve.org.
96. A typical factory worker earns USD 300 a year, nearly four times the income of a typical subsistence
farmer.
ESTIMATING THE CONSTRAINTS TO AGRICULTURAL TRADE OF DEVELOPING COUNTRIES – 59
OECD TRADE POLICY PAPER N°142 © OECD 2013
The first processing plant, which served as a ―working laboratory‖ to refine the business
model and train other interested entrepreneurs, was Miranda Caju, the product of
TechnoServe‘s partnership in 2001 with a determined Mozambican entrepreneur, Antonio
Miranda. Miranda Caju benefited in the early phase from intensive business advisory support
for recruiting supervisors, selecting workers, establishing the compensation system, training
workers, designing plant layout, identifying equipment and designing locally fabricated
equipment such as the boiler97
. During the building of the plant assistance was also provided
for identifying prospective buyers and the Rotterdam-based company that decided to
purchase the entire production of the factory on account of the high quality of its output also
agreed to loan funds for working capital and for expansion. In 2002, at the plants‘ opening,
over 1 000 people showed up for 64 jobs. In 2004 revenues were USD 1 million and
Miranda Caju opened a second 1 000 tonne plant. By 2006, nine start-up enterprises with a
total capacity of 11 700 tonnes had been established benefitting from TechnoServe‘s
business advisory services, including strategic planning, marketing, technical advice, quality
control, supply chain management, and facilitating access to investment and working capital.
The plants employed around 5 000 factory workers, of which 50% were women.
In 2005, a three year programme, supported by the Swiss State Secretariat for Economic
Affairs (SECO) with a budget of CHF 418 000, was set up to improve the processing plants‘
capacity to adopt, and have certified standards for quality, hygiene, worker safety, fair trade,
and the factories‘ environmental impact. The programme aimed at facilitating those
factories‘ exports and access to more demanding and more rewarding markets, mainly by
introducing quality assurance systems based on Hazard Analysis and Critical Control
Points (HACCP). A follow-up program with a budget of CHF 250 000 took place from 2008
to 2009 to consolidate the processing factories‘ achievements in the area of standards and
certification, while also addressing issues pertaining to trade policy and regulation.
Thanks to the introduction of a quality management system and improved management
structures and processing methods, cashew nut production in Mozambique increased
significantly and adapted to meet international demand. As a result, sales have been ensured
and bank guarantees afforded on more favourable terms. However, despite considerable
progress since the beginning of the programme, none of the participating industries had been
independently certified until the end of SECO‘s financial support to the project in 2009.
Work to introduce food safety certifications is now taken over by the Association of
Agribusiness Industries (AIA).
Addressing the marketing challenges
The revival of the cashew nut sector implied a delicate tradeoff between the appropriate
size for production and processing and the critical mass for an efficient marketing of the
commodity for export. Small rural enterprises do not have the scale to develop and maintain
effective communications and commercial relationships with foreign buyers, let alone
develop proprietary brands. The logistics of export markets require container size shipments
of uniformly graded and sorted cashew nuts, which favours much larger scale. The challenge
of efficient marketing and branding was initially addressed through business advisory
services from TechnoServe and in the longer run with the development of AIA. AIA is a
private holding company owned by the leading cashew processing companies and is in
charge of marketing and exporting processed cashew nuts for its members, as well as for
some third companies. In this capacity it also assumes quality control for HACCP and
97.
Miranda Caju paid TechnoServe USD 5 000 per year for consulting services, a mechanism that
ensured TechnoServe was really adding value. For later industry entrants that fee was replaced by the
firms‘ financial support to the industry trade associations, AIA and AICAJU (see below).
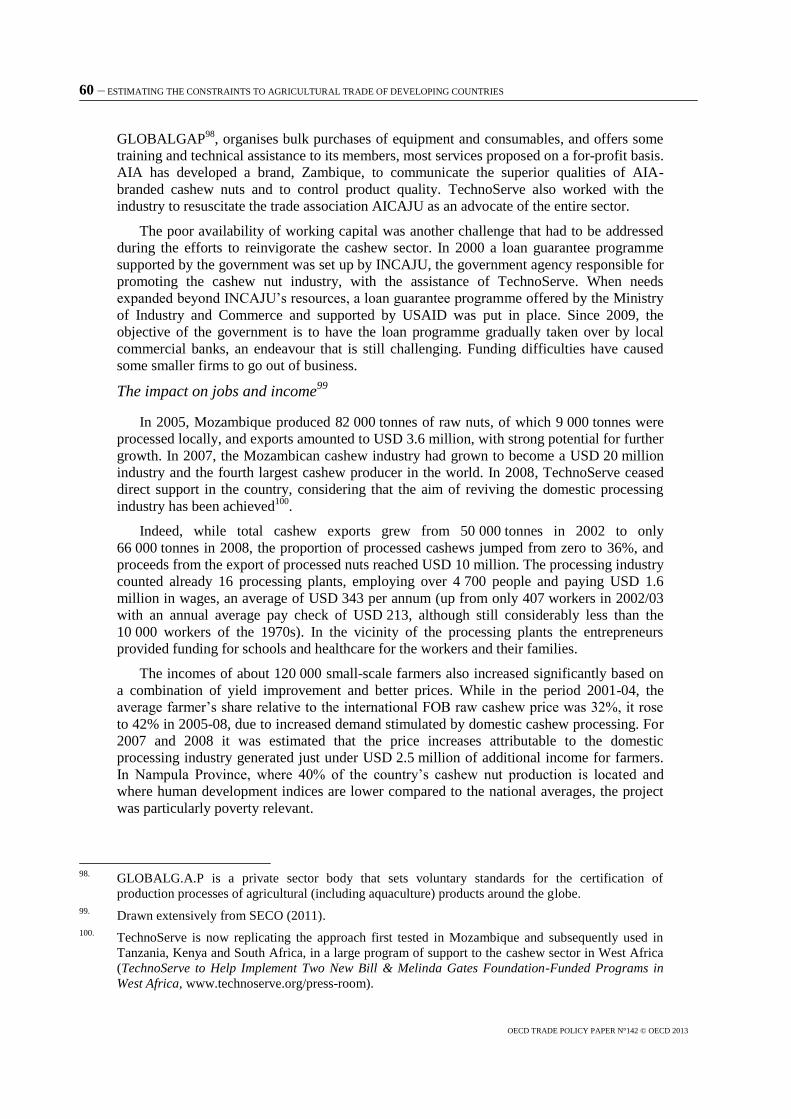
60 – ESTIMATING THE CONSTRAINTS TO AGRICULTURAL TRADE OF DEVELOPING COUNTRIES
OECD TRADE POLICY PAPER N°142 © OECD 2013
GLOBALGAP98
, organises bulk purchases of equipment and consumables, and offers some
training and technical assistance to its members, most services proposed on a for-profit basis.
AIA has developed a brand, Zambique, to communicate the superior qualities of AIA-
branded cashew nuts and to control product quality. TechnoServe also worked with the
industry to resuscitate the trade association AICAJU as an advocate of the entire sector.
The poor availability of working capital was another challenge that had to be addressed
during the efforts to reinvigorate the cashew sector. In 2000 a loan guarantee programme
supported by the government was set up by INCAJU, the government agency responsible for
promoting the cashew nut industry, with the assistance of TechnoServe. When needs
expanded beyond INCAJU‘s resources, a loan guarantee programme offered by the Ministry
of Industry and Commerce and supported by USAID was put in place. Since 2009, the
objective of the government is to have the loan programme gradually taken over by local
commercial banks, an endeavour that is still challenging. Funding difficulties have caused
some smaller firms to go out of business.
The impact on jobs and income99
In 2005, Mozambique produced 82 000 tonnes of raw nuts, of which 9 000 tonnes were
processed locally, and exports amounted to USD 3.6 million, with strong potential for further
growth. In 2007, the Mozambican cashew industry had grown to become a USD 20 million
industry and the fourth largest cashew producer in the world. In 2008, TechnoServe ceased
direct support in the country, considering that the aim of reviving the domestic processing
industry has been achieved100
.
Indeed, while total cashew exports grew from 50 000 tonnes in 2002 to only
66 000 tonnes in 2008, the proportion of processed cashews jumped from zero to 36%, and
proceeds from the export of processed nuts reached USD 10 million. The processing industry
counted already 16 processing plants, employing over 4 700 people and paying USD 1.6
million in wages, an average of USD 343 per annum (up from only 407 workers in 2002/03
with an annual average pay check of USD 213, although still considerably less than the
10 000 workers of the 1970s). In the vicinity of the processing plants the entrepreneurs
provided funding for schools and healthcare for the workers and their families.
The incomes of about 120 000 small-scale farmers also increased significantly based on
a combination of yield improvement and better prices. While in the period 2001-04, the
average farmer‘s share relative to the international FOB raw cashew price was 32%, it rose
to 42% in 2005-08, due to increased demand stimulated by domestic cashew processing. For
2007 and 2008 it was estimated that the price increases attributable to the domestic
processing industry generated just under USD 2.5 million of additional income for farmers.
In Nampula Province, where 40% of the country‘s cashew nut production is located and
where human development indices are lower compared to the national averages, the project
was particularly poverty relevant.
98.
GLOBALG.A.P is a private sector body that sets voluntary standards for the certification of
production processes of agricultural (including aquaculture) products around the globe.
99. Drawn extensively from SECO (2011).
100. TechnoServe is now replicating the approach first tested in Mozambique and subsequently used in
Tanzania, Kenya and South Africa, in a large program of support to the cashew sector in West Africa
(TechnoServe to Help Implement Two New Bill & Melinda Gates Foundation-Funded Programs in
West Africa, www.technoserve.org/press-room).
ESTIMATING THE CONSTRAINTS TO AGRICULTURAL TRADE OF DEVELOPING COUNTRIES – 61
OECD TRADE POLICY PAPER N°142 © OECD 2013
Table 4. Impact of growth of cashew processing on smallholder producers
Year Number of smallholder producers Value of purchases from smallholders
2003 9 530 USD 574 000
2004 41 800 USD 1.4 million
2005 79 800 USD 2.8 million
2006 111 500 USD 3.9 million
2007 146 000 USD 5.1 million
Source: TechnoServe.
Finally, the local economy received extra stimulation both on account of related
infrastructure investments, such as road upgrading, and thanks to the higher wages of cashew
nut farmers and factory workers. Although the government of Mozambique lost export duty
revenue levied on the export of raw nuts (equivalent to USD 2.6 million in 2007/08), the
aggregate positive impact of the cashew nut processing industry on the economy of
Mozambique from 2001 to 2008 was calculated at USD 11.5 million, including through the
creation of over 6 200 formal sector jobs within and beyond the cashew industry (support
services, construction, maintenance, transport).
VIII. Conclusion
This report provides quantitative evidence on the severity of supply-side constraints to
developing countries agricultural trade performance. The analysis was motivated by the need
to identify the most important factors constraining developing countries‘ agricultural exports
in order to inform prioritisation and sequencing of domestic policy reforms, as well as
targeting of donor interventions.
The recent food crisis has generated renewed interest of the international community for
a sector that is widely considered as an important contributor to developing countries
economic growth and fight against poverty and food insecurity. The report confirms that
some of the insights of previous work on the constraints to overall trade performance
(Hallaert et al., 2011, Estimating the Constraints to Trade of Developing Countries) are
equally valid in the case of agricultural trade but also identifies a number of specific
obstacles to this sector.
According to the quantitative analysis, developing countries‘ agricultural exports are
highly responsive to the quality of transport and trade-related infrastructure. An
improvement of 10% in the transport and trade-related infrastructure quality index has the
potential of increasing developing countries agricultural exports by 30%. This finding
confirms a large body of literature which highlights the impact of efficient and accessible
transport on countries‘ capacity to explore market access opportunities for their agricultural
products. Tariffs are also found to have a significant negative impact on agricultural trade.
Yet, despite the higher level of tariffs on agricultural products, the analysis shows that their
impact is not necessarily stronger than on manufactures. On average, a reduction of tariffs by
10% would increase trade value by about 3.7%. Although data limitations have not allowed
controlling for the impact of other trade-cost related constraints, such as standards and
conformity assessment, and access to credit, case studies have illustrated how badly these
constraints affect the agricultural trade performance of developing countries, in particular as
regards small and medium agricultural producers, processors and traders. In the case of
standards and conformity assessment, the wide range of actions necessary to upgrade
efficiently implementation, monitoring and certification capacities is impossible to bring to
62 – ESTIMATING THE CONSTRAINTS TO AGRICULTURAL TRADE OF DEVELOPING COUNTRIES
OECD TRADE POLICY PAPER N°142 © OECD 2013
fruition without long-term commitment and extensive planning. Satisfactory access to
finance appears as a prerequisite not only for undertaking export trade activities but also for
addressing a number of comparative-advantage constraints that limit agricultural
productivity growth.
Focusing on the poorest countries in our sample, it appears that large trade boosts could
also be achieved by lifting constraints on access to governance and infrastructure quality.
However, important gains can be obtained from lifting constraints on education and fresh
water availability – and this because poor countries lag far behind better off developing
countries in this respect. While not much can be done with regards to water availability and
it is often not desirable to distort a country‘s resource allocation by subsidising water, this
suggests an important role of aid for trade in terms of helping address the regulatory and
infrastructure issues that prevent the use of existing water resources. Such improvements
could in addition enable greater participation of the private sector in irrigation systems or
input and credit markets. Meanwhile, programmes for fostering the use of specific input
factors in agricultural production need to be integrated into a value chain approach. While
infrastructure often receives the largest sums of aid for trade, this finding reminds of other
important bottlenecks that remain in the poorest countries.
The analysis also highlights the important impact of complementary policies such as
education and political stability on developing countries agricultural trade performance, in
line with evidence from the related literature. A 10% improvement in secondary education
enrolment rate would generate a 7.2% increase in agricultural trade value. Aid interventions
aiming at upgrading skills could contribute to agricultural modernisation and improve the
market participation of smallholders.
Finally, case studies have illustrated how programmes providing donor support to
promote private sector initiative can make a significant contribution to poverty reduction
through increased employment and the promotion of production adapted to local
endowments.
The exercise conducted in this report is of course not sufficient in itself to direct aid
flows or prioritise domestic reforms. Policy conclusions for aid-for-trade investments should
be drawn by comparing these outcomes with the cost and feasibility of lifting the different
constraints identified. Serious preparatory field work to identify the most relevant,
country-specific approach to building supply, production and marketing capacities is
paramount in the success of such endeavours.
ESTIMATING THE CONSTRAINTS TO AGRICULTURAL TRADE OF DEVELOPING COUNTRIES – 63
OECD TRADE POLICY PAPER N°142 © OECD 2013
References
Alene, A.D. and V.M. Manyong (2007), ―The Effects of Education on Agricultural Productivity
Under Traditional and Improved Technology in Northern Nigeria: An Endogenous Switching
Regression Analysis‖, Empirical Economics (2007) 32:141–159.
Alimi, T. (2007), ―Trade and Environment Dimensions in the Food and Food Processing Industries
in Asia and the Pacific - A Country Case Study of Indonesia‖, Report prepared for UNESCAP,
Environment and Sustainable Division, Bangkok, Thailand.
Anderson, J.E. and E. van Wincoop (2003), ―Gravity with Gravitas: A Solution to the Border
Puzzle‖, American Economic Review, American Economic Association, Vol. 93(1), pp. 170-192,
March.
Anderson, J. E. and Y.V. Yotov (2010), ―The Changing Incidence of Geography‖, American
Economic Review, No. 100 (December), pp. 2157-2186.
Ariesusanty, L. (2011), ―Indonesia: Country Report‖, in Willer, H. and L. Kilcher (eds.), The World
of Organic Agriculture, Statistics and Emerging Trends, IFOAM, Bonn & FiBL, Frick.
Azam, S., K. Imai and R. Gaiha (2012), ―Agricultural Supply Response and Smallholders Market
Participation – the Case of Cambodia‖, Discussion Paper DP2012-09, Research Institute for
Economics and Business Administration, Kobe University.
Baier, S. and J.H. Bergstrand (2009), ―Bonus Vetus OLS: A Simple Method for Approximating
International Trade-Cost Effects Using the Gravity Equation‖, Journal of International
Economics 77, pp. 77-85.
Baier, S. L., J.H. Bergstrand and R. Mariutto (2010), ―The Growth of Bilateralism‖, Working Paper
Series No. 12, June 2010, The University of Warwick - CAGE,
Bais K. (2010), ―Banco Terra, a Rural Bank in Mozambique‖, available at:
/www.oxfamnovib.nl/Redactie/Downloads/Rapporten/Article%20Banco%20Terra%20ENG%20
ON%20def.pdf.
Balat, J., I. Brambilla and G. Porto (2009), ―Realizing the Gains from Trade: Export Crops,
Marketing Costs and Poverty‖, Journal of International Economics 78, 21-31.
Basu, S.R., H. Kuwahara and F. Dumesnil (2011), ―Evolution of Non-Tariff Measures: Emerging
Cases from Selected Developing Countries‖, UNCTAD/ITCD/TAB/53.
Beggs, M. (2010), Value Chain Finance in Zambia, Supply Chain Solutions to Financial
Constraints, USAID PROFIT.
Behar, A., P. Manners and B. Nelson (2011), ―Exports and International Logistics‖, World Bank
Policy Research Working Paper WPS5691, June.
Behar, A. and A.J. Venables (2010), ―Transport Costs and International Trade‖, Department of
Economics Discussion Paper Series, No. 488, June 2010, University of Oxford.
Besley, T. and T. Persson (2011), Pillars of Prosperity: The Political Economics of Development
Clusters, Princeton University Press.
Bergstrand, J.H. (1989), ―The Generalized Gravity Equation, Monopolistic Competition, and the
Factor-Proportions Theory in International Trade‖, The Review of Economics and Statistics, Vol.
1, No. 1 (Feb, 1989), pp. 143-153.
Biau, C., K. Dahou and T. Homma (2008), ―How to Increase Sound Private Investment in Africa‘s
Road Infrastructure: Building on Country Successes and OECD Policy Tools‖, paper prepared
for the NEPAD-OECD Africa Investment Initiative Roundtable, Kampala, Uganda.
64 – ESTIMATING THE CONSTRAINTS TO AGRICULTURAL TRADE OF DEVELOPING COUNTRIES
OECD TRADE POLICY PAPER N°142 © OECD 2013
Bonaglia, F. (2008), ―Zambia, Sustaining Agricultural Diversification‖, OECD Development Centre,
Business for Development Series.
Bouet, A., S. Mishra and D. Roy (2008), ―Does Africa Trade Less Than it Should, and if so, Why?
The Role of Market Access and Domestic Factors‖, IFPRI Discussion Paper 00770, May.
Brambilla, I. and G. Porto (2007), ―Market Structure, Outgrower Contracts and Farm Output,
Evidence from Cotton Reforms in Zambia‖, Oxford Economic Papers, 63 (4), pp. 740-766.
Breisinger, C., X. Diao, J. Thurlow and R. Al Hassan (2008), Agriculture for Development in
Ghana, International Food Policy Research Institute and University of Ghana, PEGNet
Conference.
Bresciani, F. and A. Valdes (2007), Beyond Food Production: the Role of Agriculture in Poverty
Reduction, FAO, Rome.
Brookings Africa Growth Initiative (2012), ―Accelerating Growth through Improved Intra-African
Trade‖, Washington.
Brooks, J. (2012), ―A Strategic Framework for Strengthening Rural Incomes in Developing
Countries‖, in Agricultural Policies for Poverty Reduction, OECD, Paris.
Byerlee, D., A. de Janvry and E. Sadoulet (2009), ―Agriculture for Development: Toward a New
Paradigm‖, Annual Review of Resource Economics, Vol. 1, No. 1, pp. 15-35.
Cadot, O., L. Dutoit and M. Olarreaga (2009), ―Barriers to Exit from Subsistence Agriculture‖,
CEPREMAP Working Papers (Docweb) 1014.
Cadot, O., A. M. Fernandes, J. Gourdon and A. Mattoo (2011), ―Impact Evaluation of Trade
Interventions: Paving the Way‖, Washington DC, World Bank, Policy Research Working Paper
5877.
Cadot, O. and J. Gourdon (2012), ―Assessing the Price Raising Impact of Non-Tariff Measures in
Africa‖, Africa Trade Policy Note no 29, available at: www.wolrdbank.org/afr/trade.
Caligari, P.D.S., C. Topper and T. Mooney (1998), Improving Production of Cashew in
Mozambique: A Preliminary Strategy, prepared for USAID.
Cardno Emerging Markets Ltd (2010), MATEP End-of-Program Evaluation, Final Report.
Carruthers, R., R.R. Krishnamani and S. Murray (2010), ―Improving Connectivity: Investing in
Transport Infrastructure in Sub-Saharan Africa, Africa Infrastructure Country Diagnostic‖,
Working Paper no7, World Bank, Washington.
Cervantes-Godoy, D. and J. Dewbre (2010) ―Economic Importance of Agriculture for Poverty
Reduction‖, OECD Food, Agriculture and Fisheries Working Paper No. 23.
Chaturvedi, S. and G. Nagpal (2003), ―WTO and Product-Related Environmental Standards:
Emerging Issues and Policy Options‖, Economic and Political Weekly, January 4-10.
Christiaensen L, L. Demery and J. Kühl (2006), ―The Role of Agriculture in Poverty Reduction: An
Empirical Perspective‖, World Bank Policy Research Working Paper 4013.
Christoplos, I. (2010), ―Mobilizing the Potential of Rural and Agricultural Extension Services‖,
FAO, Office of Knowledge Exchange, Research and Extension, The Global Forum for Rural
Advisory Services, 2010.
Crivelli, P. and J. Gröschl (2012), ―SPS Measures and Trade: Implementation Matters‖, World Trade
Organization Working Paper.
Datt, G. and M. Ravallion (1998), ―Why Have Some Indian States Done Better than Others at
Reducing Rural Poverty‖, Economica, London School of Economics and Political Science,
vol. 65(257), pages 17-38.
DEFRA (2007), Overview of the Benefits and Carbon Costs of African Horticultural Trade with the
UK, Food Chain Economics Unit, April.
ESTIMATING THE CONSTRAINTS TO AGRICULTURAL TRADE OF DEVELOPING COUNTRIES – 65
OECD TRADE POLICY PAPER N°142 © OECD 2013
Delpeuch, C. and A. Vandeplas (2012), ―Revisiting the ―Cotton Problem‖ – A Comparative Analysis
of Cotton Reforms in sub-Saharan Africa‖, World Development,
dx.doi.org/10.1016/j.worlddev.2012.06.020
Dercon, S., D. Gilligan, J. Hoddinott and T. Woldehanna (2008), ―The Impact of Agricultural
Extension and Roads on Poverty and Consumption Growth in Fifteen Ethiopian Villages‖, IFPRI
Discussion Paper 00840.
Diao, X. and A. Nin-Pratt (2007), ―Growth Options and Poverty Reduction in Ethiopia – An
Economy-Wide Model Analysis‖, Food Policy, Vol. 32(2), pp. 205-228.
Diop, N., P. Brenton and Y. Asarkaya (2005), ―Trade Costs, Export Development and Poverty in
Rwanda‖, World Bank, WPS3784.
Disdier, A-C., L. Fontagné, and M. Mimouni (2008), ―The Impact of Regulations on Agricultural
Trade: Evidence from SPS and TBT Agreements‖, American Journal of Agricultural Economics,
90(2), May, pp. 336-350.
Djama, M. (2011), "Articulating Private Voluntary Standards and Public Regulations‖, CIRAD,
Perspective, No. 11, August.
Dorosh, P., H. Wang, L. You and E. Schmidt (2010), ―Crop Production and Road Connectivity in
Sub-Saharan Africa‖, World Bank Policy Research Working Paper 5385.
Easterly, W. and A. Reshef (2010), ―African Export Successes: Surprises, Stylized Facts and
Explanations", Cambridge MA, NBER Working Paper 16597.
Eaton, J. and S. Kortum (2002), ―Technology, Geography and Trade‖, Econometrica 70 (no. 5),
pp. 1741-1779, September.
Ernst and Young (2011), It’s time for Africa, Ernst and Young’s 2011 Africa attractiveness survey.
European Commission (2008), EU-RI Trade Support Programme, Closure Report,
ASIE/ID/2003/005-664.
European Union (2008), Final Evaluation of the EU-Indonesia Trade Support Programme, June.
FAO (2011), Private Standards and Certification in Fisheries and Aquaculture: Current Practice
and Emerging Issues, FAO Fisheries and Aquaculture Technical Paper No. 553.
Feenstra, R.C. (2004), Advanced International Trade: Theory and Evidence, Princeton Univ Press,
Princeton, NJ.
Ferrantino, M. (2012), ―Using Supply Chain Analysis to Examine the Costs of Non-Tariff Measures
and the Benefits of Trade Facilitation‖, WTO Staff Working Paper ERSD-2012-02.
Ferro, E., A. Portugal-Perez and J. Wilson (2011), ―Aid to the Services Sector. Does it Affect
Manufacturing Exports?‖, World Bank Policy Research Paper 5728
Fish-journal (2010), Shrimp Culture Partnership in Indonesia, October 28, available at: www.fish-
journal.com/2010/10/shrimp-culture-partnership-in-indonesia.html.
Food and Agricultural Organization, FAO ResourceSTAT.
Foster, A., and M.R. Rosenzweig (2008), ―Economic Development and the Decline of Agricultural
Employment‖ in Schultz, T.P and J.A. Strauss (eds.) Handbook of Development Economics
Vol. 4, pp. 3051-3083.
Freund, C. and N. Rocha (2011), ―What Constraints Africa‘s Exports‖, World Bank Economic
Review 25, 361-386.
G20 (2012), Sustainable Agricultural Productivity Growth and Bridging the Gap for Small-Family
Farms, Interagency Report to the Mexican G20 Presidency, 12 June 2012
Giovannucci, D. and T. Purcell (2008), ―Standards and Agricultural Trade in Asia‖, Asian
Development Bank Institute, Discussion Paper, No. 107, Tokyo.
66 – ESTIMATING THE CONSTRAINTS TO AGRICULTURAL TRADE OF DEVELOPING COUNTRIES
OECD TRADE POLICY PAPER N°142 © OECD 2013
Große-Ruschkamp, A. and K. Seelige (2010), Analysis of the Cashew Value Chain in Mozambique,
African Cashew Initiative, Deutsche Gesellschaft für Technische Zusammenarbeit GmbH (GTZ),
available at: www.gtz.de.
Haggblade, S., J. Govereh, H. Nielson, D. Tschirley and P. Dorosh (2008), ―Regional Trade in Food
Staples: Prospects for Stimulating Agricultural Growth and Moderating Short-Term Food
Security Crises in Eastern and Southern Africa‖, Paper prepared for the World Bank.
Hallaert, J-J., R. Cavazos Cepeda and G. Kang (2011), ―Estimating the Constraints to Trade of
Developing Countries‖, OECD Trade Policy Working Paper No. 116.
Hallaert, J-J. (2010), ―Increasing the Impact of Trade Expansion on Growth: Lessons from Trade
Reforms for the Design of Aid for Trade”, OECD Trade Policy Working Paper No. 100.
Hallaert, J-J. and L. Munro (2009), ―Binding Constraints to Trade Expansion: Aid for Trade
Objectives and Diagnostics Tools‖, OECD Trade Policy Working Paper No. 94.
Haq, Z., K. Meilke and J. Cranfield (2011), ―The Gravity Model and the Problem of Zero‘s in
Agri-Food Trade‖, Canadian Agricultural Trade Policy and Competitiveness Research Network
Working Paper 2011-02, August.
Hausmann, R., D. Rodrik and A. Velasco (2005), Growth Diagnostics, unpublished, available at:
www.hks.harvard.edu/fs/rhausma/new/growthdiag.pdf.
Hernandez, M. and M. Torero (2011), ―Fertilizer Market Situation. Market Structure, Consumption
and Trade Pattern, and Pricing Behaviour‖, IFPRI Discussion Paper 01058, January.
Hillary, R. (1995), Small Firms and the Environment: a Groundwork Status Report, Birmingham
Groundwork Foundation.
Hoekman, B. and A. Nicita (2011), ―Trade Policy, Trade Costs, and Developing Country Trade‖,
World Development, Elsevier, Vol. 39(12), pp. 2069-2079.
IEG (2006), Assessing World Bank Support for Trade 1987-2004: an IEG Evaluation, the World
Bank.
Jaud, M. and O. Cadot (2011), ―A Second Look at the Pesticides Initiative Program, Evidence from
Senegal‖, Washington, DC, World Bank, Policy Research Working Paper 5635.
Jayasuriya, S., D. MacLaren and R. Mehta (2006), ―Meeting Food Safety Standards in Export
Markets: Issues and Challenges facing Firms Exporting from Developing Countries‖, paper
presented at the IATRC Summer Symposium, Bonn, Germany, 28-30 May.
Jedwab, R. and A. Moradi (2012), Revolutionizing Transport: Modern Infrastructure, Agriculture
and Development in Ghana, LSE Research Online, eprints.lse.ac.uk/42263.
Kanji, N., C. Vijfhuizen, C. Braga and L. Artur (2004), ―Cashing in on Cashew Nuts: Women
Producers and Factory Workers in Mozambique‖, in M. Carr (ed.), Chains of Fortune. Linking
Women Producers and Workers with Global Markets, Commonwealth Secretariat, London, 2004,
pp. 75-102.
Kaplinsky, R., A. Terheggen and J. Tijaja (2010), ―What Happens When the Market Shifts to China?
The Gabon Timber and Thai Cassava Value Chains‖, Washington, DC, World Bank, Policy
Research Working Paper 5206
Karugia, J., M. Waithaka, A. Freeman, R. Prabhu, B. Shiferaw, B. Gbegbelegbe, S. Massaw,
M. Kyotalimye, J. Wanjiku and E. Macharia (2009), ―Responding to Food Price Crisis in Eastern
and Southern Africa: Policy Options for National and Regional Action‖, ReSAKSS Working
Paper No. 27.
Kee, H.L., A. Nicita and M. Olarreaga (2009), ―eEstimating Trade Restrictiveness Indices‖, The
Economic Journal, 119(534), pp. 172–199.
ESTIMATING THE CONSTRAINTS TO AGRICULTURAL TRADE OF DEVELOPING COUNTRIES – 67
OECD TRADE POLICY PAPER N°142 © OECD 2013
Kee, H.L., C. Neagu, and A. Nicita (2010), ―Is Protectionism on the Rise? Assessing National Trade
Policies During the Crisis of 2008‖, World Bank Policy Research Working Paper WPS5274,
April.
Kennedy, P.E. (1981), ―Estimation with Correctly Interpreted Dummy Variables in Semi-
Logarithmic Equations‖, American Economic Review, 71, 801.
Lamy, P. (2009), ―We Must Keep the Foot on the Gas on Aid for Trade‖, Closing Remarks at the
Second Global Review on Aid for Trade, available at:
www.wto.org/english/news_e/news09_e/aid_07jul09_e.htm.
Larkin, B. (2011), Indonesia, Market Development and Access Strategy 2011/2012, Working Paper,
Department of Primary Industries, Victoria, Australia.
Lederman, D., M. Olarreaga and L. Payton (2010), ―Export Promotion Agencies Revisited‖, Journal
of Development Economics 91, 257-265.
Lederman, D. (2011), ―International Trade and Inclusive Growth: A Primer for Busy Policy
Analysts‖, Washington, DC, World Bank, Policy Research Working Paper 5886.
Lesser, C. and E. Moïsé (2009), ―Informal Cross-Border Trade and Trade Facilitation Reform in
Sub-Saharan Africa‖, OECD Trade Policy Working Paper No. 86.
Limao, N. and A. Venables (2001), ―Infrastructure, Geographical Disadvantage, Transport Costs and
Trade‖, World Bank Economic Review, Vol. 15(3), pp. 451-479.
Lord, M., R. Oktaviani and E. Ruehe (2010), Indonesia’s Trade Access to the European Union:
Opportunities and Challenges, report commissioned and financed by the European Communities.
Maertens, M., L. Colen and J.F.M. Swinnen (2008), ―Globalization and Poverty in Senegal: A Worst
Case Scenario?‖, LICOS Discussion Paper 217/2008.
Maertens, M. and J.F.M. Swinnen (2009), ―Trade, Standards and Poverty: Evidence from Senegal‖,
World Development, Vol. 37, No. 1, pp. 161-178.
Martin, P., T. Mayer and M. Thoenig (2010), ―The Geography of Conflict and Free Trade
Agreements‖, CEPR Discussion Paper 7740.
McMillan M., D. Rodrik and K. Welsh (2002), ―When Economic Reform Goes Wrong: Cashews in
Mozambique‖, NBER Working Paper No. 9117
McNamer, B. (2009), ―Saving Lives with Cashews in Mozambique‖, available at:
www.sramanamitra.com.
Melzer, I., R. Agasi and H. Botha (2010), Demand-Side Analysis of Access to Financial Services for
Businesses in Zambia, Zambia Business Survey, FinMark Trust, available at:
www.finmark.org.za.
Minot, N. (2011), Transmission of World Food Price Changes to Markets in Sub-Saharan Africa,
IFPRI Discussion Paper 01059.
Moenius, J. (2006), The Good, the Bad and the Ambiguous: Standards and Trade in Agricultural
Products, paper presented at the IATRC Summer symposium, Bonn, Germany, May, 28-30.
Mohanty, S.K., and T.R. Manoharan (2002), ―Analysis of Environment Related Non-Tariff
Measures in the European Union: Implications for South Asian Exports‖, RIS Discussion Paper
#38, Research and Information System for Developing Countries, New Delhi.
Mohanty, S.K., and S. Chaturvedi (2005), ―Prospects for Environmental Trade Under the Regional
Process in South Asia: Evidence from SAPTA and Proposals for SAFTA‖, RIS Discussion Paper
#102, Research and Information System for Developing Countries, New Delhi.
Mohanty, S.K. (2007), Trade and Environment Dimensions in the Food and Food Processing
Industries in Asia and the Pacific - REGIONAL STUDY, Report prepared for UNESCAP,
Environment and Sustainable Division, Bangkok, Thailand.
68 – ESTIMATING THE CONSTRAINTS TO AGRICULTURAL TRADE OF DEVELOPING COUNTRIES
OECD TRADE POLICY PAPER N°142 © OECD 2013
Mole, P.N. (2000), An Economic Analysis of Smallholder Cashew Development Opportunities and
Linkages to Food Security in Mozambique’s Northern Province of Nampula, Dissertation,
Michigan State University.
Morris, M., V.A. Kelly, R.J. Kopicki and D. Byerlee (2007), ―Fertilizer use in African Agriculture.
Lessons Learned and Good Practice Guidelines‖, The International Bank for Reconstruction and
Development/The World Bank.
Natawidjaja, R.S., E. Rasmikayati, B. Kharisma, D. Purwanto and T. Reardon (2007), Restructuring
of Agrifood Chains in Indonesia - National and Local Meso Study, IIED, London, available at
www.regoverningmarkets.org.
Ndulu, B. and Chakraborty, L., Lijane, L. Ramachandran, V, and Wolgin, J. (2007): ―Challenges of
African Growth: Opportunities, Constraints and Strategic Directions‖, World Bank, Washington
DC.
Ngo, T.M. (2006), Education and Agricultural Growth in Vietnam, available at:
http://perso.fundp.ac.be/~tpngo/Education_WPjun06.pdf.
Nin-Pratt, A., M. Johnson, E. Magalhaes, X. Diao, L. You, and J. Chamberlin (2009), ―Priorities for
Realizing the Potential to Increase Agricultural Productivity and Growth in Western and Central
Africa‖, IFPRI Discussion Paper 0876.
Nin Pratt A., P. Bonnet, M.A. Jabbar, S. Ehui and C.de Haan (2005), Benefits and Costs of
Compliance of Sanitary Regulations in Livestock Markets: The Case of Rift Valley Fever in the
Somali Region of Ethiopia, ILRI (International Livestock Research Institute), Nairobi.
Nkuepo, H.J. (2012), Reducing non-tariff barriers to trade in Africa, Bridges Africa Review, Vol.1.
No. 3.
Nordas, H.K., E. Pinali and M. Geloso Grosso (2006), ―Logistics and Time as a Trade Barrier‖,
OECD Trade Policy Working Paper No. 35.
OECD (2006), Aid for Trade: Making it Effective, Paris.
OECD (2008), ―Binding Constraints to Trade and the Role of Aid for Trade‖, Background
Document for Session II, OECD dialogue on Aid for Trade, 3-4 November, Paris.
OECD (2011), Promoting Effective Aid for Trade, Paris.
OECD (2012a), ―Global Food Security: Trends, Economic Determinants and Policy‖, OECD
internal document.
OECD (2012b), Agricultural Policies for Poverty Reduction, OECD publishing.
OECD (2012c), OECD Review of Agricultural Policies: Indonesia, OECD publishing.
Oktaviani, R. and Erwidodo (2005), ―Indonesia‘s Shrimp Exports: Meeting the Challenge of Quality
Standards‖, in WTO (ed.), Managing the Challenges of WTO Participation, Geneva.
Orden, D., J. Beghin and G. Henry (2012), ―Key Findings of the NTM-Impact Project‖, in ―NTMS,
Agricultural and Food Trade, and Competitiveness‖, Special Issue of The World Economy
(forthcoming 2012).
Otsuki, T., J.S. Wilson and M. Sewadeh (2001), ―Saving Two in a Billion: Quantifying the trade
Effect of European Food Safety Standards on African Exports‖, Food Policy, 26, p. 495–514.
Pannhausen, C. and B. Untied (2010), Regional Agricultural Trade for Economic Development and
Food Security in Sub-Saharan Africa, Deutsche Gesellschaft für Technische
Zusammenarbeit (GTZ) mbH, available at: www.acp-eu-trade.org.
ESTIMATING THE CONSTRAINTS TO AGRICULTURAL TRADE OF DEVELOPING COUNTRIES – 69
OECD TRADE POLICY PAPER N°142 © OECD 2013
Piper, T. (2007), ―Choosing Between Strategies: Adapting Industry Approaches to Specific Value
Chain Analysis Using Three Comparative Commodities‖, presentation at the Small Enterprise
Development Workshop, available at: www.deza.admin.ch/ressources/resource_de_150867.pdf.
Porto, G., N. Depetris Chauvin and M. Olarreaga (2011). Supply Chains in Export Agriculture,
Competition, and Poverty in Sub-Saharan Africa, World Bank, Washington.
Poulton, C., J. Kydd and A. Dorward (2006), ―Overcoming market constraints on pro-poor
agricultural growth in Sub-Saharan Africa‖, Development Policy Review, 2006, 24 (3): 243-277.
Pradana, M.N. (2011), Case Study of Organic Certification System in Indonesia, IASA, 16 June.
Raballand, G., P. Marchi and C. Petracco (2010), Rural Road Investment Efficiency, Lessons from
Burkina Faso, Cameroon and Uganda, Directions in Development, World Bank, Washington.
Ramundo, K. (2011), ―From Soup to Nuts: Reviving Mozambique‘s Cashew Industry‖, USAID
Frontlines, November-December 2011.
Salami, A., A.B. Kamara and Z. Brixiova (2010), ―Smallholder Agriculture in East Africa: Trends,
Constraints and Opportunities‖, Working Paper Series No. 105, African Development Bank,
Tunis.
Santos Silva, J. and S. Tenreyro (2005), ―The Log of Gravity‖, The Review of Economics and
Statistics, MIT Press, Vol. 88(4), pp. 641-658.
Schwartz, J. (2011), Food Prices: Eating the Cost of Logistics, available at:
blogs.worldbank.org/latinamerica/food-prices-eating-the-cost-of-logistics.
SECO (2011), Strengthening the Competitiveness of Export Oriented Agro Value Chains, Cashew
Nut Value Chain in Mozambique, OECD-WTO Aid-for-Trade Case Story Switzerland, available
at: www.oecd.org/dataoecd/11/41/47427815.pdf.
Sims B. and J. Kienzle (2006), Farm Power and Mechanization for Small Farms in Sub-Saharan
Africa, FAO, Rome.
Siringoringo, H., Prihandoko, D. Tintri and A. Kowanda (2009), Problems Faced By Small and
Medium Business in Exporting Products, Delhi Business Review Vol. 10, No. 2
(July-December).
Soesastro, H., M.C. Basri (2005), ―The Political Economy of Trade Policy in Indonesia‖, ASEAN
Economic Bulletin 22(1): 3–18.
Stifel, D. and B. Minten (2008), ―Isolation and agricultural productivity‖, Agricultural Economics,
39(2008)1-15.
Surono, I. J. (2007), Country case study of Indonesia, presented at the Regional Conference on
Organic Agriculture in Asia, Bangkok, Thailand, 12-15 December.
Sustainable Fisheries Partnership Foundation (2011), Indonesian Wild Shrimp Fishery Improvement
Project, available at: www.sustainablefish.org/fisheries-improvement/shrimp/indonesia-wild-
shrimp.
Sustainable Fisheries Partnership Foundation (2011), Indonesian Blue Swimming Crab, available at:
www.sustainablefish.org/fisheries-improvement/crabs/indonesian-blue-swimming-crab.
Taylor, M., J. Dougherty and R. Munro (2009), Zambia’s Agricultural Finance Market, Challenges
and Opportunities, A Study by PROFIT and ZNFU, available at: http://znfu.org.zm.
Topper, C.P. (2002), Issues and Constraints related to the Development of Cashew Nuts from Five
Selected African Countries, International Trade Centre Common Fund for Commodities.
UEMOA (2011), 18th
Road Governance Report, available at:
www.watradehub.com/sites/default/files/120611%2018th%20IRTG%20Report_EN.pdf.
70 – ESTIMATING THE CONSTRAINTS TO AGRICULTURAL TRADE OF DEVELOPING COUNTRIES
OECD TRADE POLICY PAPER N°142 © OECD 2013
UN Economic Commission for Africa, African Union and African Development Bank (2010),
Assessing Regional Integration in Africa IV: Enhancing Intra-African Trade, Adis Ababa,
/www.uneca.org/aria4/ARIA4Full.pdf.
USAID (2008), Market Access, Trade and Enabling Policies Project (MATEP) Annual Report #3,
Lusaka, Zambia.
USAID (2009), Market Access, Trade and Enabling Policies Project (MATEP) Quarterly Report
#13, Lusaka, Zambia.
USAID (2010), From Aid to Trade: Delivering Results. A Cross Country Evaluation of USAID
Trade Capacity Building, Washington, 24 November 2010.
USAID (2011), Legal and Institutional Reform in Zambia’s Agricultural Sector, AgCLIR Zambia.
USAID West Africa Trade Hub (2010), ―Trucking to West Africa‘s Landlocked Countries‖: Market
Structure and Conduct‖, West Africa Trade Hub Technical Report No. 32.
USAID West Africa Trade Hub (2011), ―Regional Agricultural Transport and Trade Policy Study‖,
West Africa Trade Hub Technical Report No. 41.
Utz, V. (2011), Modern Energy Services for Modern Agriculture. A Review of Smallholder Farming
in Developing Countries, Deutsche Gesellschaft für Technische Zusammenarbeit GmbH (GTZ),
available at: www.gtz.de.
Van Koppen, B., R. Namara and C. Safilios-Rothschild (2005), ―Reducing Poverty through
Investments in Agricultural Water Management‖, Working Paper 101, International Water
Management Institute.
Van Tongeren, F., J. Beghin and S. Marette (2009), ―A Cost-Benefit Framework for the Assessment
of Non-Tariff Measures in Agro-Food Trade‖, OECD Food, Agriculture and Fisheries Working
Papers, No. 21, OECD Publishing.
Wakabi, W. (2011), ―African Cashew Sector May Match Best Campaign Ever‖, The Public Ledger
no. 72712, 14 January, www.public-ledger.com.
World Bank, World Development Indicators and Logistics Performance Index.
World Bank (2007), World Development Report 2008. Agriculture for Development.
World Bank (2009), ―Eastern Africa: A Study of the Regional Maize Market and Marketing Costs‖,
Agriculture and Rural Development Unit, Africa Region Report No. 49831.
World Bank (2011), ―Facilitating Cross-Border Trade between the DRC and Neighbours in the Great
Lakes Region of Africa: Improving Conditions for Poor Traders‖, PREM Africa Region Report
No. 62992-AFR.
World Bank (2012), ―Africa Can Help Feed Africa: Removing Barriers to Regional Trade in Food
Staples‖, PREM Africa Region Report No. 66500-AFR.
Yapp, C. and R. Fairman (2004), Factors Affecting Food Safety Compliance within Small and
Medium-Sized Enterprises: Implications for Regulatory and Enforcement Strategies, Food
Control, 17, 42-51.
Yu, B. and A. Nin-Pratt, (2011), ―Agricultural Productivity and Policies in Sub-Saharan Africa‖,
IFPRI Discussion Paper 01150.
Zambia Business Survey (2010), The Profile and Productivity of Zambian Businesses, FinMark
Trust, available at: www.finmark.org.za.
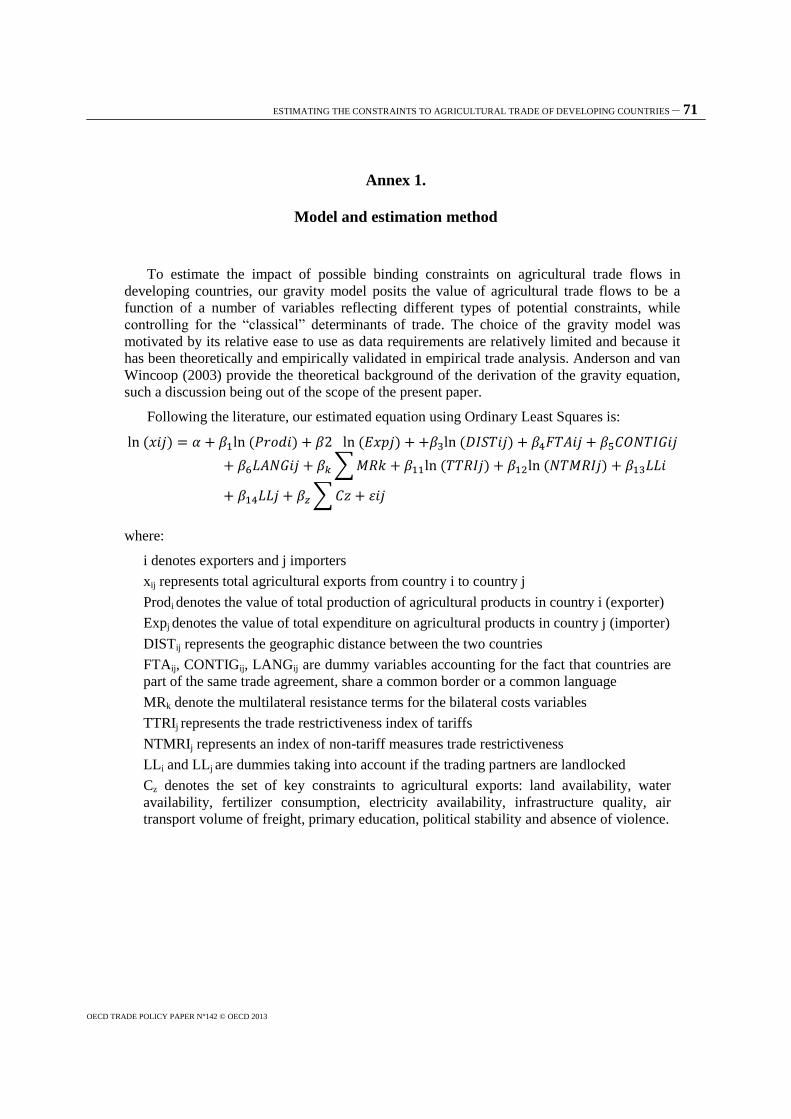
ESTIMATING THE CONSTRAINTS TO AGRICULTURAL TRADE OF DEVELOPING COUNTRIES – 71
OECD TRADE POLICY PAPER N°142 © OECD 2013
Annex 1.
Model and estimation method
To estimate the impact of possible binding constraints on agricultural trade flows in
developing countries, our gravity model posits the value of agricultural trade flows to be a
function of a number of variables reflecting different types of potential constraints, while
controlling for the ―classical‖ determinants of trade. The choice of the gravity model was
motivated by its relative ease to use as data requirements are relatively limited and because it
has been theoretically and empirically validated in empirical trade analysis. Anderson and van
Wincoop (2003) provide the theoretical background of the derivation of the gravity equation,
such a discussion being out of the scope of the present paper.
Following the literature, our estimated equation using Ordinary Least Squares is:
where:
i denotes exporters and j importers
xij represents total agricultural exports from country i to country j
Prodi denotes the value of total production of agricultural products in country i (exporter)
Expj denotes the value of total expenditure on agricultural products in country j (importer)
DISTij represents the geographic distance between the two countries
FTAij, CONTIGij, LANGij are dummy variables accounting for the fact that countries are
part of the same trade agreement, share a common border or a common language
MRk denote the multilateral resistance terms for the bilateral costs variables
TTRIj represents the trade restrictiveness index of tariffs
NTMRIj represents an index of non-tariff measures trade restrictiveness
LLi and LLj are dummies taking into account if the trading partners are landlocked
Cz denotes the set of key constraints to agricultural exports: land availability, water
availability, fertilizer consumption, electricity availability, infrastructure quality, air
transport volume of freight, primary education, political stability and absence of violence.
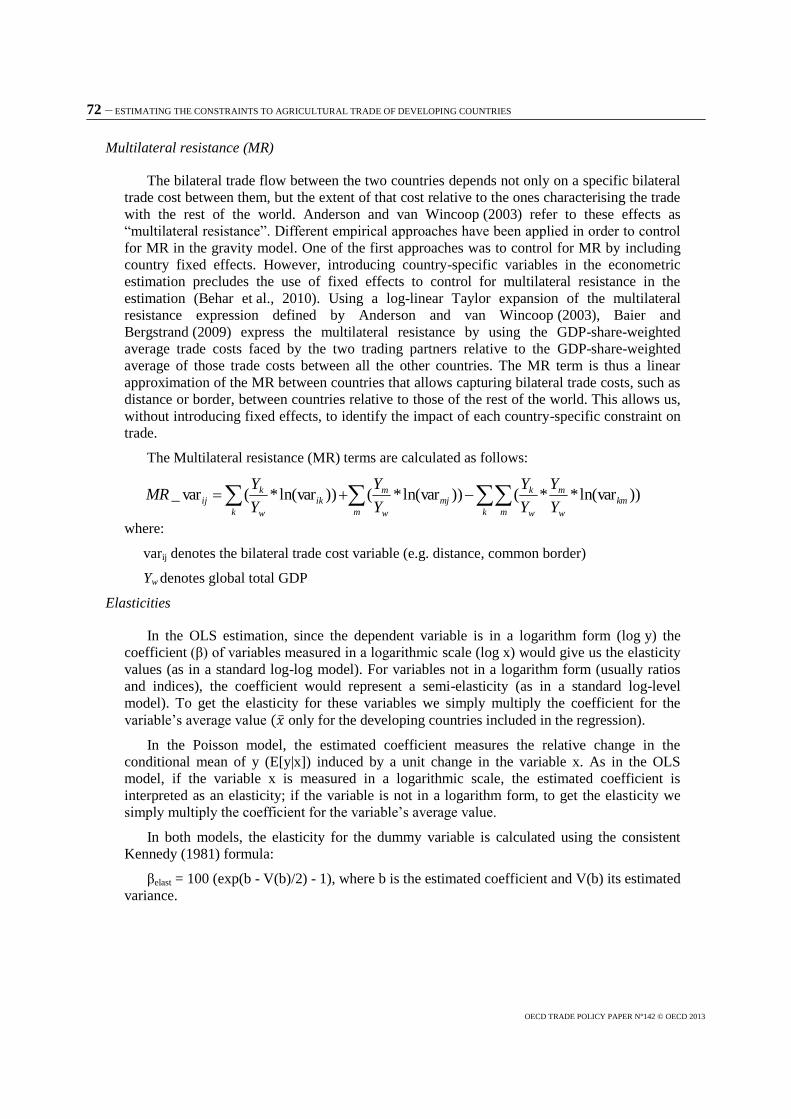
72 – ESTIMATING THE CONSTRAINTS TO AGRICULTURAL TRADE OF DEVELOPING COUNTRIES
OECD TRADE POLICY PAPER N°142 © OECD 2013
Multilateral resistance (MR)
The bilateral trade flow between the two countries depends not only on a specific bilateral
trade cost between them, but the extent of that cost relative to the ones characterising the trade
with the rest of the world. Anderson and van Wincoop (2003) refer to these effects as
―multilateral resistance‖. Different empirical approaches have been applied in order to control
for MR in the gravity model. One of the first approaches was to control for MR by including
country fixed effects. However, introducing country-specific variables in the econometric
estimation precludes the use of fixed effects to control for multilateral resistance in the
estimation (Behar et al., 2010). Using a log-linear Taylor expansion of the multilateral
resistance expression defined by Anderson and van Wincoop (2003), Baier and
Bergstrand (2009) express the multilateral resistance by using the GDP-share-weighted
average trade costs faced by the two trading partners relative to the GDP-share-weighted
average of those trade costs between all the other countries. The MR term is thus a linear
approximation of the MR between countries that allows capturing bilateral trade costs, such as
distance or border, between countries relative to those of the rest of the world. This allows us,
without introducing fixed effects, to identify the impact of each country-specific constraint on
trade.
The Multilateral resistance (MR) terms are calculated as follows:
))ln(var**())ln(var*())ln(var*(var_ k m
km
w
m
w
k
m
mj
w
m
k
ik
w
kij
Y
Y
Y
Y
Y
Y
Y
YMR
where:
varij denotes the bilateral trade cost variable (e.g. distance, common border)
Yw denotes global total GDP
Elasticities
In the OLS estimation, since the dependent variable is in a logarithm form (log y) the
coefficient (β) of variables measured in a logarithmic scale (log x) would give us the elasticity
values (as in a standard log-log model). For variables not in a logarithm form (usually ratios
and indices), the coefficient would represent a semi-elasticity (as in a standard log-level
model). To get the elasticity for these variables we simply multiply the coefficient for the
variable‘s average value only for the developing countries included in the regression).
In the Poisson model, the estimated coefficient measures the relative change in the
conditional mean of y (E[y|x]) induced by a unit change in the variable x. As in the OLS
model, if the variable x is measured in a logarithmic scale, the estimated coefficient is
interpreted as an elasticity; if the variable is not in a logarithm form, to get the elasticity we
simply multiply the coefficient for the variable‘s average value.
In both models, the elasticity for the dummy variable is calculated using the consistent
Kennedy (1981) formula:
βelast = 100 (exp(b - V(b)/2) - 1), where b is the estimated coefficient and V(b) its estimated
variance.
ESTIMATING THE CONSTRAINTS TO AGRICULTURAL TRADE OF DEVELOPING COUNTRIES – 73
OECD TRADE POLICY PAPER N°142 © OECD 2013
Robustness checks
We run a different set of robustness checks related to a range of ways to account for the
―multilateral resistance terms‖. First, following Baier and Bergstrand (2009), we restrict the
bilateral trade cost variables and the related multilateral resistance terms to have coefficients
of equal value and opposite signs. Second, following Behar, Manner and Nelson (2011) we
extend this approach to non-bilateral trade related costs such as TTRI, NTMRI and the
infrastructure quality index. Finally, we use a two-step approach. We start by accounting for
the ―multilateral resistance‖ by using exporter and importer fixed effects in a classical (non-
augmented) gravity model. The exporter fixed-effects estimated in this first stage are then used
as the dependent variable in a second regression which includes all key explanatory variables.
Results on the effects of supply-side constraints prove largely stable and consistent across
these specifications.
74 – ESTIMATING THE CONSTRAINTS TO AGRICULTURAL TRADE OF DEVELOPING COUNTRIES
OECD TRADE POLICY PAPER N°142 © OECD 2013
Annex 2.
Variables specification and data sources
Gravity variables: The gravity equation includes the following standard variables: the
geographic distance between the two trading partners, and binary variables accounting for the
existence of a common border, common language, the existence of colonial ties, whether the
countries share a common currency, as well as a binary variable that takes into account
whether the two countries are members of the same regional trade agreement. Distance is
weighted by population. The standard gravity variables are drawn from the Centre d'Etudes
Prospectives et d'Informations Internationales (CEPII)1 for the period 2002-06. The missing
observations up to 2007 are inputted from data available from the World Bank‘s World
Development Indicators (WDI) and publicly available command files for generating gravity
variables2.
Production and Expenditure data: Expenditure is proxied with data for the value of total
consumption of agricultural products. Data for exporter‘s production and importer‘s
consumption of agricultural products are from the FAO ResourceSTAT. We select Gross
Production Value (in current million USD) as a measure of production. Value of gross
production has been compiled by multiplying gross production in physical terms by output
prices at farm gate. Thus, value of production measures production in monetary terms at the
farm gate level. Since intermediate uses within the agricultural sector (seed and feed) have not
been subtracted from production data, this value of production aggregate refers to the notion of
"gross production". Consumption for each importer countries is computed by summing
production and total import and subtracting total exports. For comparable issues, also the
import and export data are form the FAO ResourceSTAT.
Tariff Trade Restrictiveness Index (TTRI): Trade policy is determined at product level and
not at a sectoral level. Simple tariff averages can lead to misleading conclusions (Kee, Nicita
and Olarreaga, 2009). Indeed, while African countries face the lowest levels of tariffs in their
export markets, notably thanks to preferences, these preferences largely cover products which
African countries do not export. We employ an index compiled by Kee, Nicita and
Olarreaga (2009) and used in Hoekman and Nicita (2011) for the agricultural sector. This
index controls for the impact of a country‘s own tariffs on its imports. It represents the
uniform tariff that, if applied, would leave a country‘s imports at their actual level. It is
compiled as the sum of a country‘s tariffs lines weighted by its import shares and demand
elasticities. Data used in the paper is based on Kee, Nicita and Olarreaga (2009) and Kee,
Neagu and Nicita (2010)3.
Non-tariff Measures Restrictiveness Index (NTMRI): The index of non-tariff
measures (NTM) restrictiveness is an aggregation of the tariff equivalents for NTMs for which
1. http://www.cepii.fr/anglaisgraph/bdd/gravity.asp
2. http://jdesousa.univ.free.fr/data
3.
http://econ.worldbank.org/WBSITE/EXTERNAL/EXTDEC/EXTRESEARCH/0,,contentMDK:22951240~
pagePK:64214825~piPK:64214943~theSitePK:469382,00.html
ESTIMATING THE CONSTRAINTS TO AGRICULTURAL TRADE OF DEVELOPING COUNTRIES – 75
OECD TRADE POLICY PAPER N°142 © OECD 2013
data was widely available: price and quantity control measures, technical regulations,
monopolistic measures such as single channel for imports, agricultural domestic support etc. It
is taken from Kee, Nicita and Olarreaga (2009), and it represents the difference between the
Overall Trade Restrictiveness Index (OTRI) and the TTRI as in Kee et al. (2009), Hoekman
and Nicita (2011). Data used in the paper is based on Kee, Nicita and Olarreaga (2009) and
Kee, Neagu and Nicita (2010).
The set of constraints
Agricultural Land: Agricultural land refers to the surface of land area that is arable, under
permanent crops, and under permanent pastures. The variable is expressed in sq km. Resource:
World Bank World Development Indicators 2011.
Fresh water availability: Renewable internal freshwater resources flows refer to internal
renewable resources (internal river flows and groundwater from rainfall) in the country. The
variable is expressed in cubic meters: World Bank World Development Indicators.
Fertiliser consumption (kg per ha of arable land): Fertiliser consumption measures the
quantity of plant nutrients used per unit of arable land. Fertiliser products cover nitrogenous,
potash, and phosphate fertilisers (including ground rock phosphate). Traditional nutrients-
animal and plant manures-are not included. For the purpose of data dissemination, FAO has
adopted the concept of a calendar year (January to December). Some countries compile
fertiliser data on a calendar year basis, while others are on a split-year basis: World Bank
World Development Indicators (background data from the FAO).
Infrastructure quality: Quality of trade and transport related infrastructure, including ports,
railroads, roads, information technology; 1 is the lowest score and 5 is the maximum score:
World Bank Logistics Performance Index.
Electricity consumption: Electric power consumption measures the production of power
plants and combined heat and power plants less transmission, distribution, and transformation
losses and own use by heat and power plants: World Bank World Development Indicators.
(Gross) School Enrolment in Primary (and Secondary) Education: Gross enrolment ratio
is the ratio of total enrolment, regardless of age, to the population of the age group that
officially corresponds to the level of education shown. Primary education provides children
with basic reading, writing, and mathematics skills along with an elementary understanding of
such subjects as history, geography, natural science, social science, art, and music. Secondary
education completes the provision of basic education that began at the primary level, and aims
at laying the foundations for lifelong learning and human development, by offering more
subject- or skill-oriented instruction using more specialised teachers: World Bank World
Development Indicators.
Political stability and absence of violence: Measures the perceptions of the likelihood that
the government will be destabilised or overthrown by unconstitutional or violent means,
including domestic violence and terrorism. The index is running from approximately -2.5 to
2.5, with higher values corresponding to a better score: World Bank World Governance
Indicators.
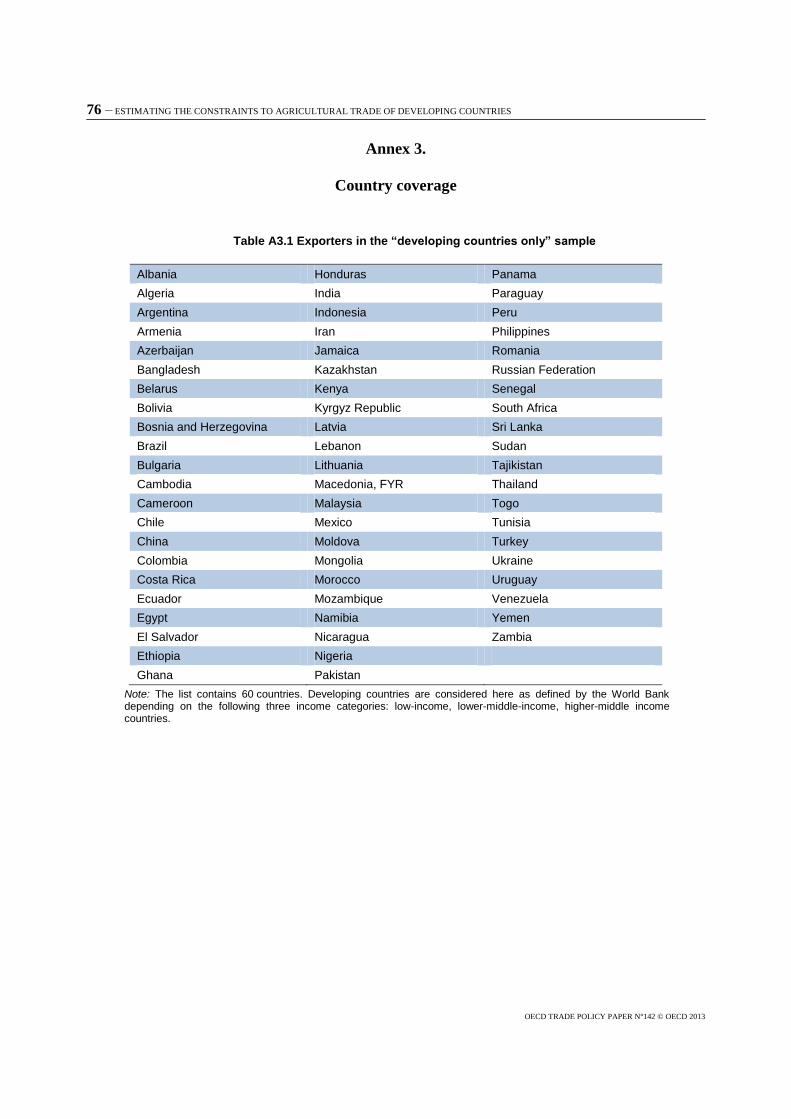
76 – ESTIMATING THE CONSTRAINTS TO AGRICULTURAL TRADE OF DEVELOPING COUNTRIES
OECD TRADE POLICY PAPER N°142 © OECD 2013
Annex 3.
Country coverage
Table A3.1 Exporters in the “developing countries only” sample
Albania Honduras Panama
Algeria India Paraguay
Argentina Indonesia Peru
Armenia Iran Philippines
Azerbaijan Jamaica Romania
Bangladesh Kazakhstan Russian Federation
Belarus Kenya Senegal
Bolivia Kyrgyz Republic South Africa
Bosnia and Herzegovina Latvia Sri Lanka
Brazil Lebanon Sudan
Bulgaria Lithuania Tajikistan
Cambodia Macedonia, FYR Thailand
Cameroon Malaysia Togo
Chile Mexico Tunisia
China Moldova Turkey
Colombia Mongolia Ukraine
Costa Rica Morocco Uruguay
Ecuador Mozambique Venezuela
Egypt Namibia Yemen
El Salvador Nicaragua Zambia
Ethiopia Nigeria
Ghana Pakistan
Note: The list contains 60 countries. Developing countries are considered here as defined by the World Bank depending on the following three income categories: low-income, lower-middle-income, higher-middle income countries.
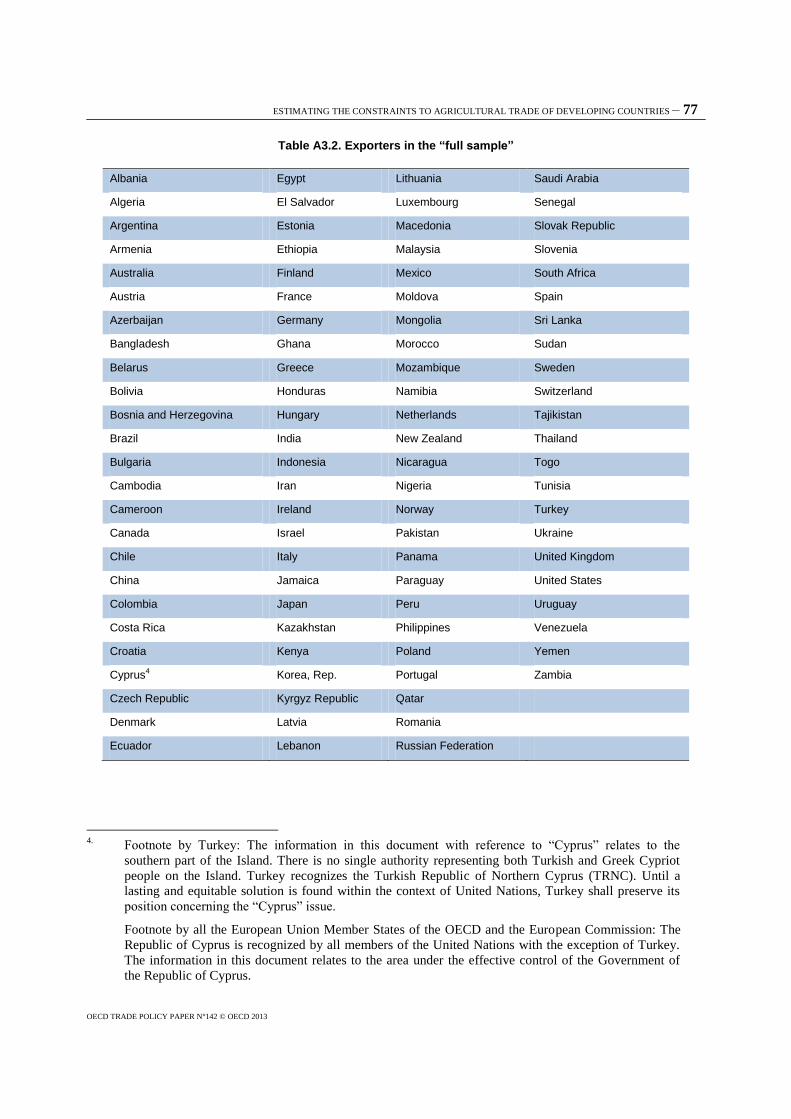
ESTIMATING THE CONSTRAINTS TO AGRICULTURAL TRADE OF DEVELOPING COUNTRIES – 77
OECD TRADE POLICY PAPER N°142 © OECD 2013
Table A3.2. Exporters in the “full sample”
Albania Egypt Lithuania Saudi Arabia
Algeria El Salvador Luxembourg Senegal
Argentina Estonia Macedonia Slovak Republic
Armenia Ethiopia Malaysia Slovenia
Australia Finland Mexico South Africa
Austria France Moldova Spain
Azerbaijan Germany Mongolia Sri Lanka
Bangladesh Ghana Morocco Sudan
Belarus Greece Mozambique Sweden
Bolivia Honduras Namibia Switzerland
Bosnia and Herzegovina Hungary Netherlands Tajikistan
Brazil India New Zealand Thailand
Bulgaria Indonesia Nicaragua Togo
Cambodia Iran Nigeria Tunisia
Cameroon Ireland Norway Turkey
Canada Israel Pakistan Ukraine
Chile Italy Panama United Kingdom
China Jamaica Paraguay United States
Colombia Japan Peru Uruguay
Costa Rica Kazakhstan Philippines Venezuela
Croatia Kenya Poland Yemen
Cyprus4 Korea, Rep. Portugal Zambia
Czech Republic Kyrgyz Republic Qatar
Denmark Latvia Romania
Ecuador Lebanon Russian Federation
4.
Footnote by Turkey: The information in this document with reference to ―Cyprus‖ relates to the
southern part of the Island. There is no single authority representing both Turkish and Greek Cypriot
people on the Island. Turkey recognizes the Turkish Republic of Northern Cyprus (TRNC). Until a
lasting and equitable solution is found within the context of United Nations, Turkey shall preserve its
position concerning the ―Cyprus‖ issue.
Footnote by all the European Union Member States of the OECD and the European Commission: The
Republic of Cyprus is recognized by all members of the United Nations with the exception of Turkey.
The information in this document relates to the area under the effective control of the Government of
the Republic of Cyprus.
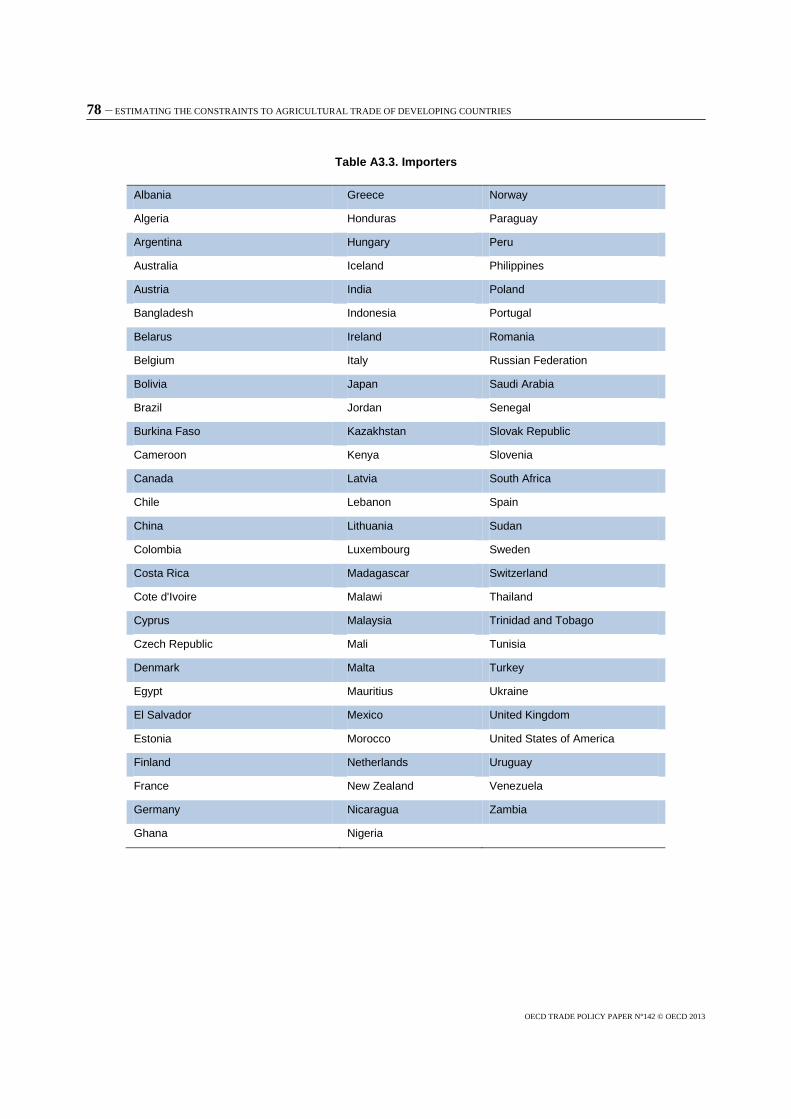
78 – ESTIMATING THE CONSTRAINTS TO AGRICULTURAL TRADE OF DEVELOPING COUNTRIES
OECD TRADE POLICY PAPER N°142 © OECD 2013
Table A3.3. Importers
Albania Greece Norway
Algeria Honduras Paraguay
Argentina Hungary Peru
Australia Iceland Philippines
Austria India Poland
Bangladesh Indonesia Portugal
Belarus Ireland Romania
Belgium Italy Russian Federation
Bolivia Japan Saudi Arabia
Brazil Jordan Senegal
Burkina Faso Kazakhstan Slovak Republic
Cameroon Kenya Slovenia
Canada Latvia South Africa
Chile Lebanon Spain
China Lithuania Sudan
Colombia Luxembourg Sweden
Costa Rica Madagascar Switzerland
Cote d'Ivoire Malawi Thailand
Cyprus Malaysia Trinidad and Tobago
Czech Republic Mali Tunisia
Denmark Malta Turkey
Egypt Mauritius Ukraine
El Salvador Mexico United Kingdom
Estonia Morocco United States of America
Finland Netherlands Uruguay
France New Zealand Venezuela
Germany Nicaragua Zambia
Ghana Nigeria
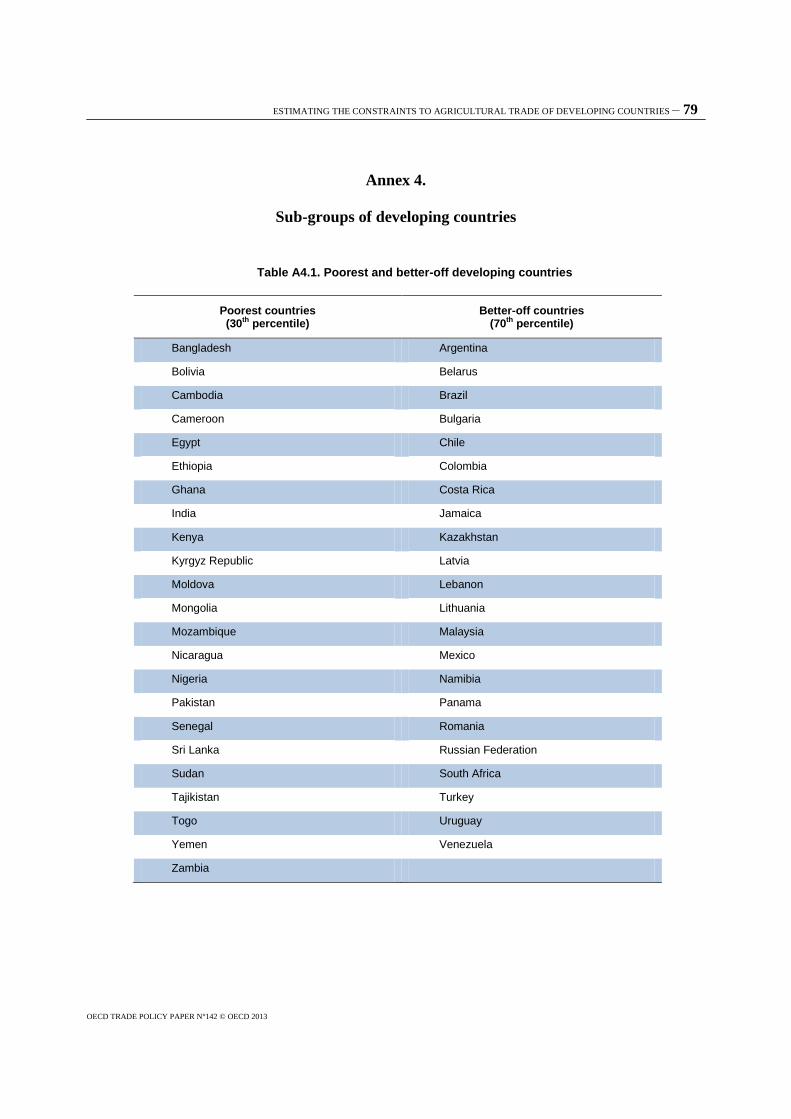
ESTIMATING THE CONSTRAINTS TO AGRICULTURAL TRADE OF DEVELOPING COUNTRIES – 79
OECD TRADE POLICY PAPER N°142 © OECD 2013
Annex 4.
Sub-groups of developing countries
Table A4.1. Poorest and better-off developing countries
Poorest countries (30th percentile)
Better-off countries (70th percentile)
Bangladesh Argentina
Bolivia Belarus
Cambodia Brazil
Cameroon Bulgaria
Egypt Chile
Ethiopia Colombia
Ghana Costa Rica
India Jamaica
Kenya Kazakhstan
Kyrgyz Republic Latvia
Moldova Lebanon
Mongolia Lithuania
Mozambique Malaysia
Nicaragua Mexico
Nigeria Namibia
Pakistan Panama
Senegal Romania
Sri Lanka Russian Federation
Sudan South Africa
Tajikistan Turkey
Togo Uruguay
Yemen Venezuela
Zambia
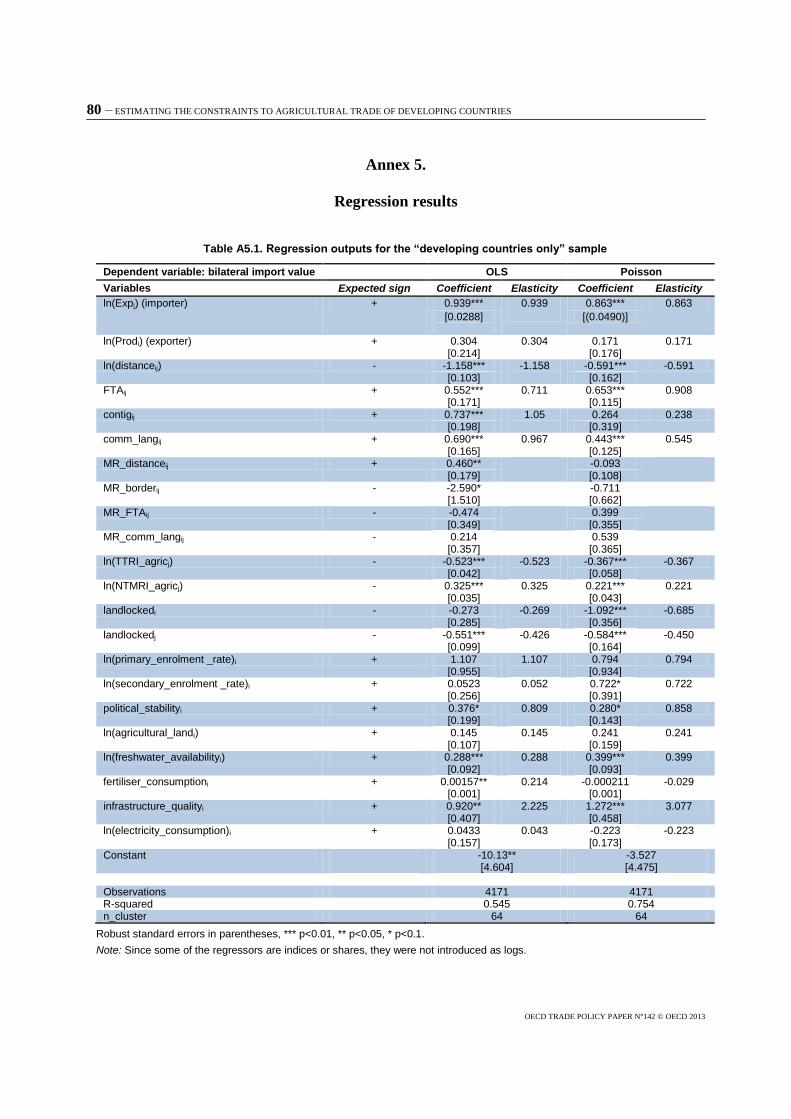
80 – ESTIMATING THE CONSTRAINTS TO AGRICULTURAL TRADE OF DEVELOPING COUNTRIES
OECD TRADE POLICY PAPER N°142 © OECD 2013
Annex 5.
Regression results
Table A5.1. Regression outputs for the “developing countries only” sample
Dependent variable: bilateral import value OLS Poisson
Variables Expected sign Coefficient Elasticity Coefficient Elasticity
ln(Expj) (importer) + 0.939*** 0.939
0.863*** 0.863
[0.0288]
[(0.0490)]
ln(Prodi) (exporter) + 0.304 0.304
0.171 0.171 [0.214] [0.176]
ln(distanceij) - -1.158*** -1.158
-0.591*** -0.591 [0.103] [0.162]
FTAij + 0.552*** 0.711
0.653*** 0.908 [0.171] [0.115]
contigij + 0.737*** 1.05
0.264 0.238 [0.198] [0.319]
comm_langij + 0.690*** 0.967
0.443*** 0.545 [0.165] [0.125]
MR_distanceij + 0.460** -0.093 [0.179] [0.108]
MR_borderij - -2.590* -0.711 [1.510] [0.662]
MR_FTAij - -0.474 0.399 [0.349] [0.355]
MR_comm_langij - 0.214 0.539 [0.357] [0.365]
ln(TTRI_agricj) - -0.523*** -0.523
-0.367*** -0.367 [0.042] [0.058]
ln(NTMRI_agricj) - 0.325*** 0.325
0.221*** 0.221 [0.035] [0.043]
landlockedi - -0.273 -0.269
-1.092*** -0.685 [0.285] [0.356]
landlockedj - -0.551*** -0.426
-0.584*** -0.450 [0.099] [0.164]
ln(primary_enrolment _rate)i + 1.107 1.107
0.794 0.794 [0.955] [0.934]
ln(secondary_enrolment _rate)i + 0.0523 0.052
0.722* 0.722 [0.256] [0.391]
political_stabilityi + 0.376* 0.809
0.280* 0.858 [0.199] [0.143]
ln(agricultural_landi) + 0.145 0.145
0.241 0.241 [0.107] [0.159]
ln(freshwater_availabilityi) + 0.288*** 0.288
0.399*** 0.399 [0.092] [0.093]
fertiliser_consumptioni + 0.00157** 0.214
-0.000211 -0.029 [0.001] [0.001]
infrastructure_qualityi + 0.920** 2.225 1.272*** 3.077 [0.407] [0.458]
ln(electricity_consumption)i + 0.0433 0.043
-0.223 -0.223 [0.157] [0.173]
Constant -10.13** -3.527 [4.604] [4.475]
Observations 4171 4171 R-squared 0.545 0.754 n_cluster 64 64
Robust standard errors in parentheses, *** p<0.01, ** p<0.05, * p<0.1.
Note: Since some of the regressors are indices or shares, they were not introduced as logs.
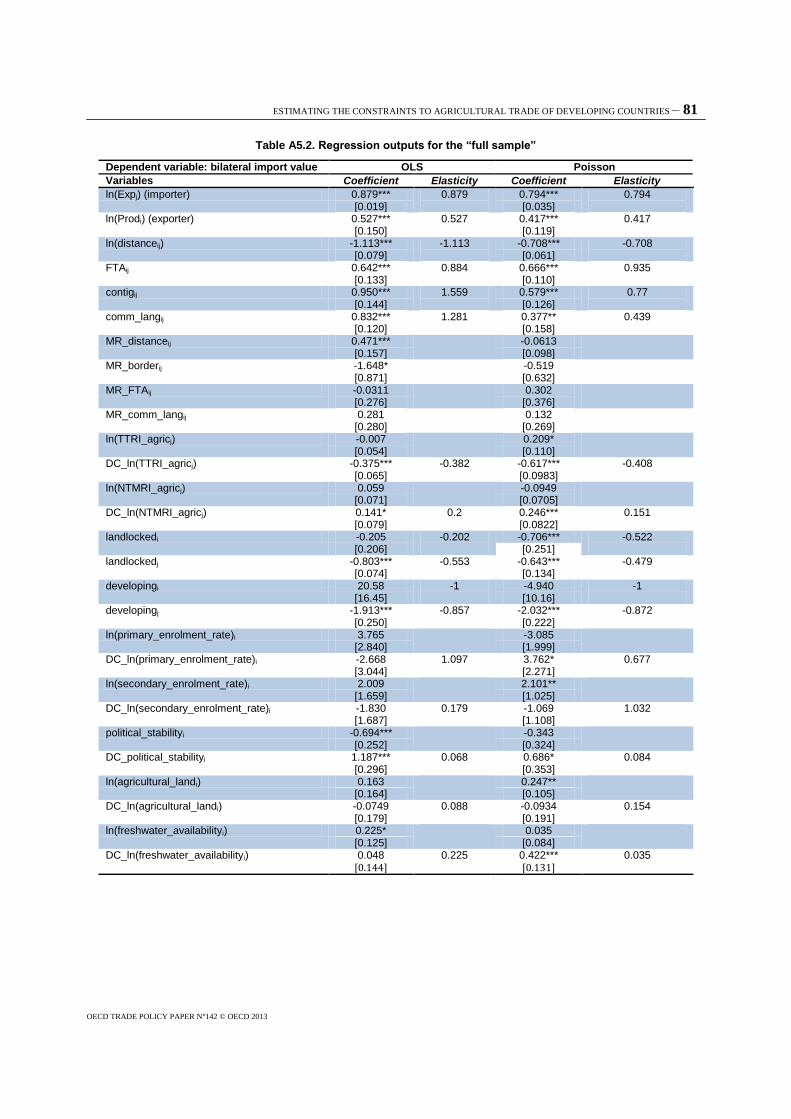
ESTIMATING THE CONSTRAINTS TO AGRICULTURAL TRADE OF DEVELOPING COUNTRIES – 81
OECD TRADE POLICY PAPER N°142 © OECD 2013
Table A5.2. Regression outputs for the “full sample”
Dependent variable: bilateral import value OLS Poisson
Variables Coefficient Elasticity Coefficient Elasticity
ln(Expj) (importer) 0.879*** 0.879
0.794*** 0.794 [0.019] [0.035]
ln(Prodi) (exporter) 0.527*** 0.527
0.417*** 0.417 [0.150] [0.119]
ln(distanceij) -1.113*** -1.113
-0.708*** -0.708 [0.079] [0.061]
FTAij 0.642*** 0.884
0.666*** 0.935 [0.133] [0.110]
contigij 0.950*** 1.559
0.579*** 0.77 [0.144] [0.126]
comm_langij 0.832*** 1.281
0.377** 0.439 [0.120] [0.158]
MR_distanceij 0.471*** -0.0613 [0.157] [0.098]
MR_borderij -1.648* -0.519 [0.871] [0.632]
MR_FTAij -0.0311 0.302 [0.276] [0.376]
MR_comm_langij 0.281 0.132 [0.280] [0.269]
ln(TTRI_agricj) -0.007 0.209* [0.054] [0.110]
DC_ln(TTRI_agricj) -0.375*** -0.382 -0.617*** -0.408 [0.065] [0.0983]
ln(NTMRI_agricj) 0.059 -0.0949 [0.071] [0.0705]
DC_ln(NTMRI_agricj) 0.141* 0.2
0.246*** 0.151 [0.079] [0.0822]
landlockedi -0.205 -0.202
-0.706*** -0.522 [0.206] [0.251]
landlockedj -0.803*** -0.553 -0.643*** -0.479 [0.074] [0.134]
developingi 20.58 -1
-4.940 -1 [16.45] [10.16]
developingj -1.913*** -0.857
-2.032*** -0.872 [0.250] [0.222]
ln(primary_enrolment_rate)i 3.765 -3.085 [2.840] [1.999]
DC_ln(primary_enrolment_rate)i -2.668 1.097
3.762* 0.677 [3.044] [2.271]
ln(secondary_enrolment_rate)i 2.009 2.101** [1.659] [1.025]
DC_ln(secondary_enrolment_rate)i -1.830 0.179
-1.069 1.032 [1.687] [1.108]
political_stabilityi -0.694*** -0.343 [0.252] [0.324]
DC_political_stabilityi 1.187*** 0.068 0.686* 0.084 [0.296] [0.353]
ln(agricultural_landi) 0.163 0.247** [0.164] [0.105]
DC_ln(agricultural_landi) -0.0749 0.088
-0.0934 0.154 [0.179] [0.191]
ln(freshwater_availabilityi) 0.225* 0.035 [0.125] [0.084]
DC_ln(freshwater_availabilityi) 0.048 0.225
0.422*** 0.035 [0.144] [0.131]
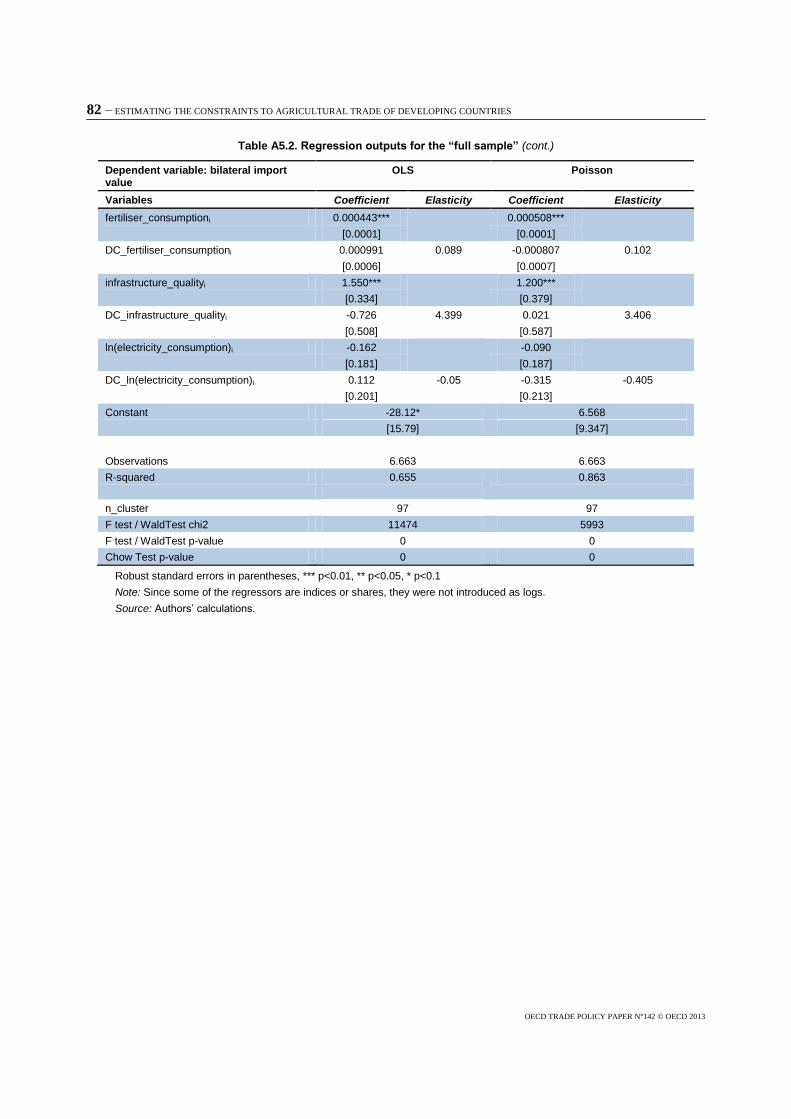
82 – ESTIMATING THE CONSTRAINTS TO AGRICULTURAL TRADE OF DEVELOPING COUNTRIES
OECD TRADE POLICY PAPER N°142 © OECD 2013
Table A5.2. Regression outputs for the “full sample” (cont.)
Dependent variable: bilateral import value
OLS Poisson
Variables Coefficient Elasticity Coefficient Elasticity
fertiliser_consumptioni 0.000443*** 0.000508***
[0.0001] [0.0001]
DC_fertiliser_consumptioni 0.000991 0.089 -0.000807 0.102
[0.0006] [0.0007]
infrastructure_qualityi 1.550*** 1.200***
[0.334] [0.379]
DC_infrastructure_qualityi -0.726 4.399 0.021 3.406
[0.508] [0.587]
ln(electricity_consumption)i -0.162 -0.090
[0.181] [0.187]
DC_ln(electricity_consumption)i 0.112 -0.05
-0.315 -0.405
[0.201] [0.213]
Constant -28.12* 6.568
[15.79] [9.347]
Observations 6.663 6.663
R-squared 0.655
0.863
n_cluster 97 97
F test / WaldTest chi2 11474 5993
F test / WaldTest p-value 0 0
Chow Test p-value 0 0
Robust standard errors in parentheses, *** p<0.01, ** p<0.05, * p<0.1
Note: Since some of the regressors are indices or shares, they were not introduced as logs.
Source: Authors’ calculations.
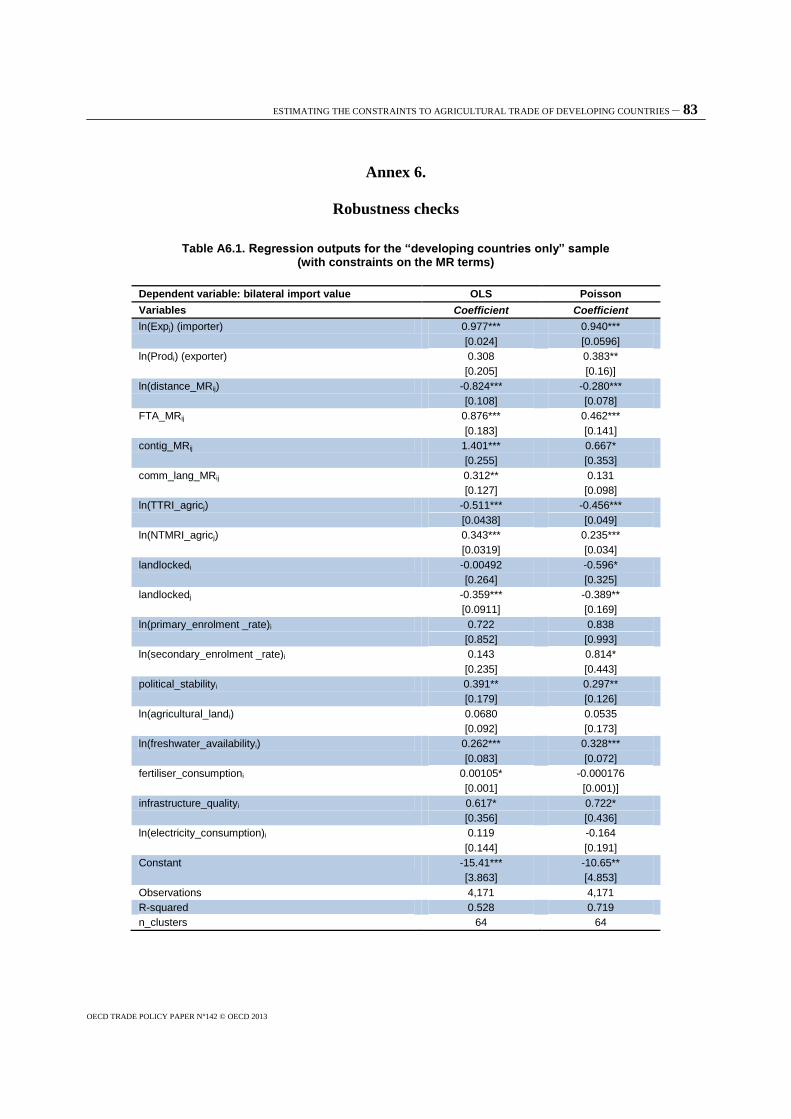
ESTIMATING THE CONSTRAINTS TO AGRICULTURAL TRADE OF DEVELOPING COUNTRIES – 83
OECD TRADE POLICY PAPER N°142 © OECD 2013
Annex 6.
Robustness checks
Table A6.1. Regression outputs for the “developing countries only” sample (with constraints on the MR terms)
Dependent variable: bilateral import value OLS Poisson
Variables Coefficient Coefficient
ln(Expj) (importer) 0.977*** 0.940***
[0.024] [0.0596]
ln(Prodi) (exporter) 0.308 0.383**
[0.205] [0.16)]
ln(distance_MRij) -0.824*** -0.280***
[0.108] [0.078]
FTA_MRij 0.876*** 0.462***
[0.183] [0.141]
contig_MRij 1.401*** 0.667*
[0.255] [0.353]
comm_lang_MRij 0.312** 0.131
[0.127] [0.098]
ln(TTRI_agricj) -0.511*** -0.456***
[0.0438] [0.049]
ln(NTMRI_agricj) 0.343*** 0.235***
[0.0319] [0.034]
landlockedi -0.00492 -0.596*
[0.264] [0.325]
landlockedj -0.359*** -0.389**
[0.0911] [0.169]
ln(primary_enrolment _rate)i 0.722 0.838
[0.852] [0.993]
ln(secondary_enrolment _rate)i 0.143 0.814*
[0.235] [0.443]
political_stabilityi 0.391** 0.297**
[0.179] [0.126]
ln(agricultural_landi) 0.0680 0.0535
[0.092] [0.173]
ln(freshwater_availabilityi) 0.262*** 0.328***
[0.083] [0.072]
fertiliser_consumptioni 0.00105* -0.000176
[0.001] [0.001)]
infrastructure_qualityi 0.617* 0.722*
[0.356] [0.436]
ln(electricity_consumption)i 0.119 -0.164
[0.144] [0.191]
Constant -15.41*** -10.65**
[3.863] [4.853]
Observations 4,171 4,171
R-squared 0.528 0.719
n_clusters 64 64
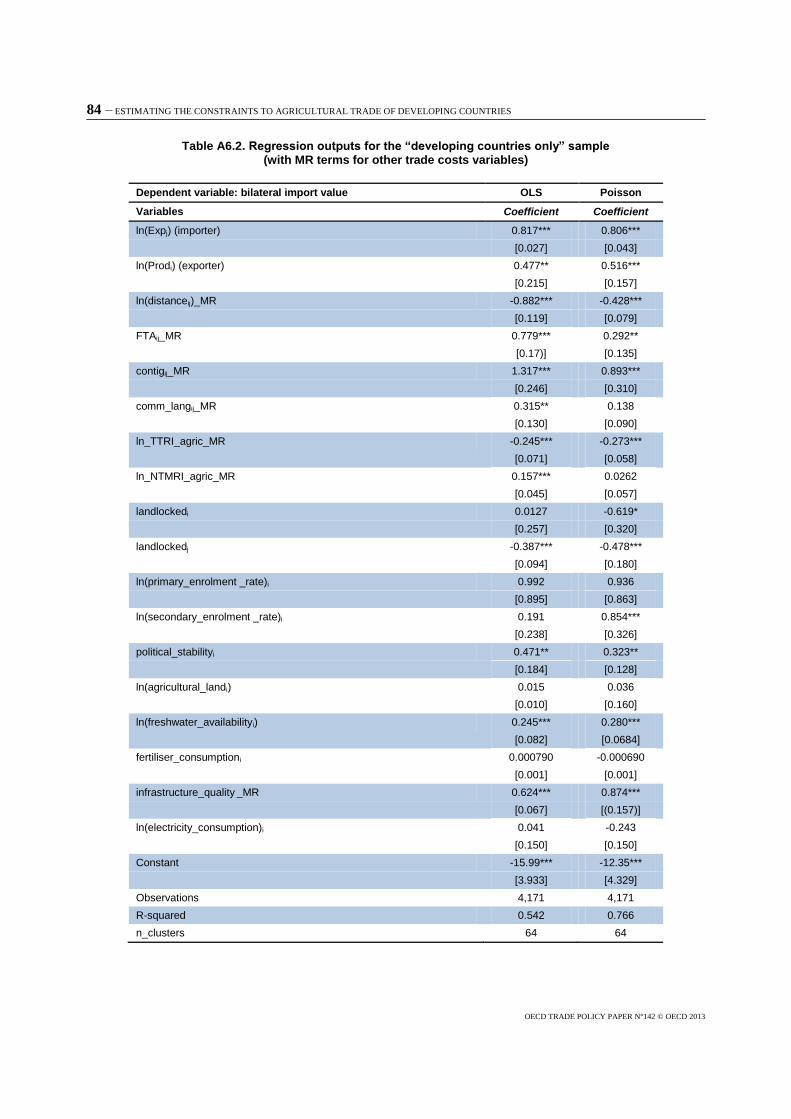
84 – ESTIMATING THE CONSTRAINTS TO AGRICULTURAL TRADE OF DEVELOPING COUNTRIES
OECD TRADE POLICY PAPER N°142 © OECD 2013
Table A6.2. Regression outputs for the “developing countries only” sample (with MR terms for other trade costs variables)
Dependent variable: bilateral import value OLS Poisson
Variables Coefficient Coefficient
ln(Expj) (importer) 0.817*** 0.806***
[0.027] [0.043]
ln(Prodi) (exporter) 0.477** 0.516***
[0.215] [0.157]
ln(distanceij)_MR -0.882*** -0.428***
[0.119] [0.079]
FTAij_MR 0.779*** 0.292**
[0.17)] [0.135]
contigij_MR 1.317*** 0.893***
[0.246] [0.310]
comm_langij_MR 0.315** 0.138
[0.130] [0.090]
ln_TTRI_agric_MR -0.245*** -0.273***
[0.071] [0.058]
ln_NTMRI_agric_MR 0.157*** 0.0262
[0.045] [0.057]
landlockedi 0.0127 -0.619*
[0.257] [0.320]
landlockedj -0.387*** -0.478***
[0.094] [0.180]
ln(primary_enrolment _rate)i 0.992 0.936
[0.895] [0.863]
ln(secondary_enrolment _rate)i 0.191 0.854***
[0.238] [0.326]
political_stabilityi 0.471** 0.323**
[0.184] [0.128]
ln(agricultural_landi) 0.015 0.036
[0.010] [0.160]
ln(freshwater_availabilityi) 0.245*** 0.280***
[0.082] [0.0684]
fertiliser_consumptioni 0.000790 -0.000690
[0.001] [0.001]
infrastructure_quality _MR 0.624*** 0.874***
[0.067] [(0.157)]
ln(electricity_consumption)i 0.041 -0.243
[0.150] [0.150]
Constant -15.99*** -12.35***
[3.933] [4.329]
Observations 4,171 4,171
R-squared 0.542 0.766
n_clusters 64 64
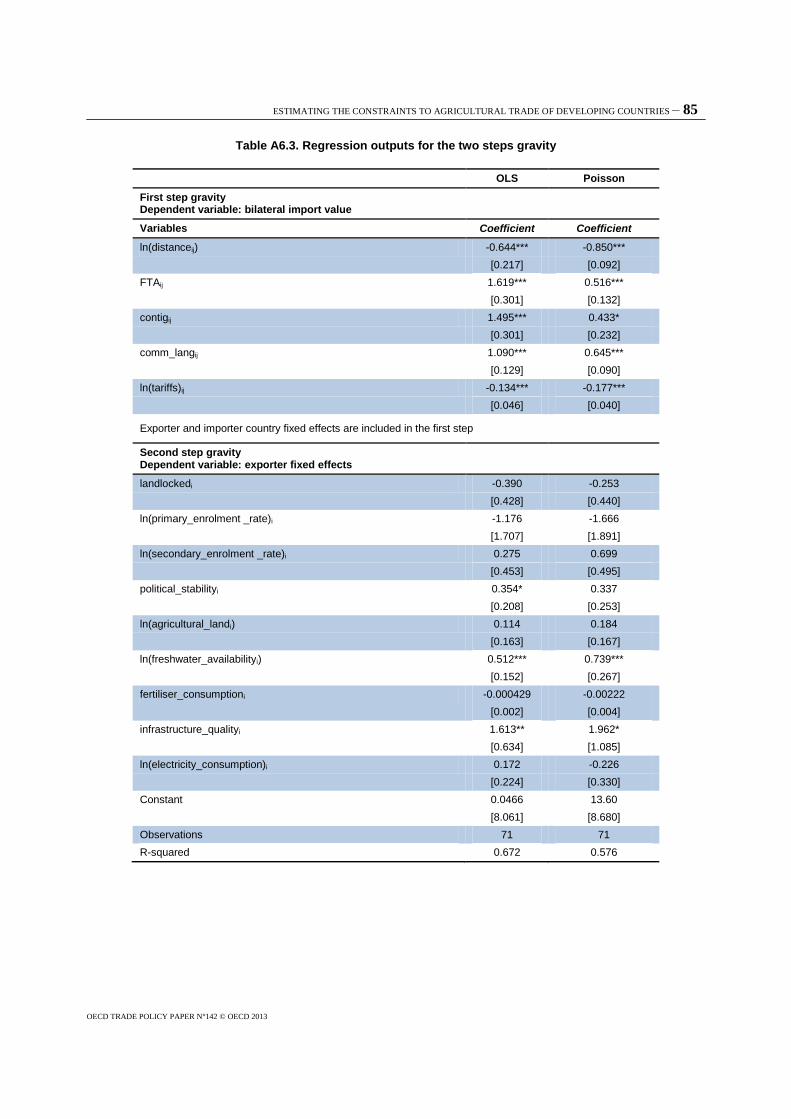
ESTIMATING THE CONSTRAINTS TO AGRICULTURAL TRADE OF DEVELOPING COUNTRIES – 85
OECD TRADE POLICY PAPER N°142 © OECD 2013
Table A6.3. Regression outputs for the two steps gravity
OLS Poisson
First step gravity Dependent variable: bilateral import value
Variables Coefficient Coefficient
ln(distanceij) -0.644*** -0.850***
[0.217] [0.092]
FTAij 1.619*** 0.516***
[0.301] [0.132]
contigij 1.495*** 0.433*
[0.301] [0.232]
comm_langij 1.090*** 0.645***
[0.129] [0.090]
ln(tariffs)ij -0.134*** -0.177***
[0.046] [0.040]
Exporter and importer country fixed effects are included in the first step
Second step gravity Dependent variable: exporter fixed effects
landlockedi -0.390 -0.253
[0.428] [0.440]
ln(primary_enrolment _rate)i -1.176 -1.666
[1.707] [1.891]
ln(secondary_enrolment _rate)i 0.275 0.699
[0.453] [0.495]
political_stabilityi 0.354* 0.337
[0.208] [0.253]
ln(agricultural_landi) 0.114 0.184
[0.163] [0.167]
ln(freshwater_availabilityi) 0.512*** 0.739***
[0.152] [0.267]
fertiliser_consumptioni -0.000429 -0.00222
[0.002] [0.004]
infrastructure_qualityi 1.613** 1.962*
[0.634] [1.085]
ln(electricity_consumption)i 0.172 -0.226
[0.224] [0.330]
Constant 0.0466 13.60
[8.061] [8.680]
Observations 71 71
R-squared 0.672 0.576