Embed Size (px)
Citation preview

Estimating Effort and Cost in Software Projects
− ISBSG A Multi-Organizational Project Data Repository for Project Estimation
And Benchmarking
IEEE Computer Society Western Canada Speaking Tour
October 2009
Pierre Bourque, ing., Ph.D. École de technologie supérieure
Montreal, Canada
2
Ice Bag
ISBSG

3
Large sculpture recently exhibited at the Guggenheim Museum in Manhattan
artsearch.nga.gov.au/Detail-LRG.cfm?IRN=37808&View=LRG
4
About ÉTS
• One of Canada’s leading schools of Engineering • ÉTS motto is ‘Engineering for Industry’. • Roughly 5000 students, 125 professors, 25 internal senior
lecturers and approximately 200 external lecturers.
• In 2005 only students completed about 2400 paid industrial internships in over 900 companies.
• A member of the Université du Québec network of establishments.
• Located in downtown Montreal, Canada
5
Agenda • Principles of Credible Estimation • Overview of Software Functional Sizing and
COSMIC • Overview of ISBSG • Overview of the Repository • An example of using ISBSG for Duration
Estimation • Example of a reality-check using ISBSG • Southern Scope • Conclusion
6
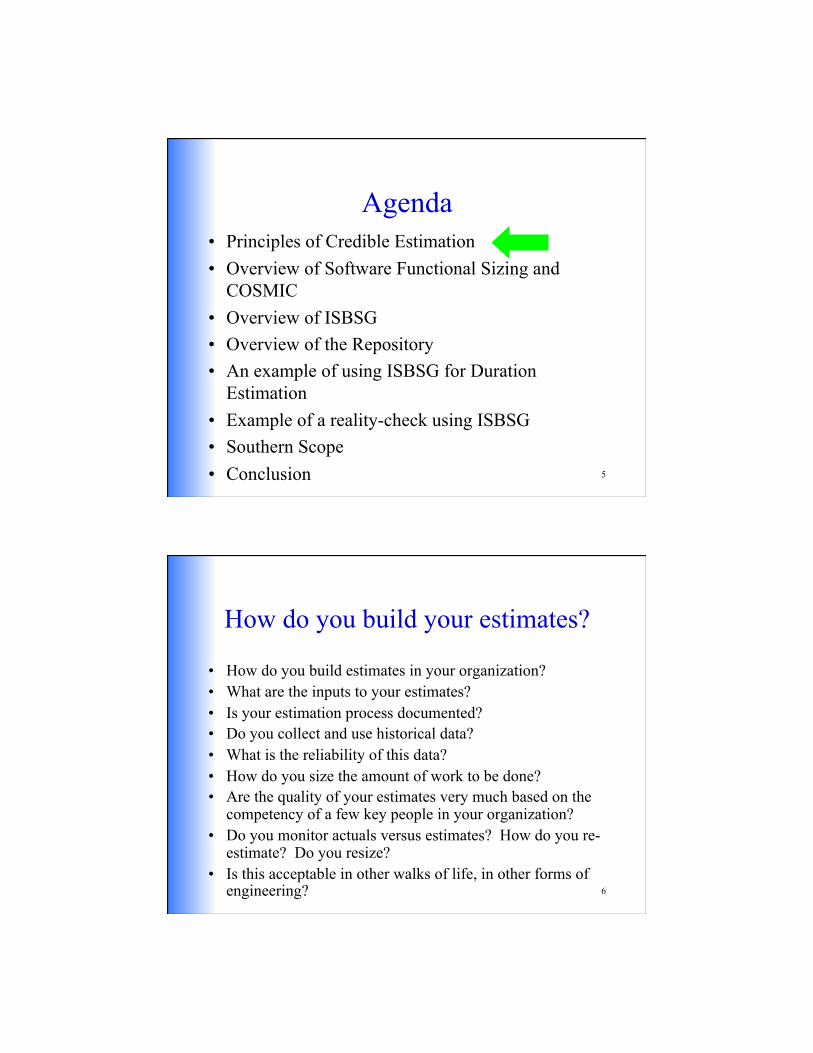
How do you build your estimates?
• How do you build estimates in your organization? • What are the inputs to your estimates? • Is your estimation process documented? • Do you collect and use historical data? • What is the reliability of this data? • How do you size the amount of work to be done? • Are the quality of your estimates very much based on the
competency of a few key people in your organization? • Do you monitor actuals versus estimates? How do you re-
estimate? Do you resize? • Is this acceptable in other walks of life, in other forms of
engineering?

7
Mixed PUBLISHED Results for Software Cost Models...
• Panoply of software cost models • Several studies have been conducted to
assess the accuracy of these models on various databases
• However, no study has proven the superiority of any models excepted for limited applications
• Often small data samples
8
Underlying Principles of CREDIBLE Estimation - 1
As defined in Park et al. (94): « Estimates are made by people, not
by models. They require reasoned judgments and commitments to
organizational goals that CANNOT be delegated to any AUTOMATED
process ».

9
Underlying Principles of CREDIBLE Estimation-2
« All estimates are based on COMPARISONS. When people
estimate, they evaluate how something is like, and how
something is unlike, things that they or others have seen before ».
10
Underlying Principles of CREDIBLE Estimation-3

11
These Principles Imply:
• To be CREDIBLE, an estimation process must inherently be WHITE-BOX.
• Software project estimation which has been plaguing the industry for years can only be solved through a COOPERATIVE DATA COLLECTION EFFORT.
• Much research still has to be done.
12
Agenda
• Principles of Credible Estimation • Overview of Software Functional Sizing and COSMIC • Overview of ISBSG • Overview of the Repository • An example of using ISBSG for Duration Estimation • Example of a reality-check using ISBSG • Southern Scope • Conclusion
13
Acknowledgements
Many thanks to my colleague Alain Abran, Ph.D., Full Professor at École de technologie supérieure, for kindly providing the slides in this section.
14

16
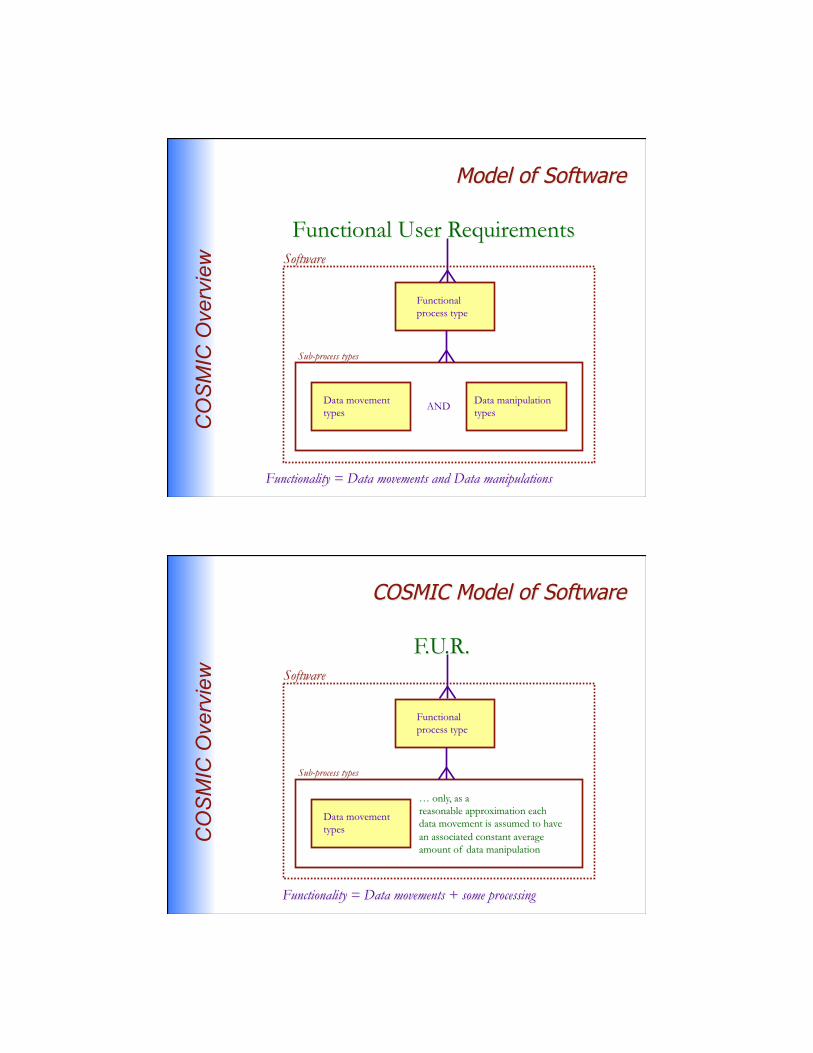
Software Functionality
Software Functionality

Includes: data transfer (ex: Input customer data; Send control signal) data transformation (ex: Calculate bank interest; Derive
average temperature) data storage (ex: Store customer order; Record temperature
over time) data retrieval (ex: List current employees; Retrieve latest
aircraft position) Excludes: quality constraints (ex: usability, reliability, efficiency and
portability) organizational constraints (ex: locations for operation, target
hardware & compliance to standards) environmental constraints (ex: interoperability, security, privacy
and safety) implementation constraints (ex: development language, delivery
schedule)
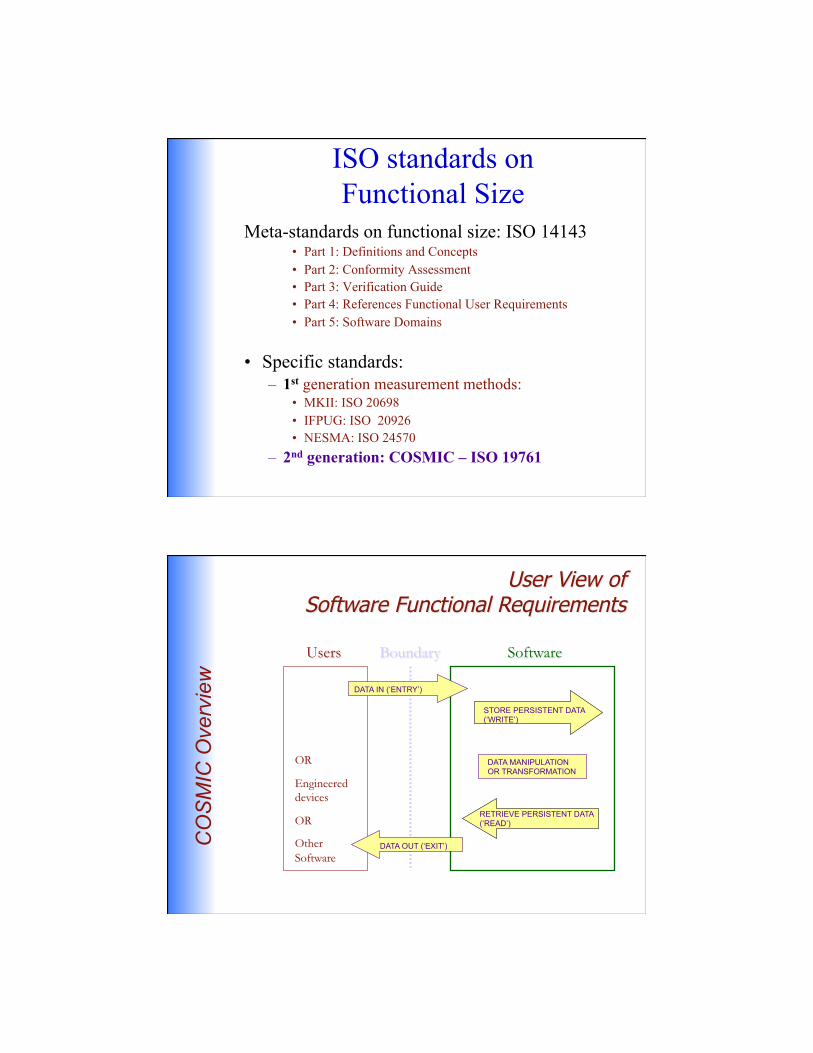
ISO standards on Functional Size
Meta-standards on functional size: ISO 14143 • Part 1: Definitions and Concepts • Part 2: Conformity Assessment • Part 3: Verification Guide • Part 4: References Functional User Requirements • Part 5: Software Domains
• Specific standards: – 1st generation measurement methods:
• MKII: ISO 20698 • IFPUG: ISO 20926 • NESMA: ISO 24570
– 2nd generation: COSMIC – ISO 19761
DATA MANIPULATION OR TRANSFORMATION
DATA IN (‘ENTRY’)
DATA OUT (‘EXIT’) CO
SM
IC O
verv
iew
STORE PERSISTENT DATA (‘WRITE’)
RETRIEVE PERSISTENT DATA (‘READ’)
CO
SM
IC O
verv
iew
CO
SM
IC O
verv
iew

28
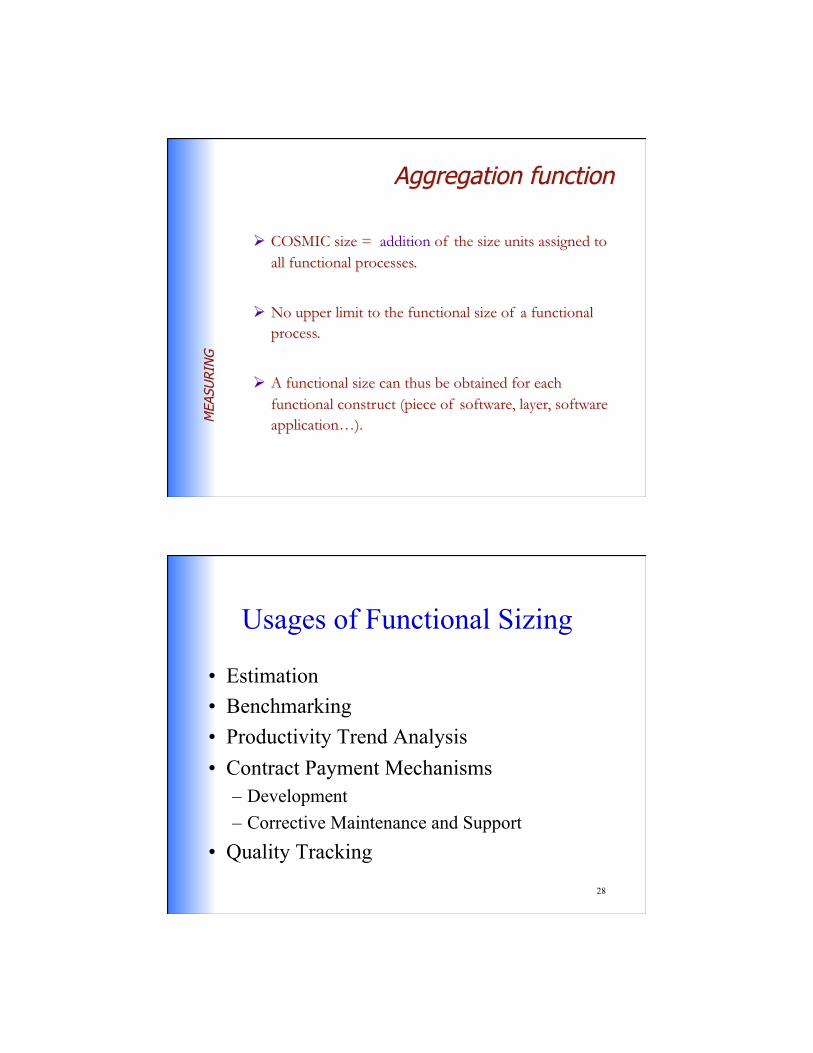
Usages of Functional Sizing
• Estimation • Benchmarking • Productivity Trend Analysis • Contract Payment Mechanisms
– Development – Corrective Maintenance and Support
• Quality Tracking

29
Agenda
• Principles of Credible Estimation • Overview of Software Functional Sizing and COSMIC • Overview of ISBSG • Overview of the Repository • An example of using ISBSG for Duration Estimation • Example of a reality-check using ISBSG • Southern Scope • Conclusion
30
ISBSG Mission
• “To help improve the management of IT resources, by both business and government, through the provision and exploitation of a public repositories of software engineering knowledge which are standardized, verified, recent and representative of current technologies.”
31
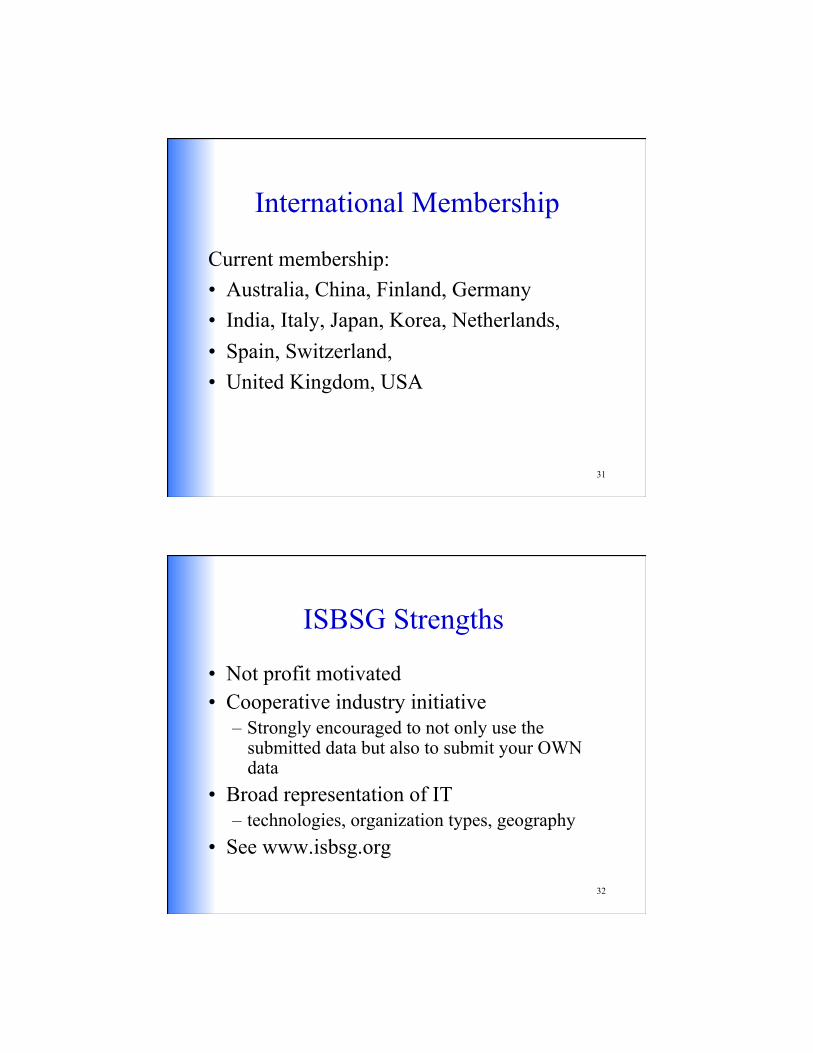
International Membership
Current membership: • Australia, China, Finland, Germany • India, Italy, Japan, Korea, Netherlands, • Spain, Switzerland, • United Kingdom, USA
32
ISBSG Strengths
• Not profit motivated • Cooperative industry initiative
– Strongly encouraged to not only use the submitted data but also to submit your OWN data
• Broad representation of IT – technologies, organization types, geography
• See www.isbsg.org

33
Agenda
• Principles of Credible Estimation • Overview of Software Functional Sizing and COSMIC • Overview of ISBSG • Overview of the Repository • An example of using ISBSG for Duration Estimation • Example of a reality-check using ISBSG • Southern Scope • Conclusion
34
R11 Demographics
• Made available in June 2009 • Over 5000 projects • 70% of the projects being less than 9 years
old • Projects have been submitted from 24
countries • Projects were “built” in 29 different
countries
35
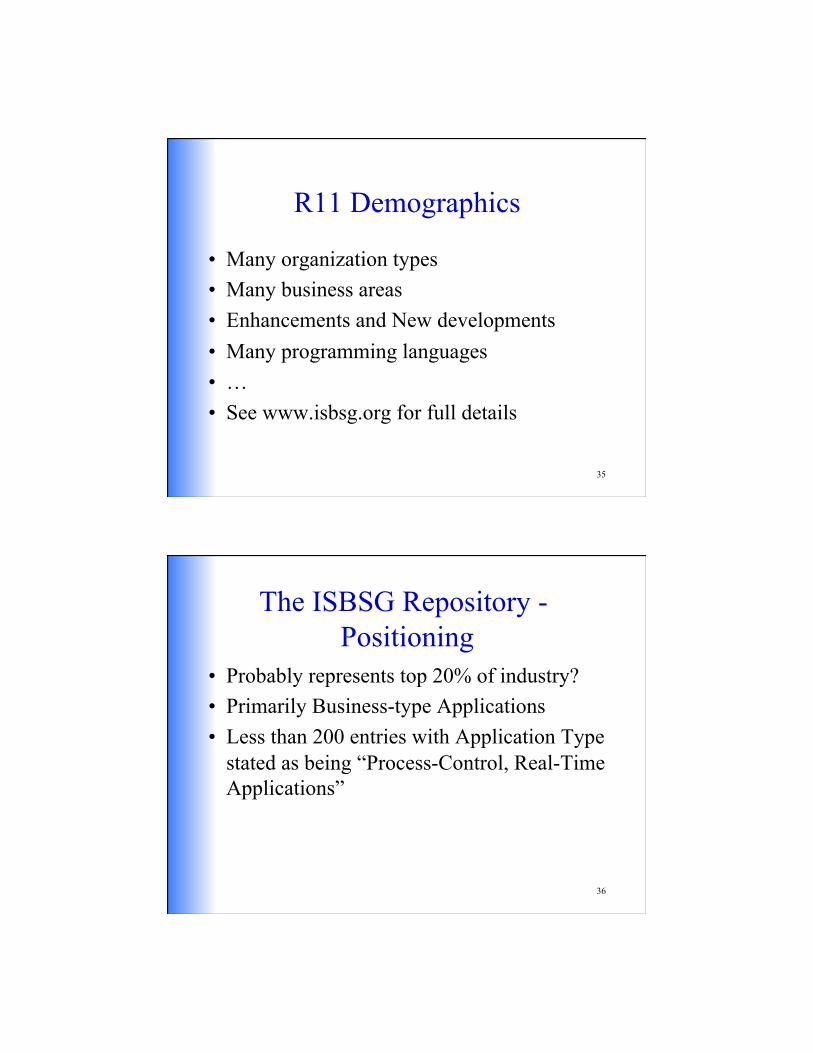
R11 Demographics
• Many organization types • Many business areas • Enhancements and New developments • Many programming languages • … • See www.isbsg.org for full details
36
The ISBSG Repository - Positioning
• Probably represents top 20% of industry? • Primarily Business-type Applications • Less than 200 entries with Application Type
stated as being “Process-Control, Real-Time Applications”
37
Agenda
• Principles of Credible Estimation • Overview of Software Functional Sizing and COSMIC • Overview of ISBSG • Overview of the Repository • An example of using ISBSG for Duration Estimation • Example of a reality-check using ISBSG • Southern Scope • Conclusion
38
Strategic Importance of Time-to-Market
• Project manager’s dream: – Complete and stable product requirements – High quality – Low costs – Short time-to-market
• Time to market or project duration is often the hardest one to pin down
• A variation of the other three have a determining effect on it
39
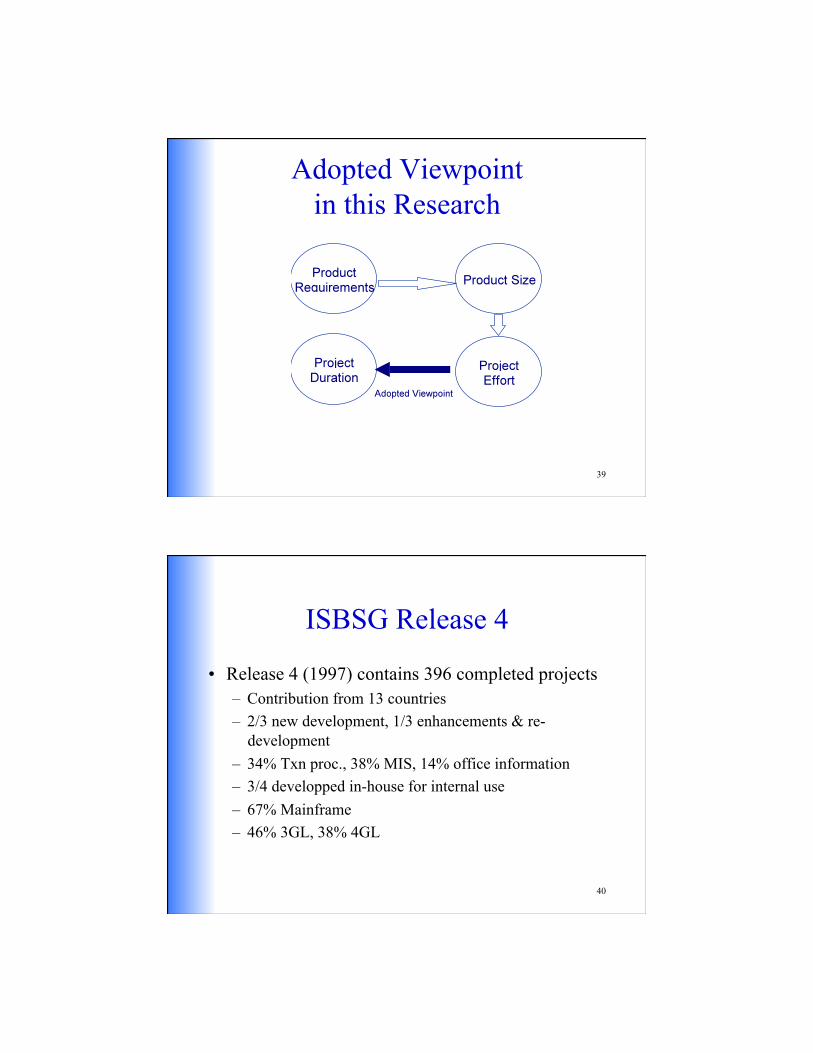
Adopted Viewpoint in this Research
40
ISBSG Release 4
• Release 4 (1997) contains 396 completed projects – Contribution from 13 countries – 2/3 new development, 1/3 enhancements & re-
development – 34% Txn proc., 38% MIS, 14% office information – 3/4 developped in-house for internal use – 67% Mainframe – 46% 3GL, 38% 4GL

41
Basic Selection Criteria • No reasonable doubts on data validity according to ISBSG
screening
• Known effort, known duration and known platform
312 projects satisfied all criteria
D range: 1 to 78 months E range: 0,1 to 761 person-months
42
Basic Criteria
Scatter plot of effort vs. duration (n=312)
43
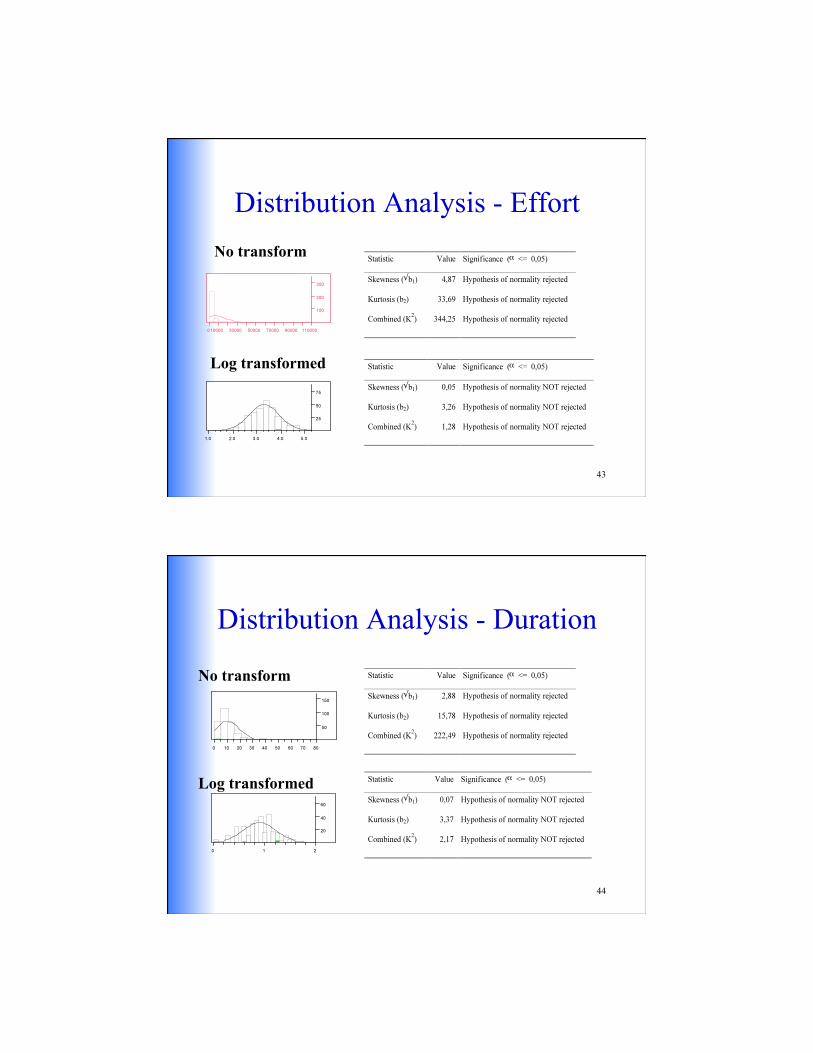
Distribution Analysis - Effort No transform
Log transformed
44
Distribution Analysis - Duration
No transform
Log transformed

45
Distribution Analysis Summary
• Skewness due to the natural distribution of projects
• Normal distribution cannot be assumed without log transformation
• Log transformed data selected for modeling purposes.
46
Correlation Analysis (Mainframe Platform Only)
Scatter plot of Log(effort) vs. Log(duration), n=208
• Pearson correlation coef. (r): 0,72
• Significant at 0,05 confidence level
• Linear model preferred
47
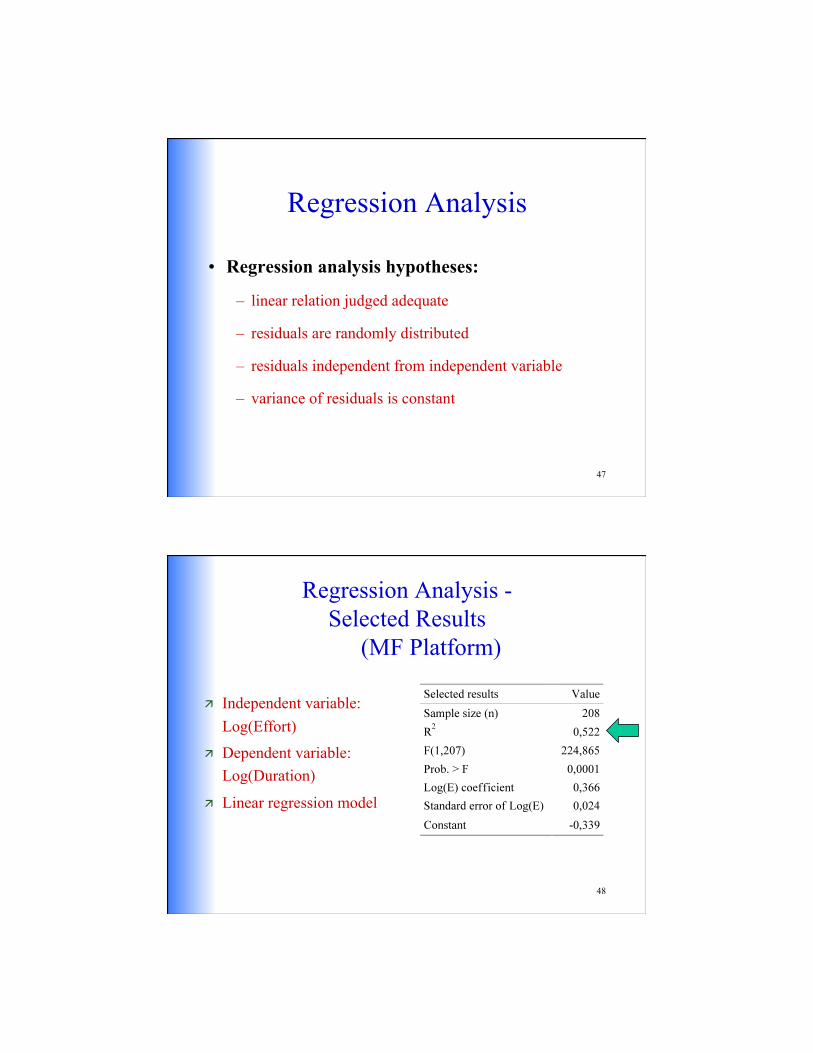
Regression Analysis
• Regression analysis hypotheses:
– linear relation judged adequate
– residuals are randomly distributed
– residuals independent from independent variable
– variance of residuals is constant
48
Regression Analysis - Selected Results
(MF Platform)
Independent variable: Log(Effort)
Dependent variable: Log(Duration)
Linear regression model

49
Regression Analysis - Residual Analysis (Mainframe Platform)
• Residuals are randomly distributed
• Residuals are independent of Log(E)
50
Regression Analysis - Residual Analysis
(Mainframe Platform Only)
Variance of residuals is constant
over the range of the dependent
variable Log(D)
51
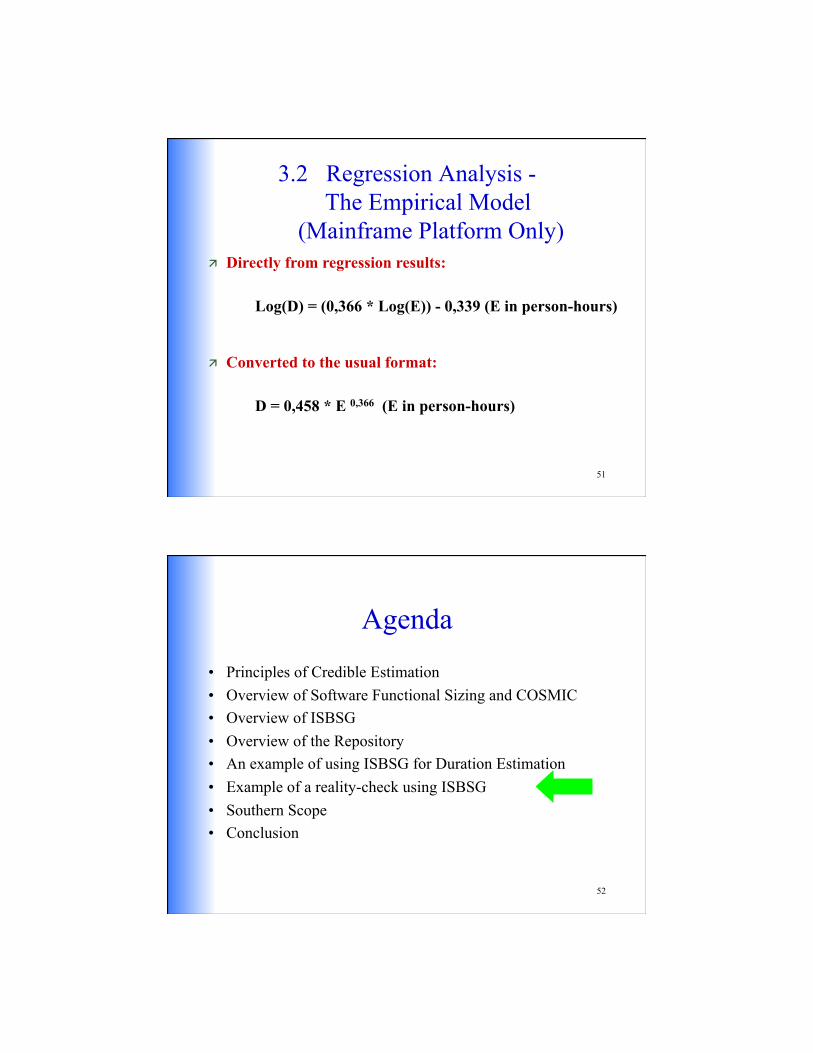
3.2 Regression Analysis - The Empirical Model (Mainframe Platform Only)
Directly from regression results:
Converted to the usual format:
Log(D) = (0,366 * Log(E)) - 0,339 (E in person-hours)
D = 0,458 * E 0,366 (E in person-hours)
52
Agenda
• Principles of Credible Estimation • Overview of Software Functional Sizing and COSMIC • Overview of ISBSG • Overview of the Repository • An example of using ISBSG for Duration Estimation • Example of a reality-check using ISBSG • Southern Scope • Conclusion

• March 2008: Can we develop and implement this software by the end of January 2009? Is this realistic?
Actual 2008 « Reality Check » Example*
« REALITY CHECK » WAS PERFORMED BY PIERRE BOURQUE AND VASILE STROIAN. COSMIC FFP COUNTING WAS PERFORMED BY LEILA CHEIKHI UNDER THE SUPERVISION OF PIERRE BOURQUE. NAME OF ACTUAL COMPANY INVOLVED IN THIS EXAMPLE WILL REMAIN UNDISCLOSED.
– Count (Estimate) the functional size of the software to be developed
– Analyze actual actual speed of delivery and productivity rates of similar projects in the ISBSG database
– Compare with required speed of delivery and productivity rate to complete the development by the planned deadline
How can we answer this question?

Counting was performed on the « actual previous software » taking into consideration a number planned changes.
Roughly 60 hours of work for the counting A detailed counting report was delivered to the customer. ◦ Limits of counting: ex: No documentation available ◦ Assumptions when counting ◦ Identification of Objects of Interest and Data Groups: 29 ◦ Identification of Functional Processes : 135 ◦ Identification of all data movements
Count of functional size: 784 CFP or 929 CFP depending on the set of assumptions
Estimate of functional size: 1000 CFP
Results of Detailed COSMIC Counting
Sample Data Movements in Counting Report
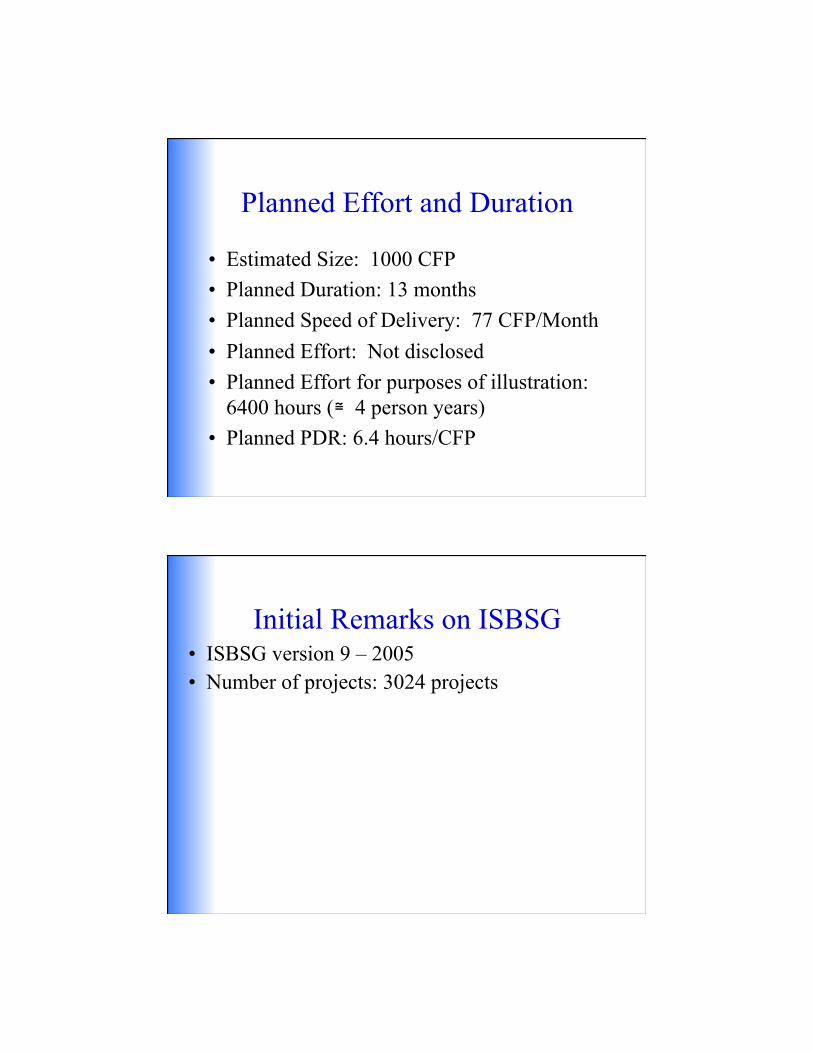
• Estimated Size: 1000 CFP • Planned Duration: 13 months • Planned Speed of Delivery: 77 CFP/Month • Planned Effort: Not disclosed • Planned Effort for purposes of illustration:
6400 hours (≅ 4 person years) • Planned PDR: 6.4 hours/CFP
Planned Effort and Duration
• ISBSG version 9 – 2005 • Number of projects: 3024 projects
Initial Remarks on ISBSG
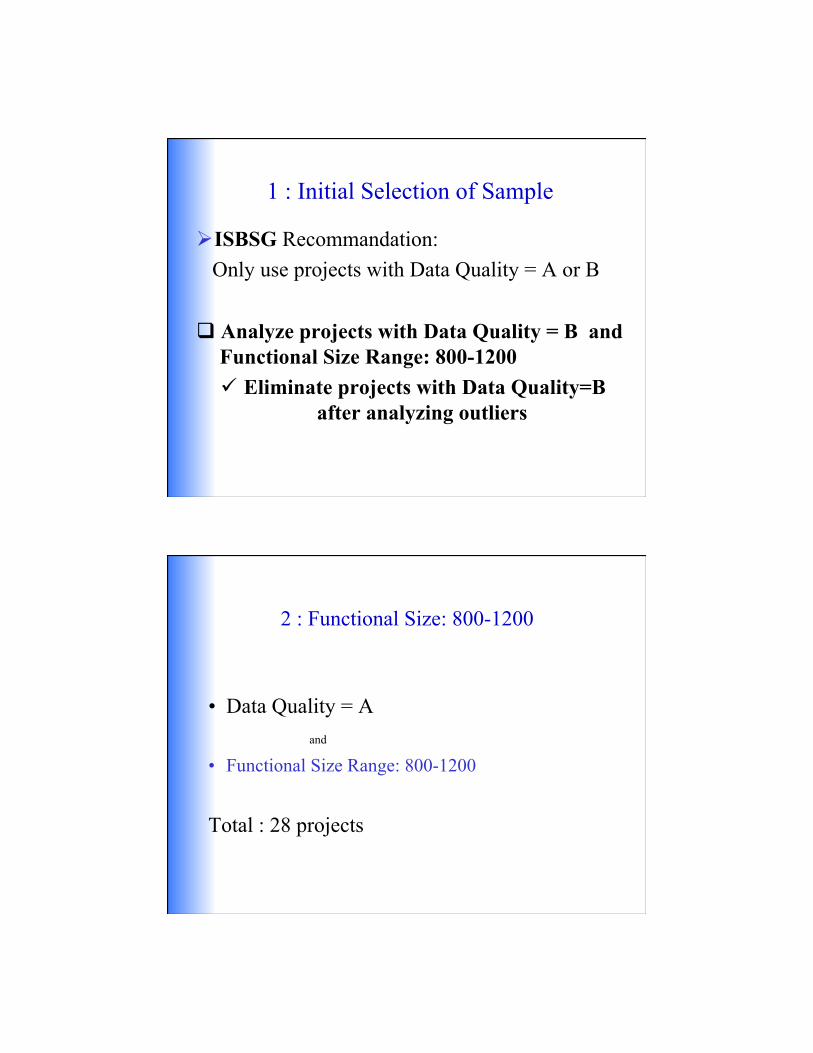
ISBSG Recommandation: Only use projects with Data Quality = A or B
Analyze projects with Data Quality = B and Functional Size Range: 800-1200 Eliminate projects with Data Quality=B
after analyzing outliers
1 : Initial Selection of Sample
• Data Quality = A and
• Functional Size Range: 800-1200
Total : 28 projects
2 : Functional Size: 800-1200

2 : Functional Size: 800-1200
Planned project
2 : Functional Size : 800-1200
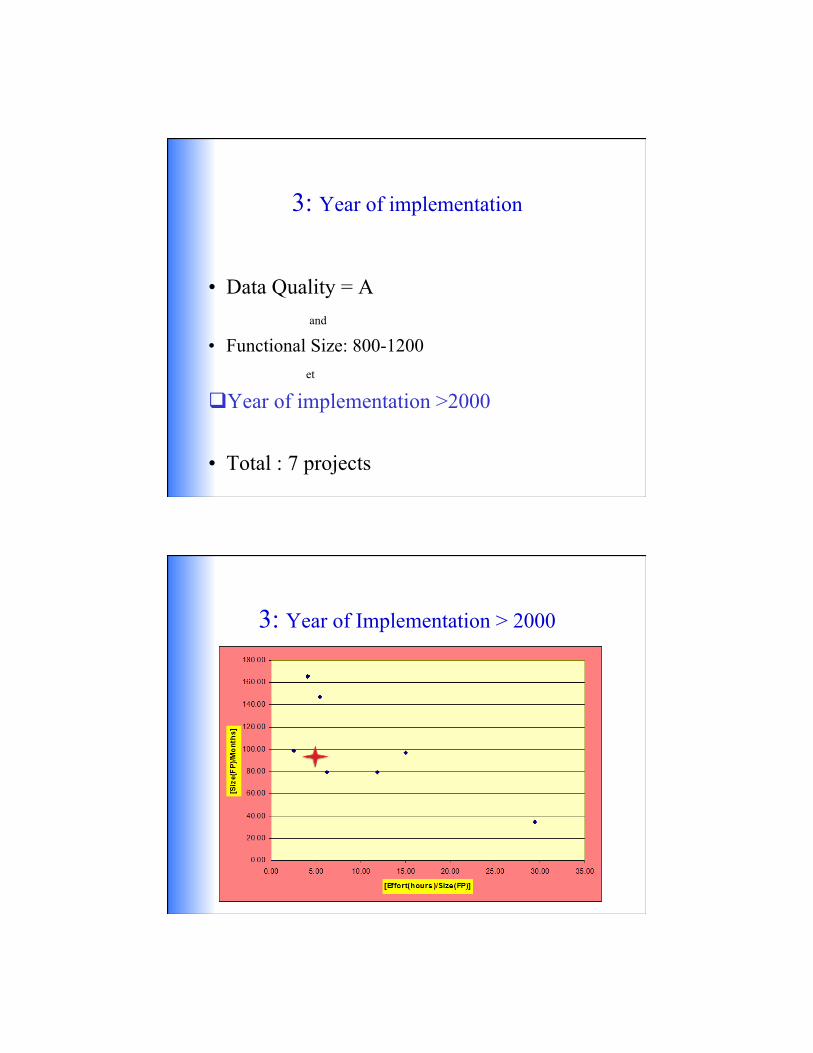
• Data Quality = A and
• Functional Size: 800-1200 et
Year of implementation >2000
• Total : 7 projects
3: Year of implementation
3: Year of Implementation > 2000

3: Year of implementation > 2000
• Data Quality : A and
• Functional Size : 800-1200 and
New Development projects only
TOTAL : 19 projects
4 : New Development Projects Only

4: New Development Projects Only
4: New Development Projects Only
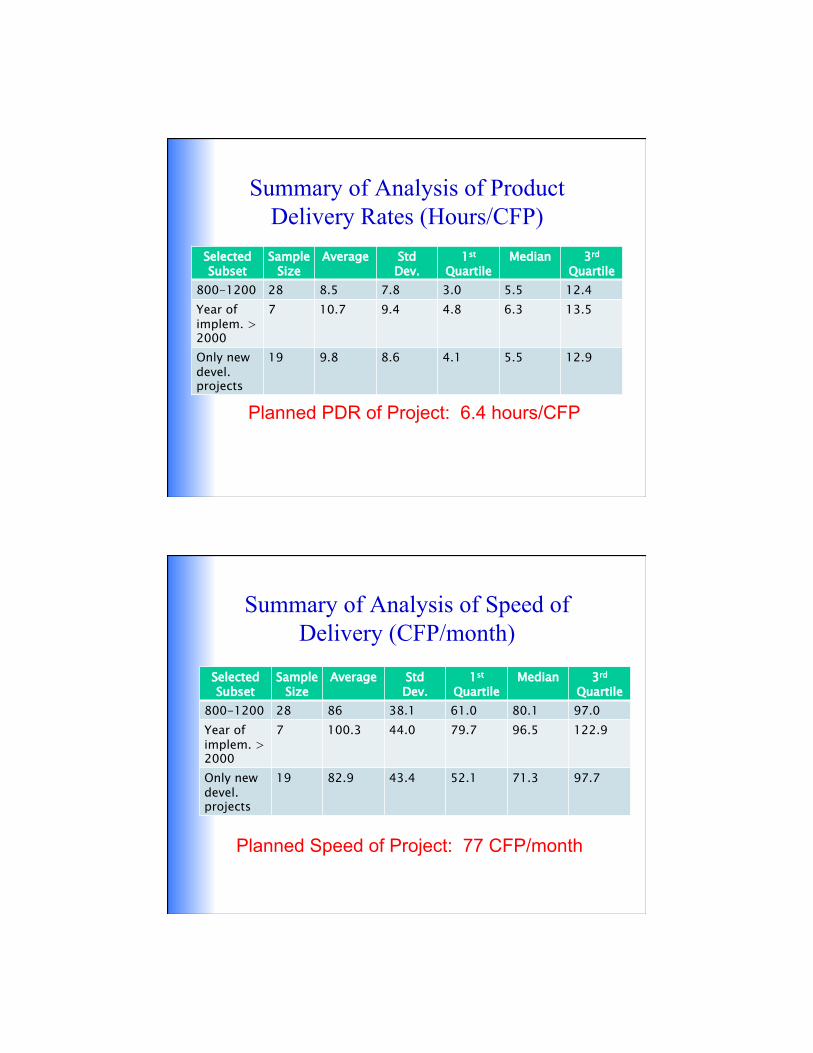
Selected Subset
Sample Size
Average Std Dev.
1st Quartile
Median 3rd Quartile
800-1200 28 8.5 7.8 3.0 5.5 12.4 Year of implem. > 2000
7 10.7 9.4 4.8 6.3 13.5
Only new devel. projects
19 9.8 8.6 4.1 5.5 12.9
Summary of Analysis of Product Delivery Rates (Hours/CFP)
Planned PDR of Project: 6.4 hours/CFP
Selected Subset
Sample Size
Average Std Dev.
1st Quartile
Median 3rd Quartile
800-1200 28 86 38.1 61.0 80.1 97.0 Year of implem. > 2000
7 100.3 44.0 79.7 96.5 122.9
Only new devel. projects
19 82.9 43.4 52.1 71.3 97.7
Summary of Analysis of Speed of Delivery (CFP/month)
Planned Speed of Project: 77 CFP/month

Planned duration and effort can be viewed as realistic but in reality are quite aggressive in terms of the overall industry ◦ ISBSG data most probably represents the upper portion
of the industry High standard deviation indicates significant
variability in productivity and in speed of delivery Need to aggressively manage scope of project Need to aggressively manage delays in project Need to apply software engineering best practices
Conclusion « Reality Check »
72
Agenda
• Principles of Credible Estimation • Overview of Software Functional Sizing and COSMIC • Overview of ISBSG • Overview of the Repository • An example of using ISBSG for Duration Estimation • Example of a reality-check using ISBSG • Southern Scope • Conclusion

• http://www.egov.vic.gov.au/index.php?env=-innews/detail:m1816-1-1-8-s-0:n-832-1-0--
Discussion and Review of Southern Scope
As defined in Park et al. (94): « Estimates are made by people, not by models.
They require reasoned judgments and commitments to organizational goals that
CANNOT be delegated to any AUTOMATED process ».
74
Underlying Principles of CREDIBLE Estimation - 1
These principles are taken from: R. E.Park, W. B. Goethert and J.T. Webb. Software Cost and Schedule Estimating: A Process Improvement Initiative. Pittsburgh, PA Software Engineering Institute,1994.
« All estimates are based on COMPARISONS. When people
estimate, they evaluate how something is like, and how
something is unlike, things that they or others have seen before ».
75
Underlying Principles of CREDIBLE Estimation-2
76
Underlying Principles of CREDIBLE Estimation-3

77
Conclusion
• Software sizing is different from estimation • Software functional sizing is rigorously defined
and used extensively around the world • ISBSG data is available and can be analyzed by
everyone. • The steps taken to derive the example model and
the assumptions behind it are known and the accuracy for this sample is published.
• Allows more intelligent tradeoffs and informed choices between various scenarios.
78
Conclusion • Development of demonstrably sound
quantitative models is a difficult and key problem in this industry.
• Can only be solved with an inherently white-box approach.
• Credibility of results depends entirely on the transparency of the method, data, definitions and assumptions that were used to derive this estimate.
79
Refererences • Abran, A., Ndiaye, I., and Bourque, P. Evaluation of a Black-Box Estimation
Tool: A Case Study, Software Process: Improvement and Practice, 2007, 12(2): 199-218.
• P. Bourque, S. Oligny, A. Abran, Developing Project Duration Models in Software Engineering, Journal of Computer Science and Technology, Springer, Vol 22, No 3, 2007.
• S.D. Conte, H.E.Dunsmore, V.Y. Shen, Software engineering metrics and models. Menlo Park: The Benjamin/Cummings Publishing Company, Inc. 1986.
• R. E.Park, W. B. Goethert and J.T. Webb. Software Cost and Schedule Estimating: A Process Improvement Initiative. Pittsburgh, PA Software Engineering Institute,1994.