Embed Size (px)
Citation preview

The value of benchmarking IT projectsHarold van HeeringenSoftware Cost Engineer, Sogeti Nederland B.V.ISBSG presidentNESMA board
The Russian Managers AssociationLocation: MoscowDate: October 2013

Семь раз отмерь, один отрежь
Сравнить божий дар с яичницей
Умом Россию не понять,
Аршином общим не измерить
Ничто не существует, пока оно не измерено
3
Overview
BenchmarkingSoftware Project IndustryFunctional Size MeasurementSoftware MetricsHistorical Data: ISBSGProject Benchmark ExampleOrganization BenchmarkOther uses for BenchmarkingConclusions and final remarks
Scope: Software Development
4
Benchmarking (wikipedia)Benchmarking is the process of comparing one's business processes and performance metrics to industry bests or best practices from other industries.
Benchmarking is used to measure performance using a specific indicator (cost per unit of measure, productivity per unit of measure, cycle time of x per unit of measure or defects per unit of measure) resulting in a metric of performance that is then compared to others
This then allows organizations to develop plans on how to make improvements or adapt specific best practices, usually with the aim of increasing some aspect of performance. Benchmarking may be a one-off event, but is often treated as a continuous process in which organizations continually seek to improve their practices.
5
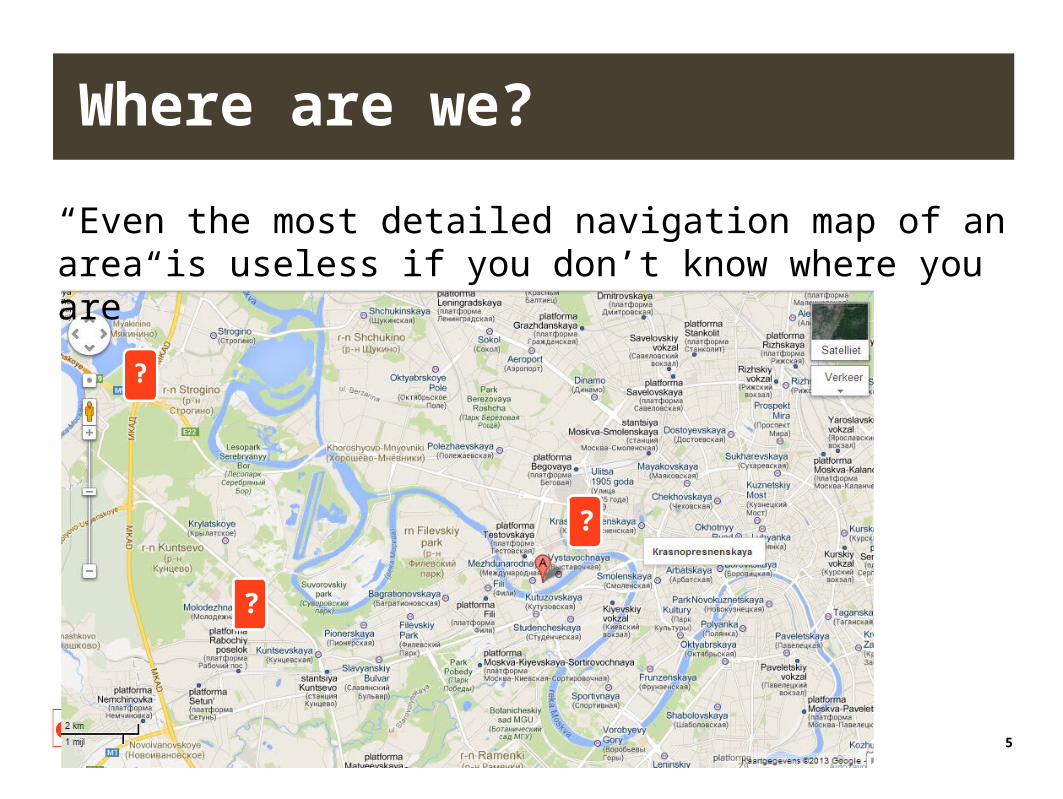
Where are we?
“Even the most detailed navigation map of an area is useless if you don’t know where you are”
?
?
6
Benchmarking
Senior Management of IT departments/organizations need to make decisions need to make decisions based on ‘where they are’ and ‘where they want to go’.
Benchmarking is about determining ‘where you are’ compared to relevant peers, in order to make informed decisions.
But how to measure and determine where you are?
7
Software project industry
Low ‘performance metrics’ maturityFew Performance Measurement Process implementedFew Benchmarking processes implemented
Most organizations don’t know how good or how bad they are in delivering or maintaining software.
These organizations are not able to assess their competitive position, nor able to make informed strategic decisions to improve their competitive position.
8
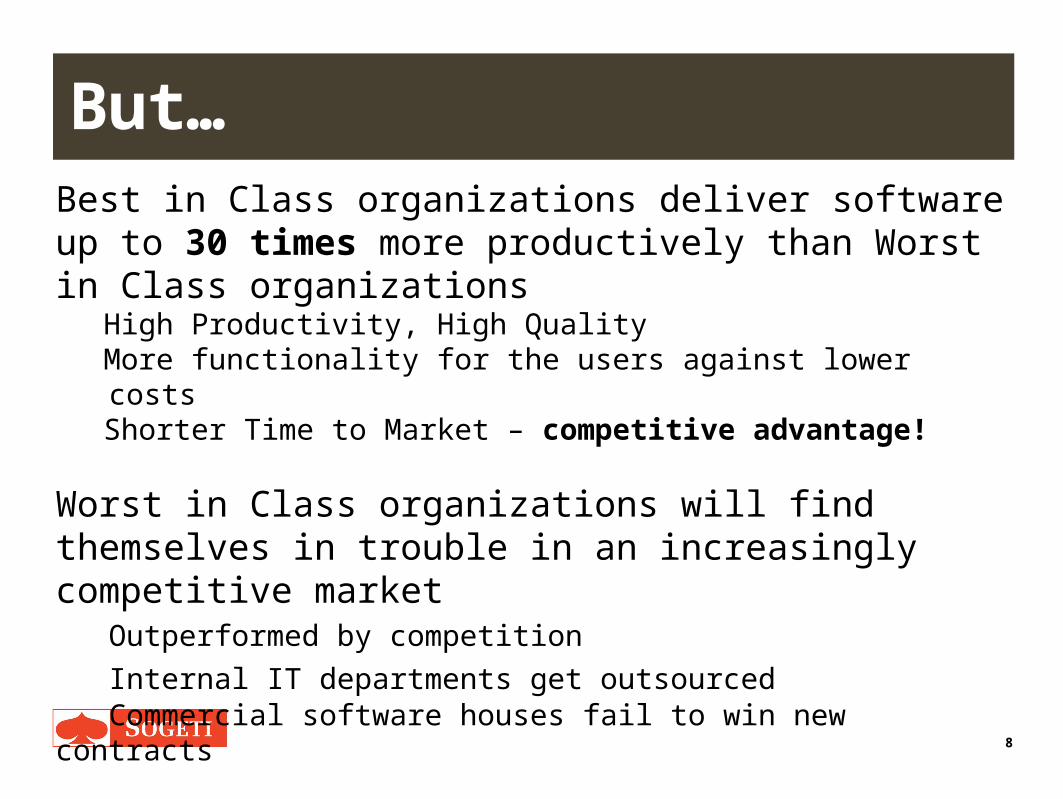
But…Best in Class organizations deliver software up to 30 times more productively than Worst in Class organizations
High Productivity, High QualityMore functionality for the users against lower costsShorter Time to Market – competitive advantage!
Worst in Class organizations will find themselves in trouble in an increasingly competitive market
Outperformed by competition
Internal IT departments get outsourcedCommercial software houses fail to win new contracts
Important to know where you are! Benchmark is essential!
9
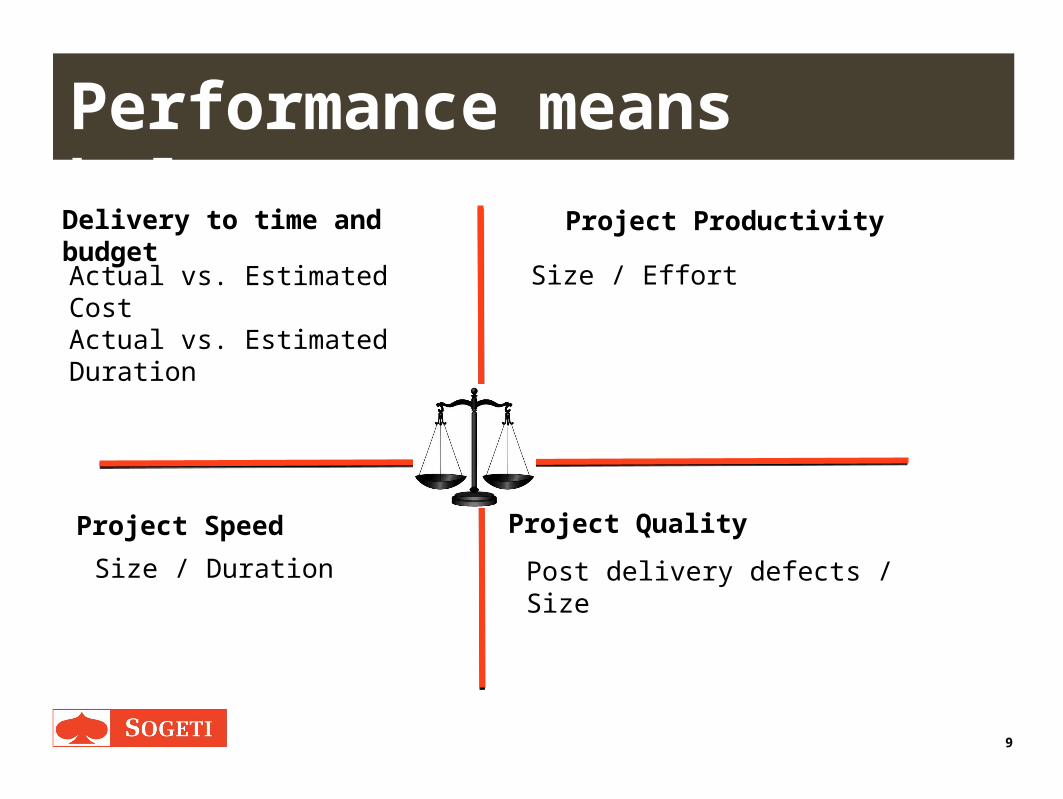
Performance means balanceDelivery to time and budget Project Productivity
Project Speed Project Quality
Actual vs. Estimated CostActual vs. Estimated Duration
Size / Effort
Size / Duration Post delivery defects / Size
10
Difficulty – low industry maturity
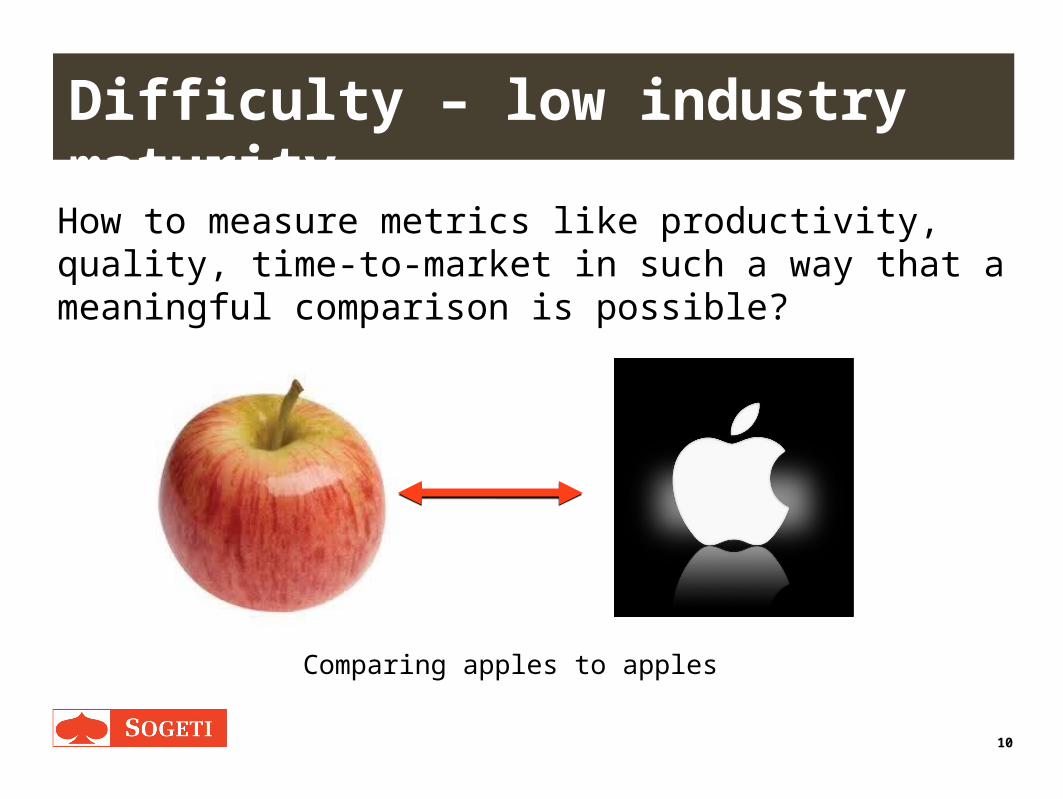
How to measure metrics like productivity, quality, time-to-market in such a way that a meaningful comparison is possible?
Comparing apples to apples
11
12
Functional Size Measurement
Function Point Analysis (NESMA, IFPUG or COSMIC)Measure the functional user requirements – size in function points;ISO standards – objective, independent, verifiable, repeatable;Strong relation between functional size and project effort needed;
What to do with the results?Project effort/duration/cost estimationBenchmarking/performance measurementUse in Request for Proposal management (answer price/FP questions)
What about historical data?Company data (preferably for estimation)Industry data (necessary for external benchmarking)
13
Unit of Measure (UoM)Why are Function Points the best UoM to use in Benchmarking?
Functionality is of value for the client/business. More functionality means more value. More Lines of code (technical size) is not necessarily of value.
Function Points are measured independent from technical requirements500 FP of functionality implemented in Java SOA architecture
=500 FP of functionality implemented in Cobol mainframe
Function Points are measured independent from implementation method
500 FP delivered in an agile development project
=500 FP delivered in a COST package implementation
14
Software metrics – some examples
ProductivityProductivity Rate: #Function points per staff monthPDR: #Effort hours per function Point
QualityDefect Density: #Defects delivered per 1000 function points
Time to MarketSpeed: #Function points delivered per calendar month
15
Performance Measurement
Measure the size of completed projectsProject size in Function Points Product size in Function Points
Collect and analyze the dataEffort hours, duration, defectsNormalize the data when necessaryStore the data in the corporate databaseBenchmark the project, internally and externally
Report metrics and trendsDifferent reports for different stakeholders Depending on goals of the stakeholder
16
Historical data: ISBSG repositories
International Software Benchmarking Standards GroupIndependent and not-for-profit
Grows and exploits two repositories of software data:New development projects and enhancements (> 6000 projects)Maintenance and support (> 1000 applications)
Everybody can submit project data DCQ on the siteAnonymousFree benchmark report in return
17
ISBSG
Mission: “To improve the management of IT resources by both business and government, through the provision and exploitation of public repositories of software engineering knowledge that are standardized, verified, recent and representative of current technologies”.
All ISBSG data is validated and rated in accordance with its quality guidelinescurrentrepresentative of the industryindependent and trustedcaptured from a range of organization sizes and industries
Industry leaders around the world contribute to the ISBSG’s development, offering the highest metrics expertise worldwide
18
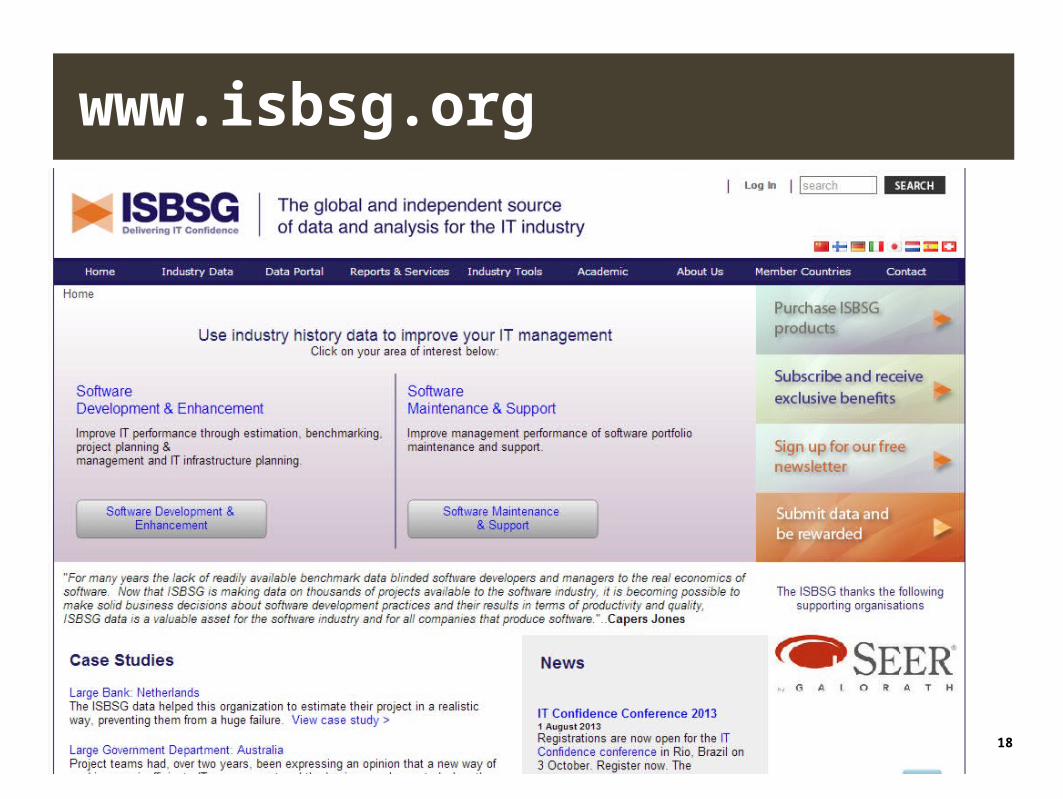
www.isbsg.org
19
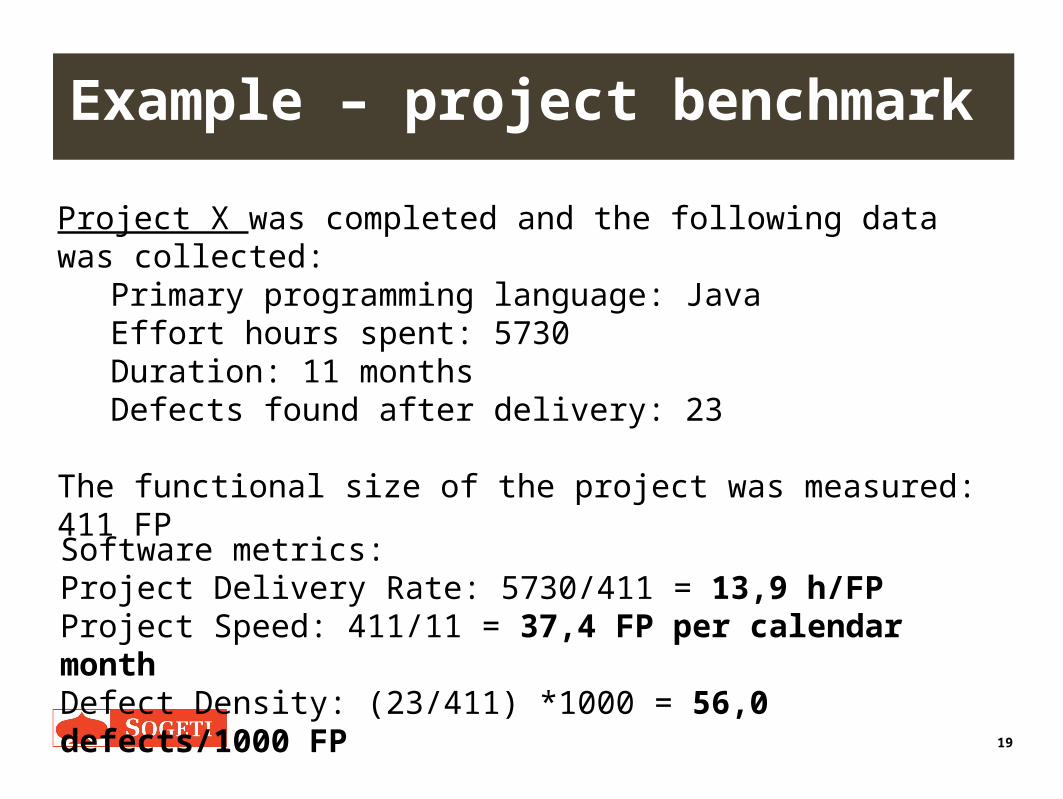
Example – project benchmark
Project X was completed and the following data was collected:Primary programming language: JavaEffort hours spent: 5730Duration: 11 monthsDefects found after delivery: 23
The functional size of the project was measured: 411 FP
Software metrics:Project Delivery Rate: 5730/411 = 13,9 h/FPProject Speed: 411/11 = 37,4 FP per calendar monthDefect Density: (23/411) *1000 = 56,0 defects/1000 FP
20
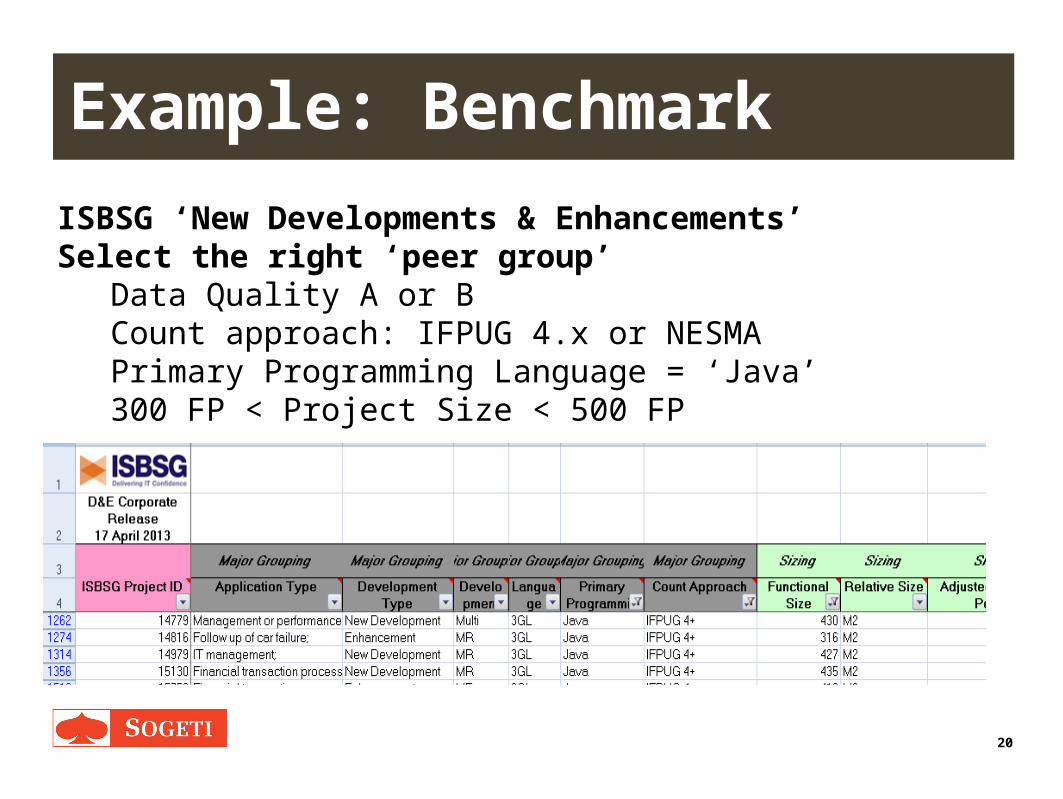
Example: Benchmark
ISBSG ‘New Developments & Enhancements’Select the right ‘peer group’
Data Quality A or BCount approach: IFPUG 4.x or NESMAPrimary Programming Language = ‘Java’300 FP < Project Size < 500 FP
21
Results – project benchmarkPDR
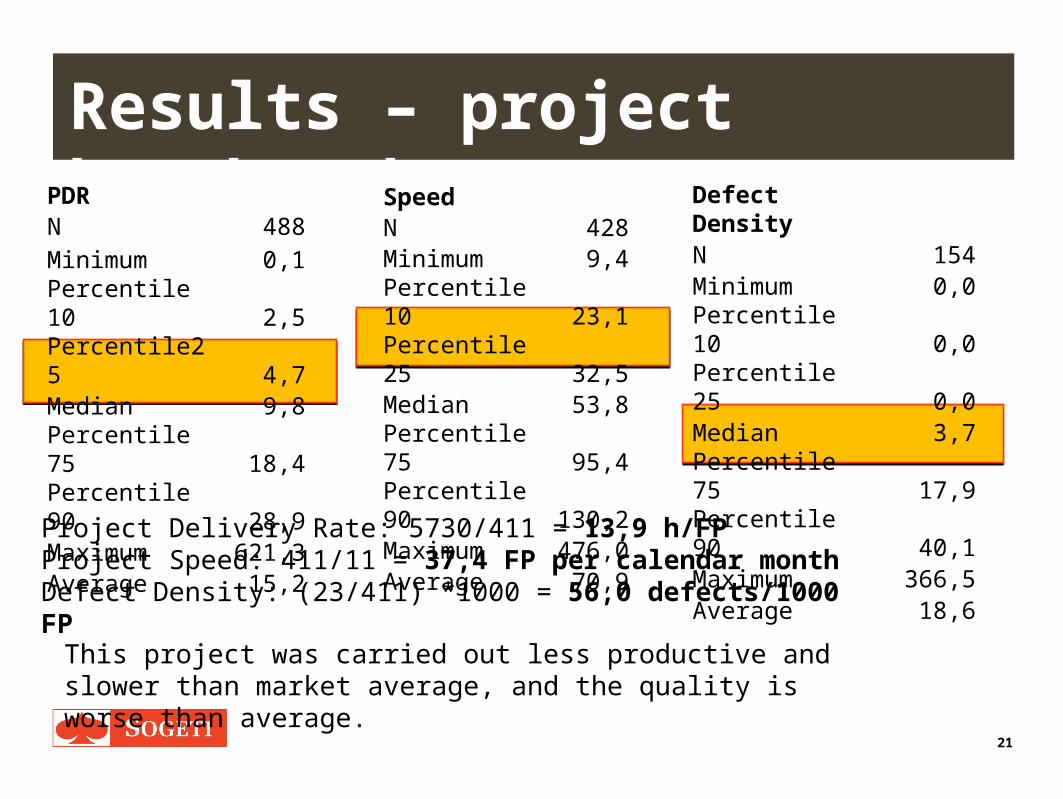
N 488Minimum 0,1Percentile 10 2,5Percentile25 4,7Median 9,8Percentile 75 18,4Percentile 90 28,9Maximum 621,3Average 15,2
Project Delivery Rate: 5730/411 = 13,9 h/FPProject Speed: 411/11 = 37,4 FP per calendar monthDefect Density: (23/411) *1000 = 56,0 defects/1000 FP
SpeedN 428Minimum 9,4Percentile 10 23,1Percentile 25 32,5Median 53,8Percentile 75 95,4Percentile 90 130,2Maximum 476,0Average 70,9
Defect DensityN 154Minimum 0,0Percentile 10 0,0Percentile 25 0,0Median 3,7Percentile 75 17,9Percentile 90 40,1Maximum 366,5Average 18,6
This project was carried out less productive and slower than market average, and the quality is worse than average.
22
Organization Benchmark
0,40,60,81,01,21,41,61,82,02,2
<2009 2009 2010 2011 2012
Prod
uctiv
ity In
dex
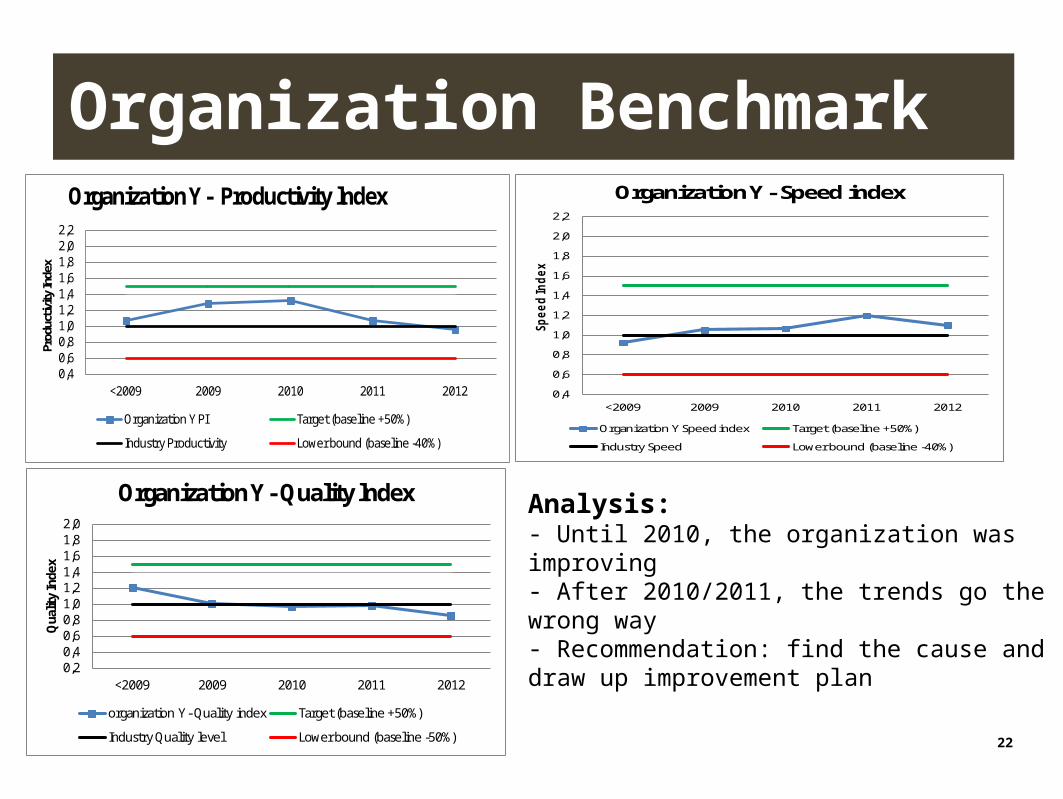
Organization Y - Productivity lndex
Organization Y PI Target (baseline +50%)
Industry Productivity Lower bound (baseline -40%)
0,4
0,6
0,8
1,0
1,2
1,4
1,6
1,8
2,0
2,2
<2009 2009 2010 2011 2012
Sp
ee
d I
nd
ex
Organization Y - Speed index
Organization Y Speed index Target (baseline +50%)
Industry Speed Lower bound (baseline -40%)
0,20,40,60,81,01,21,41,61,82,0
<2009 2009 2010 2011 2012
Qua
lity
Inde
x
Organization Y - Quality lndex
organization Y - Quality index Target (baseline +50%)
Industry Quality level Lower bound (baseline -50%)
Analysis:- Until 2010, the organization was improving- After 2010/2011, the trends go the wrong way- Recommendation: find the cause and draw up improvement plan
23
Other uses for Benchmarking
Vendor selection, based on productivity, speed or quality metrics
Definition of SLA agreements (or other KPI’s) based on market average performance
Establish a baseline from which to measure future improvement
Explain to the client/business that a project was carried out in a ‘better-than-average’ way, while the client may perceive otherwise
24
Conclusions and final remarks
Benchmarking is essential in the strategic management of an organization. It helps understanding the competitive position and it help to identify the ‘problem areas’, or ‘improvement areas’.
There are proven tools, techniques, models and historical data available to carry out benchmarks in a fairly low-cost way.
This presentation focused on software development, because this is usually the main concern of the business/client. Benchmarking of other aspects of IT is similar, but with other performance metrics.

Harold van [email protected]
@haroldveendam
haroldveendam
haroldvanheeringen
Software Cost EngineerNESMA board memberISBSG presidentCOSMIC International Advisory Council, NL representative