Embed Size (px)
Citation preview
Colaboradores:
AGILE & FSM METHODS GO WELL TOGETHER!
Agenda
• The dillemma: Agile Development or Function Points?
• TI Métricas’ Experience in 2017:
• How has this been adopted in the Brazilian market?
• What benefits were obtained from measurement?
• Did the metrics analyst job change?
• Are Story Points incompatible with Function Points?
• What about 2018 year?
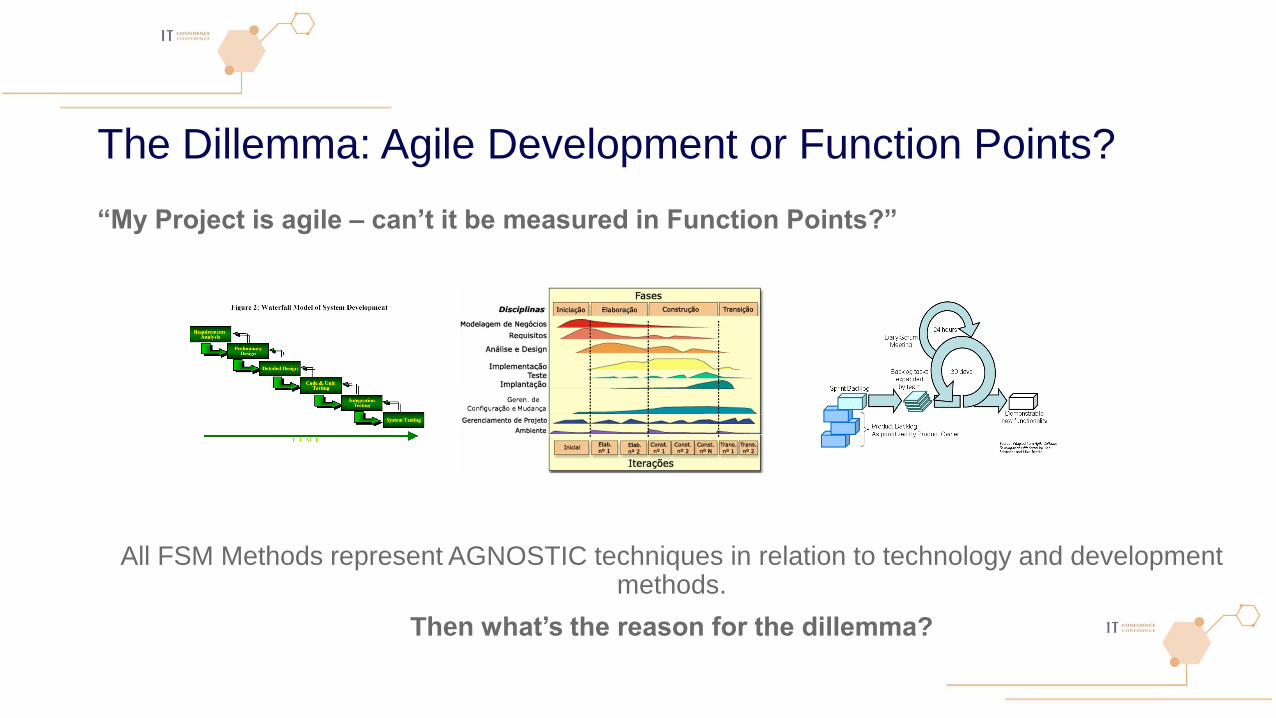
The Dillemma: Agile Development or Function Points?
“My Project is agile – can’t it be measured in Function Points?”
All FSM Methods represent AGNOSTIC techniques in relation to technology and development methods.
Then what’s the reason for the dillemma?
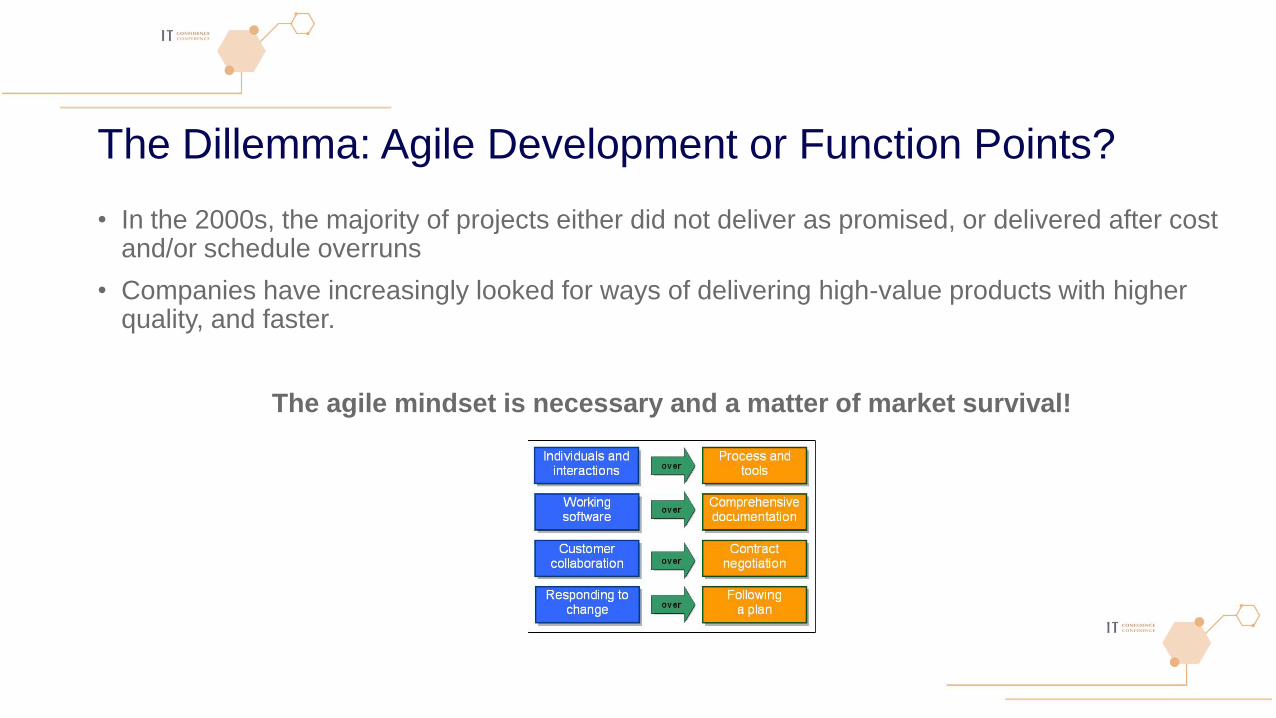
The Dillemma: Agile Development or Function Points?
• In the 2000s, the majority of projects either did not deliver as promised, or delivered after cost and/or schedule overruns
• Companies have increasingly looked for ways of delivering high-value products with higher quality, and faster.
The agile mindset is necessary and a matter of market survival!
Function Points are applicable to
Agile development!
Representativeness or Applicability?
• Applicability is related to definitions/concepts:
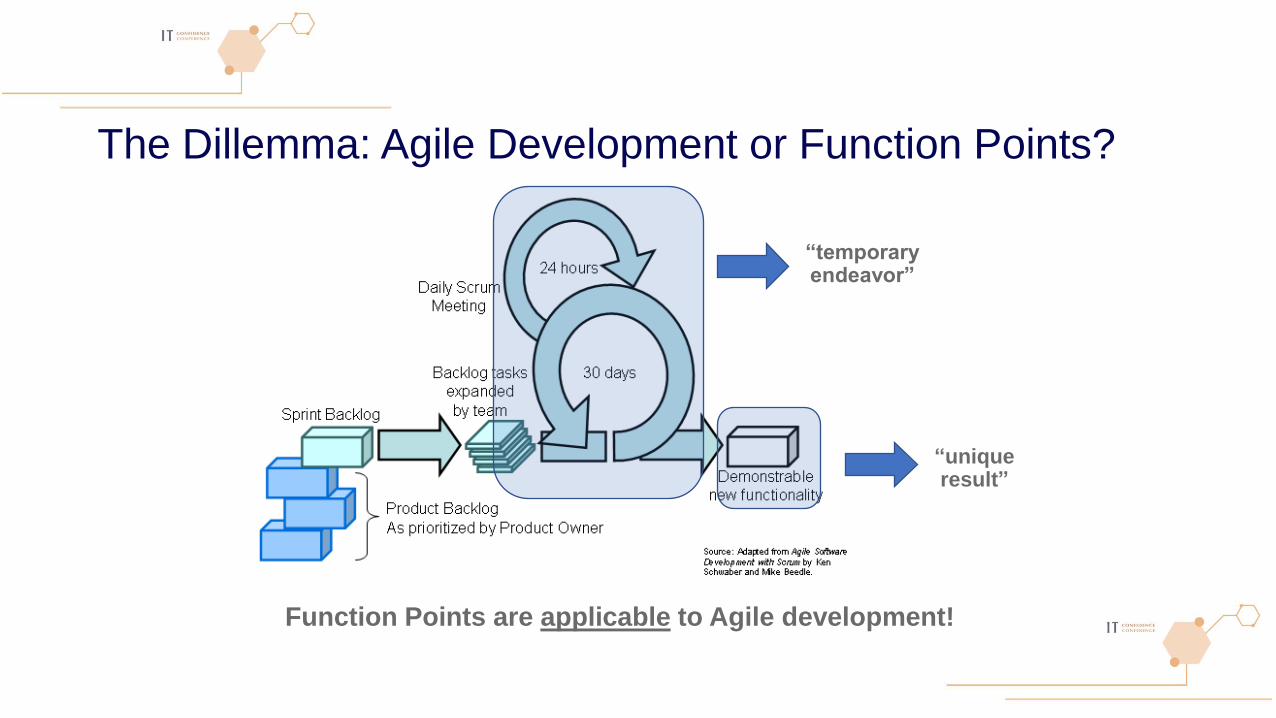
The Dillemma: Agile Development or Function Points?
“temporary endeavor”
“unique result”
Function Points are applicable to Agile development!
TI Métricas’ Experience
Clients have been adopting a HYBRID Agile approach:
• Agile development is still strongly influenced by governance protocols created for projects using a traditional approach in the same environment.
TI Métricas’ Experience
• Client from the Finance industry
• Deployment of a new, innovative and disruptive product.
• Adoption of agile methods, hybrid approach:
• Each product module is still understood as an individual project,
• Uses Scrum practices and management tools such as JIRA and Confluence.
• FP measurement of each project during the planning phase to check the software factory’s proposal (from Jun/17 to Aug/17)
Savings of ~10% were obtained in relation to the initial proposals.
Case #1
TI Métricas’ Experience
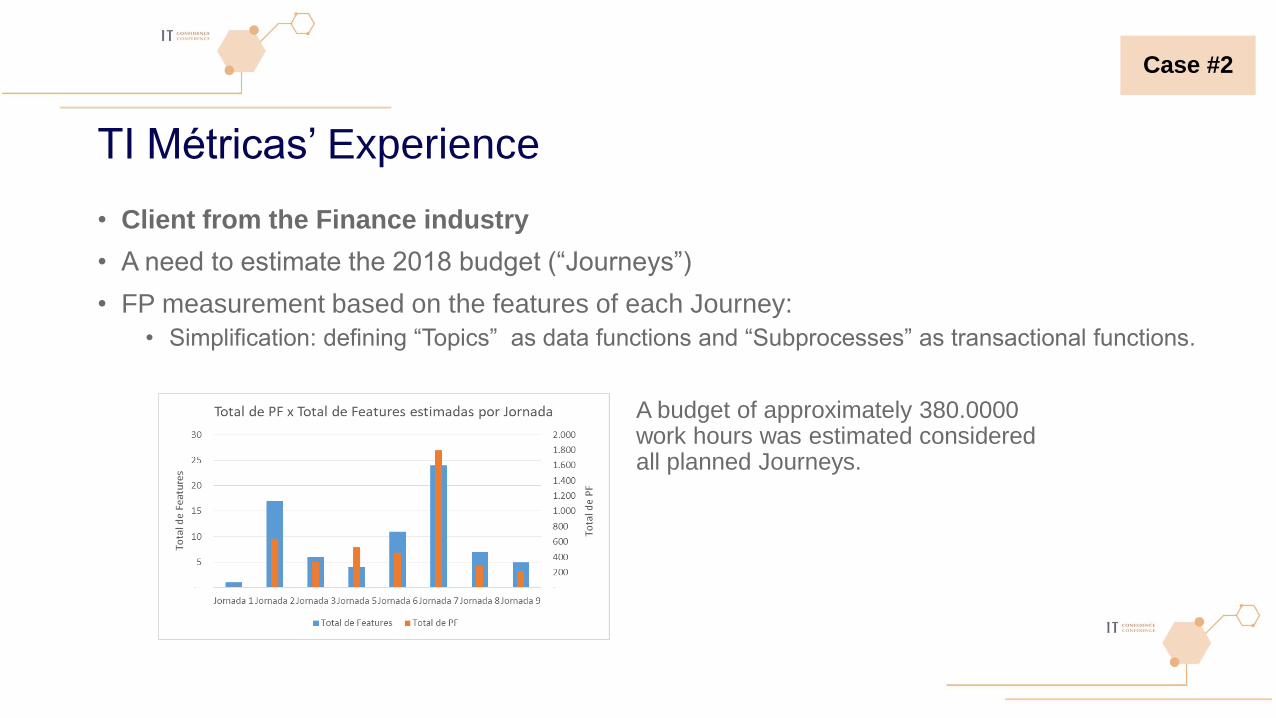
• Client from the Finance industry
• A need to estimate the 2018 budget (“Journeys”)
• FP measurement based on the features of each Journey:
• Simplification: defining “Topics” as data functions and “Subprocesses” as transactional functions.
Case #2
A budget of approximately 380.0000 work hours was estimated considered all planned Journeys.
TI Métricas’ Experience
• Has the metrics analyst job changed?
• Look for inputs, rather than documentation:
• Better balance between documentation analysis and meetings with Business Analysts
• Immersion in analysis meetings and Product Backlog prioritization
• Direct access to User Stories in agile management tools.
Case #3
TI Métricas’ Experience
• Client from the Insurance industry
• Four digital transformation projects were FP-measured from Mar/17 to Aug/17:
• Typical agile practices were adopted, with a multidisciplinary team including a Scrum Master and a Product Owner, 100% onsite with 2-week Sprints.
• Presence of a Product Manager - Scalability
• Measurement at the Sprint level based on User Stories.
• The results made it possible to assess the performance of each sprint inside each project and to compare each project to the overall performance of all projects based on the same approach.
Case #3
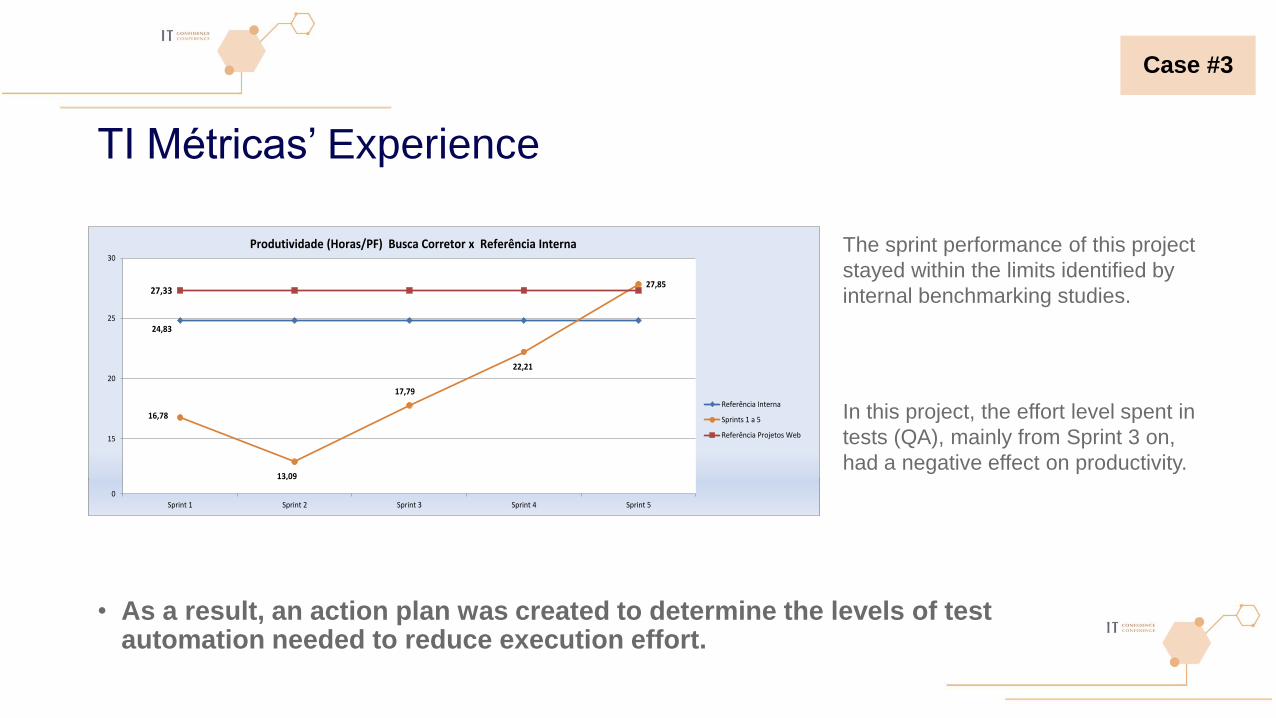
TI Métricas’ Experience
• As a result, an action plan was created to determine the levels of test automation needed to reduce execution effort.
Case #3
24,83
16,78
13,09
17,79
22,21
27,8527,33
0
5
10
15
20
25
30
Sprint 1 Sprint 2 Sprint 3 Sprint 4 Sprint 5
Referência Interna
Sprints 1 a 5
Referência Projetos Web
Produtividade (Horas/PF) Busca Corretor x Referência Interna
24,83
16,78
13,09
17,79
22,21
27,8527,33
0
5
10
15
20
25
30
Sprint 1 Sprint 2 Sprint 3 Sprint 4 Sprint 5
Referência Interna
Sprints 1 a 5
Referência Projetos Web
Produtividade (Horas/PF) Busca Corretor x Referência Interna
The sprint performance of this project
stayed within the limits identified by
internal benchmarking studies.
In this project, the effort level spent in
tests (QA), mainly from Sprint 3 on,
had a negative effect on productivity.
TI Métricas’ Experience
Are Story Points incompatible with Function Points?
• The previous study showed it is possible to COMPARE results between different projects and sprints using FPs.
• Story Points represent RELATIVE measures of size, i.e., work within a specific project context since they quantify the view of a team.
• Story Points must be analyzed within the same context to determine and assess CAPACITY/VELOCITY.
• When the goal is to SUPPORT GOVERNANCE the utilization of FPs allows for comparative analyses (multiple distinct contexts).
Case #3
TI Métricas’ Experience
• Client from the Finance industry
• A pilot measurement study was run in Jul/17 to assess the productivity of agile projects – a 27-project sample.
• The agile framework adopted:
• based on the Spotify model (Squads, Tribes, Chapters, Guilds) combined with SAFe,
• strong interaction between teams due to physical proximity,
• based on user story definitions extracted from JIRA
Case #4
TI Métricas’ Experience
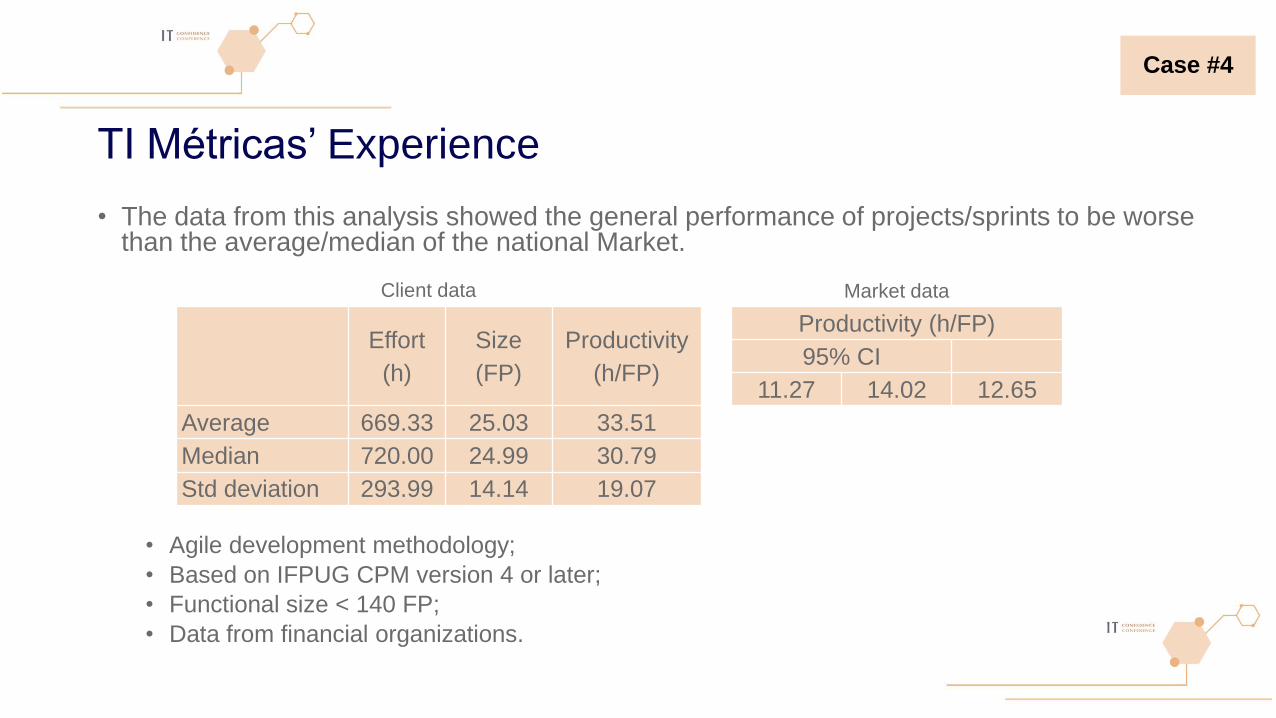
• The data from this analysis showed the general performance of projects/sprints to be worse than the average/median of the national Market.
• Agile development methodology;
• Based on IFPUG CPM version 4 or later;
• Functional size < 140 FP;
• Data from financial organizations.
Case #4
Client data
Effort
(h)
Size
(FP)
Productivity
(h/FP)
Average 669.33 25.03 33.51
Median 720.00 24.99 30.79
Std deviation 293.99 14.14 19.07
Productivity (h/FP)
95% CI
11.27 14.02 12.65
Market data
TI Métricas’ Experience
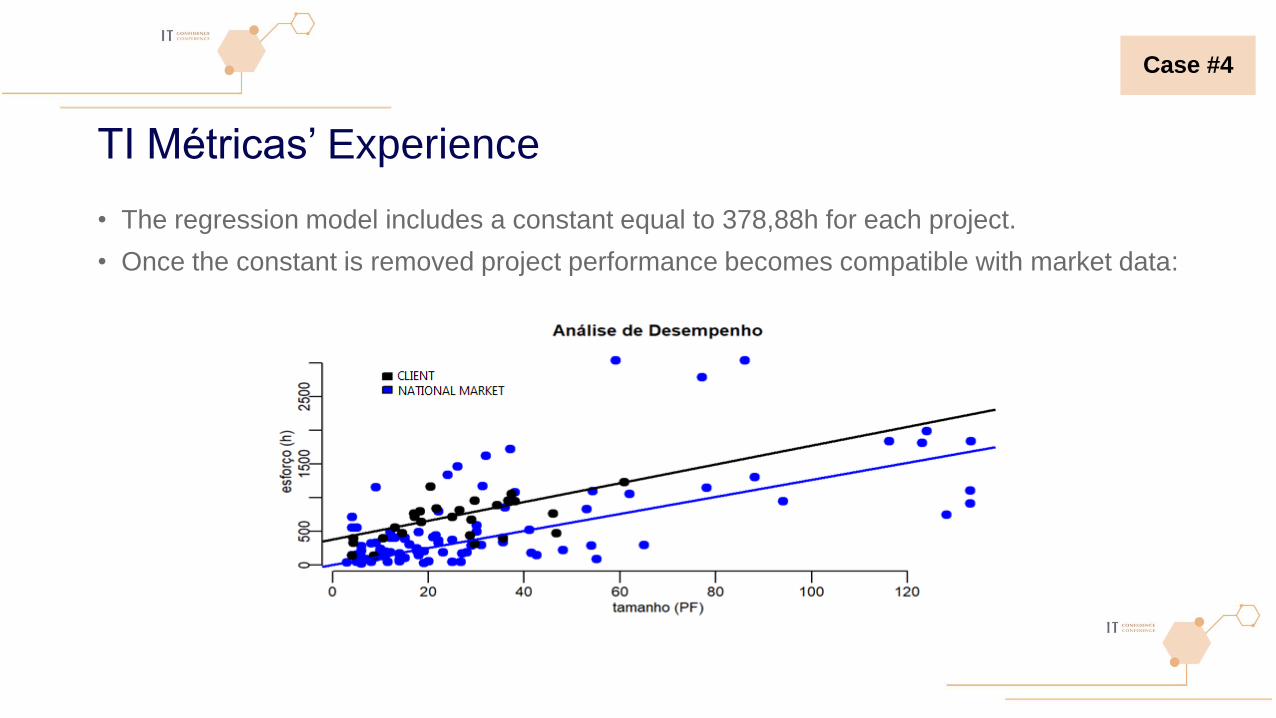
• The regression model includes a constant equal to 378,88h for each project.
• Once the constant is removed project performance becomes compatible with market data:
Case #4
TI Métricas’ Experience
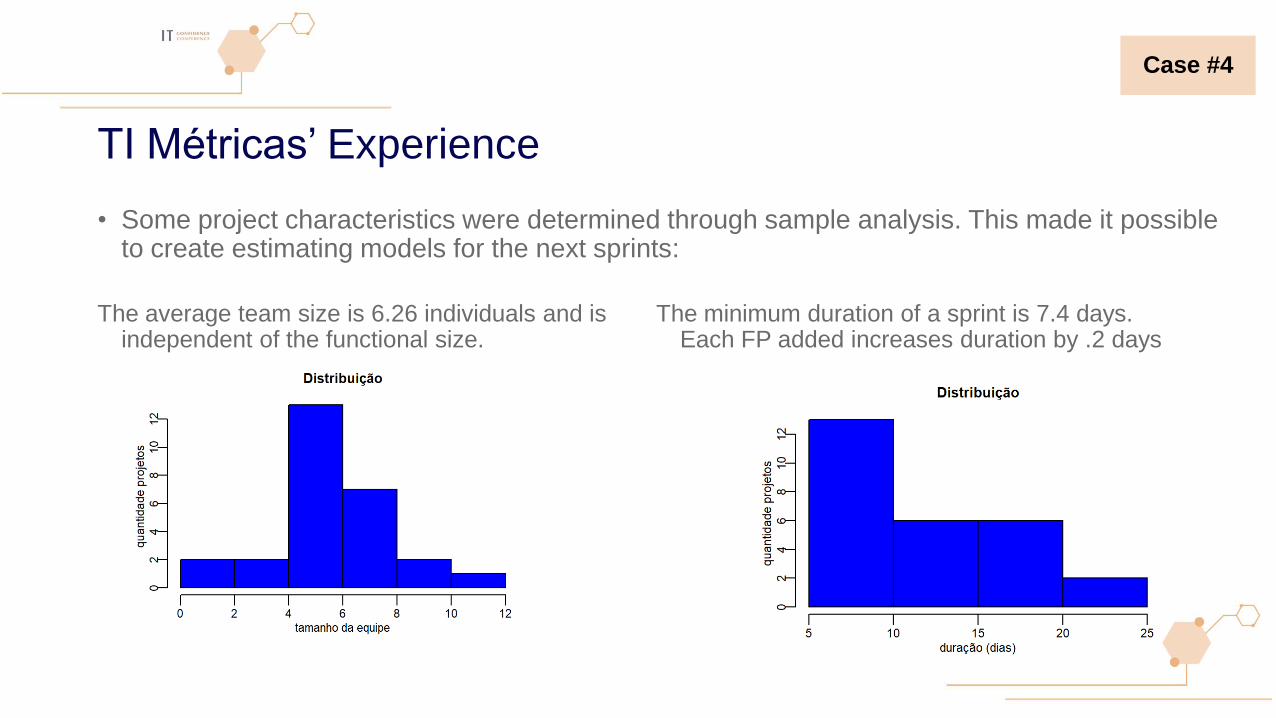
• Some project characteristics were determined through sample analysis. This made it possible to create estimating models for the next sprints:
Case #4
The average team size is 6.26 individuals and is independent of the functional size.
The minimum duration of a sprint is 7.4 days. Each FP added increases duration by .2 days
TI Métricas’ Experience
• Because of the useful results obtained the client asked TI Métricas for a three-month extension of this work (currently in progress), where new project/sprint samples will be analyzed and new findings will support the IT governance area in the decision to extend the agile approach to more projects.
Case #4
TI Métricas’ Experience
• Client from the Finance industry (Government)
• Development of a mobile front-end,
• One agile team applying Scrum concepts,
• Sprint duration varying between 2 and 4 weeks.
• Software factory compensation based on FPs at the end of each sprint
• Inputs obtained from Use Cases
Case #5
TI Métricas’ Experience
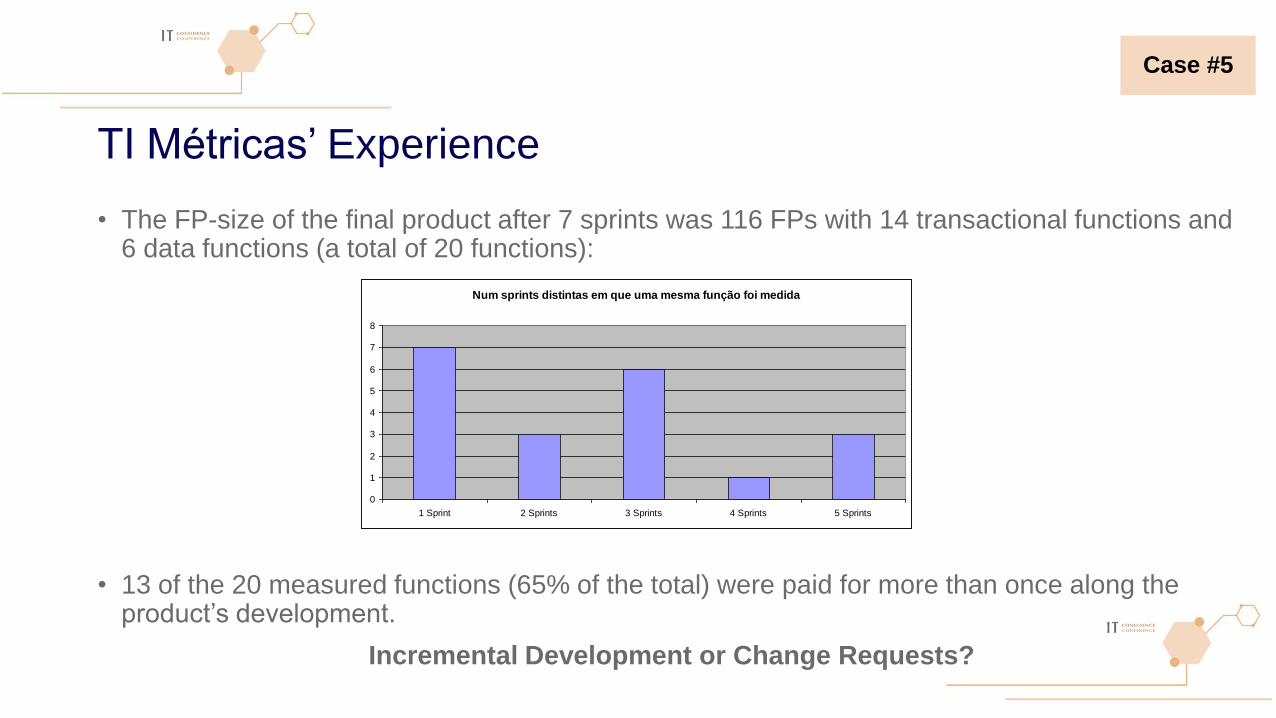
• The FP-size of the final product after 7 sprints was 116 FPs with 14 transactional functions and 6 data functions (a total of 20 functions):
• 13 of the 20 measured functions (65% of the total) were paid for more than once along the product’s development.
Incremental Development or Change Requests?
Case #5
Num sprints distintas em que uma mesma função foi medida
0
1
2
3
4
5
6
7
8
1 Sprint 2 Sprints 3 Sprints 4 Sprints 5 Sprints
TI Métricas’ Experience
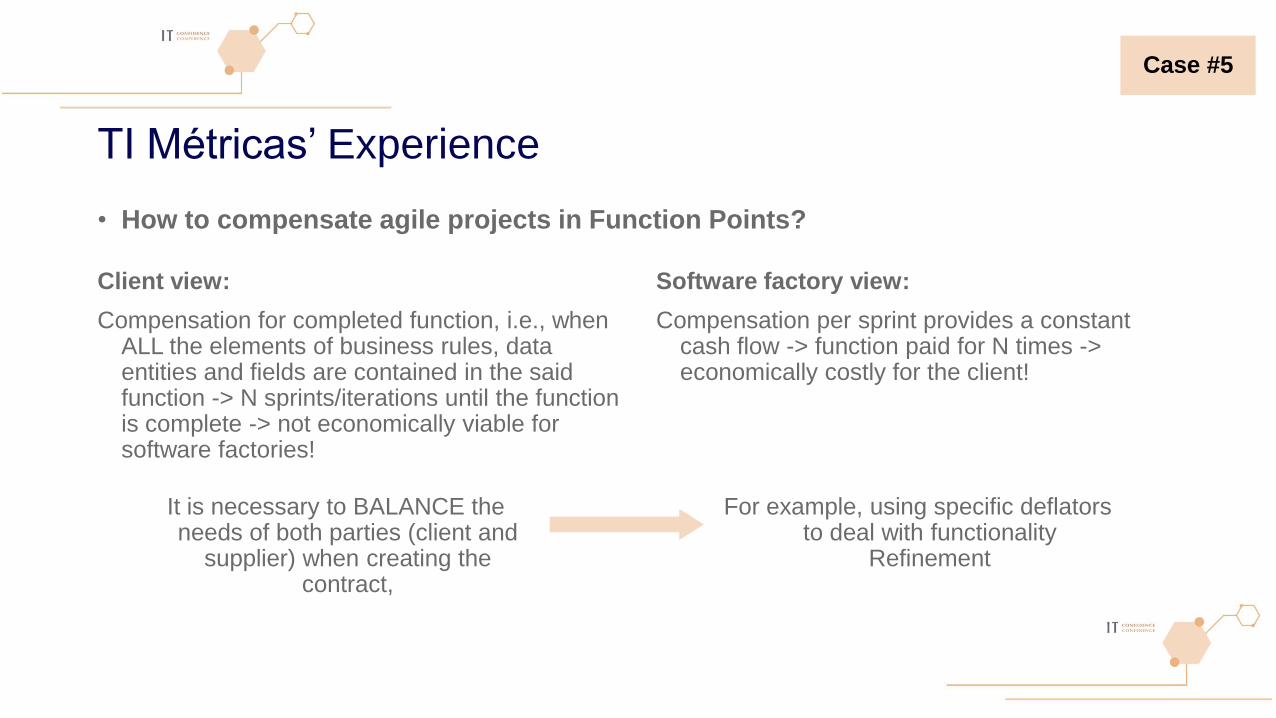
• How to compensate agile projects in Function Points?
Client view:
Compensation for completed function, i.e., when ALL the elements of business rules, data entities and fields are contained in the said function -> N sprints/iterations until the function is complete -> not economically viable for software factories!
Software factory view:
Compensation per sprint provides a constant cash flow -> function paid for N times -> economically costly for the client!
It is necessary to BALANCE the needs of both parties (client and
supplier) when creating the contract,
For example, using specific deflators to deal with functionality
Refinement
Case #5
TI Métricas’ Experience
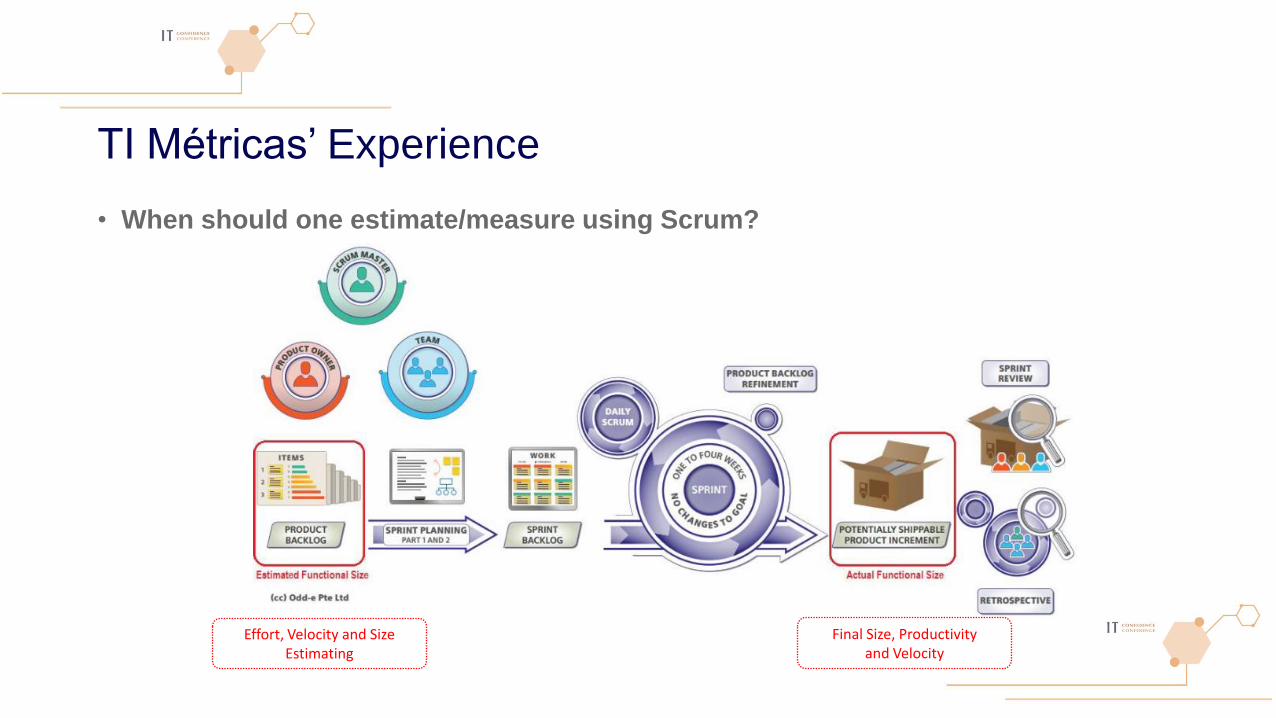
• When should one estimate/measure using Scrum?
Final Size, Productivity and Velocity
Effort, Velocity and Size Estimating
TI Métricas’ Experience
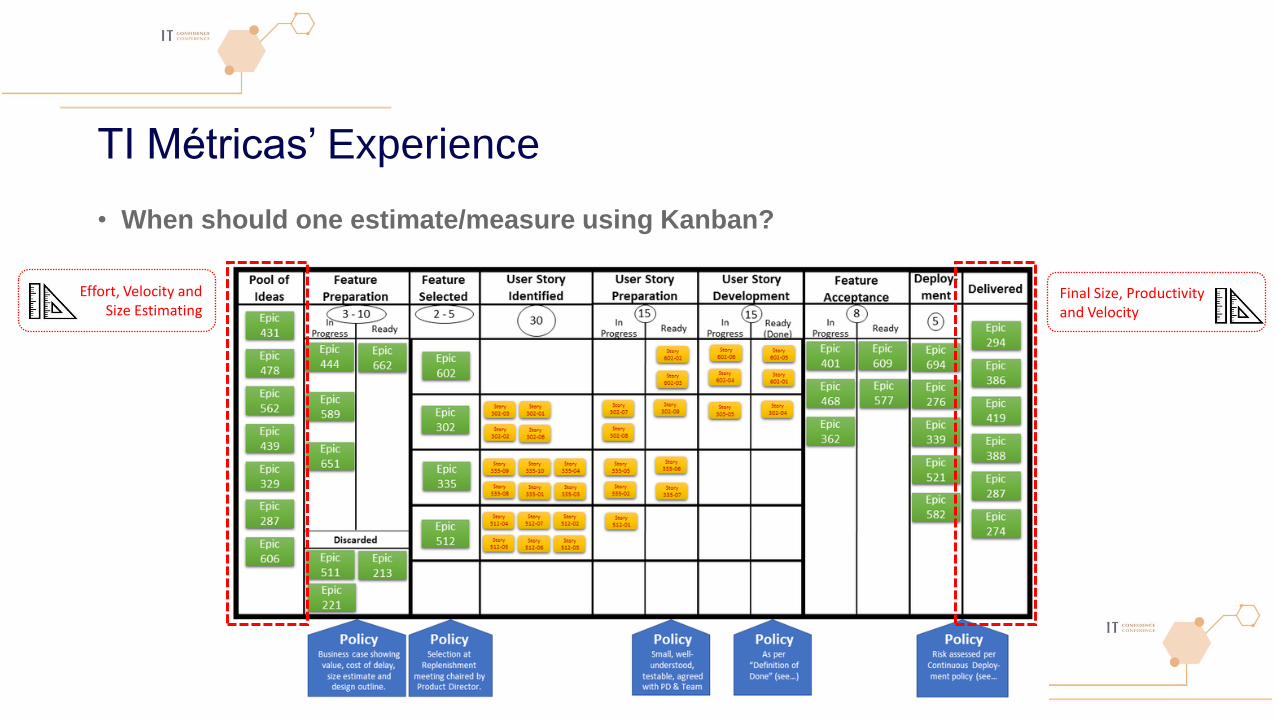
• When should one estimate/measure using Kanban?
Final Size, Productivity and Velocity
Effort, Velocity and Size Estimating
What about 2018 year?
• Cases #1 & #2 Clients from the Finance industry – Continuous services: supplier proposal analysis and 2018 performance assessment to define delivery goals for 2019
• Case #3 Client from the Insurance industry – Improvement actions based on the analysis of productivity indicators, velocity, sprint complexity, defects and the ability to respond to user functional requirements evolution
• Case #4 Client from the Finance industry – As of 1/2/2018 an organizational “Productivity” team was created to FP-measure all deliveries, track indicators (velocity, productivity, defects), maintain the historical database, and estimate productive capacity for 2019.
• Increasing number of requests from clients interested in demonstrating and communicating results obtained with agile methods in a standardized way (clients from telecom, entertainment, retail)


![FSM [Autosaved]](https://img.pdfslide.us/doc/110x75/577cda6c1a28ab9e78a5a27e/fsm-autosaved.jpg)