Embed Size (px)
Citation preview
Box 353020, William H. Gates Hall, 4293 Memorial Way Northeast, Seattle, WA 98195
Cannabis Law & Policy Project | www.law.washington.edu/Programs/Cannabis
1
March 25, 2016
Estimating Canopy Size for the Washington
Medical Marijuana Market
Prepared for the Washington State Liquor and Cannabis Board
Cannabis Law & Policy Project
University of Washington School of Law
Sean O’Connor, Boeing International Professor and Faculty Director, Cannabis Law & Policy
Project
Sam Mendez, Executive Director, Cannabis Law & Policy Project
Contributing Authors Ada Danelo
Harry Fukano
Kyle Johnson
Chad Law
Daniel Shortt
Special Consultant
Dr. Nephi Stella, Ph.D., Stella Lab, University of Washington School of Medicine
Box 353020, William H. Gates Hall, 4293 Memorial Way Northeast, Seattle, WA 98195
Cannabis Law & Policy Project | www.law.washington.edu/Programs/Cannabis
2
I. EXECUTIVE SUMMARY
A. Research Charge
The Washington State Liquor and Cannabis Board (“WSLCB”) tasked the Cannabis Law
& Policy Project (“CLPP”) with quantifying the grow canopy1 required to supply the legitimate
medical marijuana market (“MMJ market”) in Washington State in anticipation of the
restructuring of MMJ under the WSLCB I-502 licensing system. Under recent legislation,2 MMJ
dispensaries are required to obtain a license from WSLCB or cease operations by July 1, 2016.
At the same time, the producers and processors that supply the dispensaries that choose to stay in
operation under WSLCB licenses must themselves be licensed. To date, WSLCB has granted
producer licenses that amount to an upper limit of ten million square feet (10M sq. ft.) of grow
canopy, with potentially more to be granted soon. In order to determine whether and how much
more grow canopy to license, WSLCB arranged for CLPP to perform independent research on
how much grow canopy would likely be required to adequately supply the ongoing MMJ market.
This report summarizes our findings (the “Report”).
B. Relation to BOTEC Report
Separate from its arrangement with CLPP, WSLCB tasked BOTEC Analysis Corp. with
estimating the size of the overall retail MMJ market in Washington State. BOTEC’s report was
submitted in December, 2015 (the “BOTEC Report”).3 The BOTEC Report did not, and was not
intended to, estimate the grow canopy required to supply the ongoing MMJ market in
Washington State. We consulted the BOTEC Report with regard to its estimate of the number of
dispensaries in Washington State, and used that estimate as one input into our independent
research on dispensaries in order to construct estimates of how much MMJ product is needed to
supply those dispensaries as of the date of our Report. In turn, that estimate of MMJ product
needed informed our estimated calculations of the grow canopy required to adequately supply
the MMJ market going forward.
C. Background and Methodology
Up until the recent legislation, the MMJ market was sparsely regulated. Dispensaries and
collective gardens were required to obtain regular business licenses, pay standard business and
occupation taxes, and otherwise comply with general business regulations in Washington State.
But there were no industry-specific regulations, licensing, or taxes for MMJ. In particular,
Washington State did not regulate how MMJ was grown, processed, obtained, or sold. This
1 “Canopy” is defined in WAC 314-55-010 as “the square footage dedicated to live plant production, such as maintaining mother
plants, propagating plants from seed to plant tissue, clones, vegetative or flowering area. Plant canopy does not include areas
such as space used for the storage of fertilizers, pesticides, or other products, quarantine, office space, etc.” 2 In June 2015, The Washington Legislature passed HB 2136 and SB 5052, which changed the regulatory structure of MMJ by
transferring it into WSLCB’s I-502 licensing system. 3 BOTEC Analysis Corp., Estimating the Size of the Medical Cannabis Market in Washington State (Dec. 15, 2015) available at
www.lcb.wa.gov/publications/Marijuana/BOTEC%20reports/BOTEC-MMJ-Report.pdf.
Box 353020, William H. Gates Hall, 4293 Memorial Way Northeast, Seattle, WA 98195
Cannabis Law & Policy Project | www.law.washington.edu/Programs/Cannabis
3
meant that there was very little official data on the size and workings of the MMJ market in
Washington State.
Accordingly, CLPP undertook to reach out directly to this “gray” market in order to
produce an estimate of MMJ grow canopy required to supply the MMJ market based on figures
of product supplied to dispensaries and collective gardens given by individuals who work at
those facilities. This estimate of supplied product was then used to extrapolate back up the
supply chain to estimate how much grow canopy is required to produce this supply.
CLPP met with WSLCB and provided a strategy plan (attached hereto as Exhibit A)
whereby CLPP would execute the following research approaches: (1) direct contact, gathering
data by reaching out to all identifiable dispensaries and collective gardens (identified through
online lists such as leafly.com); (2) tax data, estimating canopy based on business & occupation
tax data publicly available from the Washington State Department of Revenue (“DOR”); and (3)
online survey, gathering data by posting a survey online and requesting dispensaries to complete
it. A fourth approach, reaching out to counties with public records requests, was also executed,
but no useful data was obtained. Nonetheless, that approach is also included in this report.
In performing our research, we relied on three possible dispensary counts, as well as our
survey findings of average sales, as the basis for an estimation of MMJ market size. We then
produced ranges of data based on marijuana price and estimated market share. Finally, we took
these data ranges and applied them to figures of equivalency (how much marijuana it would take
to produce edibles and concentrates) and canopy yield (how much marijuana is yielded per
square foot), in order to produce the estimate below. We also surveyed dispensaries to ask the
grow canopy they provided themselves, but this appeared to be unreliable and at any rate too
small of a percentage of overall MMJ supply to be useful. Most of the product sold at
dispensaries is derived from marijuana grown elsewhere.
D. Summary of Findings and Qualifications
CLPP estimates that the grow canopy needed to supply the existing MMJ market in
Washington State is between about 1.7 million and 2 million square feet, or an average of
1.85 million square feet (including both indoor and outdoor as described in more detail
below) for all marijuana sales at dispensaries, including sales of marijuana flower, edibles,
and concentrates. These figures are based on the calculations below which rely on a range of
sources.
It should be noted that the figures in this Report are intended as a broad estimate, and the
data is hampered by the lightly regulated nature of the current MMJ market. Surveying is by
nature a science of estimation. It is difficult, if not impossible, to know exactly how many
dispensaries there are in Washington State, or to verify the numbers provided to us by
dispensaries. Nearly all of the calculations in this Report require some measure of estimation, so
we recommend that our conclusion not be seen as a hard conclusion but rather as a broad
estimate.
Given these qualifications, we believe that our conclusion is reliable. WSLCB will
ultimately decide whether its current licensure of 10 million square feet of canopy, with
potentially more to be licensed in the near future, is sufficient for the demands of the MMJ

Box 353020, William H. Gates Hall, 4293 Memorial Way Northeast, Seattle, WA 98195
Cannabis Law & Policy Project | www.law.washington.edu/Programs/Cannabis
4
market. The BOTEC Report estimated that the overall marijuana market was divided into even
thirds for MMJ, recreational, and illicit. Because we estimate that an upper range of 2 million
square feet grow canopy is sufficient to supply the current MMJ market, and adopting BOTEC’s
estimate of market shares, we are inclined to believe that WSLCB’s current grow canopy license
limits are sufficient to supply both the recreational and MMJ markets, but we defer to WSLCB to
make that final determination.
II: PRIMARY RESEARCH APPROACH: DIRECT PHONE SURVEY
A. Overview
The central focus of this Report is the phone survey that was conducted in January and
February of 2016, in which a list of 467 potential dispensaries across Washington were
contacted, 273 of which are believed to be actual dispensaries. This list was compiled using the
databases provided publicly by leafly.com, weedmaps.com, and headshopfinder.com (accessed
for a fee). Each of these websites were manually accessed by the authors, who recorded each
dispensary found on the applicable map or list for Washington.
All 467 potential dispensaries were contacted, and about 100 follow-up calls were made
as an additional attempt, due to being told the party was busy at the time or for some other
reason. Measures were taken to eliminate duplicates. Once all were called, the list was divided
into 4 categories: (1) Complete, meaning they participated and provided data; (2) Delivery,
meaning these were delivery businesses and thus not interviewed, but are still counted in the list
of dispensaries because they still serve a customer base; (3) Refused to answer, meaning they
chose not to participate but are still counted in the list of dispensaries because it is believed they
are a dispensary, and (4) N/A, meaning the number was disconnected, a wrong number, or some
other reason in which there was no reason to believe that the contact was a dispensary. The four
categories amounted to the following:
● Complete: 117
● Delivery: 18
● Refused to answer: 138
● N/A: 193
All told, we found 273 dispensaries that had reasonable belief of current or recent
operation for purposes of assessing medical marijuana market demand. This number could be
accurate, but suffers from two hindrances: (1) it is believed that many dispensaries have closed in
recent months, even in the time between this report and BOTEC’s report; and (2) we simply
might have missed operating dispensaries, either that were not tracked by the three websites
relied upon, or that fell into the “N/A” category.
DOR provides public tax data (examined in more detail below) for dispensaries that are
taxed in Washington, and this information yields a count of 462 dispensaries.4 This number
4 The 467 count is based on the DOR’s “Medical Marijuana Tax Table” accessed in March 2016, available at
www.dor.wa.gov/content/aboutus/statisticsandreports/stats_mmjtaxes.aspx.
Box 353020, William H. Gates Hall, 4293 Memorial Way Northeast, Seattle, WA 98195
Cannabis Law & Policy Project | www.law.washington.edu/Programs/Cannabis
5
could be omitting dispensaries that have not reported themselves to the DOR, and it also might
be including dispensaries that no longer operate. Still, it is a count that is worth including in our
calculations.
Because it is nearly impossible to know the exact number of operating dispensaries in
Washington, particularly since that number is in flux, we believe it prudent to offer a range of
potential conclusions, including the three different dispensary counts: ours (273) BOTEC’s
(403), and the DOR’s (462). For purposes of simplicity, future calculations based on these counts
will be in that order.
BOTEC made two estimates of dispensary quantity in their report: one of 331 “verified”
operations and one of 403 “unverified” operations. BOTEC explained that “verified”
dispensaries were believed to have operated (meaning, been in business) in the previous 12
months, while “unverified” included dispensaries that had no such indication. BOTEC believed
(and we agree) that many dispensaries have likely closed in the months following the HB 2136
and SB 5052 reforms, thus estimating the medical marijuana market in its current state might be
underestimating what true medical marijuana demand is. Therefore, we relied upon the
“unverified” count of 403 operations, which reflects an estimate of medical market demand prior
to the likely recent rash of closures.
Dispensaries were asked the following questions:
● Do you grow your own marijuana?
● If no, where do you receive marijuana?
● If yes, what is the amount of square footage you allocate to growing marijuana?
● What is the average price per gram for usable marijuana (to processors/consumers)?
● Do you donate product?
● If so, how much marijuana do you donate to patients (pounds, grams, etc.)?
● How much marijuana do you sell per month (pounds, grams, etc.)?
● Yield: What is your yield (in weight) per year?5
● How many harvests, how much per harvest?5
● What proportion of your sales are flower, edibles, tinctures, concentrates?5
● What is the average price for edibles?5
● What is the average price for tinctures?5
● What is the average price for concentrates?5
B. Phone Survey Analysis
1. Flower Estimated
There were 44 responses to the question, “How much marijuana do you sell per month
(pounds, grams, etc.)?” which produced an average of 9.55 pounds of marijuana flower6 sold per
month per dispensary, with a standard deviation of 9.06. Thus, based on our potential dispensary
counts, we estimate the following:
5 These questions were added in early February and thus not all dispensaries were asked. Still, we received sufficient results for
them to make credible conclusions. 6 Flower meaning, product that is pure marijuana and not sold in other form such as edibles, oil, etc.
Box 353020, William H. Gates Hall, 4293 Memorial Way Northeast, Seattle, WA 98195
Cannabis Law & Policy Project | www.law.washington.edu/Programs/Cannabis
6
Dispensary Estimate Average Monthly Sales (lbs) Average Yearly Sales (lbs)
273 (CLPP) 2,607.15 31,285.8
403 (BOTEC) 3,848.65 46,183.8
462 (DOR) 4412.1 52,945.2
Average Sales (among all
three dispensary estimates): 3622.63 43,471.6
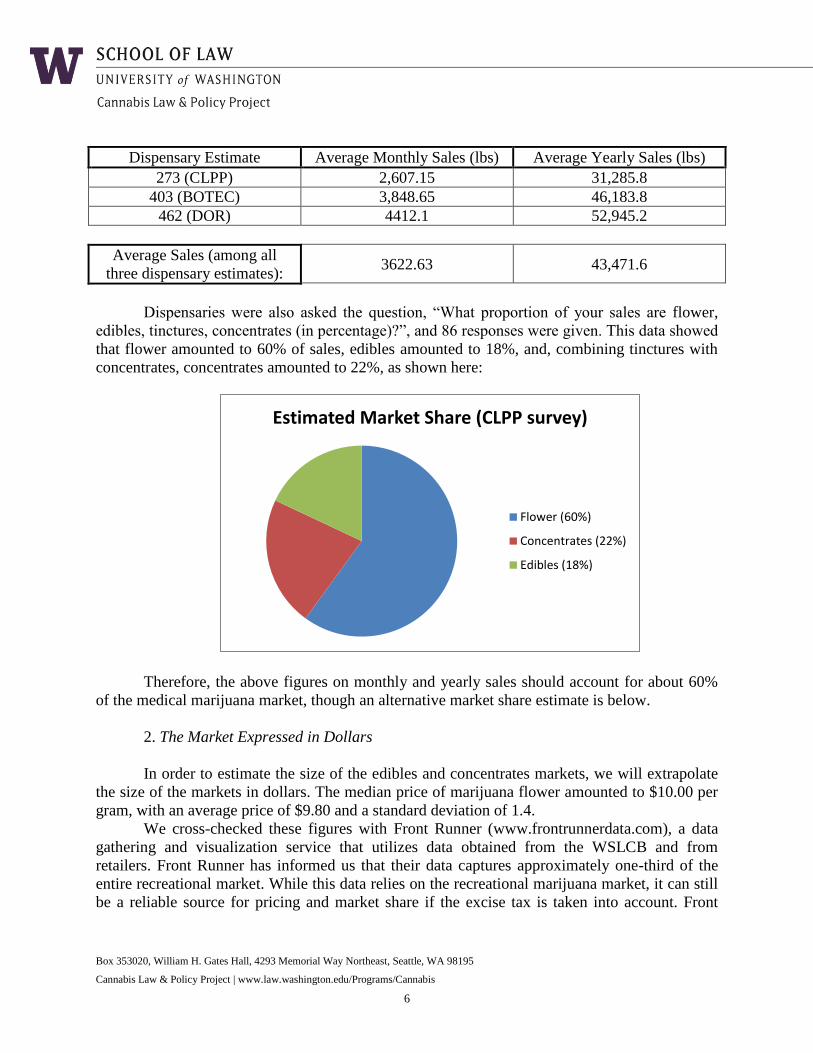
Dispensaries were also asked the question, “What proportion of your sales are flower,
edibles, tinctures, concentrates (in percentage)?”, and 86 responses were given. This data showed
that flower amounted to 60% of sales, edibles amounted to 18%, and, combining tinctures with
concentrates, concentrates amounted to 22%, as shown here:
Therefore, the above figures on monthly and yearly sales should account for about 60%
of the medical marijuana market, though an alternative market share estimate is below.
2. The Market Expressed in Dollars
In order to estimate the size of the edibles and concentrates markets, we will extrapolate
the size of the markets in dollars. The median price of marijuana flower amounted to $10.00 per
gram, with an average price of $9.80 and a standard deviation of 1.4.
We cross-checked these figures with Front Runner (www.frontrunnerdata.com), a data
gathering and visualization service that utilizes data obtained from the WSLCB and from
retailers. Front Runner has informed us that their data captures approximately one-third of the
entire recreational market. While this data relies on the recreational marijuana market, it can still
be a reliable source for pricing and market share if the excise tax is taken into account. Front
Estimated Market Share (CLPP survey)
Flower (60%)
Concentrates (22%)
Edibles (18%)
Box 353020, William H. Gates Hall, 4293 Memorial Way Northeast, Seattle, WA 98195
Cannabis Law & Policy Project | www.law.washington.edu/Programs/Cannabis
7
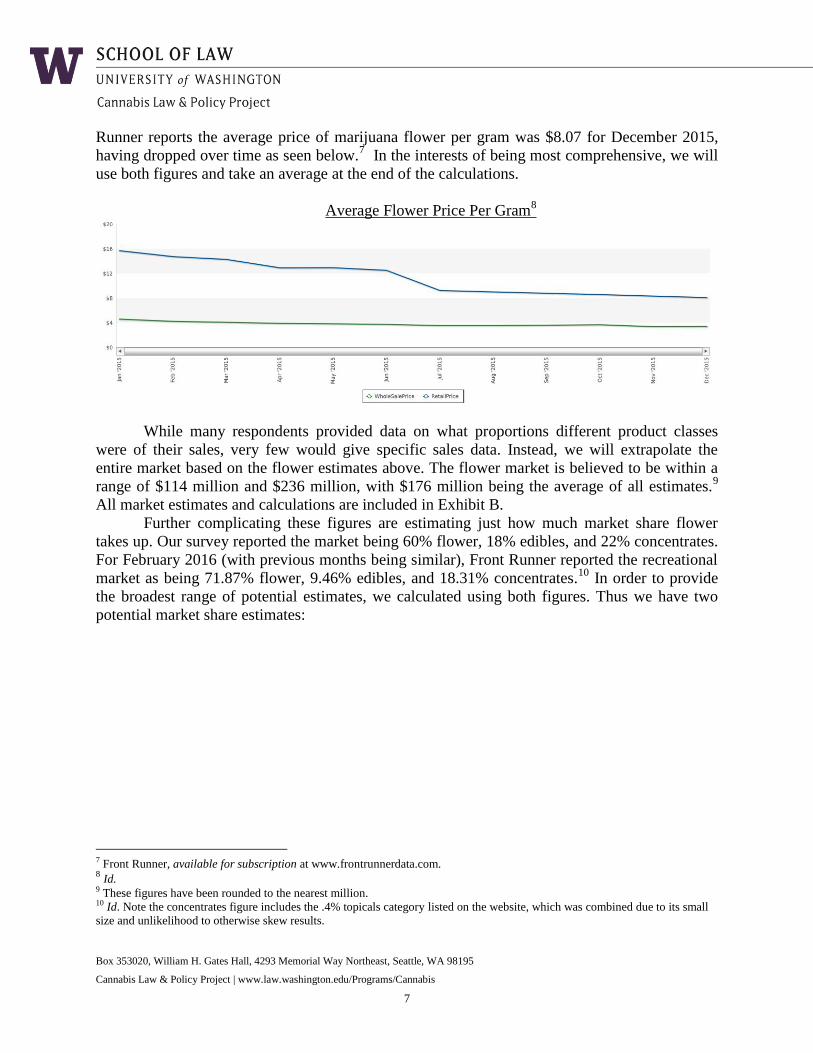
Runner reports the average price of marijuana flower per gram was $8.07 for December 2015,
having dropped over time as seen below.7 In the interests of being most comprehensive, we will
use both figures and take an average at the end of the calculations.
Average Flower Price Per Gram8
While many respondents provided data on what proportions different product classes
were of their sales, very few would give specific sales data. Instead, we will extrapolate the
entire market based on the flower estimates above. The flower market is believed to be within a
range of $114 million and $236 million, with $176 million being the average of all estimates.9
All market estimates and calculations are included in Exhibit B.
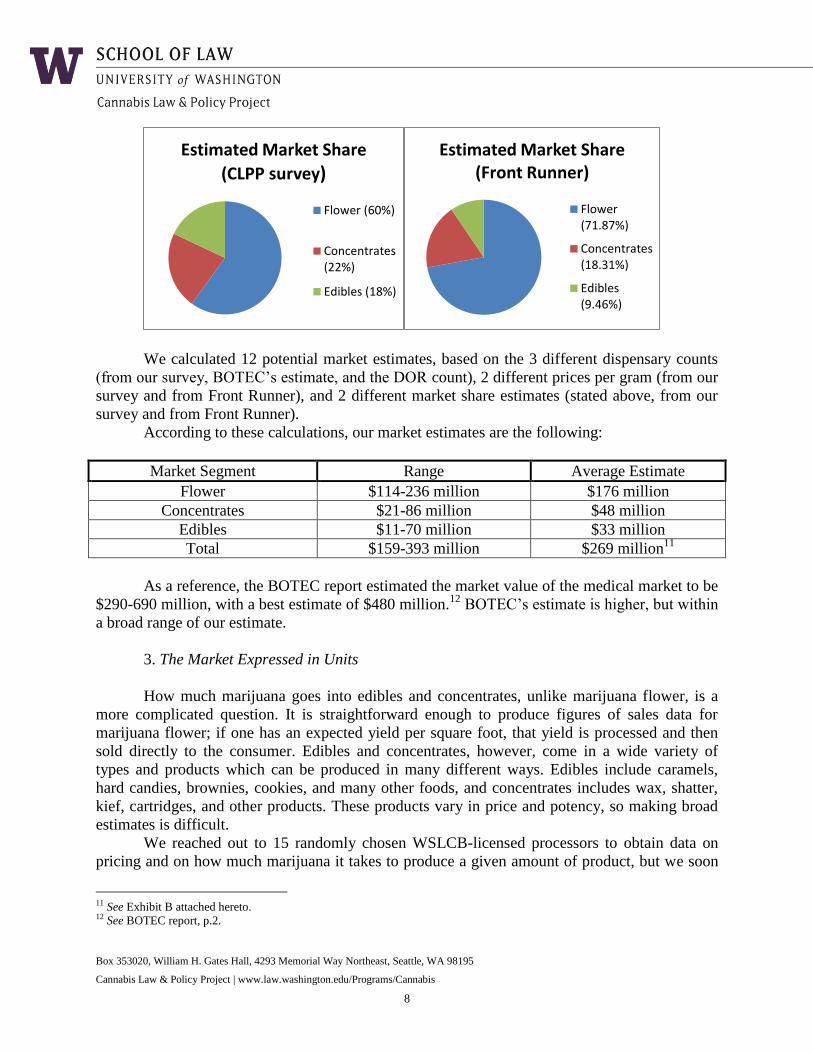
Further complicating these figures are estimating just how much market share flower
takes up. Our survey reported the market being 60% flower, 18% edibles, and 22% concentrates.
For February 2016 (with previous months being similar), Front Runner reported the recreational
market as being 71.87% flower, 9.46% edibles, and 18.31% concentrates.10
In order to provide
the broadest range of potential estimates, we calculated using both figures. Thus we have two
potential market share estimates:
7 Front Runner, available for subscription at www.frontrunnerdata.com. 8 Id.
9 These figures have been rounded to the nearest million. 10 Id. Note the concentrates figure includes the .4% topicals category listed on the website, which was combined due to its small
size and unlikelihood to otherwise skew results.
Box 353020, William H. Gates Hall, 4293 Memorial Way Northeast, Seattle, WA 98195
Cannabis Law & Policy Project | www.law.washington.edu/Programs/Cannabis
8
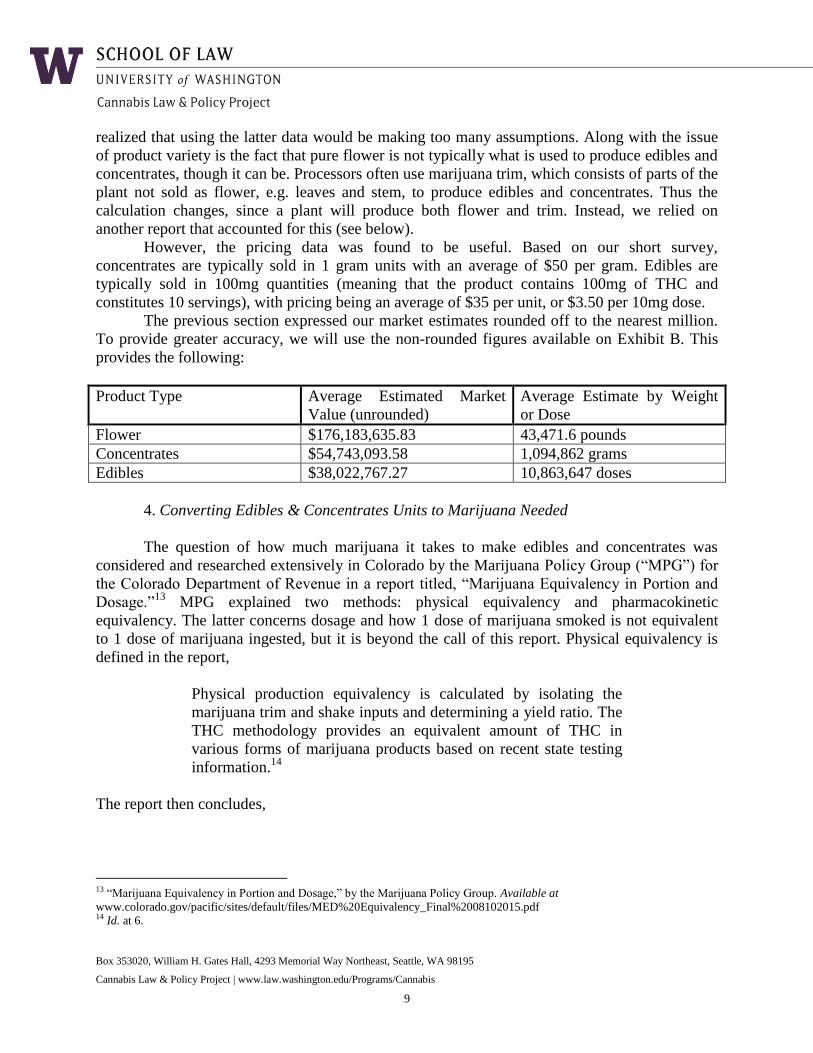
We calculated 12 potential market estimates, based on the 3 different dispensary counts
(from our survey, BOTEC’s estimate, and the DOR count), 2 different prices per gram (from our
survey and from Front Runner), and 2 different market share estimates (stated above, from our
survey and from Front Runner).
According to these calculations, our market estimates are the following:
Market Segment Range Average Estimate
Flower $114-236 million $176 million
Concentrates $21-86 million $48 million
Edibles $11-70 million $33 million
Total $159-393 million $269 million11
As a reference, the BOTEC report estimated the market value of the medical market to be
$290-690 million, with a best estimate of $480 million.12
BOTEC’s estimate is higher, but within
a broad range of our estimate.
3. The Market Expressed in Units
How much marijuana goes into edibles and concentrates, unlike marijuana flower, is a
more complicated question. It is straightforward enough to produce figures of sales data for
marijuana flower; if one has an expected yield per square foot, that yield is processed and then
sold directly to the consumer. Edibles and concentrates, however, come in a wide variety of
types and products which can be produced in many different ways. Edibles include caramels,
hard candies, brownies, cookies, and many other foods, and concentrates includes wax, shatter,
kief, cartridges, and other products. These products vary in price and potency, so making broad
estimates is difficult.
We reached out to 15 randomly chosen WSLCB-licensed processors to obtain data on
pricing and on how much marijuana it takes to produce a given amount of product, but we soon
11 See Exhibit B attached hereto. 12 See BOTEC report, p.2.
Estimated Market Share
(CLPP survey)
Flower (60%)
Concentrates(22%)
Edibles (18%)
Estimated Market Share (Front Runner)
Flower(71.87%)
Concentrates(18.31%)
Edibles(9.46%)
Box 353020, William H. Gates Hall, 4293 Memorial Way Northeast, Seattle, WA 98195
Cannabis Law & Policy Project | www.law.washington.edu/Programs/Cannabis
9
realized that using the latter data would be making too many assumptions. Along with the issue
of product variety is the fact that pure flower is not typically what is used to produce edibles and
concentrates, though it can be. Processors often use marijuana trim, which consists of parts of the
plant not sold as flower, e.g. leaves and stem, to produce edibles and concentrates. Thus the
calculation changes, since a plant will produce both flower and trim. Instead, we relied on
another report that accounted for this (see below).
However, the pricing data was found to be useful. Based on our short survey,
concentrates are typically sold in 1 gram units with an average of $50 per gram. Edibles are
typically sold in 100mg quantities (meaning that the product contains 100mg of THC and
constitutes 10 servings), with pricing being an average of $35 per unit, or $3.50 per 10mg dose.
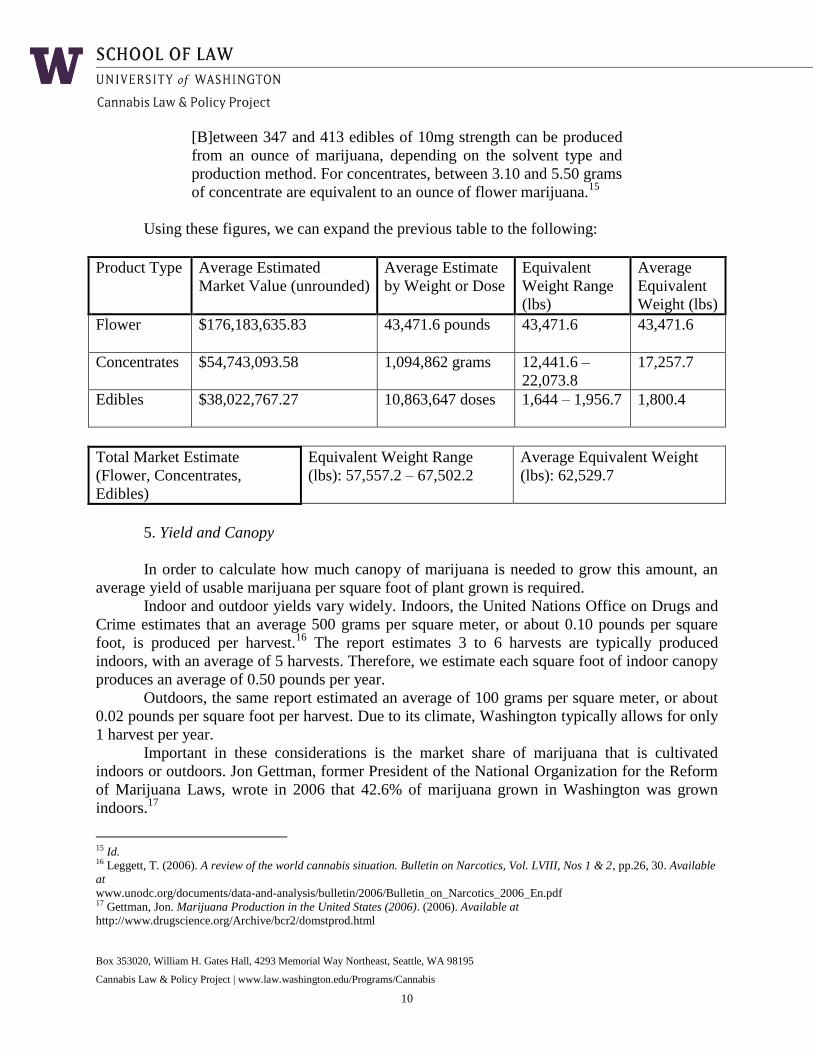
The previous section expressed our market estimates rounded off to the nearest million.
To provide greater accuracy, we will use the non-rounded figures available on Exhibit B. This
provides the following:
Product Type Average Estimated Market
Value (unrounded)
Average Estimate by Weight
or Dose
Flower $176,183,635.83 43,471.6 pounds
Concentrates $54,743,093.58 1,094,862 grams
Edibles $38,022,767.27 10,863,647 doses
4. Converting Edibles & Concentrates Units to Marijuana Needed
The question of how much marijuana it takes to make edibles and concentrates was
considered and researched extensively in Colorado by the Marijuana Policy Group (“MPG”) for
the Colorado Department of Revenue in a report titled, “Marijuana Equivalency in Portion and
Dosage.”13
MPG explained two methods: physical equivalency and pharmacokinetic
equivalency. The latter concerns dosage and how 1 dose of marijuana smoked is not equivalent
to 1 dose of marijuana ingested, but it is beyond the call of this report. Physical equivalency is
defined in the report,
Physical production equivalency is calculated by isolating the
marijuana trim and shake inputs and determining a yield ratio. The
THC methodology provides an equivalent amount of THC in
various forms of marijuana products based on recent state testing
information.14
The report then concludes,
13 “Marijuana Equivalency in Portion and Dosage,” by the Marijuana Policy Group. Available at
www.colorado.gov/pacific/sites/default/files/MED%20Equivalency_Final%2008102015.pdf 14 Id. at 6.
Box 353020, William H. Gates Hall, 4293 Memorial Way Northeast, Seattle, WA 98195
Cannabis Law & Policy Project | www.law.washington.edu/Programs/Cannabis
10
[B]etween 347 and 413 edibles of 10mg strength can be produced
from an ounce of marijuana, depending on the solvent type and
production method. For concentrates, between 3.10 and 5.50 grams
of concentrate are equivalent to an ounce of flower marijuana.15
Using these figures, we can expand the previous table to the following:
Product Type Average Estimated
Market Value (unrounded)
Average Estimate
by Weight or Dose
Equivalent
Weight Range
(lbs)
Average
Equivalent
Weight (lbs)
Flower
$176,183,635.83 43,471.6 pounds 43,471.6 43,471.6
Concentrates $54,743,093.58 1,094,862 grams 12,441.6 –
22,073.8
17,257.7
Edibles
$38,022,767.27 10,863,647 doses 1,644 – 1,956.7 1,800.4
Total Market Estimate
(Flower, Concentrates,
Edibles)
Equivalent Weight Range
(lbs): 57,557.2 – 67,502.2
Average Equivalent Weight
(lbs): 62,529.7
5. Yield and Canopy
In order to calculate how much canopy of marijuana is needed to grow this amount, an
average yield of usable marijuana per square foot of plant grown is required.
Indoor and outdoor yields vary widely. Indoors, the United Nations Office on Drugs and
Crime estimates that an average 500 grams per square meter, or about 0.10 pounds per square
foot, is produced per harvest.16
The report estimates 3 to 6 harvests are typically produced
indoors, with an average of 5 harvests. Therefore, we estimate each square foot of indoor canopy
produces an average of 0.50 pounds per year.
Outdoors, the same report estimated an average of 100 grams per square meter, or about
0.02 pounds per square foot per harvest. Due to its climate, Washington typically allows for only
1 harvest per year.
Important in these considerations is the market share of marijuana that is cultivated
indoors or outdoors. Jon Gettman, former President of the National Organization for the Reform
of Marijuana Laws, wrote in 2006 that 42.6% of marijuana grown in Washington was grown
indoors.17
15 Id. 16 Leggett, T. (2006). A review of the world cannabis situation. Bulletin on Narcotics, Vol. LVIII, Nos 1 & 2, pp.26, 30. Available
at
www.unodc.org/documents/data-and-analysis/bulletin/2006/Bulletin_on_Narcotics_2006_En.pdf 17 Gettman, Jon. Marijuana Production in the United States (2006). (2006). Available at
http://www.drugscience.org/Archive/bcr2/domstprod.html
Box 353020, William H. Gates Hall, 4293 Memorial Way Northeast, Seattle, WA 98195
Cannabis Law & Policy Project | www.law.washington.edu/Programs/Cannabis
11
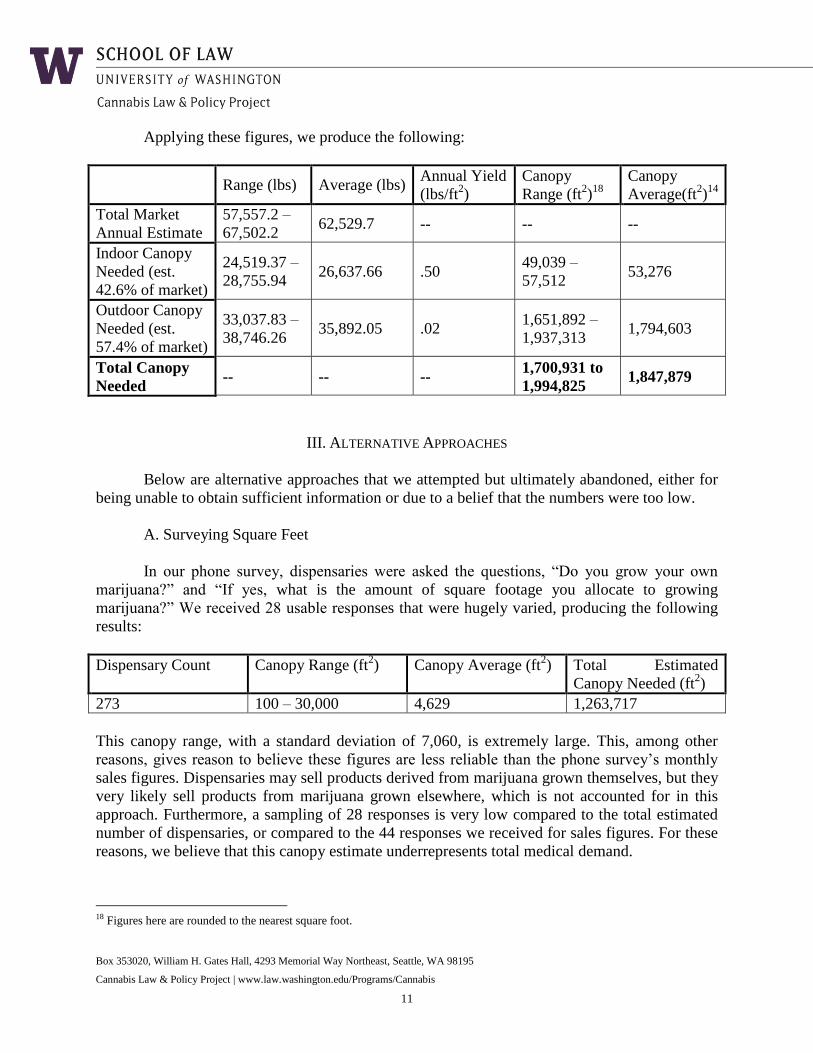
Applying these figures, we produce the following:
Range (lbs) Average (lbs)
Annual Yield
(lbs/ft2)
Canopy
Range (ft2)
18
Canopy
Average(ft2)14
Total Market
Annual Estimate
57,557.2 –
67,502.2 62,529.7 -- -- --
Indoor Canopy
Needed (est.
42.6% of market)
24,519.37 –
28,755.94 26,637.66 .50
49,039 –
57,512 53,276
Outdoor Canopy
Needed (est.
57.4% of market)
33,037.83 –
38,746.26 35,892.05 .02
1,651,892 –
1,937,313 1,794,603
Total Canopy
Needed -- -- --
1,700,931 to
1,994,825 1,847,879
III. ALTERNATIVE APPROACHES
Below are alternative approaches that we attempted but ultimately abandoned, either for
being unable to obtain sufficient information or due to a belief that the numbers were too low.
A. Surveying Square Feet
In our phone survey, dispensaries were asked the questions, “Do you grow your own
marijuana?” and “If yes, what is the amount of square footage you allocate to growing
marijuana?” We received 28 usable responses that were hugely varied, producing the following
results:
Dispensary Count Canopy Range (ft2) Canopy Average (ft
2) Total Estimated
Canopy Needed (ft2)
273 100 – 30,000 4,629 1,263,717
This canopy range, with a standard deviation of 7,060, is extremely large. This, among other
reasons, gives reason to believe these figures are less reliable than the phone survey’s monthly
sales figures. Dispensaries may sell products derived from marijuana grown themselves, but they
very likely sell products from marijuana grown elsewhere, which is not accounted for in this
approach. Furthermore, a sampling of 28 responses is very low compared to the total estimated
number of dispensaries, or compared to the 44 responses we received for sales figures. For these
reasons, we believe that this canopy estimate underrepresents total medical demand.
18 Figures here are rounded to the nearest square foot.
Box 353020, William H. Gates Hall, 4293 Memorial Way Northeast, Seattle, WA 98195
Cannabis Law & Policy Project | www.law.washington.edu/Programs/Cannabis
12
B. Online Survey
We created an online survey that allowed dispensary and collective garden owners to
voluntarily provide us with information about their businesses. We used Google Forms to create
the survey, which allowed users to answer questions. We then compiled their answers in a
spreadsheet. We made the survey available on the CLPP blog,19
advertised it on Twitter, and sent
a mass email to parties that applied for recreational marijuana retail licenses from the WSLCB.20
Additionally, when we were making calls to dispensaries, we encouraged people to fill out the
survey if they did not feel comfortable answering questions over the phone. The following is the
list of questions in the survey:
● Are you associated with a medical marijuana dispensary or collective garden?
● If yes, what is the name of the dispensary or collective garden?
● What county is the dispensary/collective garden located in?
● Do you grow your own marijuana?
● If no, where do you receive marijuana?
● What is the amount of square footage you allocate to growing marijuana?
● What is your monthly yield of useable flower?
● What is the average price per gram for usable marijuana (to processors/consumers)?
● How much marijuana do you donate to patients (pounds, grams, etc.)?
● How much marijuana do you sell (pounds, grams, etc.)?
● Do you sell marijuana to other medical marijuana collective gardens or dispensaries
and if so, how much (pounds, grams, percentage)?
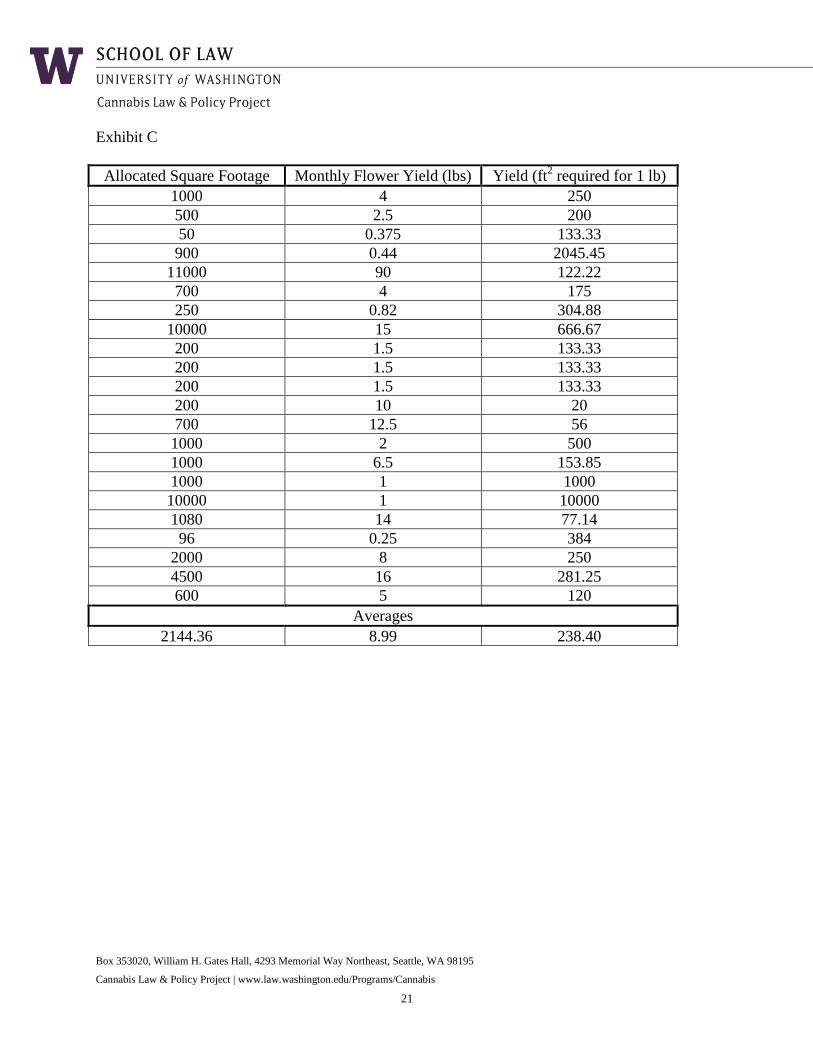
We received 51 responses to our survey. Of those, 29 provided us with information on
the amount of square footage allocated to growing marijuana.21
The range of the allocated space
was between 50 and 11,000 sq. ft., with an average of 1,830.9 sq. ft. per dispensary. 22 of the
respondents provided information on both the allocation of square footage and the monthly yield
of flower in pounds. From this we could extrapolate the amount of square footage required to
produce one pound of marijuana. The average of the ratios was 238.40 sq. ft. required to produce
a pound of marijuana per month. A table showing the complete data-set is attached as Exhibit C.
C. Taxes
For this strategy, the project relied on the reported revenue of medical marijuana from the
Department of Revenue’s (“DOR”) website. This figure was going to be divided by the average
prices for medical marijuana (divided by each market segment of flower, edibles, and
concentrates) to obtain an estimated weight amount for the state, which would then be calculated
into square footage, much like what was done above. There was to be some expected variance
given different products requiring different amounts of marijuana, uneven reporting
19 Available at: blogs.uw.edu/clpp/2015/12/26/clpps-medical-marijuana-survey. 20 Approximately 2000 parties were contacted. A second email was sent to another approximately 2000 parties that applied for
producer licences, but it is believed that none of these were received because Google’s gmail client automatically returned all of
them due to anti-spam policies. 21 One response listed “15 plants” and another listed “1 plant.”
Box 353020, William H. Gates Hall, 4293 Memorial Way Northeast, Seattle, WA 98195
Cannabis Law & Policy Project | www.law.washington.edu/Programs/Cannabis
13
requirements, potential for diversion, likelihood that all medical marijuana revenue is not derived
solely from flower/bud, etc.).
The DOR reported $109,239,149.00 in taxable retail sales of medical marijuana in
Washington for FY 2015. Given how much lower this amount was compared to even the lowest
range of calculations based on our survey, and how much lower it is compared to the figures in
the BOTEC report, we did not believe this figure was reliable, and thus abandoned the survey.
There is a strong likelihood that dispensaries were underreporting taxable sales to the DOR, and
there may be other reasons for this number being so low.
D. Public Records Requests
The project sent out public records requests to all counties in Washington. At the time
this report was published, only 4 counties responded with records, while 9 stated they were in
process. These records provided some use in cross-checking our list of dispensaries, but they
provided no data as to approximate sales or canopy. Because no usable data has been obtained
with this strategy, it has not been factored into the final calculations.22
IV. FINDINGS AND CONCLUSION
This Report provides information based on research conducted between September 2015
and March 2016. Key findings from our survey include:
● Estimated canopy needed for the state to satisfy the medical marijuana market:
Between 1.7 million and 2 million square feet, average 1.85 million square feet;
● Average price per gram: $9.80 (survey result) or $8.07 (Front Runner); median price per
gram: $10.00 (survey result);
● Average amount of marijuana sold per month in each dispensary: 9.55 pounds.
We find it reasonable to believe that 10 million square feet of canopy, the current
allotment set by the WSLCB for all licensed growers, is sufficient for Washington State’s
demand for both MMJ and recreational marijuana. This can be explained with more than one
approach.
Firstly, the BOTEC Report estimated the marijuana market in Washington State to
roughly be made up by one-third medical, one-third recreational, and one-third illicit markets,
and we find that estimate reasonable. Thus by simply multiplying our total estimate by three, one
could estimate the total grow canopy needed to be between 5.1 and 6 million square feet, well
below the current WSLCB 10 million square feet licensure limit. This also factors in the entirety
of the illicit market, and while it can be reduced, the illicit market will likely continue to exist in
some form for some time outside of regulated canopy.
Secondly, one can make a quick estimate of how much marijuana would be produced
with 10 million square feet of grow canopy. If we assume the Legget results on yield and the
22 The text used in the public record request was: “Records relating to medical marijuana (as distinct from retail marijuana)
retailers, processors, and/or producers, including collective gardens, in particular those records relating to location, amount of
products produced, canopy estimates (estimated size of growing area or number of plants), and value of marijuana products sold”
Box 353020, William H. Gates Hall, 4293 Memorial Way Northeast, Seattle, WA 98195
Cannabis Law & Policy Project | www.law.washington.edu/Programs/Cannabis
14
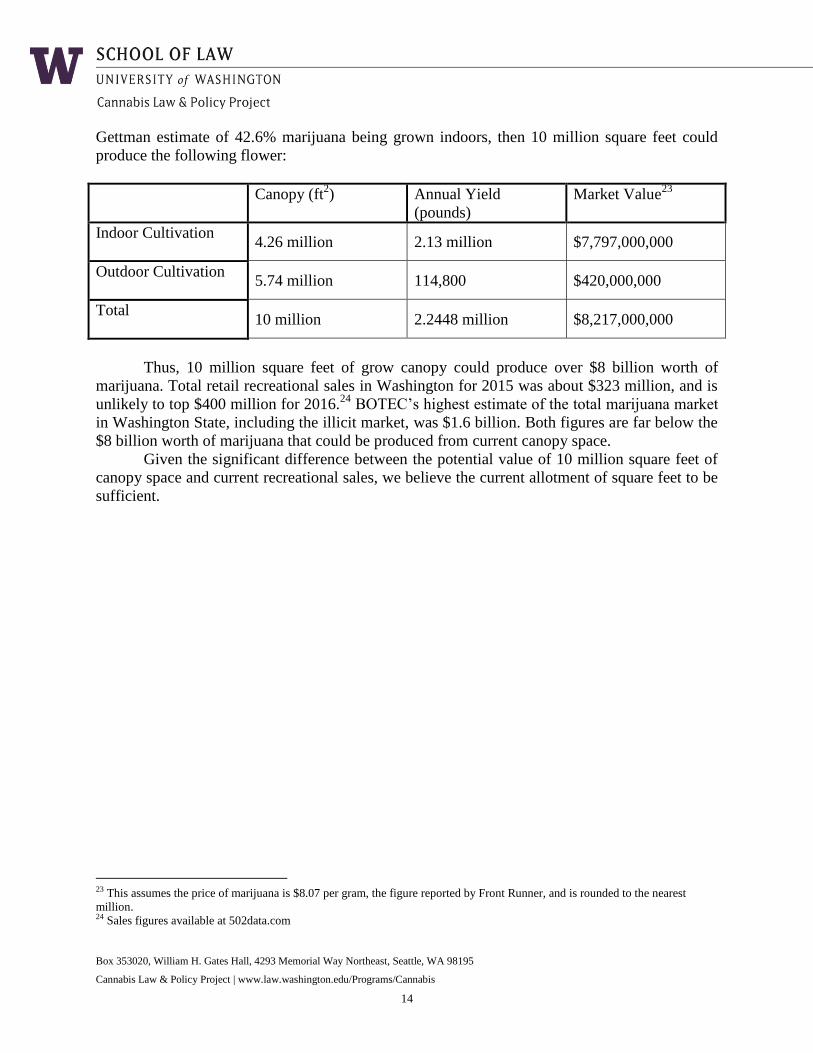
Gettman estimate of 42.6% marijuana being grown indoors, then 10 million square feet could
produce the following flower:
Canopy (ft2) Annual Yield
(pounds)
Market Value23
Indoor Cultivation
4.26 million 2.13 million $7,797,000,000
Outdoor Cultivation
5.74 million 114,800 $420,000,000
Total
10 million 2.2448 million $8,217,000,000
Thus, 10 million square feet of grow canopy could produce over $8 billion worth of
marijuana. Total retail recreational sales in Washington for 2015 was about $323 million, and is
unlikely to top $400 million for 2016.24
BOTEC’s highest estimate of the total marijuana market
in Washington State, including the illicit market, was $1.6 billion. Both figures are far below the
$8 billion worth of marijuana that could be produced from current canopy space.
Given the significant difference between the potential value of 10 million square feet of
canopy space and current recreational sales, we believe the current allotment of square feet to be
sufficient.
23 This assumes the price of marijuana is $8.07 per gram, the figure reported by Front Runner, and is rounded to the nearest
million. 24 Sales figures available at 502data.com
Box 353020, William H. Gates Hall, 4293 Memorial Way Northeast, Seattle, WA 98195
Cannabis Law & Policy Project | www.law.washington.edu/Programs/Cannabis
15
Exhibit A
Canopy Study – Quantifying Washington’s Medical Marijuana Needs
Plan Summary
Sam Mendez
Executive Director, Cannabis Law and Policy Project
The Washington Liquor and Cannabis Board (WSLCB) tasked the Cannabis Law and
Policy Project (CLPP) with researching how much space (also known as canopy) is required to
grow marijuana consumed for medical purposes in Washington. Given the unregulated nature of
medical marijuana in the state, finding exact numbers is difficult. CLPP proposes three strategies
aiming to address this issue:
1. Direct Contact: Gather a list of dispensaries, collective gardens, and individual growers,
and contact them directly to find out how much canopy is used to supply them with
product; if direct canopy numbers are not forthcoming, then we could try to estimate back
from quantity of product dispensed;
2. Tax Data: Extrapolate estimated grower sales based on business & occupation (B&O)
tax data available publicly from the Department of Revenue and try to estimate amount of
product grown (and hence canopy size) to produce that level of sales; and
3. Survey: Conduct a survey where dispensaries, gardens, and individual growers will fill in
and report how much canopy they grow under (alternatively, estimate canopy from
estimates of products amounts they report).
Each of these strategies will be discussed separately.
1. Direct Contact
The Direct Contact strategy is perhaps the most labor-intensive strategy but also the one
likely to provide the most detailed results. The Internet provides at least a few directories of
medical dispensaries around the state that could be contacted. Potential issues:
Dispensaries and other parties may be reluctant to share information;
There is no way to verify the information we receive from these parties; and
There are no similar directories for collective gardens or individual patients, so
quantifying them would be difficult.
2. Tax Data:
The Tax Data strategy is unique among the three strategies in that it relies on raw
numbers rather than information directly from people. This sidesteps the issue of people’s
potential reluctance and data verifiability. Potential issues:
The Department of Revenue is unlikely to provide data beyond what is publicly available;
The publicly available data is general, and does not provide information on number of
dispensaries or other individualized information; and
Box 353020, William H. Gates Hall, 4293 Memorial Way Northeast, Seattle, WA 98195
Cannabis Law & Policy Project | www.law.washington.edu/Programs/Cannabis
16
Given that the data is of B&O taxes, there will be no data on collective gardens or individual
patients.
3. Survey:
The Survey strategy is advantageous in that it is not as labor intensive as the Direct
Contact strategy, and there will be no reluctance issue because peopleself-select to take the
survey. Potential issues:
There is no way to verify the information we receive from these parties;
The surveys might suffer from lack of participation; and
Those who do participate, being self-selecting, might skew the data towards a particular
demographic.
We also will examine the BOTEC report recently published, where we can use the data
gathered to extrapolate how much additional canopy will be needed based on store sales.
Given that each strategy has its set of advantages and disadvantages, pursuing all three
would be advisable and would provide the most balanced approach. The medical marijuana
world, being largely unregulated until now, is naturally very difficult to quantify without
conducting a massive study. But by pursuing all of the above strategies, the WSLCB would at
least have educated approximations of the market.
Box 353020, William H. Gates Hall, 4293 Memorial Way Northeast, Seattle, WA 98195
Cannabis Law & Policy Project | www.law.washington.edu/Programs/Cannabis
17
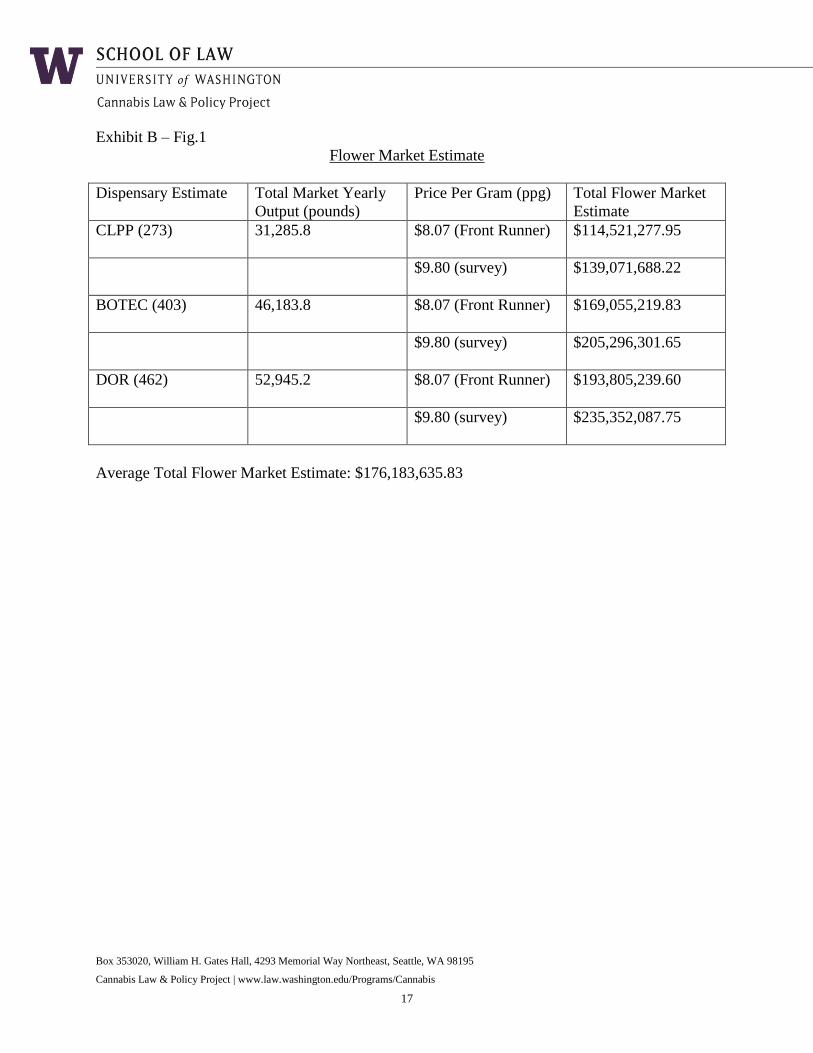
Exhibit B – Fig.1
Flower Market Estimate
Dispensary Estimate Total Market Yearly
Output (pounds)
Price Per Gram (ppg) Total Flower Market
Estimate
CLPP (273)
31,285.8 $8.07 (Front Runner) $114,521,277.95
$9.80 (survey) $139,071,688.22
BOTEC (403)
46,183.8 $8.07 (Front Runner) $169,055,219.83
$9.80 (survey) $205,296,301.65
DOR (462)
52,945.2 $8.07 (Front Runner) $193,805,239.60
$9.80 (survey) $235,352,087.75
Average Total Flower Market Estimate: $176,183,635.83
Box 353020, William H. Gates Hall, 4293 Memorial Way Northeast, Seattle, WA 98195
Cannabis Law & Policy Project | www.law.washington.edu/Programs/Cannabis
18
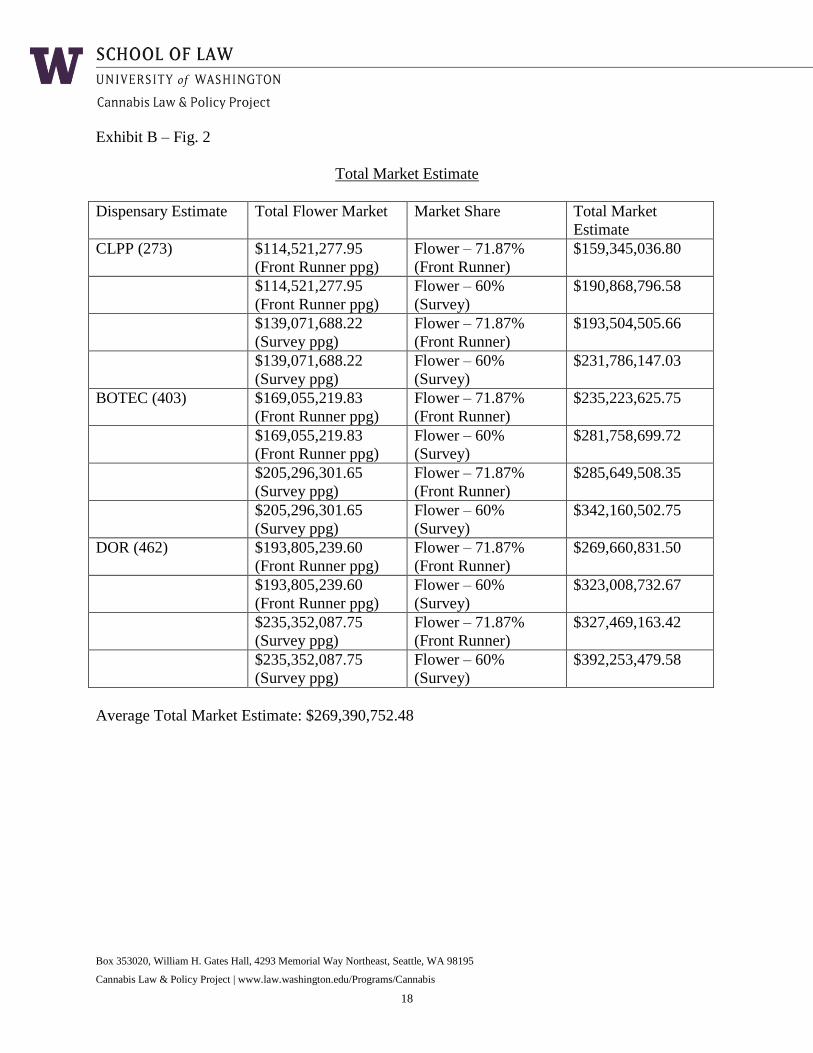
Exhibit B – Fig. 2
Total Market Estimate
Dispensary Estimate Total Flower Market Market Share
Total Market
Estimate
CLPP (273)
$114,521,277.95
(Front Runner ppg)
Flower – 71.87%
(Front Runner)
$159,345,036.80
$114,521,277.95
(Front Runner ppg)
Flower – 60%
(Survey)
$190,868,796.58
$139,071,688.22
(Survey ppg)
Flower – 71.87%
(Front Runner)
$193,504,505.66
$139,071,688.22
(Survey ppg)
Flower – 60%
(Survey)
$231,786,147.03
BOTEC (403)
$169,055,219.83
(Front Runner ppg)
Flower – 71.87%
(Front Runner)
$235,223,625.75
$169,055,219.83
(Front Runner ppg)
Flower – 60%
(Survey)
$281,758,699.72
$205,296,301.65
(Survey ppg)
Flower – 71.87%
(Front Runner)
$285,649,508.35
$205,296,301.65
(Survey ppg)
Flower – 60%
(Survey)
$342,160,502.75
DOR (462)
$193,805,239.60
(Front Runner ppg)
Flower – 71.87%
(Front Runner)
$269,660,831.50
$193,805,239.60
(Front Runner ppg)
Flower – 60%
(Survey)
$323,008,732.67
$235,352,087.75
(Survey ppg)
Flower – 71.87%
(Front Runner)
$327,469,163.42
$235,352,087.75
(Survey ppg)
Flower – 60%
(Survey)
$392,253,479.58
Average Total Market Estimate: $269,390,752.48

Box 353020, William H. Gates Hall, 4293 Memorial Way Northeast, Seattle, WA 98195
Cannabis Law & Policy Project | www.law.washington.edu/Programs/Cannabis
19
Exhibit B – Fig. 3
Edibles Market Estimate
Total Market Estimate (taken
from Fig. 2 above)
Market Share Total Edibles Market
Estimate
$159,345,036.80
9.46% (Front Runner) $15,074,040.48
$190,868,796.58
18% (Survey) $34,356,383.38
$193,504,505.66
9.46% (Front Runner) $18,305,526.23
$231,786,147.03
18% (Survey) $41,721,506.47
$235,223,625.75
9.46% (Front Runner) $22,252,155.00
$281,758,699.72
18% (Survey) $50,716,565.95
$285,649,508.35
9.46% (Front Runner) $27,022,443.49
$342,160,502.75
18% (Survey) $61,588,890.50
$269,660,831.50
9.46% (Front Runner) $25,509,914.66
$323,008,732.67
18% (Survey) $58,141,571.88
$327,469,163.42
9.46% (Front Runner) $30,978,582.86
$392,253,479.58
18% (Survey) $70,605,626.32
Average Total Edibles Market Estimate: $38,022,767.27
Box 353020, William H. Gates Hall, 4293 Memorial Way Northeast, Seattle, WA 98195
Cannabis Law & Policy Project | www.law.washington.edu/Programs/Cannabis
20
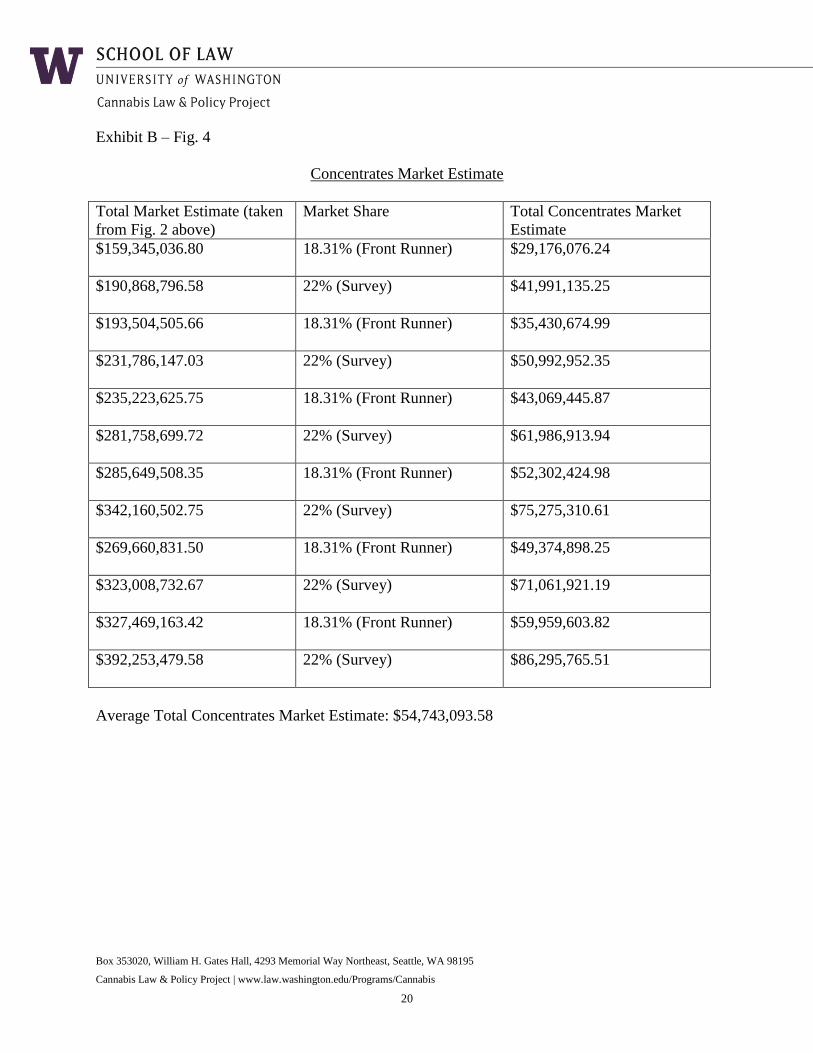
Exhibit B – Fig. 4
Concentrates Market Estimate
Total Market Estimate (taken
from Fig. 2 above)
Market Share Total Concentrates Market
Estimate
$159,345,036.80
18.31% (Front Runner) $29,176,076.24
$190,868,796.58
22% (Survey) $41,991,135.25
$193,504,505.66
18.31% (Front Runner) $35,430,674.99
$231,786,147.03
22% (Survey) $50,992,952.35
$235,223,625.75
18.31% (Front Runner) $43,069,445.87
$281,758,699.72
22% (Survey) $61,986,913.94
$285,649,508.35
18.31% (Front Runner) $52,302,424.98
$342,160,502.75
22% (Survey) $75,275,310.61
$269,660,831.50
18.31% (Front Runner) $49,374,898.25
$323,008,732.67
22% (Survey) $71,061,921.19
$327,469,163.42
18.31% (Front Runner) $59,959,603.82
$392,253,479.58
22% (Survey) $86,295,765.51
Average Total Concentrates Market Estimate: $54,743,093.58
Box 353020, William H. Gates Hall, 4293 Memorial Way Northeast, Seattle, WA 98195
Cannabis Law & Policy Project | www.law.washington.edu/Programs/Cannabis
21
Exhibit C
Allocated Square Footage Monthly Flower Yield (lbs) Yield (ft2 required for 1 lb)
1000 4 250
500 2.5 200
50 0.375 133.33
900 0.44 2045.45
11000 90 122.22
700 4 175
250 0.82 304.88
10000 15 666.67
200 1.5 133.33
200 1.5 133.33
200 1.5 133.33
200 10 20
700 12.5 56
1000 2 500
1000 6.5 153.85
1000 1 1000
10000 1 10000
1080 14 77.14
96 0.25 384
2000 8 250
4500 16 281.25
600 5 120
Averages
2144.36 8.99 238.40