Embed Size (px)
DESCRIPTION
Sensor Orientation to maize canopy row and estimating biomass and Nitrogen Status. Paul Hodgen, Fernando Solari, Jim Schepers, John Shanahan, Dennis Francis. Objectives:. 1) Evaluate effects of sensor orientation on estimating maize biomass and nitrogen uptake. - PowerPoint PPT Presentation
Citation preview

Sensor Orientation to maize canopy row and estimatingSensor Orientation to maize canopy row and estimatingbiomass and Nitrogen Statusbiomass and Nitrogen Status
Paul Hodgen, Fernando Solari, Paul Hodgen, Fernando Solari, Jim Schepers, John Shanahan, Dennis FrancisJim Schepers, John Shanahan, Dennis Francis

Objectives:Objectives:
1) Evaluate effects of sensor orientation 1) Evaluate effects of sensor orientation on estimating maize biomass and on estimating maize biomass and nitrogen uptake. nitrogen uptake.
2) Evaluating if auxiliary information 2) Evaluating if auxiliary information combined with sensor data improves combined with sensor data improves ability of estimate biomass. ability of estimate biomass.

NadirNadir
45 degrees off Nadir45 degrees off Nadir
Vs.Vs.
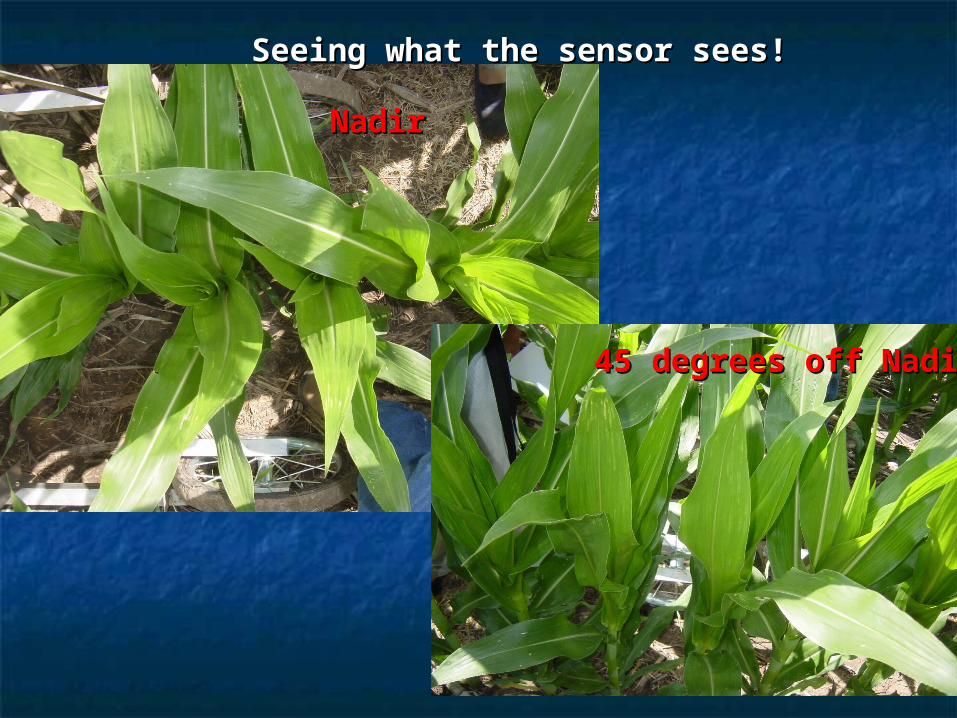
Seeing what the sensor sees!Seeing what the sensor sees!
NadirNadir
45 degrees off Nadir45 degrees off Nadir

NadirNadir
NadirNadir

NadirNadir
45 degrees off Nadir45 degrees off Nadir
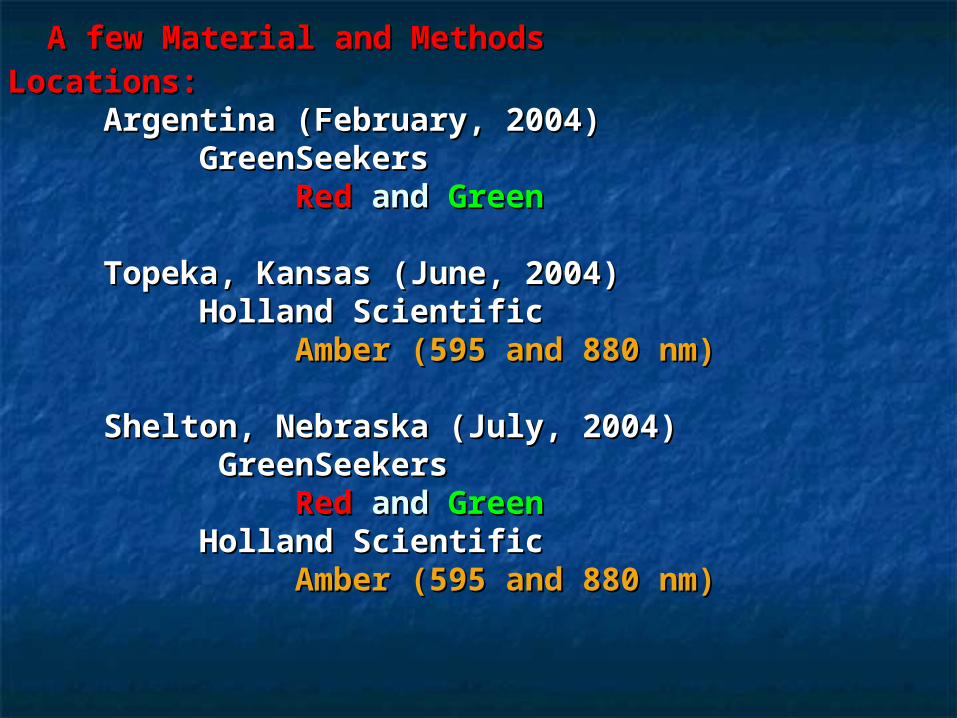
A few Material and MethodsA few Material and Methods
Locations:Locations:Argentina (February, 2004)Argentina (February, 2004)
GreenSeekersGreenSeekersRed Red andand GreenGreen
Topeka, Kansas (June, 2004)Topeka, Kansas (June, 2004)Holland ScientificHolland Scientific
Amber (595 and 880 nm)Amber (595 and 880 nm)
Shelton, Nebraska (July, 2004)Shelton, Nebraska (July, 2004) GreenSeekersGreenSeekers
Red Red andand GreenGreenHolland Scientific Holland Scientific
Amber (595 and 880 nm)Amber (595 and 880 nm)
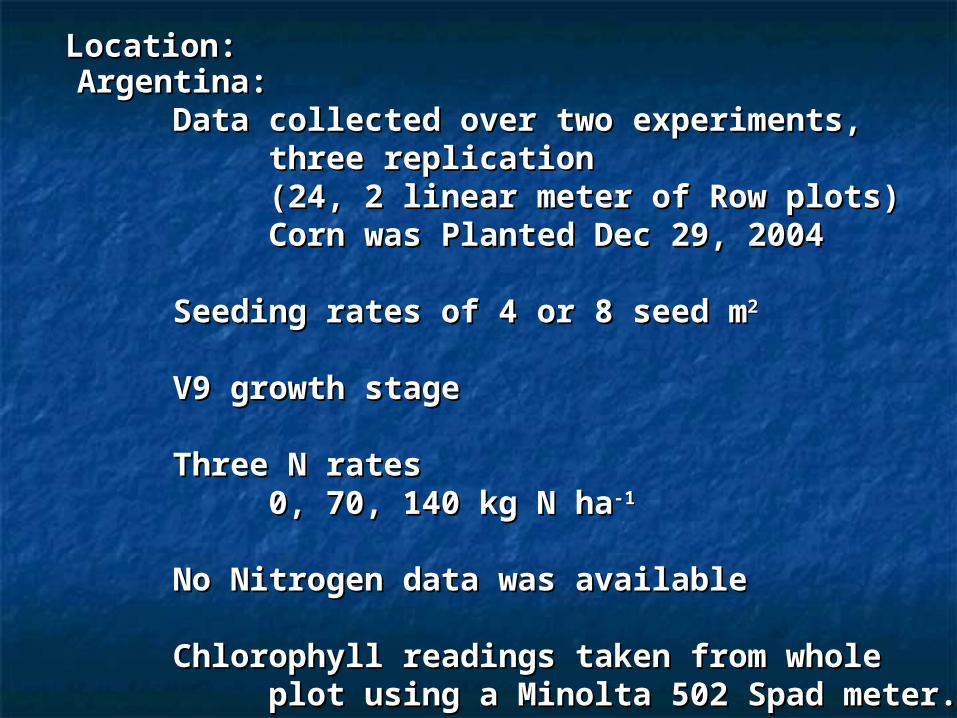
Location:Location:Argentina:Argentina:
Data collected over two experiments, Data collected over two experiments, three replication three replication (24, 2 linear meter of Row plots)(24, 2 linear meter of Row plots)
Corn was Planted Dec 29, 2004Corn was Planted Dec 29, 2004
Seeding rates of 4 or 8 seed mSeeding rates of 4 or 8 seed m22
V9 growth stageV9 growth stage
Three N ratesThree N rates0, 70, 140 kg N ha0, 70, 140 kg N ha-1-1
No Nitrogen data was availableNo Nitrogen data was available
Chlorophyll readings taken from whole Chlorophyll readings taken from whole plot using a Minolta 502 Spad meter.plot using a Minolta 502 Spad meter.

y = 0.0075e5.0201x
R2 = 0.71
0
0.1
0.2
0.3
0.4
0.5
0 0.2 0.4 0.6 0.8 1
NDVI Nadir
Dry
mat
ter
kg m
-2 NDVINDVI NadirNadir Maize V9Maize V9

y = 0.0016e6.5614x
R2 = 0.71
0
0.1
0.2
0.3
0.4
0.5
0 0.2 0.4 0.6 0.8 1
NDVI 45 degrees off Nadir
Dry
mat
ter
kg m
-2
NDVI 45 degrees Off NadirNDVI 45 degrees Off NadirMaize V9Maize V9

y = 0.0195e5.1321x
R2 = 0.28
0
0.1
0.2
0.3
0.4
0.5
0 0.2 0.4 0.6 0.8 1
GNDVI Nadir
Dry
mat
ter
kg m
-2
GNDVI NadirGNDVI Nadir Maize V9Maize V9
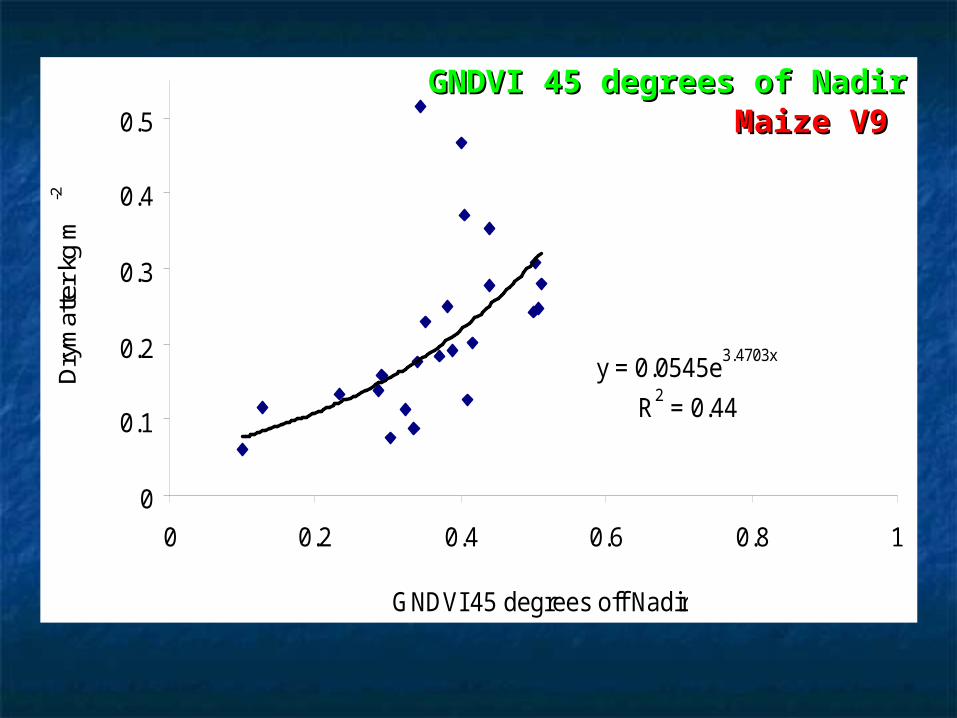
y = 0.0545e3.4703x
R2 = 0.44
0
0.1
0.2
0.3
0.4
0.5
0 0.2 0.4 0.6 0.8 1
GNDVI 45 degrees off Nadir
Dry
mat
ter
kg m
-2
GNDVI 45 degrees of NadirGNDVI 45 degrees of NadirMaize V9Maize V9
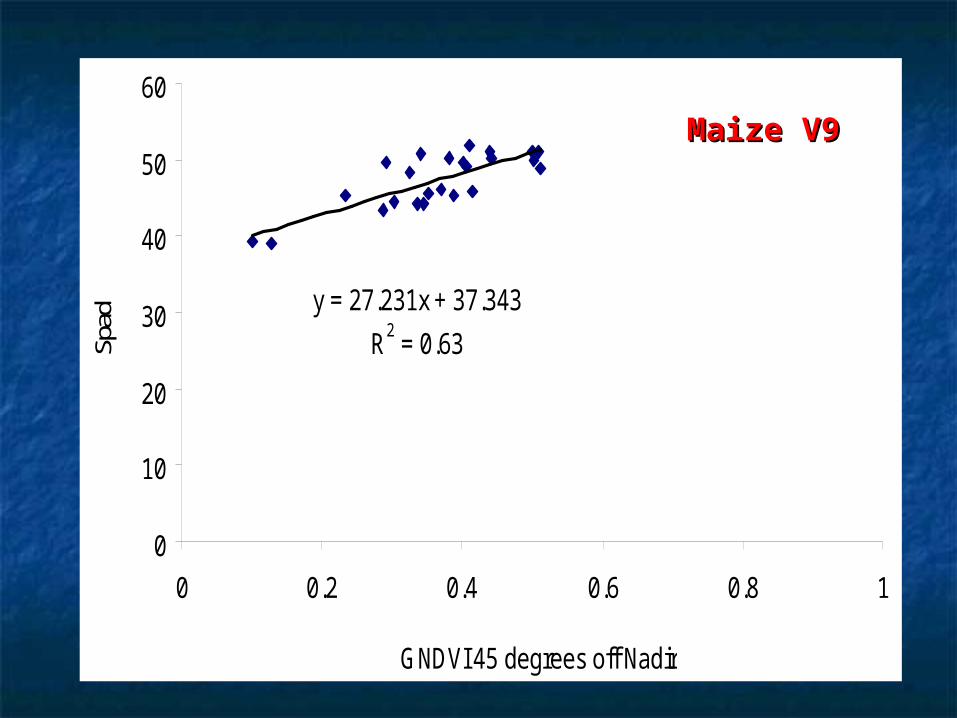
y = 27.231x + 37.343
R2 = 0.63
0
10
20
30
40
50
60
0 0.2 0.4 0.6 0.8 1
GNDVI 45 degrees off Nadir
Spad
Maize V9Maize V9
NDVI by itself from the Nadir position is a good NDVI by itself from the Nadir position is a good predictor of biomass.predictor of biomass.Off Nadir seemed to Saturate Off Nadir seemed to Saturate
Problems of NDVIProblems of NDVISaturates around a leaf area of 2.0Saturates around a leaf area of 2.0
Gitelson et al., 2003Gitelson et al., 2003Myneni et al., 1997Myneni et al., 1997
GNDVI by itself was a poor indicator of dry matter from GNDVI by itself was a poor indicator of dry matter from the Nadir position. The off Nadir position improved the Nadir position. The off Nadir position improved our ability but the relationship was still poor.our ability but the relationship was still poor.

GNDVI and SpadGNDVI and SpadR = 0.39 for NadirR = 0.39 for NadirR = 0.79 for 45 degrees off NadirR = 0.79 for 45 degrees off Nadir
GNDVI from the off Nadir position might tell us GNDVI from the off Nadir position might tell us more aboutmore about N status of the crop.N status of the crop.
Why?Why?Believe it is from holding the NIR more Believe it is from holding the NIR more
constant and difference is in the constant and difference is in the visible (Green).visible (Green).

NadirNadir
45 degrees off Nadir45 degrees off Nadir
Do not see as many gapsDo not see as many gaps

NadirNadir
45 degrees off Nadir45 degrees off Nadir
GreenSeeker GreenSeeker Light BandLight Band

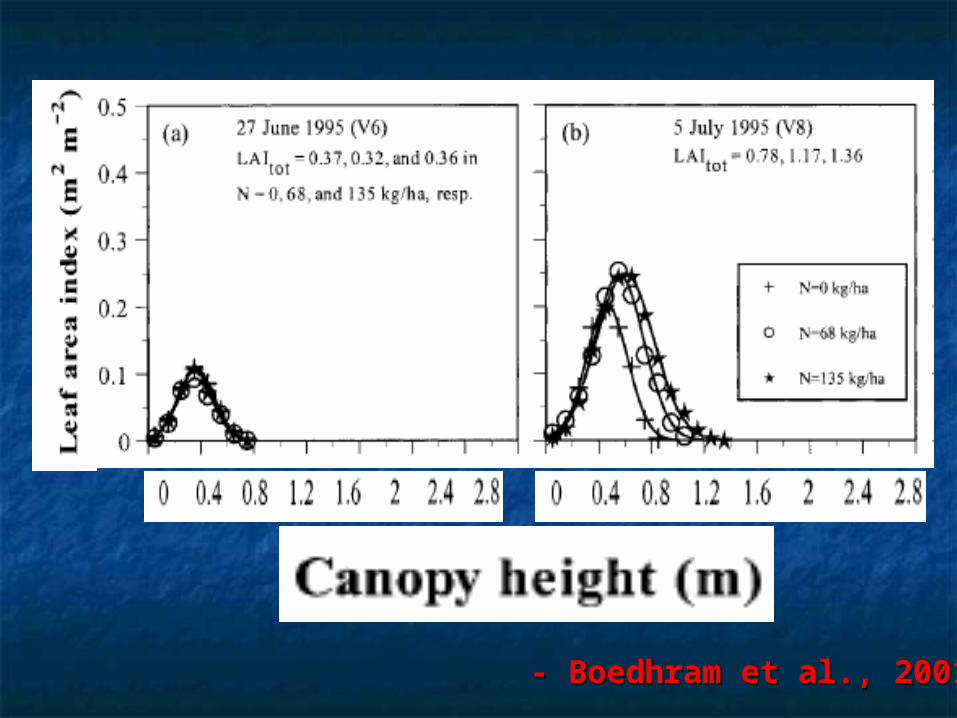
Canopy height and sensor readings.Canopy height and sensor readings.
Plant height is important, because nearly half the Plant height is important, because nearly half the weight in the vegetative growth is in the stalk.weight in the vegetative growth is in the stalk.
Also leaf area has normal vertical distribution during Also leaf area has normal vertical distribution during the growing season.the growing season.
- Boedhram et al., 2001- Boedhram et al., 2001

- Boedhram et al., 2001- Boedhram et al., 2001
- Boedhram et al., 2001- Boedhram et al., 2001
Sensor output times plant heightSensor output times plant heightNDVIht NDVIht andand GNDVIhtGNDVIht
Plant height does not gives a good estimate of Plant height does not gives a good estimate of Nitrogen status of the crop.Nitrogen status of the crop.

y = 0.0069e4.3507x
R2 = 0.82
0
0.1
0.2
0.3
0.4
0.5
0 0.1 0.2 0.3 0.4 0.5 0.6 0.7 0.8 0.9 1
Average Canopy height (m)
Dry
mat
ter
kg m
-2
Maize V9Maize V9

y = 0.0306e3.6579x
R2 = 0.84
0
0.1
0.2
0.3
0.4
0.5
0 0.1 0.2 0.3 0.4 0.5 0.6 0.7 0.8
NDVIht (Nadir)
Dry
mat
ter k
g m
-2
Maize V9Maize V9

y = 0.0245e6.0025x
R2 = 0.72
0
0.1
0.2
0.3
0.4
0.5
0 0.05 0.1 0.15 0.2 0.25 0.3 0.35 0.4
GNDVIht (Nadir)
Dry
mat
ter
kg m
-2
Maize V9Maize V9

y = 0.0614e3.984x
R2 = 0.62
0
0.1
0.2
0.3
0.4
0.5
0 0.05 0.1 0.15 0.2 0.25 0.3 0.35 0.4
GNDVIht (45 degrees off Nadir)
Dry
mat
ter k
g m
-2
Maize V9Maize V9

What happen to the GNDVI off Nadir ?What happen to the GNDVI off Nadir ?Remember those Gaps?Remember those Gaps?
presence or absence of leaves.presence or absence of leaves.

NadirNadir
45 degrees off Nadir45 degrees off Nadir
Do not see as many gapsDo not see as many gaps

Nitrogen UptakeNitrogen Uptake
Since actual Nitrogen data is not availableSince actual Nitrogen data is not available used a pseudo Nitrogen Uptakeused a pseudo Nitrogen Uptake
Spad time DrymatterSpad time Drymatter
Not the real thing but will point Not the real thing but will point us in the right direction.us in the right direction.
Now we have eliminated GNDVI and NDVI from the Now we have eliminated GNDVI and NDVI from the 45 degrees off Nadir45 degrees off Nadir
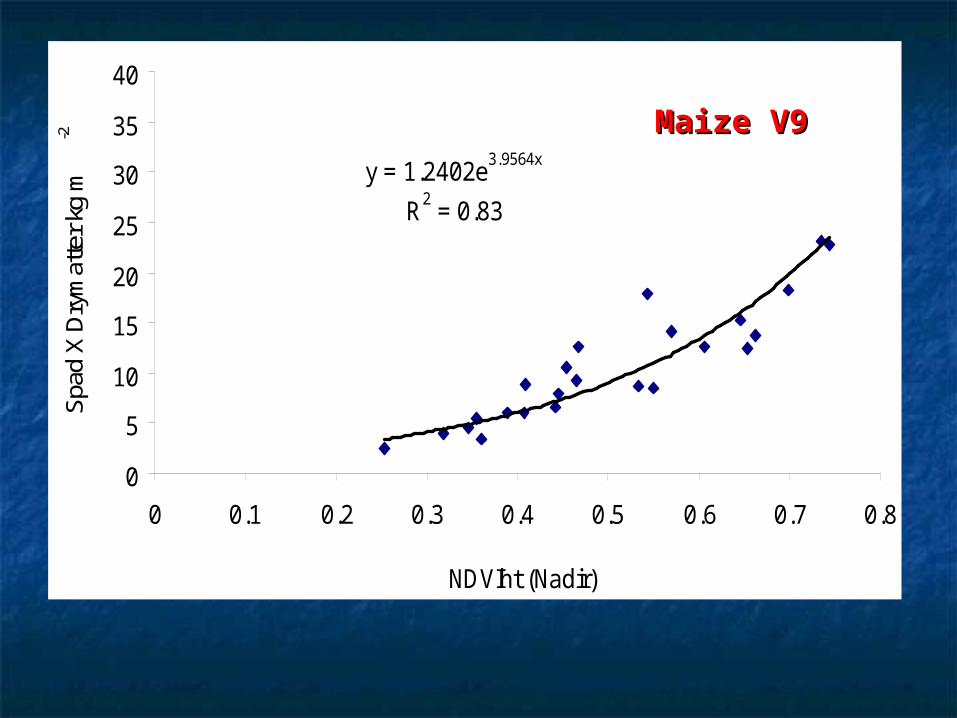
y = 1.2402e3.9564x
R2 = 0.83
0
5
10
15
20
25
30
35
40
0 0.1 0.2 0.3 0.4 0.5 0.6 0.7 0.8
NDVIht (Nadir)
Spa
d X
Dry
mat
ter
kg m
-2 Maize V9Maize V9
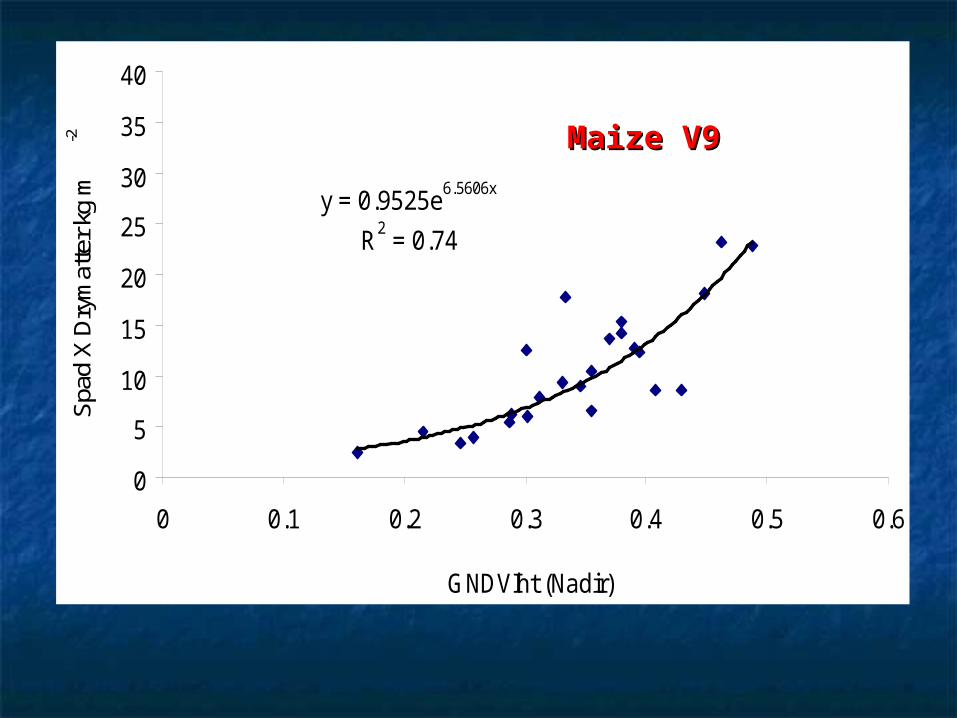
y = 0.9525e6.5606x
R2 = 0.74
0
5
10
15
20
25
30
35
40
0 0.1 0.2 0.3 0.4 0.5 0.6
GNDVIht (Nadir)
Spad
X D
rym
atte
r kg
m-2 Maize V9Maize V9

y = 1.039x + 0.1841
R2 = 0.40
0
0.1
0.2
0.3
0.4
0.5
0.6
0.7
0.8
0.9
0 0.1 0.2 0.3 0.4 0.5 0.6GNDVI Nadir
ND
VI N
adir
NDVI vs. GNDVINDVI vs. GNDVI
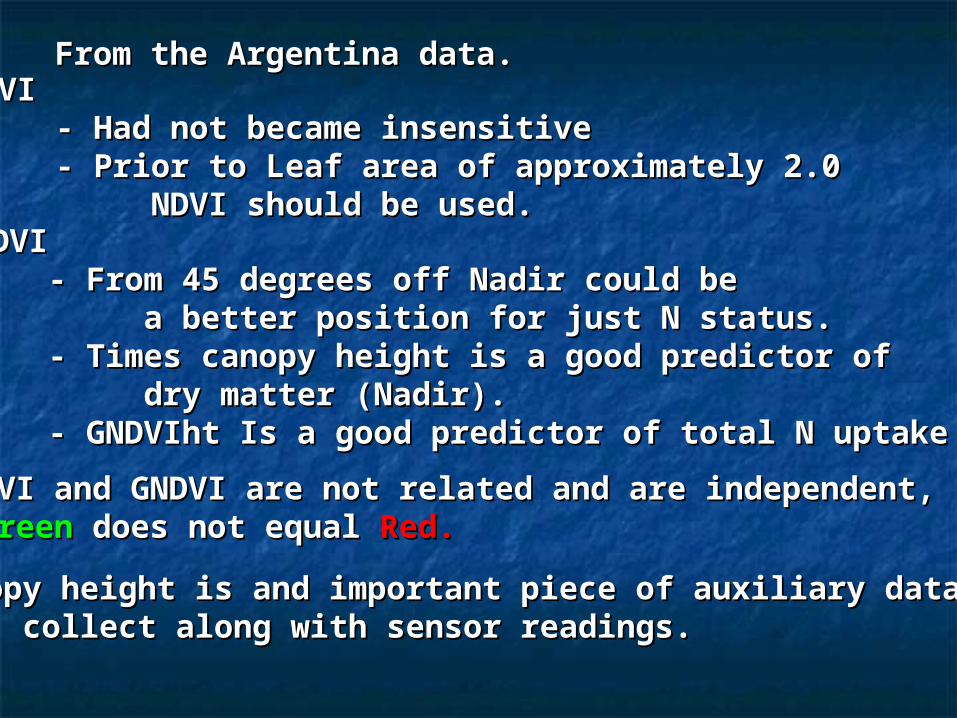
From the Argentina data.From the Argentina data.NDVI NDVI
- Had not became insensitive- Had not became insensitive- Prior to Leaf area of approximately 2.0 - Prior to Leaf area of approximately 2.0
NDVI should be used. NDVI should be used. GNDVIGNDVI
- From 45 degrees off Nadir could be - From 45 degrees off Nadir could be a better position for just N status.a better position for just N status.
- Times canopy height is a good predictor of- Times canopy height is a good predictor ofdry matter (Nadir).dry matter (Nadir).
- GNDVIht Is a good predictor of total N uptake- GNDVIht Is a good predictor of total N uptake
NDVI and GNDVI are not related and are independent,NDVI and GNDVI are not related and are independent, GreenGreen does not equaldoes not equal Red. Red.
Canopy height is and important piece of auxiliary data to Canopy height is and important piece of auxiliary data to collect along with sensor readings.collect along with sensor readings.

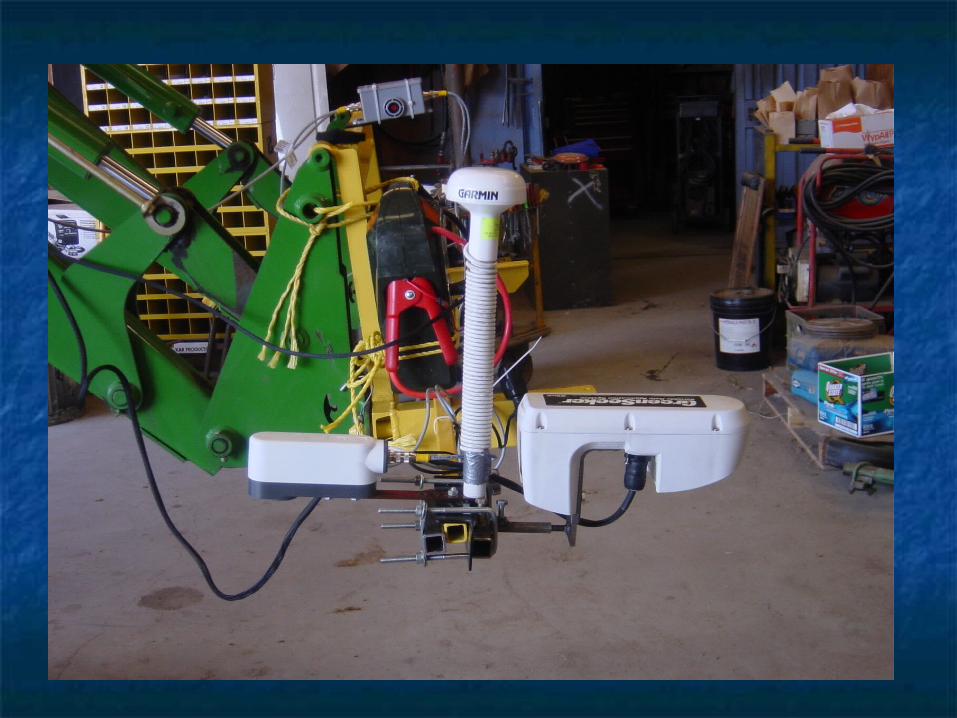
Now from KansasNow from Kansas
Crop Circle sensor just arrived.Crop Circle sensor just arrived.
Computer problems caused us to lose Computer problems caused us to lose Green Seeker data.Green Seeker data.
8 strips, each a different N treatment, 800 ft long8 strips, each a different N treatment, 800 ft long
Sensors were mounted on a front end loader of Sensors were mounted on a front end loader of tractor.tractor.

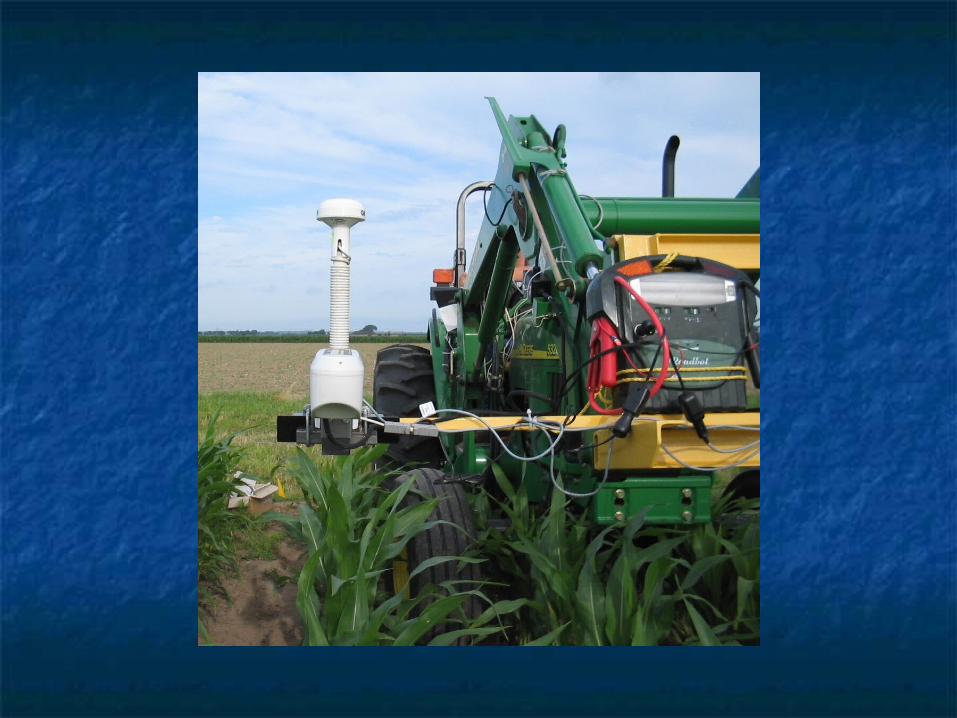
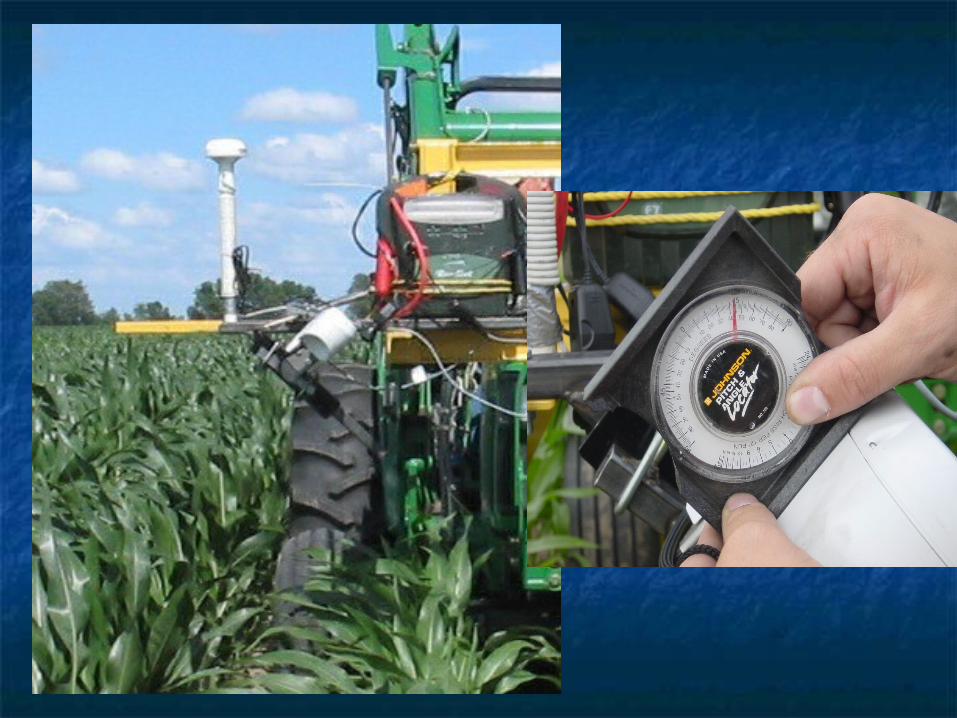


Back to Nadir vs. 45 degrees off NadirBack to Nadir vs. 45 degrees off Nadir
Crop Circle outputs the values for the NIR (880 nm) Crop Circle outputs the values for the NIR (880 nm) and Amber bands (595 nm)and Amber bands (595 nm)
Data taken at two distances from the canopyData taken at two distances from the canopyfor both positions.for both positions.
50 and 91 cm50 and 91 cm
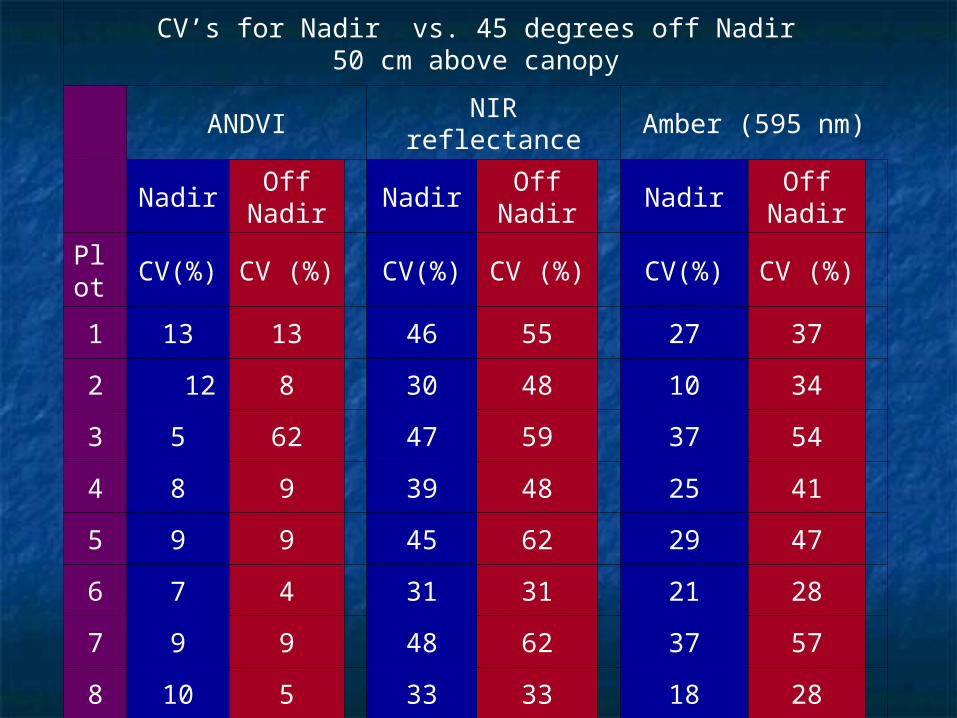
CV’s for Nadir vs. 45 degrees off Nadir50 cm above canopy
ANDVI NIR reflectance Amber (595 nm)
NadirOff
NadirNadir
Off Nadir
NadirOff
Nadir
Plot CV(%) CV (%) CV(%) CV (%) CV(%) CV (%)
1 13 13 46 55 27 37
2 12 8 30 48 10 34
3 5 62 47 59 37 54
4 8 9 39 48 25 41
5 9 9 45 62 29 47
6 7 4 31 31 21 28
7 9 9 48 62 37 57
8 10 5 33 33 18 28

CV’s for Nadir vs. 45 degrees off Nadir90 cm above canopy
ANDVI NIR reflectance Amber (595 nm)
NadirOff
NadirNadir
Off Nadir
NadirOff
Nadir
Plot CV(%) CV (%) CV(%) CV (%) CV(%) CV (%)
1 12 . 14 . 5 .
2 14 7 28 27 9 16
3 7 4 28 29 12 24
4 9 4 26 21 11 16
5 11 7 21 25 6 14
6 8 4 21 22 8 20
7 10 6 23 32 8 23
8 10 4 22 28 7 26

From KansasFrom Kansas
For both distance (50 cm and 91 cm) reflectanceFor both distance (50 cm and 91 cm) reflectancevalues increased going from Nadir to values increased going from Nadir to 45 degrees off Nadir.45 degrees off Nadir.
The variability (CV) of the reflectance values increased The variability (CV) of the reflectance values increased goinggoing from Nadir to 45 degrees off Nadir, more so from Nadir to 45 degrees off Nadir, more so
for visible (Amber) than the NIR, as distance for visible (Amber) than the NIR, as distance increased.increased.
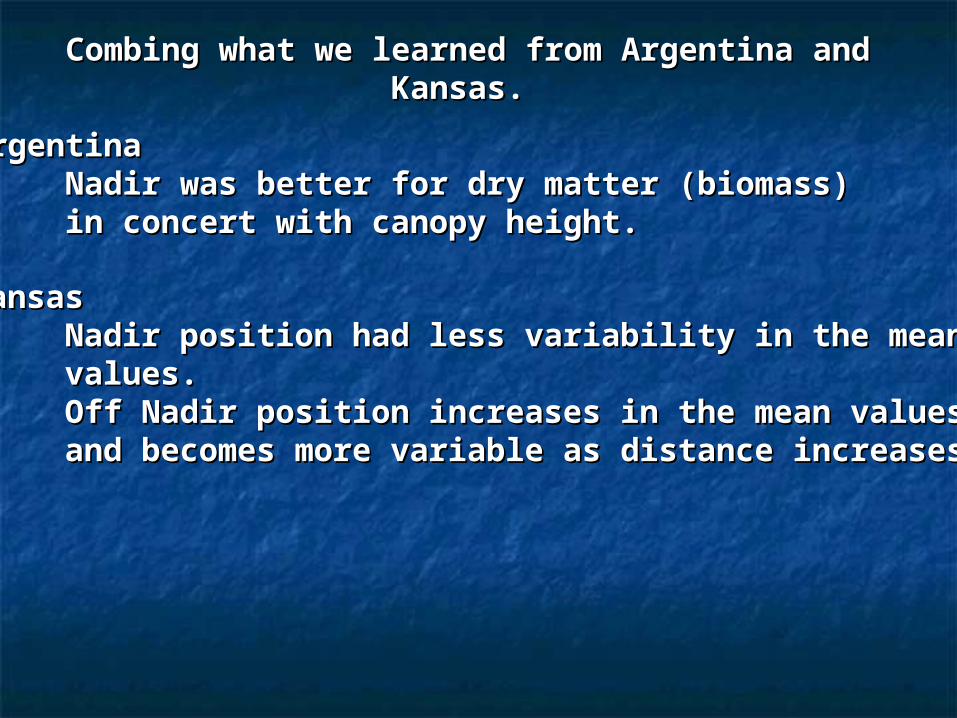
Combing what we learned from Argentina and Kansas. Combing what we learned from Argentina and Kansas.
ArgentinaArgentinaNadir was better for dry matter (biomass)Nadir was better for dry matter (biomass)in concert with canopy height.in concert with canopy height.
KansasKansasNadir position had less variability in the mean Nadir position had less variability in the mean values.values.Off Nadir position increases in the mean valuesOff Nadir position increases in the mean valuesand becomes more variable as distance increases. and becomes more variable as distance increases.
Applying what we learned for this summer in NebraskaApplying what we learned for this summer in Nebraska
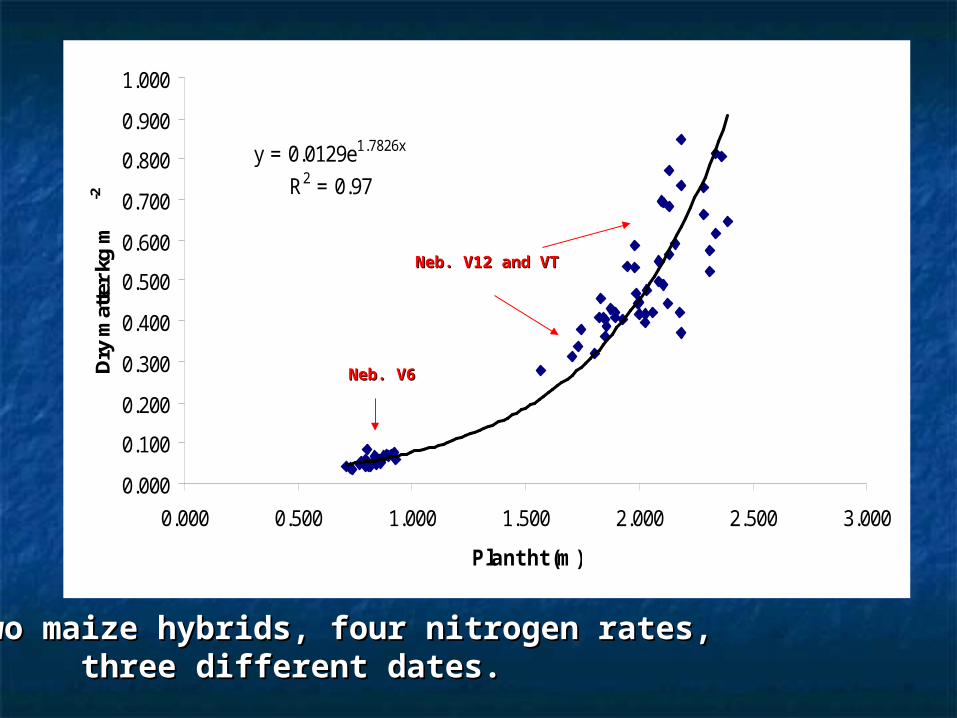
y = 0.0129e1.7826x
R2 = 0.97
0.000
0.100
0.200
0.300
0.400
0.500
0.600
0.700
0.800
0.900
1.000
0.000 0.500 1.000 1.500 2.000 2.500 3.000
Plant ht (m)
Dry
mat
ter
kg m
-2
Neb. V6Neb. V6
Neb. V12 and VTNeb. V12 and VT
Two maize hybrids, four nitrogen rates,Two maize hybrids, four nitrogen rates, three different dates.three different dates.

y = 0.0047e256.11x
R2 = 0.63
0.000
0.200
0.400
0.600
0.800
1.000
1.200
0.00000 0.00500 0.01000 0.01500 0.02000 0.02500
GINSEY (GNDVI*HT)/DAYS
Dry
mat
ter
kg m
2
Two maize hybrids, four nitrogen rates, three Two maize hybrids, four nitrogen rates, three different dates.different dates.
Neb. V6Neb. V6
Neb. V12 and VTNeb. V12 and VT
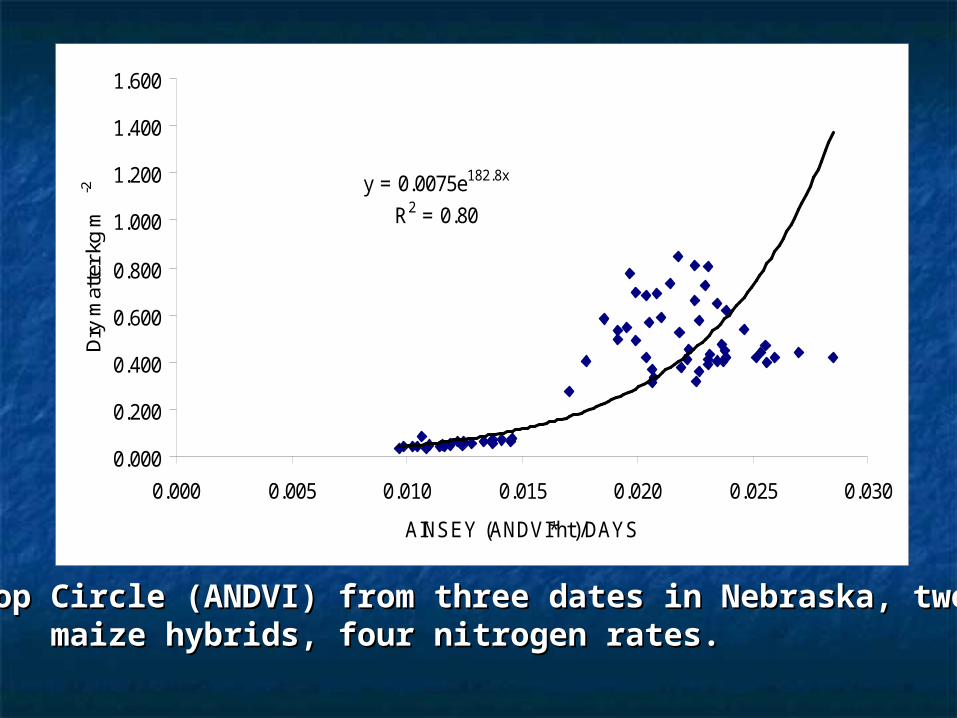
y = 0.0075e182.8x
R2 = 0.80
0.000
0.200
0.400
0.600
0.800
1.000
1.200
1.400
1.600
0.000 0.005 0.010 0.015 0.020 0.025 0.030
AINSEY (ANDVI*ht)/DAYS
Dry
mat
ter k
g m
-2
Crop Circle (ANDVI) from three dates in Nebraska, two Crop Circle (ANDVI) from three dates in Nebraska, two maize hybrids, four nitrogen rates.maize hybrids, four nitrogen rates.
Plant height continues to explains a large portion ofPlant height continues to explains a large portion of the variability in dry matter (Biomass) during the variability in dry matter (Biomass) during
vegetation growth stages.vegetation growth stages. Probably the most important auxiliary piece of Probably the most important auxiliary piece of
information to collect at time of sensor readingsinformation to collect at time of sensor readings
Still waiting on lab results for Nitrogen analysisStill waiting on lab results for Nitrogen analysisSuspect that the late season cloud will “tighten up”Suspect that the late season cloud will “tighten up”when GINSEY or AINSEY is plotted against total when GINSEY or AINSEY is plotted against total Nitrogen uptake.Nitrogen uptake.

Where to next?Where to next?
If biomass, and / or total Nitrogen uptake can beIf biomass, and / or total Nitrogen uptake can beestimated in current vegetation, then we can startestimated in current vegetation, then we can startto make future prediction about future needs.to make future prediction about future needs.
GNDVI and ANDVI hold promise to detect differences in GNDVI and ANDVI hold promise to detect differences in Nitrogen status post leaf area 2.0.Nitrogen status post leaf area 2.0.
Prior V8 is too early to get a handle on residualPrior V8 is too early to get a handle on residualplant available Nitrogen in the soil. In addition, plant available Nitrogen in the soil. In addition, V8 up to VT gives a wider window of application V8 up to VT gives a wider window of application than emergence to V8.than emergence to V8.
That’s our story!That’s our story!
Questions????Questions????
$#@$#@**