Embed Size (px)
Citation preview

United States Department of Agriculture
Forest Service
Pacific Southwest Research Station
P.O. Box 245 Berkeley California 94701
Research Note PSW-410 October 1990
Ratliff, Raymond D.; Frost, William E. 1990. Estimating botanical composition by the dryweight-rank method in California' s annual grasslands. Res. Note PSW-4lO. Berkeley,CA: Pacific Southwest Research Station, Forest Service, U.S. Department of Agriculture; 5 p.
The dry-weight-rank method of estimating botanical composition on California's annual grasslands is a viable alternative to harvesting and sorting or methods using points. Two data sets of sorted species weights were available. One spanned nine years with quadrats harvested at peak of production. The second spanned one growing season with 20 harvest dates. Two existing sets of coefficients for the first, second, and third ranked species and one calculated from our data were used to estimate dryweight composition. We tested the differences between the estimates and actual values. Differences were found (using the basic ranking method) for data from moderately grazed grassland, but one set of coefficients did not appear better than the others. The cumulative ranking correction produced more differences than the basic ranking method on ungrazed grassland with one dominant species. For the dominant species, cumulative ranking, nevertheless, produced more accurate estimates. Cumulative ranking with coefficients of 70 (rank one), 20 (rank two), and 10 (rank three) should serve well for most applications. Calculating coefficients for each new area should not be necessary.
Retrieval Terms: annual plant, Tilden Regional Park, ranking, species composition, San Joaquin Experimental Range
Estimating Botanical Composition by the Dry-Weight-Rank Method in California's Annual Grasslands Raymond D. Ratliff William E. Frost
M OnitOring change in a plant community frequently involves estimating
botanical composition. The standard for botanical composition is the percentage of the total dry weight of herbage comprised by a species. Dry-weight composition is usually estimated by clipping plots of a specific size and then sorting and weighing the individual species. The costs (in time) of estimating composition by weight, however, limit the usefulness of the method and usually restrict its use to the research setting. In one study it took 68 minutes per plot to clip, sort, and weigh the herbage but only 4 minutes per plot to estimate composition by pointS.l
Because of the time savings , on California's annual grasslands, botanical composition is commonly estimated using point methods. They measure a species ' frequency, which (with dimensionless points) estimates its cover. A number of points, frequently 10 (each point equals 10 percent cover), are held in point frames .2•3
Botanical composition is estimated as [(hits on a species/total hits on plants) x 100]. A less intense procedure, the "step-point" method, uses a single point.4 Botanical composition is estimated as the percentage of times a species is touched by or nearest to the point.
Although there is no direct relationship between them, composition based on weight can be indirectly estimated from composition based on points and, thereby, save much of the hand sorting work. 1.5.6.1 An alternative to estimating by points is direct estimation of species weights in quadrats. A larger
number of quadrats can be evaluated than with points, but clipping and sorting are still required to check the estimates and assure consistency among observers.
A "SIMPLER" WAY
The "dry-weight-rank" method for estimating botanical composition was developed for perennial grass pastures in Australia. 8 In operation, the method eliminates harvesting, sorting, drying, and weighing individual components. The basics of the method are these: With a random set of quadrats, rank the three species in each quadrat that are judged to contribute most to the dry weight-all species present can be listed if frequency is desired. Compute the proportions of quadrats in which a species ranks one, two, and three; the counts for each rank are divided by the number of quadrats observed. Sum the (proportion x coefficient) products for the three ranks to estimate the percentage dry-weight composition of the species.
The coefficients (mUltipliers) were developed as follows: Species in quadrats were ranked on the basis of their expected contribution to the total biomass. The herbage was then clipped, sorted, dried, and weighed in traditional fashion. By regression the actual percentages of weight composition were related to the proportion of quadrats in which a species was ranked one, two, or three.
The model may be expressed as Y i = P IX Ii + P2X2i + P3X3i + error. Species are identified by i. Y is a species' percentage dry-
USDA Forest SerVice Res. Note PSW- 410. 1990.
weight composition; X" x" and X, are the proportions of quadrats in which the species ranks first, second, and third respectively;
and P" P" and P, are the coefficients for the respective ranks. Because the sum of the Y 's fora sample must equal I 00, the model is/restrained so that PI + P2 + P3 = 100.
Empirical tests have shown that this simple method works.' However. attempts to use the dry-weight-rank method to estimate the composition of vegetation types other than perennial grass pastures in Australia indicated limitations of the method. One study concluded that the method was not sufficiently accurate for research on the short grass prairie.'lbis conclusion set back consideration of the method for several years, at least in the United States.
Ways of overcoming the limitations and improving estimates made by the method weredeveloped,'o One improvement was to correct for a consistent relation between yield and composition (a situation in which yields dominated by one species are always higher than yields dominated by other species). In such situalions, the herbage yield of each quadrat was multiplied by the coefficients to estimate the weight of herbage contributed by tile first, second, and third ranked species. Pasture composition estimates were based on the averages for all samples. A second improvement was to correct for a single species consistently comprising a high percentage of the herbage. In such situations, a system of "cumulative ranking" was used. The dominant species in individual quadrats was assigned f"st rank if it made up less than 75 percent, f"st and third ranks if it made up 75 to 85 percent, flfSt and second ranks if it made up 85 to 95 percent, and all three ranks if it made up over 95 percent of the composition.
The dry-weight-rank method has now been tested in Oregon,lI Oklahoma,l2 Colorado,' and Arizona." Generally, the method has produced acceptable relationships to actual dry-weight composition in perennial grasslands.
The dry-weight-rank method has not been tested in California. Three possible reasons are: I) Hand sorting of herbage is necessary in order to test the species weight/rank relationships-a very costly procedure. 2) Staying with the proven method is safepoint methods are viable, acceptable, and fairly standard. 3) Weather produces dramatic year-to-year changes-yield and
composition change quickly. This note asks the questioo-,:an the dry-weight-rank method be a viable alternative to other methods of estimating botanical composition in California's annual grasslands?
METHODS
Source Data
To answer the question we turned to clipped, sorted, dried, and weighed data sets from which actual species ranks and weight compositions could be computed. The flfSt data set was from a grazing management study attheSanJoaquinExperimental Range (SJER), Madera County, California, and was collected from 1961 to 1969. Thedata comprised 237 subsets from swales, openrolling uplands, and rocky-brushy uplands in 16 pastures. Each data subset contained from 4 to 29 quadrats randomly selected for sorting from among 18 to 70. Sample locations were randomly relocated each year to avoid repeated sampling of the same area. With variation between years and sites, therefore, each quadrat and each data subset were considered to be random and independent. Herbage was harvested near the peak of production and sorted into 14 species or species groups. Various aspects of these and related data were previously reported. I ...
lj
For each species in each subset, we computed the dry-weight composition and the proportions of quadrats in which the species ranked fmt, second, and third. Forty-eight subsets (20 percent) were randomly selected for comparing estimates with actual composition. Among the 48 subsets 17 were from swales, 18 were from open-rolling uplands, and 13 were from rocky-brushy uplands. New coefficients were computed using 2,215 weight-rank relationships in tbe remaining 189 subsets.
The second data set was collected in 1960 from a southwest-facing slope in Tilden Regional Park near Berkeley, California." In 1960, the area had not been grazed by livestock for 5 years. Randomly selected sets of 15 quadrats each were harvested on 20 dates, from March 13 to August 20, for a total sanlpleof300. The herbage was sorted into 8 separate species and a group of olhers. Given the actual percentages of dry-weight composition, for each set of 15 quadrats we found the ranks of the species and the sums of the ranks. That provided 20 weight-rank relationships per species.
2
Estimates
We estimated the dry-weight composition of each species for each of the 48 data subsets from SJER and the 20 data subsets from Tilden Park. The estimates were computed by the basic method using the set of coefficients (M&H) developed in Australia,' a set (S&D) proposed by workers in Arizona," and a new set (SAN) based on the SJER data. Also, for heuristic purposes, new coefficienL. erPB) were computed from the Tilden Park data. Because one species comprised most of the herbage at Tilden Park, we also estimated dry-weight compositions by the cumulative ranking method. lo
Cumulative ranking is indicated by using _ C with the coefficient set codes.
Analyses
The actual percentages of dry-weight composition and their corresponding estimates were generated from the same data subsets. A paired t-test was used to test the hypothesis of no difference between the estimated and actual percentages of dryweight composition of each species. Because three tests on SJER data and six tests on Tilden Park data were made, significance of the differences was assessed by the "Bonfecroci Multiple Comparison Method" with family confidence coefficients of 0.95 and 0.99." Data subsets where a species did not occur were removed before analysis.
We did not test for differences among the coefficient sets and ranking methods. Nevertheless, a relative measure of accuracy
I was computed and e~pressed as a percent-age. The measure used was 1.0 - [(actual -estimated composition)/actual composition].
In addition, we computed the 95 percent confidence intervals (C.I.) for the percentages of dry-weight composition of the firsl, second, and third ranked species for each data set. Going into the c.1. were 3,483 plots for SJER and 300 plots for Tilden Park. Our purpose was to learn how the actual rankings compared to the coefficients.
~ESUL TS AND DISCUSSION
Botanical Composition
The three sets of coefficients should seNe equally well for estimating species composition by the dry-weight-rank melhod, at
USDA Forest Service Res. Note PSW· 410. 1990.
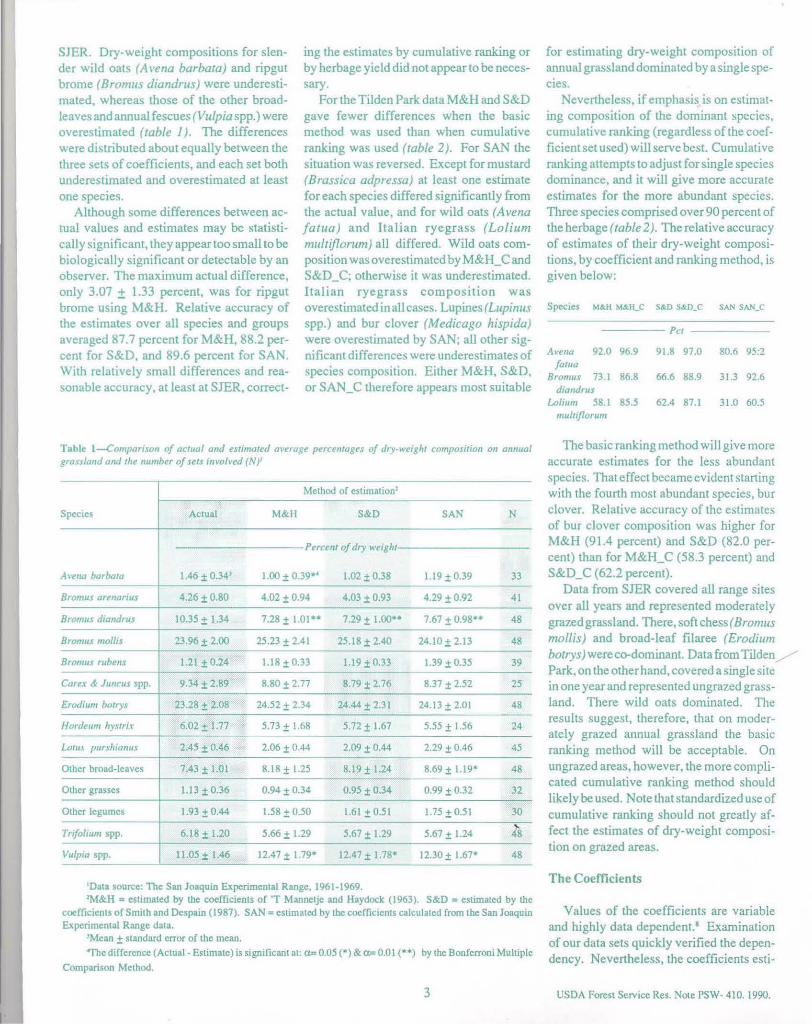
SJER. Dry-weight compositions for slender wild oats (Avena barbata) and ripgut brome (Bromus dia"drus) were underestimated, whereas those of the other broadleaves and annual fescues (Vulpia spp.) were overestimaled (table J). The differences were distributed about equally between the three sets of coefficients, and each set both underestimated and overestimated at least one species.
Although some differences between actual values and estimates may be statistically significant, they appear too small to be biologically significant or detectable by an observer. The maximum actual difference. only 3.07 ± 1.33 percent, was for ripgut brome using M&H. Relative accuracy of the estimates over all species and groups averaged 87.7 percent for M&H, 88.2 percent for S&D, and 89.6 percent for SAN. With relatively small differences and reasonable accuracy. at least at SJER. correct-
ing the estimates by cumulat.ive ranking or by herbage yield did not appear to be necessary.
For the Tilden Park data M&H and S&D gave fewer differences when the basic method was used than when cumulative ranking was used (table 2). For SAN the situation was reversed. Except for mustard (Brassica adpressa) at least one estimate for each species differed significantly from the actual value, and for wild oats (Avena [atua) and Italian rye grass (Lolium multijlorum) all differed. Wild oats composition was overes6mated by M&H_Cand S&D_C; otherwjse it was underestimated. Italian ryegrass composition was overestimated in all cases. Lupines(Lupinlls spp.} and bur clover (Medicago hispida) were overestimated by SAN; all other significant differences were underestimates of species composition. Either M&H, S&D, or SAN_C therefore appears most suitable
Table 1-Comparison of actl/al and estimated avemge percenrages of dry-weight composition on allflUai grasJ-/amj and lhe mmlbtr of seu im'o/ved (NJI
---MeLhod or estimation!
Species Actual M&1l S&D SAN N
Percent of dry .... eight
AH'na barbara 1.46 ± 0.34) 1.00 ± 0.39·~ 1.02 ± 0.38 1.1 9 1 039 33
Bromlls arenorius 4.26 ± 0.80 4.02 ± 0.94 4.03 ± 0.93 4.29 ± 0.92 41
BronlllS diandrus 10.35 ± 1.34 7.28± 1.01·· 7.29 ± 1.00·· 7.67 ± 0.98u 48
BrOn/US mollis 23.96 ± 2.00 25.23 ± 2.41 25.18 ± 2.40 24.10 ± 2.13 48
Bron/lls rllbens 1.21 ± 0.24 1.18 ± 0.33 1.19 ± 0.33 1.3910.35 39
Corex &: iuncus spp. 9.34 ± 2.89 8.80 ± 2.77 8.79 ± 2.76 8.3712.52 25
EroJium batrys 23.28;t 2.08 24.52 ± 2.34 24.44 1 2.31 24.13 ± 2.01 48
Hordeum hystri:r 6.02;t 1.77 5.73 ± 1.68 5.72± 1.67 5.55 ± 1.56 24
Lotu.f pllrshianlls 2.45 ± 0.46 2.06 1 0.44 2.09 1 0.44 2.29 ± 0.46 45
Other broad-leaves 7.431 l.Ot 8.18 ± 1.25 8.19;t1.24 8.69 ± 1.19· 48
Other grasses 1.13 10.36 0.941034 0.9510.34 0.99 ± 0.32 32
Other legumes 1.93 ± 0.44 1.58 ± 0.50 1.61 ± 0.51 1.75±0.51 30
Trifolium spp. 6.18 ± 1.20 5.66 ± 1.29 5.67 ± 1.29 5.67 ± 1.24 48
Vu/pio spp. 11.05 ± 1.46 12.47 ± 1.79· 12.47 ± 1.78· 12.30 ± 1.67· 48
IData source: The San Joaquin Experimental Range, 1961-1969. ZM&H "" estimated by the coefficients of 'T Mannetje and Haydock (1963). S&D = estimated by the
coefficients orSmilh and Despain (1987). SAN = estimated by the coerticienls calculatcd from the San Joaquin Experimcntal Range dala.
'Mean ± Siandard error or the mean. #fhedirference(Actual - Estimate) is significant at: a.= 0.05 (.) & a.= 0.01 ( •• ) by the Bonferroni Multiple
Comparison Method.
3
for estimating dry~weight composition of annual grassland dominated by a single species.
Nevertheless, if emphasis is on estimat~ ing composition of the dominant species. cumulative ranking (regardless of the coefficient set used) will serve best. Cumulative ranking attempts to adjust for single species dominance, and it will give more accurate estimates for the more abundant species. Three species comprised over 90 percent of the herbage (table 2). The relative accuracy of estimates of their dry-weight compositions, by coefficient and ranking method, is given below:
Species M&H M&H_C 5&.0 S&D_C SAN SAN_C
Pc,
A"cnu 92.0 96.9 91.8 97.0 80.0 952 fotua
Bran/US 73.1 86.8 66.6 88.9 31.3 92.6 diondrus
Lotium 58.1 85.5 62.4 87.1 31.0 60.5 mU!liflorum
The basic ranking method will give more accurate estimates for the less abundant species. That effect became evident starting with the fourth most abundant species, bur clover. Relative accuracy of the estimates of bur clover composition was higher for M&H (91.4 percent) and S&D (82.0 percent) than for M&H_C (58.3 percent) and S&D_C (62.2 percent).
Data from SJER covered all range sites over all years and represented moderately grazed grassland. There, soft chess (Bromlls mollis) and broad-leaf filaree (Erodium botrys) were co-dom inant. Data from Tilden/" Park, on the other hand, covered a single site in one year and represented ungrazed grass~ land. There wild oats dominated. The results suggest, therefore, that on moderately grazed annual grassland the basic ranking method will be acceptable. On ungrazed areas, however, the more complicated cumulative ranking method should likely be used. Note that standardized use of cumulative ranking should not greatly af-fect the estimates of dry-weight composi-60n on grazed areas.
The Coefficients
Values of the coefficients are variable and highly data dependent.' Examination of our data sets quickly verified the dependency. Nevertheless, the coefficients esti-
USDA Forest Service Res. NOle PSW- 410.1990.

Table 2--Comparison of actual and estimat~d av~rage percentag~s of dry-wdgllt campasitian on annual grassland!
Method of estimation1
Species Actual M&H S&D SAN M&H_C S&D_C SAN_C
Percent 0/ dry weight
Avena /otliO 74.15 ± 1.20' 68.22 ± 0.48"'- 68.03 ± 0.48u 59.73 ± 0.36·· 76.43 ± 0.91" 76.37 ± 0.89** 70.51 ± 0.9S"
Brossico adpressa 1.73 :0.49 1.70: 0.32 l.70: 0.32 2.10:0.35 1.28 :0.35 1.27 ± 0.34 1.52 ± 0.3)
B,.omll.~ diandrus 4.31 : 0.41 5.47: 0.64 5.75 ± 0.62" 7.27 ± 0.68" 3.74 ± 0.61 3.83 ± 0.61 4.63 ± 0.65
Bromus mollis 1.00 ± 0.08 0.77±0.17 0.88±0.19 1.24 ± 0.27 0.44 :t 0.13*· 0.50 ± 0.14" 0.70 ± 0.20
Erodillm cicutarium 1.10 to.27 0.61 ± 0.26-· 0.63 ± 0.26" 0.83 ± 0.34 0.56 ± 0.26 .... 0.57 ± 0.26" 0.74 ± 0.33
LeNum mJlllij10rJJm 13.08 ± 0.42 18.56 ± 0.57" IS.OC±O.SI-· 22.10 ± 0.54-· 14.98 ± 0.54" 14.77 ± 0.51·· 18.25 ± 0.54··
Lupimtl spp. 1.12: 0.16 1.26 ± 0.19 l.30 ± 0.19 1.71 ±0.24· 0.72 ± 0.19' 0.73 ± 0.19· 0.95 ± 0.24 -----
Medicago hispida 2.78 ± 0.35 3.02 ± 0.30 3.28 ± 0.29 4.46 ± 0.38" 1.62 ± 0.35" 1.73 ± 0.34" 2.33 :0.42 ---Others 0.78 ± 0.12 0.39 ± 0.15· 0.42 ± 0.16 0.56 ± 0.21 0.23 ± 0.12·· 0.23 ± 0.12*· 0.30 ± 0.16*
IData source: Tilden Regional Park. 1960. 'M&H = estimated by the coefficients of 'T Mannetjc and Haydock (1963). S&D = estimated by the coefficients or Smilh and Despain (1987). SAN = estimated
by the coefficients calculated rrom the San Joaquin Experimental Range data. _C = as above but using the cumulative ntnking procedure. 'Mean ± standard error of the mean.
~e difference (Actual - Estimate) is significant at: ~ 0.05 (.) & CX;= 0.01 ( ... ) by the Bonferroni Multjple Comparison Method.
mate the average dry-weight compositions. The coefficients used to estimate dry-weight composition and those computed from the Tilden Park data (the 95 percent Cl. are given for SAN and TPB) were:
Source
M&H
S&D
SAN
Eslimated coefficients
PI Pl PJ
70.19 21.08 8.73
70.00 20.00 10.00
61.21 ± 0.87 24.80 ± 1.16 13.99 ± 2.04
TPB 76.88.± 0.82 14.08 ± 1.18 9.04 ± 2.00
11,e 95 percent C.1. for actual dryweigh 1 composition at SJER and Tilden Park were:
Rank Location lSI 2nd 3ed
SJER 55.31 ± 0.58 22.70 ± 0.33 10.78 ± 0.22
Tilden 74.02 ± 1.68 15.45 ± 1.08 6.00 ± 0.58 Park
By comparing these actual dry-weight values with the coefficients, we can see why M&H, S&D, and SAN (with the basic ranking method) do not estimate the Tilden Park values well. On average. those coefficients would underestimate the contribution of the first ranked species and overestimate the contributions of the second and third ranked
species. 1110se effects were more pronounced with SAN, and were not totally corrected by cumulative ranking. Using TPB with the SJER data should have produced the opposite effect. M&H and S&D, being nearer to the averages for SJER and Tilden Park than TPB and SAN, respectively, would produce less deviation from the true composition.
Because they estimate the average compositions, why do the cr. for SAN and TPB nol overlap those for Ihe actual values? The coefficienls are calculated by regression analysis, using the average composition by species within several data subsets. They are required to sum to 100, and their CI., therefore. are not independent. Confidence intervals for the actual com~sition. on the other hand, are calculated using the individual quadrat values for the ranks, regardless of species. The averages for the three ranks are not required to sum to 100, and their CI. are independent. Thus the values and numbers of values involved in each case are different.
Why It Works
The dry-weight-rank method appears to
4
work in a given situation because. as noted above, the coefficients computed for the ranks estimate the average dry-weight compositions of the flISt, second, and third ranked species. Also, although SAN and TPB differ considerably, their averages are 69 for rank one, 19 forrank two, and 12forrank three. For the actual values the averages are 65 for rank one, 19 for rank two, and 8 for rank three. The closeness of those values to the respective M&H coefficients suggeSts approximation to an average situation in nature for all grassland types. If such an average situation exists. the base dataset for the method' was indeed fortuitous.
Use It?
The method has not been field tested in the annual grasslands. We had the exact ranks from soned herbage. Whether errors in ranking and variation between individuals doing the ranking would greaUy increase deviation from true values remains to be tested in California. Elsewhere, those errors have been negligible or the training needed has been minimal or both .l2·tl Though not considered necessary in this study, weighting the coefficients by quadrat
USDA Foresl Service Res. Note PSW- 410. 1990.
I
yields may be dictated by an obvious correlation of yield and composition.
Although SAN and TPB differed, there appears to be no reason to compute new sets of coefficients for each location. The S&D coefficients (70, 20,10) should serve quite well if cumulative ranking is routinely used.
Several quadrats must be observed to obtain reliable estimates of the proportions of first, second, and third ranks assigned each species. Individual quadrat values, therefore, cannot be used to compute withintreatment or pasture variance. Several independent data sets must be collected, or one must be content with one value per species per treatment replication. Increased efflciency in use of available field time may. however, make collecting several data sets a viable alternative to harvesting and sorting herbage.
The answer to the question asked by this note appears to be in the affinnative. The dry-weight-rank method of estimating botanical composition can be a viable alternative to other methods in California's annual grasslands. The method appears especially well suited for monitoring where high statistical precision is not required.
ACKNOWLEDGMENTS:
We thank all who were involved in harvesting and sorting herbage at the San Joaquin Experimental Range, especially Juanita M. Anderson and Chrystal A. Bums (laboratory technicians) and Stanley E. Westfall (range technician).
END NOTES AND REFERENCES
IAigner. Dennis J. 1965. An estimation procedure for range composition problems. American Statistical Association Journal 60;308-319.
2Heady. Harold F.; Rader. Lynn. 195ft Modifications of the point frame. Journal of Range Management 11(2):95-96.
lNeal. Donald L.; Hubbard, Richard L.; Conrad. C. Eugene. 1969. A magnetic point frame. 1ournalof Range Management 22(3):202-203.
4Evans, Raymond A.; Love, R. Merton. 1957. The
.{tep-point method of sampling----G practical tool in range research. Journal of Range Management 10(5p08·212.
sConrad. C. Eugene; O'Regan. William G. 1973. Two-stage stratified .wmpling to estimate herbage yield. Res. Note PSW-278. Berkeley. CA: Pacific Southwest Forest and Range Experiment Station, Forest Service. U.S. Depanment of Agriculture; 5 p.
6Heady, Harold F.; Van Dyne, O. M. 1965. Pre
,Jiction of weight composition from poirlt samples on clipped herbage. Journal of Range Management 18(3),144.148.
70'Regan, William G.; Conrad, C. Eugene. 1975. Number of pins in two-stage stratified sampling for estimating herbage yield. Res. Note PSW-300. Berkeley, CA: Pacific Southwest Forest and Range Experiment Station. Forest Service, U.S. Department of Agriculture; 4 p.
I'T Mannetje. L.; Haydock, K. P. 1963. The dryweight-rank method for the botanical analysis of pasture. Journal ofthe British Grassiand Society 18(4}:268-275.
9Hughes. J. H. 1969. An evaluation of the dry weight rank method of determining species composition of plam communities. Master of Science Thesis. Colorado State Univ .• Ft. Collins. III p.
J01ones, R. M.; Hargreaves, J. N. G. \979. Improvements to the dry-weight-rank methodfor measuring botanical compositiol!. Grass and Forage Science 34:181-189.
IIBedell, T. E. 1973. Botanical composition of subclover-grass pasture as affected by single alld dual gra:ing by cattle and sheep. Agronomy Journal 65:502-504.
IlGillen, R. L.; Smith, E. L. 1986. Evaluation of the dry-weight-rank methodfor determining species composition in tall grass prairie. 10urnal of Range Management 39(3):283-285.
llSmith, Lamar, Despain, Del. 1987. The dry
weight-rank method of estimating species compositiOI!. [Unpublished draft supplied to the authors by Lamar Smith.]
14Caldwell. Richard M.; Menke. John W.; Duncan. D. A. 1985. Effects of sulfur fertili:atioll all productivity alld botanical compositioll of California onllilal grassland. Journal of Range Management 38(2): 108-113.
15Ratliff. Raymond D.; DUncan, Don A.; Westfall. Stanley E. 1990. California oak-woodlallli overstory species affect herbage understory: management implications. Unpublished draft supplied by author.
16Ratliff, Raymond D.; Heady, Harold F. 1962. Seasonal changes in herbage weight in an allnual grass community. Journal of Range Management 15(3)'146-149.
I7Neter.John; Wasserman. William. 1974. Applied linear statistical models. Homewood, IL: Richard D. Irwin. Inc.; 842 p.
IIFriedel. M. H.; Chewings, V. H.; Bastin, G. N. 1988. The use of comparative yield allli (by-weightrank techniquesfor monitoring arid range/and. Journal of Range Management 41(5):430-435.
The Authors:
RA YMOND D. RATLIFF, a range scientist. is assigned to the Station's wildlife monitoring and range research unit, headquartered in Fresno. Calir. WILLIAM E. FROST is a range scientist with California State University at Fresno and is h~anered at the San Joaquin Experimental Range.
Persons of any race, color, national origin, sex, age, religion, or with any handicapping conditions are welcome to use and enjoy all facilities, programs, and scrvices of the U.S. Department of Agriculture. Discrimination in any fonn is strictly against agency policy, and should be reported to the Secretary of Agriculture. WaShington, DC 20250.
5 USDA Forest Service Res. Note PSW- 410. 1990.