Embed Size (px)
DESCRIPTION
USDA Forest Service Forest Inventory and Analysis (FIA). MRLC Land Characterization Partners Meeting Nov. 7-8, 2000. OUTLINE. Federal mandates that FIA more effectively use remote sensing FIA Business needs from satellite data Classification detail Classification accuracy - PowerPoint PPT Presentation
Citation preview
USDA Forest ServiceForest Inventory and Analysis
(FIA)
MRLC Land Characterization Partners Meeting
Nov. 7-8, 2000
OUTLINE
• Federal mandates that FIA more effectively use remote sensing
• FIA Business needs from satellite data• Classification detail• Classification accuracy• Geographic priorities• Information needed by FIA
Management Team
Federal mandates that FIA more effectively use remote
sensing• 1998 Farm Bill• White House Office of Science and
Technology, Committee on the Environment and Natural Resources
• RAND Corporation review of forest monitoring conducted by federal agencies
• FIA Staff Director Rich Guldin http://fia.fs.fed.us/library.htm - Papers
Improve consistency of data and process using a top down
approach• Consistent data is like a common
language
• Centralized data collection, documentation and dissemination
• Decentralized analyses and decision making
• Economies of scale
FIA Business needs from satellite data
• Stable, dependable and economical production of accurate and consistent forest cover and land use maps
• Cover entire USA every 3 to 10 years
• Adherence to Federal Geographic Data Committee (FGDC) standards
FIA Business needs from satellite data
• Automated image processing algorithms that require little human intervention– Product consistency and accuracy– Cost reduction– Timeliness– Diversity of geospatial products– Henry Ford analogy
FIA Business needs from satellite data
• Improve accuracy of FIA statistics– Improve statistical efficiency through
stratification on forest v. nonforest cover– Improve statistical estimates for small
geographic areas (e.g., counties) using remotely sensed ancillary data
FIA Business needs from satellite data
• Improve timeliness of statistics in annualized FIA– 10% - 15% of field plots re-measured each year– Remotely sensed data “refreshed” every 3 to 5
years– This is a goal, not an absolute design requirement– Could use change detection to update
forest/nonforest in a 10-year MRLC product
FIA Business needs from satellite data
• Change detection– Keep forest/nonforest map current to
maintain FIA statistical efficiency through stratification
• 2005 update to 2000 landcover map
– Better identify spatial patterns of change in broad landscapes
FIA Business needs from satellite data
• Change detection– Improve accuracy of FIA statistical
estimates for• Timber removals• Reforestation• Afforestation
FIA Business needs from satellite data
• Help provide 30-m/1:24,000 products to FIA customers– User-friendly data base for GIS analyses– Attractive maps for distribution– Spatial analysis tool box (internal and
external users)
FIA Business needs from satellite data
• Characterize context surrounding each FIA field plot that are not easily measured in field– Landscape fragmentation– Size and shape of forest stand – Distance to roads, surface waters, other
land uses (important components of wildlife habitat)
FIA Business needs from satellite data
• Substitute satellite data for 1:40,000 NAPP– Reduce cost of FIA stratification with Phase 1
plots (1-km grid)– Continue to provide imagery for navigation by field
crews– 15-m pan-sharpened Landsat 7– 10-m pan-sharpened SPOT– Superimpose ancillary geospatial data (DLG,
DEM, topos., etc.)– Downloadable to field crews (federal, state,
contractors)
FIA Business needs from satellite data
• Implementation schedule– Prototype products available for 10% -20%
of USA by September 2002– Production system functional by
September, 2003
FIA Business needs from satellite data
• New remotely sensed products in the future– Net primary productivity or photosynthesis rates– Tree mortality– Indicators of drought, acidic deposition, or pest
attack– Boundaries between different forest stands– Indicators of human infrastructure (e.g., individual
buildings)
FIA Business needs from satellite data
• Developers’ tools to implement a variety of spatial models with centralized database– Linkages to other geospatial databases (e.g.,
Census Bureau)– Sharing geomatic models– Facilitate local improvements to national map
products• Accuracy• Classification detail
Minimum spatial resolution
• 1-km pixel for global/national assessments• 250-m to 30-m pixel for regional assessments• FIA definition of forest requires 30-m scale• Special assessment needs require 30-m
scale (e.g., riparian management zones)• Functionality request:
– change spatial scale of data to balance assessment needs with technology
Classification detail
• Might need separate MRLC products for forest cover and timberland use
• Forest v. nonforest (most valuable for statistical efficiency through stratification)
Classification detail
• FIA definition for forest uses– 10% stocking, which can be applied with field data
but not directly with remotely sensed data– At least 1-acre and 120-foot wide– Includes non-stocked clearcuts and
seedling/sapling stands– Accuracy of remotely sensed classifications need
to be high, but not necessarily 100%
Classification detail
• FIA definition for nonforested land use includes– Urban and suburban areas with tree cover– tree stocking less than 10%
• Pasture with tree cover• Rangeland
Classification detail
• Broad forest types (global/national assessments)– Softwoods– Bottomland hardwoods– Upland hardwoods– Mixed hardwoods and softwoods
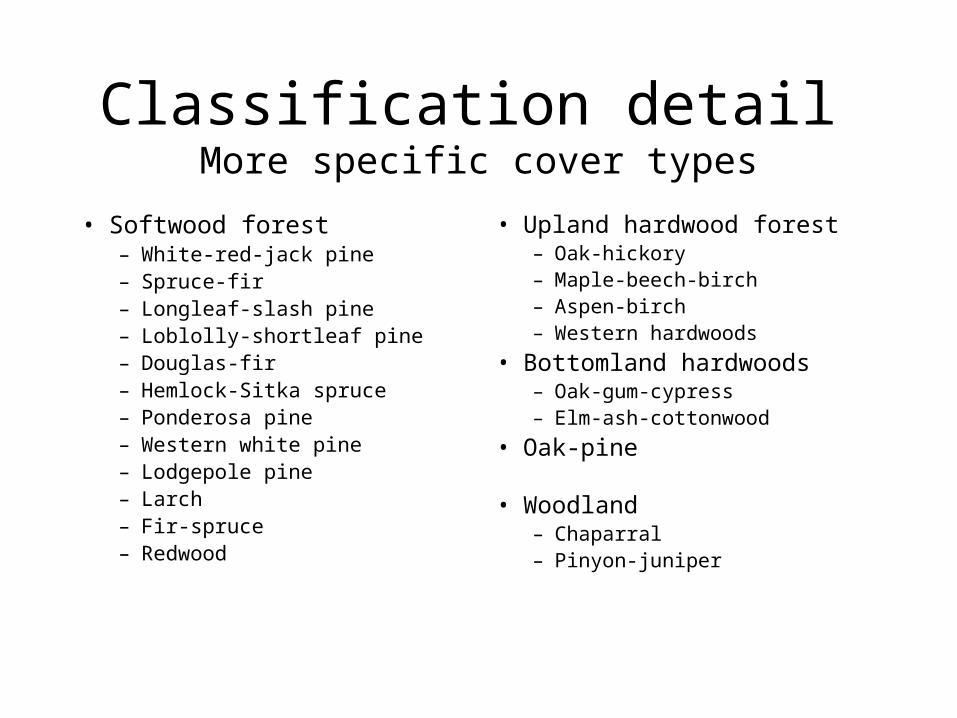
Classification detail More specific cover types
• Softwood forest – White-red-jack pine – Spruce-fir – Longleaf-slash pine – Loblolly-shortleaf pine – Douglas-fir– Hemlock-Sitka spruce – Ponderosa pine– Western white pine– Lodgepole pine– Larch– Fir-spruce– Redwood
• Upland hardwood forest– Oak-hickory – Maple-beech-birch – Aspen-birch– Western hardwoods
• Bottomland hardwoods– Oak-gum-cypress – Elm-ash-cottonwood
• Oak-pine • Woodland
– Chaparral– Pinyon-juniper
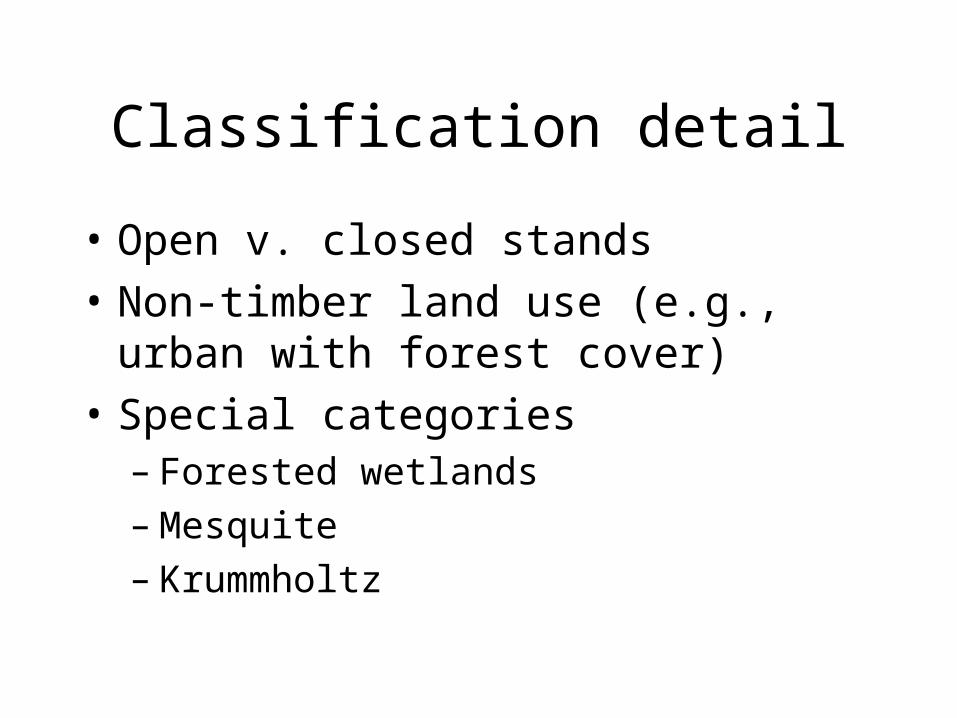
Classification detail
• Open v. closed stands
• Non-timber land use (e.g., urban with forest cover)
• Special categories– Forested wetlands– Mesquite– Krummholtz
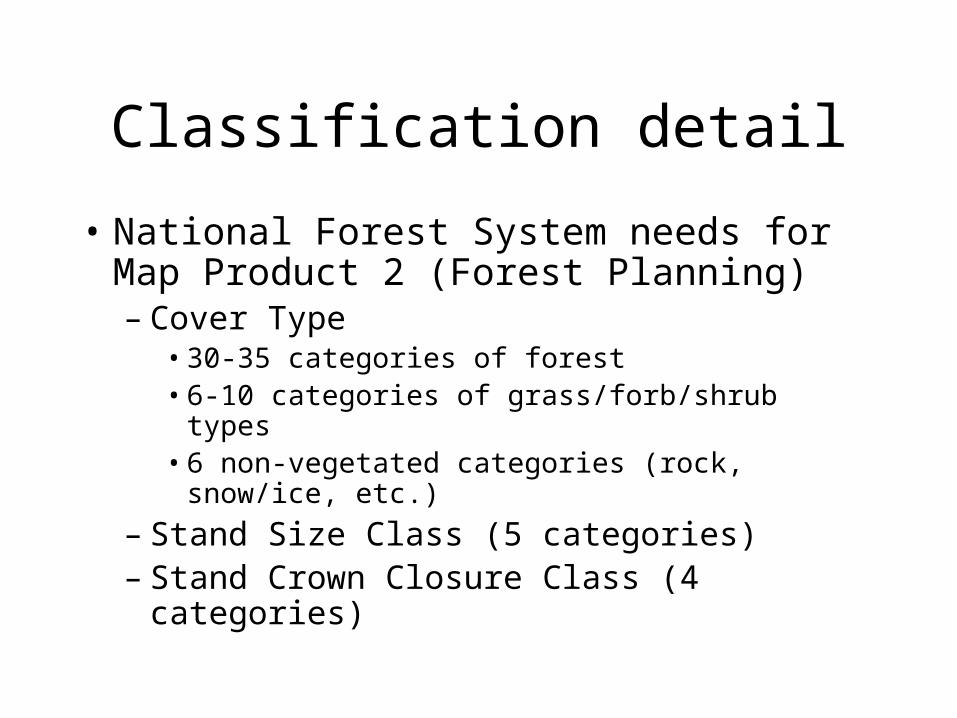
Classification detail
• National Forest System needs for Map Product 2 (Forest Planning)– Cover Type
• 30-35 categories of forest• 6-10 categories of grass/forb/shrub types• 6 non-vegetated categories (rock, snow/ice,
etc.)
– Stand Size Class (5 categories)– Stand Crown Closure Class (4 categories)
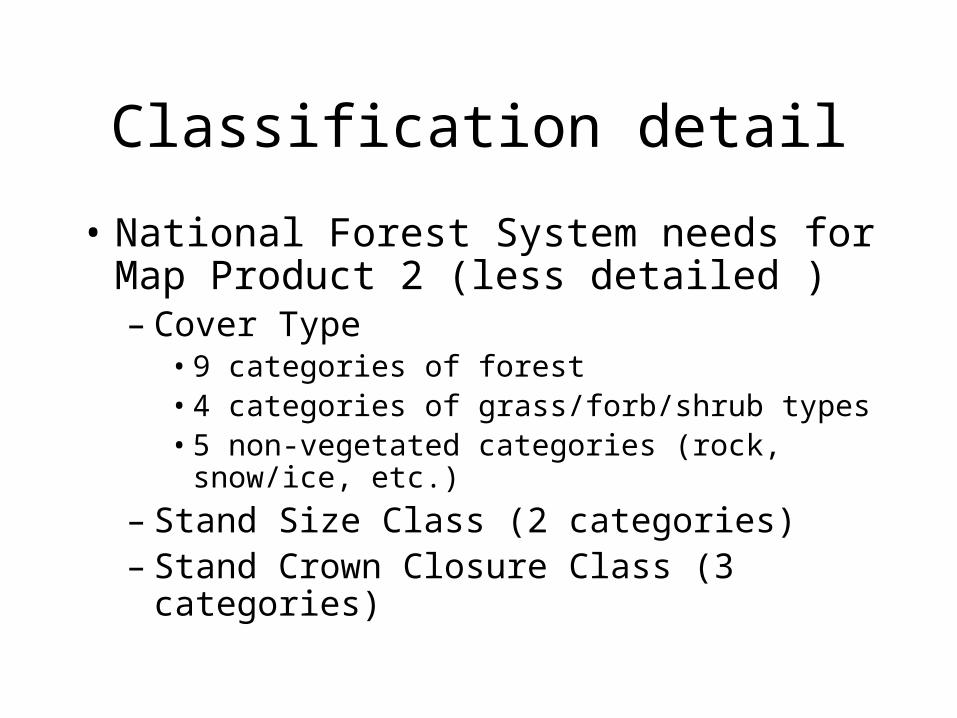
Classification detail
• National Forest System needs for Map Product 2 (less detailed )– Cover Type
• 9 categories of forest• 4 categories of grass/forb/shrub types• 5 non-vegetated categories (rock, snow/ice,
etc.)
– Stand Size Class (2 categories)– Stand Crown Closure Class (3 categories)
Classification detail
• Need to agree on detailed description– Classification rules for each category– Devil is in the details
Classification Accuracy
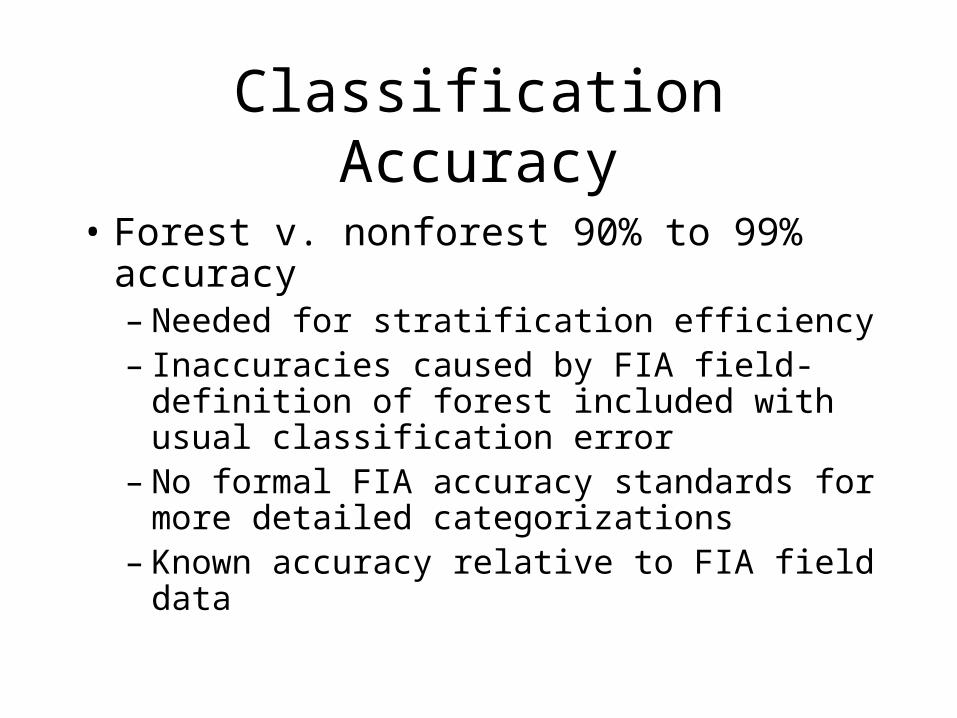
• Forest v. nonforest 90% to 99% accuracy– Needed for stratification efficiency– Inaccuracies caused by FIA field-definition
of forest included with usual classification error
– No formal FIA accuracy standards for more detailed categorizations
– Known accuracy relative to FIA field data
Classification Accuracy
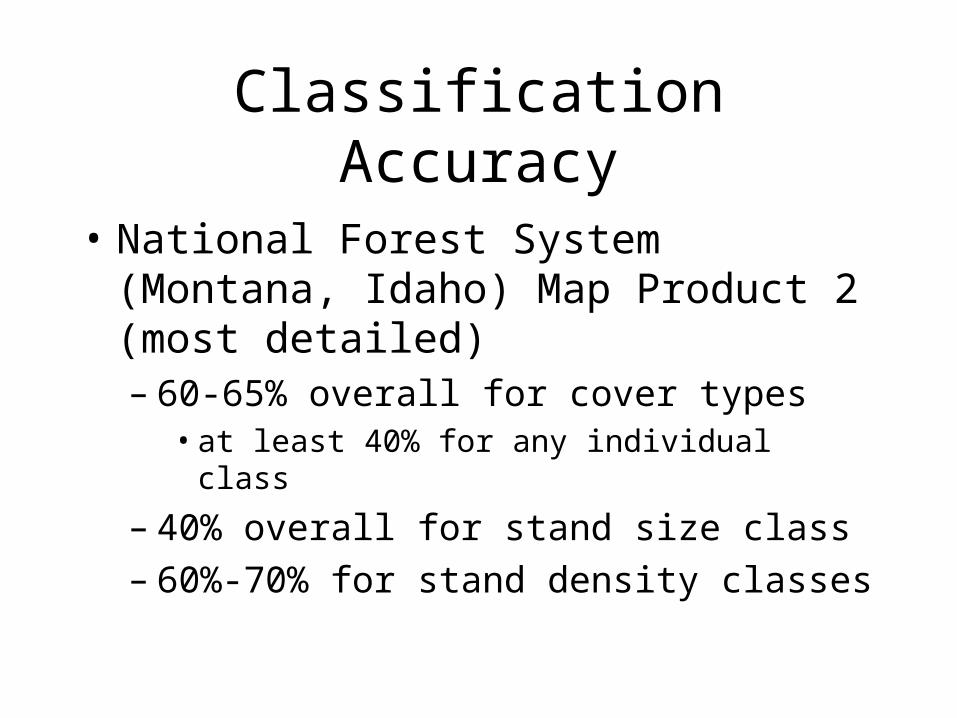
• National Forest System (Montana, Idaho) Map Product 2 (most detailed)– 60-65% overall for cover types
• at least 40% for any individual class
– 40% overall for stand size class– 60%-70% for stand density classes
Classification Accuracy
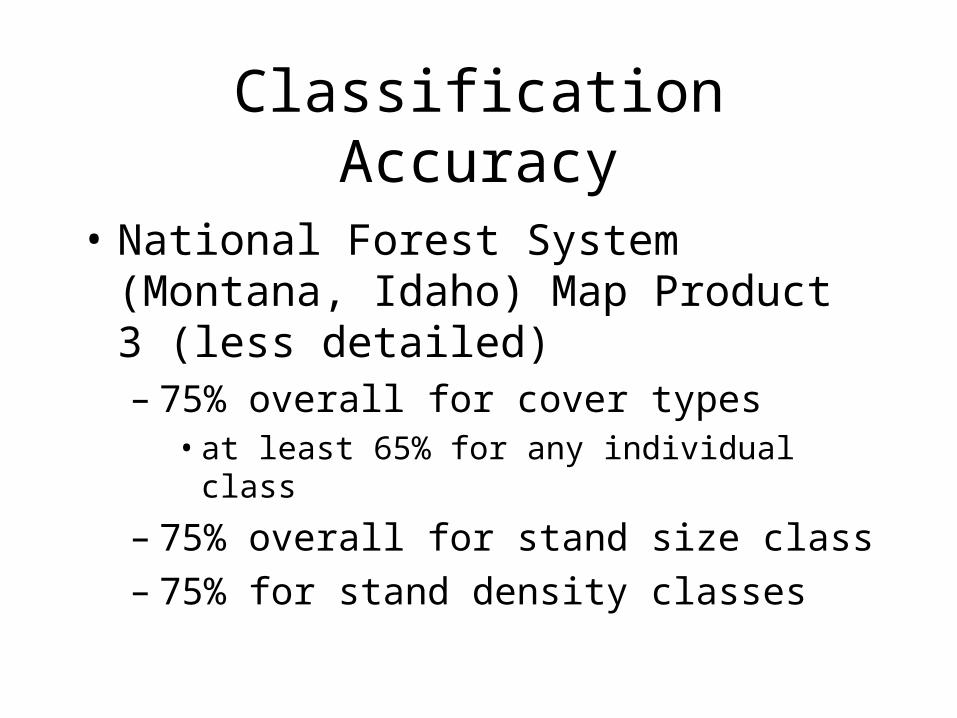
• National Forest System (Montana, Idaho) Map Product 3 (less detailed)– 75% overall for cover types
• at least 65% for any individual class
– 75% overall for stand size class– 75% for stand density classes
Timeliness
• Less than 5% net change in forest cover since date of imagery – stratification efficiency
• Less than 5 years old is desirable
Registration Accuracy
• Sufficient to link 1-acre FIA field plots to 30-m pixels
Geographic priorities Forest/non-forest mask September 2002
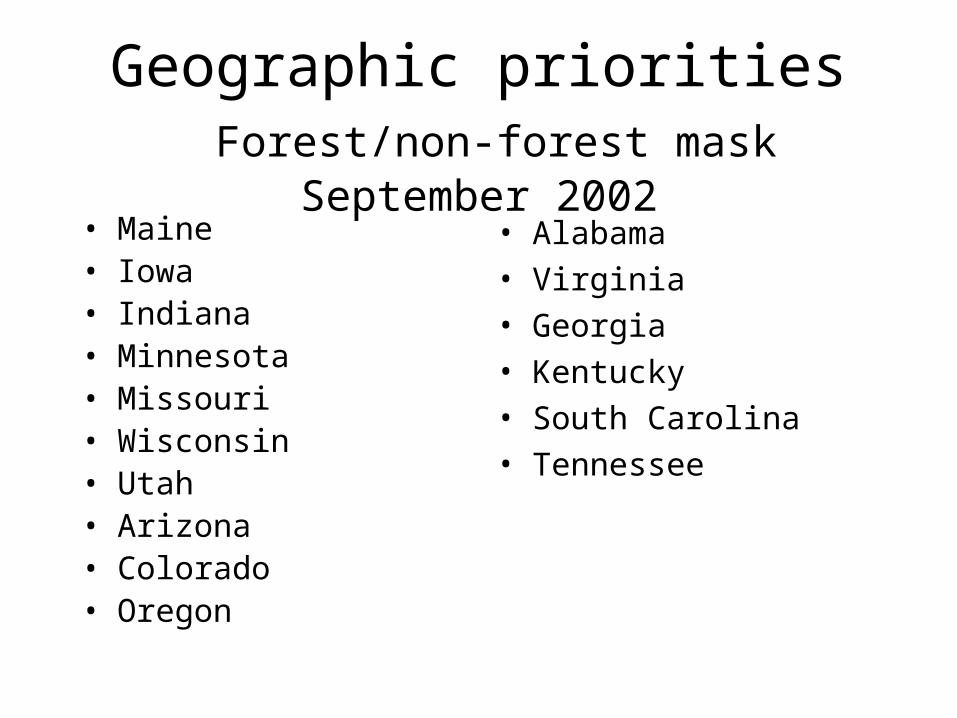
Geographic priorities Forest/non-forest mask September 2002• Maine• Iowa• Indiana• Minnesota• Missouri• Wisconsin• Utah• Arizona• Colorado• Oregon
• Alabama• Virginia• Georgia • Kentucky• South Carolina• Tennessee
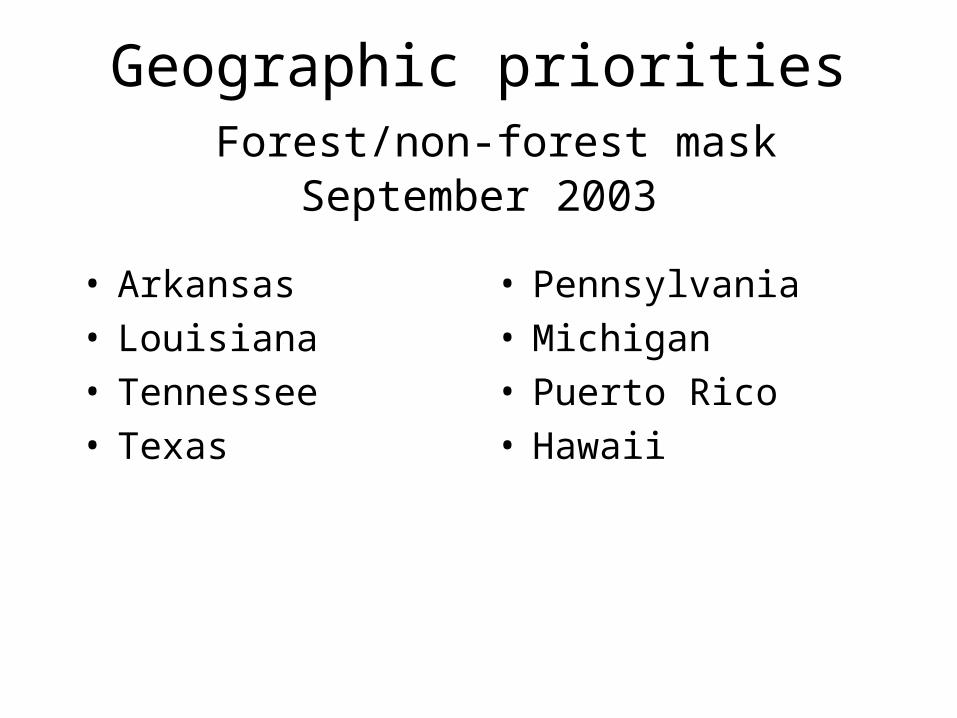
Geographic priorities Forest/non-forest mask September 2003
• Arkansas• Louisiana• Tennessee• Texas
• Pennsylvania• Michigan• Puerto Rico• Hawaii
Information needed by FIA
• Cost to FIA for Part II of MRLC
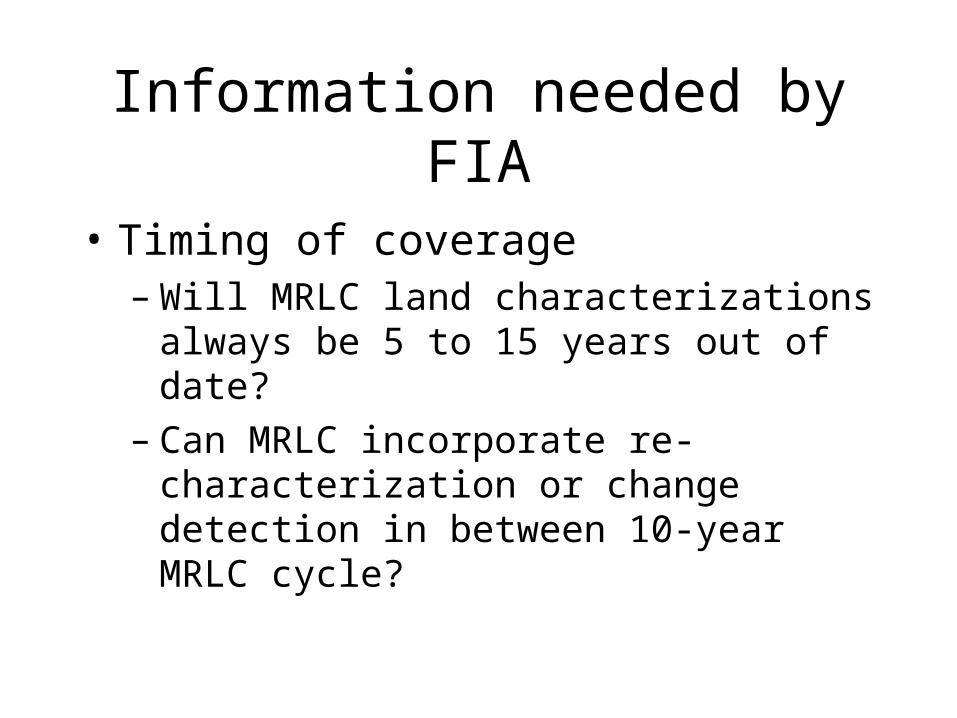
Information needed by FIA
• Timing of coverage– Will MRLC land characterizations always
be 5 to 15 years out of date?– Can MRLC incorporate re-characterization
or change detection in between 10-year MRLC cycle?
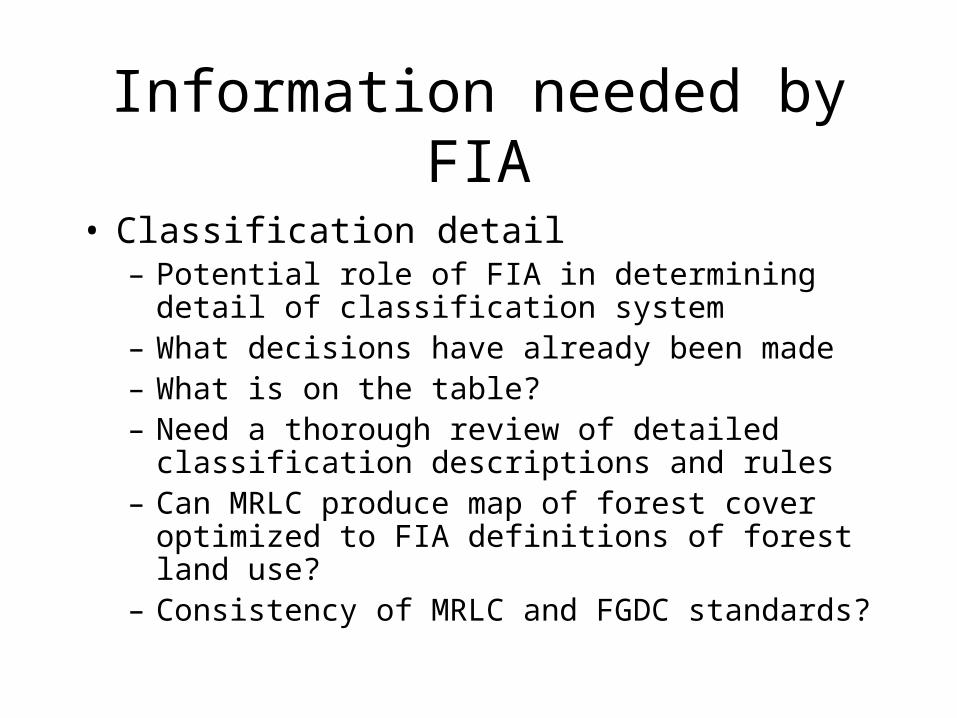
Information needed by FIA
• Classification detail– Potential role of FIA in determining detail of
classification system– What decisions have already been made– What is on the table?– Need a thorough review of detailed classification
descriptions and rules– Can MRLC produce map of forest cover optimized
to FIA definitions of forest land use?– Consistency of MRLC and FGDC standards?