Embed Size (px)
Citation preview

ESTIMAGE: A MOBILE APPLICATION IN AGRICULTURE FOR IMAGE TO
OBJECT COUNT ESTIMATION
YONGHONG CHEN10 Landing Lane, New Brunswick, NJ, USA. 08901
ABSTRACT
A major problem in the agricultural field is accurately estimating the yield of produce. Typically, farmers must wait to measure their crops after harvest using manual mechanical equipment. There is value in having better methods of yield estimation based on data that can be captured with inexpensive technology in the field, such as a smartphone. We develop a smartphone application for the Android platform with access to a cloud-based machine learning (ML) service that can estimate the amount of crop on a bush or tree from an image. The development of an image-to-object-count estimation system called Estimage is presented. The Estimage system consists of an Android client application for user interaction, a PHP server application for request handling, an Octave program for image normalization, and an open-source ML software package called ilastik that applies a predictive model to an image. The functionality of the mobile client application is tested and the system satisfies all of the functional requirements and most of the non-functional requirements. The system is tested on the images of coins on a table, logs stacked in a pile, and blueberries on the bush. We show that the system is capable of accurately estimating the count of objects in the images that have objects of the same (size, colour, and shape) as that used to train the model. The system is good at distinguishing object pixels from the image background pixels provided the background is consistent with that used to train the model.
Key Words/DefinitionsMaterial Design: Material design is a popular interface design style that
is recommended by Google [4]. It encourages good design with innovation and unified user experience across different platforms and device screen sizes.
Interface: In this thesis, interface is the user interface in an Android mobile application that is responsible for displaying contents to users.
Inflate: In Android application development, the action to create a user interface is called inflating an interface.
Desirable: A desirable requirement is an optional requirement that would be good for the system.
Proceedings of the Nova Scotian Institute of Science (2017)Volume 49, Part 1, pp. 119-143
* Author to whom correspondence should be addressed: Yonghong Chen E-mail: [email protected]

CHEN120
Essential: An essential requirement must be satisfied by the system to provide key functions to users.
SQLite Database: The SQLite database is a popular light-weight open source database that is fully supported by the Android operating system. Users’ data can be easily stored in and retrieved from the SQLite database without causing heavy burden on the memory or CPU of their hand-held device.
Image Record: Image record is an essential data structure in the Android application of the harvest-estimation system. It contains information about an image and its associated estimate. Instead of the original image, the image record keeps a thumbnail image version to reduce the memory requirement.
Estimate: An estimation on an image produces the estimate of the number of objects in the image and a density map image.
Density Map Image: The density map image is one of the results from the estimation on an image. It recognizes the density of the objects in an image by marking the non-object pixels black and the object pixels white.
INTRODUCTION
Industries are in need of high-tech methods to aid in their work flows so as to maintain efficient operation. In the agricultural field, farm-ers rely on manual methods and mechanical equipment to measure harvest, and this can only be done after the crop is picked. It would be beneficial to have a system that can estimate the crop yield prior to harvest so that, for example, farmers can better plan the use of human and material resources on the farm.
Machine learning (ML), a sub-area of artificial intelligence, focuses on the study and construction of algorithms that learn from and make predictions from data (Kohavi and Provost 1998). One method of machine learning that could help with harvest measurement is called object classification. However, object clas-sification is suitable for identifying separate objects and less so for estimating the number of overlapping objects (Fiaschi et al. 2012). A better approach is to estimate the density of pixels associated with the object integrated across the image. A machine learning method known as a random regression forest can be used to do this integra-tion. A random regression forest can provide an accurate result if the proper learning parameters are used and sufficient training examples of the object are provided. This paper illustrates the development of an image-to-object-count estimation system called Estimage, which includes an application for the Android platform that calls cloud-based machine learning methods. We will evaluate how well

121ESTIMAGE
the application functions to provide object count estimates to users based on the accuracy of count on different test objects.
DEFINITION OF THE PROBLEM
In agriculture, farmers have a difficult time accurately estimating the yield of their produce prior to harvest. They are unable to make a good estimate of the crop yields on the tree or on the bush until they harvest and measure all the crops with equipment that needs manual operation.
We wish to develop a smartphone application with access to a cloud-based machine learning service that can estimate the amount of crop on a bush or tree, such as the number of pints of berries on a blueberry bush. With this application, farmers would be able to predict their harvest volume and to take actions in advance to increase profit, such as making better marketing plans or planning use of available material and human resources on the farm.
PROJECT OBJECTIVES
The objective of this project is to design and develop the Estimage software system to help farmers evaluate crop yields in advance, and to assure the practicability of machine learning on a real life problem in the agricultural sector. The objective is achieved in two steps. First, a smartphone application is designed and implemented to allow farmers to upload images of crop fields to the server for esti-mation. Second, predictive models are built using existing machine learning software on the server to estimate the crop yields pictured in the uploaded images.
PROJECT SCOPE
The project presented herein is restricted in several ways to make it practical for an undergraduate honours research project. The smart-phone application is developed for the Android platform, which is an operating system for hand-held devices. The Android platform provides a convenient way for users to perform operations in the field and it has a larger user group than any other hand-held operating system, such as iOS or Windows Phone (McCracken 2013).

CHEN122
We have initially trained the Estimage system to estimate (1) the number of coins laying on a table and (2) the number of berries on a bush. Theoretically, the system can be used to estimate the count of any object in an image, such as fish, apples, cans, and hats.
The goal of this project is not to create the best machine learning method for developing the estimation. Instead, predictive models are trained using existing machine learning and image processing software. The focus is on the development and testing of the Android application that must capture, format, and request execution of the ML models on the server and then receive and display the predicted results on the mobile platform. On-going research is intended to build upon the preliminary ML methods that are used in this paper.
BACKGROUND
Android VersionIt is important to decide which version of Android we want our
Estimage system to support. Many versions of the Android operat-ing system have been developed, such as 4.0 (Ice Cream Sandwich), 4.4 (KitKat), 5.0 (Lollipop), and 6.0 (Marshmallow). In the Estim-age system, the Android application supports all Android versions above 4.0 Ice Cream Sandwich, which accounts for 90% of the total Android user population.
ServerIn this project, the server side programs for estimating objects in
an image are running on a popular operating system called Ubuntu Linux. A server application was written in PHP to communicate with the Android client application over HTTP. The server application is able to call an Octave program to invoke ilastik to run a machine learning predictive model on an image to generate an estimate of object count. The estimation results are saved in a MySQL database. The following subsections introduce these server-side techniques that are utilized in the Estimage system.
Server applicationA server application is a program that runs on a server computing
system that is capable of handling requests from clients. A server application can be written in different programming languages such as C++, Java, PHP, or Ruby on Rails. While most of these

123ESTIMAGE
programming languages take weeks or months for developers to learn, PHP is very easy to learn and developers can create a function- ing server application within several days. There are many mature PHP frameworks for development and the performance of a PHP server application is sufficient to handle requests for most business applications. PHP nicely supports communication over HTTP and MySQL database access by default, which is one of the most popu-lar server-side databases. For the above reasons, PHP is used in the Estimage system to develop a HTTP server application.
Machine LearningAs early as the 1950s, computer scientists studying artificial
intelligence have been interested in enabling computers to mimic a human’s way of learning from examples (Russell and Norvig 2003). However, the field of machine learning was not valued until the 1980s, when methods of developing more complex non-linear models were developed (Langley 2011). Since then, machine learning has flourished and is now one of the most promising fields of artificial intelligence.
Machine learning applications tackle the problem of how to develop predictive models directly from training examples. For example, marketing models are developed based on historical sales data. One of the most popular applications of machine learning is for recom-mending suitable products and services to customers who are surf-ing the web; examples of this are provided by companies such as Amazon and Yahoo!
Random Regression Forest AlgorithmOne category of algorithms defined in machine learning is called
supervised learning, which trains an algorithm to learn to pro-duce approximate outputs for specific inputs (Mohri et al. 2012). The “random regression forest algorithm” belongs to this category. A random regression forest is an ensemble learning method that works by building multiple decision trees at training time and outputting the mean prediction (regression) of the trees (Ho 1995). A decision tree is a predictive model which maps input variables related to an item to the estimate or prediction of the item’s target value (Quinlan 1986). In the tree structure, leaves serve as class tags and branches show unions of features that bring on those class tags. In random regression forest, decision trees are built with random selection of features.

CHEN124
The number of trees in a random forest and the maximum depth of each single tree are two key factors that affect the smoothness of the prediction and performance in the algorithm. In other words, few and shallow trees can create a model that is under-fitted to the data, while many and deep trees may create a model that is over-fitted to the data (Fiaschi et al. 2012). In the Estimage system, machine learning predictive models are built with 10 decision trees and 50 maximum depth.
ilastikilastik is an open-source image analysis tool that generates machine
learning predictive models based on training images and parameters (Sommer et al. 2011). Various workflows are provided to automate the processes of image classification, segmentation and analysis.
One of the provided workflows, called density counting, satisfies our need to count overlapped objects of similar appearance in im-ages such as blueberries or coins (Fiaschi et al. 2012). The process of density counting is as follows: (1) The objects to be estimated (shown in red) and their surroundings to be ignored (shown in green) are manually labelled in a set of training images using a marking tool. (2) ilastik uses image processing techniques to trans-form the marked pixels of labelled objects into image features. (3) The random regression forest algorithm introduced in Section is applied to train a predictive model based on the image features. (4) The model is used to predict the fraction of object per pixel.
Fig 1 Using ilastik to train a machine learning model on an image.

125ESTIMAGE
(5) ilastik calculates the estimate of the number of objects in an image by adding all of the fractions of objects per pixel in the image.
Fig 1 depicts how a machine learning predictive model is trained using ilastik. The left hand side of Fig 1 is a functional menu detailed in Fig 2. The menu lists all the functions provided by the density counting workflow of ilastik. (1) Images can be imported to ilastik in the Input Data option. (2) The Feature Selection option provides features that the random regression forest algorithm can use for constructing predictive models. (3) The Counting option allows the user to mark selected pixels as being of the object class to count. The Update Total Density button starts running the random regres-sion forest algorithm on an image to produce an estimate. (4) The Density Export and Batch Processing options are used for generat-ing a density map image for each image to be estimated in a batch process. The density map image depicts the density of objects in an
image by marking the non-object pixels black and the object pixels white. (5) The visibility options below are used to show or hide the colour marks that were made before.
Using ilastik, we are able to train ML predictive models for different objects and store them on a server for access by a client application.
Fig 2 Object mark-up options and other menu options in ilastik.

CHEN126
OctaveOctave is an open-source version of the popular MATLAB pro-
gramming environment. MATLAB was created to be a programming language to help people do numerical computations with computers on large sets of data (Eaton et al. 2015). It has become a common programming language for developing and executing machine learn-ing algorithms.
In the Estimage system, an Octave program runs on the server and is responsible for reformatting the selected image and calling ilastik to apply a chosen ML predictive model to estimate the number of objects in the image.
REQUIREMENT ANALYSIS
Refinement of ProblemThe primary goal of this project is to create the Estimage system
through which farmers are able to take a photo of a crop in the field and estimate its yield. The Estimage system has two components to be developed: an Android application and a server application. The Android application should provide an intuitive and user-friendly user interface and allow farmers to easily upload images of crop in the field to the server for estimation. The server application should be able to estimate the crop yield from the uploaded images using machine learning predictive models.
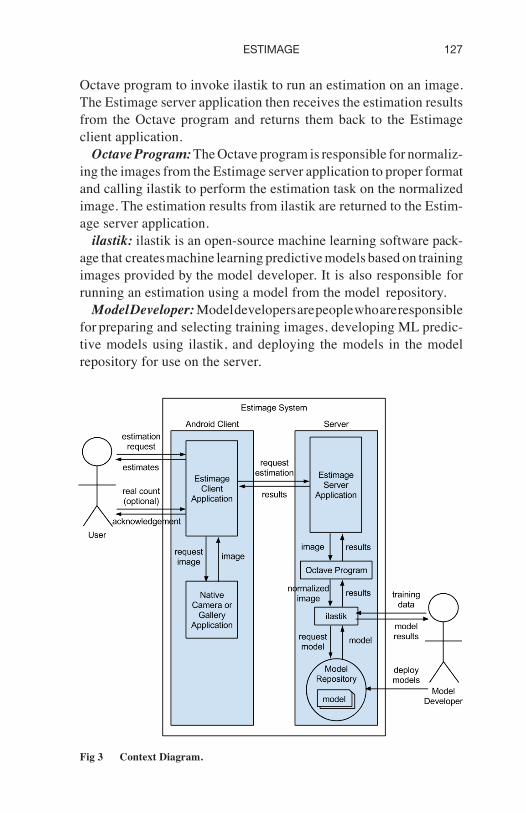
Context DiagramThis section presents how external actors (users) interact with the
Estimage system. The following is a list of entities found within and external to the system described in the context diagram in Fig 3.
User: Users are the farmers in the field who can use the system to estimate their harvest. They interact with the Estimage client ap-plication found inside the Estimage system.
Estimage Client Application: As the core component in the sys-tem, the Estimage client application provides an interface for the Estimage system to communicate with the users. It helps users take a photo with a camera application or select an image with a gallery application. It is also responsible for posting requests to the Estimage server application and displaying returned results.
Estimage Server Application: The Estimage server application handles requests from the Estimage client application, and calls the
127ESTIMAGE
Octave program to invoke ilastik to run an estimation on an image. The Estimage server application then receives the estimation results from the Octave program and returns them back to the Estimage client application.
Octave Program: The Octave program is responsible for normaliz-ing the images from the Estimage server application to proper format and calling ilastik to perform the estimation task on the normalized image. The estimation results from ilastik are returned to the Estim-age server application.
ilastik: ilastik is an open-source machine learning software pack-age that creates machine learning predictive models based on training images provided by the model developer. It is also responsible for running an estimation using a model from the model repository.
Model Developer: Model developers are people who are responsible for preparing and selecting training images, developing ML predic-tive models using ilastik, and deploying the models in the model repository for use on the server.
Fig 3 Context Diagram.

CHEN128
Model Repository: The model repository is a place to store the ML predictive models for different types of objects to be estimated. For the same object type, several models are also prepared for differ-ent sizes of objects in order to achieve the maximum accuracy. The model repository responds to requests from ilastik.
TESTING AND EVALUATION
This section focuses on the validation and verification of the Estim-age client application and its server-side components. Although sec-ondary to the mobile client application and cloud server development, the machine learning model performance of the system is evaluated in terms of the accuracy of the estimation functionality.
Non-functional TestingNon-functional requirements were tested manually on a physical
Nexus 4 Android smartphone and a Ubuntu server. The Nexus 4 An-droid smartphone has a Quadcore 1.5 GHz Krait CPU, a Adreno 320 GPU, 2 GB RAM, and 16 GB external storage. The Ubuntu server has a 2.40 GHz Intel@Xeon@Processor E5-2620 v3 and 8 GB RAM.
System Platform1. [Essential] [Satisfied] The Estimage client application should
be able to run on mobile devices with Android 4.0 Ice Cream Sandwich and above.
The Estimage client application was installed and tested on the Android 4.0, 4.4, 5.0, and 5.1 operating system and all functions worked well.
System Performance — Time and Space1. [Essential] [Satisfied] Little delay should be noticed when switch-
ing user interfaces in the Estimage client application. The maximum switching time between each pair of associated
interfaces was tested to be less than 0.2 seconds, which is hardly noticed.
2. [Desirable] [Satisfied] The response time of each button click should be less than 0.2 seconds.
The maximum response time of each button click was tested to be less than seconds.
129ESTIMAGE
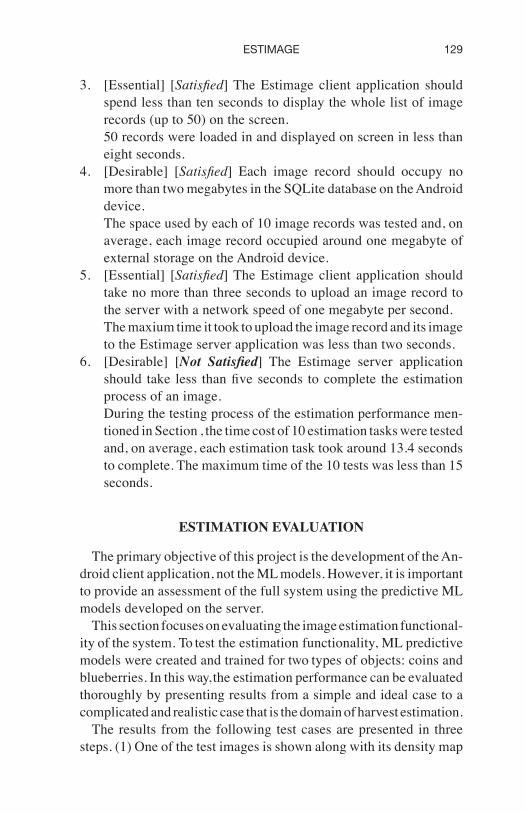
3. [Essential] [Satisfied] The Estimage client application should spend less than ten seconds to display the whole list of image records (up to 50) on the screen.
50 records were loaded in and displayed on screen in less than eight seconds.
4. [Desirable] [Satisfied] Each image record should occupy no more than two megabytes in the SQLite database on the Android device.
The space used by each of 10 image records was tested and, on average, each image record occupied around one megabyte of external storage on the Android device.
5. [Essential] [Satisfied] The Estimage client application should take no more than three seconds to upload an image record to the server with a network speed of one megabyte per second.
The maxium time it took to upload the image record and its image to the Estimage server application was less than two seconds.
6. [Desirable] [Not Satisfied] The Estimage server application should take less than five seconds to complete the estimation process of an image.
During the testing process of the estimation performance men-tioned in Section , the time cost of 10 estimation tasks were tested and, on average, each estimation task took around 13.4 seconds to complete. The maximum time of the 10 tests was less than 15 seconds.
ESTIMATION EVALUATION
The primary objective of this project is the development of the An-droid client application, not the ML models. However, it is important to provide an assessment of the full system using the predictive ML models developed on the server.
This section focuses on evaluating the image estimation functional-ity of the system. To test the estimation functionality, ML predictive models were created and trained for two types of objects: coins and blueberries. In this way, the estimation performance can be evaluated thoroughly by presenting results from a simple and ideal case to a complicated and realistic case that is the domain of harvest estimation.
The results from the following test cases are presented in three steps. (1) One of the test images is shown along with its density map

CHEN130
image. (2) The actual count with an estimate of each estimation is presented. (3) The error rate of each estimation is calculated as follows:
error rate = | actual count − estimate |
actual count
Coin EstimationThe first test case is coin estimation. Since coins of the same value
on the same background have the same appearance, most of the vari-ability of the objects to be estimated is eliminated, and the complexity of counting the objects in an image is reduced.
Objective The objective of the coin estimation is to test the estima-tion performance of an ideal environment, where the appearances of the objects and the background colour are controlled.
Materials and Methods Images of 25-cent Canadian coins on a wooden table were provided for training the ML models as well as testing the models’ performance. The shiny appearance of the 25-cent coin made it easily identifiable on the brown wooden background.
One image for training is depicted in Fig 4. Using ilastik, all the coins were labelled as one class of object to be recognized (shown in red) and examples of background pixels were marked as another class of object to be ignored (shown in green). The ilastik system generated features from the marked pixels and built a random regres-sion forest ML model using these pixels of coins and background.
To test the performance of the coin estimation, the Estimage client application was used to take 11 images of coins with the number of coins varying from 0 to 40. These images were taken at the same height above the table to maintain the size of coins in each test im-age. This way, we could see how the estimates varied as the number of coins increased.
Results In Fig 5, all the coins were properly identified by the system.Fig 6 depicts the estimates of 11 test images. When no coins were
in the image, the estimate was six. As the actual number of coins increased from 0 to 24, the estimate converged to the actual number of coins. When the actual number of coins increased from 24 to 40, the error of the estimate gradually increased in each estimation.
Fig 7 depicts the error rate as a function of the actual number of coins in the image. Since the error rate of the result from the image with no coins could not be calculated, it was not presented. As the

131ESTIMAGE
Fig 4 Sample Image of Coins for Training.
(a) Sample Image (b) Labelled Sample Image
Fig 5 Sample Image of Coins for Testing.
(a) Original Image (b) Density Map Image

CHEN132
actual number of coins increased from 0 to 24, the error rate fell dramatically to 0.21%. When the number of coins increased from 24 to 40, the error rate gradually increased, such that at 40 coins the error rate was 2.38%.
Fig 6 Comparison between the actual counts and the estimates of coins.
Fig 7 Graph of the error rate percentage as a function of the actual number of coins.

133ESTIMAGE
Discussion Based on the results, the estimation of coins is quite accurate when the actual number is at least 20. However, when the actual number of coins is 16 or less, the error rate increases signifi-cantly. This is because there is a minimum value for each pixel to be set when an image is being estimated by the ML predictive model. All values of each pixel in the image including the background are added up to create the estimate. This means that even when there are no objects in an image, the count will be greater than zero. This explains why the estimate would be 6 coins when there are no coins in the estimated image.
There are two conclusions from the coin estimation. (1) The system works pretty well on estimating the number of coins on a wooden table when the actual number is at least 20. (2) The ML estimation approach currently being used needs to be improved for small numbers of objects.
Blueberry EstimationThe blueberry estimation needs to take into account the different
appearances of blueberries as well as varying surroundings. On a blue-berry bush, there are mature blueberries with blue colour and immature ones with light green colour. Blueberries have surroundings such as green leaves, brown soil, and light sky. All of these factors can greatly affect the estimation result.
Objective The goal of the blueberry estimation is to verify the performance of the estimation in a realistic environment, where the color of the background can be different from or similar to the color of the objects to be estimated.
Materials and Methods Three images of a bush with mature blueberries were selected from the internet for training the ML pre- dictive model. In Fig 8 one of the training images pictured the mature blueberries with surroundings that could be easily distinguished from the blueberries. Most of the mature blueberries were labelled as one class to be recognized (shown in red) while the small blueberries a short distance away were ignored. The immature blueberries and the background were marked as another class (shown in green) to indicate that they should be excluded.
In total eight images were selected from the internet for testing. The first four images had a background that was consistent with the images for training the ML model and could be well distinguished from blueberries. The other four images had a mixed background

CHEN134
with mixture of colors that was similar to the blueberries in colour. To reduce the influence of blueberry size and focus on the influence of varying background, these eight test images were resized so that the number of pixels each blueberry occupied is similar to the blueberry size for training the ML model. Fig 9 depicts one of the images with a consistent background and Fig 10 depicts one of the images with a mixed background.
Fig 8 Sample Image of Blueberries for Training.
(a) Original Image (b) Labelled Image
Fig 9 Image of Blueberries with Consistent Background for Testing.
(a) Original Image (b) Density Map Image

135ESTIMAGE
Results Fig 9 shows the test result for one of the test images with a consistent background: all blueberries were recognized. While most of the background was recognized to be separate from the blueberries, a small portion of the background was mistakenly viewed as blueberries, some of which is circled in Fig 9.
Fig 10 shows the test results for one of the test images with a mixed background. All the blueberries were recognized. However, a large portion of the background at the top-right and bottom-right corner was misrecognized as blueberries.
Fig 10 Image of Blueberries with Mixed Background for Testing.
(a) Original Image (b) Density Map Image
For a real application the model likely estimates the number of pints of berries; however, the number of berries is more practical for our current testing. Fig 11 presents the actual counts and the estimates for the eight test images. The estimate of the number of blueberries in an image with a consistent background was close to the actual number of blueberries. However, in each image with a mixed background, the estimate of the number of blueberries was a lot more than the actual number of blueberries. Fig 12 depicts the

CHEN136
error rates of the results from the estimations. The estimation of each images with a consistent background had an error rate below 10%, while the estimation of each image with a mixed background had an error rate above 50%.
Fig 11 Comparison between the actual counts and the estimates of blueberries.
Fig 13 presents the error rates of test images with a consistent background. The mean of the error rates is 7.34% and the standard deviation is 2.65%. Fig 14 presents the error rates of test images with a mixed background. The mean of the error rates is 94.59% and the standard deviation is 32.14%.
Discussion The numbers of blueberries in all of the eight test images are overestimated because their backgrounds have parts rec-ognized as blueberries. But a consistent background causes fewer errors in estimating the number of blueberries compared to a mixed background. Judging from the test results, the light sky, brown soil, and green leaves are all excluded in the first four test images with a consistent background because the ML model has been trained to ignore these background pixels. Therefore, the first four test images have accurate estimates. However, the other four test images have a mixed background that is similar to the blueberries in colour and the images tend to mislead the model to recognize some parts of their backgrounds as blueberries. This causes large errors in the estimates of the other four test images.
For the blueberry estimation, there are two conclusions. (1) The system can make an accurate estimate of blueberries provided

137ESTIMAGE
Fig 14 Error rates of test images with a mixed background.
Fig 12 Depiction of the error rates in the blueberry estimation.
Fig 13 Error rates of test images with a consistent background.

CHEN138
the background is consistent to the one in the training images. (2) Improvements are needed in the ML approach being used to esti-mate the number of objects in an image with a mixed background.
LimitationsOne important factor that is not taken into account in these two
estimation experiments is the overlap between objects. The coin estimation experiment was set up to ensure that there was no over-lap between any of the coins in each test image, and the estimation performance in an ideal environment could be tested. However, the blueberry estimation was set up to test the performance in a realistic environment, which inevitably involves the overlap between blue-berries. Since the factor of overlap is hard to controlled, the two experiments above mainly focus on how estimation performance varies as the object appearance and image background change. Further experiments are needed to test the estimation performance in both ideal and realistic environments with control of overlap.
ConclusionFactors that affect the estimation accuracy include the appearance of
objects to be estimated and the image background. When the objects in an image can be distinguished easily from the background and have a similar size, colour, and shape, the estimation of the system is accurate. When the background is consistent with the training images of the ML model, the estimation also performs well. In order to get an accurate result, several steps should be followed when taking a photo for estimation.
(1) Select objects that have a similar appearance to the one used to train the ML predictive model. (2) Pick a background that is con-sistent with the training images. (3) Choose a distance and an angle so that the image pictures the objects with same size as the training images. (4) Cast enough light to the objects so that they are pictured in the same colour as the training images. (5) Take a photo in a way that the objects occupy at least half of the image.

139ESTIMAGE
SUMMARY AND CONCLUSION
This paper is concerned with the problem of providing farmers with a convenient software application for estimating crop yield in the field prior to harvest.
To solve the major problem, a software system called Estimage was created, which included an Android application for user interaction and a cloud-based machine learning service that could estimate the amount of crop pictured in an image. The Android application was analysed, designed, implemented and tested following the traditional system development process and was responsible for uploading im-ages to the server for estimation. The Android application provided users with an intuitive and user-friendly interface to manage their image records and estimation tasks.
ML predictive models were built and trained using an existing machine learning software package called ilastik. A PHP server application was created to call an Octave program which in turn invokes ilastik to apply a machine learning predictive model to an image so as to estimate the number of objects in the image. With the Estimage system, users can conveniently take photos of the crops in the field and upload these photos to the server for estimation using their mobile device.
Three test cases were created to evaluate the estimation perfor-mance of the ML predictive models on different objects in order to find out the factors that affected the estimation accuracy. The first test case was an ideal case estimating the number of identical coins on a wooden table. The second test case was a transitional case esti-mating the number of logs stacked in a pile. The last test case was a realistic case estimating the number of blueberries on a bush. The test results showed that the system could accurately estimate the number of objects in a suitable image. Suitable images depicted objects of the same shape, size, and colour as the ones used to train the ML model and thus they had a more accurate estimate. Further, the more consistent the background, the more accurate results an estimation had. These factors could be controlled by adjusting the distance or the angle to the objects when taking a photo of them.

CHEN140
FUTURE WORK
Although the Estimage system has satisfied the goal of this project, there are still many aspects to be improved as below.
(1) The system should have a user account management system that allows users to register a new account and login. The users’ in-formation can be saved for other research purposes. (2) The system should have backup copies of users’ image records on the server so that users can retrieve their image records to any Android mobile device using their accounts. (3) The system should help users to take a qualified image for better estimation of the number of objects. For example, the Android application could indicate how big an object should be in an image when users are taking a photo.
Currently, the prediction models are not very robust. There is need to process the image so as to better prepare the data prior to presenta-tion to the machine learning model. For example, the images could be normalized in terms of object size.
There are other aspects of our system that could be explored. Theoretically, the system can be expanded to estimate the count of any object in an image, such as fish, apples, cans and hats. For any industry that has a problem of counting similar objects, the system provides a potential solution. For example, there is a need in biology to count the number of bacteria in a culture dish under a microscope. This counting process can be time-consuming and error-prone for human beings. The Estimage approach could be introduced as a solution to this task.

141ESTIMAGE
APPENDIX A. TEST LOG
Table A.1 10 Tests on Estimage Client Application Performance.
Time (secs) Displaying Record List Interface Switching Button Click
7.779 0.117 0.005 7.820 0.334 0.003 7.742 0.267 0.006 7.759 0.069 0.004 7.704 0.291 0.003 7.750 0.240 0.001 7.633 0.042 0.001 7.712 0.050 0.003 7.725 0.279 0.001 7.734 0.246 0.003average 7.736 0.196 0.003min 7.633 0.042 0.001max 7.820 0.334 0.006
Table A.2 10 Tests on Size of Data Created on User’s Device.
Size (MB) Image Record Image Density Map Image Total
0.100 0.654 0.016 0.770 0.122 0.849 0.159 1.130 0.109 0.765 0.113 0.987 0.121 0.868 0.097 1.086 0.104 0.719 0.023 0.846 0.079 0.577 0.153 0.809 0.119 0.675 0.162 0.956 0.141 0.942 0.224 1.307 0.154 1.067 0.075 1.296 0.171 1.253 0.200 1.624average 0.122 0.837 0.122 1.081min 0.079 0.577 0.016 0.770max 0.171 1.253 0.224 1.624

CHEN142
Table A.3 10 Tests on Estimation Time Performance.
Time (secs) Android App Data Comm PHP Octave ilastik Total
0.111 1.672 0.748 3.6164 6.7896 12.937 0.135 1.349 1.338 4.2544 7.2176 14.294 0.084 0.683 0.869 5.1037 8.1723 14.912 0.096 1.136 1.43 3.644 6.704 13.010 0.113 1.799 1.222 3.6023 6.6677 13.404 0.132 1.371 1.536 3.6382 6.8218 13.499 0.122 1.587 1.118 3.6256 6.7574 13.210 0.115 1.108 0.821 3.6227 6.7083 12.375 0.133 0.665 1.516 3.6519 6.6771 12.643 0.127 1.837 1.568 3.6196 6.8434 13.995average 0.1168 1.321 1.2166 3.83788 6.93592 13.428min 0.084 0.665 0.748 3.6023 6.6677 12.375max 0.135 1.837 1.568 5.1037 8.1723 14.912
BIBLIOGRAPHY
DifferenceBetween.net. (2015). Difference Between TCP and HTTP. Retrieved from differencebetween.net/technology/internet/ difference-between-tcp-and-http/, 2015. Accessed 23 Nov. 2015.
Eaton, J.W., Bateman, D., Hauberg, S., & Wehbring, R. (2015). The GNU Octave 4.0 Reference Manual: Free Your Numbers. Samurai Media Ltd.
Fiaschi, L., Nair, R., Koethe, U., & Hamprecht, F.A. (2012). Learning to Count with Regression Forest and Structured Labels. In Proceedings of the International Conference on Pattern Recognition (ICPR 2012), Tsukuba, Japan, November 2012.
Google. (2015a). Introduction — Material design — Google design guidelines. Retrieved from google.com/design/spec/material-design/ introduction.html, 2015. Accessed 23 Nov. 2015.
Google. (2015b). Activity — Android Developers. Retrieved from devel-oper. android.com/reference/android/app/Activity.html, 2015. Accessed 23 Nov. 2015.
Google. (2015c). Dashboards — Platform Versions — Android Develop-ers. Retrieved from developer.android.com/intl/zh-cn/about/dashboards/ index.html, 2015. Accessed 23 Nov. 2015.
Google. (2015d). Fragments — Android Developers. Retrieved from developer. android.com/guide/components/fragments.html, 2015. Accessed 23 Nov. 2015.
Ho, T.K., (1995). Random Decision Forests. In Proceedings of the 3rd International Conference on Document Analysis and Recognition, pp 278-282, Montreal, QC, August 1995.
Kohavi, R. & Provost, F. (1998). Glossary of Terms. Machine Learning, 30:271-274.

143ESTIMAGE
Langley, P. (2011). The changing science of machine learning. Machine Learning, 82 (3):275-279, February 2011.
McCracken, H. (2013). Who’s Winning, iOS or Android? All the Numbers, All in One Place. Retrieved from techland.time.com/2013/04/16/ ios-vs-android/, April 2013.
Mohri, M., Rostamizadeh, A., & Talwalkar, A. (2012). Foundations of Machine Learning. MIT Press.
Quinlan, J.R. (1986). Induction of Decision Trees. Machine Learning, 1:81-106.
Russell, S.J. & Norvig, P. (2003). Artificial Intelligence: A Modern Ap-proach. Prentice Hall, 2nd edition.
Sommer, C., Strähle, C., Köthe, U., & Hamprecht, F.A. (2011). ilastik: Interactive Learning and Segmentation Toolkit. In Proceedings of the Eighth IEEE International Symposium on Biomedical Imaging (ISBI), pages 230-233.
Tutorials Point. (2015). Android — Architecture. Retrieved from tutorialspoint.com/android/android_architecture.htm, 2015. Accessed 23 Nov. 2015.