Embed Size (px)
Citation preview

Essential
Q2 2015 Results Presentation
August 11, 2015
2
Notice to Readers
This document is being distributed on a confidential basis by Capstone Infrastructure Corporation (“Capstone” or the “Corporation”). References to “we” “us”, “our” and similar expressions are to Capstone. This document is an outline of matters for discussion
only and no representations or warranties are given or implied. The information contained in this document is subject to discussion, completion and amendment. This document is not an offer, solicitation of an offer or invitation for the subscription or purchase of
or a recommendation of securities. It does not take into account the investment objectives, financial situation and particular needs of any investors. This document does not contain all the information necessary to fully evaluate any transaction or investment, and
you should not rely on the contents of this document. Any investment decision should be made based solely upon appropriate due diligence and, if applicable, upon receipt and careful review of any Confidential Information Memorandum or prospectus. Before
making an investment in the Corporation, an investor or prospective investor should consider whether such an investment is appropriate to such investor’s particular investment needs, objectives and financial circumstances and such investor should consult
investment, legal and tax advisers. Information, including forward-looking statements and financial outlook, in this presentation should not be considered as a recommendation in relation to holding purchasing or selling shares, securities or other instruments in
any company. This document and its contents are confidential to the person to whom it is provided and should not be copied or distributed in whole or in part or disclosed by such persons to any other person without our prior written consent.
Certain of the statements contained within this document are forward-looking and reflect management’s expectations regarding the future growth, results of operations, performance and business of Capstone Infrastructure Corporation (the “Corporation”) based
on information currently available to the Corporation. Forward-looking statements and financial outlook are provided for the purpose of presenting information about management’s current expectations and plans relating to the future and readers are cautioned
that such statements may not be appropriate for other purposes. These statements and financial outlook use forward-looking words, such as “anticipate”, “continue”, “could”, “expect”, “may”, “will”, “intend”, “estimate”, “plan”, “believe” or other similar words. These
statements and financial outlook are subject to known and unknown risks and uncertainties that may cause actual results or events to differ materially from those expressed or implied by such statements and financial outlook and, accordingly, should not be read
as guarantees of future performance or results. The forward-looking statements and financial outlook within this document are based on information currently available and what the Corporation currently believes are reasonable assumptions, including the
material assumptions set out in the management’s discussion and analysis of the results of operations and the financial condition of the Corporation (“MD&A”) for the year ended December 31, 2014 under the heading “Results of Operations”, as updated in
subsequently filed MD&A of the Corporation (such documents are available under the Corporation’s SEDAR profile at www.sedar.com).
Other potential material factors or assumptions that were applied in formulating the forward-looking statements and financial outlook contained herein include or relate to the following: that the business and economic conditions affecting the Corporation’s
operations will continue substantially in their current state, including, with respect to industry conditions, general levels of economic activity, regulations, weather, taxes and interest rates; that there will be no material delays in the Corporation’s wind development
projects achieving commercial operation; that the Corporation’s power infrastructure facilities will experience normal wind, hydrological and solar irradiation conditions, and ambient temperature and humidity levels; that there will be no material changes to the
Corporation’s facilities, equipment or contractual arrangements; that there will be no material changes in the legislative, regulatory and operating framework for the Corporation’s businesses; that there will be no material delays in obtaining required approvals for
the Corporation’s power infrastructure facilities or Värmevärden; that there will be no material changes in rate orders or rate structures for Bristol Water; that Bristol Water will implement rates prescribed in Ofwat’s final determination while pursuing a more
appropriate outcome through the Competition & Markets Authority; that there will be no material changes in environmental regulations for the power infrastructure facilities, Värmevärden or Bristol Water; that there will be no significant event occurring outside the
ordinary course of the Corporation’s businesses; the refinancing on similar terms of the Corporation’s and its subsidiaries’ various outstanding credit facilities and debt instruments which mature during the period in which the forward-looking statements and
financial outlook relate; market prices for electricity in Ontario and the number of hours Cardinal is dispatched; the price Whitecourt will receive for its electricity production considering the market price for electricity in Alberta, the impact of renewable energy
credits and Whitecourt’s agreement with Millar Western, which includes sharing mechanisms regarding the price received for electricity sold by the facility; the re-contracting of the PPA for Sechelt; that there will be no material change from the expected amount
and timing of capital expenditures by Bristol Water; that there will be no material changes to the Swedish Krona to Canadian dollar and UK pound sterling to Canadian dollar exchange rates; and that Bristol Water will operate and perform in a manner consistent
with management’s assumptions of the final regulatory outcome for AMP6, including, among others: real and inflationary changes in Bristol Water’s revenue, Bristol Water’s expenses changing in line with inflation and efficiency measures, and capital investment,
leakage, customer service standards and asset serviceability targets being achieved.
Although the Corporation believes that it has a reasonable basis for the expectations reflected in these forward-looking statements and financial outlook, actual results may differ from those suggested by the forward-looking statements and financial outlook for
various reasons, including: risks related to the Corporation’s securities (dividends on common shares and preferred shares are not guaranteed; volatile market price for the Corporation’s securities; shareholder dilution; and convertible debentures credit risk,
subordination and absence of covenant protection); risks related to the Corporation and its businesses (availability of debt and equity financing; default under credit agreements and debt instruments; geographic concentration; foreign currency exchange rates;
acquisitions, development and integration; environmental, health and safety; changes in legislation and administrative policy; and reliance on key personnel); risks related to the Corporation’s power infrastructure facilities (power purchase agreements; completion
of the Corporation’s wind development projects; operational performance; contract performance and reliance on suppliers; land tenure and related rights; environmental; and regulatory environment); risks related to Värmevärden (operational performance; fuel
costs and availability; industrial and residential contracts; environmental; regulatory environment; and labour relations); and risks related to Bristol Water (Ofwat price determinations; failure to deliver capital investment programs; economic conditions; operational
performance; failure to deliver water leakage target; SIM and the serviceability assessment; pension plan obligations; regulatory environment; competition; seasonality and climate change; and labour relations). For a comprehensive description of these risk
factors, please refer to the “Risk Factors” section of the Corporation’s Annual Information Form dated March 24, 2015, as supplemented by disclosure of risk factors contained in any subsequent annual information form, material change reports (except
confidential material change reports), business acquisition reports, interim financial statements, interim management’s discussion and analysis and information circulars filed by the Corporation with the securities commissions or similar authorities in Canada
(which are available under the Corporation’s SEDAR profile at www.sedar.com).
The assumptions, risks and uncertainties described above are not exhaustive and other events and risk factors could cause actual results to differ materially from the results and events discussed in the forward-looking statements and financial outlook. The
forward-looking statements and financial outlook within this document reflect current expectations of the Corporation as at the date of this document and speak only as at the date of this document. Except as may be required by applicable law, the Corporation
does not undertake any obligation to publicly update or revise any forward-looking statements and financial outlook.
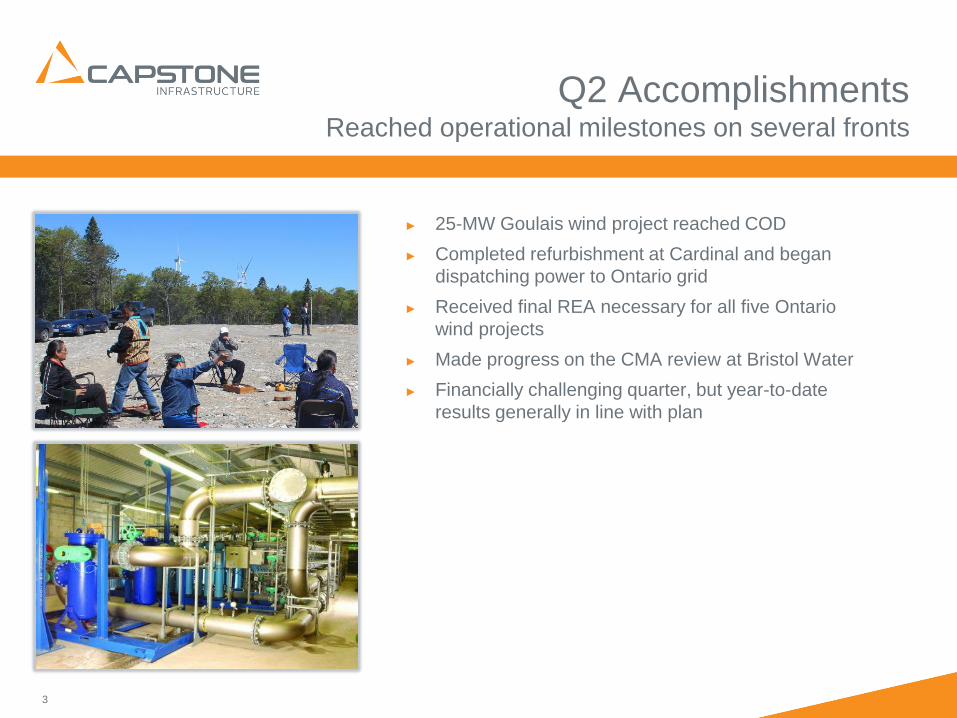
Q2 AccomplishmentsReached operational milestones on several fronts
3
► 25-MW Goulais wind project reached COD
► Completed refurbishment at Cardinal and began
dispatching power to Ontario grid
► Received final REA necessary for all five Ontario
wind projects
► Made progress on the CMA review at Bristol Water
► Financially challenging quarter, but year-to-date
results generally in line with plan
0
5
10
15
20
25
30
35
Q22014
Q22015
YTD2014
YTD2015
0
50
100
150
200
250
Q22014
Q22015
YTD2014
YTD2015
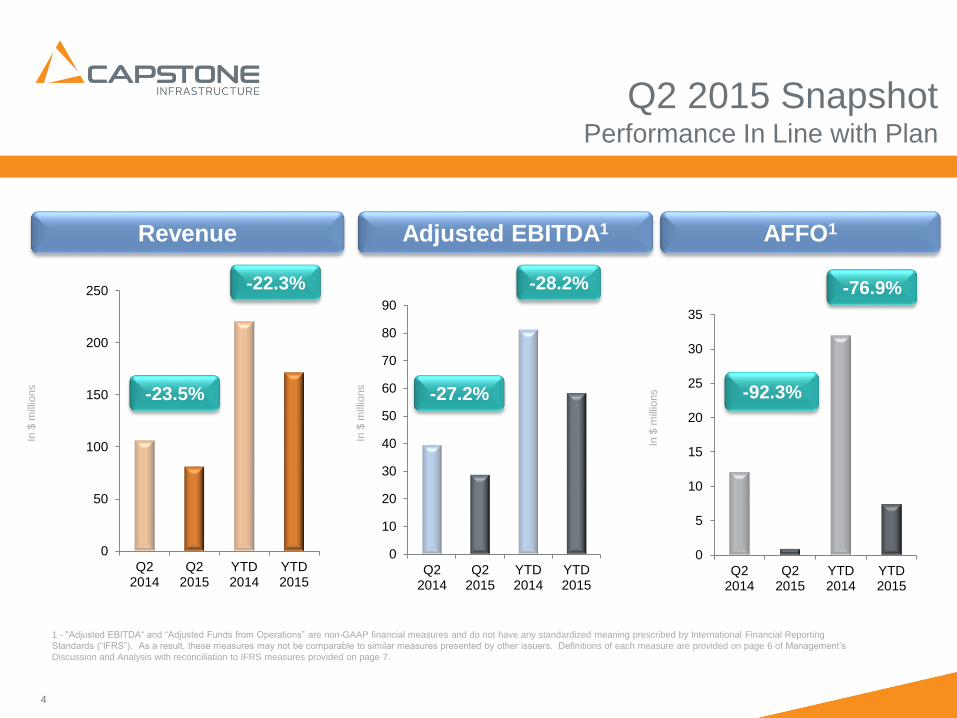
Q2 2015 SnapshotPerformance In Line with Plan
4
Revenue Adjusted EBITDA1
In $
mill
ions
AFFO1
1 - "Adjusted EBITDA“ and “Adjusted Funds from Operations” are non-GAAP financial measures and do not have any standardized meaning prescribed by International Financial Reporting
Standards (“IFRS”). As a result, these measures may not be comparable to similar measures presented by other issuers. Definitions of each measure are provided on page 6 of Management’s
Discussion and Analysis with reconciliation to IFRS measures provided on page 7.
In $
mill
ions
In $
mill
ions
-28.2%
-92.3%-23.5%
0
10
20
30
40
50
60
70
80
90
Q22014
Q22015
YTD2014
YTD2015
-22.3%
-27.2%
-76.9%
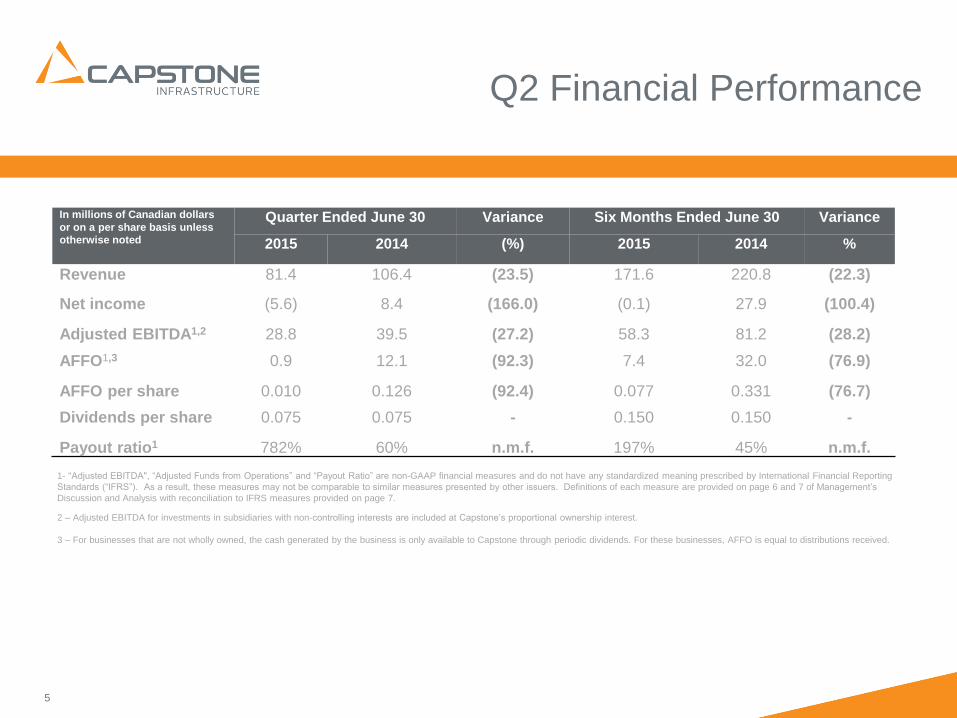
Q2 Financial Performance
5
In millions of Canadian dollars
or on a per share basis unless
otherwise noted
Quarter Ended June 30 Variance Six Months Ended June 30 Variance
2015 2014 (%) 2015 2014 %
Revenue 81.4 106.4 (23.5) 171.6 220.8 (22.3)
Net income (5.6) 8.4 (166.0) (0.1) 27.9 (100.4)
Adjusted EBITDA1,2 28.8 39.5 (27.2) 58.3 81.2 (28.2)
AFFO1,3 0.9 12.1 (92.3) 7.4 32.0 (76.9)
AFFO per share 0.010 0.126 (92.4) 0.077 0.331 (76.7)
Dividends per share 0.075 0.075 - 0.150 0.150 -
Payout ratio1 782% 60% n.m.f. 197% 45% n.m.f.
1- "Adjusted EBITDA", “Adjusted Funds from Operations” and “Payout Ratio” are non-GAAP financial measures and do not have any standardized meaning prescribed by International Financial Reporting
Standards (“IFRS”). As a result, these measures may not be comparable to similar measures presented by other issuers. Definitions of each measure are provided on page 6 and 7 of Management’s
Discussion and Analysis with reconciliation to IFRS measures provided on page 7.
2 – Adjusted EBITDA for investments in subsidiaries with non-controlling interests are included at Capstone’s proportional ownership interest.
3 – For businesses that are not wholly owned, the cash generated by the business is only available to Capstone through periodic dividends. For these businesses, AFFO is equal to distributions received.
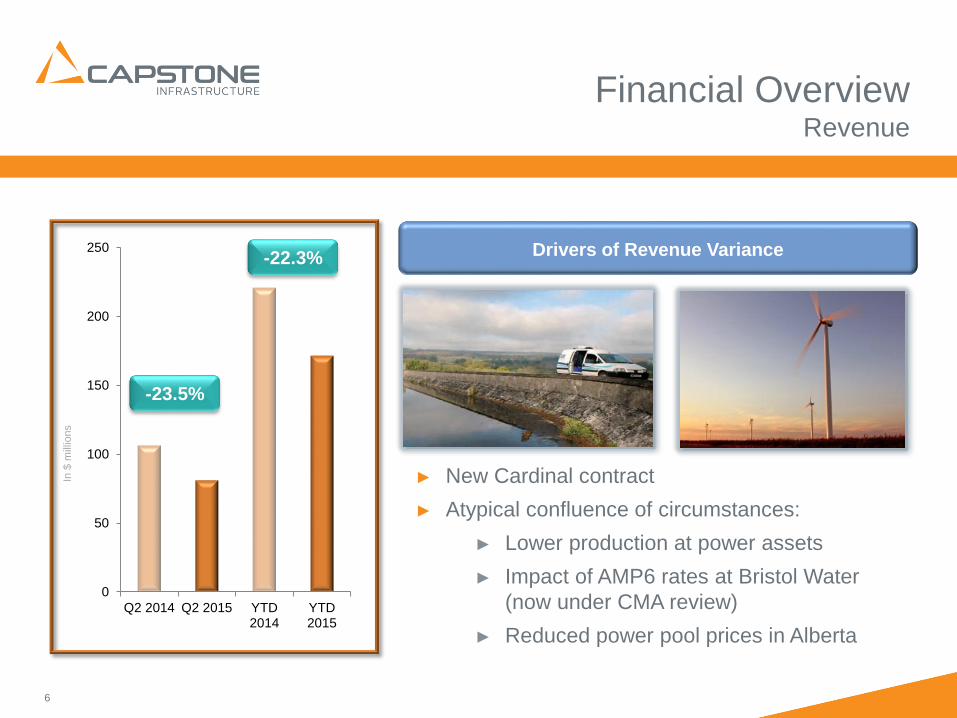
Financial OverviewRevenue
6
► New Cardinal contract
► Atypical confluence of circumstances:
► Lower production at power assets
► Impact of AMP6 rates at Bristol Water
(now under CMA review)
► Reduced power pool prices in Alberta
Drivers of Revenue Variance
In $
mill
ions
0
50
100
150
200
250
Q2 2014 Q2 2015 YTD2014
YTD2015
-23.5%
-22.3%
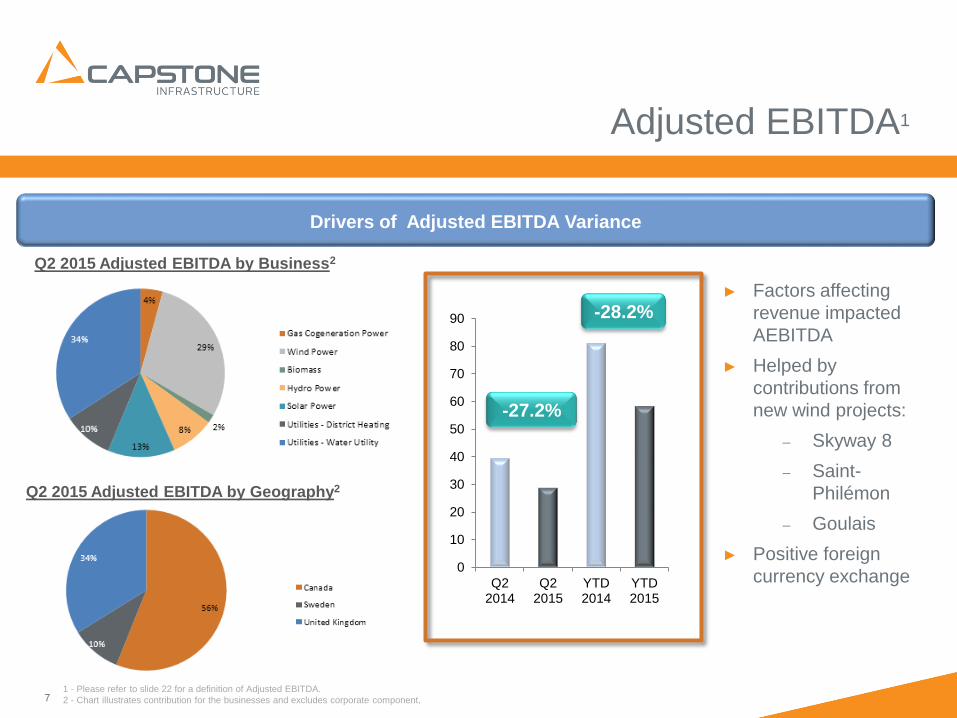
Adjusted EBITDA1
7
Variance in AFFODrivers of Adjusted EBITDA Variance
Q2 2015 Adjusted EBITDA by Business2
Q2 2015 Adjusted EBITDA by Geography2
1 - Please refer to slide 22 for a definition of Adjusted EBITDA.
2 - Chart illustrates contribution for the businesses and excludes corporate component.
► Factors affecting
revenue impacted
AEBITDA
► Helped by
contributions from
new wind projects:
‒ Skyway 8
‒ Saint-
Philémon
‒ Goulais
► Positive foreign
currency exchange
2%
0
10
20
30
40
50
60
70
80
90
Q22014
Q22015
YTD2014
YTD2015
-27.2%
-28.2%
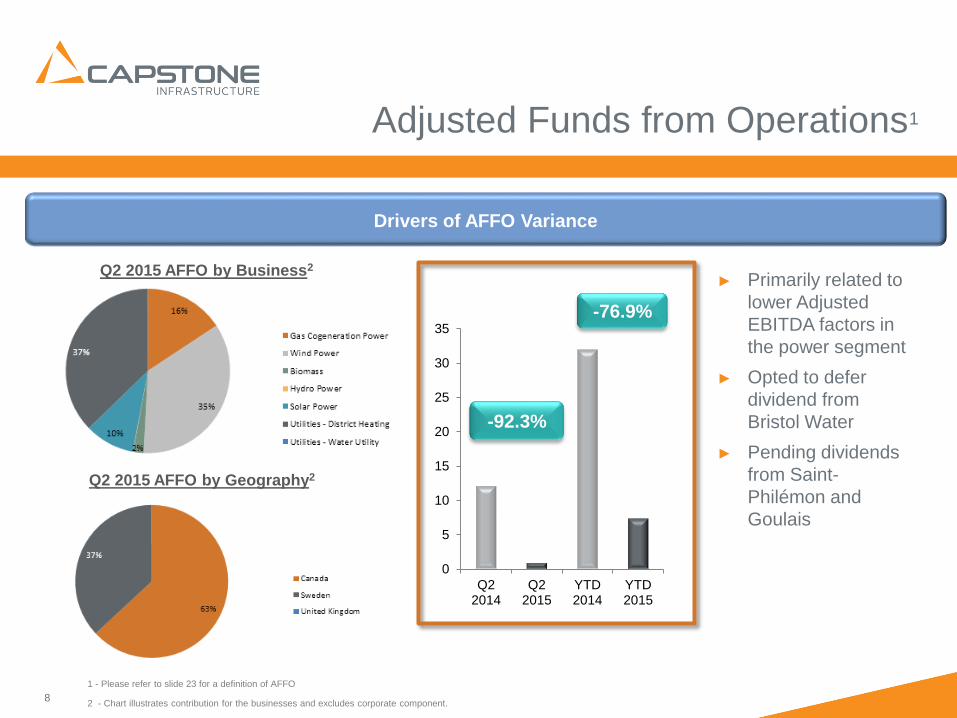
8
Adjusted Funds from Operations1
1 - Please refer to slide 23 for a definition of AFFO
2 - Chart illustrates contribution for the businesses and excludes corporate component.
► Primarily related to
lower Adjusted
EBITDA factors in
the power segment
► Opted to defer
dividend from
Bristol Water
► Pending dividends
from Saint-
Philémon and
Goulais
Drivers of AFFO Variance
Q2 2015 AFFO by Business2
Q2 2015 AFFO by Geography2
0
5
10
15
20
25
30
35
Q22014
Q22015
YTD2014
YTD2015
-76.9%
-92.3%
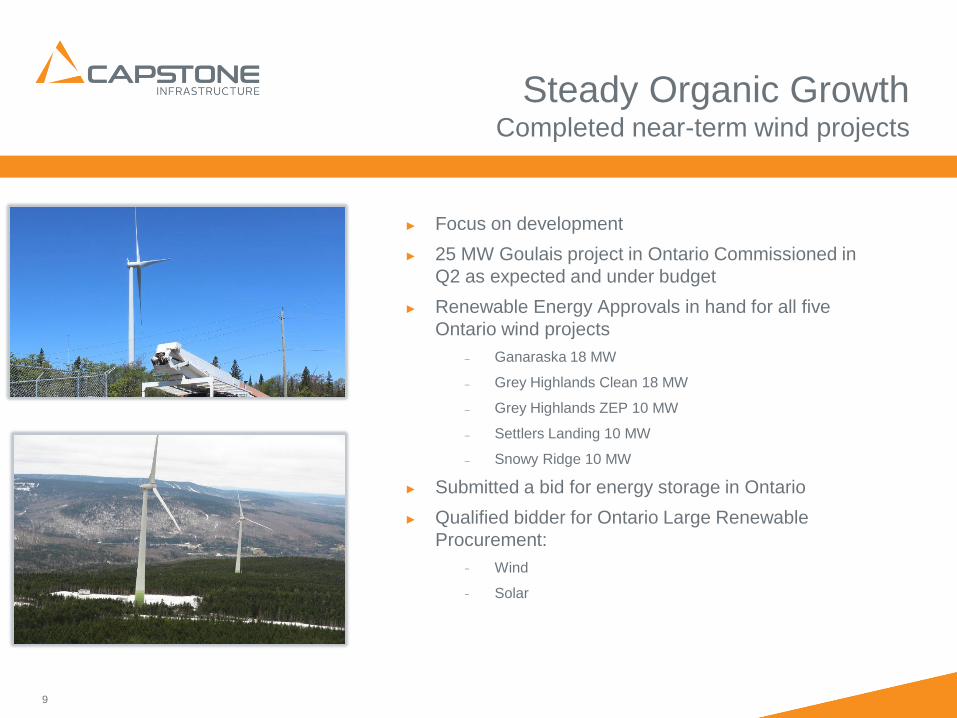
Steady Organic GrowthCompleted near-term wind projects
9
► Focus on development
► 25 MW Goulais project in Ontario Commissioned in
Q2 as expected and under budget
► Renewable Energy Approvals in hand for all five
Ontario wind projects
‒ Ganaraska 18 MW
‒ Grey Highlands Clean 18 MW
‒ Grey Highlands ZEP 10 MW
‒ Settlers Landing 10 MW
‒ Snowy Ridge 10 MW
► Submitted a bid for energy storage in Ontario
► Qualified bidder for Ontario Large Renewable
Procurement:
ᅳ Wind
ᅳ Solar
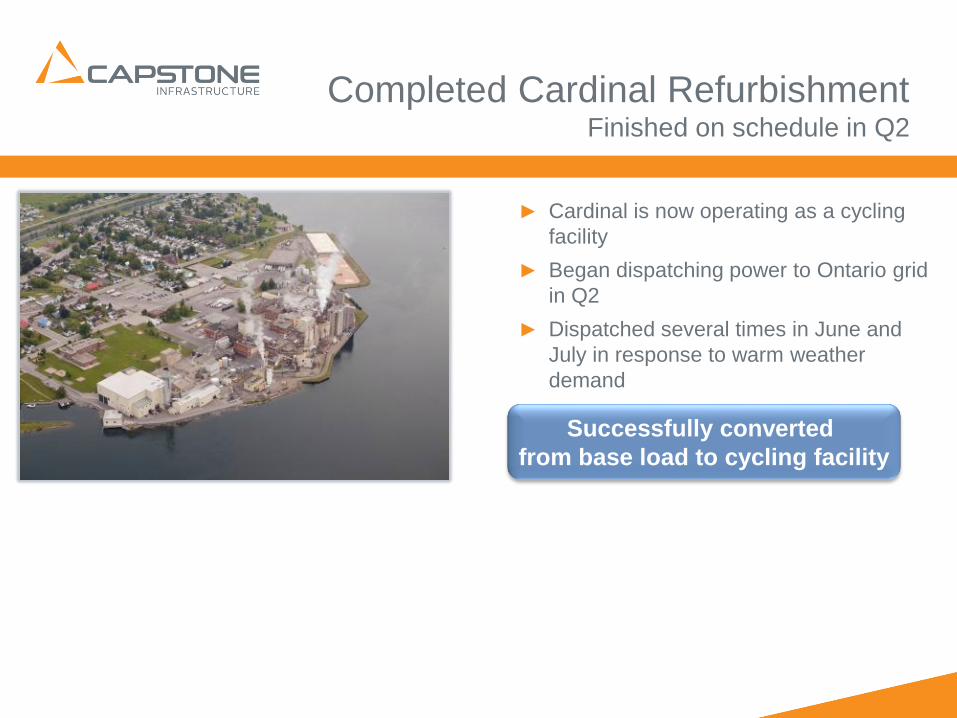
Completed Cardinal RefurbishmentFinished on schedule in Q2
► Cardinal is now operating as a cycling
facility
► Began dispatching power to Ontario grid
in Q2
► Dispatched several times in June and
July in response to warm weather
demand
10
Successfully converted
from base load to cycling facility
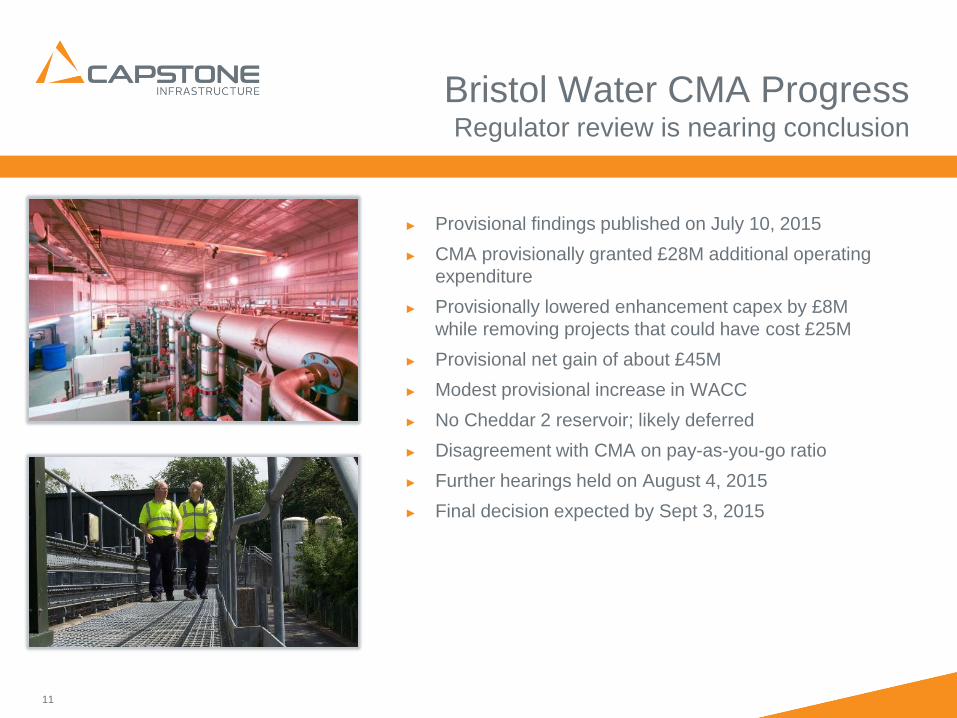
Bristol Water CMA ProgressRegulator review is nearing conclusion
11
► Provisional findings published on July 10, 2015
► CMA provisionally granted £28M additional operating
expenditure
► Provisionally lowered enhancement capex by £8M
while removing projects that could have cost £25M
► Provisional net gain of about £45M
► Modest provisional increase in WACC
► No Cheddar 2 reservoir; likely deferred
► Disagreement with CMA on pay-as-you-go ratio
► Further hearings held on August 4, 2015
► Final decision expected by Sept 3, 2015
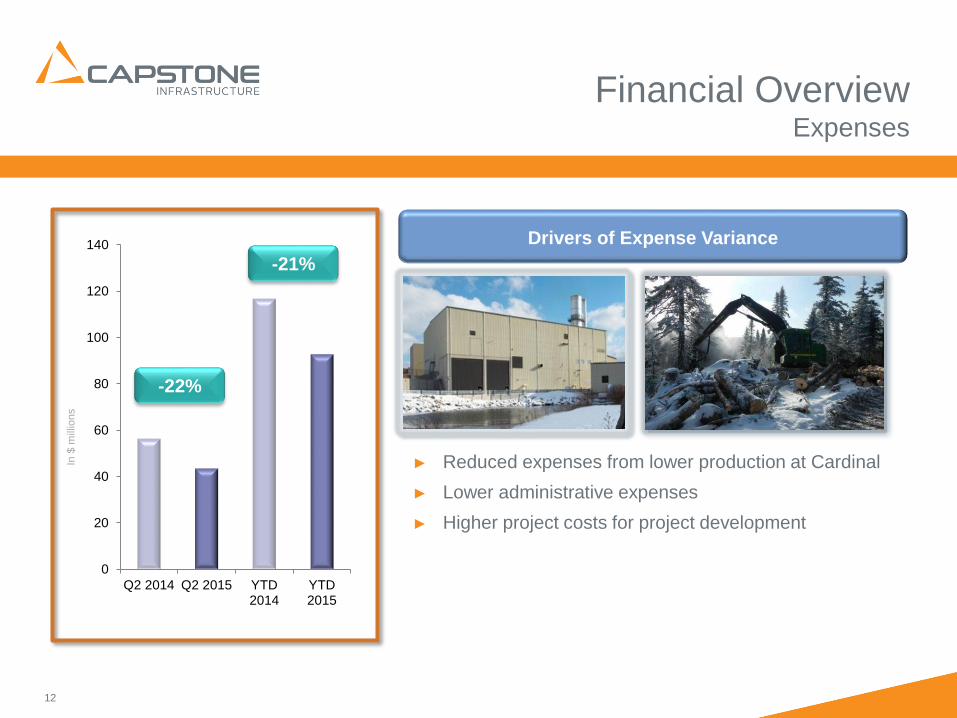
Financial OverviewExpenses
12
In $
mill
ions
► Reduced expenses from lower production at Cardinal
► Lower administrative expenses
► Higher project costs for project development
Drivers of Expense Variance
0
20
40
60
80
100
120
140
Q2 2014 Q2 2015 YTD2014
YTD2015
-21%
-22%
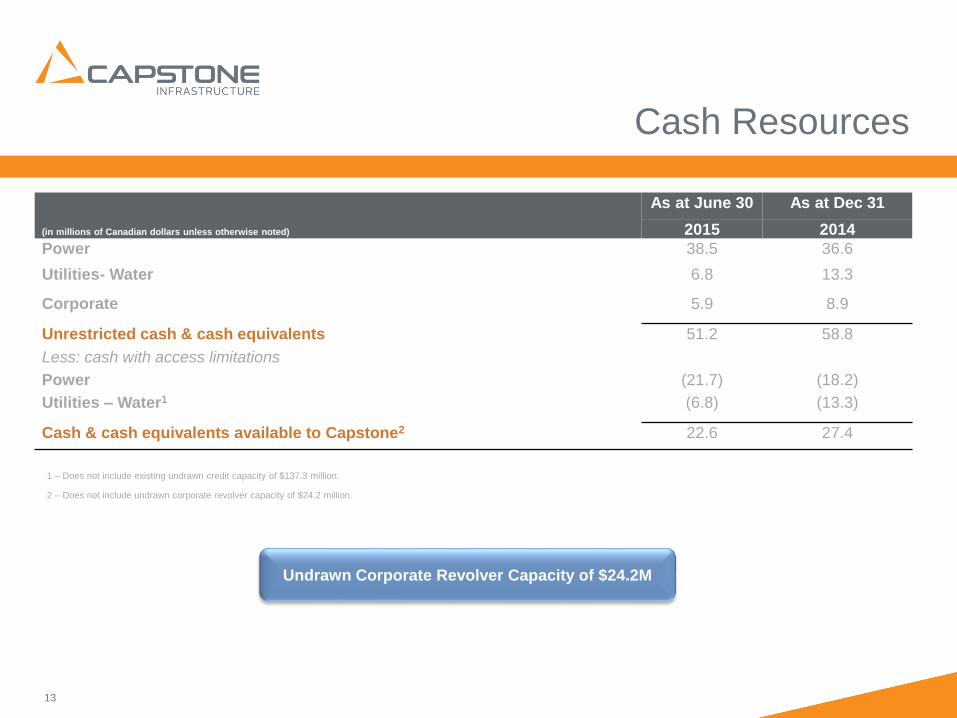
Cash Resources
13
(in millions of Canadian dollars unless otherwise noted)
As at June 30 As at Dec 31
2015 2014
Power 38.5 36.6
Utilities- Water 6.8 13.3
Corporate 5.9 8.9
Unrestricted cash & cash equivalents 51.2 58.8
Less: cash with access limitations
Power (21.7) (18.2)
Utilities – Water1 (6.8) (13.3)
Cash & cash equivalents available to Capstone2 22.6 27.4
1 – Does not include existing undrawn credit capacity of $137.3 million.
2 – Does not include undrawn corporate revolver capacity of $24.2 million.
Undrawn Corporate Revolver Capacity of $24.2M
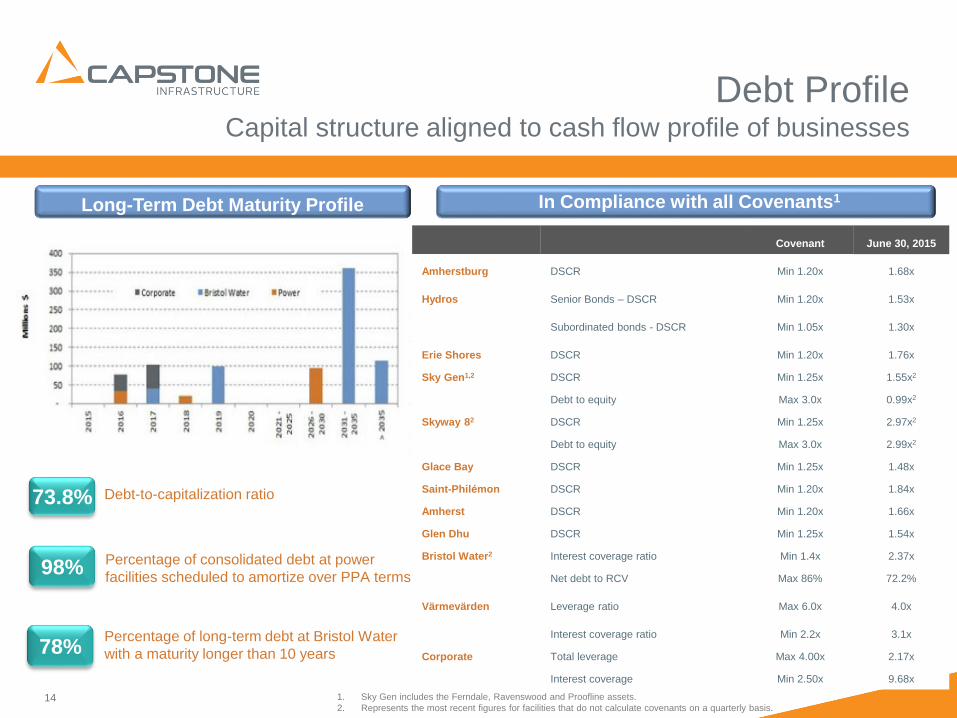
Debt ProfileCapital structure aligned to cash flow profile of businesses
14
In Compliance with all Covenants1
1. Sky Gen includes the Ferndale, Ravenswood and Proofline assets.
2. Represents the most recent figures for facilities that do not calculate covenants on a quarterly basis.
73.8%
Long-Term Debt Maturity Profile
Debt-to-capitalization ratio
98% Percentage of consolidated debt at power
facilities scheduled to amortize over PPA terms
78%Percentage of long-term debt at Bristol Water
with a maturity longer than 10 years
Covenant June 30, 2015
Amherstburg DSCR Min 1.20x 1.68x
Hydros Senior Bonds – DSCR Min 1.20x 1.53x
Subordinated bonds - DSCR Min 1.05x 1.30x
Erie Shores DSCR Min 1.20x 1.76x
Sky Gen1,2 DSCR Min 1.25x 1.55x2
Debt to equity Max 3.0x 0.99x2
Skyway 82 DSCR Min 1.25x 2.97x2
Debt to equity Max 3.0x 2.99x2
Glace Bay DSCR Min 1.25x 1.48x
Saint-Philémon DSCR Min 1.20x 1.84x
Amherst DSCR Min 1.20x 1.66x
Glen Dhu DSCR Min 1.25x 1.54x
Bristol Water2 Interest coverage ratio Min 1.4x 2.37x
Net debt to RCV Max 86% 72.2%
Värmevärden Leverage ratio Max 6.0x 4.0x
Interest coverage ratio Min 2.2x 3.1x
Corporate Total leverage Max 4.00x 2.17x
Interest coverage Min 2.50x 9.68x
15
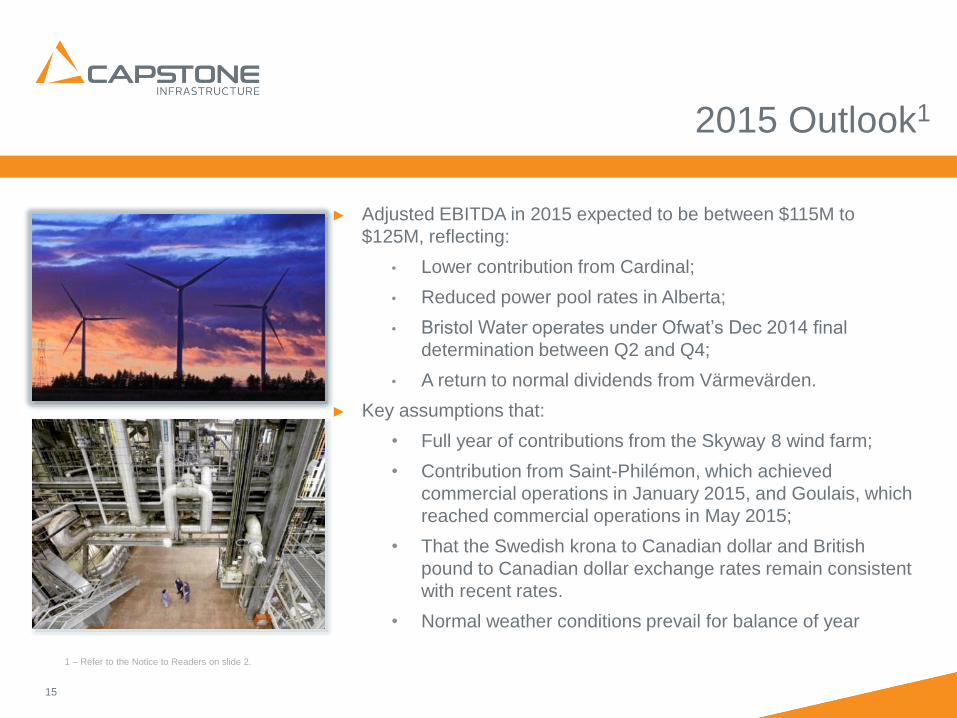
2015 Outlook1
1 – Refer to the Notice to Readers on slide 2.
► Adjusted EBITDA in 2015 expected to be between $115M to
$125M, reflecting:
• Lower contribution from Cardinal;
• Reduced power pool rates in Alberta;
• Bristol Water operates under Ofwat’s Dec 2014 final
determination between Q2 and Q4;
• A return to normal dividends from Värmevärden.
► Key assumptions that:
• Full year of contributions from the Skyway 8 wind farm;
• Contribution from Saint-Philémon, which achieved
commercial operations in January 2015, and Goulais, which
reached commercial operations in May 2015;
• That the Swedish krona to Canadian dollar and British
pound to Canadian dollar exchange rates remain consistent
with recent rates.
• Normal weather conditions prevail for balance of year
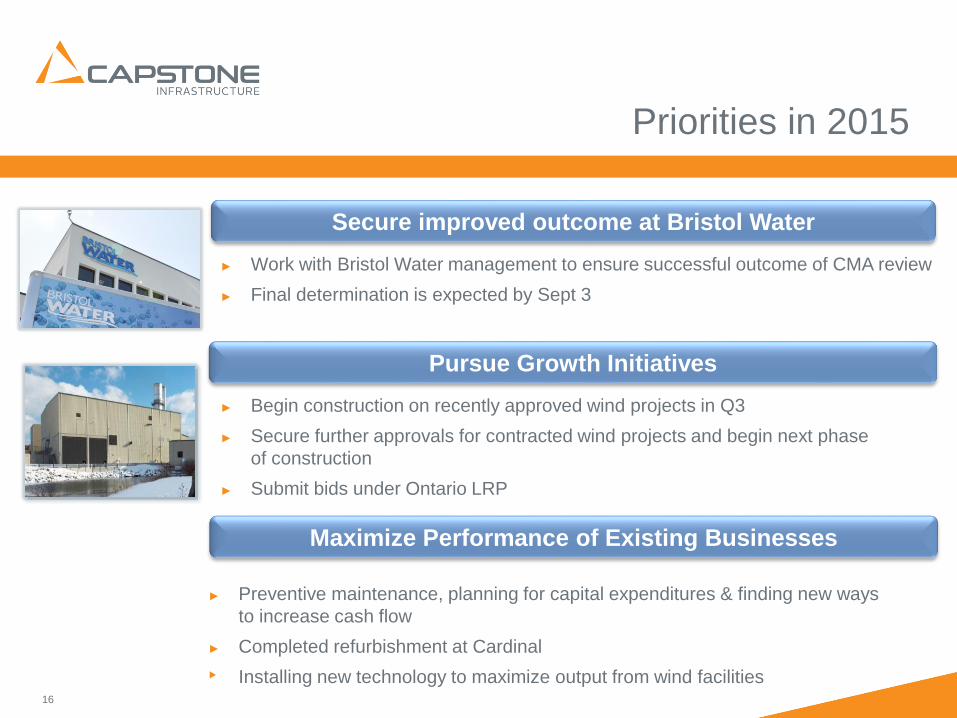
Priorities in 2015
16
► Work with Bristol Water management to ensure successful outcome of CMA review
► Final determination is expected by Sept 3
Secure improved outcome at Bristol Water
Maximize Performance of Existing Businesses
► Preventive maintenance, planning for capital expenditures & finding new ways
to increase cash flow
► Completed refurbishment at Cardinal
‣ Installing new technology to maximize output from wind facilities
Pursue Growth Initiatives
► Begin construction on recently approved wind projects in Q3
► Secure further approvals for contracted wind projects and begin next phase
of construction
► Submit bids under Ontario LRP

Solid Fundamentals
17
High quality, growing diversified
portfolio
Solid balance sheet
All near-term projects have
reached COD and next phase
moving towards construction
Experienced team with strong
relationships across the
infrastructure spectrum

Appendix
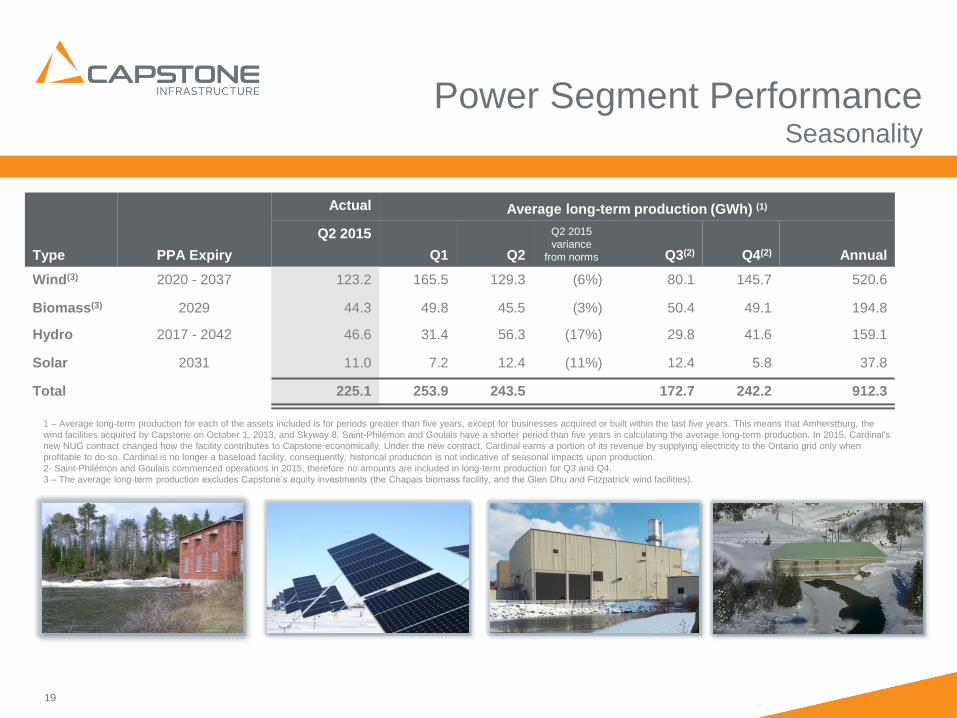
Power Segment PerformanceSeasonality
19
Type PPA Expiry
Actual Average long-term production (GWh) (1)
Q2 2015
Q1 Q2
Q2 2015
variance
from norms Q3(2) Q4(2) Annual
Wind(3) 2020 - 2037 123.2 165.5 129.3 (6%) 80.1 145.7 520.6
Biomass(3) 2029 44.3 49.8 45.5 (3%) 50.4 49.1 194.8
Hydro 2017 - 2042 46.6 31.4 56.3 (17%) 29.8 41.6 159.1
Solar 2031 11.0 7.2 12.4 (11%) 12.4 5.8 37.8
Total 225.1 253.9 243.5 172.7 242.2 912.3
1 – Average long-term production for each of the assets included is for periods greater than five years, except for businesses acquired or built within the last five years. This means that Amherstburg, the
wind facilities acquired by Capstone on October 1, 2013, and Skyway 8, Saint-Philémon and Goulais have a shorter period than five years in calculating the average long-term production. In 2015, Cardinal's
new NUG contract changed how the facility contributes to Capstone economically. Under the new contract, Cardinal earns a portion of its revenue by supplying electricity to the Ontario grid only when
profitable to do so. Cardinal is no longer a baseload facility, consequently, historical production is not indicative of seasonal impacts upon production.
2- Saint-Philémon and Goulais commenced operations in 2015, therefore no amounts are included in long-term production for Q3 and Q4.
3 – The average long-term production excludes Capstone’s equity investments (the Chapais biomass facility, and the Glen Dhu and Fitzpatrick wind facilities).
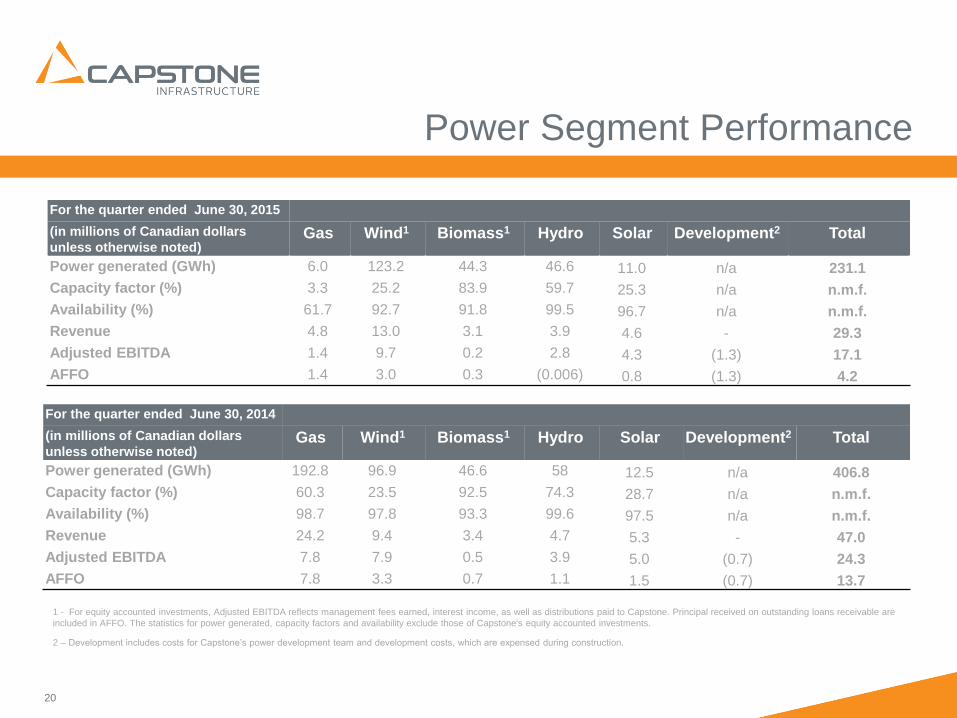
Power Segment Performance
For the quarter ended June 30, 2015
(in millions of Canadian dollars
unless otherwise noted)Gas Wind1 Biomass1 Hydro Solar Development2 Total
Power generated (GWh) 6.0 123.2 44.3 46.6 11.0 n/a 231.1
Capacity factor (%) 3.3 25.2 83.9 59.7 25.3 n/a n.m.f.
Availability (%) 61.7 92.7 91.8 99.5 96.7 n/a n.m.f.
Revenue 4.8 13.0 3.1 3.9 4.6 - 29.3
Adjusted EBITDA 1.4 9.7 0.2 2.8 4.3 (1.3) 17.1
AFFO 1.4 3.0 0.3 (0.006) 0.8 (1.3) 4.2
20
1 - For equity accounted investments, Adjusted EBITDA reflects management fees earned, interest income, as well as distributions paid to Capstone. Principal received on outstanding loans receivable are
included in AFFO. The statistics for power generated, capacity factors and availability exclude those of Capstone's equity accounted investments.
2 – Development includes costs for Capstone’s power development team and development costs, which are expensed during construction.
For the quarter ended June 30, 2014
(in millions of Canadian dollars
unless otherwise noted)Gas Wind1 Biomass1 Hydro Solar Development2 Total
Power generated (GWh) 192.8 96.9 46.6 58 12.5 n/a 406.8
Capacity factor (%) 60.3 23.5 92.5 74.3 28.7 n/a n.m.f.
Availability (%) 98.7 97.8 93.3 99.6 97.5 n/a n.m.f.
Revenue 24.2 9.4 3.4 4.7 5.3 - 47.0
Adjusted EBITDA 7.8 7.9 0.5 3.9 5.0 (0.7) 24.3
AFFO 7.8 3.3 0.7 1.1 1.5 (0.7) 13.7
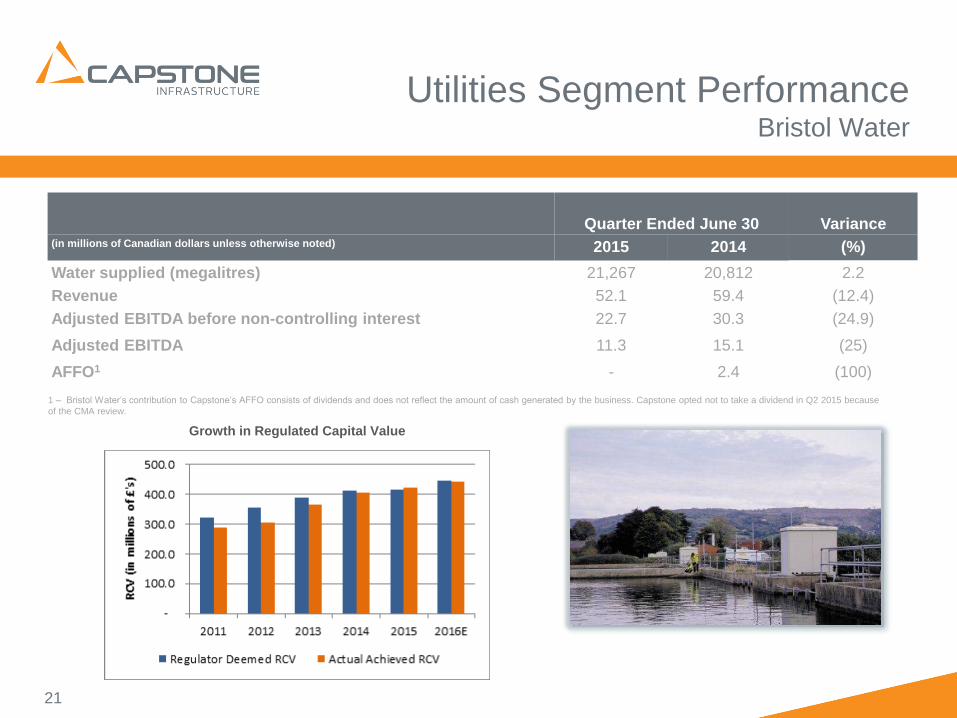
Utilities Segment PerformanceBristol Water
Quarter Ended June 30 Variance(in millions of Canadian dollars unless otherwise noted) 2015 2014 (%)
Water supplied (megalitres) 21,267 20,812 2.2
Revenue 52.1 59.4 (12.4)
Adjusted EBITDA before non-controlling interest 22.7 30.3 (24.9)
Adjusted EBITDA 11.3 15.1 (25)
AFFO1 - 2.4 (100)
21
1 – Bristol Water’s contribution to Capstone’s AFFO consists of dividends and does not reflect the amount of cash generated by the business. Capstone opted not to take a dividend in Q2 2015 because
of the CMA review.
Growth in Regulated Capital Value
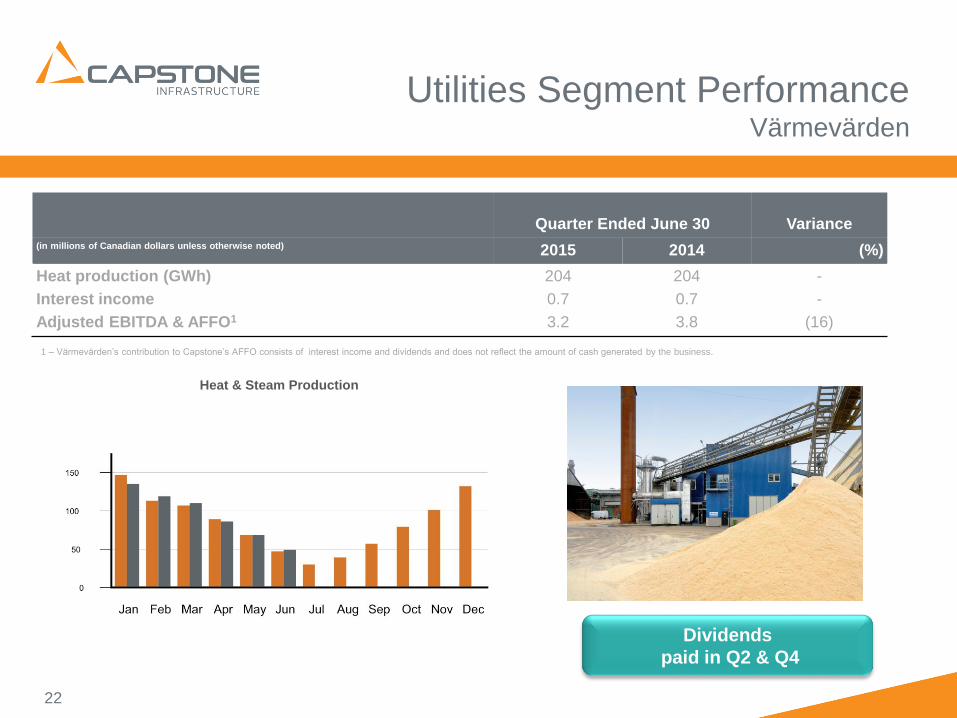
Utilities Segment PerformanceVärmevärden
22
Quarter Ended June 30 Variance
(in millions of Canadian dollars unless otherwise noted) 2015 2014 (%)
Heat production (GWh) 204 204 -
Interest income 0.7 0.7 -
Adjusted EBITDA & AFFO1 3.2 3.8 (16)
1 – Värmevärden’s contribution to Capstone’s AFFO consists of interest income and dividends and does not reflect the amount of cash generated by the business.
Dividends
paid in Q2 & Q4
Heat & Steam Production
23
Non-GAAP Performance MeasuresDefinitions
This presentation contains figures that are performance measures not defined by International Financial Reporting Standards (IFRS).
These non-GAAP and additional GAAP performance measures do not have any standardized meaning prescribed by IFRS and are,
therefore, unlikely to be comparable to similar measures presented by other issuers. The non-GAAP and additional GAAP measures
used in presentation are defined below.
Earnings before Interest Expense, Taxes, Depreciation and Amortization (EBITDA)
EBITDA is an additional GAAP financial measure defined as earnings (loss) before financing costs, income tax expense, depreciation
and amortization. EBITDA includes earnings (loss) related to the non-controlling interest (“NCI”), interest income and net pension
interest. EBITDA represents Capstone’s capacity to generate income from operations before taking into account management’s
financing decisions and costs of consuming tangible capital assets and intangible assets, which vary according to their vintage,
technological currency, and management’s estimate of their useful life. EBITDA is presented on the unaudited consolidated statement
of income.
Adjusted EBITDA
Adjusted EBITDA is a non-GAAP financial measure that assists management, investors and other stakeholders in evaluating
Capstone's operating performance. Adjusted EBITDA is an indicator of results generated by the business activities, prior to how these
operations are financed or taxed and excludes capitalized expenditures and amortization.
Adjusted EBITDA is calculated as revenue less operating and administrative expenses and project development costs plus interest
income, contractual settlements included in other gains and (losses) and dividends or distributions received from equity accounted
investments. Adjusted EBITDA for investments in subsidiaries with non-controlling interests is included at Capstone’s proportionate
ownership interest by deducting amounts attributed to any non-controlling interest.
24
Non-GAAP Performance MeasuresDefinitions (continued)
Adjusted Funds from Operations (AFFO)
AFFO is a non-GAAP financial measure that assists management, investors and other stakeholders in analyzing the cash flow
available for future growth capital investments, acquisitions and dividends to common shareholders.Capstone’s definition of AFFO
measures cash generated by activities of infrastructure business investments which is available for dividends and general corporate
purposes. For wholly owned businesses, AFFO is equal to Adjusted EBITDA less interest paid, repayment of principal on debt, and
maintenance capital expenditures. For businesses that are not wholly owned, the cash generated by the business is only available to
Capstone through periodic dividends. For these businesses, AFFO is equal to distributions received. Also deducted are taxes paid
and dividends on preferred shares.
AFFO is calculated from Adjusted EBITDA by:
Deducting: - Adjusted EBITDA generated from businesses with significant non-controlling interests
Adding: - Distributions received from businesses with significant non-controlling interests
- Scheduled repayments of principal on loans receivable from equity accounted investments
Deducting items, for corporate and businesses without significant non-controlling interests:
- Interest paid
- Income taxes paid
- Dividends paid on the preferred shares included in shareholders’ equity
- Maintenance capital expenditure payments and
- Scheduled repayments of principal on debt.
Payout Ratio
Payout ratio measures the proportion of cash generated that is declared as dividends to common shareholders. The payout ratio is
calculated as dividends declared divided by AFFO.
Additional Details
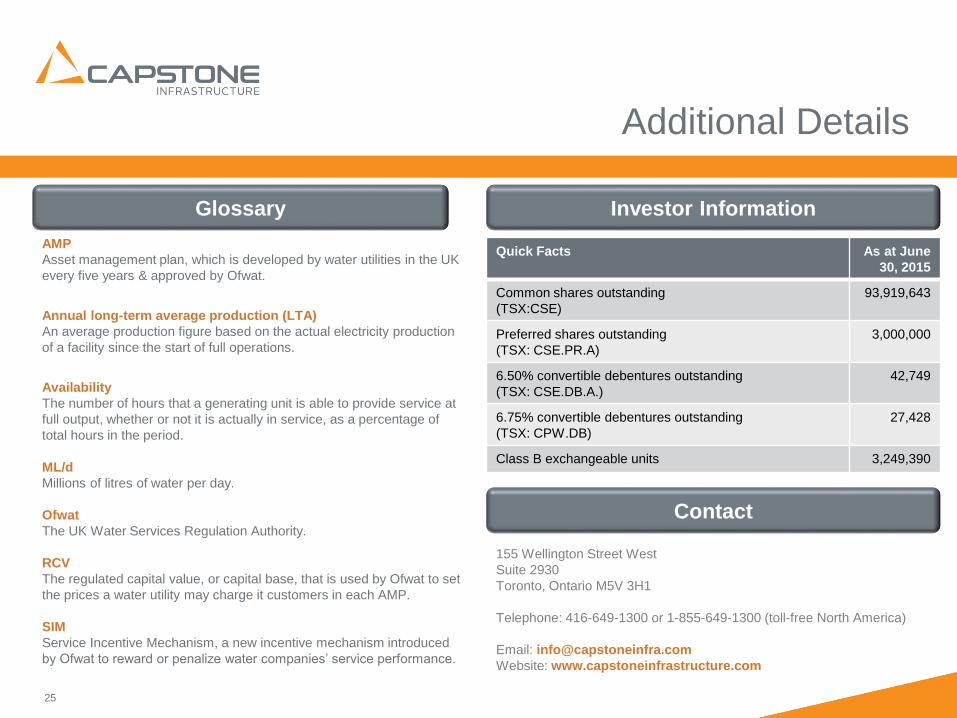
AMP
Asset management plan, which is developed by water utilities in the UK
every five years & approved by Ofwat.
Annual long-term average production (LTA)
An average production figure based on the actual electricity production
of a facility since the start of full operations.
Availability
The number of hours that a generating unit is able to provide service at
full output, whether or not it is actually in service, as a percentage of
total hours in the period.
ML/d
Millions of litres of water per day.
Ofwat
The UK Water Services Regulation Authority.
RCV
The regulated capital value, or capital base, that is used by Ofwat to set
the prices a water utility may charge it customers in each AMP.
SIM
Service Incentive Mechanism, a new incentive mechanism introduced
by Ofwat to reward or penalize water companies’ service performance.
25
Glossary Investor Information
Quick Facts As at June
30, 2015
Common shares outstanding
(TSX:CSE)
93,919,643
Preferred shares outstanding
(TSX: CSE.PR.A)
3,000,000
6.50% convertible debentures outstanding
(TSX: CSE.DB.A.)
42,749
6.75% convertible debentures outstanding
(TSX: CPW.DB)
27,428
Class B exchangeable units 3,249,390
Contact
155 Wellington Street West
Suite 2930
Toronto, Ontario M5V 3H1
Telephone: 416-649-1300 or 1-855-649-1300 (toll-free North America)
Email: [email protected]
Website: www.capstoneinfrastructure.com