Embed Size (px)
Citation preview
Q2 2015 Presentation
July 30, 2015
Arni Oddur Thordarson, CEO
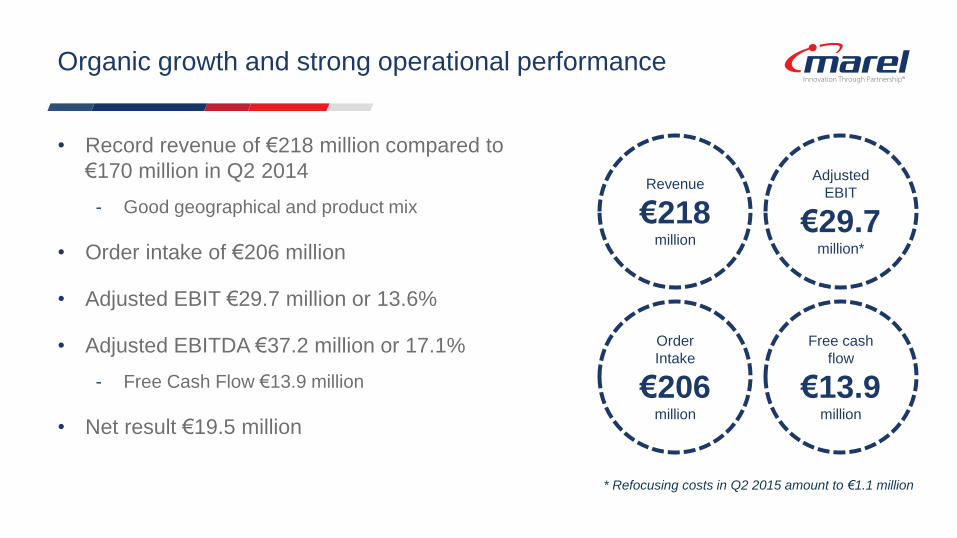
• Record revenue of €218 million compared to
€170 million in Q2 2014
- Good geographical and product mix
• Order intake of €206 million
• Adjusted EBIT €29.7 million or 13.6%
• Adjusted EBITDA €37.2 million or 17.1%
- Free Cash Flow €13.9 million
• Net result €19.5 million
Organic growth and strong operational performance
Revenue
€218 million
Adjusted
EBIT
€29.7 million*
Order
Intake
€206 million
Free cash
flow
€13.9 million
* Refocusing costs in Q2 2015 amount to €1.1 million
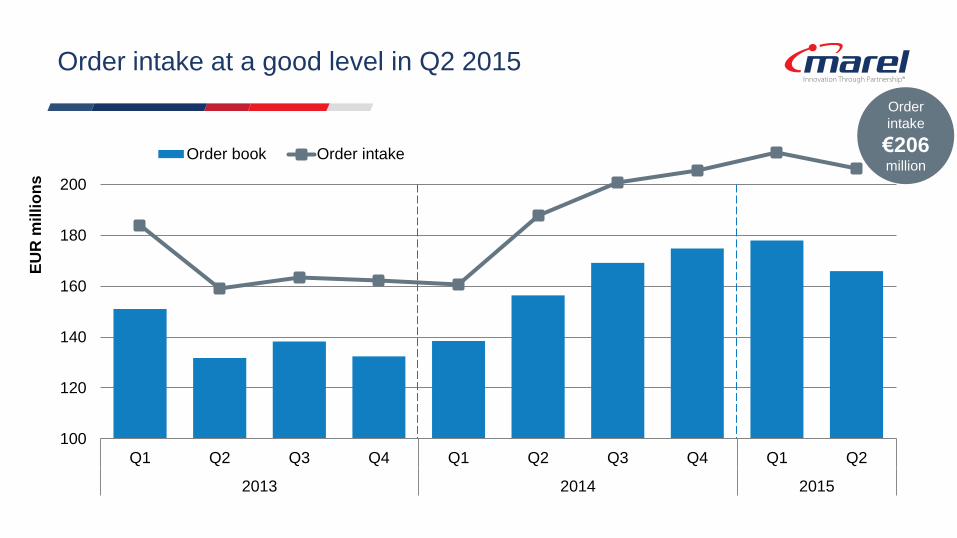
Order intake at a good level in Q2 2015
100
120
140
160
180
200
Q1 Q2 Q3 Q4 Q1 Q2 Q3 Q4 Q1 Q2
2013 2014 2015
EU
R m
illi
on
s
Order book Order intake
Order
intake
€206 million
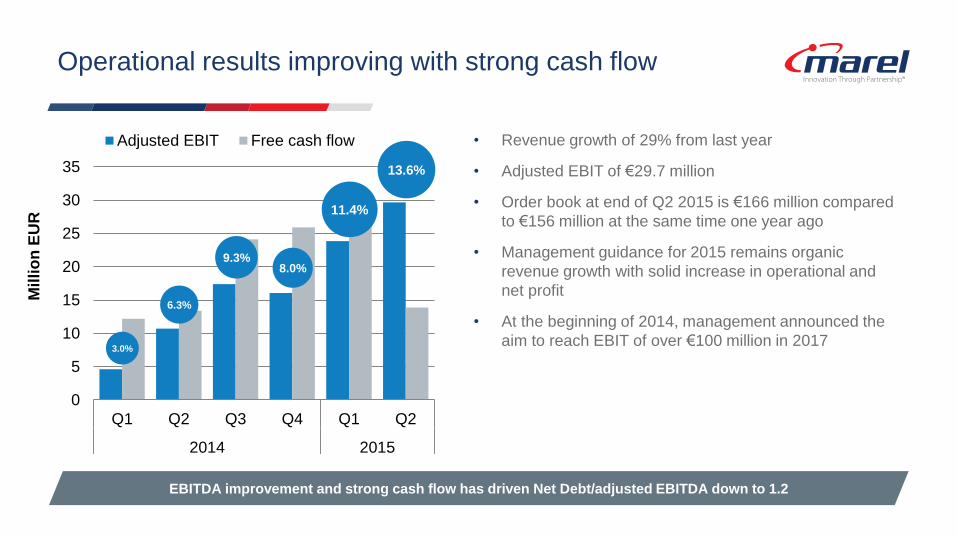
Operational results improving with strong cash flow
• Revenue growth of 29% from last year
• Adjusted EBIT of €29.7 million
• Order book at end of Q2 2015 is €166 million compared
to €156 million at the same time one year ago
• Management guidance for 2015 remains organic
revenue growth with solid increase in operational and
net profit
• At the beginning of 2014, management announced the
aim to reach EBIT of over €100 million in 2017
EBITDA improvement and strong cash flow has driven Net Debt/adjusted EBITDA down to 1.2
0
5
10
15
20
25
30
35
Q1 Q2 Q3 Q4 Q1 Q2
2014 2015
Mil
lio
n E
UR
Adjusted EBIT Free cash flow
3.0%
6.3%
9.3%
11.4%
8.0%
13.6%
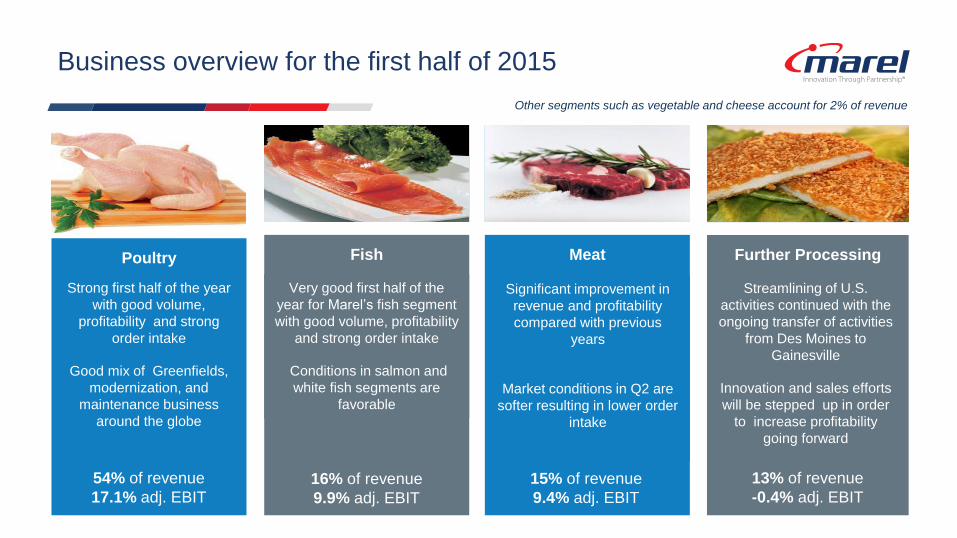
Poultry
Business overview for the first half of 2015
Strong first half of the year
with good volume,
profitability and strong
order intake
Good mix of Greenfields,
modernization, and
maintenance business
around the globe
Fish
Very good first half of the
year for Marel’s fish segment
with good volume, profitability
and strong order intake
Conditions in salmon and
white fish segments are
favorable
16% of revenue
9.9% adj. EBIT
54% of revenue
17.1% adj. EBIT
Meat
Significant improvement in
revenue and profitability
compared with previous
years
Market conditions in Q2 are
softer resulting in lower order
intake
15% of revenue
9.4% adj. EBIT
Further Processing
Streamlining of U.S.
activities continued with the
ongoing transfer of activities
from Des Moines to
Gainesville
Innovation and sales efforts
will be stepped up in order
to increase profitability
going forward
13% of revenue
-0.4% adj. EBIT
Other segments such as vegetable and cheese account for 2% of revenue
Linda Jonsdottir, CFO
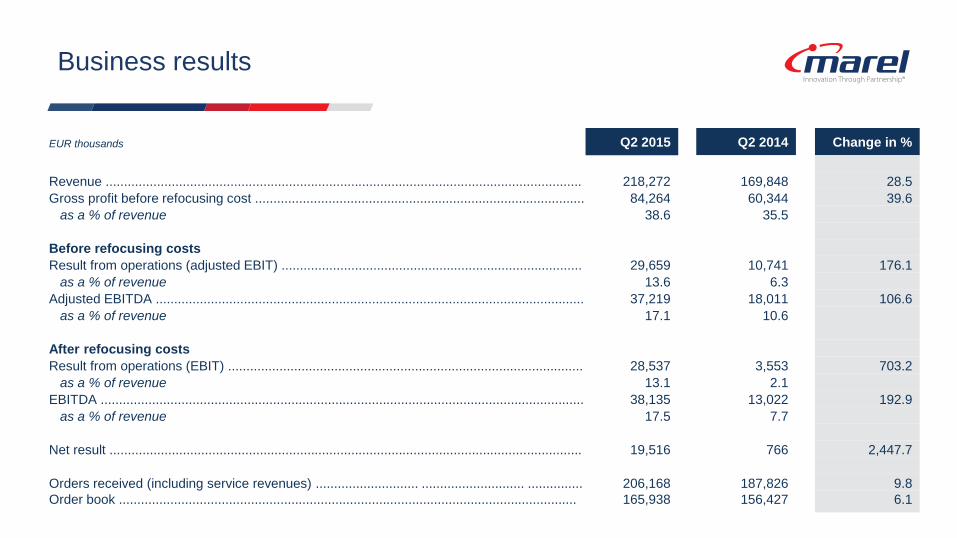
EUR thousands Q2 2015 Q2 2014 Change in %
Revenue .................................................................................................................................. 218,272 169,848 28.5
Gross profit before refocusing cost .......................................................................................... 84,264 60,344 39.6
as a % of revenue 38.6 35.5
Before refocusing costs
Result from operations (adjusted EBIT) .................................................................................. 29,659 10,741 176.1
as a % of revenue 13.6 6.3
Adjusted EBITDA ..................................................................................................................... 37,219 18,011 106.6
as a % of revenue 17.1 10.6
After refocusing costs
Result from operations (EBIT) ................................................................................................. 28,537 3,553 703.2
as a % of revenue 13.1 2.1
EBITDA .................................................................................................................................... 38,135 13,022 192.9
as a % of revenue 17.5 7.7
Net result ................................................................................................................................. 19,516 766 2,447.7
Orders received (including service revenues) ............................ ............................ ............... 206,168 187,826 9.8
Order book ............................................................................................................................. 165,938 156,427 6.1
Business results
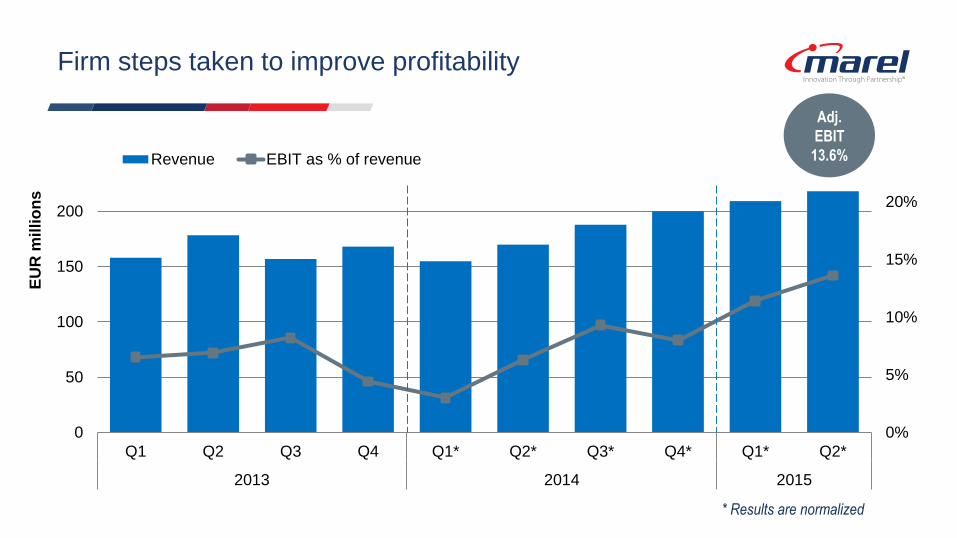
0%
5%
10%
15%
20%
0
50
100
150
200
Q1 Q2 Q3 Q4 Q1* Q2* Q3* Q4* Q1* Q2*
2013 2014 2015
EU
R m
illi
on
s
Revenue EBIT as % of revenue
Firm steps taken to improve profitability
* Results are normalized
Adj.
EBIT
13.6%
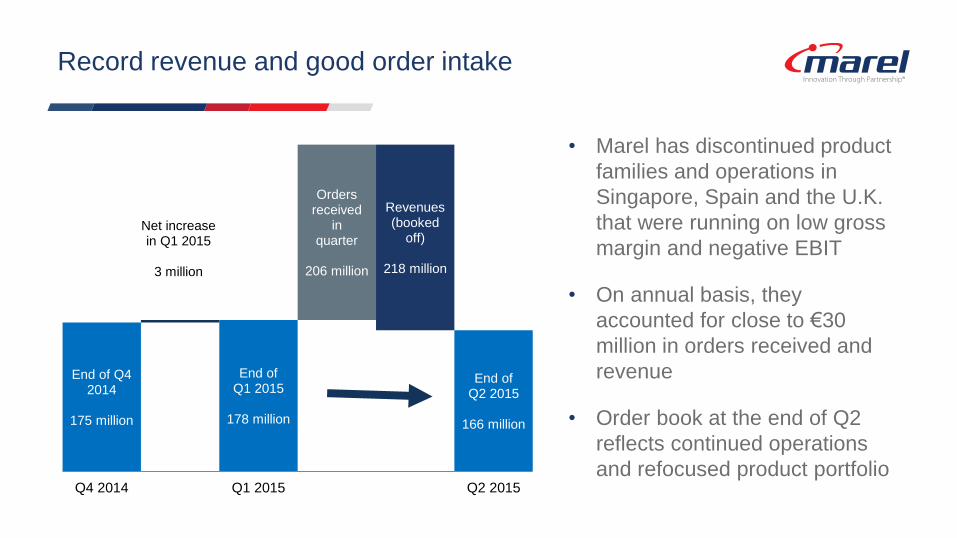
End of Q4 2014
175 million
Net increase in Q1 2015
3 million
End of Q1 2015
178 million
End of Q2 2015
166 million
Orders received
in quarter
206 million
Revenues (booked
off)
218 million
Q4 2014 Q1 2015 Q2 2015
Record revenue and good order intake
• Marel has discontinued product
families and operations in
Singapore, Spain and the U.K.
that were running on low gross
margin and negative EBIT
• On annual basis, they
accounted for close to €30
million in orders received and
revenue
• Order book at the end of Q2
reflects continued operations
and refocused product portfolio
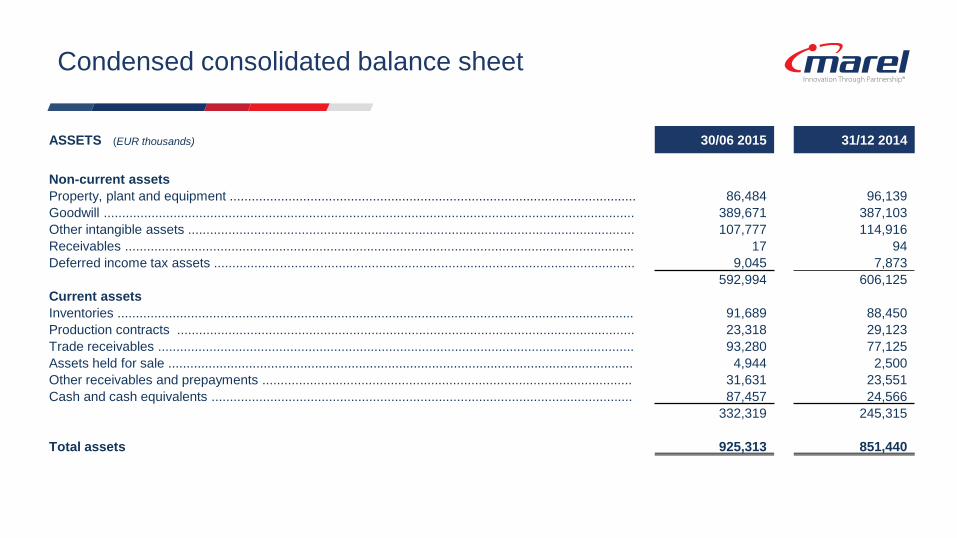
Condensed consolidated balance sheet
ASSETS (EUR thousands) 30/06 2015 31/12 2014
Non-current assets
Property, plant and equipment ............................................................................................................... 86,484 96,139
Goodwill ................................................................................................................................................. 389,671 387,103
Other intangible assets .......................................................................................................................... 107,777 114,916
Receivables ........................................................................................................................................... 17 94
Deferred income tax assets ................................................................................................................... 9,045 7,873
592,994 606,125
Current assets
Inventories ............................................................................................................................................. 91,689 88,450
Production contracts ............................................................................................................................. 23,318 29,123
Trade receivables .................................................................................................................................. 93,280 77,125
Assets held for sale ............................................................................................................................... 4,944 2,500
Other receivables and prepayments ..................................................................................................... 31,631 23,551
Cash and cash equivalents ................................................................................................................... 87,457 24,566
332,319 245,315
Total assets 925,313 851,440
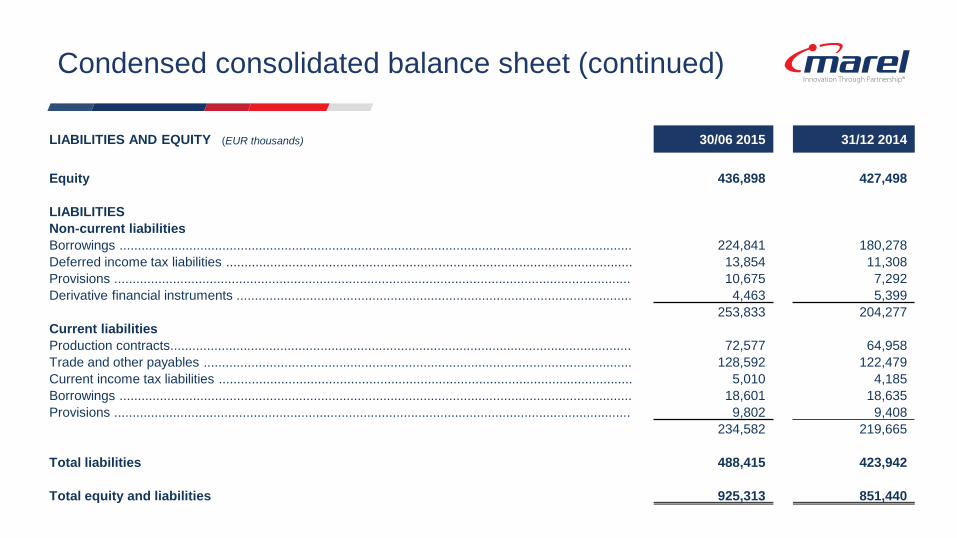
Condensed consolidated balance sheet (continued)
LIABILITIES AND EQUITY (EUR thousands) 30/06 2015 31/12 2014
Equity 436,898 427,498
LIABILITIES
Non-current liabilities
Borrowings ............................................................................................................................................ 224,841 180,278
Deferred income tax liabilities ............................................................................................................... 13,854 11,308
Provisions ............................................................................................................................................. 10,675 7,292
Derivative financial instruments ............................................................................................................ 4,463 5,399
253,833 204,277
Current liabilities
Production contracts.............................................................................................................................. 72,577 64,958
Trade and other payables ..................................................................................................................... 128,592 122,479
Current income tax liabilities ................................................................................................................. 5,010 4,185
Borrowings ............................................................................................................................................ 18,601 18,635
Provisions ............................................................................................................................................. 9,802 9,408
234,582 219,665
Total liabilities 488,415 423,942
Total equity and liabilities 925,313 851,440
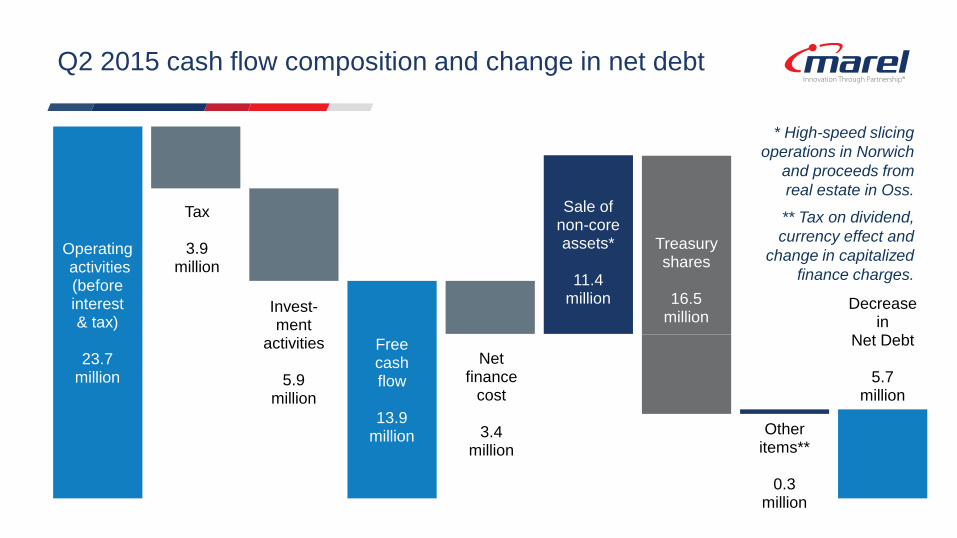
Operating activities (before interest & tax)
23.7
million
Free cash flow
13.9
million
Net finance
cost
3.4 million
Sale of non-core assets*
11.4
million
Other items**
0.3
million
Decrease in
Net Debt
5.7 million
Tax
3.9 million
Invest- ment
activities
5.9 million
Treasury shares
16.5
million
Q2 2015 cash flow composition and change in net debt
* High-speed slicing
operations in Norwich
and proceeds from
real estate in Oss.
** Tax on dividend,
currency effect and
change in capitalized
finance charges.
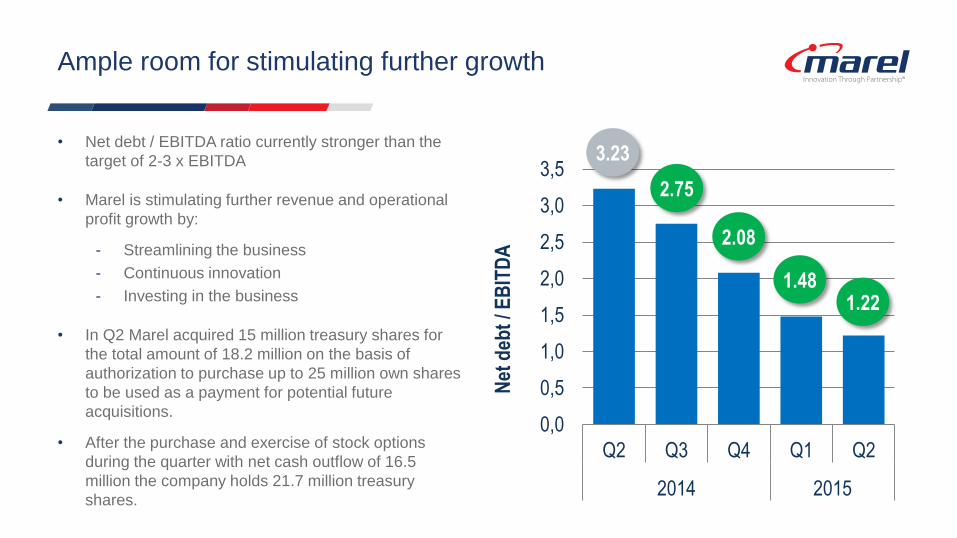
• Net debt / EBITDA ratio currently stronger than the
target of 2-3 x EBITDA
• Marel is stimulating further revenue and operational
profit growth by:
- Streamlining the business
- Continuous innovation
- Investing in the business
• In Q2 Marel acquired 15 million treasury shares for
the total amount of 18.2 million on the basis of
authorization to purchase up to 25 million own shares
to be used as a payment for potential future
acquisitions.
• After the purchase and exercise of stock options
during the quarter with net cash outflow of 16.5
million the company holds 21.7 million treasury
shares.
Ample room for stimulating further growth
0,0
0,5
1,0
1,5
2,0
2,5
3,0
3,5
Q2 Q3 Q4 Q1 Q2
2014 2015N
et d
ebt
/ EB
ITD
A 2.08
3.23
2.75
1.48 1.22
Arni Oddur Thordarson, CEO
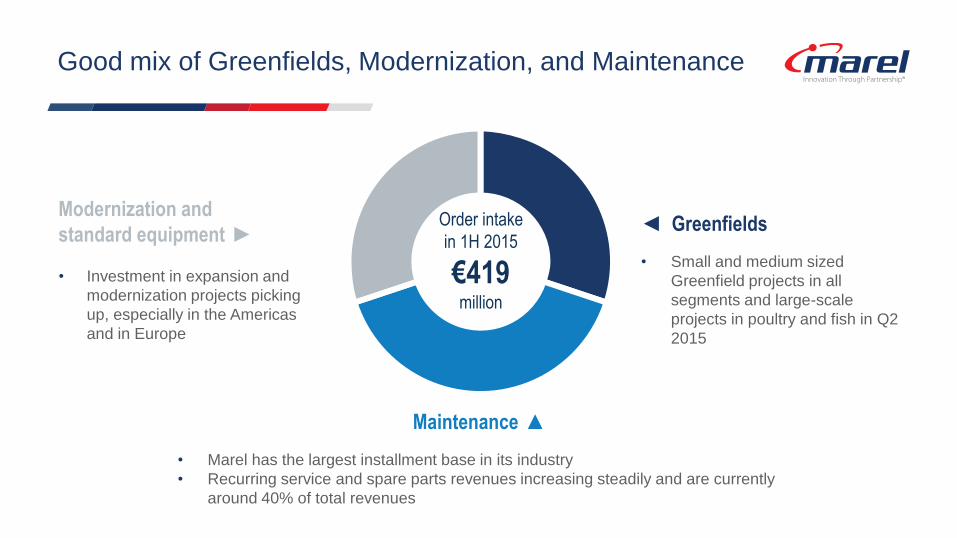
Good mix of Greenfields, Modernization, and Maintenance
Modernization and
standard equipment ►
• Investment in expansion and
modernization projects picking
up, especially in the Americas
and in Europe
◄ Greenfields
• Small and medium sized
Greenfield projects in all
segments and large-scale
projects in poultry and fish in Q2
2015
Maintenance ▲
• Marel has the largest installment base in its industry
• Recurring service and spare parts revenues increasing steadily and are currently
around 40% of total revenues
Order intake
in 1H 2015
€419 million
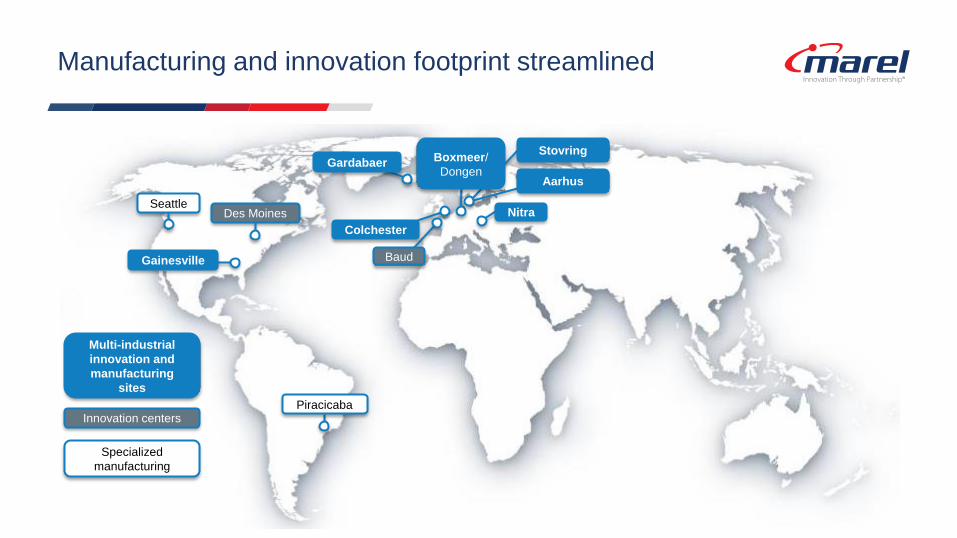
Manufacturing and innovation footprint streamlined
Seattle
Gainesville
Gardabaer
Aarhus
Nitra
Piracicaba
Des Moines
Multi-industrial
innovation and
manufacturing
sites
Innovation centers
Baud
Colchester
Specialized
manufacturing
Stovring Boxmeer/
Dongen
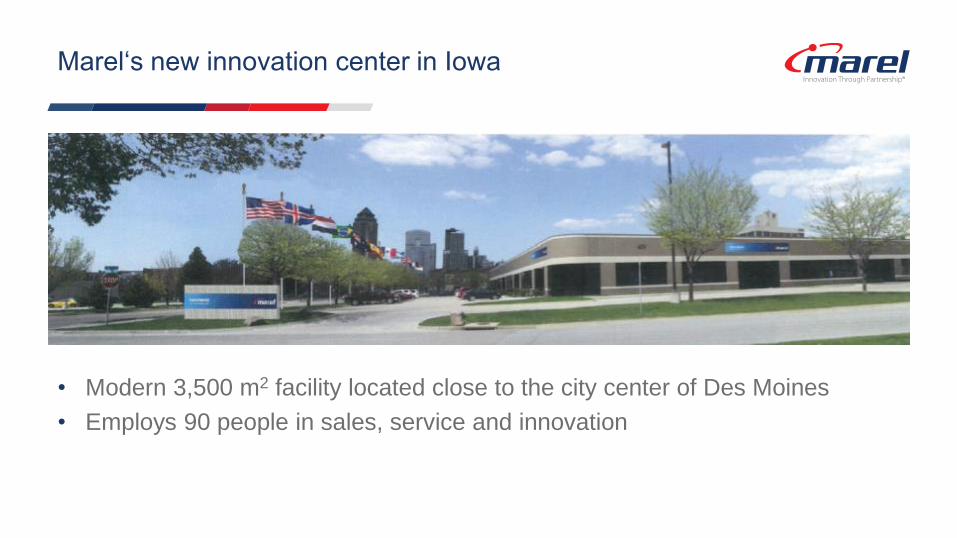
Marel‘s new innovation center in Iowa
• Modern 3,500 m2 facility located close to the city center of Des Moines
• Employs 90 people in sales, service and innovation
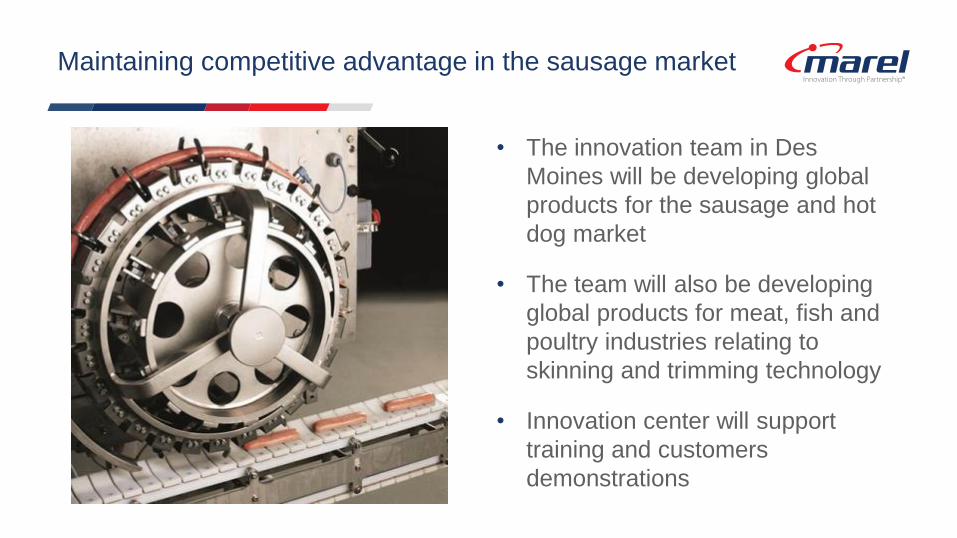
Maintaining competitive advantage in the sausage market
• The innovation team in Des
Moines will be developing global
products for the sausage and hot
dog market
• The team will also be developing
global products for meat, fish and
poultry industries relating to
skinning and trimming technology
• Innovation center will support
training and customers
demonstrations
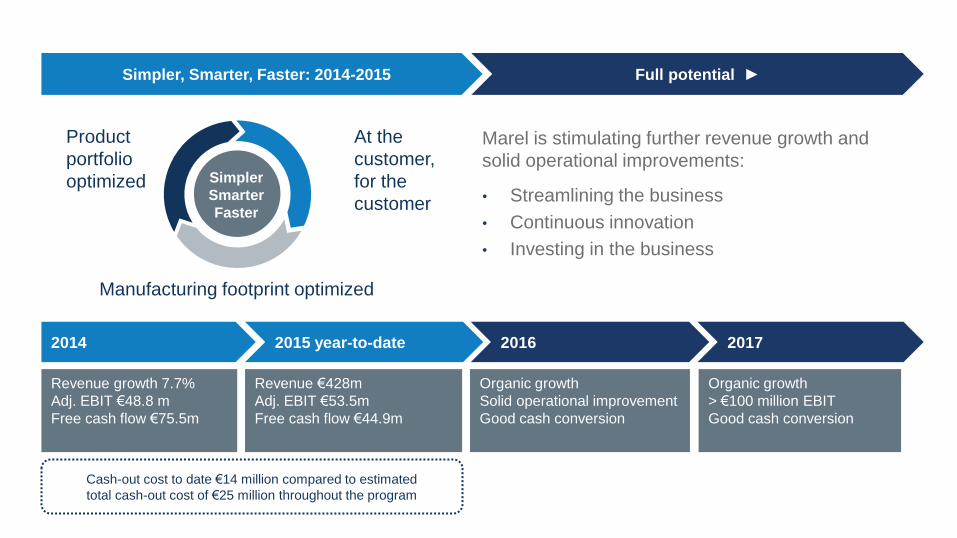
Revenue €428m
Adj. EBIT €53.5m
Free cash flow €44.9m
Revenue growth 7.7%
Adj. EBIT €48.8 m
Free cash flow €75.5m
Marel is stimulating further revenue growth and
solid operational improvements:
• Streamlining the business
• Continuous innovation
• Investing in the business
Simpler
Smarter
Faster
Product
portfolio
optimized
Manufacturing footprint optimized
At the
customer,
for the
customer
Full potential ► Simpler, Smarter, Faster: 2014-2015
2014 2015 year-to-date 2016 2017
Organic growth
Solid operational improvement
Good cash conversion
Organic growth
> €100 million EBIT
Good cash conversion
Cash-out cost to date €14 million compared to estimated
total cash-out cost of €25 million throughout the program
This Presentation is being furnished for the sole purpose of assisting the recipient in deciding whether to proceed with further analysis of this potential opportunity. This Presentation is for informational purposes only and shall not be construed as an offer or solicitation for the subscription or purchase or sale of any securities, or as an invitation, inducement or intermediation for the sale, subscription or purchase of securities. The information set out in this Presentation may be subject to updating, completion, revision and amendment and such information may change materially. Even though Marel hf. has given due care and attention in the preparation of this Presentation, no representation or warranty, express or implied, is or will be made by Marel hf. as to the accuracy, completeness or fairness of the information or opinions contained in this Presentation and any reliance the recipient places on them will be at its own sole risk. Without prejudice to the foregoing, Marel hf. does not accept any liability whatsoever for any loss howsoever arising, directly or indirectly, from use of this Presentation or its contents or otherwise arising in connection therewith. Any recipient of this Presentation is recommended to seek its own financial advice. There is no representation, warranty or other assurance that any of the projections in the Presentation will be realized. The recipient should conduct its own investigation and analysis of the business, data and property described herein. Any statement contained in this Presentation that refers to estimated or anticipated future results or future activities are forward-looking statements which reflect current analysis of existing trends, information and plans. Forward-looking statements are subject to a number of risks and uncertainties that could cause actual results to differ materially and could adversely affect the outcome and financial effects of the plans and events described herein. As a result, the recipient is cautioned not to place undue reliance on such forward-looking statements. Transactions with financial instruments by their very nature involve high risk. Historical price changes are not necessarily an indication of future price trends. Any recipient of this Presentation are encouraged to acquire general information from expert advisors concerning securities trading, investment issues, taxation, etc. in connection with securities transactions. This Presentation and its contents are confidential and may not be further distributed, published or reproduced, in whole or in part, by any medium or in any form for any purpose, without the express written consent of Marel hf. By accepting this Presentation the recipient has agreed, upon request, to return promptly all material received from Marel hf. (including this Presentation) without retaining any copies. In furnishing this Presentation, Marel hf. undertakes no obligation to provide the recipient with access to any additional information or to update this Presentation or to correct any inaccuracies therein which may become apparent. The distribution of this Presentation, or any of the information contained in it, in other jurisdictions than the Republic of Iceland may be restricted by law, and persons into whose possession this Presentation comes should inform themselves about, and observe, any such restrictions. Any failure to comply with these restrictions may constitute a violation of the laws of any such other jurisdictions.
Disclaimer
Thank you
Takk fyrir
Dank u wel
Mange tak