Embed Size (px)
Citation preview

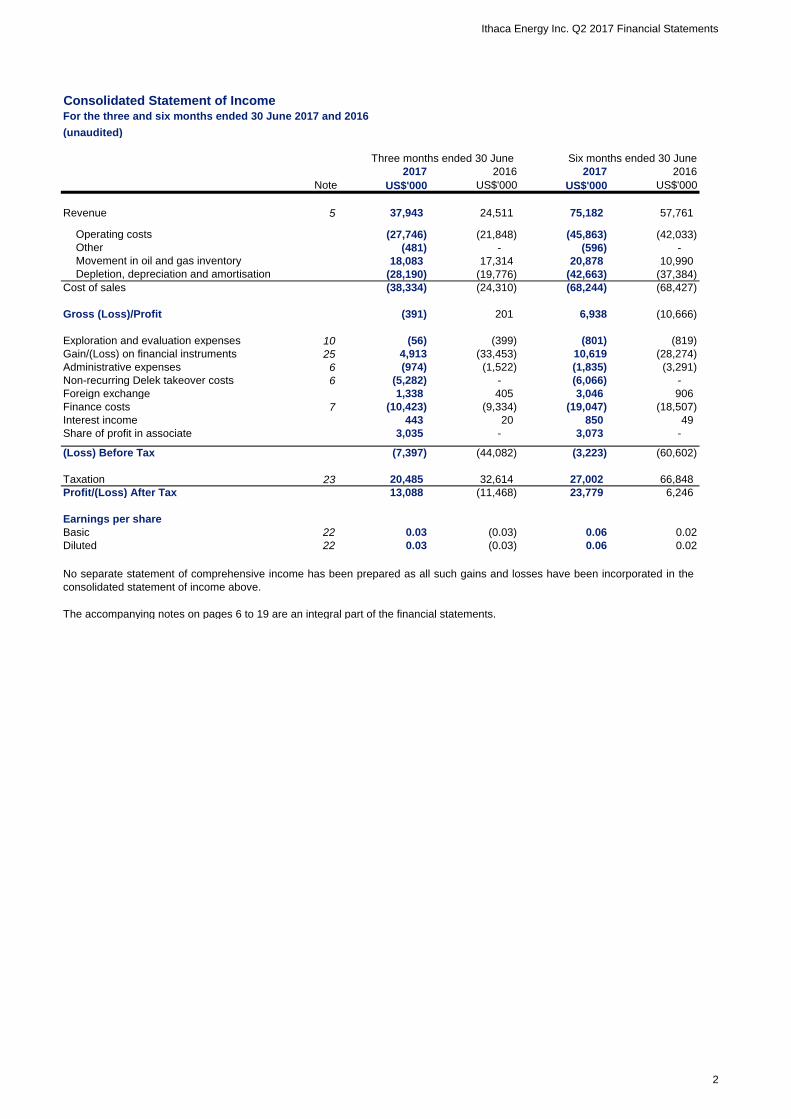
Ithaca Energy Inc. Q2 2017 Financial Statements
Q2 2017CONSOLIDATED FINANCIAL STATEMENTS
1
Ithaca Energy Inc. Q2 2017 Financial Statements
Consolidated Statement of IncomeFor the three and six months ended 30 June 2017 and 2016
(unaudited)
Three months ended 30 June Six months ended 30 June
Note
Revenue 5
- Operating costs
- Other
- Movement in oil and gas inventory
- Depletion, depreciation and amortisation
Cost of sales
Gross (Loss)/Profit
Exploration and evaluation expenses 10
Gain/(Loss) on financial instruments 25
Administrative expenses 6
Non-recurring Delek takeover costs 6
Foreign exchange
Finance costs 7
Interest income
Share of profit in associate
(Loss) Before Tax
Taxation 23
Profit/(Loss) After Tax
Earnings per share
Basic 22
Diluted 22
The accompanying notes on pages 6 to 19 are an integral part of the financial statements.
3,035 - 3,073 -
23,779
0.06
-
37,943
(7,397)
(56)
(974)
(38,334)
(481)
13,088
No separate statement of comprehensive income has been prepared as all such gains and losses have been incorporated in the
consolidated statement of income above.
(391)
1,338
(10,423)
20,485
4,913
66,848
0.02
6,246
27,002
(11,468)
0.02
(3,223)
6,938
(60,602)(44,082)
(819)(399)
(1,522)
201
(19,047)(9,334)
405
(3,291)(1,835)
(28,274)(33,453)
3,046
10,619
57,761
(68,427)
850
(42,033)
(18,507)
(10,666)
10,990
(801)
(37,384)
(596)
US$'000
24,511
(24,310)
75,182
(68,244)
17,314 20,878
-
US$'000
2017
US$'000
2016
US$'000
20172016
0.03
0.03
(0.03) 0.06
32,614
(0.03)
443
(28,190) (19,776) (42,663)
49
906
(27,746) (21,848) (45,863)
18,083
(5,282) - (6,066) -
20
2
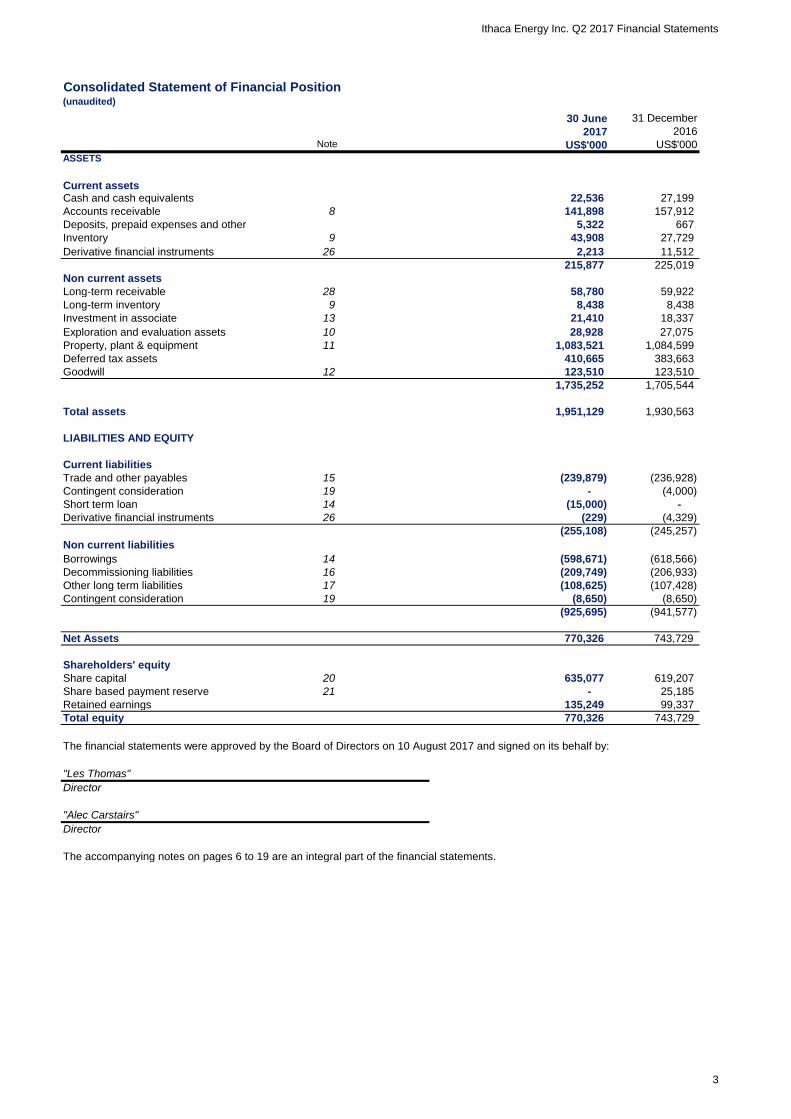
Ithaca Energy Inc. Q2 2017 Financial Statements
(unaudited)
Note
Current assetsCash and cash equivalents CAS01Accounts receivable 8 CAS02Deposits, prepaid expenses and other CAS04Inventory 9 CAS06Derivative financial instruments 26 CAS10
Non current assets
Long-term receivable 28
Long-term inventory 9
Investment in associate 13 CAS07
Exploration and evaluation assets 10
Property, plant & equipment 11 CAS08
Deferred tax assets
Goodwill 12 CAS11
Total assets
LIABILITIES AND EQUITY
Current liabilities
Trade and other payables 15 CLB01
Contingent consideration 19 CLB06
Short term loan 14
Derivative financial instruments 26 CLB07
Non current liabilities
Borrowings 14 CLB02
Decommissioning liabilities 16 CLB04
Other long term liabilities 17 CLB03
Contingent consideration 19 CLB07
Net Assets
Shareholders' equity
Share capital 20 SEQ01
Share based payment reserve 21 SEQ02
Retained earnings SEQ03
Total equity
The financial statements were approved by the Board of Directors on 10 August 2017 and signed on its behalf by:
The accompanying notes on pages 6 to 19 are an integral part of the financial statements.
1,930,563
(4,329)
(245,257)
(236,928)
(4,000)
1,084,599
383,663
59,922
8,438
18,337
27,075
123,510
1,705,544
(618,566)
743,729
(206,933)
(941,577)
667
27,199
157,912
11,512
27,729
225,019
743,729
(8,650)
(107,428)
(925,695)
25,185
619,207
99,337
(255,108)
770,326
(8,650)
(209,749)
770,326
(108,625)
410,665
215,877
(229)
30 June 31 December
43,908
2017
5,322
US$'000
Consolidated Statement of Financial Position
141,898
ASSETS
Director
2,213
1,951,129
(239,879)
135,249
635,077
-
"Alec Carstairs"
"Les Thomas"
58,780
8,438
US$'000
(598,671)
21,410
1,735,252
Director
28,928
123,510
1,083,521
2016
22,536
-
(15,000) -
3
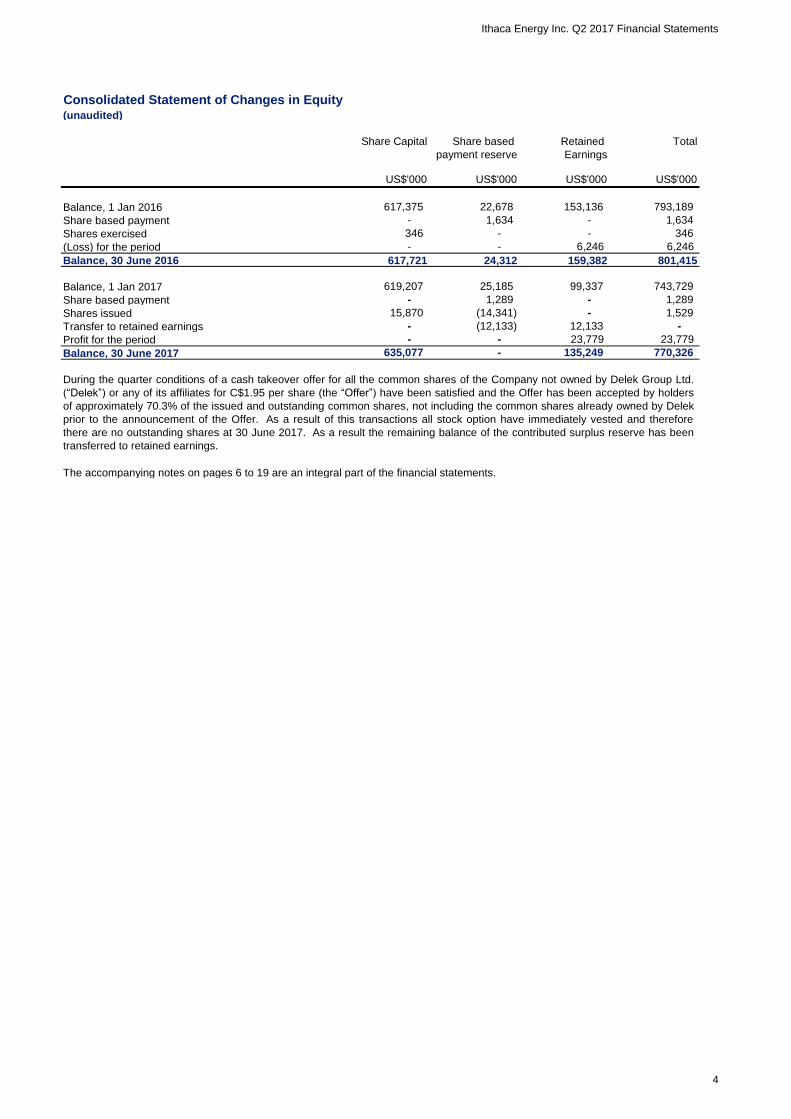
Ithaca Energy Inc. Q2 2017 Financial Statements
Consolidated Statement of Changes in Equity(unaudited)
Balance, 1 Jan 2016
Share based payment
Shares exercised
(Loss) for the period
Balance, 30 June 2016
Balance, 1 Jan 2017
Share based payment
Shares issued
Transfer to retained earnings
Profit for the period
Balance, 30 June 2017
The accompanying notes on pages 6 to 19 are an integral part of the financial statements.
-
(14,341)
12,133 - (12,133)
99,337
135,249 770,326 635,077
25,185
23,779
619,207
-
1,289
743,729
-
1,289
US$'000
-
1,529
23,779
24,312617,721
- -
Total
159,382
US$'000
15,870
Share Capital
617,375
-
801,415
-
US$'000 US$'000
1,634
6,246 -
Retained
Earnings
Share based
payment reserve
6,246
1,634
346
22,678 793,189 153,136
346 - -
During the quarter conditions of a cash takeover offer for all the common shares of the Company not owned by Delek Group Ltd.
(“Delek”) or any of its affiliates for C$1.95 per share (the “Offer”) have been satisfied and the Offer has been accepted by holders
of approximately 70.3% of the issued and outstanding common shares, not including the common shares already owned by Delek
prior to the announcement of the Offer. As a result of this transactions all stock option have immediately vested and therefore
there are no outstanding shares at 30 June 2017. As a result the remaining balance of the contributed surplus reserve has been
transferred to retained earnings.
- -
4
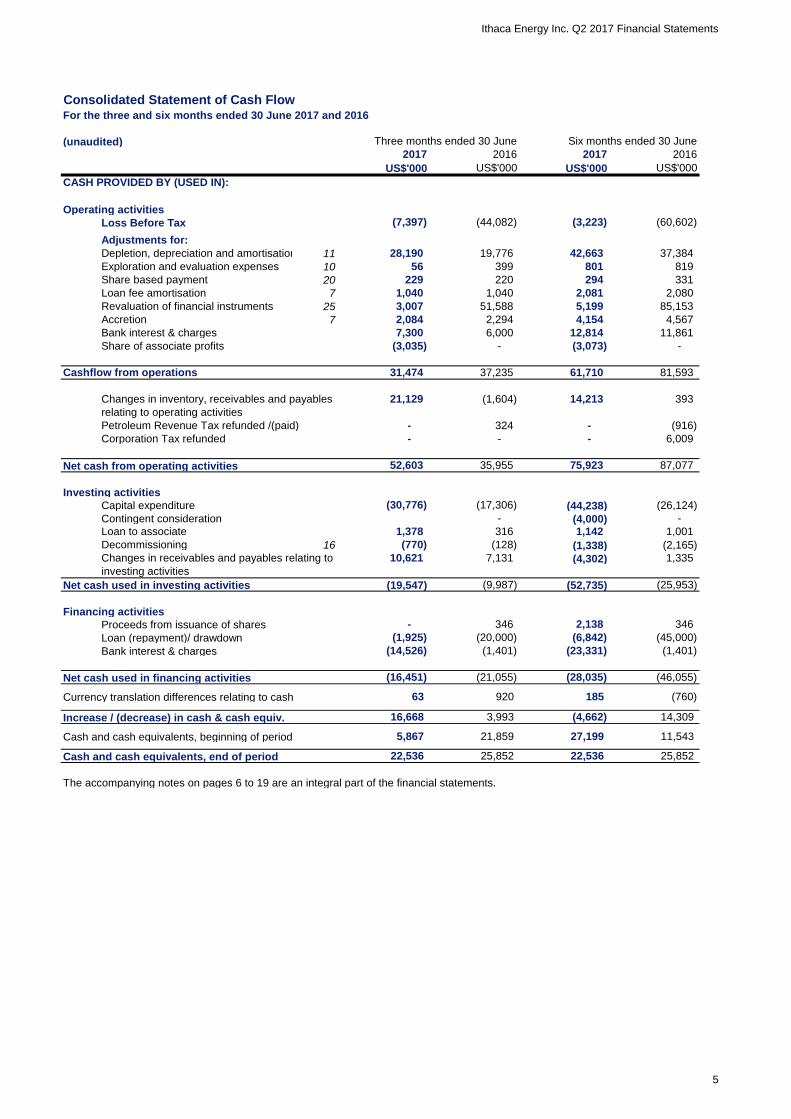
Ithaca Energy Inc. Q2 2017 Financial Statements
Consolidated Statement of Cash FlowFor the three and six months ended 30 June 2017 and 2016
(unaudited) Three months ended 30 June Six months ended 30 June
Operating activities
Loss Before Tax
Adjustments for:
Depletion, depreciation and amortisation 11
Exploration and evaluation expenses 10
Share based payment 20
Loan fee amortisation 7
Revaluation of financial instruments 25
Accretion 7
Bank interest & charges
Share of associate profits
Cashflow from operations
Petroleum Revenue Tax refunded /(paid)
Corporation Tax refunded
Net cash from operating activities
Investing activities
Capital expenditure
Contingent consideration
Loan to associate
Decommissioning 16
Net cash used in investing activities
Financing activities
Proceeds from issuance of shares
Loan (repayment)/ drawdown
Bank interest & charges
Net cash used in financing activities
Currency translation differences relating to cash
Increase / (decrease) in cash & cash equiv.
Cash and cash equivalents, beginning of period
Cash and cash equivalents, end of period
The accompanying notes on pages 6 to 19 are an integral part of the financial statements.
42,663
801
2,081
294
CASH PROVIDED BY (USED IN):
4,154
14,213
(3,073)
US$'000
61,710
2,080
(60,602)
-
331
11,861
81,593
2016
Changes in receivables and payables relating to
investing activities
-
1,040
6,000
3,993
(20,000)(1,925)
(19,547)
(7,397)
(770) (128)
1,378
10,621
819
(14,526)
14,309
25,852
920
16,668
(45,000)
22,536
399
(28,035)(21,055)
27,199
5,199
12,814
(4,000)
(760)
(1,401)
2017
25,852
63
(16,451) (46,055)
(23,331)
220
21,859
(9,987)
(4,662)
5,867
(30,776)
37,384
(44,082)
21,129
2,084
56
-
7,300
(3,223)
Changes in inventory, receivables and payables
relating to operating activities
229
2,294
3,007
19,776
US$'000
28,190
(3,035)
-
(1,604)
-
- 324
31,474
51,588
US$'000
(17,306)
37,235
US$'000
87,077
7,131
346
1,335
35,955
316
(1,338)
(26,124)
75,923
6,009
11,543
346
(52,735)
(6,842)
1,001
(25,953)
(44,238)
1,142
2,138
393
4,567
1,040
-
52,603
(1,401)
-
85,153
2017
22,536
(4,302)
185
- (916)
(2,165)
-
2016
5
Ithaca Energy Inc. Q2 2017 Financial Statements
1. NATURE OF OPERATIONS
2. BASIS OF PREPARATION
Basis of measurement
Basis of consolidation
Goodwill
Capitalisation
Impairment
The consolidated financial statements are presented in US dollars and all values are rounded to the nearest thousand (US$'000),
except when otherwise indicated.
These interim consolidated financial statements have been prepared in accordance with International Financial Reporting
Standards (IFRS) applicable to the preparation of interim financial statements, including IAS 34 Interim Financial Reporting. These
interim consolidated financial statements do not include all the necessary annual disclosures in accordance with IFRS.
Ithaca Energy Inc. (the “Corporation” or “Ithaca”), incorporated and domiciled in Alberta, Canada on 27 April 2004, is a company
involved in the development and production of oil and gas in the North Sea. The Corporation's registered office is 1600, 333 - 7th
Avenue S.W., Calgary, Alberta, Canada, T2P 2Z1. The Corporation's shares previously traded on the Toronto Stock Exchange in
Canada and the London Stock Exchange’s Alternative Investment Market in the United Kingdom under the symbol “IAE”.
The consolidated financial statements have been prepared on a going concern basis using the historical cost convention, except
for financial instruments which are measured at fair value.
The policies applied in these condensed interim consolidated financial statements are based on IFRS issued and outstanding as of
12 August 2017, the date the Board of Directors approved the statements. Any subsequent changes to IFRS that are given effect
in the Corporation’s annual consolidated financial statements for the year ending 31 December 2016 could result in restatement of
these interim consolidated financial statements.
The condensed interim consolidated financial statements should be read in conjunction with the Corporation’s annual financial
statements for the year ended 31 December 2016.
Business Combinations
Subsidiaries are all entities, including structured entities, over which the group has control. The group controls an entity when the
group is exposed to or has rights to variable returns from its investments with the entity and has the ability to affect those returns
through its power over the entity. Subsidiaries are fully consolidated from the date on which control is transferred to the group.
They are deconsolidated on the date that control ceases.
Business combinations are accounted for using the acquisition method. The cost of an acquisition is measured as the fair value of
the assets acquired, equity instruments issued and liabilities incurred or assumed at the date of completion of the acquisition.
Acquisition costs incurred are expensed and included in administrative expenses. Identifiable assets acquired and liabilities and
contingent liabilities assumed in a business combination are measured initially at their fair values at the acquisition date. The
excess of the cost of acquisition over the fair value of the Corporation's share of the identifiable net assets acquired is recorded as
goodwill. If the cost of the acquisition is less than the Corporation's share of the net assets acquired, the difference is recognised
directly in the statement of income as negative goodwill.
The interim consolidated financial statements have been prepared under the historical cost convention, except for the revaluation
of certain financial assets and financial liabilities (under IFRS) to fair value, including derivative instruments.
The interim consolidated financial statements of the Corporation include the financial statements of Ithaca Energy Inc. and all
wholly-owned subsidiaries as listed per note 28. Ithaca has twenty wholly-owned subsidiaries. All inter-company transactions and
balances have been eliminated on consolidation.
Goodwill acquired through business combinations is initially measured at cost, being the excess of the aggregate of the
consideration transferred and the amount recognised as the fair value of the Corporation's share of the identifiable net assets
acquired and liabilities assumed. If this consideration is lower than the fair value of the identifiable assets acquired, the difference
is recognised in the statement of income.
Goodwill is tested annually for impairment and also when circumstances indicate that the carrying value may be at risk of being
impaired. Impairment is determined for goodwill by assessing the recoverable amount of each cash generating unit ("CGU") to
which the goodwill relates. Where the recoverable amount of the CGU is less than its carrying amount, an impairment loss is
recognised in the statement of income. Impairment losses relating to goodwill cannot be reversed in future periods.
6
Ithaca Energy Inc. Q2 2017 Financial Statements
Interest in joint operations
Revenue
Foreign currency translation
Share based payments
Cash and cash equivalents
Financial instruments
Held-for-trading financial instruments are subsequently measured at fair value with changes in fair value recognised in net
earnings. All other categories of financial instruments are measured at amortised cost using the effective interest method. Cash
and cash equivalents are classified as held-for-trading and are measured at fair value. Accounts receivable are classified as loans
and receivables. Accounts payable, accrued liabilities, certain other long-term liabilities, and long-term debt are classified as other
financial liabilities. Although the Corporation does not intend to trade its derivative financial instruments, they are classified as held-
for-trading for accounting purposes.
The Corporation's interest in joint operations (eg exploration and production arrangements) are accounted for by recognising its
assets (including its share of assets held jointly), its liabilities (including its share of liabilities incurred jointly), its revenue from the
sale of its share of the output arising from the joint operation, its share of revenue from the sale of output by the joint operation and
its expenses (including its share of any expenses incurred jointly).
Oil, gas and NGL revenues associated with the sale of the Corporation’s crude oil and natural gas are recognised when title
passes to the customer. This generally occurs when the product is physically transferred into a vessel, pipe or other delivery
mechanism. Revenues from the production of oil and natural gas properties in which the Corporation has an interest with joint
venture partners are recognised on the basis of the Corporation’s working interest in those properties (the entitlement method).
Differences between the production sold and the Corporation’s share of production are recognised within cost of sales at market
value.
Items included in the financial statements are measured using the currency of the primary economic environment in which the
Corporation and its subsidiaries operate (the ‘functional currency’). The consolidated financial statements are presented in United
States Dollars, which is the Corporation’s functional and presentation currency.
All financial instruments are initially recognised at fair value on the statement of financial position. The Corporation’s financial
instruments consist of cash, restricted cash, accounts receivable, deposits, derivatives, accounts payable, accrued liabilities,
contingent consideration and the liability acquired as part of the Beatrice field acquisition. The Corporation classifies its financial
instruments into one of the following categories: held-for-trading financial assets and financial liabilities; held-to-maturity
investments; loans and receivables; and other financial liabilities. All financial instruments are required to be measured at fair value
on initial recognition. Measurement in subsequent periods is dependent on the classification of the respective financial instrument.
The Corporation has a share based payment plan as described in note 20 (c). The expense is recorded in the consolidated
statement of income or capitalised for all options granted in the year, with the gross increase recorded in the share based payment
reserve. Compensation costs are based on the estimated fair values at the time of the grant and the expense or capitalised
amount is recognised over the vesting period of the options. Upon the exercise of the stock options, consideration paid together
with the amount previously recognised in share based compensation reserve is recorded as an increase in share capital. In the
event that vested options expire unexercised, previously recognised compensation expense associated with such stock options is
not reversed. In the event that unvested options are forfeited or expired, previously recognised compensation expense associated
with the unvested portion of such stock options is reversed.
Under the equity method, investments are carried at cost plus post-acquisition changes in the Corporation's share of net assets,
less any impairment in value in individual investments. The consolidated income statement reflects the Corporation's share of the
results and operations after tax and interest.
Foreign currency transactions are translated into the functional currency using the exchange rates prevailing at the dates of the
transactions. Foreign exchange gains and losses resulting from the settlement of such transactions and from the translation at year
end exchange rates of monetary assets and liabilities denominated in foreign currencies are recognised in the statement of income.
For the purpose of the statement of cash flow, cash and cash equivalents include investments with an original maturity of three
months or less.
Interest income is recognised on an accruals basis and is separately recorded on the face of the statement of income.
Under IFRS 11, joint arrangements are those that convey joint control which exists only when decisions about the relevant
activities require the unanimous consent of the parties sharing control. Investments in joint arrangements are classified as either
joint operations or joint ventures depending on the contractual rights and obligations of each investor. Associates are investments
over which the Corporation has significant influence but not control or joint control, and generally holds between 20% and 50% of
the voting rights.
7
Ithaca Energy Inc. Q2 2017 Financial Statements
Inventory
Trade receivables
Trade payables
Property, plant and equipment
Oil and gas expenditure – exploration and evaluation assets
Capitalisation
Oil and gas expenditure – development and production assets
Capitalisation
Depreciation
Impairment
Non oil and natural gas operations
Analyses of the fair values of financial instruments and further details as to how they are measured are provided in notes 25 to 27.
Pre-acquisition costs on oil and gas assets are recognised in the consolidated statement of income when incurred. Costs incurred
after rights to explore have been obtained, such as geological and geophysical surveys, drilling and commercial appraisal costs
and other directly attributable costs of exploration and evaluation including technical, administrative and share based payment
expenses are capitalised as intangible exploration and evaluation (“E&E”) assets.
Trade payables are measured at cost.
E&E costs are not amortised prior to the conclusion of evaluation activities. At completion of evaluation activities, if technical
feasibility is demonstrated and commercial reserves are discovered then, following development sanction, the carrying value of the
E&E asset is reclassified as a development and production (“D&P”) asset, but only after the carrying value is assessed for
impairment and where appropriate its carrying value adjusted. If after completion of evaluation activities in an area, it is not
possible to determine technical feasibility and commercial viability or if the legal right to explore expires or if the Corporation
decides not to continue exploration and evaluation activity, then the costs of such unsuccessful exploration and evaluation are
written off to the statement of income in the period the relevant events occur.
Costs of bringing a field into production, including the cost of facilities, wells and subsea equipment, direct costs including staff
costs and share based payment expense together with E&E assets reclassified in accordance with the above policy, are capitalised
as a D&P asset. Normally each individual field development will form an individual D&P asset but there may be cases, such as
phased developments, or multiple fields around a single production facility when fields are grouped together to form a single D&P
asset.
Trade receivables are recognised and carried at the original invoiced amount, less any provision for estimated irrecoverable
amounts.
Inventories of materials and product inventory supplies are stated at the lower of cost and net realisable value. Cost is determined
on the first-in, first-out method. Current oil and gas inventories are stated at fair value less cost to sell. Non-current oil and gas
inventories are stated at historic cost.
For impairment review purposes the Corporation’s oil and gas assets are analysed into cash-generating units ("CGUs") as
identified in accordance with IAS 36. A review is carried out each reporting date for any indicators that the carrying value of the
Corporation’s assets may be impaired. For assets where there are such indicators, an impairment test is carried out on the CGU.
The impairment test involves comparing the carrying value with the recoverable value of an asset. The recoverable amount of an
asset is determined as the higher of its fair value less costs to sell and value in use, where the value in use is determined from
estimated future net cash flows. If the recoverable amount of an asset is estimated to be less that its carrying amount, the carrying
amount of the asset is reduced to the recoverable amount. The resulting impairment losses are written off to the statement of
income.
Computer and office equipment is recorded at cost and depreciated over its estimated useful life on a straight-line basis over three
years. Furniture and fixtures are recorded at cost and depreciated over their estimated useful lives on a straight-line basis over five
years.
All costs relating to a development are accumulated and not depreciated until the commencement of production. Depreciation is
calculated on a unit of production basis based on the proved and probable reserves of the asset. Any re-assessment of reserves
affects the depreciation rate prospectively. Significant items of plant and equipment will normally be fully depreciated over the life
of the field. However, these items are assessed to consider if their useful lives differ from the expected life of the D&P asset and
should this occur a different depreciation rate would be charged.
Transaction costs that are directly attributable to the acquisition or issue of a financial asset or liability and original issue discounts
on long-term debt have been included in the carrying value of the related financial asset or liability and are amortised to
consolidated net earnings over the life of the financial instrument using the effective interest method.
8
Ithaca Energy Inc. Q2 2017 Financial Statements
Borrowings
Decommissioning liabilities
Contingent consideration
Taxation
Operating leases
Finance leases
Loan origination fees are capitalised and amortised over the term of the loan. Borrowing costs directly attributable to the
acquisition, construction or production of qualifying assets, which are assets that necessarily take a substantial period of time to get
ready for their intended use or sale, are added to the cost of those assets until such time as the assets are substantially ready for
their intended use of sale. All other borrowing costs are expensed as incurred.
Finance leases that transfer substantially all the risks and benefits incidental to ownership of the leased item to the Corporation,
are capitalised at the commencement of the lease at the fair value of the leased property or, if lower, at the present value of the
minimum lease payments. Lease payments are apportioned between finance charges and reduction of the lease liability so as to
achieve a constant rate of interest on the remaining balance of the liability. Finance charges are recognised in finance costs in the
income statement. A leased asset is depreciated over the useful life of the asset. However, if there is no reasonable certainty that
the Corporation will obtain ownership by the end of the lease term, the asset is depreciated over the shorter of the estimated useful
life of the asset and the lease term.
PRT is accounted for under IAS 12 since it has the characteristics of an income tax as it is imposed under Government authority
and the amount payable is based on taxable profits of the relevant field. Deferred PRT is accounted for on a temporary difference
basis.
The Corporation records the present value of legal obligations associated with the retirement of long-term tangible assets, such as
producing well sites and processing plants, in the period in which they are incurred with a corresponding increase in the carrying
amount of the related long-term asset. The obligation generally arises when the asset is installed or the ground/environment is
disturbed at the field location. In subsequent periods, the asset is adjusted for any changes in the estimated amount or timing of
the settlement of the obligations. The carrying amounts of the associated assets are depleted using the unit of production method,
in accordance with the depreciation policy for development and production assets. Actual costs to retire tangible assets are
deducted from the liability as incurred.
Current income tax
All interest-bearing loans and other borrowings with banks are initially recognised at fair value net of directly attributable transaction
costs. After initial recognition, interest-bearing loans and other borrowings are subsequently measured at amortised cost using the
effective interest method. Amortised cost is calculated by taking into account any issue costs, discount or premium.
Contingent consideration is accounted for as a financial liability and measured at fair value at the date of acquisition with any
subsequent remeasurements recognised either in profit or loss or in other comprehensive income in accordance with IAS 39.
Petroleum Revenue Tax
Deferred tax assets and liabilities are offset only when a legally enforceable right of offset exists and the deferred tax assets and
liabilities arose in the same tax jurisdiction.
Current income tax assets and liabilities are measured at the amount expected to be recovered from or paid to the taxation
authorities. The tax rates and tax laws used to compute the amounts are those that are enacted or substantively enacted by the
reporting date.
In addition to corporate income taxes, the Group's financial statements also include and disclose Petroleum Revenue Tax (PRT)
on net income determined from oil and gas production.
Deferred income tax
Senior notes are measured at amortised cost.
Deferred tax is recognised for all deductible temporary differences and the carry-forward of unused tax losses. Deferred tax assets
and liabilities are measured using enacted or substantively enacted income tax rates expected to apply to taxable income in the
years in which temporary differences are expected to be recovered or settled. The effect on deferred tax assets and liabilities of a
change in rates is included in earnings in the period of the enactment date. Deferred tax assets are recorded in the consolidated
financial statements if realisation is considered more likely than not.
Rentals under operating leases are charged to the statement of income on a straight line basis over the period of the lease.
9
Ithaca Energy Inc. Q2 2017 Financial Statements
Maintenance expenditure
Recent accounting pronouncements
4. SEGMENTAL REPORTING
5. REVENUE
Three months ended 30 June Six months ended 30 June
Oil sales REV01
Gas sales REV02
NGL sales REV03
Other income REV04
6. ADMINISTRATIVE EXPENSES
Three months ended 30 June Six months ended 30 June
General & administrative EXP01
Non-recurring Delek takeover costs EXP01
Share based payment EXP16
7. FINANCE COSTS
Three months ended 30 June Six months ended 30 June
Bank interest and charges
Senior notes interest
Finance lease interest
Non-operated asset finance fees
Prepayment interest
Loan fee amortisation
Accretion
8. ACCOUNTS RECEIVABLE
Trade debtors
Accrued income
9. INVENTORY
Current
Crude oil inventory - current
Materials inventory
Non-current
Crude oil inventory
The non-current portion of inventory relates to long term stocks at the Sullom Voe Terminal.
11,722
146,190
(1,380)
(2,081)
(4,567)
6,172
157,912
2016
27,729
31 Dec
1,861
(745)
67,534
(2,294) (4,154)
2017
157
1,319
US$'000
(702) (782)
(10,423) (19,047)
(1,040)
2017
US$'000
25,868
31 Dec
30 June
43,908
(1,404)
(2,079)
US$'000
8,438
141,898
30 June
2016
(2,084)
(9,334)
(8,414)
23,504
US$'000
US$'000
(45)
(476)
(1,040)
(229)
(11)
US$'0002017 2016
(3,830)
(237)
(7,659)
(2,283)
US$'000
(250)
(6,256)
(4,584)
(1,731)
2017 2016
2016
(18,507)
42,047
24,511 57,761
US$'000
66,214
30 June
US$'000
(504)
(7)
75,684
31 Dec
1,202
(1,131)
US$'000
278
106
(3,291)
33
(1,541)
US$'000
1,861
2017
The Company operates a single class of business being oil and gas exploration, development and production and related activities
in a single geographical area presently being the North Sea.
1,895
54
(1,302)
(1,522)
(294)
US$'000
2017
37,943
5,042
US$'000
75,182
55,534
US$'000
2017
(2,486)
2016
(7,901)
824
31,593
2016
US$'000
2017US$'000
(220)
US$'000
2016
150
US$'000
(5,282) - (6,066) -
(56)
2017 2016
Expenditure on major maintenance refits or repairs is capitalised where it enhances the life or performance of an asset above its
originally assessed standard of performance; replaces an asset or part of an asset which was separately depreciated and which is
then written off, or restores the economic benefits of an asset which has been fully depreciated. All other maintenance expenditure
is charged to the statement of income as incurred.
(331)
New and amended standards and interpretations need to be adopted in the first interim financial statements issued after their
effective date (or date of early adoption). There are no new IFRSs or IFRICs that are effective for the first time for this interim
period that would be expected to have a material impact on the Corporation.
8,438
(2,960)
10
Ithaca Energy Inc. Q2 2017 Financial Statements
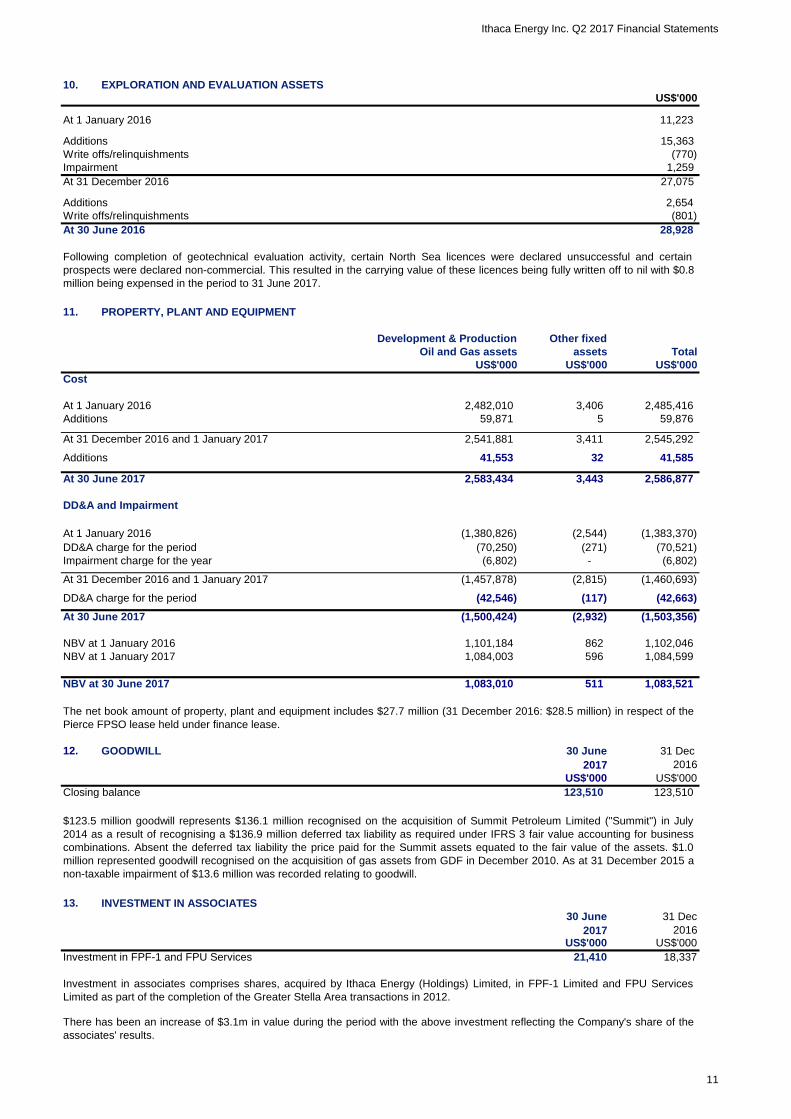
10. EXPLORATION AND EVALUATION ASSETS
At 1 January 2016
Additions
Write offs/relinquishments
Impairment
At 31 December 2016
Additions
Write offs/relinquishments
At 30 June 2016
11. PROPERTY, PLANT AND EQUIPMENT
Development & Production Other fixed
Cost
At 1 January 2016
Additions
At 31 December 2016 and 1 January 2017
Additions
At 30 June 2017
DD&A and Impairment
At 1 January 2016
DD&A charge for the period
Impairment charge for the year
At 31 December 2016 and 1 January 2017
DD&A charge for the period
At 30 June 2017
NBV at 1 January 2016
NBV at 1 January 2017
NBV at 30 June 2017
12. GOODWILL 30 June 31 Dec
Closing balance
13. INVESTMENT IN ASSOCIATES
Investment in FPF-1 and FPU Services
2,541,881
5 59,876 59,871
2,485,416
Oil and Gas assets
(70,521)(271)
3,406 2,482,010
3,411 2,545,292
(1,380,826)
(70,250)
(1,383,370)
2,586,877
27,075
1,259
15,363
Following completion of geotechnical evaluation activity, certain North Sea licences were declared unsuccessful and certain
prospects were declared non-commercial. This resulted in the carrying value of these licences being fully written off to nil with $0.8
million being expensed in the period to 31 June 2017.
(6,802)(6,802) -
US$'000
3,443
(770)
(2,544)
(2,815) (1,460,693)(1,457,878)
32
US$'000
assets
US$'000
28,928
11,223
(801)
1,084,599
1,101,184
596
862 1,102,046
(117)
(1,503,356)
2017
123,510 123,510
There has been an increase of $3.1m in value during the period with the above investment reflecting the Company's share of the
associates' results.
2016
1,083,010
1,084,003
The net book amount of property, plant and equipment includes $27.7 million (31 December 2016: $28.5 million) in respect of the
Pierce FPSO lease held under finance lease.
US$'000
Investment in associates comprises shares, acquired by Ithaca Energy (Holdings) Limited, in FPF-1 Limited and FPU Services
Limited as part of the completion of the Greater Stella Area transactions in 2012.
US$'000
US$'000
30 June
511
$123.5 million goodwill represents $136.1 million recognised on the acquisition of Summit Petroleum Limited ("Summit") in July
2014 as a result of recognising a $136.9 million deferred tax liability as required under IFRS 3 fair value accounting for business
combinations. Absent the deferred tax liability the price paid for the Summit assets equated to the fair value of the assets. $1.0
million represented goodwill recognised on the acquisition of gas assets from GDF in December 2010. As at 31 December 2015 a
non-taxable impairment of $13.6 million was recorded relating to goodwill.
41,553
2,583,434
(42,663)
31 Dec
(42,546)
2017
(2,932)
1,083,521
US$'000
2016
18,337
41,585
Total
(1,500,424)
2,654
US$'000
21,410
11
Ithaca Energy Inc. Q2 2017 Financial Statements
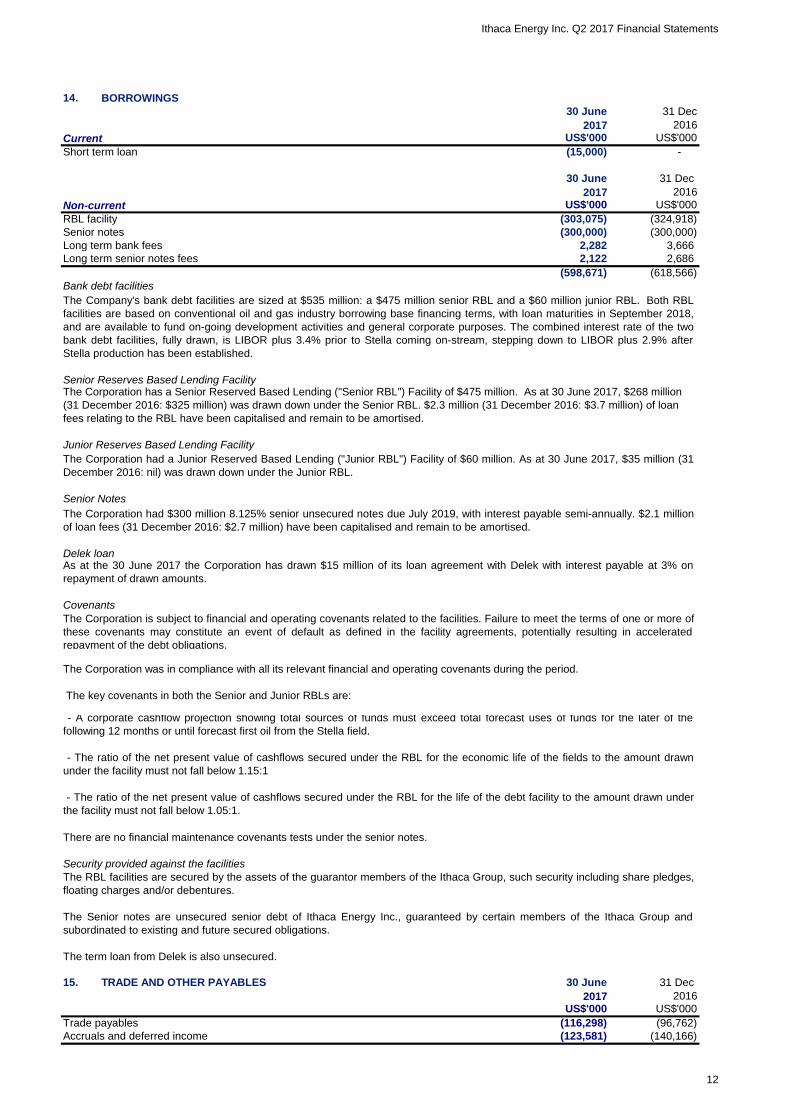
14. BORROWINGS
31 Dec
Current US$'000 US$'000
Short term loan
Non-current
RBL facility 38004
Senior notes 38002
Long term bank fees
Long term senior notes fees
Bank debt facilities
Senior Reserves Based Lending Facility
Junior Reserves Based Lending Facility
Senior Notes
Delek loan
Covenants
The key covenants in both the Senior and Junior RBLs are:
15. TRADE AND OTHER PAYABLES 30 June 31 Dec
Trade payables
Accruals and deferred income
US$'000
2016
(116,298)
US$'000
(123,581)
(324,918)
(300,000)
30 June 31 Dec
(618,566)
2,282
The Corporation had a Junior Reserved Based Lending ("Junior RBL") Facility of $60 million. As at 30 June 2017, $35 million (31
December 2016: nil) was drawn down under the Junior RBL.
US$'000
(303,075)
2016
(15,000) -
3,666
2,122 2,686
(598,671)
2017
(300,000)
30 June
2017
(96,762)
US$'000
(140,166)
There are no financial maintenance covenants tests under the senior notes.
The Corporation is subject to financial and operating covenants related to the facilities. Failure to meet the terms of one or more of
these covenants may constitute an event of default as defined in the facility agreements, potentially resulting in accelerated
repayment of the debt obligations.
- A corporate cashflow projection showing total sources of funds must exceed total forecast uses of funds for the later of the
following 12 months or until forecast first oil from the Stella field.
- The ratio of the net present value of cashflows secured under the RBL for the economic life of the fields to the amount drawn
under the facility must not fall below 1.15:1
- The ratio of the net present value of cashflows secured under the RBL for the life of the debt facility to the amount drawn under
the facility must not fall below 1.05:1.
2017
The Corporation had $300 million 8.125% senior unsecured notes due July 2019, with interest payable semi-annually. $2.1 million
of loan fees (31 December 2016: $2.7 million) have been capitalised and remain to be amortised.
The Corporation was in compliance with all its relevant financial and operating covenants during the period.
The Company's bank debt facilities are sized at $535 million: a $475 million senior RBL and a $60 million junior RBL. Both RBL
facilities are based on conventional oil and gas industry borrowing base financing terms, with loan maturities in September 2018,
and are available to fund on-going development activities and general corporate purposes. The combined interest rate of the two
bank debt facilities, fully drawn, is LIBOR plus 3.4% prior to Stella coming on-stream, stepping down to LIBOR plus 2.9% after
Stella production has been established.
Security provided against the facilities
The Corporation has a Senior Reserved Based Lending ("Senior RBL") Facility of $475 million. As at 30 June 2017, $268 million
(31 December 2016: $325 million) was drawn down under the Senior RBL. $2.3 million (31 December 2016: $3.7 million) of loan
fees relating to the RBL have been capitalised and remain to be amortised.
The RBL facilities are secured by the assets of the guarantor members of the Ithaca Group, such security including share pledges,
floating charges and/or debentures.
The Senior notes are unsecured senior debt of Ithaca Energy Inc., guaranteed by certain members of the Ithaca Group and
subordinated to existing and future secured obligations.
The term loan from Delek is also unsecured.
As at the 30 June 2017 the Corporation has drawn $15 million of its loan agreement with Delek with interest payable at 3% on
repayment of drawn amounts.
2016
12

Ithaca Energy Inc. Q2 2017 Financial Statements
(239,879) (236,928)
13
Ithaca Energy Inc. Q2 2017 Financial Statements
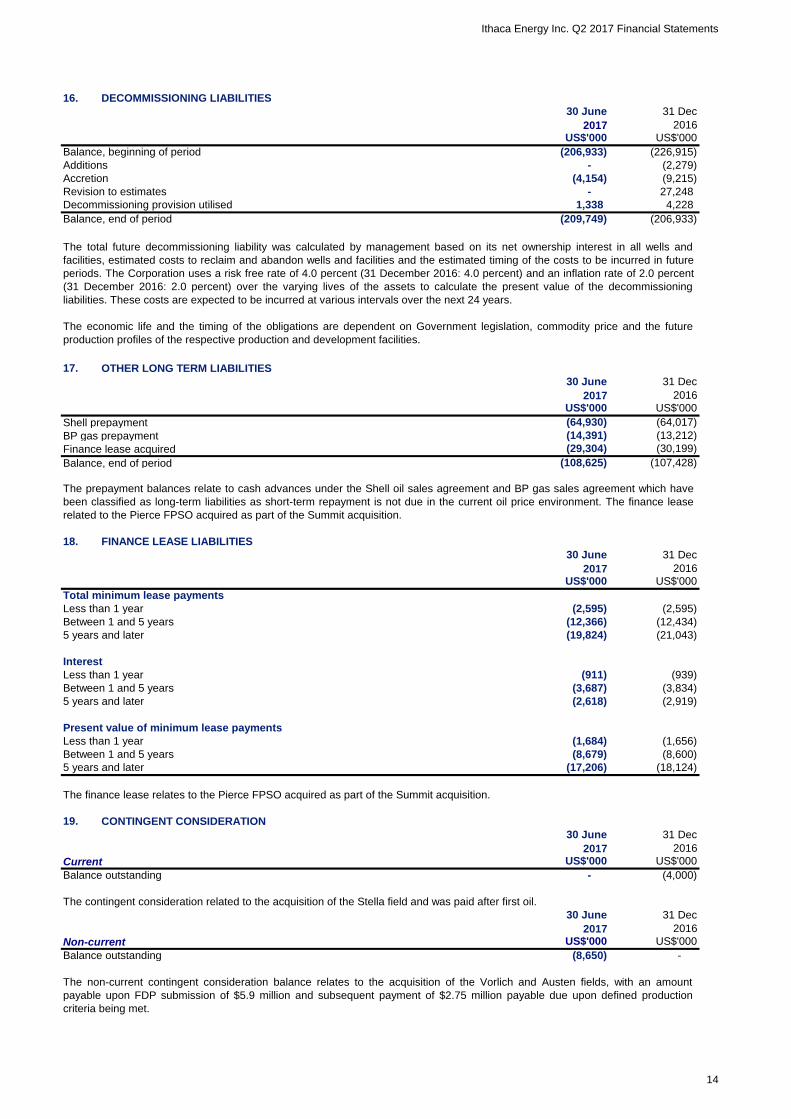
16. DECOMMISSIONING LIABILITIES
Balance, beginning of period
Additions
Accretion
Revision to estimates
Decommissioning provision utilised
Balance, end of period
17. OTHER LONG TERM LIABILITIES
Shell prepayment
BP gas prepayment
Finance lease acquired
Balance, end of period
18. FINANCE LEASE LIABILITIES
30 June 31 Dec
US$'000 US$'000
Total minimum lease payments
Less than 1 year
Between 1 and 5 years
5 years and later
Interest
Less than 1 year
Between 1 and 5 years
5 years and later
Present value of minimum lease payments
Less than 1 year
Between 1 and 5 years
5 years and later
19. CONTINGENT CONSIDERATION
31 Dec
Current US$'000 US$'000
Balance outstanding
Non-current
Balance outstanding
(209,749)
1,338
US$'000
(206,933)
2016
30 June
(4,154)
30 June
2017
2017
(13,212)
(108,625)
US$'000
31 Dec
31 Dec
(14,391)
(12,366)
2016
(3,687)
2017
The contingent consideration related to the acquisition of the Stella field and was paid after first oil.
2016
(911)
(17,206)
The finance lease relates to the Pierce FPSO acquired as part of the Summit acquisition.
(8,679)
(19,824)
(2,595)
(29,304)
2017
US$'000
-
(1,684)
(2,618)
2017
-
The total future decommissioning liability was calculated by management based on its net ownership interest in all wells and
facilities, estimated costs to reclaim and abandon wells and facilities and the estimated timing of the costs to be incurred in future
periods. The Corporation uses a risk free rate of 4.0 percent (31 December 2016: 4.0 percent) and an inflation rate of 2.0 percent
(31 December 2016: 2.0 percent) over the varying lives of the assets to calculate the present value of the decommissioning
liabilities. These costs are expected to be incurred at various intervals over the next 24 years.
The economic life and the timing of the obligations are dependent on Government legislation, commodity price and the future
production profiles of the respective production and development facilities.
2016
30 June
(2,595)
(18,124)
(4,000)
The non-current contingent consideration balance relates to the acquisition of the Vorlich and Austen fields, with an amount
payable upon FDP submission of $5.9 million and subsequent payment of $2.75 million payable due upon defined production
criteria being met.
(8,650) -
US$'000 US$'000
(8,600)
(12,434)
(21,043)
(1,656)
31 Dec30 June
2016
(3,834)
4,228
-
(107,428)
(2,919)
The prepayment balances relate to cash advances under the Shell oil sales agreement and BP gas sales agreement which have
been classified as long-term liabilities as short-term repayment is not due in the current oil price environment. The finance lease
related to the Pierce FPSO acquired as part of the Summit acquisition.
US$'000
(30,199)
(939)
(64,017)(64,930)
27,248
(226,915)
(2,279)
(9,215)
(206,933)
14
Ithaca Energy Inc. Q2 2017 Financial Statements
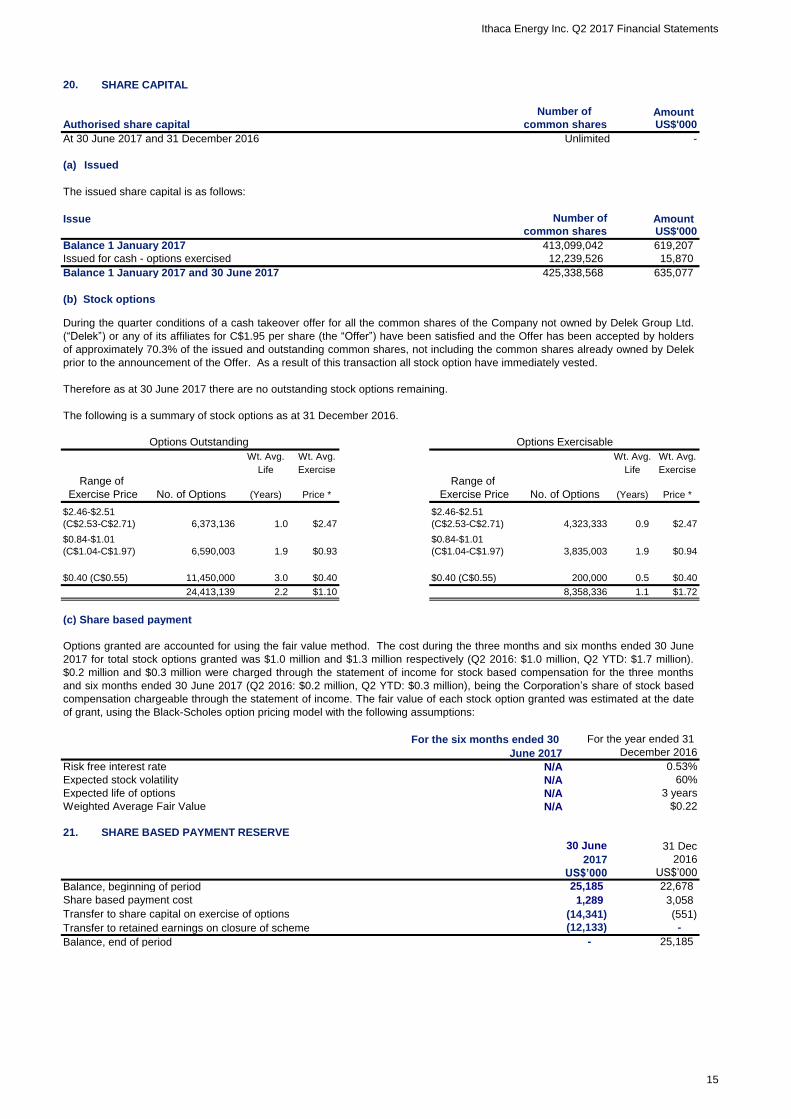
20. SHARE CAPITAL
Amount Authorised share capital common shares US$'000
At 30 June 2017 and 31 December 2016 Unlimited -
(a) Issued
The issued share capital is as follows:
Issue Amount common shares US$'000
Balance 1 January 2017
Issued for cash - options exercised
Balance 1 January 2017 and 30 June 2017
(b) Stock options
The following is a summary of stock options as at 31 December 2016.
Wt. Avg. Wt. Avg. Wt. Avg. Wt. Avg.
Life Exercise Life Exercise
(Years) Price * (Years) Price *
1.0 $2.47 0.9 $2.47
1.9 $0.93 1.9 $0.94
$0.40 (C$0.55) 3.0 $0.40 $0.40 (C$0.55) 0.5 $0.40
2.2 $1.10 1.1 $1.72
(c) Share based payment
Risk free interest rate
Expected stock volatility
Expected life of options
Weighted Average Fair Value
21. SHARE BASED PAYMENT RESERVE
30 June 31 Dec
Balance, beginning of period
Share based payment cost
Transfer to share capital on exercise of options
Transfer to retained earnings on closure of scheme
Balance, end of period
12,239,526 15,870
619,207
425,338,568
Number of
-
413,099,042
635,077
Options granted are accounted for using the fair value method. The cost during the three months and six months ended 30 June
2017 for total stock options granted was $1.0 million and $1.3 million respectively (Q2 2016: $1.0 million, Q2 YTD: $1.7 million).
$0.2 million and $0.3 million were charged through the statement of income for stock based compensation for the three months
and six months ended 30 June 2017 (Q2 2016: $0.2 million, Q2 YTD: $0.3 million), being the Corporation’s share of stock based
compensation chargeable through the statement of income. The fair value of each stock option granted was estimated at the date
of grant, using the Black-Scholes option pricing model with the following assumptions:
For the six months ended 30
June 2017
Number of
For the year ended 31
December 2016
N/A
During the quarter conditions of a cash takeover offer for all the common shares of the Company not owned by Delek Group Ltd.
(“Delek”) or any of its affiliates for C$1.95 per share (the “Offer”) have been satisfied and the Offer has been accepted by holders
of approximately 70.3% of the issued and outstanding common shares, not including the common shares already owned by Delek
prior to the announcement of the Offer. As a result of this transaction all stock option have immediately vested.
$2.46-$2.51
(C$2.53-C$2.71)
N/A
8,358,336
$0.84-$1.01
(C$1.04-C$1.97)
US$’000
22,678
3,058
(551)
25,185
(12,133)
25,185
(14,341)
$0.22
2016
-
1,289
2017
US$’000
N/A
N/A
0.53%
3 years
60%
No. of Options
6,373,136
Options Outstanding
Range of
Exercise Price No. of Options
200,000
4,323,333
$2.46-$2.51
(C$2.53-C$2.71)
6,590,003 3,835,003
Range of
Exercise Price
Therefore as at 30 June 2017 there are no outstanding stock options remaining.
$0.84-$1.01
(C$1.04-C$1.97)
24,413,139
11,450,000
Options Exercisable
15
Ithaca Energy Inc. Q2 2017 Financial Statements
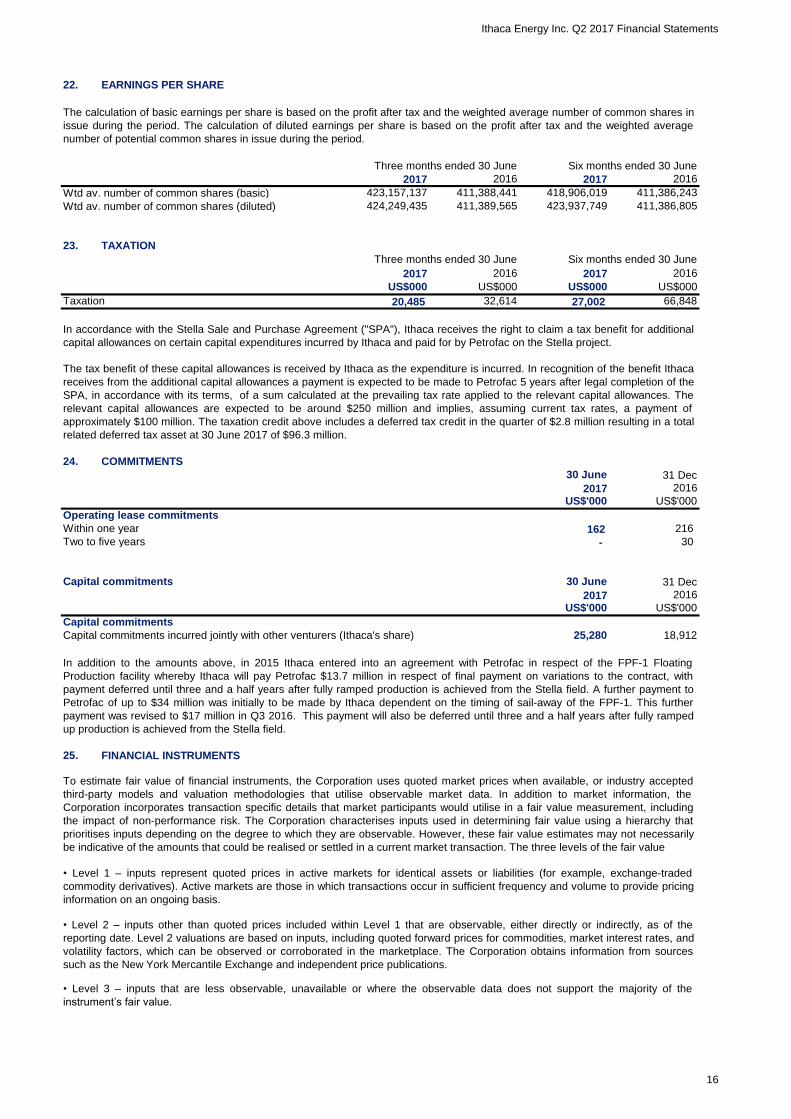
22. EARNINGS PER SHARE
Three months ended 30 June Six months ended 30 June
Wtd av. number of common shares (basic)
Wtd av. number of common shares (diluted)
23. TAXATION
Three months ended 30 June Six months ended 30 June
Taxation
24. COMMITMENTS
30 June 31 Dec
Operating lease commitments
Within one year
Two to five years
Capital commitments 30 June 31 Dec
Capital commitments
Capital commitments incurred jointly with other venturers (Ithaca's share)
25. FINANCIAL INSTRUMENTS
2016
30
US$000
424,249,435
2017
32,614
US$000
423,157,137
2016
2016
411,388,441
The calculation of basic earnings per share is based on the profit after tax and the weighted average number of common shares in
issue during the period. The calculation of diluted earnings per share is based on the profit after tax and the weighted average
number of potential common shares in issue during the period.
2017
66,848
411,386,805
The tax benefit of these capital allowances is received by Ithaca as the expenditure is incurred. In recognition of the benefit Ithaca
receives from the additional capital allowances a payment is expected to be made to Petrofac 5 years after legal completion of the
SPA, in accordance with its terms, of a sum calculated at the prevailing tax rate applied to the relevant capital allowances. The
relevant capital allowances are expected to be around $250 million and implies, assuming current tax rates, a payment of
approximately $100 million. The taxation credit above includes a deferred tax credit in the quarter of $2.8 million resulting in a total
related deferred tax asset at 30 June 2017 of $96.3 million.
20162017
27,002
25,280
216 162
-
In accordance with the Stella Sale and Purchase Agreement ("SPA"), Ithaca receives the right to claim a tax benefit for additional
capital allowances on certain capital expenditures incurred by Ithaca and paid for by Petrofac on the Stella project.
2017
US$'000
2016
In addition to the amounts above, in 2015 Ithaca entered into an agreement with Petrofac in respect of the FPF-1 Floating
Production facility whereby Ithaca will pay Petrofac $13.7 million in respect of final payment on variations to the contract, with
payment deferred until three and a half years after fully ramped production is achieved from the Stella field. A further payment to
Petrofac of up to $34 million was initially to be made by Ithaca dependent on the timing of sail-away of the FPF-1. This further
payment was revised to $17 million in Q3 2016. This payment will also be deferred until three and a half years after fully ramped
up production is achieved from the Stella field.
• Level 3 – inputs that are less observable, unavailable or where the observable data does not support the majority of the
instrument’s fair value.
2016
418,906,019
411,389,565 423,937,749
US$'0002017
411,386,243
To estimate fair value of financial instruments, the Corporation uses quoted market prices when available, or industry accepted
third-party models and valuation methodologies that utilise observable market data. In addition to market information, the
Corporation incorporates transaction specific details that market participants would utilise in a fair value measurement, including
the impact of non-performance risk. The Corporation characterises inputs used in determining fair value using a hierarchy that
prioritises inputs depending on the degree to which they are observable. However, these fair value estimates may not necessarily
be indicative of the amounts that could be realised or settled in a current market transaction. The three levels of the fair value
20,485
2017
• Level 2 – inputs other than quoted prices included within Level 1 that are observable, either directly or indirectly, as of the
reporting date. Level 2 valuations are based on inputs, including quoted forward prices for commodities, market interest rates, and
volatility factors, which can be observed or corroborated in the marketplace. The Corporation obtains information from sources
such as the New York Mercantile Exchange and independent price publications.
• Level 1 – inputs represent quoted prices in active markets for identical assets or liabilities (for example, exchange-traded
commodity derivatives). Active markets are those in which transactions occur in sufficient frequency and volume to provide pricing
information on an ongoing basis.
US$'000
18,912
US$000US$000
US$'000
16
Ithaca Energy Inc. Q2 2017 Financial Statements
Contingent consideration
Derivative financial instrument asset
Derivative financial instrument liability
Three months ended 30 June Six months ended 30 June
Revaluation of forex forward contracts
Revaluation of commodity hedges
Revaluation of interest rate swaps
Realised (loss) on forex contracts
Realised gain on commodity hedges
Realised (loss) on interest rate swaps
Total gain/(loss) on financial instruments
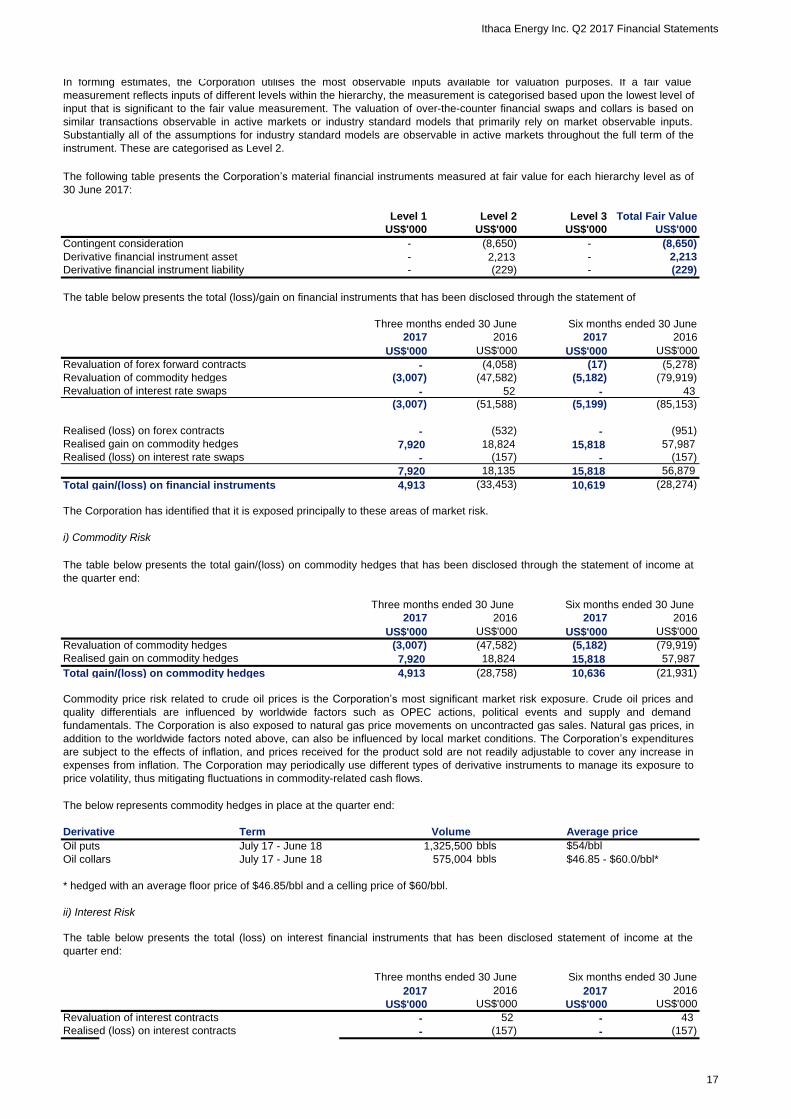
The Corporation has identified that it is exposed principally to these areas of market risk.
i) Commodity Risk
Three months ended 30 June Six months ended 30 June
Revaluation of commodity hedges
Realised gain on commodity hedges
Total gain/(loss) on commodity hedges
Derivative Term Volume
July 17 - June 18 bbls $54/bbl
July 17 - June 18 bbls
ii) Interest Risk
Three months ended 30 June Six months ended 30 June
Revaluation of interest contracts
Realised (loss) on interest contracts
575,004
1,325,500
(5,278)
Oil collars
Oil puts
(51,588)
2016
Level 2
57,987
(157)
Average price
10,619
US$'000
-
43
2017 2016
-
(21,931)
-
(5,199)
(951)
2016
(229) (229)
(8,650)
-
-
(79,919)
US$'000
2017
10,636
18,824
(157)
-
- - (8,650)
US$'000
Level 3
The following table presents the Corporation’s material financial instruments measured at fair value for each hierarchy level as of
30 June 2017:
Level 1
US$'000
In forming estimates, the Corporation utilises the most observable inputs available for valuation purposes. If a fair value
measurement reflects inputs of different levels within the hierarchy, the measurement is categorised based upon the lowest level of
input that is significant to the fair value measurement. The valuation of over-the-counter financial swaps and collars is based on
similar transactions observable in active markets or industry standard models that primarily rely on market observable inputs.
Substantially all of the assumptions for industry standard models are observable in active markets throughout the full term of the
instrument. These are categorised as Level 2.
2017
15,818
(28,274)
18,135
(33,453)
(3,007)
57,987
15,818
2017
US$'000
Commodity price risk related to crude oil prices is the Corporation’s most significant market risk exposure. Crude oil prices and
quality differentials are influenced by worldwide factors such as OPEC actions, political events and supply and demand
fundamentals. The Corporation is also exposed to natural gas price movements on uncontracted gas sales. Natural gas prices, in
addition to the worldwide factors noted above, can also be influenced by local market conditions. The Corporation’s expenditures
are subject to the effects of inflation, and prices received for the product sold are not readily adjustable to cover any increase in
expenses from inflation. The Corporation may periodically use different types of derivative instruments to manage its exposure to
price volatility, thus mitigating fluctuations in commodity-related cash flows.
56,879
4,913
43
2016
US$'000
7,920
US$'000
(3,007)
(5,182)
-
(157)
52
US$'000
(28,758)
15,818
The below represents commodity hedges in place at the quarter end:
The table below presents the total (loss)/gain on financial instruments that has been disclosed through the statement of
$46.85 - $60.0/bbl*
US$'000
The table below presents the total (loss) on interest financial instruments that has been disclosed statement of income at the
quarter end:
2016
-
US$'000
2017
The table below presents the total gain/(loss) on commodity hedges that has been disclosed through the statement of income at
the quarter end:
US$'000
(79,919)
18,824
(85,153)
(47,582)
-
(5,182)
(17)(4,058)
(47,582)
-
2,213
-
(532)
52
4,913
7,920
7,920
2017 2016
-
-
(3,007)
Total Fair Value
US$'000
-
US$'000 US$'000
2,213
US$'000
* hedged with an average floor price of $46.85/bbl and a celling price of $60/bbl.
-
US$'000
(157)
17

Ithaca Energy Inc. Q2 2017 Financial Statements
Total (loss) on interest contracts - (105) - (114)
18
Ithaca Energy Inc. Q2 2017 Financial Statements
Three months ended 30 June Six months ended 30 June
Revaluation of foreign exchange forward contracts
Realised (loss) on foreign exchange forward contracts
Total (loss) on forex forward contracts
Accounts payable and accrued liabilities
Other long term liabilities
Borrowings
2016
-
US$'000
(722,297)
(6,228)
-
(17)
Within 1 year
(613,671)
v) Liquidity Risk
1 to 5 years
(17)
The table below presents the total (loss) on foreign exchange financial instruments that has been disclosed through the statement
of income at the quarter end:
US$'000
(239,879)
(239,879)
2017
iv) Credit Risk
The Corporation is exposed to foreign exchange risks to the extent it transacts in various currencies, while measuring and
reporting its results in US Dollars. Since time passes between the recording of a receivable or payable transaction and its collection
or payment, the Corporation is exposed to gains or losses on non USD amounts and on balance sheet translation of monetary
accounts denominated in non USD amounts upon spot rate fluctuations from quarter to quarter.
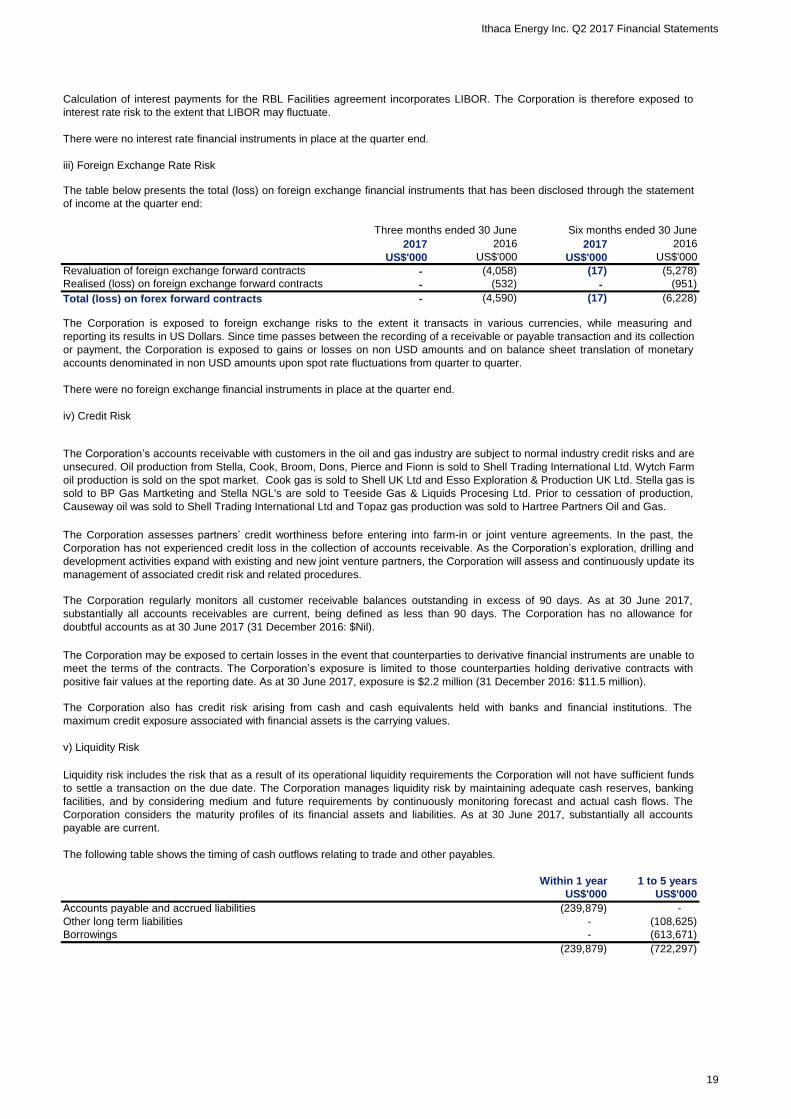
The following table shows the timing of cash outflows relating to trade and other payables.
The Corporation may be exposed to certain losses in the event that counterparties to derivative financial instruments are unable to
meet the terms of the contracts. The Corporation’s exposure is limited to those counterparties holding derivative contracts with
positive fair values at the reporting date. As at 30 June 2017, exposure is $2.2 million (31 December 2016: $11.5 million).
-
2017 2016
Calculation of interest payments for the RBL Facilities agreement incorporates LIBOR. The Corporation is therefore exposed to
interest rate risk to the extent that LIBOR may fluctuate.
iii) Foreign Exchange Rate Risk
US$'000
(4,590)
US$'000
The Corporation regularly monitors all customer receivable balances outstanding in excess of 90 days. As at 30 June 2017,
substantially all accounts receivables are current, being defined as less than 90 days. The Corporation has no allowance for
doubtful accounts as at 30 June 2017 (31 December 2016: $Nil).
(4,058)
- (532)
US$'000
There were no foreign exchange financial instruments in place at the quarter end.
US$'000
(5,278)
(951)
-
-
There were no interest rate financial instruments in place at the quarter end.
The Corporation’s accounts receivable with customers in the oil and gas industry are subject to normal industry credit risks and are
unsecured. Oil production from Stella, Cook, Broom, Dons, Pierce and Fionn is sold to Shell Trading International Ltd. Wytch Farm
oil production is sold on the spot market. Cook gas is sold to Shell UK Ltd and Esso Exploration & Production UK Ltd. Stella gas is
sold to BP Gas Martketing and Stella NGL's are sold to Teeside Gas & Liquids Procesing Ltd. Prior to cessation of production,
Causeway oil was sold to Shell Trading International Ltd and Topaz gas production was sold to Hartree Partners Oil and Gas.
(108,625)
-
Liquidity risk includes the risk that as a result of its operational liquidity requirements the Corporation will not have sufficient funds
to settle a transaction on the due date. The Corporation manages liquidity risk by maintaining adequate cash reserves, banking
facilities, and by considering medium and future requirements by continuously monitoring forecast and actual cash flows. The
Corporation considers the maturity profiles of its financial assets and liabilities. As at 30 June 2017, substantially all accounts
payable are current.
The Corporation assesses partners’ credit worthiness before entering into farm-in or joint venture agreements. In the past, the
Corporation has not experienced credit loss in the collection of accounts receivable. As the Corporation’s exploration, drilling and
development activities expand with existing and new joint venture partners, the Corporation will assess and continuously update its
management of associated credit risk and related procedures.
The Corporation also has credit risk arising from cash and cash equivalents held with banks and financial institutions. The
maximum credit exposure associated with financial assets is the carrying values.
19
Ithaca Energy Inc. Q2 2017 Financial Statements
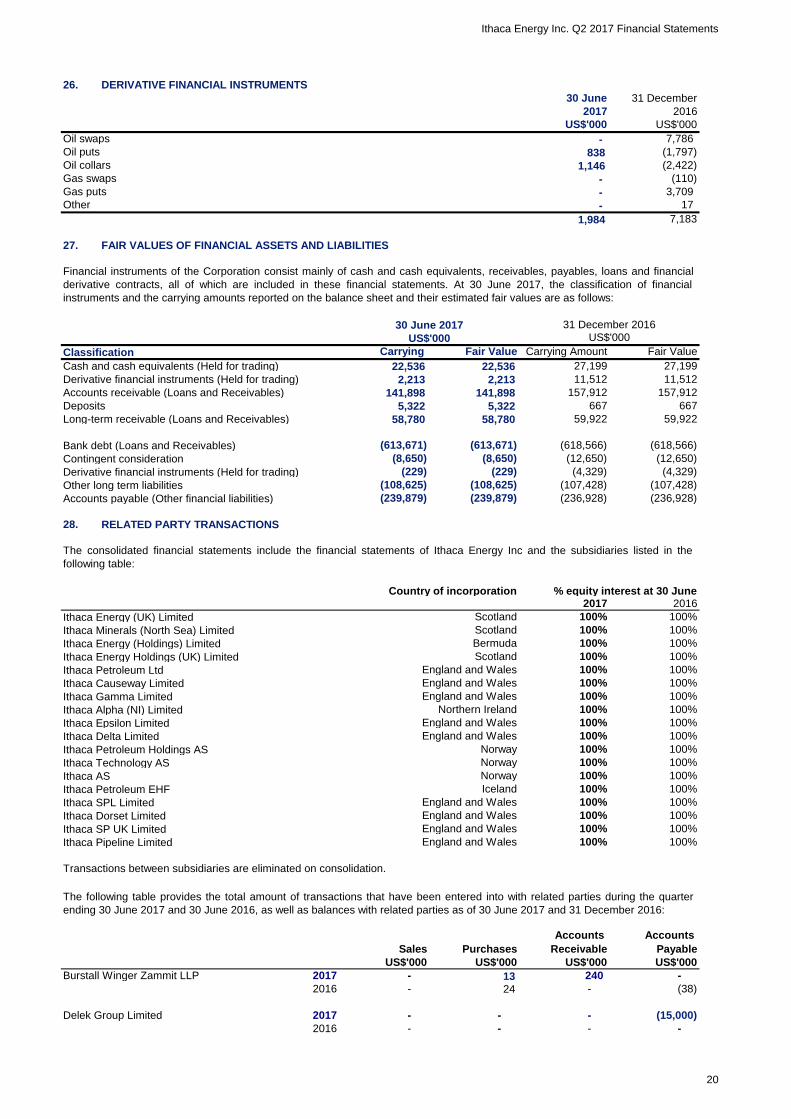
26. DERIVATIVE FINANCIAL INSTRUMENTS
30 June 31 December
US$'000 US$'000
Oil swaps
Oil puts
Oil collars
Gas swaps
Gas puts
Other
27. FAIR VALUES OF FINANCIAL ASSETS AND LIABILITIES
Classification
Cash and cash equivalents (Held for trading)
Derivative financial instruments (Held for trading)
Accounts receivable (Loans and Receivables)
Deposits
Long-term receivable (Loans and Receivables)
Bank debt (Loans and Receivables)
Contingent consideration
Derivative financial instruments (Held for trading)
Other long term liabilities
Accounts payable (Other financial liabilities)
28. RELATED PARTY TRANSACTIONS
Country of incorporation % equity interest at 30 June
Ithaca Energy (UK) Limited Scotland 100% 100%
Ithaca Minerals (North Sea) Limited Scotland 100% 100%
Ithaca Energy (Holdings) Limited Bermuda 100% 100%
Ithaca Energy Holdings (UK) Limited Scotland 100% 100%
Ithaca Petroleum Ltd England and Wales 100% 100%
Ithaca Causeway Limited England and Wales 100% 100%
Ithaca Gamma Limited England and Wales 100% 100%
Ithaca Alpha (NI) Limited Northern Ireland 100% 100%
Ithaca Epsilon Limited England and Wales 100% 100%
Ithaca Delta Limited England and Wales 100% 100%
Ithaca Petroleum Holdings AS Norway 100% 100%
Ithaca Technology AS Norway 100% 100%
Ithaca AS Norway 100% 100%
Ithaca Petroleum EHF Iceland 100% 100%
Ithaca SPL Limited England and Wales 100% 100%
Ithaca Dorset Limited England and Wales 100% 100%
Ithaca SP UK Limited England and Wales 100% 100%
Ithaca Pipeline Limited England and Wales 100% 100%
Burstall Winger Zammit LLP 2017 - 240
2016 - -
Delek Group Limited 2017 - -
2016 - -
- (15,000)
-
Transactions between subsidiaries are eliminated on consolidation.
Carrying
(108,625)
(239,879)
US$'000
(108,625)
Purchases
The following table provides the total amount of transactions that have been entered into with related parties during the quarter
ending 30 June 2017 and 30 June 2016, as well as balances with related parties as of 30 June 2017 and 31 December 2016:
(229)
5,322
Carrying Amount
2017
58,780
141,898
Fair Value
(8,650)
22,536
US$'000
31 December 2016
US$'000
2017
(107,428)
141,898
5,322
(239,879)
(8,650)
(613,671)(613,671)
(229)
58,780
Sales
US$'000US$'000 US$'000
Accounts
Payable
Accounts
Receivable
(38)
-
1,984
1,146
The consolidated financial statements include the financial statements of Ithaca Energy Inc and the subsidiaries listed in the
following table:
2016
17
7,786
(1,797)
22,536
Fair Value
30 June 2017
-
Financial instruments of the Corporation consist mainly of cash and cash equivalents, receivables, payables, loans and financial
derivative contracts, all of which are included in these financial statements. At 30 June 2017, the classification of financial
instruments and the carrying amounts reported on the balance sheet and their estimated fair values are as follows:
2,213 2,213
-
13 -
157,912
27,199
157,912
(2,422)
(12,650)(12,650)
59,922
(618,566)
(4,329)(4,329)
(236,928)
667
27,199
(236,928)
11,512 11,512
667
59,922
(618,566)
(107,428)
(110)
3,709
24
7,183
838
-
2016
-
20
Ithaca Energy Inc. Q2 2017 Financial Statements
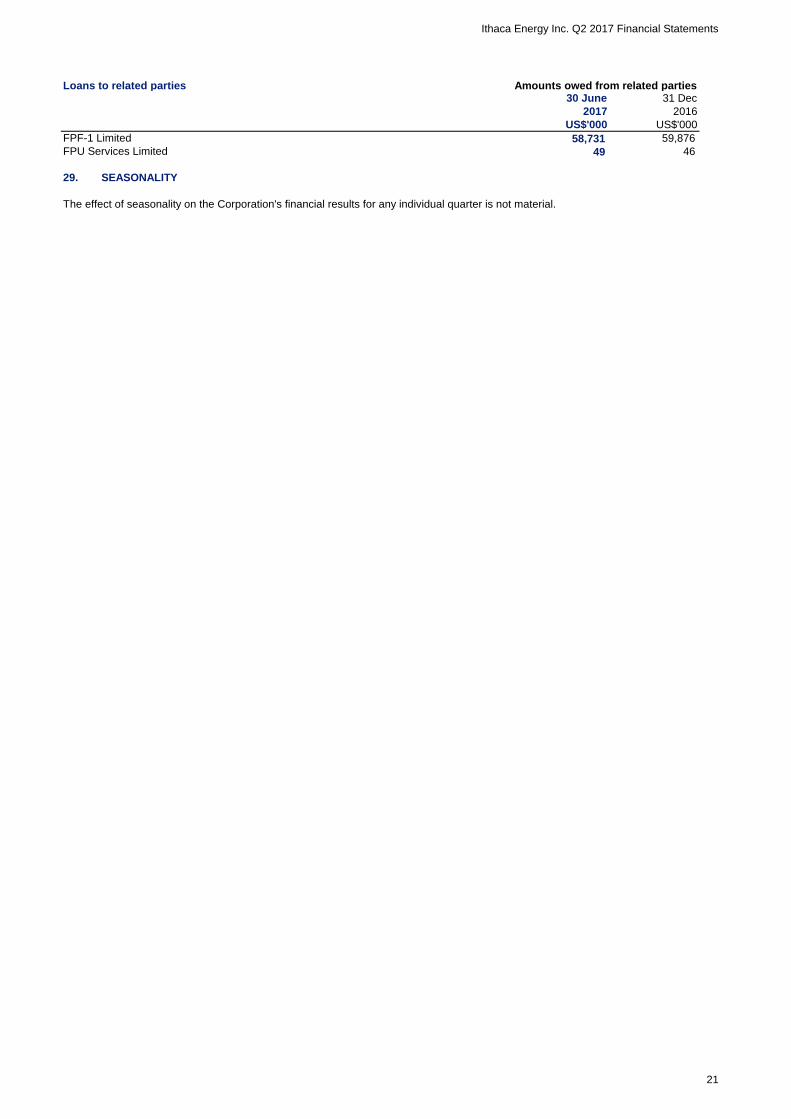
Loans to related parties Amounts owed from related parties
FPF-1 Limited
FPU Services Limited
29. SEASONALITY
The effect of seasonality on the Corporation's financial results for any individual quarter is not material.
2016
US$'000
30 June 31 Dec
58,731
2017
US$'000
49 46
59,876
21