Embed Size (px)
Citation preview

UNIVERSITA’ DEGLI STUDI DI BERGAMO
Facoltà di Ingegneria Dottorato di Ricerca in Economia e Management della Tecnologia
Essays on Entrepreneurship and Firms Performances
Alessandra Colombelli
Supervisor: Prof. Lucio Cassia
January 2008

2
3
Contents
ACKNOWLEDGEMENTS ..........................................................................................................9
CHAPTER 1 INTRODUCTION ...........................................................................................11 1.1 WHAT IS AN ENTREPRENEURIAL ACTIVITY? ..................................................................11 1.2 LINKING ENTREPRENEURSHIP AND ECONOMIC PERFORMANCES ..................................14 1.3 AIMS AND SCOPE OF THE DISSERTATION........................................................................17
CHAPTER 2 ENTREPRENEURIAL DIMENSIONS AS DETERMINANTS OF SMALL COMPANIES GROWTH ...........................................................................................21
2.1 INTRODUCTION...............................................................................................................22 2.2 THEORETICAL FRAMEWORK ...........................................................................................23 2.3 DATASET AND METHODOLOGY .....................................................................................28
2.3.1 Dataset and sample .................................................................................................28 2.3.2 Specification of the econometric model ....................................................................33 2.3.3 Dependent and Explanatory variables ....................................................................34
2.4 EMPIRICAL RESULTS .......................................................................................................38 2.4.1 Pre- and post-IPO comparison................................................................................38 2.4.2 Results of the econometric models ..........................................................................41
2.5 DISCUSSION AND POLICY IMPLICATIONS.......................................................................46 CHAPTER 3 HOW INVESTORS EVALUATE FIRM ENTREPRENEURIAL ORIENTATION?.........................................................................................................................55
3.1 INTRODUCTION...............................................................................................................56 3.2 TWO DIFFERENT PERSPECTIVES SEEKING FOR RECONCILIATION ...................................59 3.3 METHODOLOGY ..............................................................................................................62
3.3.1 Dataset and Sample.................................................................................................62 3.3.2 Methodology............................................................................................................63
3.4 RESULTS ..........................................................................................................................70 3.5 CONCLUDING REMARKS.................................................................................................73
CHAPTER 4 THE IMPACT OF KNOWLEDGE SPILLOVERS ON NEW FIRMS GROWTH .............................................................................................................................79
4.1 INTRODUCTION...............................................................................................................80 4.2 KNOWLEDGE SPILLOVERS AND FIRMS GROWTH.............................................................81 4.3 METHODOLOGY DESIGN ................................................................................................86
4.3.1 Dataset and Sample.................................................................................................86 4.3.2 The Gibrat’s Law .....................................................................................................91 4.3.3 Variables description ...............................................................................................93
4.4 RESULTS ..........................................................................................................................98 4.5 DISCUSSION...................................................................................................................102
CHAPTER 5 CONCLUSIONS ............................................................................................109

Essays on Entrepreneurship and Firms Performances
4

5
List of Tables
Table 2.1 – Panel a) and b) - Descriptive statistics at IPO............................. 31
Table 2.2 - Panel c) – Descriptive statistics at IPO ........................................ 32
Table 2.3 - Variables Typology and Their Measurement Methods............. 37
Table 2.4 – Descriptive statistics, pre- and post-IPO comparison tests ...... 40
Table 2.5 - Results of GMM-SYS Regression .................................................. 42
Table 3.1 - Variables Typology and Their Measurement Methods............. 68
Table 3.2 – Descriptive Statistics ...................................................................... 69
Table 3.3 – Correlation Matrix.......................................................................... 71
Table 3.4 - Results of OLS Regression ............................................................. 72
Table 4.1 - Descriptive statistics at IPO ........................................................... 90
Table 4.2 - Variables Measurement Methods ................................................. 96
Table 4.3 - Descriptive statistics of independent variables .......................... 97
Table 4.4 - Correlation matrix........................................................................... 99
Table 4.5- Results of GMM-SYS Regression ................................................ 101

Essays on Entrepreneurship and Firms Performances
6

7
List of Figures
Figure 2.1 – Average Sales, Total Assets and CapEx of 665 firms listed on
the AIM, 1995-2005............................................................................................. 39
Figure 2.2 - S-shaped curve of sales and relative profit curve along the
product life cycle ................................................................................................ 43
Figure 4.1 - Distribution of sample firms....................................................... 89
Figure 4.2 - Distribution of firms per thousands inhabitants ..................... 89

Essays on Entrepreneurship and Firms Performances
8

9
Acknowledgements
I wish to thank Lucio Cassia for his supervision. I am grateful to Arif
Khurshed, Gianmaria Martini, Stefano Paleari and Andrea Salanti for
useful suggestions and support during my PhD.
The first chapter also benefited from the comments of Bill Petty,
Jonathan Scott and participants in the 46th Congress of the European
Regional Science Association (Volos, 30 August - 3 September 2006), the
PhD Seminars Day (Ceris-CNR, Turin, 10 November 2006), the XX
Research In Entrepreneurship snd Small Business Annual Conference,
(Brussels, 23-24 November 2006) and the Academy of Entrepreneurial
Finance Annual Meeting (Austin, 25-27 April 2007).
I also acknowledge the helpful comments on the second chapter by
Hans Landström, Jesper L. Christensen, António Miguel A. D. Amaral and
participants to the Annual Conference of the International Council for
Small Business (Turku, 13-15 June 2007), the RENT XXI Doctoral
workshop (Cardiff, 21 November 2007) and the PhD Seminars Day (Ceris-
CNR, Turin, 23 November 2007).
The third chapter has benefited from the comments of Cristiano
Antonelli, Giovanni Dosi, Joana Mendonça, Josè Veciana and the
participants at the European Meeting on Applied Evolutionary Economics
(Manchester, 17-19 May 2007), the 47th Congress of the European Regional
Science Association (Paris, 29 August - 2 September 2007), the XXI
Research In Entrepreneurship And Small Business Annual Conference

Essays on Entrepreneurship and Firms Performances
10
(Cardiff, 22 November 2007) and the PhD Seminars Day (Castellanza, 4
July 2007).
I wish to thank Marie Curie Training Site (Grant Ref.: MEST-CT-2004-
504299) for financial support, the Accounting and Finance Group and
Centre for Research on Innovation and Competition for hospitality and co-
operation during my staying at Manchester Business School.
I am grateful to my family and Francesco for precious patience and
support.

Introduction
11
Chapter 1
Introduction
1.1 What is an entrepreneurial activity?
Although a broad range of literature has proved the important
economic value of entrepreneurship, there is still the existence of many
competitive theories and schools of thought and a lack of common
definitions. Herbert and Link (1989), in their study of the history of
economic thought about entrepreneurship, identify and classify three
different traditions, each tracing its origin to Richard Cantillon and
starting different lines of research. Firstly, the German tradition, based on
the work of Thünen, Schumpeter and Baumol, emphasizes the role of the
entrepreneur in the process of economic growth and relates economic
development to dynamic and innovative entrepreneurs. Secondly, the
(neo-)classical tradition, whose main authors are Marshall, Knight and
Schultz, stresses the role of the entrepreneur in leading markets to
equilibrium through their entrepreneurial activities. Finally, the Austrian
tradition, based on the contributions of Menger, von Mises and Kirzner, in
opposition to the formal neoclassical theories based on well-defined actors
and processes, underlines the spontaneous order emerging in economic
systems and the role of uncertainty and tacit knowledge that prompt
evolutionary processes.

Essays on Entrepreneurship and Firms Performances
12
The lack of a common definition reveals the multidimensional and
multilevel nature of entrepreneurship. Different approaches, from
economics to management, emphasize different aspects and, moreover,
adopt different level of analysis, from the regional to the individual focus.
However, it is possible to find some recurring concepts and prevalent
views in the literature. In particular, the literature focuses on two main
aspects of entrepreneurship: the intuition of new business opportunities
and the introduction of new ideas in the market. This idea is consistent
with the definition of entrepreneurship proposed in OECD (1998), which
defines entrepreneurs “as agents of change and growth in a market
economy, able to accelerate the generation, dissemination and application
of innovative ideas, willing to take risks to check whether their intuitions
are successful or not”. Similarly, the widely cited definition by Wennekers
and Thurik (1999, p. 46–48) associates the entrepreneurial activity with
“the manifest ability and willingness of individuals, on their own, in
teams, within and outside existing organisations, to perceive and create
new economic opportunities and to introduce their ideas in the market, in
the face of uncertainty and other obstacles, by making decisions on
location, form and the use of resources and institutions”.
Thus, entrepreneurship has to do with novelty and change and
involves a variety of entities both at micro and macro-level (Wennekers
and Thurik 1999, Davidsson and Wiklund 2001). This opens another
complex issue for the research activity, specifically for empirical works.
Indeed, to the purpose of operationalizing entrepreneurship, empirical
researches have adopted a wide array of measures. At individual level,
entrepreneurs are regarded as self-employed, founders or owner-
managers of a business. Similarly, an entrepreneurial team is often
characterized as two or more individuals with equity interest jointly
launching and actively participating in a business, or having a key role in
the strategic decision making of the venture at the time of founding.
Introduction
13
Following this definitions, empirical works analyse individual
characteristics of entrepreneurs and entrepreneurial teams in order to put
in evidence common traits and peculiarities (Ensley et al. 1999, Birley and
Stockley 2000, McGrath and MacMillan 2000, Lechler 2001, Baron and
Markman 2003, Gupta et al. 2004, Minniti et al. 2005). The concept of
Entrepreneurial Orientation (EO) defines entrepreneurship at the level of
organizations. Entrepreneurial orientation refers to the processes as
methods, practices, behaviours and strategies managers adopt to act
entrepreneurially. Three main dimensions have been used for
characterising and describing companies’ entrepreneurial orientation, i.e.
risk taking, innovation and proactivity (Miller 1983, Covin and Slevin
1991, Lumpkin and Dess 1996). Empirical researches have adopted various
approaches, such as managerial perceptions, firm behaviours and resource
allocations (Lyon et al. 2000) with the purpose of revealing entrepreneurial
activities in terms management perceptions, firm behaviours and strategic
decision making. At the firm level of analysis, entrepreneurial measures
are often associate with small firms, young firms or nascent firms. In
dynamic terms, entrepreneurial activities are measured as firms’ rate of
growth in accordance with the idea that the entrepreneurial activity is
mainly a growth-oriented phenomenon which stimulates economic
performance of individual firms (Covin and Covin, 1990; Covin and
Slevin, 1991; Lumpkin and Dess, 1996; Sadler-Smith et al., 2003; Swierczek
and Ha, 2003; Wolff and Pett, 2006). Actually, different variables have
been used as proxies of firm growth, e.g. sales or market share growth,
number of employees. Finally, moving the attention to the aggregate level
of analysis, studies focusing on geographical areas, such as clusters,
regions or whole countries, refer to self-employment rates, business
ownership rates, firms’ entry and exit (Fritsch 1997, Fölster 2000,
Wennekers et al. 2005, Mueller et al. 2008, Acs and Mueller 2008, Baptista
et al. 2008, Carree and Thurik 2008, Fritsch and Mueller 2008, Van Stel and
Essays on Entrepreneurship and Firms Performances
14
Suddl 2008). Although such measures have some limitations – in
particular they do not distinguish between high-tech and low-tech
activities – all of them are easy to collect and can be compared across
countries and over time.
1.2 Linking entrepreneurship and economic
performances
The relationship between entrepreneurial activities and economic
performances is not obvious. The role of entrepreneurship has changed
rapidly during the second half of last century. After the World War II,
traditional theories highlighted a decreasing function of entrepreneurial
activities in the leading economies. Entrepreneurial companies, meaning
small and young companies, were found to be less efficient than their
counterparts and only marginally involved in innovation activities. This
caused a negative impact of entrepreneurship on economic performances.
As a consequence, traditional theories assert that entrepreneurial activities
retard economic growth. By contrast, more recently, literature has
revealed changing dynamics and has suggested that, in the new economic
framework, entrepreneurship generates growth. Empirical evidence has
shown a revitalization of entrepreneurial activities since the Seventies. In
order to give an explanation to these phenomena, researchers have
developed a set of hypothesis. Firstly, the rapid technical progress, the
growing importance of niche markets and innovation in high income
countries have fostered the creation of new firms and businesses, in
particular, of small and medium-sized enterprises (SMEs). Secondly, the
competition from low-wage countries has changed the nature of
workplaces towards high-skilled work and knowledge-intensive activities.
Moreover, globalization has increased market volatility because of higher

Introduction
15
competition from foreign companies, and this has caused the exit of many
firms. By contrast, deregulation and privatization policies have boosted
the entry of new firms in formerly-regulated industries.
The phenomena described have influenced the entrepreneurial
dynamism and also carry relevant implications for the entire Economy. In
particular, it is widely accepted that a fundamental step for the
reconsideration of entrepreneurship has been the transition from the
traditional to the knowledge economy. The most competitive modern
economies are often referred to as knowledge economies meaning
economies which are directly based on production, distribution and use of
knowledge and information (OECD 1996). The basic thesis behind the
emergence of the knowledge economy concept is that firms’ competitive
advantage and economic growth in general, both at national and local
level, are more and more determined by knowledge creation and technical
progress. This thesis brings some implications for entrepreneurial
dynamics. As Audretsch (2002) points out “The new theories are dynamic
in nature and emphasize the role that knowledge plays. Because
knowledge is inherently uncertain, asymmetric and associated with high
costs of transactions, divergences emerge concerning the expected value of
new ideas. Economic agents therefore have an incentive to leave an
incumbent firm and start a new firm in an attempt to commercialize the
perceived value of their knowledge. Entrepreneurship is the vehicle by
which (the most radical) ideas are sometimes implemented”. These
evolutionary theories focus on change and innovation, being one of the
central manifestations of change. In this line of reasoning, entrepreneurial
firms enter the market motivated by the desire to appropriate the expected
value of new economic knowledge. However, firm may not be able to
remain on the market. As a consequence, markets are in motion, with a lot
of new firms entering the industry and a lot of firms exiting out of the
industry. This generates high turbulence. Apparently, as highlighted and
Essays on Entrepreneurship and Firms Performances
16
demonstrated by empirical evidences, this entrepreneurial process has a
positive impact on economic growth. Many studies have shown that
entrepreneurship indeed leads to substantial benefits in terms of, for
instance, employment generation, innovations, productivity and growth
(see van Praag and Versloot 2007 for an extensive review of the literature).
It is now clear that several fields of research have recognised the
importance of entrepreneurship for economic growth. Historical views,
management literature, growth theory and evolutionary economics,
explicitly or implicitly , consider entrepreneurship relevant for explaining
economic growth. A crucial point to be presented now is the
understanding of the link between entrepreneurship and economic
growth. This also means to link the diverse levels of analysis involved. As
Wennekers and Thurik (1999) points out “linking entrepreneurship to
economic growth also means linking the individual level to the firm and
the macro level” (pp. 50). Entrepreneurship is firstly an individual level
concept and refers to the behaviours of individuals. Entrepreneurs need a
vehicle to act entrepreneurially, firms provide such a vehicle. As a result
of individual actions companies show an entrepreneurial posture. At
organizational level, entrepreneurial actions take the form of innovation,
proactive exploitation of new opportunities and risk taking. At the
aggregate level of geographical areas, the variety of new businesses adds
to the productive potential of an economy increasing its competitiveness.
The final effect of this chain of linked facts is economic growth.
In conclusion, as highlighted by the literature at the end of the last
century, entrepreneurship “is more important for economic growth than it
has ever been. The reason is that globalization and the ICT-revolution
imply a need for structural change, requiring a substantial reallocation of
resources” (Wennekers and Thurik 1999). The wide array of works linking
entrepreneurial activities to economic growth has been the starting point
for a broad agenda of research. Since the beginning of the new century, a

Introduction
17
major field of research has been focusing on the determinants of economic
performances, both at the level of firm performance and that of the
development of regional and national economies. The research questions
considered in the thesis are originated in this framework.
1.3 Aims and scope of the dissertation
The present research is rooted in the debate on the entrepreneurial
factors affecting economic performances. The main objective of the thesis
is addressing the determinants of firm performances with a particular
focus on entrepreneurial dimensions at different level of analysis, i.e.
individual characteristics, organizational factors and external
environment.
The research question is originated by the observation of a high rate of
new firm formation in the modern economies and the resulting turbulence
due to the fact that many new companies fail while just a smaller fraction
succeed. In particular the main idea of this work is to highlight the
entrepreneurial dimension behind the fast growth of firms formed around
new business ideas in a knowledge-based economy, where value-relevant
assets are expected to consist mainly of intangible and non-marketable
assets. To this purpose, we centre our attention on public companies,
with a particular focus on the Alternative Investment Market (henceforth,
AIM) IPOs. A number of different reasons supports our choice. Firstly, an
initial public offering is one of the most notable entrepreneurial settings,
being characterized by a high degree of uncertainty. A firm undertaking
an IPO and entering the arena of public offerings faces new challenges and
pressures, such as the acceptance and monitoring activities from a new
variety of stakeholders. Moreover, the AIM is recognized as the most
successful secondary market in Europe, brought forward as an example by
Essays on Entrepreneurship and Firms Performances
18
other stock exchanges in mainland Europe when trying to (re)launch
second-tier markets. The AIM is a secondary market dedicated to young
and growing companies. These firms are in the entrepreneurial phase,
characterized by high innovativeness and entrepreneurial creativity, and
are facing uncertainty and risks due, for example, to the lack of operating
history and reputation on the market. No specific suitability criteria are
requested to qualify for the listing on the AIM. The firms listing on this
market are indeed formed around new business ideas, the main factor
behind the entrepreneurship capital creation. Furthermore, the AIM is not
a market dedicated to high-tech companies. Firms quoted on the AIM
operate both in science and non-science based industries. Accordingly,
compared to the new stock markets, the AIM allows for a more extensive
analysis without industry specificities.
In order to address the above-mentioned objective, the thesis is
structured in three individual contributions.
The first paper aims at highlighting whether individual features of
founders and top managers play an important role in determining firms’
growth. In particular, by focusing on variables relating to both firm and
top management history, we firstly try to underline the impact of three
dimensions of entrepreneurship, i.e. risk taking, education and learning.
The results of our analysis underline how risk taking and CEO
educational level seem to matter. At the same time innovativeness and
creativity, typical of both young firms and top managers, appear to have
positive effects on the rate of growth of firms listed on the AIM.
Since our results show that both firm and individual characteristics
positively affect firms’ growth, in the second part of the thesis we
investigate the relationship between firms’ entrepreneurial orientation
(EO), with a particular focus on organizational factors, and investors’
valuation. Despite the literature on entrepreneurial orientation found
support for a positive impact of EO on operating and financial

Introduction
19
performances, literature on IPOs still has to consider the effects of EO on
investor valuation. For this reason in this work we claim that
entrepreneurial orientation should be taken in consideration in the
analysis on IPO performances and enter the model on investor valuation.
Following the literature, firms’ entrepreneurial orientation is measured in
terms of risk taking, innovation and proactivity while the percent price
premium is used as the proxy for investor valuation. Our results confirm a
positive impact of risk-taking and proactivity, two of the main dimensions
of entrepreneurial orientation, on investors’ valuation.
Besides individual and organizational features, firms’ performances
are affected by environmental factors. Coupling entrepreneurship and
regional science approaches, the third contribution explores the effect of
universities, largely considered in the literature as the main source of
knowledge spillovers, on firm's growth. By analyzing the role played by
external knowledge sources such as universities, the paper contributes to
the literature on the determinants of firms’ growth. Addressing this issue
is a significant contribution in the literature as previous empirical studies
have mainly focused on the impact of knowledge spillovers on firm
concentration while their effects on firms’ growth have not been
sufficiently investigated. To our purposes, in the empirical analysis we use
the Gibrat’s Law of Proportionate Effects model. The results supports the
hypothesis that, controlling for firm's idiosyncratic factors and external
forces, both universities knowledge input and output are important
determinants of the growth of entrepreneurial firms listed on the AIM.

Essays on Entrepreneurship and Firms Performances
20

Entrepreneurial dimensions as determinants of small companies growth
21
Chapter 2 Entrepreneurial dimensions as determinants of small companies growth
Abstract
Our aim is to highlight the main features of entrepreneurial businesses
and to shed light on the determinants of small firms’ growth undertaking
an IPO. To this purpose, we centre our attention on companies going
public on the Alternative Investment Market (AIM), a market dedicated to
young and growing companies. In the paper we investigate the post-IPO
performance of 665 listed firms, which have gone public during the period
going from 1995 to 2006. In the work the factors influencing business
performance are inferred from a broad range of variables (e.g., accounting
information, CEO and board age, educational background and past
experiences). Our findings confirm that small companies listed on the
AIM growth at a faster rate after the IPO. It seems that intangible assets
are important determinants of their fast growth. The results of this work
underline the relevance of secondary markets, such as the AIM, as a
valuable alternative to traditional financial institutions in providing
capital to small and entrepreneurial companies.
JEL classification : D92, L25, M13
Keywords: Entrepreneurship, Firm Size and Performance, Public Enterprises

Essays on Entrepreneurship and Firms Performances
22
2.1 Introduction
The aim of the research is to highlight the entrepreneurial dimension
behind the creation of firms formed around new business ideas in a
knowledge-based economy, where value-relevant assets are expected to
consist mainly of intangible and non-marketable assets. To this purpose,
we focus on companies listed on the Alternative Investment Market
(henceforth, AIM). In this work we investigate the post Initial Public
Offering (IPO) performance on a three period of time of 665 listed firms,
which went public during the period going from 1995 to 2006, with the
two-fold aim to highlight the determinants shaping that performance and
to underline the role of entrepreneurship in fostering firm growth.
The analysis carried out in this paper is relevant for different reasons.
Firstly, an Initial Public Offering is one of the most notable entrepreneurial
settings, being characterized by a high degree of uncertainty. A firm
undertaking an IPO and entering the arena of public offerings faces new
challenges and pressures, such as the acceptance and monitoring activities
from a new variety of stakeholders. Moreover, AIM is a secondary market
dedicated to young and growing companies. This kind of firms at the
moment of the IPO are facing uncertainty and risks as a result of the lack
of operating history and reputation on the market, among the others.
These companies range from young, venture capital-backed start-ups to
young international companies looking to use a public market to fund
further expansion and raise their global profile. Thirdly, the AIM is the
most successful growth market in the world. Since its launch in 1995, over
2,500 companies have joined AIM. Today, more than 1500 companies from
any industry sector are quoted on it. Hence, in literature there is a growing
interest in this market. For all these reasons we find of some interest
shedding light on the features of entrepreneurial companies listed on
AIM.

Entrepreneurial dimensions as determinants of small companies growth
23
To our purposes, we investigate the post-IPO (Initial Public Offering)
performance of the 665 firms in our sample and highlight how the
entrepreneurial dimensions play an important role in determining firms’
growth. In particular, by focusing on variables relating to both firm and
top management history, our results show that both firm and CEO
characteristics positively affect firms’ growth. In particular, the results of
our analysis underline how risk taking and CEO educational level seem to
matter. At the same time innovativeness and creativity, typical of both
young firms and top managers, appear to have positive effects on the rate
of growth of firms listed on the AIM. In the discussion of our results we
also try to draw some useful policy indications both at national and
regional level. We argue that policy makers could pay attention to the key
role of secondary financial market. We also claim that some policy issues
may be voted to encouraging the propensity to risk.
The paper is organized as follows. In the first part we outline the
theoretical framework underlying the paper and clarify the research
background of the study. In this section we illustrate the relationship
between entrepreneurial dimensions and firms’ performance and describe
the theoretical model that guides our study. In the methodological section
we describe the dataset, the sample of companies we used in our work
and the variables used in our model. Next, we describe the results of our
analyses. Finally, we discuss our interpretation regarding our findings and
try to carry some policy implications.
2.2 Theoretical framework
Empirical works have concentrated the attention on traditional
determinants of firm performance as, for example, age, size, industry,
legal form and location (Storey 1994, Audretsch 1995, Sutton 1997, Caves
Essays on Entrepreneurship and Firms Performances
24
1998, Almus and Nerlinger 1999, Davidsson et al. 2002) and have
demonstrated that small, young and independent businesses grow at
fastest rate. However, in a knowledge-based economy, where value-
relevant assets are expected to consist mainly of intangible assets, firms’
performance may be influenced by factors other than the traditional ones.
In particular, a growing interest in the literature has been devoted to
human and intellectual capital as critical factors shaping firm
performance. Among the determinants of growth, entrepreneurship is
assumed to play a relevant role, as this kind of intangible asset promotes
the spillover of knowledge, becoming crucial in building both firms’ and
regions’ innovation capability and strengthening learning skills. This is
consistent with the critical resources theories (Wernerfelt 1984, Zingales
2000, Rajan and Zingales 2001, Kaplan et al. 2005) that emphasizes the role
of critical resources in shaping firms evolution and growth. According to
these theories a critical resource can be either a person or a specific asset.
In particular, Kaplan et al. (2005) interprets this theory in a dynamic
perspective and highlight that while the firm initial critical resource is the
founder, along the life cycle path the investments built around the founder
become the critical resource.
The role of entrepreneurship on firm performance has been analysed
on different levels. On the one hand, the literature on entrepreneurship
has paid interest on the role of founders, entrepreneurial as well as
management teams showing that their human capital, in terms of
knowledge and skills, has a positive impact on firm growth (Eisenhardt
and Schoonhoven 1990, Storey 1994, Timmons 1999, Birley and Stockley
2000, Weinzimmer 1997). On the other hand, literature has focused
attention on firm entrepreneurial behavior at the organizational level. In
this vein, one of the most important features of a firm showing an
entrepreneurial orientation is considered its propensity for risk taking,
which consists of activities such as borrowing heavily, committing a high

Entrepreneurial dimensions as determinants of small companies growth
25
percentage of resources to projects with high risks but high returns and
entering in unknown markets (Baird and Thomas 1985).
These concepts are consistent with both the definition of
entrepreneurship proposed in OECD (1998), which defines the
entrepreneurs “as agents of change and growth in a market economy, able
to accelerate the generation, dissemination and application of innovative
ideas, willing to take risks to check whether their intuitions are successful
or not” and in Wennekers and Thurik (1999, p. 46–48) which defines
entrepreneurial “the manifest ability and willingness of individuals, on
their own, in teams, within and outside existing organisations, to perceive
and create new economic opportunities and to introduce their ideas in the
market, in the face of uncertainty and other obstacles, by making decisions
on location, form and the use of resources and institutions”.
Following these arguments, we argue that young and fast growing
companies formed around new business ideas and, furthermore,
undertaking an IPO are in an entrepreneurial phase. First, they are
introducing new ideas in the market. Second, they are facing uncertainty,
as they don’t have market history. Third, they are making decision on
their form and resources allocation. In accordance with the literature on
this topic, we claim that such a firms growth is affected by both
entrepreneurial firm behaviour as risk taking and organizational factors as
founder and top management team characteristics.
In our work we thus focus on public companies listed on the AIM
trying to highlight three dimensions of entrepreneurship: risk taking,
education and learning. A brief review of the literature may allow us to
identify for each dimension some of the relevant variables influencing
firms’ performance.
First, empirical evidence shows how younger and smaller firms grow
more than the older and larger ones. Consistently with the life cycle model
(see Quinn and Cameron 1983, Miller and Friesen 1984), actually, an

Essays on Entrepreneurship and Firms Performances
26
enterprise starts as young, small and simple, showing a risk-taking
posture and high rate of growth. However, along the path of
transformation it becomes older, bigger and in general more complex and
it begins to grow at a slow rate and to slow down its propensity towards
risk taking. In sum, the life cycle model argue that the firm shows an
exponential growth path over time during the first stages – birth and
growth; after that, during the maturity and decline phases, the firm starts
a new path showing an asymptotic profile, as soon as sales growth slows
down. Following these arguments, we expect a negative relationship
between age and size and firms growth. Furtermore, concerning the risk
level of business, previous researches show how young and small firms
are associated with a high risk as they lack of past experience and no
complete information on their operational activities and quality are
available. For this reason small and young enterprises are often subject to
‘credit rationing’ (Jaffe and Russel 1976, Stiglitz and Weiss 1981, Fazzari et
al. 1988, Winker 1999). This may hamper their prospects of growth.
However such a companies have also the opportunity to attract
investments from venture capitalists, which provide equity to those firms
with a high risk. For this reason, the literature has tried to understand the
impact of venture capitalist on firm performances. However, the effect of
venture capitalists investments on firm growth seems to be ambigous
(Audretsch and Lehman 2004, Cressey 2006). Another dimension of risk
taking is related to the borrowing propensity of a company.
Entrepreneurial firms are expected to incurr in high debt and, hence, to
show high leverage ratios in order to obtain high returns. Several studies
have focused on firm’s financial risk and found a negative relationship
between leverage ratio and firm profitability (Arditti 1967, Gale 1972).
Following these arguments we want to verify the impact of risk taking on
firms’ growth.

Entrepreneurial dimensions as determinants of small companies growth
27
Secondly, a large body of empirical research provides support to the
existence of a relationships between firms performances and founder or
top managers educational background (Bates 1990, Storey 1994, Roper
1998, Carmeli and Tisher 2004, Audretsch and Lehmann 2004, Lester et al.
2006). The board of directors has important roles of governance as, for
example, the right to choose and advice the management of the firm.
Moreover, directors acquire and evaluate information on firm financial
situation in order to define firm strategies. Their education and skills may,
thus, be an important asset for the firm. For example, Audretsch and
Lehmann (2004), in their study on the determinants of the post-IPO
performance on the German Neuer Market, suggest that human capital,
measured as the educational background of the owner and the board, is
one of the most significant determinants of the market performance of
listed firms. Therefore, we aim to analyze the relationship between the
presence of highly educated directors and firm growth.
Finally, previous works highlight how firms’ performance may depend
on executive managers competences and experiences (Lee and Tsang 2001,
Carmeli and Tisher 2004). Moreover, some contributions (Rotemberg and
Saloner 2000, Schutjens e Wever 2000) argue that the survival of the firm is
influenced by the capabilities and experiences of the board. Lester et al.
(2006) find that the prestige of top management teams (TMTs), measured
on the bases of previous experiences and educational level, at the time of
an IPO enhances organizational legitimacy and thereby influences
investor valuations. Furthermore, the entrepreneurship literature offers
theoretical contributions and give empirical foundation to the relationship
between propensity to new firm formation and the individual
characteristics of entrepreneurs, such as age, level of education and degree
of working experience (Evans and Leighton 1989, Shaver and Scott 1991,
Adaman and Devine 2002). Empirical research finds a positive
relationships between entrepreneurial attitudes – for example cognitive

Essays on Entrepreneurship and Firms Performances
28
ability, creativity, intuition – and both knowledge and expertise.
Following these arguments, we finally aim at verify if companies managed
by directors with previous experiences and skills will exhibit higher
growth rate than those managed by directors without previous
experiences and skills.
2.3 Dataset and Methodology
2.3.1 Dataset and sample
In order to investigate the relationship between firms’ performance
and entrepreneurship, we refer to EurIPO1 database which collects data on
more than 3,000 operating companies that went public on the main
European markets (London, Frankfurt, Euronext, and Milan) through IPO
during the period 1985-2006. We focus on the subset of companies listed
on the AIM from 1995 to 2006. The dataset combines publicly available
information (e.g., year of establishment, listing date), accounting data from
balance sheets (the main variables of consolidated financial statements in a
range of three years before and three years after the listing date of each
firm) and data related to both the offer and the ownership structure from
IPO prospectuses.
To the purpose of analyzing the influence of intangibles assets (such as
human, organizational and entrepreneurship capital) on firm
performance, we mainly focus on offer and ownership set of data. The IPO
prospectus, accordingly, is the primary source of data for our study. It is
an important document, which gives detailed information about the firm
1 EurIPO is a database containing information on European public companies realized at the University of Bergamo. The dataset is organized in three sections: Accounting, collecting data from the balance sheets, e.g., assets, equity, sales, EBIT and capital expenditure; Offer, which brings together data on the offering, such as pricing methodology, number of share, cost of the IPO and Book Value; Ownership, gathering information on main shareholder, founder, CEO and board of directors. Additional information referring to intellectual property rights are also included.
Entrepreneurial dimensions as determinants of small companies growth
29
such as the operating history, firm products and ownership structure.
Additionally, it includes biographical information regarding the founder,
CEO and the firm executive management.
Our sample consists of 665 companies listed on the AIM. The
Alternative Investment Market is regarded as the most successful
secondary market in Europe, brought forward as an example by other
stock exchanges in mainland Europe when trying to (re) launch second-
tier markets. A number of different reasons made this market interesting
for our purposes.
Firstly, the AIM is a secondary market dedicated to young and
growing companies. In accordance with the corporate life cycle model by
Quinn and Cameron (1983), these firms are in the entrepreneurial phase,
characterized by high innovativeness and entrepreneurial creativity, and
also by a high level of uncertainty.
Furthermore, no specific suitability criteria are requested to qualify for
the listing on the AIM. The firms listing on the AIM are indeed formed
around new business ideas, the main factor behind the entrepreneurship
capital creation. As Audretsch and Keilbach (2004) argue,
entrepreneurship capital shows up through the creation of new firms,
involving entrepreneurs, who are willing to deal with the risk of creating
new firms, and investors, that want to share the risks and benefits
involved.
Moreover, firms quoted on the AIM operate both in science and non-
science based industries. Accordingly, compared to the new stock
markets, the Alternative Investment Market allows for a more extensive
analysis without industry specificities. Actually, this is consistent with our
aims as entrepreneurship can be considered a firm- or a region-specific
factor rather than an industry-specific factor. It is a transversal
phenomenon with regard to the industrial sector.

Essays on Entrepreneurship and Firms Performances
30
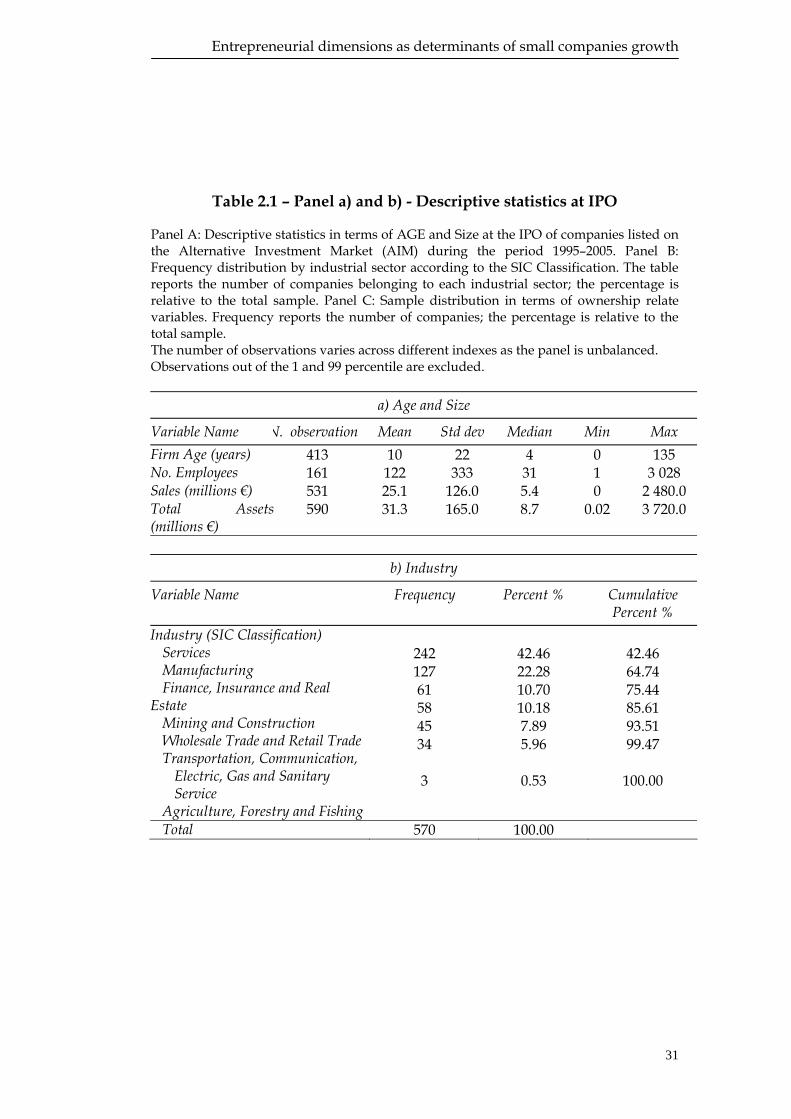
Descriptive statistics for the sample at the IPO year are provided in
Table 2.1 and 2.2. Data in panel a) (Age and Size) confirm that on average
companies going public on the AIM are quite young and small.
Companies are 10 years old in mean, 4 in median. As far as the size is
concerned, AIM’s firms with 122 employees and 25.1 millions euro on
average are included in the SME segment according to the definition of the
European Commission2.
Panel b) (Industry) reports the industry classification referring to the 1-
digit SIC Classification. The Services companies (e.g., hotels, business
services, health, legal and social services) are highly represented in our
sample (42.46%). Manufacturing cover more than 20% of the sample while
each of the other economic groups gathers about 10% or less of the IPOs.
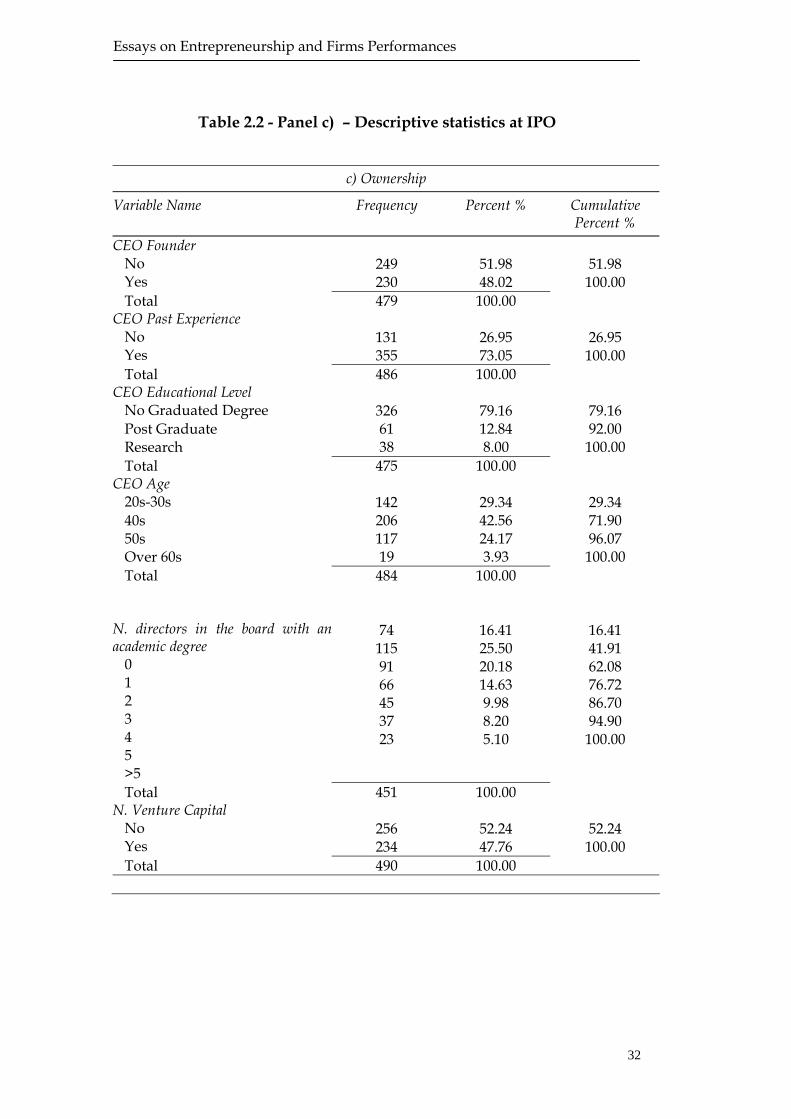
Panel c) (Ownership) describes the sample in terms of top management
related variables as CEO biographical information, board educational level
and number of venture capitalists. The CEO is also the founder of the
company for the 48% of the sample. On average the CEO has past
experiences in other companies’ board of directors. Most of the CEO are in
their 40s and don not hold a post-graduate title. Most of the companies
have in their board at least one director with an academic degree while
almost a half of firms are financed with venture capital funds.
2 Commission Recommendation 2003/361/EC of 6 May 2003 regarding the SME definition, which replaced Recommendation 96/280/EC as from 1 January 2005.
Entrepreneurial dimensions as determinants of small companies growth
31
Table 2.1 – Panel a) and b) - Descriptive statistics at IPO
Panel A: Descriptive statistics in terms of AGE and Size at the IPO of companies listed on the Alternative Investment Market (AIM) during the period 1995–2005. Panel B: Frequency distribution by industrial sector according to the SIC Classification. The table reports the number of companies belonging to each industrial sector; the percentage is relative to the total sample. Panel C: Sample distribution in terms of ownership relate variables. Frequency reports the number of companies; the percentage is relative to the total sample. The number of observations varies across different indexes as the panel is unbalanced. Observations out of the 1 and 99 percentile are excluded.
a) Age and Size
Variable Name N. observation Mean Std dev Median Min Max Firm Age (years) 413 10 22 4 0 135 No. Employees 161 122 333 31 1 3 028 Sales (millions €) 531 25.1 126.0 5.4 0 2 480.0 Total Assets(millions €)
590 31.3 165.0 8.7 0.02 3 720.0
b) Industry
Variable Name Frequency Percent % Cumulative Percent %
Industry (SIC Classification) Services Manufacturing Finance, Insurance and Real
Estate Mining and Construction Wholesale Trade and Retail Trade Transportation, Communication,
Electric, Gas and Sanitary Service
Agriculture, Forestry and Fishing
242 127 61 58 45 34
3
42.46 22.28 10.70 10.18 7.89 5.96
0.53
42.46 64.74 75.44 85.61 93.51 99.47
100.00
Total 570 100.00
Essays on Entrepreneurship and Firms Performances
32
Table 2.2 - Panel c) – Descriptive statistics at IPO
c) Ownership
Variable Name Frequency Percent % Cumulative Percent %
CEO Founder No Yes
249 230
51.98 48.02
51.98
100.00 Total 479 100.00
CEO Past Experience No Yes
131 355
26.95 73.05
26.95
100.00 Total 486 100.00
CEO Educational Level No Graduated Degree
326
79.16
79.16
Post Graduate 61 12.84 92.00 Research 38 8.00 100.00 Total 475 100.00
CEO Age 20s-30s
142
29.34
29.34
40s 206 42.56 71.90 50s 117 24.17 96.07 Over 60s 19 3.93 100.00 Total 484 100.00
N. directors in the board with anacademic degree
0 1 2 3 4 5 >5
74 115 91 66 45 37 23
16.41 25.50 20.18 14.63 9.98 8.20 5.10
16.41 41.91 62.08 76.72 86.70 94.90
100.00
Total 451 100.00 N. Venture Capital
No Yes
256 234
52.24 47.76
52.24
100.00 Total 490 100.00

Entrepreneurial dimensions as determinants of small companies growth
33
2.3.2 Specification of the econometric model
The entrepreneurial dimensions behind business performance are
investigated through the estimation of the following model:
Firm Growth Ratei,t = β0 + β1 Firm Growth Ratei,t-1 + β2 Risk Takingit +
β2 Educationit + β3 Learningi,t + β4 Controlit + εit (2.1)
Where sales growth for firm i in year t is taken as the dependent
variable. We control for growth rate autocorrelation by including Firm
Growth Ratei,t-1 , i.e. the lagged value of the dependent variable. Risk Takingit ,
Educationit and Learningit are groups of variables describing the three
entrepreneurial dimensions highlighted in the theoretical framework
while Controlit is a group of control variables.
The inclusion of the lagged dependent variable in the model requires
dynamic estimation techniques. We have a large N and small T panel data
set. Following the literature on dynamic panel estimator (Arellano and
Bond 1991, Blundell and Bond 1998, Bond 2002), the model is estimated
using the generalize method of moments (GMM) methodology. In
particular, we use the GMM-System (GMM-SYS) estimator developed by
Blundell and Bond (1998) in order to increase efficiency. This approach
instruments variables in levels with lagged first-differenced terms. The
authors demonstrated dramatic improvement in performance of the
system estimator compared to the usual first-difference GMM estimator
developed by Arellano and Bond (1991). We choose this estimator for a
specific reason. In system GMM it is possible to include time-invariant
regressors, which would disappear in difference GMM. Asymptotically,
this does not affect the coefficients estimates for other regressors.
Essays on Entrepreneurship and Firms Performances
34
2.3.3 Dependent and Explanatory variables
In accordance with the framework we use in this paper, the variables
included in our model can be grouped in three classes. The first one refers
to the degree of risk associated with the firm, the second one to the
education levels of the board, the third represents the learning dynamics.
Moreover a set of control variables has been used to provide higher
robustness to the analysis. In the remainder of this section we provide an
outline of the indicators we used in the econometric test.
Consistently with previous research on small businesses and
entrepreneurship (Covin and Covin 1990, Covin and Slevin 1991,
Lumpkin and Dess 1996, Sadler-Smith et al. 2003, Swierczek and Ha 2003,
Wolff and Pett 2006), the dependent variable of our model is a measure of
firms’ performance. Actually, different variables can be considered as
proxies of firm performance, e.g. sales or market share growth, number of
employees and financial outcomes. To our purposes, we choose sales
growth for different reasons. First, in the literature on entrepreneurship it
is the most widely used measure of firms performance as the
entrepreneurial activity is considered mainly as a growth-oriented
phenomenon which stimulates economic performance of individual firms
and, as a consequence, general economic growth. Furthermore, the IPOs
sample under scrutiny is principally composed by young and small
companies, which decided to go public for a growth strategy. In many
cases, firms listed on the AIM are within the first four years of activity and
the aftermarket is a period for high investments. As a consequence,
profitability may be a biased measure of such a firms performances. In
sum, sales growth is both a measure of firm contribution to the overall
economic growth and a proxy of owners and managers propensity to
pursue growth trajectories. The dependent variable is, hence, computed as
the growth rate of firm sales at each period t. Such a rate has been
computed as the ratio between sales in two subsequent periods in
Entrepreneurial dimensions as determinants of small companies growth
35
logarithmic scale, i.e., the difference between logs of sales yielded in two
subsequent periods. In particular we focus on the post-IPO period of time.
As far as independent variables are concerned, we grouped them in
three categories: risk-related, education-level and learning variables.
Firstly, the risk-related variables are Firm Size, Firm Age, Leverage and
Venture Capitalist. The first two are among the wide range of independent
variables used to investigate firms’ growth rate determinants and refers
respectively to the logarithm of sales (Firm Size) and the age of the firm at
the moment of the IPO in logarithmic scale (Firm Age). The third indicator
to measure the propensity for risk taking is the financial leverage of firms,
computed as the ratio between financial debts and financial debts plus
equity at the moment of the IPO. This ratio is a proxy of companies’ risk
exposure as generally financing capital via debt is considered riskier than
equity financing. By the fourth variable, Venture Capitalist, we identify
those IPOs, which rely on venture capital investments (Lester et al. 2006);
it is a dummy variable which takes value 1 if at the moment of the IPO
venture capitalists were in the ownership structure of the firm, 0
otherwise.
Secondly, we introduce in our model the education-level variables to
investigate the influence of human capital on business performance.
Recent studies show how prestige and educational background of CEO
and board of directors may impact firm’s performance on the markets
(Lester et al., 2006) and firm survival (Bates 1990, Audretsch and Lehmann
2004). Our measures of CEO and Board educational level are Board
Education, CEO No Graduate, CEO Postgraduate and CEO Research. The first
is a dummy taking value 1 if there is at least one board director having at
least a bachelor degree, 0 otherwise. The other variables refer specifically
to the CEO. They all are dummies taking value 1 if the CEO holds
respectively no graduate degree, post-graduate or PhD degrees as
reported in IPO prospectus.

Essays on Entrepreneurship and Firms Performances
36
As far as learning is concerned, we explore the role of CEO work
experiences and capabilities and try to find if they have some impacts on
business performance. The literature in the field of knowledge economics
shows how the stock of accumulated learning positively influences the
development path of firms. For this reason, firms in the early stages of
their life cycle, which do not have a past history and experience, may be
supported in their growth by the capability and competence accumulated
by the direction in previous experiences. Based on previous works (Lester
et al., 2006) in our model we, thus, use the variables CEO Founder and CEO
Experience, which are dummy variables respectively denoting whether or
not the CEO is also the firm’s founder, and whether or not the CEO has
already been in other firm boards of directors. To account for the possible
impact of learning dynamics and creativity, the age of the CEO has also
been used as an independent variable. The measure of CEO Age is the age
of the CEO as reported in the IPO prospectus.
In our model we control for both industry and calendar year effects.
Following the primary 1-digit standard industrial classification (SIC) code
for the IPOs analysed, ten industry dummies were included in the model
to control for industry-specific factors, as industry cycles and trends that
may influence the rate of growth of individual firms. In our model, we
also included a set of dummies variables controlling for calendar year
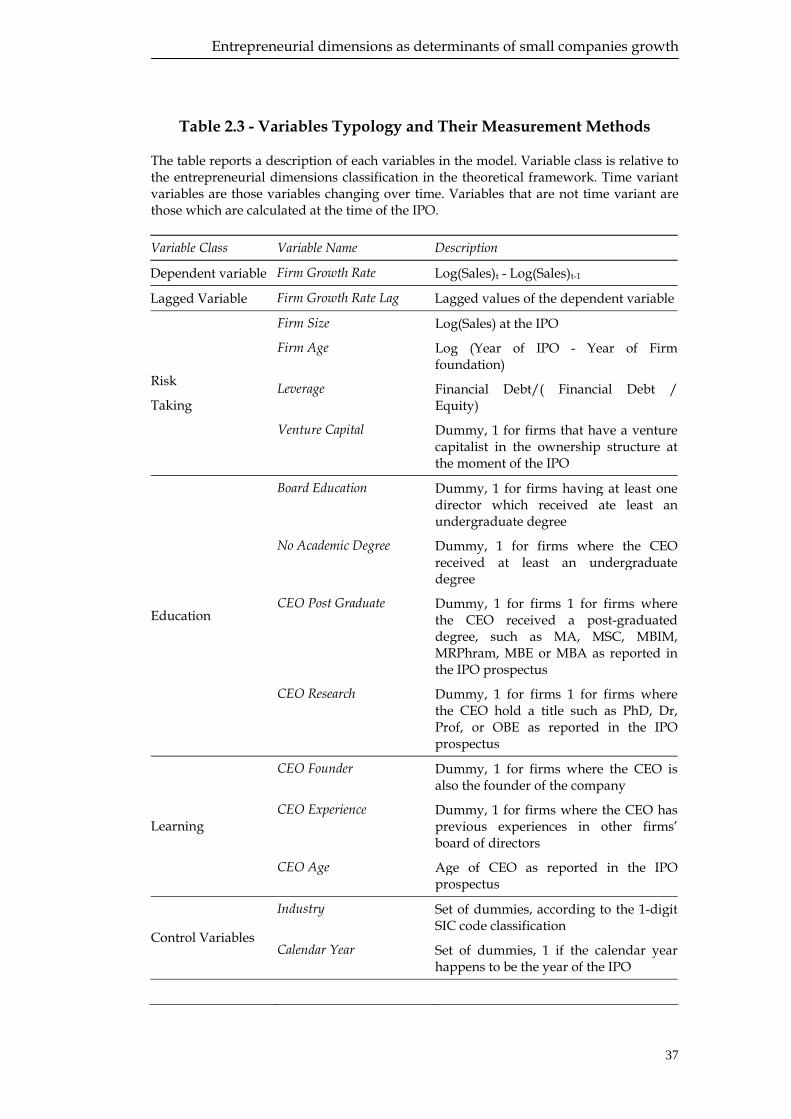
effects. In Table 2.3 the basic features of both the dependent and
independent variables of the model are summarized.
Entrepreneurial dimensions as determinants of small companies growth
37
Table 2.3 - Variables Typology and Their Measurement Methods
The table reports a description of each variables in the model. Variable class is relative to the entrepreneurial dimensions classification in the theoretical framework. Time variant variables are those variables changing over time. Variables that are not time variant are those which are calculated at the time of the IPO. Variable Class Variable Name Description
Dependent variable Firm Growth Rate Log(Sales)t - Log(Sales)t-1
Lagged Variable Firm Growth Rate Lag Lagged values of the dependent variable
Firm Size Log(Sales) at the IPO
Firm Age Log (Year of IPO - Year of Firm foundation)
Leverage Financial Debt/( Financial Debt / Equity)
Risk
Taking
Venture Capital Dummy, 1 for firms that have a venture capitalist in the ownership structure at the moment of the IPO
Board Education Dummy, 1 for firms having at least one director which received ate least an undergraduate degree
No Academic Degree Dummy, 1 for firms where the CEO received at least an undergraduate degree
CEO Post Graduate Dummy, 1 for firms 1 for firms where the CEO received a post-graduated degree, such as MA, MSC, MBIM, MRPhram, MBE or MBA as reported in the IPO prospectus
Education
CEO Research Dummy, 1 for firms 1 for firms where the CEO hold a title such as PhD, Dr, Prof, or OBE as reported in the IPO prospectus
CEO Founder Dummy, 1 for firms where the CEO is also the founder of the company
CEO Experience Dummy, 1 for firms where the CEO has previous experiences in other firms’ board of directors
Learning
CEO Age Age of CEO as reported in the IPO prospectus
Industry Set of dummies, according to the 1-digit SIC code classification
Control Variables Calendar Year Set of dummies, 1 if the calendar year
happens to be the year of the IPO

Essays on Entrepreneurship and Firms Performances
38
2.4 Empirical Results
2.4.1 Pre- and post-IPO comparison
Figure 2.1 shows the pre- and post-IPO trends of sales, total assets and
CapEx for the sample under investigation. Descriptive statistics for the
pre- and post-IPO main operating performance in the IPO sample are
provided in Table 2.4. The pre-IPO period of time goes from three years
before the IPO to the listing year included, while the post-IPO covers the
three years after the listing date of each firm. The two periods of time are
compared through median comparison test (Mann-Whitney) and mean
comparison test (t-statistics). F-test for equal variance is also provided. The
results show that firms listed on AIM increase in terms of sales, total assets
and capital expenditure (CapEx) after the IPO. It seems such a companies
use the capital raised at the listing to realize new investments as the
increase in total assets and CapEx shows.
If we move our attention on the measures of firm performance we can
refine our considerations. The results show those firms grow at faster rate
in terms of sales after the listing on the Alternative Investment Market.
This is in line with the findings of Khurshed et al. (2003) for a sample of
companies listed on the AIM between 1995 and 1999 emphasizing that the
performance of such a firms increased in the three years post-IPO period
of time. We find that Turnover and Investments indexes decrease after the
IPO, although the decrease in Investments is not significant. This means
that total assets increase at a faster rate than both sales and CapEx. This
result supports the idea that companies list on the AIM in order to
implement a growth strategy.

Entrepreneurial dimensions as determinants of small companies growth
39
Figure 2.1 – Average Sales, Total Assets and CapEx of 665 firms listed on the AIM, 1995-2005
Source: Our elaborations on EurIPO data.
90,00
92,00
94,00
96,00
98,00
100,00
102,00
104,00
106,00
108,00
-4 -3 -2 -1 0 1 2 3 4
Years, T(0)=IPO
Sale
s, T
(0)=
100
SalesTotal AssettsCapEx

Essays on Entrepreneurship and Firms Performances
40
Table 2.4 – Descriptive statistics, pre- and post-IPO comparison tests Descriptive statistics for the pre- and post-IPO main operating performance in the 665 IPO sample are provided in the table. The pre-IPO period of time goes from three years before the IPO to the listing year included, while the post-IPO covers the three years after the listing date of each firm. Statistical significance at 1%, 5%, and 10% as ***, **and * respectively. Variables’ definition in brackets.
Variables pre-IPO post-IPO Tests (f, t, z statistics)
Sales (million €) N. observations Std dev mean median
1563 42.8 16.0 4.3
1264 71.9 25.9 7.7
0.3546*** -4.3266*** 7.273***
Total Assets (million €) N. observations Std dev mean median
1743 67.6 19.3 5.6
1328 84.6 34.3 11.5
0.6381*** -5.3085*** 14.035***
CapEx (million €) N. observations Std dev mean median
711 1.8 0.7 0.2
543 4.3 2.1 0.5
0.1836*** -6.8287*** 9.315***
Sales Growth Rate (%) N. observations Std dev mean median
907
106.7 33.2 25.5
1126 116.1 41.2 29.2
0.8443*** -1.6327** 1.760**
Turnover (%) (Sales/Total Assets)
N. observations Std dev mean median
1564 357.3 157.6 93.1
1266 297.9 114.6 66.5
1.4382*** 3.4966*** -6.698***
Investments (%) (CapEx/Total Assets)
N. observations Std dev mean median
703 60.3 12.8 5.4
547 14.3 9.8 4.5
17.7035*** 1.2668 -0.285
ROA (%) (Ebitda/Total Assets)
Observations Std dev mean median
1568 648.3 -58.4 3.1
1264 244.9 -25.5 0.1
7.0052*** -1.8526** -4.672***
Leverage (%) ( Debt/(Debt+Equity))
N. observations Std dev mean median
690 502.8 85.5 26.3
631 320.7 35.6 13.7
2.4586*** 2.1688** -6.796***

Entrepreneurial dimensions as determinants of small companies growth
41
The measure of profitability and (ROA) is found to be decreasing after
the IPO. There is an ongoing debate within the empirical literature
concerning post-IPO underperformance. For a discussion of these issues
see Schultz (2003), Loughran and Ritter (2000), and Brav et al. (2000). In
particular, as far as operating performances are concerned, Jain and Kini
(1994) and Mikkelson et al. (1997) find that operating return on assets
declines after the IPO while Loughran and Ritter (1997) report post
Seasoned Equity Offerings (SEO) underperformance. The literature on this
topic tries to give explanation to listed companies underperformances and
find three main reasons for this phenomenon, e.g., windows of
opportunity, window dressing and change of ownership. However, to
our purposes we are analyzing the AIM companies’ sample from another
perspective, as we are interested in some of the features of fast growing
companies. Finally, as expected the leverage diminish in the post-IPO
period of time. Indeed, the issue gives firms the opportunity to rise equity
capital and consequently to decrease their leverage.
2.4.2 Results of the econometric models
The results of the econometric estimation are presented in Table 2.5.
Both firm-specific and CEO-specific variables proved to be statistically
significant. First, the lagged dependent variable proved to be negatively
and significantly (p<0.10) related to the firm rate of growth. This is an
interesting result in its own right. Actually, according to the life-cycle
theory, firms’ growth path is supposed to follow an S-shaped curve, hence
showing an exponential path followed by a logarithmic one (see Figure
2.2).

Essays on Entrepreneurship and Firms Performances
42
Table 2.5 - Results of GMM-SYS Regression GMM-SYS data estimations are applied using the following regression equation:
Firm Growth Ratei,t = β0 + β1 Firm Growth Ratei,t-1 + β2 Firm Sizei + β3 Firm Agei +
+β4Leveragei + β5 Venture Capitali + β6Board Educationi + β7 CEO Post Graduatei +
+β8CEO Researchi + β9 CEO Founderi + β10 CEO Experiencei + β11 CEO Agei+
+β12Industryi +β13 Calendar Yeari +εi
Where the index i=1,…,665 refers to the companies and t=0,…,3 refers to the year after the IPO. For variables’ definition refer to Table II. CEO No Graduated is dropped to avoid multicollinearity. Statistical significance at 1%, 5%, and 10% as ***, **and * respectively. z statistics between parentheses. Dependent variable = Firm Growth Ratei,t
Variable Class Variable Name Estimations
Constant -1.126(-2.70)
***
Lagged Variable Firm Growth Rate Lag -0.133(-1.63)
*
Firm Size -0.044 (-2.74)
***
Firm Age -0.082 (-1.69)
*
Leverage 0.148 (1.78)
* Risk Taking
Venture Capital 0.002 (0.04)
Board Education -0.023 (-0.38)
CEO Post Graduate 0.244 (1.97)
** Education
CEO Research -0.034 (-0.18)
CEO Founder -0.127 (-1.77)
*
CEO Experience -0.011 (-0.15)
Learning
CEO Age -0.008 (-2.27)
**
Industry Yes Control variables Calendar Year Yes Number of instruments 38 Wald Test χ2 (12) 41.67 *** Hansen test χ2 (8) Prob> χ2
6.750.564
AR(1) Prob> z
-3.540.000
***
AR(2) Prob> z
-1.110.265

Entrepreneurial dimensions as determinants of small companies growth
43
Figure 2.2 - S-shaped curve of sales and relative profit curve along the
product life cycle
Time
Amount of sales or profits
Introduction Growth Maturity Decline
Sales
Profits
Essays on Entrepreneurship and Firms Performances
44
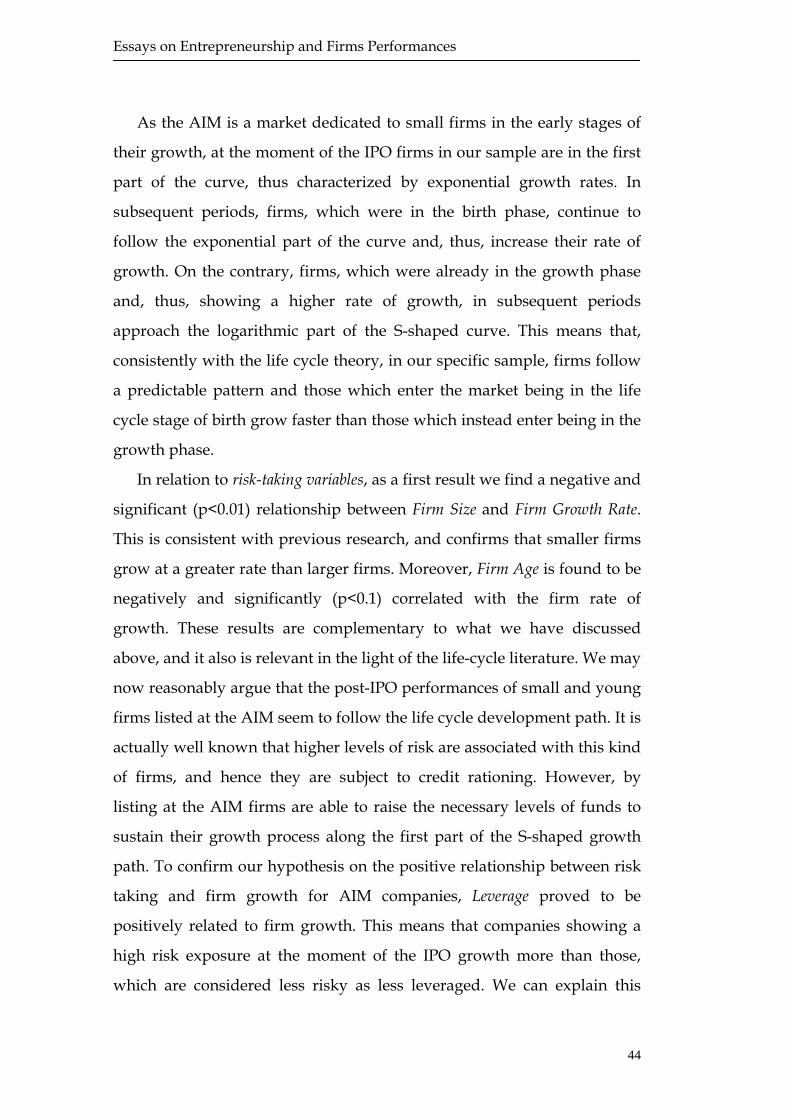
As the AIM is a market dedicated to small firms in the early stages of
their growth, at the moment of the IPO firms in our sample are in the first
part of the curve, thus characterized by exponential growth rates. In
subsequent periods, firms, which were in the birth phase, continue to
follow the exponential part of the curve and, thus, increase their rate of
growth. On the contrary, firms, which were already in the growth phase
and, thus, showing a higher rate of growth, in subsequent periods
approach the logarithmic part of the S-shaped curve. This means that,
consistently with the life cycle theory, in our specific sample, firms follow
a predictable pattern and those which enter the market being in the life
cycle stage of birth grow faster than those which instead enter being in the
growth phase.
In relation to risk-taking variables, as a first result we find a negative and
significant (p<0.01) relationship between Firm Size and Firm Growth Rate.
This is consistent with previous research, and confirms that smaller firms
grow at a greater rate than larger firms. Moreover, Firm Age is found to be
negatively and significantly (p<0.1) correlated with the firm rate of
growth. These results are complementary to what we have discussed
above, and it also is relevant in the light of the life-cycle literature. We may
now reasonably argue that the post-IPO performances of small and young
firms listed at the AIM seem to follow the life cycle development path. It is
actually well known that higher levels of risk are associated with this kind
of firms, and hence they are subject to credit rationing. However, by
listing at the AIM firms are able to raise the necessary levels of funds to
sustain their growth process along the first part of the S-shaped growth
path. To confirm our hypothesis on the positive relationship between risk
taking and firm growth for AIM companies, Leverage proved to be
positively related to firm growth. This means that companies showing a
high risk exposure at the moment of the IPO growth more than those,
which are considered less risky as less leveraged. We can explain this

Entrepreneurial dimensions as determinants of small companies growth
45
result considering that companies in our sample diminish their leverage in
the post-IPO period of time as the issue gives firms the opportunity to
increase more equity capital. This is in line with the results of the our pre-
and post-IPO comparison analysis that shows how in the post-IPO period
of time sales reveal a fast increase while the Leverage index shows a
decrease. From our findings, Venture Capitalists is not a significant
variable. This result seems to confirm the ambiguous impact of venture
capitalists on firm performance, as shown by the literature on this topic.
Secondly, we obtained some interesting findings concerning
education-related variables. As far as the CEO is concerned, the
educational level proved to be relevant, in that the coefficients on the CEO
Post Graduate is positive and statistically significant (p<0.05). This means
that firms’ performances are likely to be positively influenced by the CEO
educational attainment. This finding is consistent with the literature on the
importance of codified knowledge.
For what concern learning-related variables, the CEO Founder is a
negative and statistically significant variable (p<0.10). This result is
consistent with previous works. Certo et al. (2001), for example, found that
IPO firms managed by founder CEOs perform more poorly than IPO firms
managed by non-founder CEOs while Lester et al. (2006) found that
investor valuations are negatively affected by the presence of a CEO,
which is also the founder of the company. This result can be explained as
follows. After an IPO fundamental changes in management style should
emerge in response to the demands of an evolving organizational context.
However, as Tashakori (1980) concluded, the large majority of
entrepreneurial owner-founders do not make the transition to a
professional style of management. This is consistent with the critical
resources theories stating that while in the initial phase of the life cycle the
founder is the critical resource, in the following stages the web of specific
investments built around the founder becomes the critical resource.

Essays on Entrepreneurship and Firms Performances
46
Next, the CEO Age is found negative and statistically significant
(p<0.05). This means that firms that are managed by young CEOs growth
more than those managed by older CEOs. Thus we can infer, that the
typical entrepreneurial features like creativity and alertness, which are
more likely to be found among young CEOs as previous studies argue,
have a positive impact on firm growth.
As the validity of GMM relies on the choice of the appropriate set of
instruments and the absence of serial correlation of second order, the
results of the post-estimation tests are included in Table IV. The Hansen
test for over-identyfing restrictions give us confidence with the validity of
the instruments with a probability of 0.6. As expected, negative first-order
serial correlation is found in Arellano-Bond AR(1) test. The Arellano-Bond
AR(2) test does not allow us to reject the null hypothesis of no higher
order serial correlation. This result indicates the validity of instruments
with a probability of 0.3.
2.5 Discussion and Policy Implications
In this work the determinants of business performance are inferred
from a broad range of variables (e.g., accounting information, CEO and
board age, educational background and past experiences). Our results
confirm that intangible assets other than traditional ones (e.g., firm age
and size) are important factors shaping the performance of firms listed on
the AIM. In particular we found that AIM companies follow an S-shaped
pattern of growth. Furthermore, age and size have negative effects on
firms’ growth, consistently with the life-cycle theory. It also seems that
CEO educational level and age are critical to the businesses performance,
providing further support to the importance of codified and tacit
knowledge stocks.

Entrepreneurial dimensions as determinants of small companies growth
47
The results of this work could have some policy implications both at
national and regional level. At the national level, policy makers could take
into account the relevance of an efficient financial system, in particular the
emerging role of secondary markets such as the AIM, and try to remove
financial constraints that hamper the prospect of new businesses. In their
start-up and growth phases, firms need substantial external funding.
However, the literature on this topic highlights that small and young
enterprises are subject to ‘credit rationing’ and thus have major difficulty
in attracting capital in their initial phase, mainly due to information
asymmetries (Stiglitz and Weiss 1981, Fazzari et al. 1988, Winker 1999).
Actually, potential investors have in general little information on the
entrepreneurial capabilities or about the investment opportunities of such
enterprises. Hence, if lenders are not able to identify the quality or the risk
associated with the borrower, there will be credit rationing (Jaffe and
Russell 1976). Under uncertainty conditions a secondary market as the
AIM could help in lowering credit rationing. In this way new businesses
may find the funds required to finance their growth.
As far as entrepreneurship is concerned, it is important to look at the
process of transformation in the cultural and behavioral attitudes of many
countries towards entrepreneurship, in particular on the matter of
rewarding propensity to risk, an element that brings with it economic
advantages. The increase in the number of new firms and their relative
chances of survival and growth is, thus, an important objective for
governments action. At the regional level, political intervention could aim
at promoting entrepreneurial activities, which ease the local process of
change by encouraging the propensity to risk and easing the access to
external capital. Education towards entrepreneurship represents an
example of how is important the stimulation a more dynamic
entrepreneurial culture. In order to increase the population of
entrepreneurs, another appropriate policy would be to foster the

Essays on Entrepreneurship and Firms Performances
48
participation of young and the unemployed work force in the
entrepreneurial process. Our findings support these two achievable
intervention as they show how educated and young CEOs positively
influence firms growth.

Entrepreneurial dimensions as determinants of small companies growth
49
References
Adaman, F., P. Devine (2002), A Reconsideration of the Theory of Entrepreneurship: A Participatory Approach, Review of Political Economy, 14 (3), 329-55.
Almus, M., E.A. Nerlinger (1999), Growth of New Technology-Based Firms: Which Factors Matter?, Small Business Economics , 13 (2), 141-54.
Arditti, F. (1967), Risk and the required return on equity, Journal of Finance, 22, 19-36.
Arellano, M., Bond, S. (1991), Some Tests of Specification for Panel Data: Monte Carlo Evidence and an Application to Employment Equations, Review of Economic Studies , 58, 277-97.
Audretsch, D.B. (1995), Innovation and Industry Evolution , Cambridge, MA: MIT Press.
Audretsch, D.B., M. Keilbach (2004), Does Entrepreneurship Capital Matter?, Entrepreneurship Theory and Practice , 28(5), 419-30.
Audretsch, D.B., E.E. Lehmann (2004), The Effects of Experience, Ownership, and Knowledge on IPO Survival: Empirical Evidence from Germany, Max-Planck-Institut zur Erforschung von Wirtschaftssystemen, Papers on Entrepreneurship, Growth and Public Policy (20-2004).
Baird, I. S., Thomas H. (1985), Toward a Contingency Model of Strategic Risk Taking , The Academy of Management Review , 10 (2), 230-243.
Bates, T. (1990), Entrepreneurial Human Capital Impacts and Small Business Longevity, The Review of Economics and Statistics , 72, 551-9.
Birley, S., S. Stockley (2000), Entrepreneurial teams and venture growth, in D. Sexton and H. Landström, (eds.), Blackwell Handbook of Entrepreneurship , Blackwell: Oxford.
Blundell, R., Bond, S. (1998), Initial Conditions and Moment Restrictions in Dynamic Panel Data Models, Journal of Econometrics, 87, 115-143.
Bond, S. (2002), Dynamic panel data models: a guide to micro data methods and practice, Portuguese Economic Journal , 1, 141-62.

Essays on Entrepreneurship and Firms Performances
50
Brav, A.C. Geczy, P. Gompers (2000), Is the abnormal return following equity issuance anomalous?, Journal of Financial Economics, 56, 209-49.
Carmeli, A., e Tishler, A. (2004), Resources, Capabilities, and the Performance of Industrial Firms: A Multivariate Analysis, Managerial and Decision Economics, 25, 299-315.
Caves, R. (1998), Industrial organization and new findings on the turnover and mobility of firms, Journal of Economic Literature , 36, 1947–1982.
Certo, S. T., J. G. Covin, C. M. Daily, and D. R. Dalton (2001), Wealth and the Effects of Founder anagement Among IPO-Stage New Ventures, Strategic Management Journal, 22, 641-58.
Covin, J. G., T. J. Covin (1990), Competitive Aggressiveness, Environmental Context, and Small Firm Performance, Entrepreneurship Theory and Practice , 14, 35-50.
Covin, J. G., Slevin, D. P. (1991), A conceptual model of entrepreneurship as firm behaviour, Entrepreneurship Theory and Practice , 16, 7-25.
Cressey, R. (2006), Debt Finance and Credit Constraints on SMEs, in S.C. Parker (eds.), The Life Cycle of Entrepreneurial Ventures, Springer: US.
Davidsson, P., B. Kirchhoff, A. Hatemi-J, H. Gustavsson (2002), Empirical Analysis of Business Growth Factors Using Swedish Data, Journal of Small Business Management , 40 (4), 332-49.
Eisenhardt, K., C. Schoonhoven (1990), Organizational growth: linking founding team, strategy, environment, and growth among U.S. semiconductor ventures, 1978-1988, Administrative Science Quarterly , 35 (3), 504-529.
Evans, D.S., L.S. Leighton (1989), Some Empirical Aspects of Entrepreneurship, The American Economic Review, 79 (3), 519-35.
Fazzari, S.M., R.G. Hubbard, B.C. Petersen (1988), Financing Constraints and Corporate Investment, Brookings Papers on Economic Activity, 88, 141-95.
Gale, B. (1972), Market share and rate of return, The Review of Economics and Statistics, 54, 412-423.
Kaplan, S. N., B. A. Sensoy and P. Strömberg (2005), What are firms? Evolution from birth to public companies, NBER Working Paper 11581.
Entrepreneurial dimensions as determinants of small companies growth
51
Khurshed, A., S. Paleari and S. Vismara (2003), The Operating Performance of Initial Public Offerings: The UK Experience, paper presented at the Australasian Banking and Finance Conference.
Jaffe, D.M. and T. Russell (1976), Imperfect Information, Uncertainty and Credit Rationing, Quarterly Journal of Economics , 90, 651-66.
Jain, B.A., and O. Kini (1994), The Post-Issue Operating Performance of IPO Firms, Journal of Finance, 49, 1699-1726.
Lee, D.Y, and E.W.K. Tsang (2001), The Effect of Entrepreneurial Personality Background and Network Activities on Venture Growth, Journal of Management Studies , 38 (4), 583-602.
Lester, R.H., S.T. Certo, C.M. Dalton, D.R. Dalton and A.A. Cannella, Jr (2006), Initial Public Offering investor valuations: an examination of top management team prestige and environmental uncertainty, Journal of Small Business Management , 44, 1-26.
Loughran, T., J. R. Ritter (1997), The Operating Performance of Firms Conducting Seasoned Equity Offerings, Journal of Finance, 52 (5), 1823-50.
Loughran, T., J. R. Ritter (2000), Uniformly least powerful tests of market efficiency, Journal of Financial Economics, 55 , 361-89.
Lumpkin, G.T., e G.G. Dess (1996), Clarifying the Entrepreneurial Orientation Construct and Linking it to Performance, Academy of Management Review, 21, 135-72.
Mikkelson, W.H., M.M. Partch and K. Shah, 1997, Ownership and operating performance of companies that go public, Journal of Financial Economics, 44, 281-307.
Miller, D., and P. H. Friesen (1984), A Longitudinal Study of the Corporate Life Cycle, Management Science, 30(10), 1161-83.
OECD - Organization for Economic Co-operation and Development (1998), Fostering Entrepreneurship- The OECD Job Strategy, OECD: Paris, 12.
Quinn, R.E. and K. Cameron (1983), Organisational Life Cycles and Shifting Criteria of Effectiveness: Some Preliminary Evidence, Management Science, 29, 33-51.

Essays on Entrepreneurship and Firms Performances
52
Rajan, R., and Zingales, L. (2001), The firm as a dedicated hierarchy: A theory of the origins and growth of firms, Quarterly Journal of Economics, 805-850.
Roper, S., 1998, Entrepreneurial Characteristics, Strategic Choice and Small Business Performance, Small Business Economics, 11, 11-24.
Rotemberg, J.J. and G. Saloner (2000), Visionaries, Managers, and Strategic Decisions, Rand Journal of Economics, 31, 693-716.
Sadler-Smith, E., Y. Hampson, I. Chaston, and B. Badger (2003), Managerial Behavior, Entrepreneurial Style, and Small Firm Performance, Journal of Small Business Management , 41(1), 47-67.
Sutton, J (1997), Gibrat’s legacy, Journal of Economic Literature , 35, 40–59.
Schutjens, V.A.J.M., e Wever, E. (2000), Determinants of new firm success?, Papers in Regional Science , 79, 135-59.
Schultz, P. (2003), Pseudo Market Timing and the Long-Run Underperformance of IPOs, The Journal of Finance, 58, 483-517.
Shaver, K.G. and L.R. Scott (1991), Person, Process, Choice: The Psychology of New Venture Creation, Entrepreneurship Theory and Practice, Winter, 23-42.
Stiglitz, J.E. and A. Weiss (1981), Credit Rationing in Markets with Imperfect Information, The American Economic Review, 71, 393-410.
Storey, D. (1994), Understanding the Small Business Sector, New York, London: Routledge.
Swierczek, F. W. and T. T. Ha (2003), Entrepreneurial Orientation, Uncertainty Avoidance and Firm Performance, International Journal of Entrepreneurship and Innovation, 4(1), 46-58.
Tashakori, M. 1980, Management Succession: From the Owner-Founder to the Professional Manager (Praeger: New York).
Timmons, J. (1999), New venture creation: entrepreneurship for the 21st century, Irwin/McGraw-Hill: Boston, MA..
Weinzimmer, L. (1997), Top management team correlates of organizational growth in a small business context: a comparative study, Journal of Small Business Management , 35 (3), 1-9.

Entrepreneurial dimensions as determinants of small companies growth
53
Wennekers, S. and R. Thurik (1999), Linking entrepreneurship and economic growth, Small Business Economics , 13 (1), 27-55.
Wernerfelt, Birger (1984), A Resource Based View of the Firm, Strategic Management Journal, 5, 171-180.
Winker, P. (1999), Causes and Effects of Financing Constraints at the Firm Level, Small Business Economics, 12, 169-81.
Wolff J. A. and T. L. Pett (2006), Small-Firm Performance: Modeling the Role of Product and Process Improvements, Journal of Small Business Management , 44(2), 268-84. Zingales, L. (2000), In Search of New Foundations, The Journal of
Finance, 55, 1623- 1653.

Essays on Entrepreneurship and Firms Performances
54
The impact of knowledge spillovers on new firms growth
55
Chapter 3 How investors evaluate firm entrepreneurial orientation?
Abstract The aim of this paper is to investigate the relationship between firm
performances after the IPO and their entrepreneurial orientation (EO). In
our work we want to test if more entrepreneurial oriented firms show
better market performances signalling that investors valuate it positively.
To this purpose, we focus on a particular sample of entrepreneurial firms,
i.e. companies that went public on the Alternative Investment Market
(AIM) through IPO during the period from 1995 to 2006. Along the lines of
Miller (1983), Covin and Slevin (1991) and Lunpkin and Dess (1996), firms’
entrepreneurial orientation is measured in terms of risk taking, innovation
and proactivity. Following the literature in management on investor
valuation we use the percent price premium as dependent variable of our
model. Our results confirm a positive impact of risk-taking and proactivity
on investors’ valuation.
JEL classification : D21, G3, M13
JEL keywords: Entrepreneurial Orientation, Firm Market Performance, IPOs, Top Management Team
Essays on Entrepreneurship and Firms Performances
56
3.1 Introduction
A wide body of literature has focused on the entrepreneur as the main
actor of the entrepreneurship phenomenon. In particular, many researches
have concentrated on the main attributes of the entrepreneur trying to
relate some traits of the individual with firm performance. More recently,
a branch of the literature has moved the attention on the entrepreneurial
behavior at the organizational level. A firm level model of
entrepreneurship seems to be more appropriate as entrepreneurial
effectiveness is arguably a firm-level phenomenon that involves the whole
organization and goes beyond the abilities of an individual. Following
studies such as Miller (1983), Covin and Slevin (1991) and Lumpkin and
Dess (1996), firms showing an entrepreneurial orientation are risk taking,
innovative and proactive. In this vein, the conceptual model developed to
account for the firm behaviour highlights how various combinations of
individual, organizational and environmental factors may affect firm
performance.
One of the main objective of literature on this topic has been the
understanding of the entrepreneurial orientation-performance
relationship. Covin and Slevin (1991) and Lumpkin and Dess (1996)
developed conceptual models to understand the relationship between
entrepreneurial orientation (EO) and firms performance. These models
indicate a variety of factors, such as external environment, organizational
structure, corporate culture and strategy, which may simultaneously affect
the entrepreneurial orientation-performance relationship.
Following the EO framework, scholars have attempted to give
empirical evidence to the EO effect on firm performance, mainly measured
in terms of sales growth (Wiklund 1999; Lumpkin and Dess 2001, Wiklund
and Shepard 2005, Walter et al. 2006, Covin et al. 2006, Keh et al. 2006) but
also as employment growth (Wiklund 1999, Walter et al. 2006, Wiklund

The impact of knowledge spillovers on new firms growth
57
and Shepard 2005) and firm profitability (Becherer and Murer 1997,
Lumpkin and Dess 2001, Walter et al. 2006, Wiklund and Shepard 2005,
Keh et al. 2006). However, literature has yet to consider the effects of EO
on market performances.
In our work we extend the literature investigating the relationship
between entrepreneurial orientation (EO) and firm market performance in
a peculiar entrepreneurial setting, i. e. an IPO on a secondary market. By
focusing on companies listed on the Alternative Investment Market (AIM),
in our work we want to test whether more entrepreneurial oriented firms
show better market performances signalling that investors valuate it
positively.
Our research may contribute to the literature in several ways. First,
although empirical evidence has shown that the relationship between an
EO and performance is not always positive but it varies for different types
of business, the general belief is that firms benefit from an entrepreneurial
behaviour. On the one hand, this may lead manager to act
entrepreneurially in order to increase firm performances. On the other
hand, investors may evaluate positively a firm showing an EO in the
expectation of high return. For this reason in this paper we want to verify
if investor give value to the EO of companies towards entrepreneurship in
the prospect of high returns.
Secondly, the literature has shown that the EO-performance
relationship is moderate by both external and internal factors. In
particular, many studies have postulated a strong EO-performance
relationship in hostile and technologically sophisticated environments
(Naman and Slevin 1993, Covin and Slevin 1998). Hence, a growing
interest has been devoted to companies operating in unique environments
such as small businesses (Wiklund 2005, Keh 2006) and university spin-off
(Walter et al. 2006). In this work we extend this stream of research by
focusing on IPO companies which therefore operate in a peculiar

Essays on Entrepreneurship and Firms Performances
58
environment, characterised by high level of uncertainty. Actually, a firm
undertaking an IPO and entering the arena of public offerings faces new
challenges and pressures, such as the acceptance and monitoring activities
from a new variety of stakeholders.
Moreover, our study may also contribute to the literature in enhancing
the approach to the measurement of the different dimensions involved in
the EO concept as we can rely on IPO prospectuses as a source of data. To
the purpose of operationalizing EO and test the conceptual framework of
entrepreneurial orientation, empirical researches have adopted mainly
three approaches: managerial perceptions, firm behaviours and resource
allocations (see Lyon et al. 2000 for an extensive review). The first
approach is the most widely used and requires interviews or surveys to
measure EO as management perceptions. The second approach, firm
behaviours, is focused on competitive behaviours of companies and
involves the content analysis of published news. The third approach
examines resource allocations to operationalize strategy concepts. The
main source of data is company’s financial statements. To our purposes
the latter approach seems to be the most appropriate. The idea to
operationalize strategy concepts looking at resource allocation can be
ascribed to Gale (1972) and Miller and Friesen (1978). This approach has
pros and cons. On the one hand, an advantage is that measures are
standardised and can be compared across time and firms. Furthermore
they are easy to confirm. On the other hand, a drawback can be that
resource allocation measures may not accurately reflect firm activities and
are not suitable for in-depth analysis on managerial practices and
strategies. However we can complement this data with information from
the IPO prospectus which, accordingly, is the primary source of data for
our study. It is an important document which gives detailed information
about the firm such as the operating history, firm products and ownership
The impact of knowledge spillovers on new firms growth
59
structure. Additionally, it includes biographical information regarding the
founder, CEO and the firm executive management.
The reminder of our paper proceeds as follows. In section two we
discuss the theoretical framework and hypothesis. The sample, measure
and the econometric model are then presented in the methodological
section. Section three describes the results of our analyses. Finally, in the
concluding section we discuss our interpretation regarding our findings.
3.2 Two different perspectives seeking for
reconciliation
In order to investigate the linkage between entrepreneurial orientation
and market performance for IPOs we combine two streams of literature.
On the one hand we apply the concept of EO developed in the area of
entrepreneurship and management. On the other hand we refer to the
literature on IPOs in the area of corporate governance and management.
In other words, we use entrepreneurial orientation as a framework for
examining the relationship between firm behaviour and market
performance within initial public offering firms.
Along the lines of the pioneering and widely cited works by Miller
(1983), Covin and Slevin (1991) and Lumpkin and Dess (1996),
entrepreneurial orientation refers to the processes as methods, practices,
behaviours and strategies managers adopt to act entrepreneurially.
Various dimensions have been used for characterising and describing
companies’ entrepreneurial orientation. Most of the works define firms
showing an entrepreneurial orientation as risk taking, innovative and
proactive. Risk taking consists of activities such as borrowing heavily,
committing a high percentage of resources to projects with high risks but
high returns and entering in unknown markets. Innovativeness refers to

Essays on Entrepreneurship and Firms Performances
60
attempts to embrace creativity, experimentation, novelty, technological
leadership, research and development in both products and processes.
Proactiveness relate to forward-looking, first-mover efforts to introduce
new products or projects in the market anticipating competitors. Other
two dimensions, used to describe EO but less recurrent in the literature,
are autonomy and aggressiveness. Autonomy refers to actions aiming at
establishing a new business while aggressiveness refers to attempts to
overtake rivals.
The works by Miller (1983), Covin and Slevin (1991) and Lunpkin and
Dess (1996) contributed to define the theoretical framework for linking
entrepreneurial orientation and firm performance. The prevailing and
ultimate reason in the topic of entrepreneurship is indeed the idea that
entrepreneurial activity stimulates economic performance of individual
firms and, as a consequence, general economic growth. In sum, firm
performance seems to be affected by i) organizational factors as size,
structure, strategy, strategy-making processes, firm resources, culture, and
top management team (TMT) characteristics; ii) environmental factors as
dynamism, munificence, complexity, industry characteristics, and
hostility; iii) entrepreneurial orientation as risk taking, innovativeness,
proactiveness, and, in some cases, autonomy and competitive
aggressiveness.
Actually, by analysing the literature on IPOs we observe similar
findings. First, scholars in this field have highlighted the role of
organizational factors as age, size, structure, firm resources, founder and
top management team characteristics in enhancing the market
performance of initial public offering companies. For example, Welbourne
and Andrews (1996) examine how human resource management decisions
at the moment of the IPO affect both short-term and long-term
performances. The authors found that human resources variables predict
both initial investor reaction and long-term survival. Certo et al. (2003)

The impact of knowledge spillovers on new firms growth
61
studied investors reactions to the CEO ownership of stock options and
equity. Their study was grounded in behavioural decision theory which
suggests that compensation may influence CEO propensity for taking risk.
The authors found that both stock and equity ownership interact to
influence the premiums that investors applied to the IPO firms. Lester et
al. (2006) examined the impact of prestigious top management teams
characteristics on investor valuation at the time of an IPO and found that
mainly the TMT educational level has a positive influence on IPOs market
performance. Second, IPO literature found how also environmental factors
as dynamism, munificence, complexity and industry characteristics
influence the valuations that investors apply to IPO companies. For
example, Lester et al. (2006) suggested the importance of an industry
structure on a firm performance. In particular, the authors found that
investors apply lower valuations to firms operating in industries with high
levels of dynamism and higher valuations to firms operating in industries
with high levels of complexity. Certo et al. (2003) found a positive
relationship between firms operating in high-tech industries and investor
valuation while Welbourne and Andrews (1996) found that investor value
positively companies in services sectors.
Despite the literature on entrepreneurial orientation found support for
a positive impact of EO on operating and financial performances,
literature on IPOs still has to consider the effects of EO on investor
valuation. For this reason in this work we claim that entrepreneurial
orientation should be taken in consideration in the analysis on IPO
performances and enter the model on investor valuation. Concerning the
individual dimensions of EO, previous works suggested that each can
have a universal positive influence on performance. Since the seminal
works by Shumpeter, innovative companies have been recognized as
highly competitive and thus shown high performances. Proactive
companies have first-mover advantages and thus are able to outperform
Essays on Entrepreneurship and Firms Performances
62
competitors. Although risk taking companies have more volatile results, it
has been shown that risky strategies are more profitable in the long run.
3.3 Methodology
3.3.1 Dataset and Sample
To the purpose of verify if firm entrepreneurial orientation may
influence investor valuations we focus on a particular sample of
entrepreneurial firms, i.e. companies listed on the AIM. A number of
different reasons make AIM’s companies interesting for our purposes.
Firstly, the firms listed on the AIM are formed around new business ideas.
Hence these firms are in the entrepreneurial phase, characterized by high
innovativeness, entrepreneurial creativity, and a high level of uncertainty.
Moreover, the AIM is a secondary market dedicated to young and
growing companies. They range from young, venture capital-backed start-
ups to young international companies looking to use a public market to
fund further expansion and raise their global profile. Thirdly, an Initial
Public Offering is one of the most notable entrepreneurial settings, being
characterized by a high degree of uncertainty. A firm undertaking an IPO
and entering the arena of public offerings faces new challenges and
pressures, such as the acceptance and monitoring activities from a new
variety of stakeholders. Finally, the AIM is the most successful growing
market in the world. Since its launch in 1995, over 2,500 companies have
joined AIM. Today, more than 1500 companies from any industry sector
are quoted on it. Hence, in literature there is a growing interest in this
market. For example, Kurshed et al. (2003) shows that the AIM is the first
market where operating performance is not found to be declining after the

The impact of knowledge spillovers on new firms growth
63
IPO. On the contrary, they find that the performance of firms on the
Official List deteriorates significantly after the issue.
Our main source of data is the EurIPO database which collects data on
3,000 operating companies that went public on the main European
markets (London, Euronext, Frankfurt and Milan) through IPO during the
period 1985-2006. We focus on the companies listed on the AIM from 1995
to 2006. Our IPO’s dataset combines public available information (e.g.,
year of establishment, industry sector, region), accounting data from
balance sheets (the main variables of consolidated financial statements in a
range -3, +3 years from the listing date) and data related to both the offer
and the ownership structure from IPO prospectuses (e.g., private equity
financing, risk factors, biographical information regarding the founder,
CEO, the firm’s board of directors and management).
The most of data were collected from IPO prospectuses. Companies
follow strict rules and guidelines in compiling a prospectus. For this
reason a repeatability of information is guaranteed and, thus, it is possible
to make comparison across time and across companies. Furthermore, the
document is first written by members of the management and then
certificated by lawyers and accountants. We thus can reasonably trust in
the validity and reliability of data collected.
3.3.2 Methodology
Specification of the econometric model
The relationship between entrepreneurial orientation and investor
valuation is investigated through the estimation of the following model:
Investor valuationi = β0 + β1 Risk Takingi + β2 Innovationi + β3
Proactivenessi + β4 Controli + εi (3.1)

Essays on Entrepreneurship and Firms Performances
64
Where Risk Takingi , Innovationi and Proactivenessi are vectors of
variables describing the three dimensions of the entrepreneurial
orientation as highlighted in the theoretical framework while Controli is a
vector of control variables.
Dependent variable
In order to consider the effects of EO on market performances, we refer
to the literature in management on investor valuation (Welbourne and
Andrews 1996, Rasheed et al. 1997, Certo et al. 2003, Lester et al. 2006) and
use the percent price premium as dependent variable of our model. As
suggested by Welbourne and Andrews (1996) the absolute stock price at
the time of the IPO is misleading since it fails to account for the worth of
firm assets. As an alternative, price premium, which is the amount of the
stock price considered beyond the book value, allows to control for assets
and, thus, provides a more robust estimate of investor perceived future
value. We calculated percent price premium as stock price less book value
over stock price, where the stock price equals the offer price at the time of
the IPO, and book value is the book value of the firm’s equity as reported
in the prospectus. The offer price is the price paid by institutional
investors and determines the capital a firm raises in its IPO. As a
consequence, investors tend to reward encouraging prospects with higher
premiums. To control for underpricing an alternative measure for stock
price is the closing stock price on the first day of trading.
Explanatory variables
As far as independent variables are concerned, we grouped the
measures of EO in three categories: risk taking, innovativeness and
proactiveness.
The impact of knowledge spillovers on new firms growth
65
Firstly, the risk-related variables are Risk Factors, Profit and Business-
risk. A prospective investor should be aware of the risks of investing in a
company and should make the decision to invest only after careful
consideration. For this reason, companies are required to mention the
factors of risk for the business in the IPO prospectuses. Some examples of
risk factors listed in IPO prospectuses include issues related to
technological change, retention of key personnel, protection of intellectual
property rights and demand volatility. Following previous researches we
use the number of Risk Factors reported in the IPO prospectus as a proxy
for the business risk level as perceived by investors (Beatty and Zajac 1994,
Welbourn and Endrews 1996, Certo et al. 2001, Lester et al. 2006). The
second risk-related variable included in the model is profit per share
before the IPO. Many listing companies report losses, in most of the cases
due to their short operating history. As a consequence, a high variance in
performances and uncertainty characterise AIM firms. We thus assume
that the lower is the profit per share (or loss per share) the higher is the
firm’s risk position. As such, Profit could affect investor perceived firm’s
value. We also include in our model Business-risk as an additional variable.
As reported in previous studies, measures of propensity for risk taking
include an indicator of business risk, such as the standard deviation of a
firm’s return on assets over time (Oviatt and Bauerschmidt 1991, Miller
and Leiblein 1996, Lyon et al. 2000).
Secondly, we introduce in our model an innovation-related variable to
investigate the influence of innovation activity on investor valuation.
Actually, innovation is a signal for a firm’s strategic competitive value and
investors may valuate positively firms’ innovation efforts in the
expectation of high returns. In our model we, thus, use a measure of
innovation output, IPR, which represent the number of intellectual
property rights held by the company. Although some companies do not
disclose this information, we gather data on IPR from the prospectus. We

Essays on Entrepreneurship and Firms Performances
66
thus assume that investors can valuate the innovation propensity of a
company only in the case of disclosure in the IPO prospectus. Graduated
refers to the number of members of the board of directors with a post-
graduated degree. This is a proxy for innovation input.
As far as proactiveness is concerned, we explore the role of Top
Management Team (TMT) characteristics and capabilities and try to find if
they have some impacts on investors’ valuation. Essentially, the literature
on EO shows how firms’ proactiveness can be measured in terms of TMT’s
risk-taking proclivity, decision making style and competitive posture.
Firstly, the variable Past Exp measures the involvement of the TMT
members in other boards of directors in the same position. It is a proxy for
proactivity as it measures whether the members are serial entrepreneurs,
CEOs or directors. As measures of TMT’s risk posture we, secondly,
include the variables Board Equity in our model, accounting for the share
of equity owned by the board of directors. Furthermore, we add a dummy
variable, CEO share, taking value 1 if the CEO is also a shareholder. As
previous researches suggest (Mehran, et al., 1999; Sanders, 2001; Certo et
al., 2003), the CEO equity level may influence CEOs’ risk-taking
behaviour. Consistently with the agency theory (Jensen and Meckling,
1976), high levels of board of directors’ ownership align the interests of
TMTs and shareholder. Thus TMTs have an incentive to diminish the risk
exposure of the company which is, in turn, associated with their portfolio
risk level. We suggest that IPO investors are likely to take into
consideration the risk properties of directors’ equity. Secondly, CEO
founder is considered as an additional variable for measuring executives’
proactive behaviour. Investors can evaluate positively the fact that CEO is
also the firm founder, as this gives a signal of executives risk proclivity.

The impact of knowledge spillovers on new firms growth
67
Control variables
We further include a set of control variables which may have an
impact on investors’ valuation. Sales Growth controls for firms
performances. Firm size is measured as the logarithm of Total Assets. Firm
Age is measured as one plus the age of the firm at the moment of the IPO
in logarithmic scale. By Venture Capitalist we identify those IPOs which
rely on venture capital investments (Lester et al., 2006); it is a dummy
variable which takes value 1 if venture capitalists were in the ownership
structure of the firm at the moment of the IPO, 0 otherwise. Insiders
represents the proportion of executive members on the board of directors
affecting market valuations in term of advising and monitor activities
(Gompers 1995, Certo et al. 2001). Following the primary 1-digit standard
industrial classification (SIC) code for the IPOs analysed, nine industry
dummies were included in the model to control for industry-specific
factors, as industry cycles and trends, that may influence the rate of
growth of individual firms.
In Table 3.1 the basic features of independent variables of the model
are summarized.
Descriptive statistics for the sample are provided in Table 3.2. Data in
panel a) (Independent and Control Variables) summarize the results for
both the independent and control variables. Panel b) (Industry) reports the
industry classification referring to the 1-digit SIC Classification. The
Services companies (e.g., hotels, business services, health, legal and social
services) are highly represented in our sample (52.73%). Manufacturing
cover more than 20% of the sample while each of the other economic
groups gathers about less than 10% of the IPOs.

Essays on Entrepreneurship and Firms Performances
68
Table 3.1 - Variables Typology and Their Measurement Methods
Independent and Control Variables
Variable Class Variable Name
Description
Risk Factors Number of Risk factors as reported in the prospectus
Risk taking Profit Average earnings per share in the pre-IPO period of time
Business-risk Standard deviation of a firm’s return on assets over time
Innovation IPR Number of intellectual property rights held by the company at the IPO
Graduated Dummy
Past experiences Dummy
Board Equity Share of equity owned by the board of directors in the post-IPO
Proactivity CEO Share Dummy variable taking value 1 if the CEO is also a shareholder
CEO Founder Dummy variable taking value 1 if CEO is also the firm founder
Sales Growth Average sales growth rate before the IPO
Total Assets Logarithm of total assets at the moment of the IPO
Control Age Logarithm of one plus the age of the firm at the moment of the IPO
VC Venture-backed IPOs
Insiders Proportion of executive members on the board of directors at the IPO
Industry Set of Industry dummies
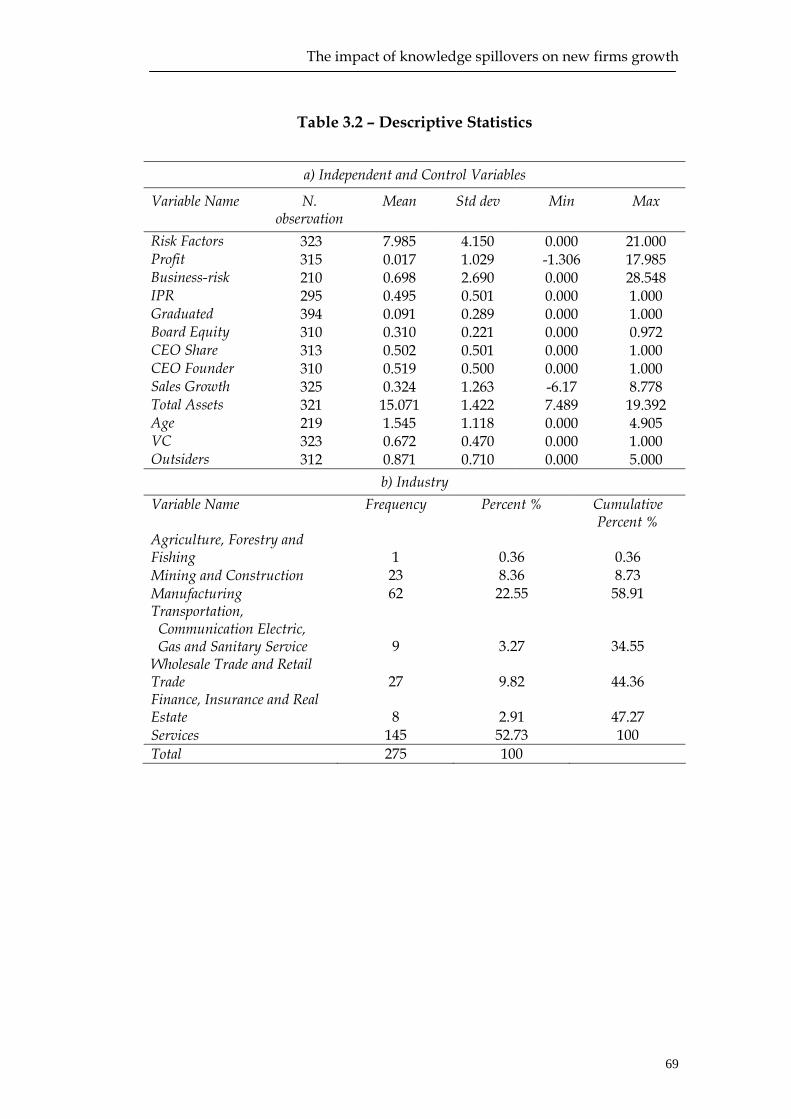
The impact of knowledge spillovers on new firms growth
69
Table 3.2 – Descriptive Statistics
a) Independent and Control Variables
Variable Name N. observation
Mean Std dev Min Max
Risk Factors 323 7.985 4.150 0.000 21.000 Profit 315 0.017 1.029 -1.306 17.985 Business-risk 210 0.698 2.690 0.000 28.548 IPR 295 0.495 0.501 0.000 1.000 Graduated 394 0.091 0.289 0.000 1.000 Board Equity 310 0.310 0.221 0.000 0.972 CEO Share 313 0.502 0.501 0.000 1.000 CEO Founder 310 0.519 0.500 0.000 1.000 Sales Growth 325 0.324 1.263 -6.17 8.778 Total Assets 321 15.071 1.422 7.489 19.392 Age 219 1.545 1.118 0.000 4.905 VC 323 0.672 0.470 0.000 1.000 Outsiders 312 0.871 0.710 0.000 5.000
b) Industry Variable Name Frequency Percent % Cumulative
Percent % Agriculture, Forestry and Fishing 1 0.36 0.36 Mining and Construction 23 8.36 8.73 Manufacturing 62 22.55 58.91 Transportation, Communication Electric, Gas and Sanitary Service 9 3.27 34.55
Wholesale Trade and Retail Trade 27 9.82 44.36 Finance, Insurance and Real Estate 8 2.91 47.27 Services 145 52.73 100 Total 275 100

Essays on Entrepreneurship and Firms Performances
70
3.4 Results
Table 3.3 reports the correlation matrix of the variables, showing that
some correlations should be taken into account in the interpretation of the
results. Particularly, Business-risk and Profit show a correlation index equal
to -0.34. Also Age and Risk Factors, CEO Founder and CEO Share also turned
out to be correlated (-0.38 and 0.4 respectively). However, we also checked
for variable dependence by examining the variance inflation factor (VIF).
The VIF for of our regression equation is found to be 1.91, below the
guideline of ten, suggesting that multicollinearity does not affect the
analytical model (Chatterjee and Price 1991). The results of the
econometric estimation are presented in Table 3.4.
In relation to risk-taking variables, as a first result we find a positive
and significant (p<0.05) relationship between Risk Factors and investor
valuation (IV). Furthermore, Profit proved to be significantly (p<0.01) and
negatively related to IV. This means that companies showing a high risk
exposure at the time of the IPO receive a higher valuation by investors
than those which are considered less riskier. In other words, the higher the
number of risk factors reported in the prospectus and the lower the profit
of the company the higher the level of risk and, as our regression results
suggest, the higher the investor valuation.
For what concerns proactivity-related variables, the CEO Share is a
negative and statistically significant variable (p<0.05). This result is
consistent with the Risk-taking variables’ finding. The shareholder status of
a CEO may give him an incentive to diminish the risk exposure of the
company which is, in turn, associated with his portfolio risk level.
Investors may valuate negatively the threat of a decrease in CEO risk-
taking proclivity. Finally, Innovation, as proxied by the number of
intellectual property rights (IPR), is not related to investor valuations in
our model.

The impact of knowledge spillovers on new firms growth
71
Table 3. 3 – Correlation Matrix
1 2
3 4
5 6
7 8
9 10
11
12
13
14
15
1
IV
1
2
Risk
Fac
tors
0.
19
1.00
3 Pr
ofit
-0.2
7 -0
.16
1.00
4
Busin
ess-
risk
0.07
0.
12
-0.3
4 1.
00
5
IPR
0.05
0.
14
-0.0
6 -0
.01
1.00
6
Gra
duat
ed
0.01
0.
18
-0.0
2 0.
10
0.04
1.
00
7
Past
exp
0.01
0.
11
-0.1
0 0.
00
0.00
0.
05
1.00
8
Boar
d Eq
uity
0.
04
0.12
0.
02
0.03
0.
09
-0.0
8 0.
02
1.00
9 CE
O S
hare
-0
.12
-0.0
9 0.
16
-0.1
0 -0
.08
-0.1
4 -0
.07
-0.0
9 1.
00
10
CEO
Fou
nder
-0
.06
0.06
0.
06
-0.0
3 -0
.02
0.00
-0
.07
-0.0
4 0.
40
1.00
11
Sales
Gro
wth
0.
02
0.02
-0
.07
-0.0
3 -0
.04
0.04
0.
06
0.01
-0
.07
0.06
1.
00
12
Tota
l Ass
ets
-0.2
3 -0
.01
0.19
-0
.35
-0.0
6 -0
.02
0.03
0.
04
-0.1
3 -0
.10
-0.0
1 1.
00
13
A
ge
-0.1
9 -0
.38
0.12
-0
.03
-0.1
0 -0
.07
-0.1
2 -0
.04
0.03
-0
.16
-0.0
2 0.
08
1.00
14
In
sider
s -0
.02
0.19
-0
.22
0.00
-0
.12
0.11
0.
01
-0.0
5 -0
.19
-0.1
1 -0
.19
0.12
-0
.03
1.00
15
VC
0.10
0.
06
-0.0
8 -0
.12
0.21
-0
.06
0.07
-0
.10
-0.0
6 0.
01
0.07
0.
16
-0.0
9 0.
06
1.00

Essays on Entrepreneurship and Firms Performances
72
Table 3.4 - Results of OLS Regression
Statistical significance at 1%, 5%, and 10% as ***, **and * respectively. z statistics between parentheses. Dependent variable = Investor Valuation (IV)
Variable Class Variable Name Estimations
Constant 1.399 *** 1.673 ***
Risk Factors 0.010 **
Risk taking Profit -0.446 ***
Business-risk -0.007
Innovation IPR -0.028
Graduated -0.025
Past experiences -0.021
Board Equity 0.011
Proactivity CEO Share -0.082 **
CEO Founder -0.018
Sales Growth -0.005 -0.026
Total Assets -0.069 *** -0.045 ***
Age -0.017 ** -0.028
Control VC 0.018 ** -0.049
Outsiders 0.004 0.038
Industry Yes
F-test 2.65 *** 2.35 ***
R2 0.11 0.23
Adj-R2 0.07 0.13

The impact of knowledge spillovers on new firms growth
73
As far as the control variables are concerned, the variable Total Assets ,
which is a proxy for firm size, is negatively and significantly (p<0.01)
related to investors valuation. Investors expect companies use the capital
raised at the listing to realize new investments and, thus, increase total
assets. This means that investors give more value to larger companies than
their counterpart. We interpret this result in the light of the life cycle
theory. According to this theory, firms’ growth path is supposed to follow
an S-shaped curve, hence showing an exponential path followed by a
logarithmic one. As the AIM is a market dedicated to small firms in the
early stages of their growth, at the moment of the IPO firms in our sample
are in the first part of the curve, thus characterized by exponential growth
rates. In subsequent periods, firms which were in the birth phase continue
to follow the exponential part of the curve and, thus, increase their rate of
growth. In sum, it seems that investors expect an increase in the size
expressed by Total Assets of larger companies in our sample in the
expectation of fast rates of growth and, in turn, of firms’ value. This leads
to a temporary diminishing in firms’ profitability directly affected by the
IPO.
3.5 Concluding Remarks
In this work the determinants of business performance are inferred
from a broad range of variables. Following the EO framework, we
investigated the relationship between entrepreneurial orientation (EO)
and firm market performance, measured in terms of percent price
premium. To this purpose, we focused on an IPO sample of companies
listed on the Alternative Investment Market (AIM). Our results confirm a
positive impact of risk-taking and proactivity on investors’ valuation.
More precisely, a higher risk position of companies, proxied by both
number of risk factors and profitability, proved to influence the price

Essays on Entrepreneurship and Firms Performances
74
premium paid by investors in the prospect of high returns. Furthermore,
CEO risk-taking proclivity seems to have an impact on investor valuation.
In particular, CEO equity ownership is negatively related to firm
performance, as the prospect of risk-reducing firm strategies have a
negative impact on the valuation of investors.
To conclude, we believe that further researches could extend the
results of our analysis. The variables we used to explain firms’ market
performances are just a selection on the wider set of possible independent
variables, which may be found in the literature. In this direction in future
researches we will introduce further information related to the three
dimensions of entrepreneurial orientation, in order to increase the set of
explanatory variables and improve the model.

The impact of knowledge spillovers on new firms growth
75
References
Beatty, R. P., and E. J. Zajac (1994), Managerial Incentives, Monitoring, and Risk Bearing: A Study of Executive Compensation, Ownership, and Board Structure in Initial Public Offerings, Administrative Science Quarterly , 39, 313–335.
Becherer, R.C., and Maurer, J.G. (1997), The moderating effect of environmental variables on the entrepreneurial and marketing orientation of entrepreneur-led firms, Entrepreneurship Theory and Practice, 22, 47–58.
Certo, S. T., J. G. Covin, C. M. Daily, and D. R. Dalton (2001), Wealth and the Effects of Founder anagement Among IPO-Stage New Ventures, Strategic Management Journal , 22, 641-58.
Certo, S. T., C. M. Daily, A. A. Cannella, and D. R. Dalton (2003),Giving Money to Get Money: How CEO Stock Options and CEO Equity Enhance IPO Valuations, Academy of Management Journal , 46, 643–664.
Chatterjee, S., and B. Price (1991), Regression Analysis By Example, 2nd ed. New York: Wiley.
Covin, J. G., Slevin, D. P. (1991), A conceptual model of entrepreneurship as firm behaviour, Entrepreneurship Theory and Practice , 16, 7-25.
Covin, J.G., Slevin, D.P. (1998), Adherence to plans, risk taking, and environment as predictors of firm growth, Journal of High Technology Management Research, 9 (2), 207– 237.
Covin, J.G., Green KM, Slevin, D.P., Covin (2006), Strategic Process Effects on the Entrepreneurial Orientation–Sales Growth Rate Relationship, Entrepreneurship Theory and Practice , 30, 57-81.
Gale, B. (1972), Market share and rate of return, The Review of Economics and Statistics, 54, 412–423.
Gompers P. A. (1995), Optimal investment, monitoring, and the staging of venture capital, The Journal of Finance, 50, 1461–1489.
Jensen, M. C., and Meckling, W. H. (1976), Theory of the firm: Managerial behavior, agency costs and ownership structure, Journal of Financial Economics, 3, 305–360.

Essays on Entrepreneurship and Firms Performances
76
Keh Hean Tat Keh, Thi Tuyet Mai Nguyen, Hwei Ping Ng (2007), The effects of entrepreneurial orientation and marketing information on the performance of SMEs, Journal of Business Venturing, 22 (4), 592-611.
Khurshed, A., S. Paleari and S. Vismara (2003), The Operating Performance of Initial Public Offerings:The UK Experience, paper presented at the Australasian Banking and Finance Conference.
Lester, R.H., S.T. Certo, C.M. Dalton, D.R. Dalton and A.A. Cannella, Jr, (2006), Initial Public Offering investor valuations: an examination of top management team prestige and environmental uncertainty, Journal of Small Business Management, 44, 1-26.
Lyon Douglas W. Lyon, G. T. Lumpkin and Gregory G. Dess, (2000), Enhancing Entrepreneurial Orientation Research: Operationalizing and Measuring a Key Strategic Decision Making Process, Journal of Management, 26, 1055-1085.
Lumpkin, G.T., G.G. Dess (1996), Clarifying the Entrepreneurial Orientation Construct and Linking it to Performance, Academy of Management Review, 21, 135-72.
Lumpkin, G.T. Dess, G.G. (2001), Linking two dimensions of entrepreneurial orientation to firm performance: The moderating role of environment and industry life cycle, Journal of Business Venturing, 16, 429–451.
Mehran, H., Taggart, R. A., Yermack, D. (1999), CEO ownership, leasing, and debt financing, Financial Management, 28(2), 5–14.
Miller, D., 1983. The correlates of entrepreneurship in three types of firms, Management Science, 29, 770– 791.
Miller, D., Friesen, P.H. (1978), Archetypes of strategy formulation, Management Science, 24 (9), 921– 933.
Miller, K.D., & Leiblein, M.J. (1996), Corporate risk-return relations: Returns variability versus downside risk, Academy of Management Journal, 39, 91–122.
Naman, J.L., Slevin, D.P., (1993), Entrepreneurship and the concept of fit: a model and empirical tests, Strategic Management Journal, 14 (2), 137–153.
The impact of knowledge spillovers on new firms growth
77
Oviatt, B.M., & Bauerschmidt, A.D. (1991), Business risk and return: A test of simultaneous relationships, Management Science, 37, 1405–1423.
Rasheed A., M A Rasheed, D. K Datta; R. R. Chinta. (1997), Determinants of price premiums: A study of initial public offerings in the medical diagnostics and devices industry, Journal of Small Business Management, 35, 11-23-;
Sanders, W. G. (2001), Behavioral responses of CEOs to stock ownership and stock option pay, Academy of Management Journal, 44, 477–492.
Walter A., M. Auerb and Ritter T. (2006), The impact of network capabilities and entrepreneurial orientation on university spin-off performance, Journal of Business Venturing, 21 , 541– 567
Welbourne, T. M., and A. O. Andrews (1996), Predicting the Performance of Initial Public Offerings: Should Human Resource Management Be in the Equation?, Academy of Management Journal, 39, 891–919.
Wiklund, J. (1999), The sustainability of the entrepreneurial orientation–performance relationship, Entrepreneurship Theory and Practice, 24, 37–48.
Wiklund, J. and Shepherd, D. (2005), Entrepreneurial orientation and small business performance: A configurational approach, Journal of Business Venturing, 20, 71–91.

Essays on Entrepreneurship and Firms Performances
78

The impact of knowledge spillovers on new firms growth
79
Chapter 4 The impact of knowledge spillovers on new firms growth
Abstract The paper investigates the effects of external sources of knowledge on firm
growth. In line with the knowledge spillovers literature, we focus on the
relationship between firms and universities, considered as a crucial source
of knowledge. To this purpose, we apply the Gibrat’s Law of
Proportionate Effects model on a sample of UK public companies in the
period 1995 to 2006. Our findings confirm that both universities
knowledge input and output are important determinants of the growth of
entrepreneurial firms.
JEL classification : M13, L26, O12, R30
Keywords: Firm growth, Knowledge Spillovers, Initial Public Offering,
Gibrat’s Law

Essays on Entrepreneurship and Firms Performances
80
4.1 Introduction
A wide body of literature has focused on the determinants of the
evolutionary process behind firm growth. In particular a growing interest
has been devoted to the understanding of the determinants of firms’
differential rate of growth.
Empirical works have concentrated mainly the attention on traditional
determinants of firm growth, principally firm-specific characteristics such
as age, size, legal form and innovation, and have demonstrated that small,
young and independent businesses grow at fastest rate (Mansfield 1962,
Storey 1994, Audretsch 1995, Sutton 1997, Caves 1998, Almus and
Nerlinger 1999). Besides, a growing interest in the literature has been
devoted to an additional variable, i.e. location as critical factor shaping
firm performance. Storey (1994) argues that some regions are more
conducive to firm growth being characterised by high resources and wide
market opportunities. The work by Davidsson (1989) suggests that
location is an important factor for industry clustering while Davidsson et
al. (2002) highlight how change in geographical location seems to exert a
positive effect on business rate of growth.
In spite of the interest on the link between location and firm growth,
the literature has paid less attention to the identification of the region-
specific characteristics that may play a relevant role in determining the
growth of firms. More recently, a few contributions emphasize how
university-based knowledge spillovers influence firm performances
(Audretsch and Lehmann 2005a, 2006, Colombo et al. 2006).
In our work we extend the literature on this topic, investigating the
connection between external sources of research, in particular universities,
and individual firm growth by focusing on UK public companies listed on
the London Stock Exchange (LSE) on both the Official List (OL) and the
Alternative Investment Market (AIM). By comparing companies listed on

The impact of knowledge spillovers on new firms growth
81
the two markets, in our work we try to highlight the impact of knowledge
produced by universities on the post-issue rate of growth of such a firms.
We compare two samples of companies for a specific reason. While
companies on the Official List cover all the life cycle phases and all the
industry sectors, the AIM is the secondary market dedicated to young and
growing companies formed around new business ideas. These firms are in
the entrepreneurial phase, characterized by high innovativeness and
entrepreneurial creativity, and also by a high level of uncertainty. The
literature highlights that small and young enterprises are subject to ‘credit
rationing’ and thus have major difficulty in developing internal research.
For this reason, these companies rely mainly on external sources of R&D
in order to sustain their innovation activities. We thus expect a greater
impact of university research spending and knowledge spillovers on the
growth rates of AIM’s companies in comparison with companies listed on
the Official List.
The reminder of our paper proceeds as follows. In section II we discuss
the theoretical framework on the role of external sources of knowledge
and highlight the expected impact on firms’ rate of growth. The sample,
measure and the econometric model are presented in the methodological
section. Section IV describes the results of our analyses. Finally, in the
concluding section we discuss our findings, also highlighting suggestions
for further researches.
4.2 Knowledge spillovers and firms growth
The premise behind our study is that the proactive role of the three
local actors, specifically financial institutions, universities and firms, may
influence businesses performance. The stream of literature on
entrepreneurship and growth emphasizes the link between

Essays on Entrepreneurship and Firms Performances
82
entrepreneurial dynamics and economic growth taking into account
different units of analysis: firms, industries and regions. In the research
area of regional science, concepts like Regional Innovation Systems (RIS)
(Freeman 1987, 1991, Lundvall 1992, Nelson 1993) and Triple Helix (TH)
(Etzkowitz and Leydesdorff 1997, 2000) emphasize the active role of
territorial actors within regional development dynamics and give
relevance to the institutional foundations of regions’ competitive
advantage, for example in the areas of education, research and
development and financial services. Since Marshall and until the end of
the Nineties, the model of local development has always been bi-polar,
built upon two fundamental components of change, firms and local
institutions. More recently, Etzkowitz and Leydesdorff (1997, 2000) have
highlighted the active presence of an additional variable in the scenario,
i.e. the university. These conceptual models develop a framework able to
account for the existence of a new configuration of the interactions among
different institutional forces (firms, local institutions and universities),
which appear involved in a ‘spiral’ of relations. Within these models the
social interaction between different actors aims at the production,
diffusion and application of new and economically useful knowledge.
We thus argue that the local environment may directly impact and
facilitate the generation of those factors determining firms’ growth, in
particular through institutional organizations such as universities. The
habitat in which firms operate exherts a direct influence on their activity
and hence economic development. In sum, institutions provide a
framework that guides business activity, lowers uncertainty and facilitates
the coordination of knowledge and intangible assets. In this work we
mainly focus on one of the local institutional actors, the university, in
order to test whether it influences firms’ growth.
There is an ongoing debate on the role of universities in fostering
business creation and economic growth. The debate on the economics of

The impact of knowledge spillovers on new firms growth
83
knowledge has evolved through different steps based on the different
characteristics assigned to knowledge through time (see Antonelli 2005).
Following the different phases in the debate, firms and local institutions,
in particular universities and research centres, are assumed to play
evolving role. Based on the works by Arrow (1962) and Nelson (1959),
knowledge has firstly been regarded as a public good. The basic idea
behind this assumption is that knowledge is a public good, thus, it may
spill over, primarily from universities, and it is freely available to firms.
Subsequently, knowledge has been considered as a proprietary good
(Nelson and Winter 1982). This concept emphasizes knowledge features
such as appropriability and exclusivity. In this view, the firm is regarded
as the privileged locus where knowledge is created and accumulated. In
turn, universities and public research centres are solicited to protect their
research output in order to secure appropriability. Finally, the literature
has shifted towards the concept of knowledge as a collective process. This
approach centres the attention on external knowledge, generated by
interactions among the diverse economic agents (Griliches 1992, David
1993, Cooke 2002). In this line of thought, the firm is regarded as a
changing and creative agent, searching for knowledge in the local
environment. Interrelation among firms, universities and research centres
are now considered vital for the generation, dissemination and absorption
of new knowledge. Knowledge can indeed be transferred and
disseminated among different actors in the economic system. According to
this idea, universities have the incentive to disclose the results of their
research activities and as a consequence they are crucial sources of
external knowledge to firms. The spillovers of knowledge generate
positive externalities to firms by stimulating innovation activities and
productivity.
The literature on this topic has mainly focused on two different levels
of analysis. First, several works have studied the impact of knowledge

Essays on Entrepreneurship and Firms Performances
84
spillovers on innovation and economic growth at regional level. Secondly,
a number of analysis have focused on the relationship between knowledge
spillovers and the innovative output at firm level of analysis. Compelling
evidence was provided suggesting that investments in new knowledge
affect both the knowledge spillovers generation (Jaffe, 1989; Audretsch
and Feldman, 1996) and the creation of new businesses. Several studies
also highlighted a significant positive correlation between firms’
concentration and university location (Varga 2000, Audretsch et al. 2004,
Audretsch and Lehmann 2005b). For example, Audretsch and Lehmann
(2005b), in a study on German public companies and universities,
highlight how the number of young and high-tech firms located around
universities depends on the knowledge capacity and the knowledge
output of the region. This is consistent with previous researches (Jaffe
1989, Audretsch and Feldman 1996, Audretsch and Stephan 1996) which
show that knowledge spillovers are geographically bounded. In
particular, Audretsch and Stephan (1996) also find that geographic
proximity is a prerequisite to absorptive capacity, i.e. the ability of a firm
to evaluate and utilize outside knowledge. If we turn our attention on
analysis at firm level, great attention has been paid to the influence of
spillovers on productivity (Mairesse and Sassenou 1991, Hall and
Mairesse 1995, Mairesse and Hall 1996, Chen and Chih-Hai 2005).
Although there exist an extensive literature on the positive effects of
knowledge spillovers, there is less evidence on the impact of university
spillovers on firms growth. In particular, Audretsch and Lehmann (2005a)
in their study on 281 German public companies suggests that both firm-
specific and knowledge spillovers influence firm growth. Similarly,
Colombo et al. (2006) analyse empirically the impact of university-based
knowledge spillovers on the growth of Italian new technology-based
firms. The authors find that knowledge spillovers foster the growth of a
peculiar sub-sample of new high-tech ventures, i.e. academic start-ups. In

The impact of knowledge spillovers on new firms growth
85
this paper we test whether firm growth is shaped by spillovers of
knowledge by universities for a sample of UK IPOs.
In the literature, different mechanisms have been proposed as
conducive to knowledge spillovers. First, knowledge from universities
flows in the economic system and generates new market opportunities for
companies. This is in accordance with the Knowledge Spillover Theory of
Entrepreneurship by Audretsch (1995). This theory states that the spillover
of knowledge from its producing entity such as universities involves the
creation of a new firm. Indeed, new entrepreneurial opportunities are
generated by new knowledge left uncommercialized by both research
centres as universities and the incumbent companies. As a consequence,
new firms are created in a process involving the spillover of knowledge.
We assume that a similar process influences firm performance, in
particular firm growth in early stages of development, as the access to
knowledge in the periods subsequent firm formation still gives a
competitive advantage to the company. Following these arguments, we
expect that the access to knowledge generated by universities may affect
firm propensity to create new economic opportunities, introduce new
ideas in the market and, in turn, grow at a fast rate.
The second mechanism for the transmission of knowledge spillovers is
based on the distinction between codified and tacit knowledge. On the one
hand, knowledge is transferred among firms and universities through
knowledge codified in journal publications and seminars. On the other
hand, tacit knowledge spills over in oral conversations and face-to-face
communication. Indeed, spatial proximity seems to be a prerequisite for
the diffusion of this sort of knowledge. As highlighted by Audretsch and
Lehmann (2006), it is possible to distinguish also different types of
research according to the different kinds of knowledge they are based on.
While research in natural sciences largely draws on codified knowledge,
social sciences are more tacit in nature. Thus, we expect a greater influence
Essays on Entrepreneurship and Firms Performances
86
of research in the fields of social sciences on the rate of growth of
companies located in the same area where this research is accomplished.
Finally, mobility of human capital is another mechanism for
transferring knowledge. The availability of a higher number of skilled and
highly educated resources stemming from universities has a positive effect
on knowledge transfer (Powers 2003, O’Shea et al. 2005, Audretsch and
Lehmann 2006). We, thus, expect that knowledge embedded in young
students and new graduated is likely to foster knowledge transfer and, in
turn, firms growth.
4.3 Methodology Design
4.3.1 Dataset and Sample
To the purpose of verify if the access to knowledge from universities
may influence firm growth, we focus on a particular sample of firms,
companies listed on the London Stock Exchange, comparing the
Alternative Investment Market and the Official List.
Our main source of data is the EurIPO, an original database which
collects data on 3,000 operating companies that went public on the main
European markets (London, Euronext, Frankfurt and Milan) through IPO
during the period 1985-2006. We focus on the companies listed on the AIM
and Official List from 1995 to 2006. Our IPO’s dataset combines public
available information (e.g., year of establishment, industry sector, region),
accounting data from balance sheets (the main variables of consolidated
financial statements in a range -3, +3 years from the listing date) and data
related to both the offer and the ownership structure from IPO
prospectuses (e.g., private equity financing, risk factors, biographical
information regarding the founder, CEO, the firm’s board of directors and
management).

The impact of knowledge spillovers on new firms growth
87
In order to analyze the influence of universities on firm growth, we
pooled the dataset by adding also information on UK regions trying to
capture the local features in terms of university quality and new business
formation and growth. In our dataset, regional boundary are defined
referring to the Nomenclature of Units for Territorial Statistics (NUTS), a
hierarchical classification of spatial units that provides a breakdown of the
European Union’s territory for producing regional statistics which are
comparable across the Union. In particular, we used the NUTS level 2
corresponding to individual counties or groups of counties, London
boroughs, metropolitan districts and unitary authorities for England,
groups of unitary authorities for Wales, groups of whole or part of unitary
authorities and/or local enterprise company areas for Scotland and
counties for Northern Ireland. Following this classification 37 different UK
areas are identified.
As far as university-specific variables are concerned, we added
information on grants and research funding available to 116 UK higher
education institutions from the HEFCE (Higher Education Funding
Council for England) according to the periodic Research Assessment
Exercise (RAE). We also collected data on students provided by the
Higher Education Statistics Agency Limited. Finally, the numbers of
articles published both in natural and social science were hand-collected
from the research database Web of Science realised by ISI (Information
Sciences Institute).
Our sample consists of 200 companies listed on the AIM and 200
companies listed on the Official List. Figure 4.1.a displays the distribution
of sample companies across the 37 NUTS2 regions. The map shows a high
concentration of firms in the south east, mainly in the area of Inner
London, but also in Outer London, Berkshire, Buckinghamshire and
Surrey, East and West Sussex. The distribution of companies per
thousands inhabitants reveals similar results (see Figure 4.1.b). Sample

Essays on Entrepreneurship and Firms Performances
88
companies are still mainly concentrated in a few key regions of south east,
i.e. Inner London, Berkshire, Buckinghamshire, Bedfordshire and
Hertfordshire, Surrey, East and West Sussex.
Table 4.1 compares the groups of IPOs by age, size and industry. Data
in panel a) (Age and Size) confirm that on average companies going public
on the AIM are younger and smaller than companies listed on the Official
List. AIM companies are 8 years old in mean while sample companies
from the Official List are 18 years old on average. As far as the size is
concerned, AIM’s firms with about 12 millions of sterling on average are
included in the SME segment according to the definition of the European
Commission3. On the contrary, companies on the Official List, showing an
average turnover of 162 millions of sterling, are included in the Large
segment. Panel b) (Industry) reports the industry classification referring to
the 1-digit SIC Classification. The Services companies (e.g., hotels,
business services, health, legal and social services) are highly represented
in our sample: 46% on the AIM vs. 41% on the OL. Manufacturing and
Wholesale and Retail Trade cover respectively about 24% and 13% for the
AIM’s companies and 28% and 14% for OL’s companies, while each of the
other economic groups gathers about 10% or less of the IPOs.
3 Commission Recommendation 2003/361/EC of 6 May 2003 regarding the SME definition, which replaced Recommendation 96/280/EC as from 1 January 2005.

The impact of knowledge spillovers on new firms growth
89
Figure 4.1 - Distribution of sample firms
Figure 4.2 - Distribution of firms per thousands inhabitants
a) Distribution of sample firms

Essays on Entrepreneurship and Firms Performances
90
Table 4.1 - Descriptive statistics at IPO
a) Age and Size
AIM Official List
Variable Name N. Firms Mean Std. Dev. N. Firms Mean Std. Dev.
Firm Age (years) 200 8 8 200 18 32
Sales (millions £) 200 12.2 38.5 200 162.0 490.0
b) Industry
AIM Official List
Variable Name Frequency Percent % Frequency Percent %
Agriculture, Forestry and Fishing
Mining and Construction
Manufacturing
Transportation, Communication,
Electric, Gas and Sanitary Service
Wholesale Trade and Retail Trade
Finance, Insurance and Real Estate
Services
2
18
47
10
25
5
93
1.00
9.00
23.50
5.00
12.50
2.50
46.50
1
7
56
18
28
8
82
0.50
3.50
28.00
9.00
14.00
4.00
41.00
Total 200 100.00 200 100.00

The impact of knowledge spillovers on new firms growth
91
4.3.2 The Gibrat’s Law
The relationship between firm’s growth and external research
provided by universities is investigated through the estimation of the
Gibrat’s law model (Gibrat 1931):
LnSizei,t = β0 + β1 LnSizei,t-1 + εi,t (4.1)
where LnSizei,t is the size of firm i at time t, LnSizei,t-1 is the size of the
same firm in the previous period and εi,t is a random variable distributed
independently of LnSizei,t-1. Following Chesher (1979), if both sides of
equation 4.1 are exponentiated, it becomes clear that if β1 is equal to unity,
then growth rate and initial size are independently distributed and
Gibrat’s Law is in operation. By contrast, if β1 < 1, smaller firms grow at a
systematically higher rate than do their larger counterparts, while the
opposite is the case if β1> 1.
Empirical investigations of Gibrat’s law rely on estimation of
augmented equations including the LnAge of the firm. The resulting
models are specified as follows:
LnSizei,t = β0 + β1 LnSizei,t-1 + β2 LnAgei,t-1 + εi,t (4.2)
LnSizei,t = β0 + β1 LnSizei,t-1 + β2 LnAgei,t-1 + β3 LnSize2i,t-1 +
+ β4 LnAge2i,t-1 + εi,t (4.3)
Equation (4.2) and (4.3) can be generalised augmenting them by firm
specific variables in the following form:
LnSizei,t = β0 + β1 LnSizei,t-1 + β2 LnAgei,t-1 + Σ βj Xj-2 + εi,t (4.4)
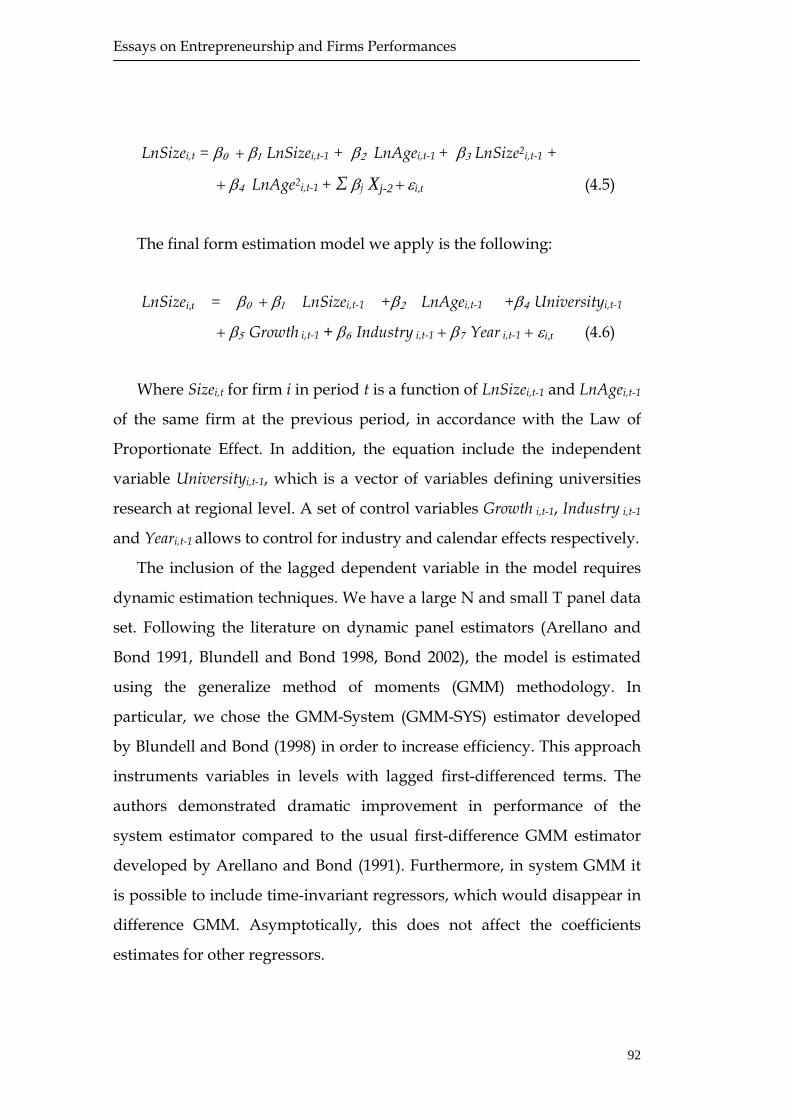
Essays on Entrepreneurship and Firms Performances
92
LnSizei,t = β0 + β1 LnSizei,t-1 + β2 LnAgei,t-1 + β3 LnSize2i,t-1 +
+ β4 LnAge2i,t-1 + Σ βj Xj-2 + εi,t (4.5)
The final form estimation model we apply is the following:
LnSizei,t = β0 + β1 LnSizei,t-1 +β2 LnAgei,t-1 +β4 Universityi,t-1
+ β5 Growth i,t-1 + β6 Industry i,t-1 + β7 Year i,t-1 + εi,t (4.6)
Where Sizei,t for firm i in period t is a function of LnSizei,t-1 and LnAgei,t-1
of the same firm at the previous period, in accordance with the Law of
Proportionate Effect. In addition, the equation include the independent
variable Universityi,t-1, which is a vector of variables defining universities
research at regional level. A set of control variables Growth i,t-1, Industry i,t-1
and Yeari,t-1 allows to control for industry and calendar effects respectively.
The inclusion of the lagged dependent variable in the model requires
dynamic estimation techniques. We have a large N and small T panel data
set. Following the literature on dynamic panel estimators (Arellano and
Bond 1991, Blundell and Bond 1998, Bond 2002), the model is estimated
using the generalize method of moments (GMM) methodology. In
particular, we chose the GMM-System (GMM-SYS) estimator developed
by Blundell and Bond (1998) in order to increase efficiency. This approach
instruments variables in levels with lagged first-differenced terms. The
authors demonstrated dramatic improvement in performance of the
system estimator compared to the usual first-difference GMM estimator
developed by Arellano and Bond (1991). Furthermore, in system GMM it
is possible to include time-invariant regressors, which would disappear in
difference GMM. Asymptotically, this does not affect the coefficients
estimates for other regressors.

The impact of knowledge spillovers on new firms growth
93
4.3.3 Variables description
Dependent variable
Consistently with previous research on small businesses and
entrepreneurship (Covin and Covin 1990, Covin and Slevin 1991,
Lumpkin and Dess 1996, Sadler-Smith et al. 2003, Swierczek and Ha 2003,
Wolff and Pett 2006), the dependent variable of our model is a measure of
firms’ growth. Actually, different variables can be considered as proxies of
firm growth, e.g. sales or market share growth, number of employees. To
our purposes, we choose sales growth for different reasons. First, in the
literature on entrepreneurial firms it is the most widely used measure of
performance as the entrepreneurial activity is considered mainly as a
growth-oriented phenomenon which stimulates economic performance of
individual firms and, as a consequence, general economic growth. The
dependent variable, LnSizei,t , is, hence, measured as the natural
logarithmic of sales at constant prices for firm i at period t.
Independent variables
Following the Gibrat’s Law, our model include characteristics specific
to the enterprise such as firm LnSize and LnAge at period t-1. Firm LnAge is
measured as one plus the age of the firm at the moment of the IPO in
logarithmic scale.
To analyze the impact of universities research on firms’ growth in the
region, the model comprises measure of knowledge endowment both in
terms of knowledge input and output, trying to highlight the different
mechanisms for transferring knowledge as reviewed in the literature.
Research funding reflects the potential knowledge capacity of a region as
provided by universities and is a proxy for market opportunities
generated by knowledge spillovers. This input-related variable measure
the amount of research funds financed by HEFCE and available to each

Essays on Entrepreneurship and Firms Performances
94
university. HEFCE research funds are distributed selectively to higher
education institutions that have demonstrated the quality of their research
by reference to national and international standards. Quality is measured
according to the periodic Research Assessment Exercise (RAE). The
quality-related research funding are distributed to institutions with
reference to both the quality and volume of research activity, where
quality is defined by a rating, on a scale of 1 to 5* (five star), and volume is
a function of the number of research-active academic staff, research
assistants and research fellows.
As far as knowledge output is concerned, we introduced two distinct
variables accounting for different impacts of university output at regional
level. First we introduced the share of academic publications in social
science (SocialScience) with respect to the number of publication in both
natural and social sciences. This variable gives a measure of knowledge
produced by local universities which is appropriable by firms and, thus,
represents an important source of entrepreneurial opportunities. More
precisely, the proxy accounts for the relative weight of sciences with a
high level of tacitness with respect to sciences based on codified
knowledge, i.e. natural sciences. Additionally, the model includes the
number of total students in local universities, measured in logarithmic
scale, as a proxy of human capital available in the region. This variable
accounts for the spillovers of knowledge embodied in young and highly
educated students.
Control variables
We further include a set of control variables which may have an impact
on firm growth. Growth between t-1 and t is meant to account for likely
interactions between the macroeconomic situation and the performance of
the individual firm and, thus, to control for local determinants influencing
firm’s growth rate. Finally, in our model we control for both industry and
The impact of knowledge spillovers on new firms growth
95
calendar year effects. Following the primary 1-digit standard industrial
classification (SIC) code for the IPOs analysed, a set of dummies (Industry)
are included in the model to control for industry-specific factors, as
industry cycles and trends, that may influence the rate of growth of
individual firms. In our model, we also included a set of dummies
variables controlling for calendar year effects due to the fact that the IPOs
in our sample happen to be in different calendar year. Table 4.2
summarizes the variables measurement methods for both the dependent
and independent variables introduced in the model while descriptive
statistics are presented in Table 4.3 4.
4 We also ran analyses using a Gibrat’s Law model including squared terms of both Age and Size; this method did not substantively alter our results.

Essays on Entrepreneurship and Firms Performances
96
Table 4.2 - Variables Measurement Methods
Variable Description
LnSizet Logarithm of the size of the firm at t measured by sales
LnSizet-1 Logarithm of the size of the firm at t-1measured by sales
LnAget-1 Logarithm of 1 plus the number of years from firm’s foundation to
the IPO at t-1
Research funding Logarithm of total research funding by universities in the firms’
region
SocialScience Ratio between publications in social sciences and total publications by
universities in the firms’ region
Students Logarithm of total number of students attending universities in the
firms’ region
Growth Annual GDP growth rate of log-normalized sales (constant prices) in
the firms’ region
Industry Set of industry dummies according to the 1-digit SIC code
classification
Year Set of calendar dummies

The impact of knowledge spillovers on new firms growth
97
Table 4.3 - Descriptive statistics of independent variables
AIM
Variable Mean Std. Dev. Min Max Observations
LnSizet-1 10.45 2.31 0.06 17.49 1021
LnAget-1 1.97 0.84 0 3.69 1032
Research funding 12.81 0.92 9.58 13.89 1062
SocialScience 0.26 0.08 0.17 0.65 1062
Students 11.67 0.83 8.93 12.49 1062
Growth 0.09 0.07 -0.07 0.27 764
Official List
Variable Mean Std. Dev. Min Max Observations
LnSizet-1 12.78 1.85 5.43 19.99 1181
LnAget-1 2.28 1.13 0 5.25 1126
Research funding 12.81 0.83 10.20 13.89 1184
SocialScience 0.25 0.06 0.18 0.65 1184
Students 11.65 0.78 9.43 12.49 1184
Growth 0.12 0.31 -2.06 2.36 796

Essays on Entrepreneurship and Firms Performances
98
4.4 Results
Table 4.4 presents the correlation matrix while the results of the
econometric estimations are shown in Table 4.5. The correlation matrix
reveals that some rather high correlations should be taken into account in
the analysis. Particularly, Research Funding and Students turn out to be
significantly correlated in both the AIM and OL samples. Such high
correlations are probably related to one specific reason. The two variables
are both measures of size, the former referring to the knowledge input and
the latter to the knowledge output available in the region. Given their high
correlation, the two explanatory variables are included in separate
regressions. Model 1 presents the results using Research Funding while
Model 2 displays estimation results using Students for both AIM and OL.
Coefficients for the other variables included in the model are consistent in
spite of the university-related variable used, confirming the robustness of
estimations for both the samples.
The results of the estimations show that both university input and
output influence firm growth for AIM sample while no effects of
university-related variables are found for OL companies. The amount of
research funding available to universities in the region has a positive
impact (significance at 5% in both models) on the rate of growth of AIM’s
firms, suggesting that for young and growing companies the spillovers of
knowledge in the innovation system matter. This result supports the
hypothesis that the access to external knowledge sources may have
different effects on firms’ growth depending mainly on the diverse profile
of such a firms. Entrepreneurial companies in early phases of the life cycle
widely rely on external sources of research activities as they have major
difficulties in developing internal research.
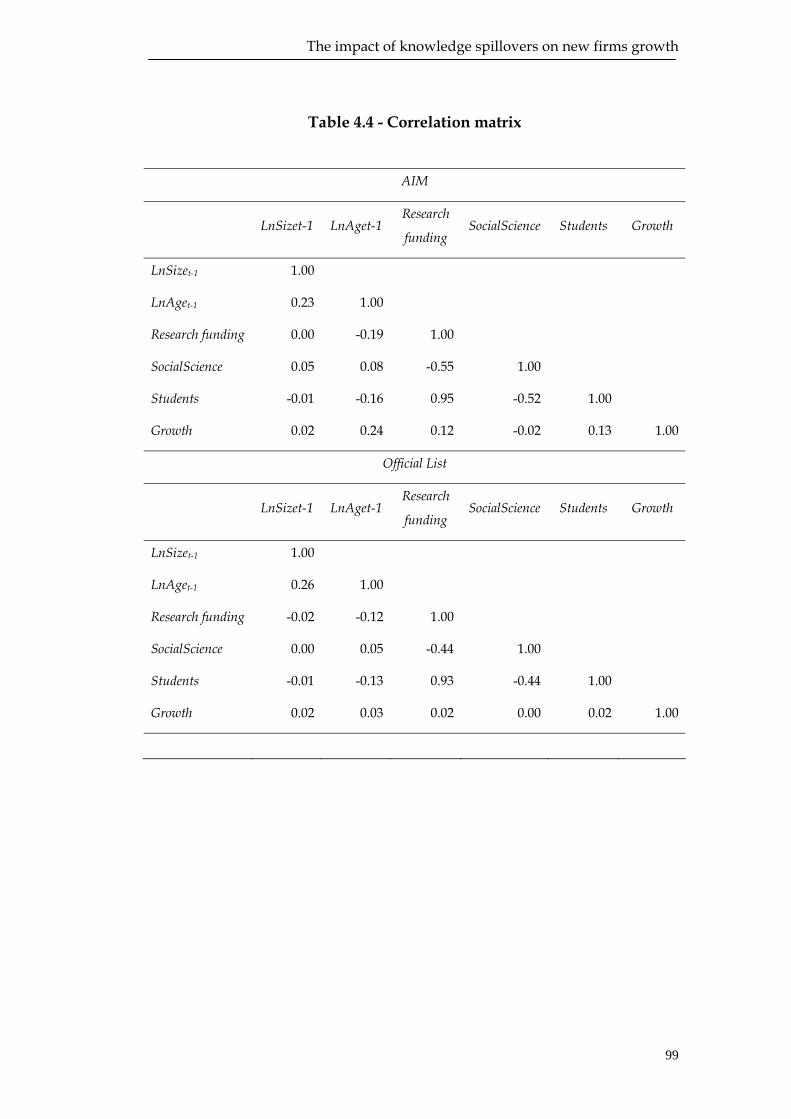
The impact of knowledge spillovers on new firms growth
99
Table 4.4 - Correlation matrix
AIM
LnSizet-1 LnAget-1
Research
funding SocialScience Students Growth
LnSizet-1 1.00
LnAget-1 0.23 1.00
Research funding 0.00 -0.19 1.00
SocialScience 0.05 0.08 -0.55 1.00
Students -0.01 -0.16 0.95 -0.52 1.00
Growth 0.02 0.24 0.12 -0.02 0.13 1.00
Official List
LnSizet-1 LnAget-1
Research
funding SocialScience Students Growth
LnSizet-1 1.00
LnAget-1 0.26 1.00
Research funding -0.02 -0.12 1.00
SocialScience 0.00 0.05 -0.44 1.00
Students -0.01 -0.13 0.93 -0.44 1.00
Growth 0.02 0.03 0.02 0.00 0.02 1.00

Essays on Entrepreneurship and Firms Performances
100
As far as the university output is concerned, SocialScience, measuring
the relative weight articles published in the social science, is found to be
positively and significantly (p<0.05 in both models) correlated with the
firm rate of growth confirming that research activity in this field positively
impacts the growth of firms in AIM sample. Actually, AIM companies
operate mainly in knowledge-intensive sectors, such as business services,
health, legal and social services, wholesales and retail trade. These
companies are particularly dependent on knowledge in social sciences and
thus are motivated to interact with universities conducting research in this
field. Conversely, research intensity in natural science is less important for
this class of firms. This result lends support to the hypothesis that sciences
more tacit in nature positively impact the knowledge spillovers in the
innovation system.
The number of students in the region is also positively and
significantly correlated (p<0.05) to firms rate of growth for AIM
companies. This result suggests that knowledge embodied in people and
accessible in the region may foster the rate of growth of small and young
companies.
As to the remaining variables, LnSize shows a statistically significant
(p<0.01) impact on firm growth, suggesting that smaller firms grow faster
than their counterparts, as shown by the coefficient smaller than one in all
the four regressions. The coefficient of LnAge is statistically significant
only for sample companies listed on the Official List. While AIM’s sample
is quite concentrated on the mean with respect to LnAge, OL’s companies
are more dispersed from the mean value. The OL’s rate of growth is thus
influenced by LnAge effects. It seems that characteristics related with the
age of the firm count more than external knowledge effects for the sample
of IPO’s on the Official List, comprising more mature and stable
companies than the AIM sample.

The impact of knowledge spillovers on new firms growth
101
Table 4.5- Results of GMM-SYS Regression
AIM Official List Model 1 Model 2 Model 1 Model 2 Constant 1.208
(1.21) 1.623
(1.50) 6.583 (4.84)
*** 6.435 (5.02)
***
LnSizet-1 0.696 (6.55)
*** 0.701 (6.80)
*** 0.508 (5.61)
*** 0.508 (5.63)
***
LnAget-1 0.160 (1.44)
0.145 (1.38)
0.120 (2.59)
*** 0.120 (2.59)
SocialScience 1.587 (2.14)
** 1.342 (1.970)
** -0.153 (-0.27)
-0.096 (-0.17)
Research funding
0.150 (2.23)
**
0.010 (0.22)
Students 0.132 (2.01)
** 0.022 (0.43)
Growth -0.385 (-0.31)
-0.382 (-0.31)
0.026 (0.23)
0.026 (0.23)
Industry Yes Yes Yes Yes
Year Yes Yes Yes Yes
Number of instruments 42
42
42
42
Wald Test
χ2 (12) 256.51 *** 245.43 *** 202.04 *** 204.08 ***
Hansen test χ2 (8)
Prob> χ2
12.43 (0.867)
12.21
(0.877)
21.75
(0.297)
21.70
(0.300)
AR(1)
Prob> z -5.73
(0.000)
*** -5.79 (0.000)
*** -2.42 (0.015)
** -2.43 (0.015)
***
AR(2)
Prob> z 0.05
(0.960) 0.04
(0.964) 0.06
(0.955) 0.06
(0.955)
Statistical significance at *p<0.10 **p<0.05 ***p<0.01 z statistics between parentheses

Essays on Entrepreneurship and Firms Performances
102
As the validity of GMM relies on the choice of the appropriate set of
instruments and the absence of serial correlation of second order, the
results of the post-estimation tests are included in Table5. The Hansen test
for over-identifying restrictions give us confidence with the validity of the
instruments for the overall estimations. As expected, negative first-order
serial correlation is found in Arellano-Bond AR(1) test while the Arellano-
Bond AR(2) test indicates the validity of instruments for both AIM and OL
regressions.
4.5 Discussion
In this paper the determinants of firms’ growth are inferred from a
broad range of variables. In accordance with the knowledge spillovers
literature, the aim of the research has been the understanding of the
relationship between universities and new businesses growth, with a
particular focus on the role of knowledge spillovers. Our results suggest
that the production of new knowledge by universities in a specific region
positively impact the rate of growth of entrepreneurial companies in the
early stages of the life cycle. Thus, it seems that such a firms are more able
to access and absorb knowledge spillovers than their counterparts. In
particular, the analysis conducted in this paper give evidence to the
positive role of investment in research activities for the process behind
small and young firms’ growth. Furthermore, university’s output derived
by these investments in terms of both scientific publication and human
capital is also found to be related to firms’ rate of growth. In sum, our
results support the hypothesis that the interaction between different
actors, the importance of codified and tacit knowledge stocks and
investment in the creation of new ideas can generate opportunities for
growth of entrepreneurial firms.
The impact of knowledge spillovers on new firms growth
103
By analyzing the role played by external knowledge sources such as
universities, the paper contributes to the literature on the determinants of
firms’ growth. Addressing this issue is a significant contribution in the
literature as previous empirical studies have mainly focused on the impact
of knowledge spillovers on firm concentration while their effects on firms’
growth have not been sufficiently investigated. A further contribution is
related with the comparison between AIM and OL samples. The results
lend support to the idea that knowledge produced and diffused in the
local environment is more important for entrepreneurial companies than
for companies in more advanced stages of the development process.
The results of this work bring some policy implications. Policy
makers could play the key role of setting the basic conditions to
entrepreneurship dynamism. Public policy acts as facilitators of the
interactions process between firms and universities. By financing research
activities policy makers can contribute to nurture the local knowledge
capacity and, in turn, promote growth of firms. To conclude, we believe
that further researches could extend the results of our analysis. Future
analysis need to distinguish the impact of external knowledge on
different kinds of business activities, maybe distinguishing manufacturing
and services activities in knowledge based sectors.

Essays on Entrepreneurship and Firms Performances
104
References
Almus, M., Nerlinger, E.A. (1999), Growth of New Technology-Based Firms: Which Factors Matter?, Small Business Economics, 13, 141-154.
Antonelli, C., 2005. Models of Knowledge and systems of governance, Journal of Instituional Economics, 1, 51-73.
Arellano, M., Bond, S. (1991), Some Tests of Specification for Panel Data: Monte Carlo Evidence and an Application to Employment Equations, Review of Economic Studies, 58, 277-297.
Arrow, K. J. (1962), Economic welfare and the allocation of resources for invention. in R. R. Nelson (ed.), The Rate and Direction of Inventive Activity: Economic and Social Factors, Princeton, NJ: Princeton University Press for N.B.E.R., 609–625.
Audretsch, D.B. (1995), Innovation and Industry Evolution, Cambridge, MA: MIT Press.
Audretsch, D.B., Feldman, M.P. (1996), R&Dspillovers and the geography of innovation and production, American Economic Review, 86, 630–640.
Audretsch, D.B., Lehmann, E.E., Warning, S. (2004), University spillovers: Does the kind of knowledge matters?, Industry and Innovation, 11, 193-205.
Audretsch, D.B., Lehmann, E.E. (2005a), Does the knowledge spillover theory of entrepreneurship hold for regions?, Research Policy, 34, 1191-1202.
Audretsch, D.B., Lehmann, E.E. (2005b), Mansfield’s Missing Link: The Impact of Knowledge Spillovers on Firm Growth, Journal of Technology Transfer , 30 1/2, 207–210.
Audretsch, D.B., Link, A.N. (2006), Empirical evidence on knowledge flows from research collaborations: Introduction to the special issue, Economics of Innovation and New Technology, 15, 1 – 3.
Audretsch, D.B., Stephan, P.E. (1996), Company-scientist locational links: the case of biotechnology, The American Economic Review, 86, 641-652.
Blundell, R., Bond, S. (1998), Initial Conditions and Moment Restrictions in Dynamic Panel Data Models, Journal of Econometrics, 87, 115-143.
The impact of knowledge spillovers on new firms growth
105
Bond, S. (2002), Dynamic panel data models: a guide to micro data methods and practice, Portuguese Economic Journal, 1, 141-162.
Caves, R. (1998), Industrial organization and new findings on the turnover and mobility of firms, Journal of Economic Literature, 36, 1947–1982.
Chen, J-R., Chih-Hai, Y. (2005), Technological knowledge, spillover and productivity: evidence from Taiwanese firm level panel data, Applied Economics, 37, 2361 – 2371.
Chesher, A. (1979), Testing the Law of Proportionate Effect, Journal of Industrial Economics, 27, 403-411.
Colombo, M., D’Adda, G., Piva, E. (2006), When do university-based knowledge spillovers influence the growth of NTBFs?, RENT XX Conference, Brussels.
Cooke, P. (2002), Knowledge Economies. Clusters, learning and cooperative advantage, London: Routledge.
Covin, J. G., Covin, T. J. (1990), Competitive Aggressiveness, Environmental Context, and Small Firm Performance, Entrepreneurship Theory and Practice, 14, 35–50.
Covin, J. G., Slevin, D. P. (1991), A conceptual model of entrepreneurship as firm behaviour, Entrepreneurship Theory and Practice, 16, 7–25.
David, P. A. (1993), Knowledge property and the system dynamics of technological change. In Summers, L., Shah, S. (Eds.). Proceedings of the World Bank Annual Conference on Development Economics. Washington, DC: The World Bank, 215–248.
Davidsson, P. (1989), Continued Entrepreneurship and Small Firm Growth, PhD Thesis Dissertation, Stockholm School of Economics.
Davidsson, P., Kirchhoff, B., Hatemi-J, A., Gustavsson, H. (2002), Empirical Analysis of Business Growth Factors Using Swedish Data, Journal of Small Business Management, 40, 332-349.
Etzkowitz, H., Leydesdorff, L. (1997), Universities in the Global Economy: A Triple Helix of University–Industry–Government Relations, Cassell: London.
Essays on Entrepreneurship and Firms Performances
106
Etzkowitz, H. and Leydesdorff, L. (2000), The Dynamics of Innovation: from National Systems and “Mode 2” to a Triple Helix of University–Industry–Government Relations, Research Policy , 29, 109–123.
Foray, D., Lundvall, B. (1995), The knowledge-based economy: from the economics of knowledge to the learning economy, Employment and Growth in the Knowledge-based Economy, Paris: OECD, 11-32.
Freeman, C. (1987), Technology and Economic Performance: Lessons from Japan, Pinter: London.
Freeman, C. 1(991), Networks of Innovators: A Synthesis of Research Issues, Research Policy , 20, 499-514.
Gibrat, R. (1931), Les Inégalités Economiques, Paris, France: Librairie du Recueil Sirey.
Griliches, Z. (1992), The search for R&D spillovers, Scandinavian Journal of Economics, 94, 29–47.
Hall, B. H., Mairesse, J. (1995), Exploring the relationship between R-D and productivity in France manufacturing firms, Journal of Econometrics, 65, 263–93.
Jaffe, A.B. (1989), Real effects of academic research, The American Economic Review, 79, 957–970.
Lumpkin, G.T., Dess, G.G. (1996), Clarifying the Entrepreneurial Orientation Construct and Linking it to Performance, Academy of Management Review, 21, 135–172.
Lundvall, B. (1992), National systems of innovation: towards a theory of innovation and interactive learning, Frances Pinter: London.
Mairesse, J., Hall, B. H. (1996), Estimating the productivity of research and development in France and United States manufacturing firms: an exploration of simultaneity issues with GMM. In Wagner, K., van Ark, B. (eds.), International Productivity Comparisons, Amsterdam: North-Holland, 285–315.
Mairesse, J., Sassenou, M. (1991), R&D and productivity: a survey of econometric studies at the firm level, Science-Technology Industry Review, 8, 317–48.

The impact of knowledge spillovers on new firms growth
107
Mansfield, E. (1962), Entry, Gibrat's law, innovation and the growth of firms, American Economic Review, 52, 1023-1051.
Marshall, A. (1890), Principles of Economics, London: Macmillan.
Nelson, R. R. (1959), The simple economics of basic scientific research, Journal of Political Economy, 67, 297–306.
Nelson, R. (1993), National innovation systems: a comparative analysis, Oxford: Oxford University Press.
Nelson, R. R., Winter, S. G. (1982), An Evolutionary Theory of Economic Change, Cambridge, MA: Harvard University Press.
OECD (1996), The knowledge-Based Economy, Paris: OECD.
O’Shea, R.P., Allen, T.J., Chevalier, A., Roche, F. (2005), Entrepreneurial orientation, technology transfer and spin-off performance of U.S. universities, Research Policy, 34, 994-1009.
Powers, J. (2003), Commercializing academic research: Resource effects on performance of university technology transfer, The Journal of Higher Education, 74, 26–50.
Sadler-Smith, E., Hampson, Y., Chaston, I., Badger, B. (2003), Managerial Behavior, Entrepreneurial Style, and Small Firm Performance, Journal of Small Business Management , 41, 47–67.
Smith, K. (2002), What is the ‘Knowledge Economy’? Knowledge Intensity and Distributed Knowledge Bases, Discussion Paper, Maastricht: United Nations University.
Storey, D.J. (1994), Understanding the Small Business Sector, London: Thomson Learning.
Sutton, J. (1997), Gibrat’s legacy, Journal of Economic Literature, 35, 40–59.
Swierczek, F. W., Ha, T. T. (2003), Entrepreneurial Orientation, Uncertainty Avoidance and Firm Performance, International Journal of Entrepreneurship and Innovation, 4, 46–58.
Varga, A. (2000), Local academic knowledge transfers and the concentration of economic activity, Journal of Regional Science, 40, 289-309.

Essays on Entrepreneurship and Firms Performances
108
Wolff J. A., Pett, T. L. (2006), Small-Firm Performance: Modeling the Role of Product and Process Improvements, Journal of Small Business Management, 44, 268–284.

Conclusions
109
Chapter 5 Conclusions
The research carried out in this thesis contributes to the literature
linking entrepreneurship and firms performances taking into account the
multilevel nature of the entrepreneurship concept. From our study
common traits for entrepreneurial companies emerge.
In the first part of the work, the individual level was at the heart of our
analysis. By looking at both organizational information and board of
directors characteristics, intangible assets were found to play a crucial role
in shaping firms rate of growth. According to our results, the educational
attainment of key figures managing the company appeared to be an
important determinant of firms performances. This finding proved the
importance of codified knowledge. Besides, also tacit knowledge seemed
to matter as highlighted by the impact of individual learning dynamics on
the development path of firms. In addition, organizational factors were
investigated. Our result revealed that companies showing a high risk
exposure at the moment of the IPO growth more than their counterpart.
Furthermore, consistently with the life-cycle theory, we found that
entrepreneurial companies follow an S-shaped pattern of growth.
In light of the factors affecting firms growth, in the second part of the
thesis we investigated the relationship between EO and firm market
Essays on Entrepreneurship and Firms Performances
110
performance with the purpose of verifying whether investors positively
evaluate entrepreneurial orientation. Our results confirmed a positive
impact of risk-taking and proactivity on investors’ valuation. More
precisely, the price premium paid by investors in the prospect of high
returns is higher for companies showing a higher risk position.
Furthermore, proactive behaviours of the top management team seems to
have an impact on the valuation of investors.
In the third paper, we moved the attention on external factors
affecting firms performance. In accordance with the knowledge spillovers
theory of entrepreneurship, the paper contributed to the literature by
investigating the connection between external sources of research, in
particular universities, and individual firm growth. The analysis
highlighted the positive role of research institutions in influencing
entrepreneurial activities of small and young companies. Indeed, both
university input and output appeared to influence firm growth for AIM
companies while no effects of university-related variables are found for
OL companies. The results lend support to the idea that knowledge
produced and diffused in the local environment is more important for
entrepreneurial companies than for companies in more advanced stages of
the development process. Indeed, entrepreneurial companies in early
phases of the life cycle widely rely on external sources of research
activities as they have major difficulties in developing internal research.
The results of this work bring both management and policy
implications. At managerial level, it is important to remark the crucial role
of key figures attributes and attitudes. The stock of knowledge and
learning processes internal to the organization help in increasing firms
performances. Additionally, risk taking and proactivity are important
traits of both individual and organization for succeeding. Another crucial
issue for the top management of companies is related with financial
constraints. In their start-up and growth phases, firms need substantial

Conclusions
111
external funding. However, the literature on this topic highlights that
small and young enterprises are subject to ‘credit rationing’. The results of
the present study revealed the emerging role of secondary markets, such
as the AIM, in removing financial constraints that hamper the prospects of
new businesses. The existence of markets dedicated to young and
growing companies allows such a companies to rise the capital required to
finance their growth.
Moving the attention on the policy implications of this work, it is
important to remark the key role of policy makers in setting the basic
conditions to entrepreneurship dynamism. Political intervention could
aim at promoting entrepreneurial activities, which ease the local process of
change by encouraging the propensity to risk and easing the access to
external capital. Education towards entrepreneurship represents an
example of how is important the stimulation a more dynamic
entrepreneurial culture. Public policy can also ease the interactions
process between firms and universities. By financing research activities
policy makers can contribute to nurture the local knowledge capacity and,
in turn, promote growth of firms. In order to increase the population of
entrepreneurs, another appropriate policy would be to foster the
participation of young and the unemployed work force in the
entrepreneurial process. It is important to look at the process of
transformation in the cultural and behavioral attitudes of many countries
towards entrepreneurship, in particular on the matter of rewarding
propensity to risk, an element that brings with it economic advantages.
The increase in the number of new firms and their relative chances of
survival and growth is, thus, an important objective for governments
action.
Although we consider this set of articles a valid contribution to the
literature on the relationship between entrepreneurship and firms
performances, we believe that further researches could extend the results

Essays on Entrepreneurship and Firms Performances
112
of our analysis. After some crucial determinants of entrepreneurial
companies have been highlighted, an important research question is
related with the the basic conditions of firms survival. We believe it is
important to veify whether the analysed factors also assure a long term
process of growth. Finally, future analysis need to differentiate the impact
of diverse kinds of business activities, maybe distinguishing
manufacturing and services activities in knowledge based sectors.

References
113
References
Acs, Z.J. and Mueller, P. (2008), Employment Effects of Business Dynamics: Mice, Gazelles and Elephants, Small Business Economics, 30(1), 85-100.
Audretsch, D. B. (2002), Entrepreneurship: A Survey of the Literature, prepared for the European Commission, Enterprise Directorate General, July.
Baptista, R., Escaria, V. and Madruga, P. (2008), Entrepreneurship, Regional Development and Job Creation: The Case of Portugal, Small Business Economics, 30(1), 49-58
Baron, R. A. and Markman G.D. (2003), Beyond social capital: The role of entrepreneurs’ social competence in their financial success, Journal of Business Venturing, 18(1), 41-60.
Birley S. and Stockley S. (2000), Entrepreneurial teams and venture growth, in D.L. Sexton and H. Landström (eds.), Blackwell Handbook of Entrepreneurship, Oxford: Blackwell Publishing, pp. 287-307.
Carree, M.A. and Thurik, A.R. (2008), The Lag Structure of the Impact of Business Ownership on Economic Performance in OECD Countries, Small Business Economics, 30(1), 101-110.
Covin, J. G., T. J. Covin (1990), Competitive Aggressiveness, Environmental Context, and Small Firm Performance, Entrepreneurship Theory and Practice , 14, 35-50.
Covin, J. G., Slevin, D. P. (1991), A conceptual model of entrepreneurship as firm behaviour, Entrepreneurship Theory and Practice , 16, 7-25.
Davidsson P. and Wiklund J. (2001), Levels of Analysis in entrepreneurship research: Current research practice and suggestions for the future, Entrepreneurship Theory and Practice, 25(4), 81-99.
Ensley M.D., Carland J.C., CarlandJ.W. and Banks M. (1999), Exploring the Existence of Entrepreneurial Teams, International Journal of Management, 16(2): 276-286.

Essays on Entrepreneurship and Firms Performances
114
Fölster, S. (2000), Do Entrepreneurs Create Jobs?, Small Business Economics, 14(2), 137-148
Fritsch, M. (1997), New Firms and Regional Employment Change, Small Business Economics, 9, 437-448
Fritsch, M. and Mueller, P. (2008), The Effect of New Business Formation on Regional Development over Time. The Case of Germany, Small Business Economics, 30(1),15-29.
Gupta V., MacMillan I. and Surie G. (2004), Entrepreneurial leadership: developing and measuring a cross-cultural construct, Journal of Business Venturing, 19(2), 241-260.
Hebert, R.F. and Albert N. Link (1989), In Search of the Meaning of Entrepreneurship, Small Business Economics, 1(1), 39-49.
Lechler, T. (2001), Social interaction: A determinant of entrepreneurial team venture success, Small Business Economics, 16(4), 263-278.
Lumpkin, G.T., G.G. Dess, (1996), Clarifying the Entrepreneurial Orientation Construct and Linking it to Performance, Academy of Management Review, 21, 135-72.
Lyon Douglas W. Lyon, G. T. Lumpkin and Gregory G. Dess, (2000), Enhancing Entrepreneurial Orientation Research: Operationalizing and Measuring a Key Strategic Decision Making Process, Journal of Management , 26(5), 1055-1085.
McGrath R. G. and MacMillan I. (2000), The entrepreneurial mindset: Strategies for continuously creating opportunity in age of uncertainty, Harvard Business School Press, Boston.
Miller, D. (1983), The correlates of entrepreneurship in three types of firms, Management Science, 29, 770– 791.
Minniti M., Bygrave W.D. and Autio E. (2005), Global Entrepreneurship Monitor 2005, Executive Report: Babson College and London Business School.
Mueller, P., Van Stel, A. and Storey, D. (2008), The Effects of New Firm Formation on Regional Development over Time: The Case of Great Britain, Small Business Economics, 30(1), 59-71

References
115
OECD - Organization for Economic Co-operation and Development (1998), Fostering Entrepreneurship- The OECD Job Strategy, Paris: OECD.
OECD - Organization for Economic Co-operation and Development (1996), The knowledge-Based Economy, Paris: OECD.
Sadler-Smith, E., Y. Hampson, I. Chaston, and B. Badger (2003), Managerial Behavior, Entrepreneurial Style, and Small Firm Performance, Journal of Small Business Management , 41(1), 47-67.
Swierczek, F. W. and T. T. Ha (2003), Entrepreneurial Orientation, Uncertainty Avoidance and Firm Performance, International Journal of Entrepreneurship and Innovation, 4(1), 46-58.
van Praag C. M. and Versloot P. H. (2007), What is the Value of Entrepreneurship? A Review of Recent Research, Small Business Economics, 29(4), 251-382.
Van Stel, A. and Suddle, K. (2008), The Impact of New Firm Formation on Regional Development in the Netherlands, Small Business Economics, 30(1), 31-47.
Wennekers, A.R.M., Thurik, A.R. (1999), Linking entrepreneurship and economic growth, Small Business Economics, 13, 27-55.
Wennekers, S., Van Stel, A, Thrurik, R., Reynolds, P. (2005), Nascent Entrepreneurship and the Level of Economic Development, Small Business Economics, 24 (3), 293-309
Wolff J. A. and T. L. Pett (2006), Small-Firm Performance: Modeling the Role of Product and Process Improvements, Journal of Small Business Management , 44(2), 268-84.