Embed Size (px)
Citation preview
UNIVERSITE DE SHEEBROOKE Faculte de genie
Departement de genie civil
Essais in situ et analyses non-lineaires d'un batiment multi-etage endommage lors du
seisme d'Ha'iti du 12 janvier 2010
Memoire de maitrise Speciality : genie civil
Benoit Boulanger
Jury : Patrick Paultre (directeur) Jean Proulx (co-directeur) Charles-Philippe Larnarche (rapporteur) Pierre Leger
Sherbrooke (Quebec) Canada Avril 2012
- j£ -3 -^°
Reproduced with permission of the copyright owner. Further reproduction prohibited without permission.

Library and Archives Canada
Published Heritage Branch
Bibliotheque et Archives Canada
Direction du Patrimoine de I'edition
395 Wellington Street Ottawa ON K1A0N4 Canada
395, rue Wellington Ottawa ON K1A 0N4 Canada
Your file Votre reference
ISBN: 978-0-494-90956-0
Our file Notre reference ISBN: 978-0-494-90956-0
NOTICE:
The author has granted a non-exclusive license allowing Library and Archives Canada to reproduce, publish, archive, preserve, conserve, communicate to the public by telecommunication or on the Internet, loan, distrbute and sell theses worldwide, for commercial or non-commercial purposes, in microform, paper, electronic and/or any other formats.
AVIS:
L'auteur a accorde une licence non exclusive permettant a la Bibliotheque et Archives Canada de reproduire, publier, archiver, sauvegarder, conserver, transmettre au public par telecommunication ou par I'lnternet, preter, distribuer et vendre des theses partout dans le monde, a des fins commerciales ou autres, sur support microforme, papier, electronique et/ou autres formats.
The author retains copyright ownership and moral rights in this thesis. Neither the thesis nor substantial extracts from it may be printed or otherwise reproduced without the author's permission.
L'auteur conserve la propriete du droit d'auteur et des droits moraux qui protege cette these. Ni la these ni des extraits substantiels de celle-ci ne doivent etre imprimes ou autrement reproduits sans son autorisation.
In compliance with the Canadian Privacy Act some supporting forms may have been removed from this thesis.
While these forms may be included in the document page count, their removal does not represent any loss of content from the thesis.
Canada
Conformement a la loi canadienne sur la protection de la vie privee, quelques formulaires secondaires ont ete enleves de cette these.
Bien que ces formulaires aient inclus dans la pagination, il n'y aura aucun contenu manquant.
Reproduced with permission of the copyright owner. Further reproduction prohibited without permission.
RESUME
Malgre la destruction massive survenue lors du seisme d'Hai'ti en 2010, le batiment do 12 etages en beton arme de Digicel a bien resiste, ne subissant que des dommages reparables. devaluation de sa structure, ainsi qu'une serie d'essais sous vibrations ambiantes, ont permis de caracteriser son comportement dynamique (frequences propres, modes propres et amortissement).
Des modeles par elements finis sur ETABS, avant et apres les essais, ont permis d'eva-luer la capacite de prediction des techniques de modelisation courantes. Une calibration manuelle a ensuite permis d'elaborer un modele numerique representant bien le compor-tement reel du batiment. Cette etude a montre que la methode des elements finis permet de bien representer le comportement dynamique de structures, mais est tres sensible aux hypotheses utilisees. II a aussi ete observe qu'un modele peut predire precisement les frequences propres d'une structure sans pour autant representer fidelement son comporte-ment dynamique (modes propres). Une calibration efficace a ete necessaire afin d'avoir un modele representant bien le comportement du batiment.
Le modele calibre a ainsi donne lieu a des modeles plus sophistiques permettant de faire des analyses non-lineaires. Ces analyses ont permis de recreer les evenements de janvier 2010 afin d'evaluer la capacite des outils numeriques a predire ou reproduire les vibrations du sol, de comprendre les causes des dommages observes et d'estimer l'intensite probable du seisme.
Les resultats d'une serie d'analyse non-lineaires de differentes intensites ont ete compares aux dommages observes. Les analyses numeriques ont bien reproduit les dommages et ont permis de les expliquer. Le comportement general du systeme murs-cadres du batiment est clairement domine par la grande rigidite des murs de refend, permettant un bon controle des deplacements inter-etage. La structure generale a repondu lineairement a toutes les analyses, mais l'incompatibilite des deformations des 2 systemes a induit des dommages locaux a l'interface entre les poutres connectees directement aux murs de refend.
Mots-cl6s : Essais sous vibrations ambiantes, Hai'ti, Analyses non-lineaires, Beton arme, Batiment multi-etage
i
Reproduced with permission of the copyright owner. Further reproduction prohibited without permission.
ABSTRACT
Despite all the damages encountered during the 2010 Haiti earthquake, the 12-storey reinforced-concrete Digicel building behaved well, sustaining only reparable damages. Vi-sual assessment and ambient vibration tests were carried out to characterize the damages sustained and to identify the building's key dynamics properties (natural vibration fre-quencies, mode shapes, and damping ratios).
ETABS was used to generate FE models before and after the AVT to evaluate the capa-bilities of common modelling assumptions to predict the dynamic behaviour of structures. Manual model updating was carried out to present a model representing the building's ac-tual dynamic behaviour. The study showed that the FE method is reliable for predicting the dynamic behaviour of structures, but is very sensitive to the assumptions used during modelling. The model could predict the vibration frequencies precisely, but an accurate representation of the mode shapes required careful model updating.
The updated model lead the way to a more sophisticated model able to produce nonlin-ear time history analyses using the software SeismoStruct. The numerical analyses helped assessing the capabilites of common models to reproduce such events and damages, ex-plaining the observed damages and estimating the probable intensity of the tremor.
Several nonlinear analyses involving various ground motion intensities were conducted and the results were compared with the damages reported during the on-site survey. The overall response of the mixed stiff frame-wall structure was clearly dominated by the high stiffness of the shear walls, showing that this type of structural system helps in keeping reasonable inter-storey drift levels. Overall, the building's structure seems to have re-sponded linearly to all the ground motions investigated, but deformation incompatibilities at the interface between beams and shear walls lead to important local damages.
Keywords: Ambient vibration test, Haiti, Nonlinear analyses, Reinforced concrete, High-rise building
ii
Reproduced with permission of the copyright owner. Further reproduction prohibited without permission.
REMERCIEMENTS
Je ne pourrais commencer mes remerciements autrement qu'en remerciant mes direc-teurs de recherche Patrick Paultre et Jean Proulx pour rn'avoir donne l'opportunite d'ef-fectuer ce projet unique qui m'a fait decouvrir plusieurs domaines du genie parasismique, des essais experimentaux a la modelisation non-lineaire d'un batiment complet. Comment aussi passer sous silence la chance unique d'avoir fait ce sejour enrichissant autant profes-sionellement qu'humainement a Port-au-Prince. Leur generosite et passion a transmettre leur savoir est sans aucun doute leur plus grande qualite en tant que directeur de recherche.
Je tiens aussi a dire un merci special a Charles-Philippe Lamarche qui m'a cotoye tout au long de ce projet, et sans qui ma comprehension des essais experimentaux et des traitements de donnees ne serait pas la meme aujourd'hui.
Ces travaux de recherche n'auraient ete possibles sans l'apport incroyable de l'equipe de techniciens, Claude Aube, Jeason Desmarais et Laurent Thibaudeau.
Merci a tous les membres du CRGP que j'ai cotoyes lors de mon passage a l'Universite de Sherbrooke : Eric Lapointe, Olivier Gauron, Olivier Girard, Nathalie Roy et surtout Yannick Boivin, avec qui j'ai partage plusieurs discussions tres enrichissantes.
Je dois aussi remercier le CRSNG et le FQRNT pour leurs aides financieres importantes.
Finalement, j'aimerais remercier tout particulierement mes parents pour leur support incroyable tout au long de ce long processus que fut mon cheminement scolaire. Sylvie et Daniel, je vous aime.
iii
Reproduced with permission of the copyright owner. Further reproduction prohibited without permission.
TABLE DES MATIERES
1 Introduction 1
2 Essais in situ et analyse du comportement dynamique 3 2.1 Introduction 5 2.2 The Digicel Building 7
2.2.1 Building Description 7 2.2.2 Description of the Structural System 9 2.2.3 Description of the Observed Damages 11
2.3 Dynamic Behaviour Survey 13 2.3.1 Ambient Vibration Tests 13 2.3.2 Signal Processing 13 2.3.3 Instrumentation and Testing Procedure 14 2.3.4 Test Results 15
2.4 Finite Element Modelling 18 2.4.1 Pretest FEM 18 2.4.2 Updated FEM 19
2.5 Summary and Conclusions 21
3 Simulations numeriques 31 3.1 Introduction 33 3.2 Numerical model 35
3.2.1 Software used 35 3.2.2 Modelling assumptions 35 3.2.3 Damping 39 3.2.4 Dynamic behaviour 39
3.3 Analyses 40 3.3.1 Nonlinear analyses 40 3.3.2 Ground motions 40
3.4 Results 43 3.4.1 Global responses 43 3.4.2 Low-rise parking structure adjacent to the main building 46 3.4.3 Main building 50
3.5 Summary and Conclusions 56
4 Conclusion 58
LISTE DES REFERENCES 61
iv
Reproduced with permission of the copyright owner. Further reproduction prohibited without permission.
LISTE DES FIGURES
2.1 In background : the Digicel Building located in a damaged area of Port-au-Prince; on the left : the collapsed "Hopital de Turgeau" 6
2.2 Southwest elevation of the Digicel building 7 2.3 Plan view of the ground level 8 2.4 Elevation of axis 4 9 2.5 a) Connection of Phase 1 and 2; b) flexible connection system used for
exterior cladding 10 2.6 Plan view of a typical storey with the sensors position 23 2.7 a) Masonry-wall damage; b) flexural damage and concrete segregation; c)
bond splitting failure in a beam; d) concrete crushing in the east wall. . . 24 2.8 Damage to columns in the parking area of the low-rise building 25 2.9 a) Short-column damage; b) top view of the steel-roof collapse; c) evidence
of pounding; d) post-quake separation between phases 2 and 3 26 2.10 Typical corrected and uncorrected responses of reference sensors for light
and high winds 27 2.11 a) Four first SVD lines of setup 18 with the spectral bells for a 0.8 MAC
rejection level; b) SVD lines with standard deviation limits for the setups with and without high winds 28
2.12 Mode shapes found experimentally 28 2.13 Convergence of the damping ratios with the increase of data points used. . 29 2.14 Comparison of the pretest and updated model vibration frequencies with
the experimental ones 29 2.15 Comparison of the pretest and updated model vibration modes with the
experimental ones 30 2.16 Comparison of the MAC values for the pretest and updated models 30
3.1 3D view of the FE model 36 3.2 a) Typical storey plan of the tower sections; b) reinforcements details in a
typical beam 37
v
Reproduced with permission of the copyright owner. Further reproduction prohibited without permission.
3.3 Response spectra of the scaled ground motions 41 3.4 Both components of the scaled San Fernando ground motion records. ... 43 3.5 Roof displacement in both directions for the scaled San Fernando records
(in % of the total building height) 45 3.6 Lateral displacements and inter-storey drifts in both principal directions for
the scaled San Fernando records 46 3.7 Average, and inter-storey drift standard deviation interval for each ground
motion record sets 47 3.8 a) Pounding evidence between the high-rise part and the low-rise; b) Dama-
ged parking column; c) 10th storey columns on axis 5; d) Damaged beam attached to a wall 48
3.9 a) First floor displacement of column B2; b) Shear in column B2 with the different the concrete, steel and total column resistance; c) Shear demand (V/Vc) for both model 49
3.10 Moment-curvature curves of column F5, located at the 11th floor, under the scaled Northridge soil B - 100% ground motion record 51
3.11 Normalised average spalling demand ratio (^max/fsp) and normalised plas-tic hinging demand ratio (<pmax/<Py) of axis 5 columns in both principal directions 52
3.12 Normalised average spalling demand ratio (<pmax/lPap) and normalised plas-tic hinging demand ratio (ipmax/fy) for positive and negative moments for beam end at K5 and L4 53
3.13 Deformed shape of the building, in the Y-direction, under a seismic input. 55
vi
Reproduced with permission of the copyright owner. Further reproduction prohibited without permission.
LISTE DES TABLEAUX
2.1 Comparison between the experimental and the numerical natural periods of the first six vibration modes identified 16
2.2 Average damping ratios for all the acquisitions and for the five with high wind (values in %) 18
2.3 Material properties for the pretest model and the updated model 21
3.1 Experimental and numerical vibration periods 39 3.2 Response spectrum used 41 3.3 Ground motion acceleration records used 42 3.4 Peak and average roof displacements (in % of the total building height) for
the scaled San Fernando records 44
vii
Reproduced with permission of the copyright owner. Further reproduction prohibited without permission.
CHAPITRE 1 Introduction
Bien que les seismes de grande amplitude soient des evenements tres peu frequents, leurs consequences sont trop souvent catastrophiques, entrainant des degats materiels impor-tants et laissant parfois derriere eux des milliers de morts. Le risque sismique differe selon la region du globe. La sismicite elle-meme varie selon les regions, mais la vulnerabilite des humains causee par des constructions inadequates est un phenomene egalement tres repandu. C'est le concept de l'alea sismique (probability qu'un evenement d'une certaine magnitude arrive a un endroit donne pendant une periode donnee) versus le risque sis-mique. Le risque sismique integre a la fois la notion d'alea sismique et de vulnerabilite de la population.
L'augmentation de la proportion des humains habitant les grands centres urbains ne fait qu'accroitre ce risque. C'est le travail de l'ingenieur de voir a diminuer la vulnerabilite des structures. Les dernieres decennies ont fait place a d'importants developpements dans le domaine du genie parasismique. Afin de trouver des solutions pour attenuer ces risques, plusieurs equipes de recherche de partout dans le monde tentent de comprendre et de pre-dire le comportement de differents types de structures soumises a des charges sismiques. L'avancement des technologies, particulierement des ordinateurs personnels, a entraine une evolution incroyable du savoir des ingenieurs. Dans cette optique, bien que les seismes demeurent des evenements souvent desastreux, ils restent la meilleure source d'informa-tions pour la communaute scientifique. Les cas de la ville de Mexico (1985), ou l'effet des sols sur la reponse des structures a ete mis en avant-plan, et de Northridge (1994), ou la rupture fragile de plusieurs connexions en acier nous a apporte a revoir nos fagons de faire, ne sont que deux exemples.
Les legons tirees des recents tremblements de terre ont permis de confirmer des connais-sances, mais surtout de reveler plusieurs autres parametres importants concernant la
1
Reproduced with permission of the copyright owner. Further reproduction prohibited without permission.
conception des structures. Dans les dernieres annees, chaque seisme majeur a mene a plusieurs travaux de recherche qui ont permis d'ameliorer les differents codes de construc-tion. Leur efficacite a ete confirmee en comparant les dommages entre les batiments congus avec ces nouveaux codes et les batiments plus anciens. Malgre le niveau de connaissance de plus en plus important de la communaute scientifique, les consequences devastatrices des tremblements de terre se font malheureusement toujours sentir.
Le 12 janvier 2010, un puissant seisme de magnitude 7.0 (magnitude du moment Mw) a touche Haiti, causant plus de 200 000 morts et 1,5 million de sans-abris. La capitale du pays, Port-au-Prince, a ete particulierement touchee. La proximite de l'epicentre de cette population extremement vulnerable est sans aucun doute la cause de l'ampleur de la catastrophe. La sismicite de la region combinee a l'absence de codes de construction et de materiaux de mauvaise qualite explique le risque sismique immense qui hante cette region.
Malgre la violence et les dommages inestimables des evenements de janvier 2010, certains batiments se sont bien comportes. C'est le cas de la tour Digicel, un batiment de 12 etages en beton arme, construit en 2006 et dimensionne selon la norme americaine ACI 318-05. Situe dans un quartier pratiquement totalement detruit, le batiment n'a subi que des dommages reparables et est reste operationnel. Cet ouvrage confirme qu'il est possible de concevoir des batiments capables de resister a de puissants seismes.
L'acces au batiment de la compagnie Digicel a ete rendu possible par les proprietaries, fournissant une opportunity unique d'evaluer son comportement dynamique et de com-prendre la repartition des dommages. Des essais sous vibration ambiantes suivis de la calibration de modele par elements finis ont permis de bien comprendre son comporte-ment dynamique et d'avoir en main un modele fidele a la structure telle que construite. Des analyses numeriques non-lineaires ont permis ensuite de reproduire numeriquement les evenements pour ainsi evaluer la capacite des outils numeriques de bien predire de tels seismes, de comprendre les dommages et d'estimer la puissance du seisme du 12 janvier 2010.
Le present document est divise en deux parties distinctes qui correspondent respectivement a deux articles soumis a la Revue canadienne de genie civil. Ces articles decrivent la totalite des presents travaux de recherche. Le premier article (Chapitre 2) presente le batiment a l'etude, les etudes semblables, les essais in situ et la calibration de modeles par elements finis effectuee. Le deuxieme article (Chapitre 3) decrit le modele utilise pour les analyses non-lineaires ainsi que les resultats obtenus.
2
Reproduced with permission of the copyright owner. Further reproduction prohibited without permission.
CHAPITRE 2
Essais in situ et analyse du comportement dynamique
Avant-propos Auteurs et affiliation :
B. Boulanger : etudiant a la maitrise, Universite de Sherbrooke, Faculte de genie, Departement de genie civil. C.-P. Lamarche : professeur, Universite de Sherbrooke, Faculte de genie, Departement de genie civil. J. Proulx : professeur, Universite de Sherbrooke, Faculte de genie, Departement de genie civil. P. Paultre : professeur, Universite de Sherbrooke, Faculte de genie, Departement de genie civil.
Date de soumission : 7 mars 2012
Revue : Revue Canadienne de Genie Civil
Etat de l'acceptation : Article soumis
Titre en frangais : Analyse d'un batiment multi-etage en beton arme endommage lors du seisme d'Haiti du 12 janvier 2010. Partie I : Analyse du comportement dynamique
Contribution au document : Cet article decrit l'ensemble de la partie experimental des presents travaux de recherche. II decrit le batiment a l'etude, les essais in situ effectues et la premiere partie de la modelisation numerique de la structure, soit les analyses lineaires.
3
Reproduced with permission of the copyright owner. Further reproduction prohibited without permission.
Cet article presente aussi la theorie et d'autres travaux semblables. Une comparaison entre les resultats numeriques et experimentaux est aussi presentee.
Resume frangais : Malgre la destruction massive survenue lors du seisme d'Haiti en 2010, le batiment de 12 etages en beton arme de Digicel a bien resiste, ne subissant que des dommages reparables. devaluation de sa structure ainsi qu'une serie d'essais sous vibrations ambiantes ont permis de caracteriser son comportement dynamique (frequences propres, modes propres et amortissement). Des modeles par elements finis sur ETABS, avant et apres les essais, ont permis d'evaluer la capacite de prediction des techniques de modelisation courantes. Une calibration manuelle a ensuite permis d'elaborer un modele numerique representant bien le comportement reel du batiment. Cette etude a montre que la methode des elements finis permet de bien representer le comportement dynamique de structures, mais est tres sensible aux hypotheses utilisees. II a aussi ete observe qu'un modele peut fidelement predire les frequences propres d'une structure sans pour autant representer fidelement son comportement dynamique (modes propres). Une calibration efficace a ete necessaire afin d'avoir un modele representant bien le comportement du batiment.
Note : A la suite des corrections demandees par le jury, le contenu de cet article differe de celui qui a ete soumis.
4
Reproduced with permission of the copyright owner. Further reproduction prohibited without permission.
Analysis of a damaged 12-storey frame-wall concrete
building during the 2010 Haiti earthquake.
Part I : Dynamic behaviour assessment
Abstract
Despite all the damages encountered during the 2010 Haiti earthquake, the 12-storey reinforced-concrete Digicel building behaved well, sustaining only reparable damages. Vi-sual assessment and ambient vibration tests were carried out to characterize the damages sustained and to identify the building's key dynamics properties (natural vibration fre-quencies, mode shapes, and damping ratios). ETABS was used to generate FE models before and after the AVT to evaluate the capabilities of common modelling assumptions to predict the dynamic behaviour of structures. Manual model updating was carried out to present a model representing the building's actual dynamic behaviour. The study showed that the FE method is reliable for predicting the dynamic behaviour of structures, but is very sensitive to the assumptions used during modelling. The model could predict the vibration frequencies precisely, but an accurate representation of the mode shapes required careful model updating.
2.1 Introduction
Advances in earthquake engineering during the last few decades have been driven by experimental and theoretical research, and, more importantly, by the lessons learned during the actual seismic events. The cases of Mexico City (1985), where soil-structure interaction was a key factor, and of Northridge (1994), where fragile steel connections were observed, are two well-known examples.
The M7.0 earthquake that struck Haiti on January 12, 2010 left the capital city Port-au-Prince in a state of massive destruction. Government estimates place the earthquake's death toll at more than 300 000. In addition, 1.5 million people were left homeless and over 500 000 displaced. The epicentre's proximity to the vulnerable population of Port-au-Prince was directly related to the extent of damage [Paultre et al., 2012], The vulnerability of this population living in an active seismic zone can also be explained by the lack of adequate seismic design codes, poor construction techniques, and inconsistency in the materials quality.
5
Reproduced with permission of the copyright owner. Further reproduction prohibited without permission.
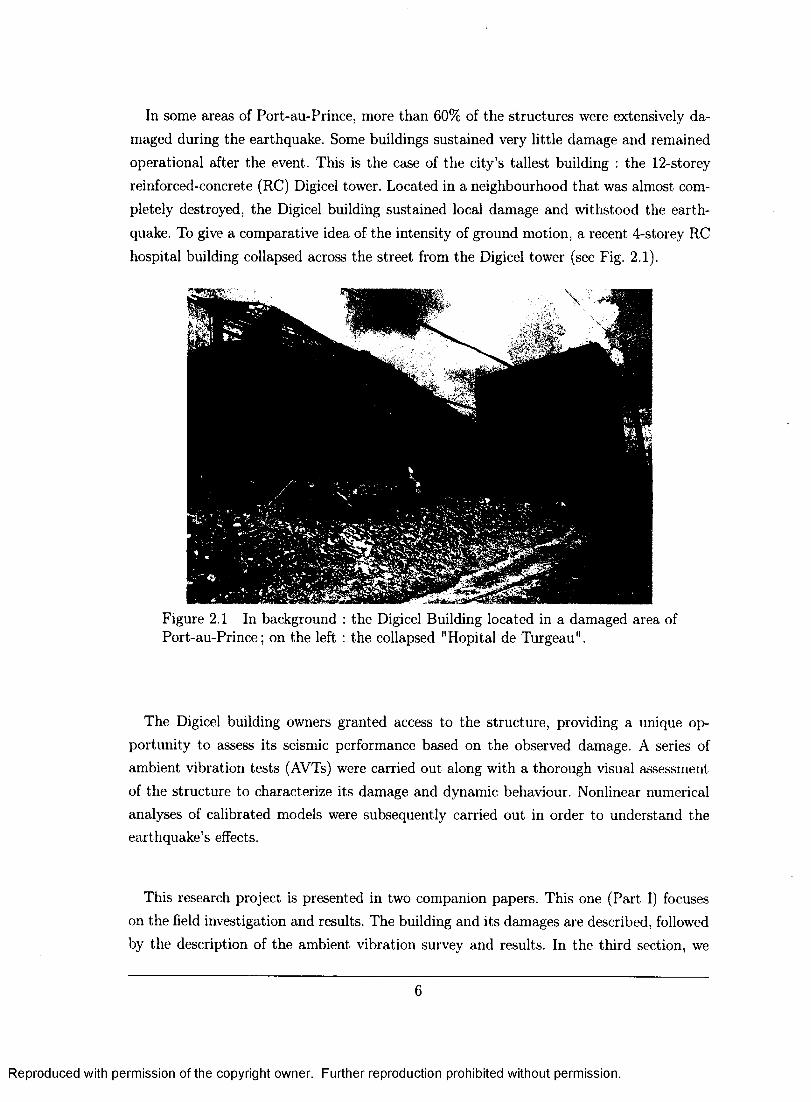
In some areas of Port-au-Prince, more than 60% of the structures were extensively da-maged during the earthquake. Some buildings sustained very little damage and remained operational after the event. This is the case of the city's tallest building : the 12-storey reinforced-concrete (RC) Digicel tower. Located in a neighbourhood that was almost com-pletely destroyed, the Digicel building sustained local damage and withstood the earth-quake. To give a comparative idea of the intensity of ground motion, a recent 4-storey RC hospital building collapsed across the street from the Digicel tower (see Fig. 2.1).
Figure 2.1 In background : the Digicel Building located in a damaged area of Port-au-Prince; on the left : the collapsed "Hopital de Turgeau".
The Digicel building owners granted access to the structure, providing a unique op-portunity to assess its seismic performance based on the observed damage. A series of ambient vibration tests (AVTs) were carried out along with a thorough visual assessment of the structure to characterize its damage and dynamic behaviour. Nonlinear numerical analyses of calibrated models were subsequently carried out in order to understand the earthquake's effects.
This research project is presented in two companion papers. This one (Part I) focuses on the field investigation and results. The building and its damages are described, followed by the description of the ambient vibration survey and results. In the third section, we
Reproduced with permission of the copyright owner. Further reproduction prohibited without permission.
6
investigate the effects of both structural and non-structural components on the dynamic response by calibrating finite-element models with the experimental data.
The objectives of this work were to characterize the damages sustained by the 12-storey building, identify the building's key dynamics properties (natural vibration frequencies, mode shapes, and damping ratios) and generate a finite-element model representative of the "true" structure, as built, based on the ambient-vibration-test results and a thorough inspection.
2.2 The Digicel Building
2.2.1 Building Description
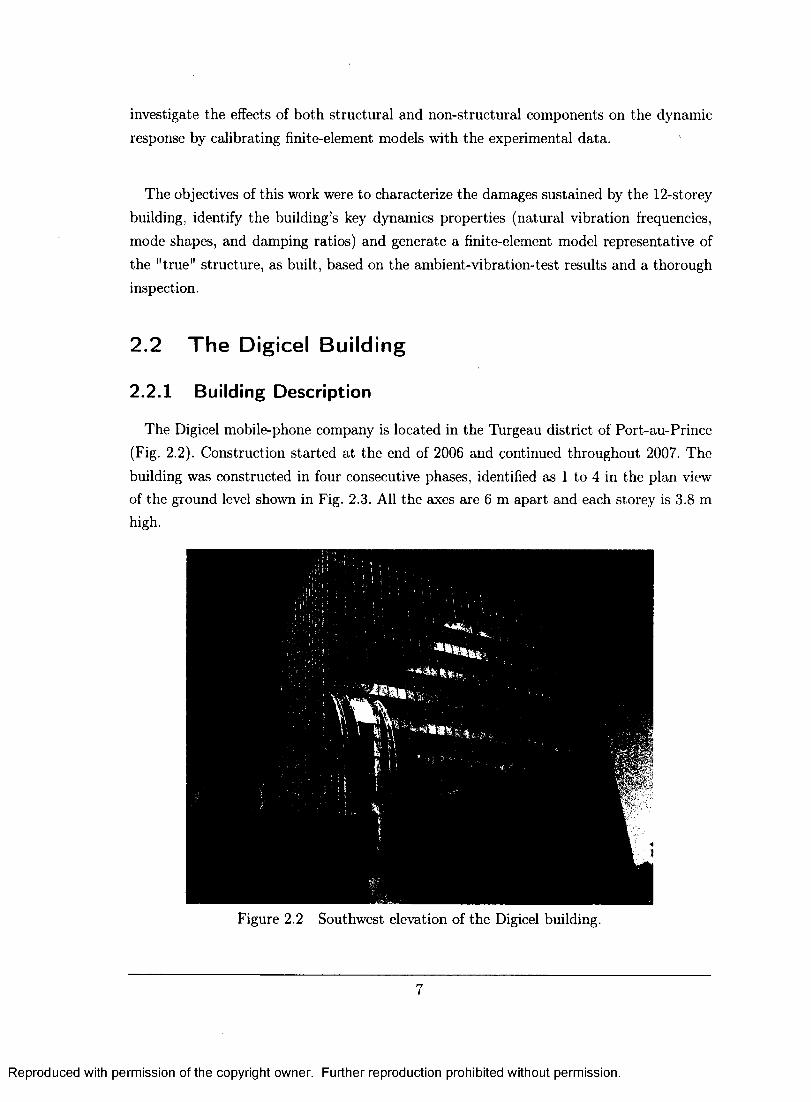
The Digicel mobile-phone company is located in the Turgeau district of Port-au-Prince (Fig. 2.2). Construction started at the end of 2006 and continued throughout 2007. The building was constructed in four consecutive phases, identified as 1 to 4 in the plan view of the ground level shown in Fig. 2.3. All the axes are 6 m apart and each storey is 3.8 m high.
Figure 2.2 Southwest elevation of the Digicel building.
7
Reproduced with permission of the copyright owner. Further reproduction prohibited without permission.
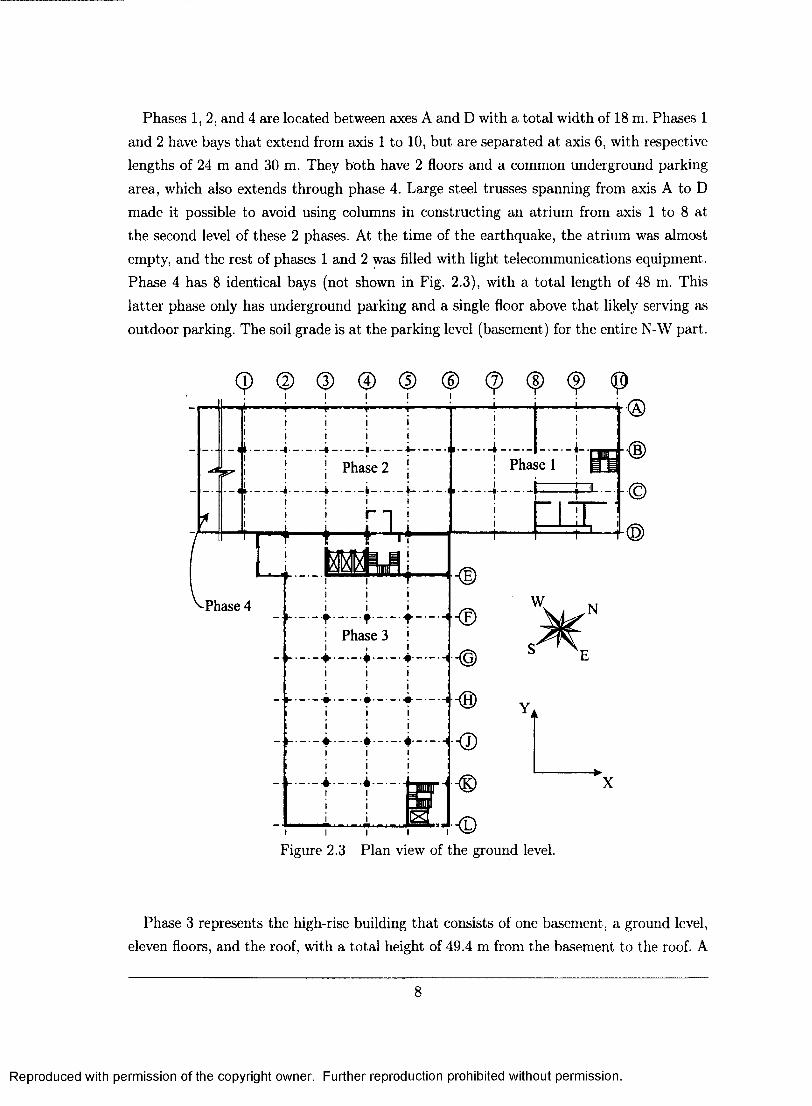
Phases 1, 2, and 4 are located between axes A and D with a total width of 18 m. Phases 1 and 2 have bays that extend from axis 1 to 10, but are separated at axis 6, with respective lengths of 24 m and 30 m. They both have 2 floors and a common underground parking area, which also extends through phase 4. Large steel trusses spanning from axis A to D made it possible to avoid using columns in constructing an atrium from axis 1 to 8 at the second level of these 2 phases. At the time of the earthquake, the atrium was almost empty, and the rest of phases 1 and 2 was filled with light telecommunications equipment. Phase 4 has 8 identical bays (not shown in Fig. 2.3), with a total length of 48 m. This latter phase only has underground parking and a single floor above that likely serving as outdoor parking. The soil grade is at the parking level (basement) for the entire N-W part.
( p ( D ( D 0 ( 5 ) ( 6 ) ( 7 ) ( | ) ( 9 ) ( p >
<S>
© I
i i
Phase 2
I—?—r-L..J i— n
Phase 1
_ 4m
P M j V Phase 4
•t -! Phase 3
T"
i - f -
* *
± 4.
<E>
-©
<D
w
Figure 2.3 Plan view of the ground level.
N
X
Phase 3 represents the high-rise building that consists of one basement, a ground level, eleven floors, and the roof, with a total height of 49.4 m from the basement to the roof. A
8
Reproduced with permission of the copyright owner. Further reproduction prohibited without permission.
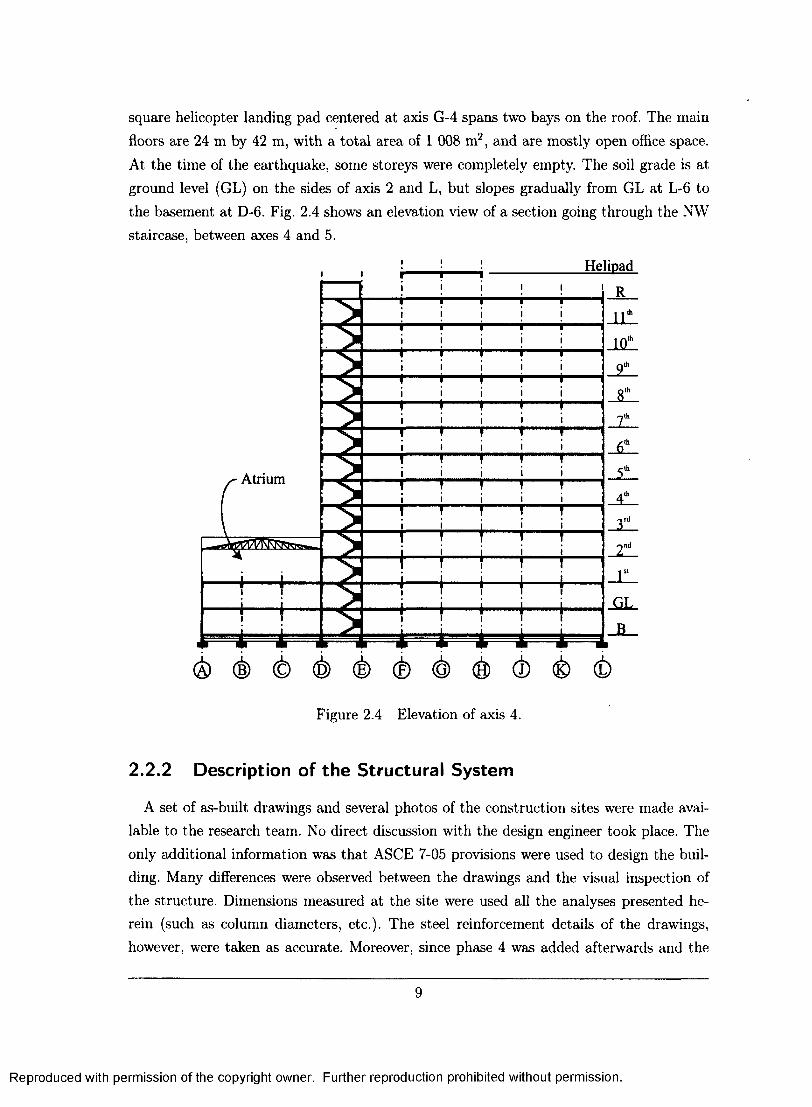
square helicopter landing pad centered at axis G-4 spans two bays on the roof. The main floors are 24 m by 42 m, with a total area of 1 008 m2, and are mostly open office space. At the time of the earthquake, some storeys were completely empty. The soil grade is at ground level (GL) on the sides of axis 2 and L, but slopes gradually from GL at L-6 to the basement at D-6. Fig. 2.4 shows an elevation view of a section going through the NW staircase, between axes 4 and 5.
Helipad
Atnum
Figure 2.4 Elevation of axis 4.
2.2.2 Description of the Structural System
A set of as-built drawings and several photos of the construction sites were made avai-lable to the research team. No direct discussion with the design engineer took place. The only additional information was that ASCE 7-05 provisions were used to design the buil-ding. Many differences were observed between the drawings and the visual inspection of the structure. Dimensions measured at the site were used all the analyses presented he-rein (such as column diameters, etc.). The steel reinforcement details of the drawings, however, were taken as accurate. Moreover, since phase 4 was added afterwards and the
9
Reproduced with permission of the copyright owner. Further reproduction prohibited without permission.
drawings were not available, the necessary information was obtained by visual assessment and on-site measurements.
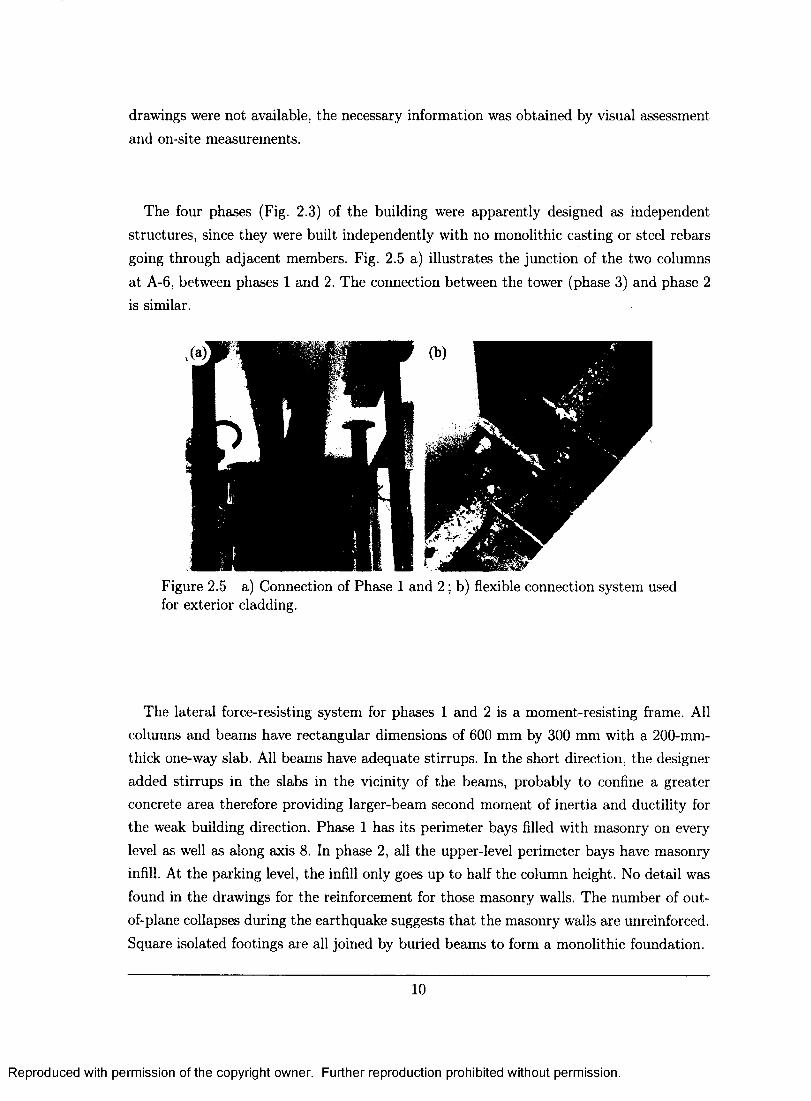
The four phases (Fig. 2.3) of the building were apparently designed as independent structures, since they were built independently with no monolithic casting or steel rebars going through adjacent members. Fig. 2.5 a) illustrates the junction of the two columns at A-6, between phases 1 and 2. The connection between the tower (phase 3) and phase 2 is similar.
Figure 2.5 a) Connection of Phase 1 and 2 ; b) flexible connection system used for exterior cladding.
The lateral force-resisting system for phases 1 and 2 is a moment-resisting frame. All columns and beams have rectangular dimensions of 600 mm by 300 mm with a 200-mm-thick one-way slab. All beams have adequate stirrups. In the short direction, the designer added stirrups in the slabs in the vicinity of the beams, probably to confine a greater concrete area therefore providing larger-beam second moment of inertia and ductility for the weak building direction. Phase 1 has its perimeter bays filled with masonry on every level as well as along axis 8. In phase 2, all the upper-level perimeter bays have masonry infill. At the parking level, the infill only goes up to half the column height. No detail was found in the drawings for the reinforcement for those masonry walls. The number of out-of-plane collapses during the earthquake suggests that the masonry walls are unreinforced. Square isolated footings are all joined by buried beams to form a monolithic foundation.
10
Reproduced with permission of the copyright owner. Further reproduction prohibited without permission.
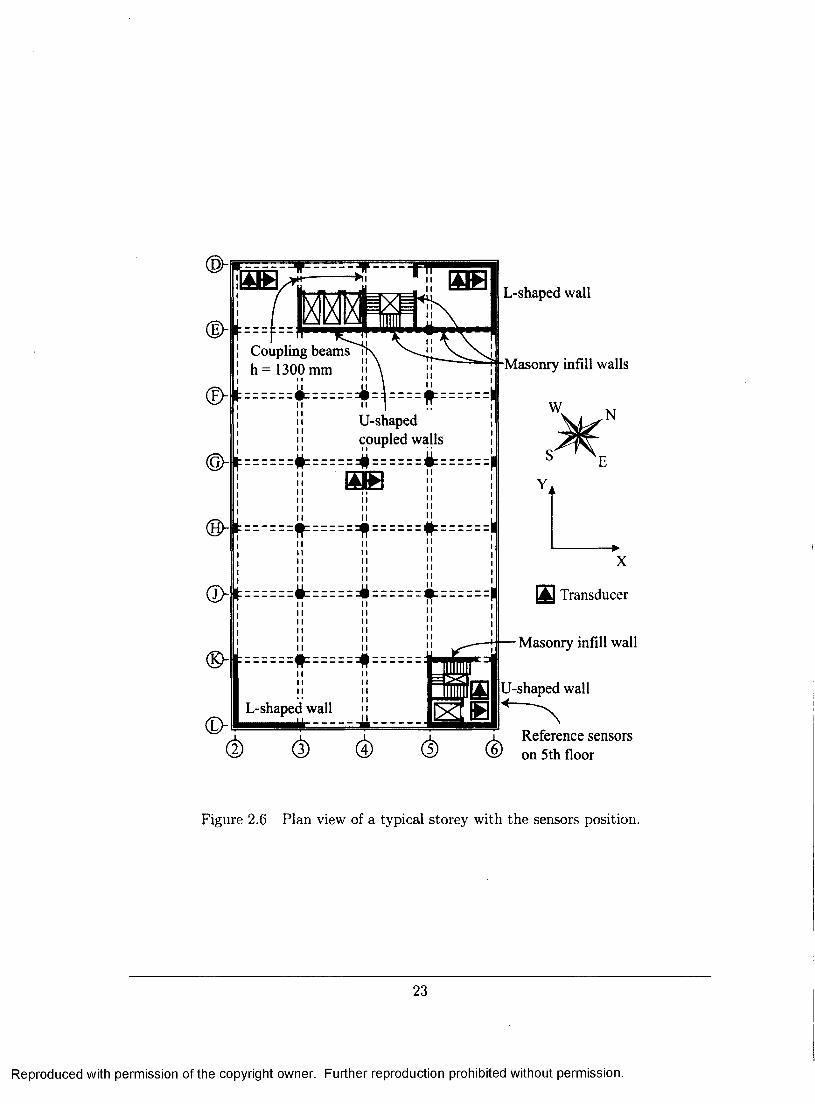
The tower's structure (phase 3) is a dual system of moment frames and shear walls acting together to resist lateral loads (Fig. 2.6). L-shaped walls are present at the north and south corners. U-shaped walls enclosing a staircase and an elevator are found at the east corner, with a door opening on the ground level along axis L. The U-shaped wall is closed by a masonry infill wall along axis K. At the west corner, U-shaped walls enclosing the elevator shafts have been placed in the second bay for architectural considerations. Their open side faces NW; doors on axis 3 and 4 provide access to the elevator shaft. This yields a system of U-shaped walls coupled with two T-shaped columns. From the basement to the seventh floor, the beams are 400 mm wide, changing to 300 mm for the remaining storey. All beams are 600 mm deep, including the 200-mm-thick slabs, which are identical on all floors. All walls are 300-mm-thick. For the bottom parts, all perimeter columns measure 400 mm by 800 mm, reduced to 300 mm by 600 mm on the upper floors. All the interior columns are circular with diameters varying from 800 mm at the basement to 500 mm on the top floors. Infill walls are present on all floors near the north shear walls, as illustrated in Fig. 2.6.
Apart from the infill walls shown in Fig. 2.6, very few interior partitions are present. Most of the offices consist of movable partitions or gypsum wallboard, which are not likely to influence the dynamic behaviour of the whole building. The exterior cladding consists of a light glass wall attached outside the structure with a connection system of slotted holes that allow a certain amount of movement (Fig. 2.5 b)). This system was chosen to make up for structural defects. This building is therefore an ideal candidate for a research project because the non-structural components have very limited effect on the structure's overall stiffness. On the other hand, material uniformity and quality are uncertain parameters in this project. Studies of finite-element-model updating of buildings in Vancouver revealed that material properties can be off expected values by more than 50% [Ventura et al., 2005]. Such variations are most certainly greater in Haiti, since material quality controls aren't as strict there as in industrialized countries. This uncertainty may also apply to steel-rebar detailing.
2.2.3 Description of the Observed Damages
As in most buildings subject to strong ground accelerations, a lot of non-structural damage took place in the highest part of the tower. The failure of the suspended ceilings and the tumbling of many desks and bookcases produced chaotic post-quake scenes. The exterior cladding's flexible connection system saved almost all of the exterior windows.
11
Reproduced with permission of the copyright owner. Further reproduction prohibited without permission.
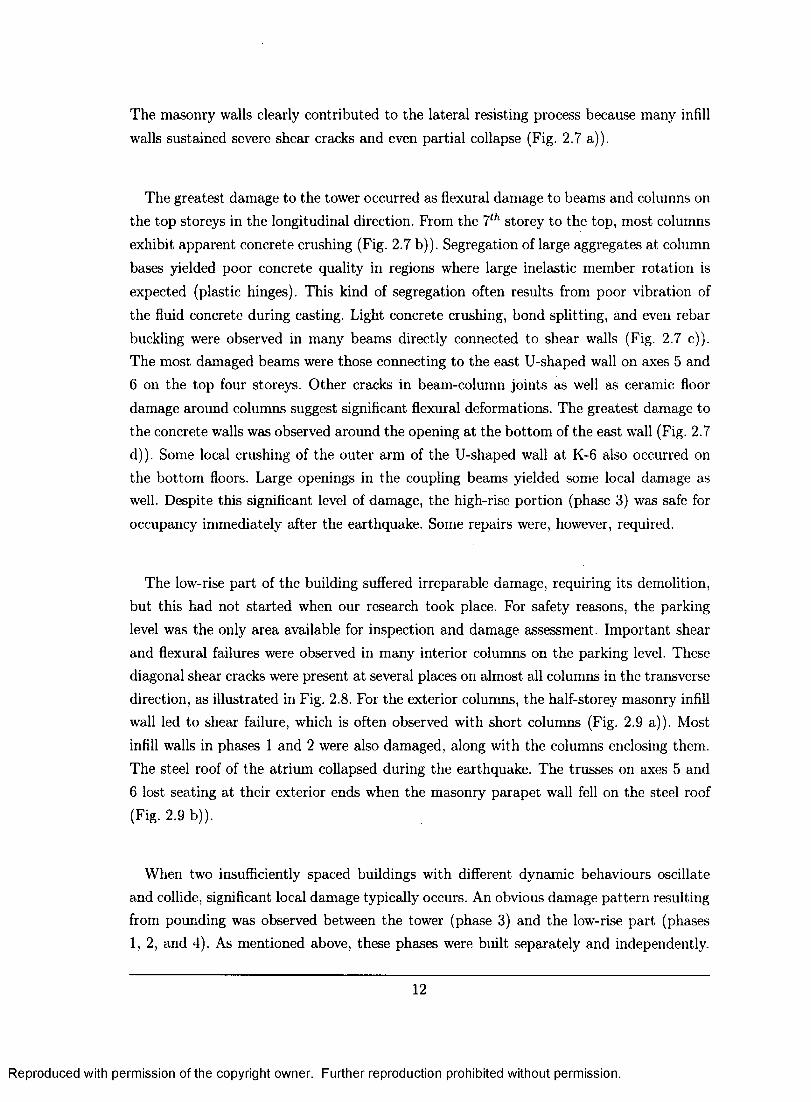
The masonry walls clearly contributed to the lateral resisting process because many infill walls sustained severe shear cracks and even partial collapse (Fig. 2.7 a)).
The greatest damage to the tower occurred as flexural damage to beams and columns on the top storeys in the longitudinal direction. From the 7th storey to the top, most columns exhibit apparent concrete crushing (Fig. 2.7 b)). Segregation of large aggregates at column bases yielded poor concrete quality in regions where large inelastic member rotation is expected (plastic hinges). This kind of segregation often results from poor vibration of the fluid concrete during casting. Light concrete crushing, bond splitting, and even rebar buckling were observed in many beams directly connected to shear walls (Fig. 2.7 c)). The most damaged beams were those connecting to the east U-shaped wall on axes 5 and 6 on the top four storeys. Other cracks in beam-column joints as well as ceramic floor damage around columns suggest significant flexural deformations. The greatest damage to the concrete walls was observed around the opening at the bottom of the east wall (Fig. 2.7 d)). Some local crushing of the outer arm of the U-shaped wall at K-6 also occurred on the bottom floors. Large openings in the coupling beams yielded some local damage as well. Despite this significant level of damage, the high-rise portion (phase 3) was safe for occupancy immediately after the earthquake. Some repairs were, however, required.
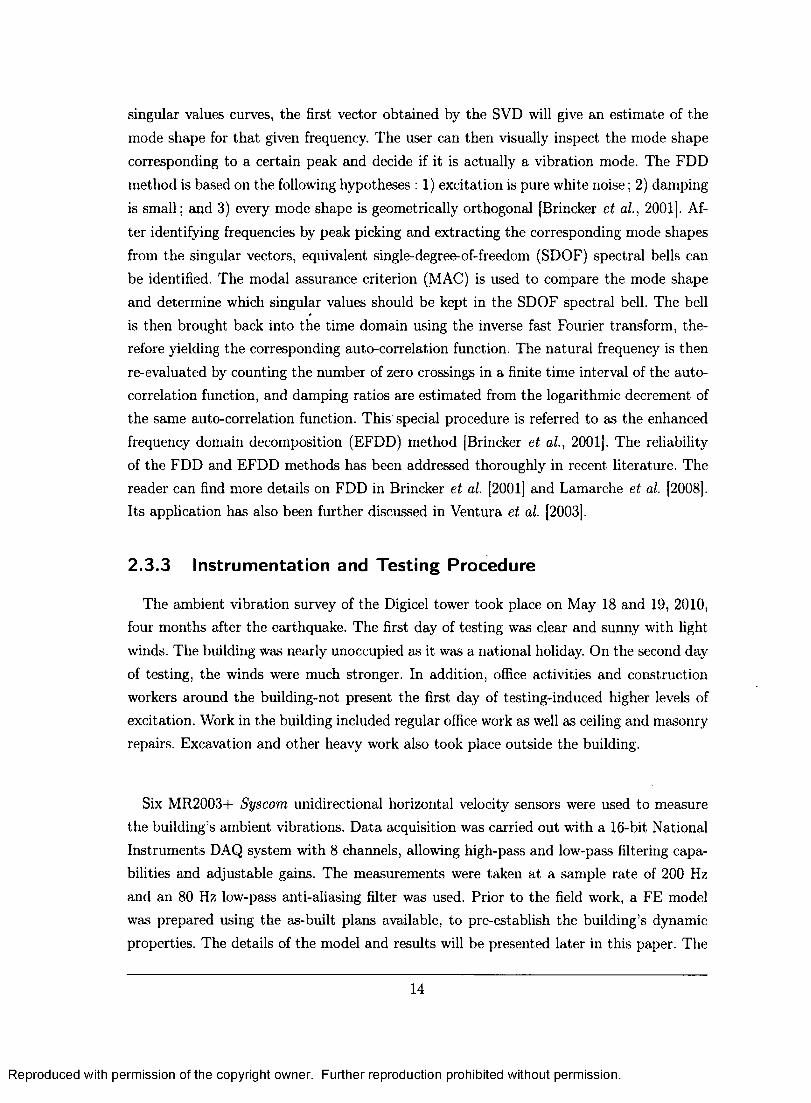
The low-rise part of the building suffered irreparable damage, requiring its demolition, but this had not started when our research took place. For safety reasons, the parking level was the only area available for inspection and damage assessment. Important shear and flexural failures were observed in many interior columns on the parking level. These diagonal shear cracks were present at several places on almost all columns in the transverse direction, as illustrated in Fig. 2.8. For the exterior columns, the half-storey masonry infill wall led to shear failure, which is often observed with short columns (Fig. 2.9 a)). Most infill walls in phases 1 and 2 were also damaged, along with the columns enclosing them. The steel roof of the atrium collapsed during the earthquake. The trusses on axes 5 and 6 lost seating at their exterior ends when the masonry parapet wall fell on the steel roof (Fig. 2.9 b)).
When two insufficiently spaced buildings with different dynamic behaviours oscillate and collide, significant local damage typically occurs. An obvious damage pattern resulting from pounding was observed between the tower (phase 3) and the low-rise part (phases 1, 2, and 4). As mentioned above, these phases were built separately and independently.
12
Reproduced with permission of the copyright owner. Further reproduction prohibited without permission.
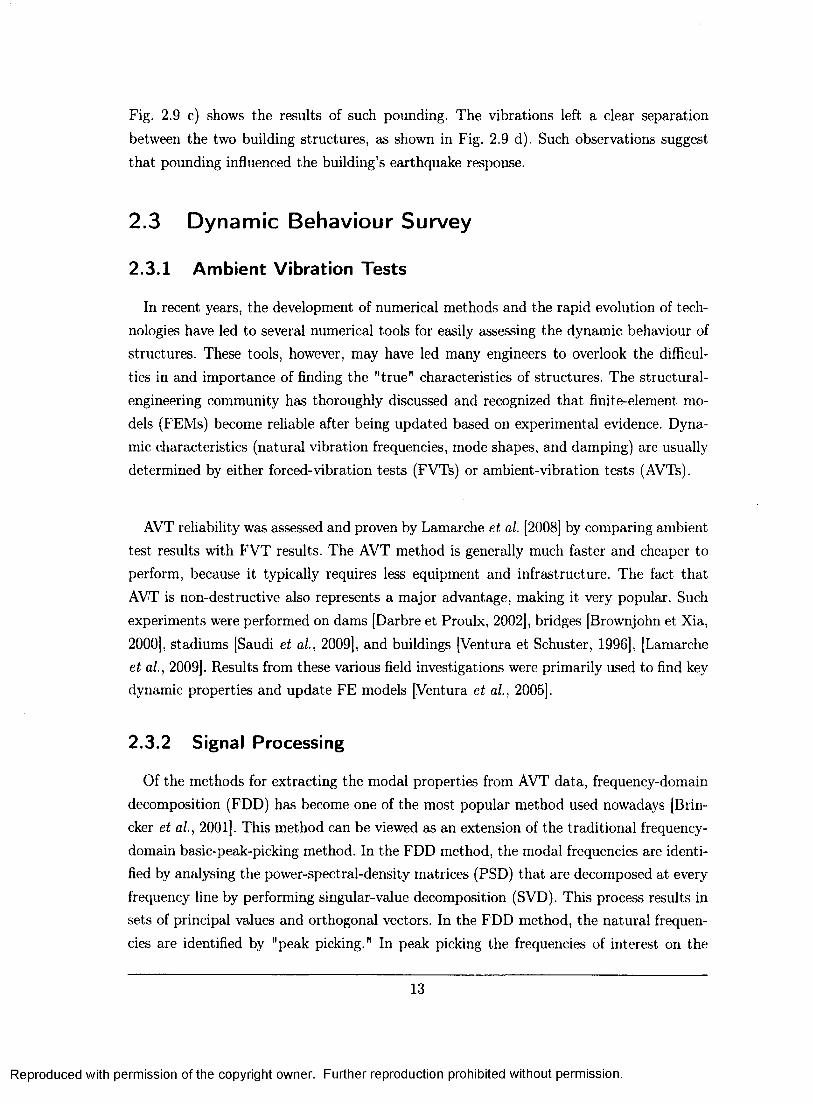
Fig. 2.9 c) shows the results of such pounding. The vibrations left a clear separation between the two building structures, as shown in Fig. 2.9 d). Such observations suggest that pounding influenced the building's earthquake response.
2.3 Dynamic Behaviour Survey
2.3.1 Ambient Vibration Tests
In recent years, the development of numerical methods and the rapid evolution of tech-nologies have led to several numerical tools for easily assessing the dynamic behaviour of structures. These tools, however, may have led many engineers to overlook the difficul-ties in and importance of finding the "true" characteristics of structures. The structural-engineering community has thoroughly discussed and recognized that finite-element mo-dels (FEMs) become reliable after being updated based on experimental evidence. Dyna-mic characteristics (natural vibration frequencies, mode shapes, and damping) are usually determined by either forced-vibration tests (FVTs) or ambient-vibration tests (AVTs).
AVT reliability was assessed and proven by Lamarche et al. [2008] by comparing ambient test results with FVT results. The AVT method is generally much faster and cheaper to perform, because it typically requires less equipment and infrastructure. The fact that AVT is non-destructive also represents a major advantage, making it very popular. Such experiments were performed on dams [Darbre et Proulx, 2002], bridges [Brownjohn et Xia, 2000], stadiums [Saudi et al., 2009], and buildings [Ventura et Schuster, 1996], [Lamarche et al., 2009]. Results from these various field investigations were primarily used to find key dynamic properties and update FE models [Ventura et al., 2005].
2.3.2 Signal Processing
Of the methods for extracting the modal properties from AVT data, frequency-domain decomposition (FDD) has become one of the most popular method used nowadays [Brin-cker et al., 2001]. This method can be viewed as an extension of the traditional frequency-domain basic-peak-picking method. In the FDD method, the modal frequencies are identi-fied by analysing the power-spectral-density matrices (PSD) that are decomposed at every frequency line by performing singular-value decomposition (SVD). This process results in sets of principal values and orthogonal vectors. In the FDD method, the natural frequen-cies are identified by "peak picking." In peak picking the frequencies of interest on the
13
Reproduced with permission of the copyright owner. Further reproduction prohibited without permission.
singular values curves, the first vector obtained by the SVD will give an estimate of the mode shape for that given frequency. The user can then visually inspect the mode shape corresponding to a certain peak and decide if it is actually a vibration mode. The FDD method is based on the following hypotheses : 1) excitation is pure white noise; 2) damping is small; and 3) every mode shape is geometrically orthogonal [Brincker et al, 2001]. Af-ter identifying frequencies by peak picking and extracting the corresponding mode shapes from the singular vectors, equivalent single-degree-of-freedom (SDOF) spectral bells can be identified. The modal assurance criterion (MAC) is used to compare the mode shape and determine which singular values should be kept in the SDOF spectral bell. The bell is then brought back into the time domain using the inverse fast Fourier transform, the-refore yielding the corresponding auto-correlation function. The natural frequency is then re-evaluated by counting the number of zero crossings in a finite time interval of the auto-correlation function, and damping ratios are estimated from the logarithmic decrement of the same auto-correlation function. This special procedure is referred to as the enhanced frequency domain decomposition (EFDD) method [Brincker et al., 2001]. The reliability of the FDD and EFDD methods has been addressed thoroughly in recent literature. The reader can find more details on FDD in Brincker et al. [2001] and Lamarche et al. [2008]. Its application has also been further discussed in Ventura et al. [2003].
2.3.3 Instrumentation and Testing Procedure
The ambient vibration survey of the Digicel tower took place on May 18 and 19, 2010, four months after the earthquake. The first day of testing was clear and sunny with light winds. The building was nearly unoccupied as it was a national holiday. On the second day of testing, the winds were much stronger. In addition, office activities and construction workers around the building-not present the first day of testing-induced higher levels of excitation. Work in the building included regular office work as well as ceiling and masonry repairs. Excavation and other heavy work also took place outside the building.
Six MR2003+ Syscom unidirectional horizontal velocity sensors were used to measure the building's ambient vibrations. Data acquisition was carried out with a 16-bit National Instruments DAQ system with 8 channels, allowing high-pass and low-pass filtering capa-bilities and adjustable gains. The measurements were taken at a sample rate of 200 Hz and an 80 Hz low-pass anti-aliasing filter was used. Prior to the field work, a FE model was prepared using the as-built plans available, to pre-establish the building's dynamic properties. The details of the model and results will be presented later in this paper. The
14
Reproduced with permission of the copyright owner. Further reproduction prohibited without permission.
FE model helped us determine where to place the reference sensors and to plan efficient configuration patterns. Based on the FE-model mode shapes, we decided to place the re-ference sensors at the east corner (axis L-6) of the fifth floor. The roof was not an option due to cable-length considerations. This location was chosen to get both translational and torsional modes, and because it was not located on any mode shape nodes. The other four sensors were moved around the building to accurately describe the mode shapes. Two configurations of four sensors per floor were used to record data at three corners and at the geometrical centre in both horizontal directions (Fig. 2.6). The acquisition time was set to 10 minutes per configuration, corresponding to approximately 400 times the first vibra-tion period obtained numerically. This value is within the recommended range discussed by Lamarche [2005].
2.3.4 Test Results
Time Domain Results
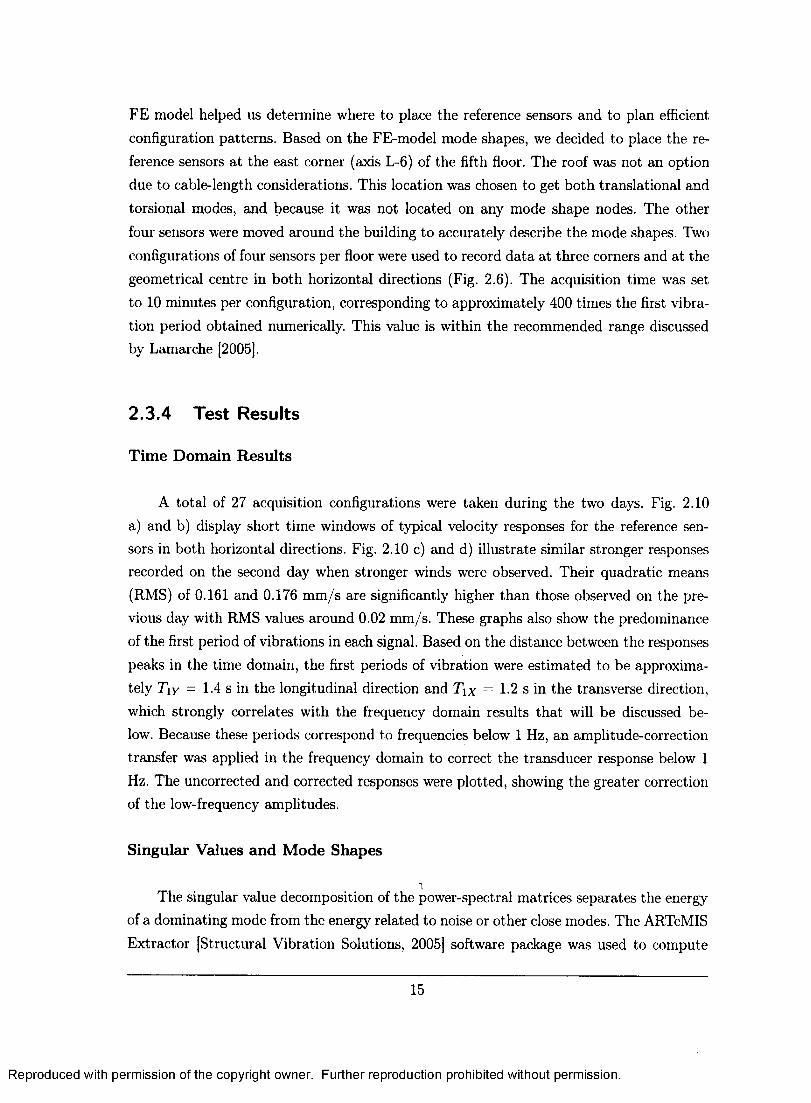
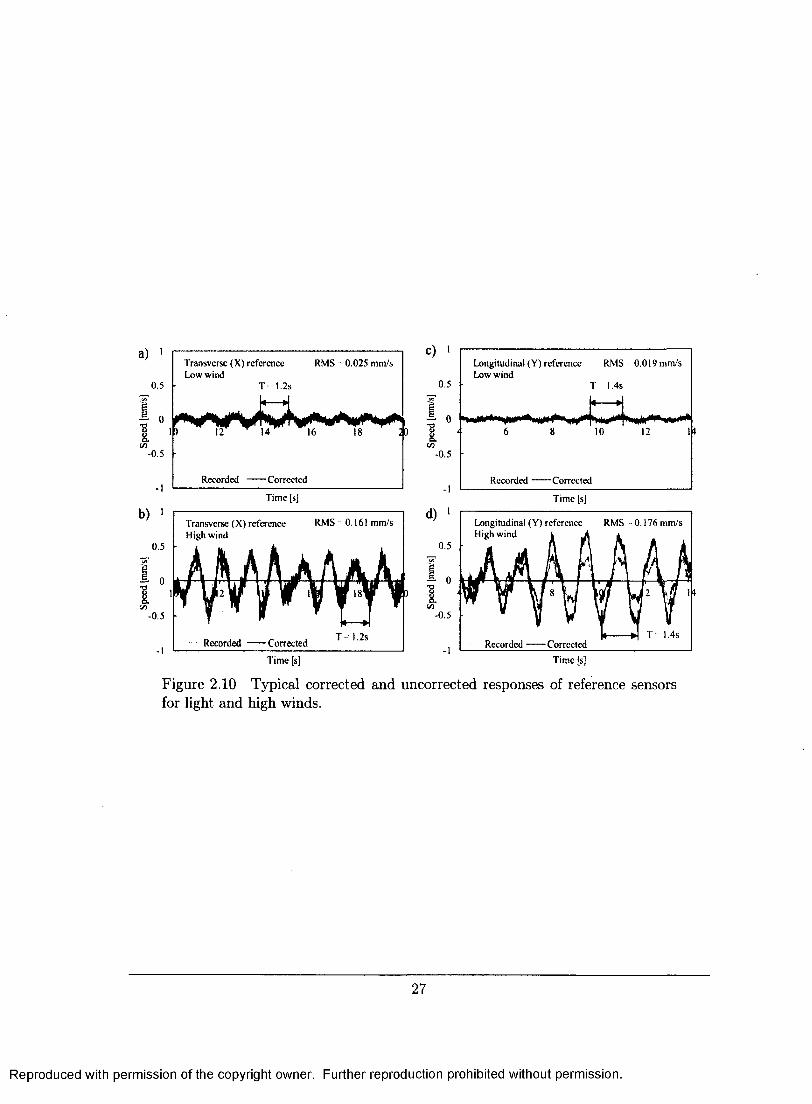
A total of 27 acquisition configurations were taken during the two days. Fig. 2.10 a) and b) display short time windows of typical velocity responses for the reference sen-sors in both horizontal directions. Fig. 2.10 c) and d) illustrate similar stronger responses recorded on the second day when stronger winds were observed. Their quadratic means (RMS) of 0.161 and 0.176 mm/s are significantly higher than those observed on the pre-vious day with RMS values around 0.02 mm/s. These graphs also show the predominance of the first period of vibrations in each signal. Based on the distance between the responses peaks in the time domain, the first periods of vibration were estimated to be approxima-tely T\y = 1.4 s in the longitudinal direction and Tvx = 1.2 s in the transverse direction, which strongly correlates with the frequency domain results that will be discussed be-low. Because these periods correspond to frequencies below 1 Hz, an amplitude-correction transfer was applied in the frequency domain to correct the transducer response below 1 Hz. The uncorrected and corrected responses were plotted, showing the greater correction of the low-frequency amplitudes.
Singular Values and Mode Shapes
1 The singular value decomposition of the power-spectral matrices separates the energy
of a dominating mode from the energy related to noise or other close modes. The ARTeMIS Extractor [Structural Vibration Solutions, 2005] software package was used to compute
15
Reproduced with permission of the copyright owner. Further reproduction prohibited without permission.
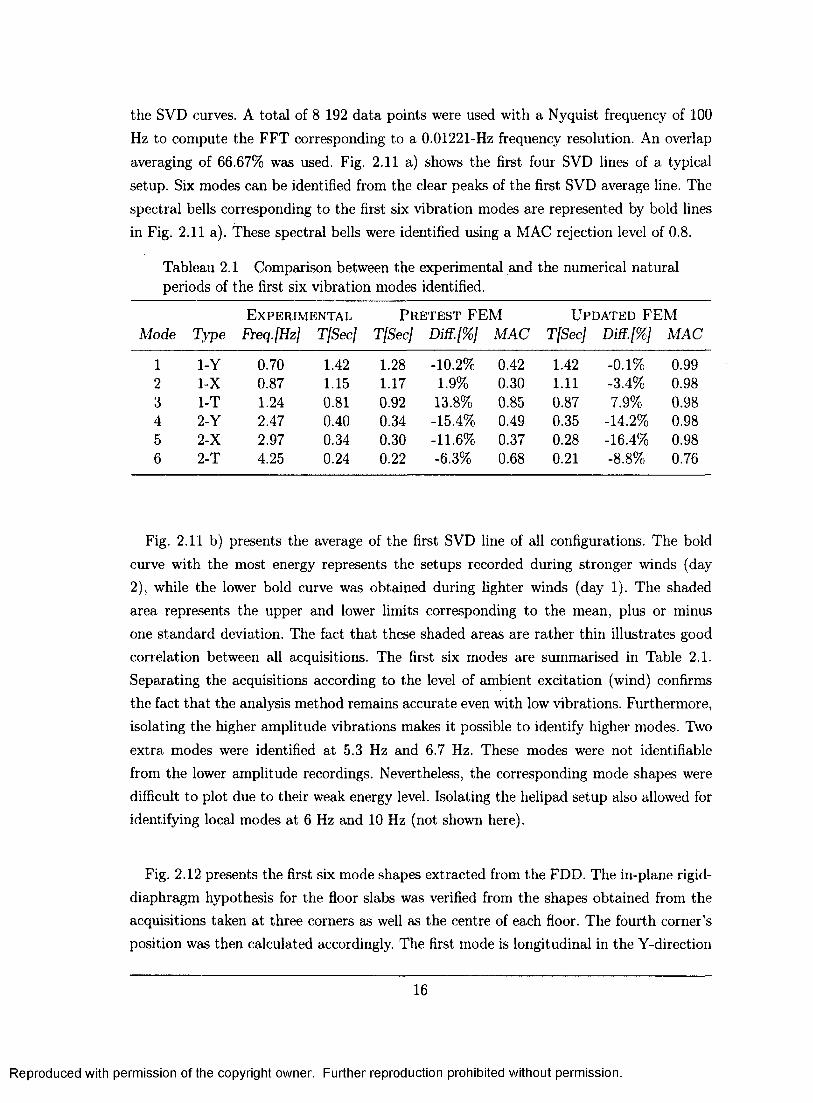
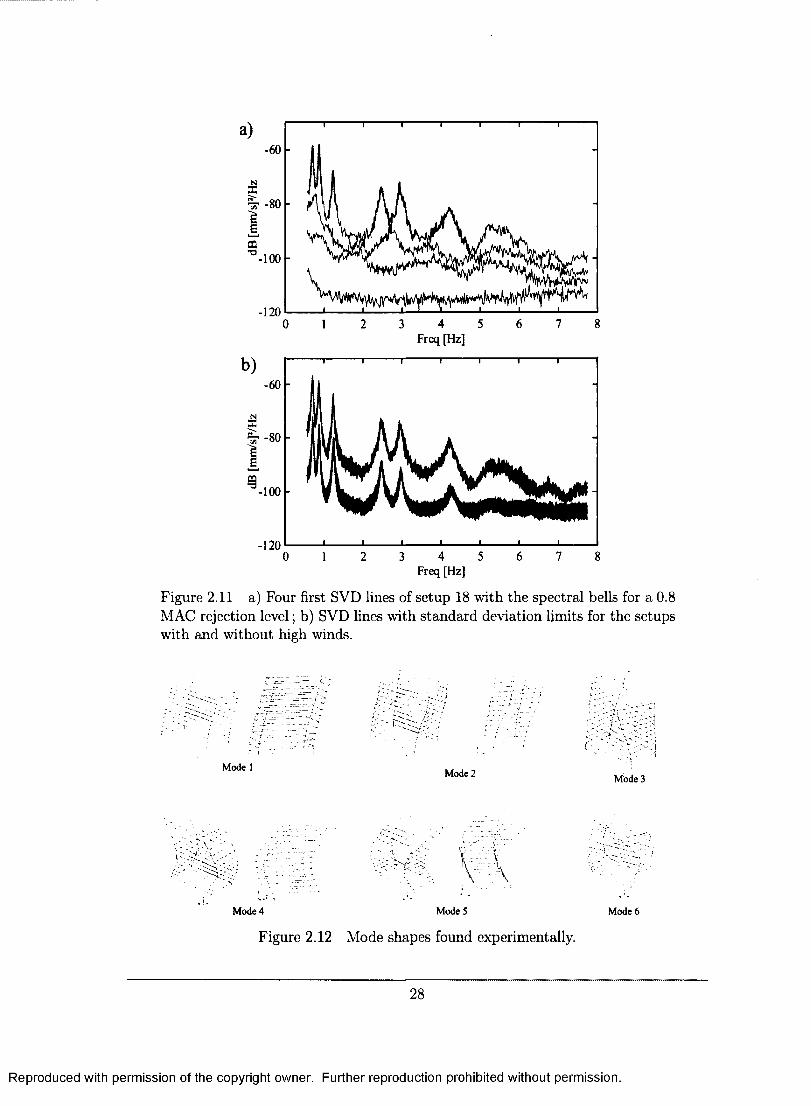
the SVD curves. A total of 8 192 data points were used with a Nyquist frequency of 100 Hz to compute the FFT corresponding to a 0.01221-Hz frequency resolution. An overlap averaging of 66.67% was used. Fig. 2.11 a) shows the first four SVD lines of a typical setup. Six modes can be identified from the clear peaks of the first SVD average line. The spectral bells corresponding to the first six vibration modes are represented by bold lines in Fig. 2.11 a). These spectral bells were identified using a MAC rejection level of 0.8.
Tableau 2.1 Comparison between the experimental and the numerical natural periods of the first six vibration modes identified.
EXPERIMENTAL PRETEST FEM UPDATED FEM Mode Type Freq.[Hz] T[Sec] T[Sec] Diff.[%] MAC T[Sec] Diff.[%J MAC
1 1-Y 0.70 1.42 1.28 -10.2% 0.42 1.42 -0.1% 0.99 2 1-X 0.87 1.15 1.17 1.9% 0.30 1.11 -3.4% 0.98 3 1-T 1.24 0.81 0.92 13.8% 0.85 0.87 7.9% 0.98 4 2-Y 2.47 0.40 0.34 -15.4% 0.49 0.35 -14.2% 0.98 5 2-X 2.97 0.34 0.30 -11.6% 0.37 0.28 -16.4% 0.98 6 2-T 4.25 0.24 0.22 -6.3% 0.68 0.21 -8.8% 0.76
Fig. 2.11 b) presents the average of the first SVD line of all configurations. The bold curve with the most energy represents the setups recorded during stronger winds (day 2), while the lower bold curve was obtained during lighter winds (day 1). The shaded area represents the upper and lower limits corresponding to the mean, plus or minus one standard deviation. The fact that these shaded areas are rather thin illustrates good correlation between all acquisitions. The first six modes are summarised in Table 2.1. Separating the acquisitions according to the level of ambient excitation (wind) confirms the fact that the analysis method remains accurate even with low vibrations. Furthermore, isolating the higher amplitude vibrations makes it possible to identify higher modes. Two extra modes were identified at 5.3 Hz and 6.7 Hz. These modes were not identifiable from the lower amplitude recordings. Nevertheless, the corresponding mode shapes were difficult to plot due to their weak energy level. Isolating the helipad setup also allowed for identifying local modes at 6 Hz and 10 Hz (not shown here).
Fig. 2.12 presents the first six mode shapes extracted from the FDD. The in-plane rigid-diaphragm hypothesis for the floor slabs was verified from the shapes obtained from the acquisitions taken at three corners as well as the centre of each floor. The fourth corner's position was then calculated accordingly. The first mode is longitudinal in the Y-direction
16
Reproduced with permission of the copyright owner. Further reproduction prohibited without permission.
and the first transverse mode in the X direction has an atypical shape with the SE part having much larger amplitude than the NW part, adding some torsional behaviour (see Fig. 2.6 for X and Y sensor directions). This amplitude difference between both ends of the building can be explained by the eccentricity between the torsion centre and the centre of mass. This eccentricity is obviously due to an irregular pattern of the lateral force-resisting systems, because the in-plane mass distributions of the various floors are uniform. The third and sixth modes are two typical torsional modes with a slight transverse component in the X-direction. Mode 4 is the 2nd longitudinal mode, with a little more transverse component than the first mode. Mode 5 is a 2nd transverse mode with the same asymmetric pattern as mode 4.
Damping
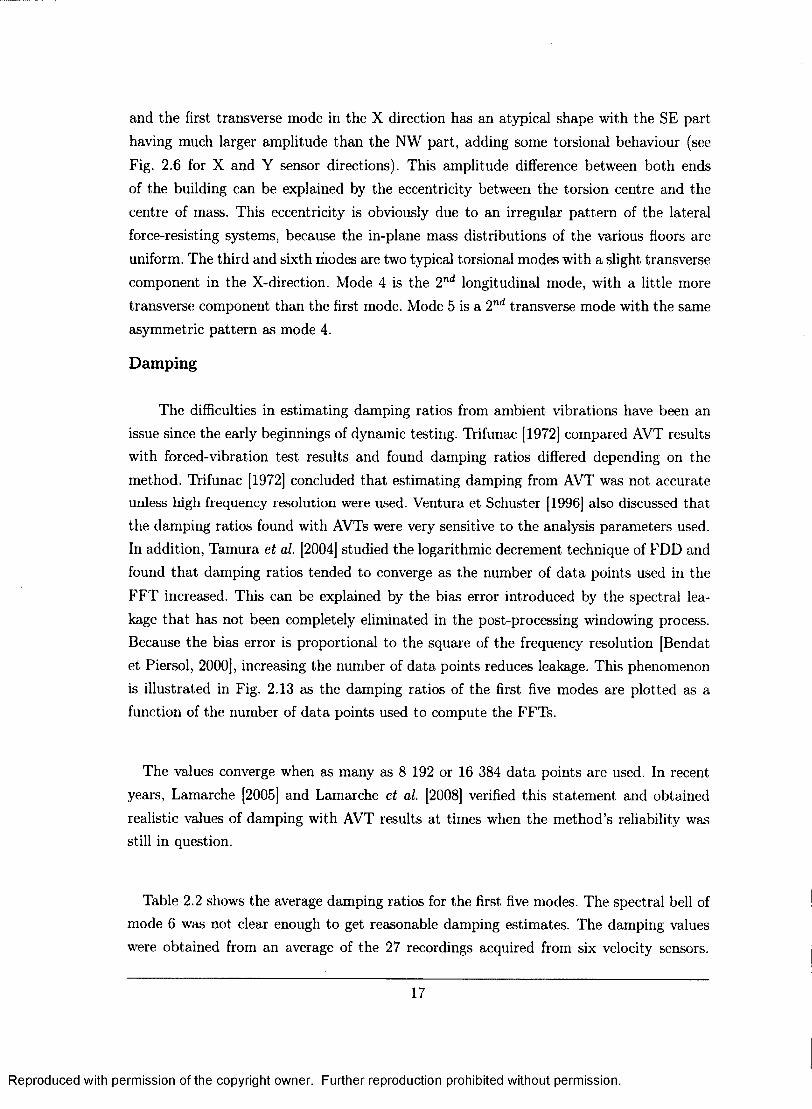
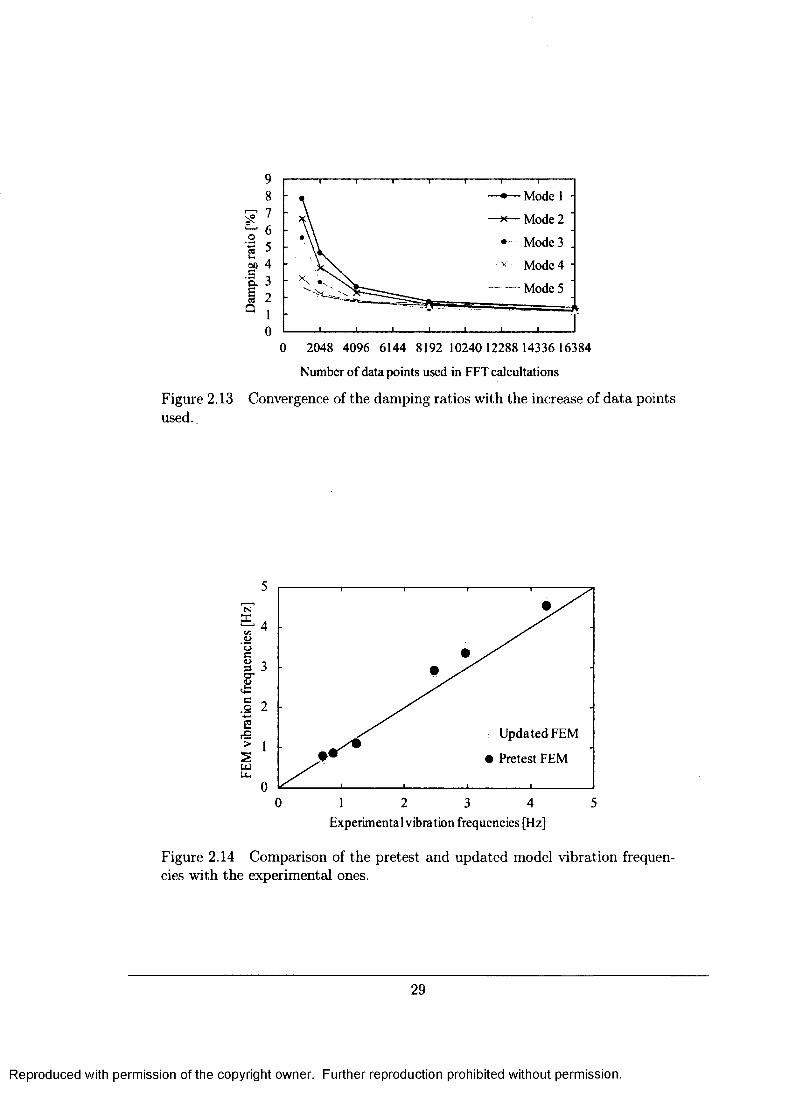
The difficulties in estimating damping ratios from ambient vibrations have been an issue since the early beginnings of dynamic testing. Trifunac [1972] compared AVT results with forced-vibration test results and found damping ratios differed depending on the method. Trifunac [1972] concluded that estimating damping from AVT was not accurate unless high frequency resolution were used. Ventura et Schuster [1996] also discussed that the damping ratios found with AVTs were very sensitive to the analysis parameters used. In addition, Tamura et al. [2004] studied the logarithmic decrement technique of FDD and found that damping ratios tended to converge as the number of data points used in the FFT increased. This can be explained by the bias error introduced by the spectral lea-kage that has not been completely eliminated in the post-processing windowing process. Because the bias error is proportional to the square of the frequency resolution [Bendat et Piersol, 2000], increasing the number of data points reduces leakage. This phenomenon is illustrated in Fig. 2.13 as the damping ratios of the first five modes are plotted as a function of the number of data points used to compute the FFTs.
The values converge when as many as 8 192 or 16 384 data points are used. In recent years, Lamarche [2005] and Lamarche et al. [2008] verified this statement and obtained realistic values of damping with AVT results at times when the method's reliability was still in question.
Table 2.2 shows the average damping ratios for the first five modes. The spectral bell of mode 6 was not clear enough to get reasonable damping estimates. The damping values were obtained from an average of the 27 recordings acquired from six velocity sensors.
17
Reproduced with permission of the copyright owner. Further reproduction prohibited without permission.
The results show that the damping ratios ranged from 1.0 to 1.5%. It must be kept in mind that these values were obtained from AVTs and that they are related to very small amplitudes of motion. It is expected that higher damping values would be obtained from forced vibration tests and during strong ground motions with significantly higher input forces as the micro-cracks in the concrete would open and close, thus adding hysteretic damping to the structure [Lamarche et al., 2008].
Tableau 2.2 Average damping ratios for all the acquisitions and for the five with high wind (values in %).
ALL HIGH WIND avg. ref RMS 0.05 mm/s 0.16 mm/s
Mode 1 1.45% 1.78% Mode 2 1.26% 1.42% Mode 3 1.22% 1.31% Mode 4 1.43% 2.20% Mode 5 1.20% 1.94%
The presence of five acquisitions that occurred with high wind raised the possibility of investigating the effect of motion amplitude on the damping ratios. Li et al. [2004] illustrated the nonlinear energy dissipation characteristics of a tall building in China by comparing the different damping ratios found in functions of the building motion's ampli-tude. Increases of 0.2% to 0.4% were observed. The average RMS of the reference sensors increased from 0.05 mm/s to 0.16 mm/s with the wind during the tests. The damping ratios for all modes increased from 0.1% to 0.8%, showing that the level of excitation had an effect on the damping ratios found with the AVTs.
2.4 Finite Element Modelling
It is well recognised that FEMs are only accurate when calibrated with experimental data. The following sections illustrate a typical FE model established with the drawings, as would be used during design. The calibration with experimental data is then presented.
2.4.1 Pretest FEM
ETABS software was used to model the structure of the Digicel tower. A model was developed with the available drawings and visual-assessment information obtained during
18
Reproduced with permission of the copyright owner. Further reproduction prohibited without permission.
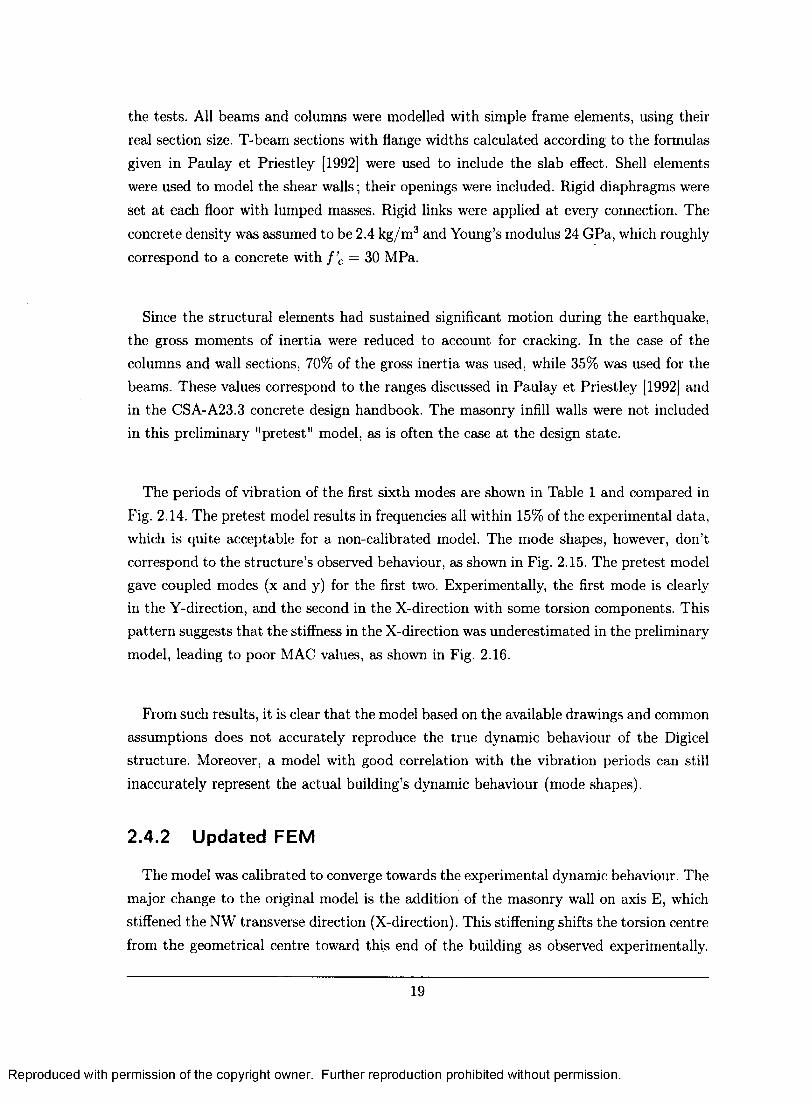
the tests. All beams and columns were modelled with simple frame elements, using their real section size. T-beam sections with flange widths calculated according to the formulas given in Paulay et Priestley [1992] were used to include the slab effect. Shell elements were used to model the shear walls; their openings were included. Rigid diaphragms were set at each floor with lumped masses. Rigid links were applied at every connection. The concrete density was assumed to be 2.4 kg/m3 and Young's modulus 24 GPa, which roughly correspond to a concrete with f'c = 30 MPa.
Since the structural elements had sustained significant motion during the earthquake, the gross moments of inertia were reduced to account for cracking. In the case of the columns and wall sections, 70% of the gross inertia was used, while 35% was used for the beams. These values correspond to the ranges discussed in Paulay et Priestley [1992] and in the CSA-A23.3 concrete design handbook. The masonry infill walls were not included in this preliminary "pretest" model, as is often the case at the design state.
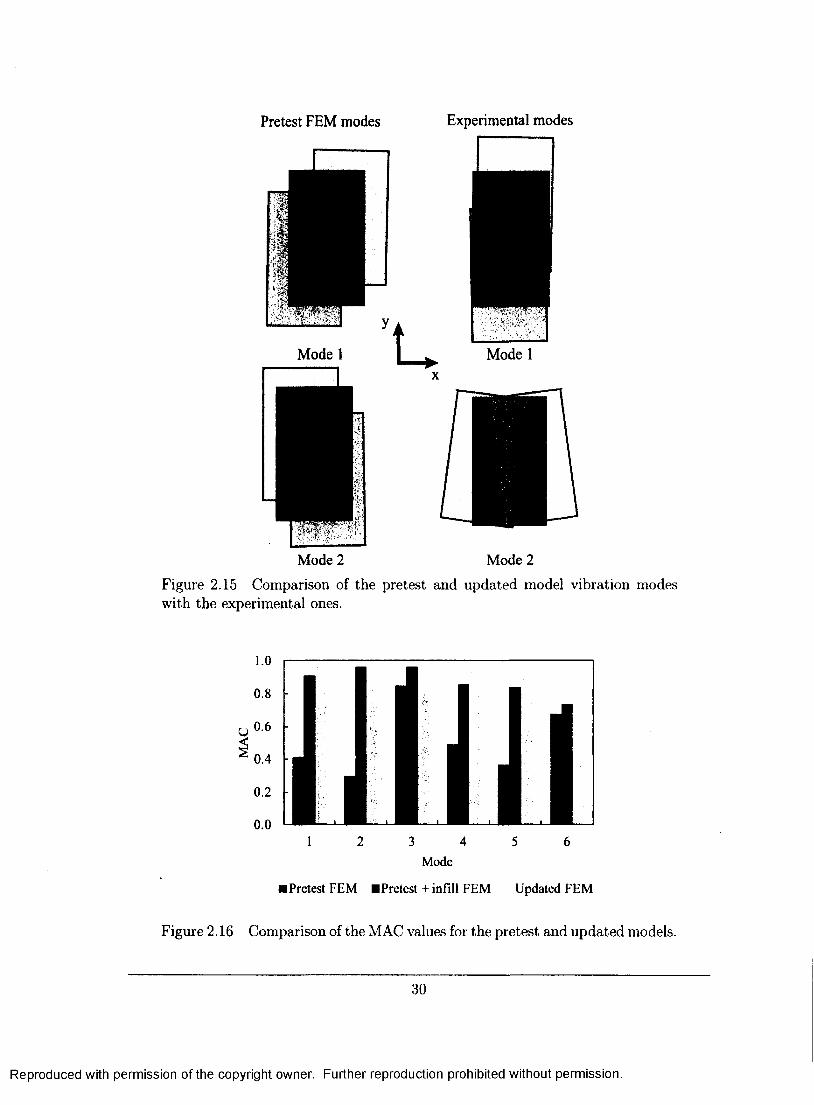
The periods of vibration of the first sixth modes are shown in Table 1 and compared in Fig. 2.14. The pretest model results in frequencies all within 15% of the experimental data, which is quite acceptable for a non-calibrated model. The mode shapes, however, don't correspond to the structure's observed behaviour, as shown in Fig. 2.15. The pretest model gave coupled modes (x and y) for the first two. Experimentally, the first mode is clearly in the Y-direction, and the second in the X-direction with some torsion components. This pattern suggests that the stiffness in the X-direction was underestimated in the preliminary model, leading to poor MAC values, as shown in Fig. 2.16.
From such results, it is clear that the model based on the available drawings and common assumptions does not accurately reproduce the true dynamic behaviour of the Digicel structure. Moreover, a model with good correlation with the vibration periods can still inaccurately represent the actual building's dynamic behaviour (mode shapes).
2.4.2 Updated FEM
The model was calibrated to converge towards the experimental dynamic behaviour. The major change to the original model is the addition of the masonry wall on axis E, which stiffened the NW transverse direction (X-direction). This stiffening shifts the torsion centre from the geometrical centre toward this end of the building as observed experimentally.
19
Reproduced with permission of the copyright owner. Further reproduction prohibited without permission.
The infill walls were modelled by diagonal equivalent struts with a Young's modulus E = 10 GPa. The equivalent section was set to 250 mm thick, which is the wall's actual thickness, by 800 mm deep, which correspond to approximately 25% of the clear diagonal length of the infill bays, as recommended by Paulay et Priestley [1992].
As a result of this addition, the MAC values were significantly increased to almost per-fect values (Table 2.1 and Fig. 2.16). The added stiffness in the X-direction left a weaker Y-direction, bringing the first mode in this direction, as observed experimentally. The un-balanced stiffness brought on by the infill wall is responsible for the torsion component in the second mode. This shows the importance of the infill walls in the building's dyna-mic behaviour. Their participation in sustaining lateral forces was confirmed from all the diagonal cracks that observed on site.
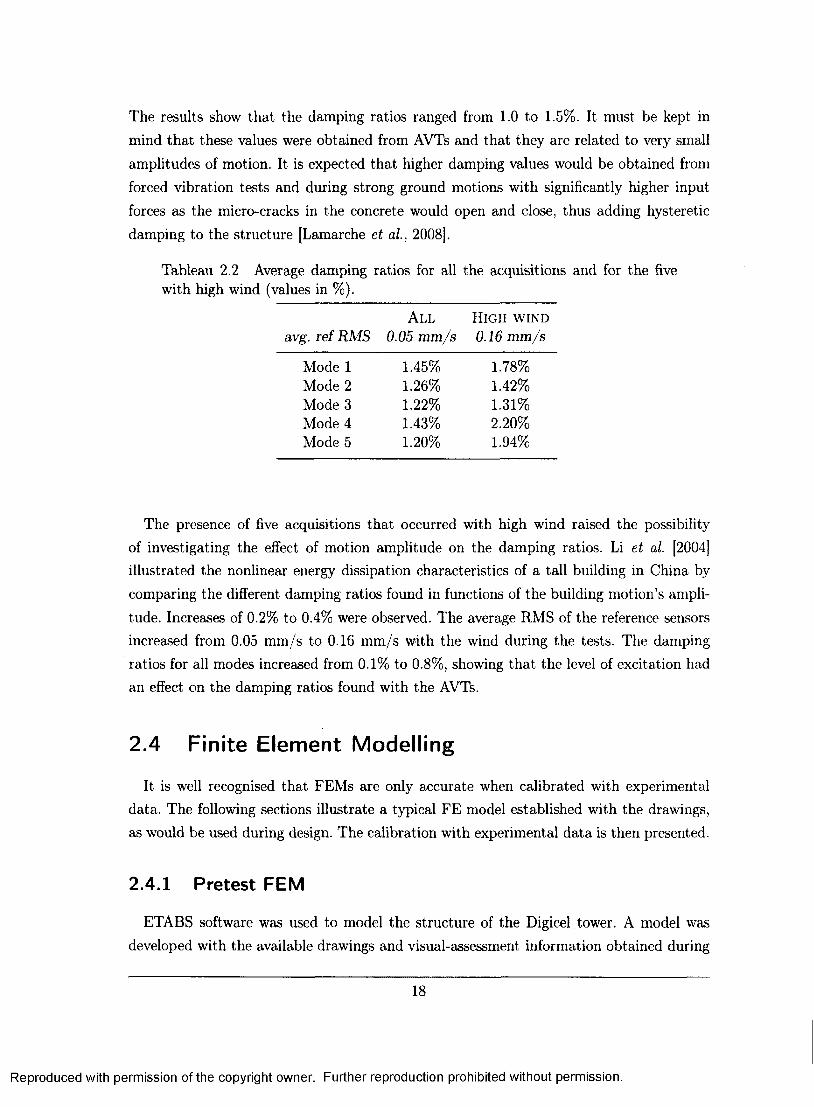
Several iterations were carried out manually to get a final updated model with vibration periods and MAC that almost perfectly fit the experimental values (Table 2.1, Fig. 2.14 and 2.16). Apart from the infill walls added on axis E and K, parametric studies were carried out on the concrete density and the elastic moduli of the various materials. The effective inertias of the various members were kept unchanged, since they already represent severe cracking and lower values would not be physically probable. The effect of the cladding was not added because of its negligible rigidity due to the flexible connection system. Table 2.3 presents the final values leading to the best correlations. The results show that the concrete properties were not likely to be as high as reported during construction. The more radical decreases in the moduli of the concrete beams and columns, compared to the walls, result from greater damage to them.
The updated model has periods that agree almost perfectly with the experimental values for the first two modes. For the subsequent modes, the errors remain fairly low. This is perfectly acceptable if we recall that the project's main objective was to assess the importance of each parameter in eventually creating nonlinear models used to assess the building's earthquake behaviour and to try to explain the observed damage. Since vibration periods change during a nonlinear analysis, the more important dynamic recordings are the mode shapes that dictate member responses during analysis. The MAC values of 98% for the first five modes and 75% for the sixth mode are high enough to assume that the building's dynamic behaviour has been accurately modelled.
20
Reproduced with permission of the copyright owner. Further reproduction prohibited without permission.
Tableau 2.3 Material properties for the pretest model and the updated model.
MODEL Properties Pretest Updated
p concrete 2.4 kg/m3
Ec columns 24 GPa Ec beams 24 GPa Ec walls 24 GPa
Em masonry
1.8 kg/m3
13.9 GPa 14.5 GPa 20.7 GPa 13.5 GPa
2.5 Summary and Conclusions
Despite destruction produced by the 2010 Haiti earthquake, the 12-storey Digicel buil-ding behaved well and sustained little damage. Experimental work consisting of visual assessments and ambient-vibration tests were carried out to characterise the damages sus-tained and to identify the building's key dynamic properties (natural vibration frequencies, mode shapes, and damping ratios). ETABS was used to generate FE models before and after the AVT to assess the capabilities of common modelling assumptions in predicting structure dynamic behaviour.
AVT yielded the first six vibration modes and the damping ratios, reaffirming the ef-ficiency and accuracy of the method in assessing structure dynamic properties. The be-haviour was then modelled with accuracy through manual model updating, laying the ground for a more sophisticated nonlinear analysis presented in the companion paper. It was found that the infill walls had a major impact on the building's dynamic behaviour and that the concrete properties were likely not as high as reported during construction.
The study shows that the FE method is reliable in predicting structure dynamic beha-viour, but is very sensitive to the assumptions used during modelling. The model could predict the vibration frequencies precisely, but an accurate representation of the mode shapes required careful model updating.
Acknowledgments
The authors would like to acknowledge the financial support of the Natural Sciences and Engineering Research Council of Canada (NSERC) for the Canadian Seismic Research Network (CSRN), the Quebec Fonds pour la recherche sur la nature et les technologies
21
Reproduced with permission of the copyright owner. Further reproduction prohibited without permission.
(FQRNT) for the Centre d'etudes interuniversitaires des structures sous charges extremes (CEISCE), and the Canadian Association for Earthquake Engineering (CAEE). The au-thors would also like to acknowledge the cooperation of Ian Jones, construction manager of the Digicel building, who provided all the necessary information.
22
Reproduced with permission of the copyright owner. Further reproduction prohibited without permission.
Coupling beams h = 1300 mm
0 - t I I I I (I i I I I ©-«: = = = = = =#= = = = = :
U-shaped coupled walls 4 = = = = = = i: =
©>• t==-===w=======f====== I I II II
II II I I
(J>- = z = ^ = =
<&
Q-
n 11 11 L-shaped wall
(2) (3) (4)
E
L-shaped wall
•Masonry infill walls
W.
X
Transducer
•Masonry infill wall
U-shaped wall
Reference sensors on 5th floor
Figure 2.6 Plan view of a typical storey with the sensors position.
23
Reproduced with permission of the copyright owner. Further reproduction prohibited without permission.
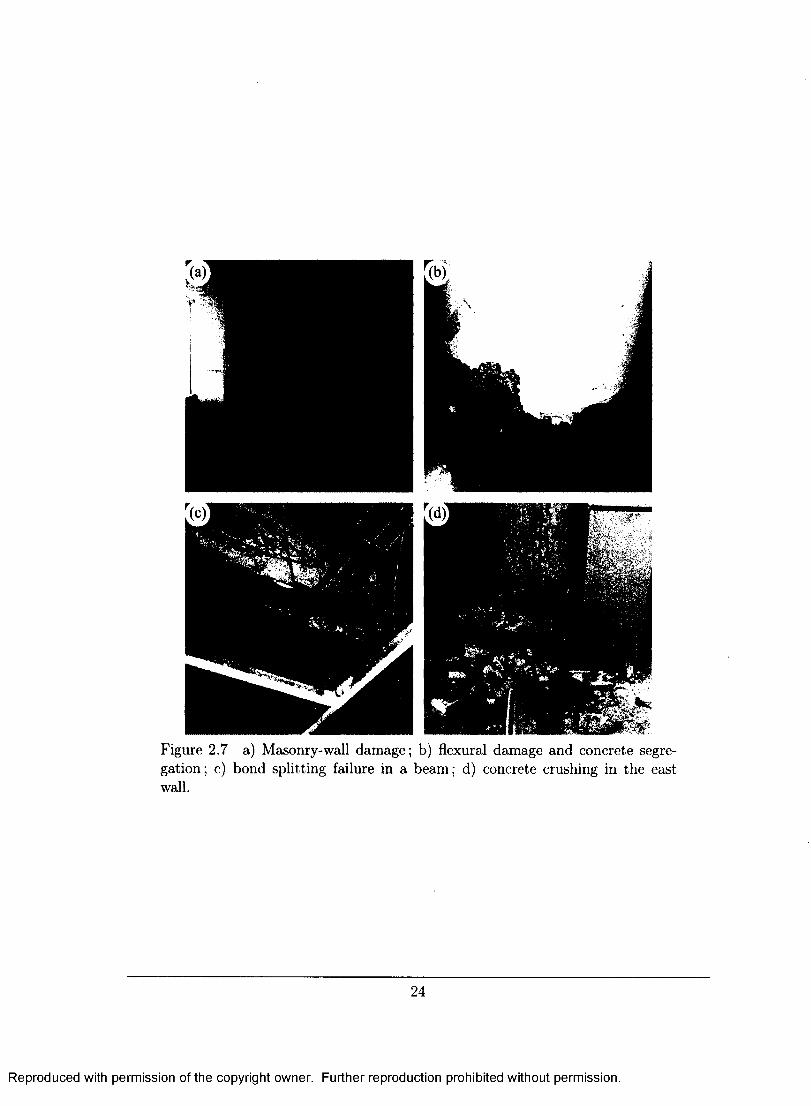
Figure 2.7 a) Masonry-wall damage; b) flexural damage and concrete segre-gation; c) bond splitting failure in a beam; d) concrete crushing in the east wall.
24
Reproduced with permission of the copyright owner. Further reproduction prohibited without permission.
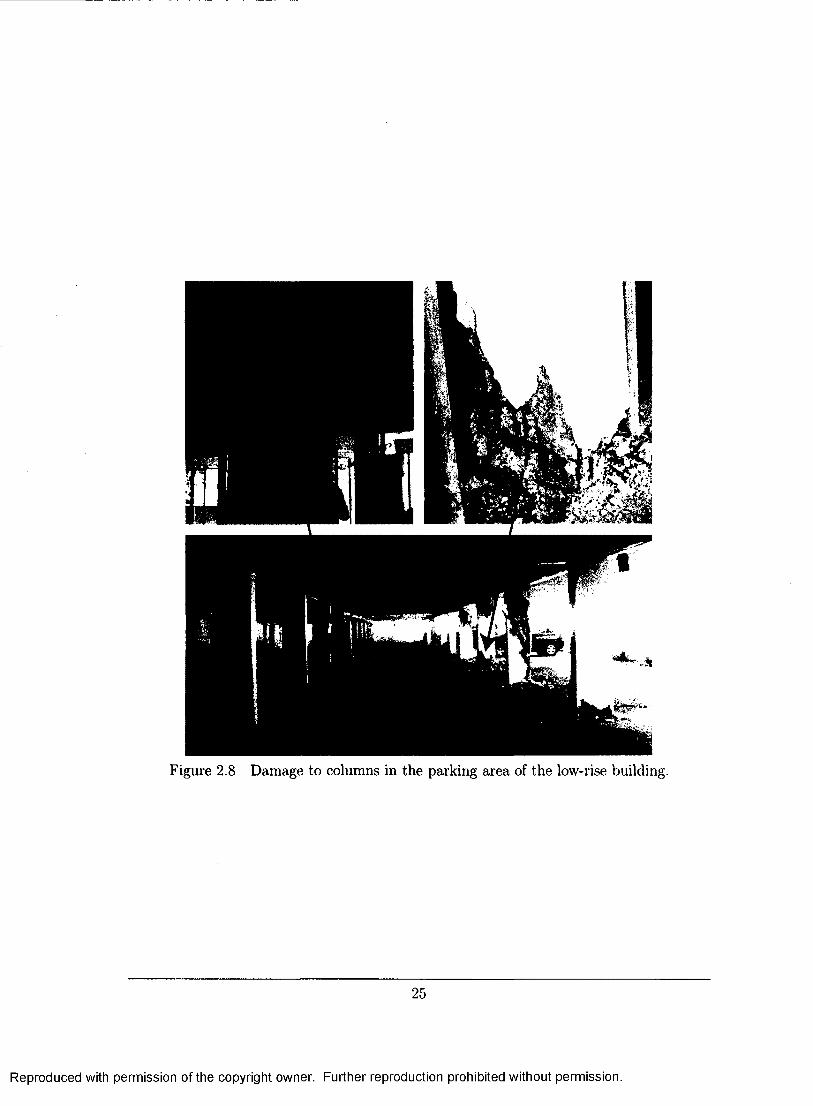
Figure 2.8 Damage to columns in the parking area of the low-rise building.
Reproduced with permission of the copyright owner. Further reproduction prohibited without permission.
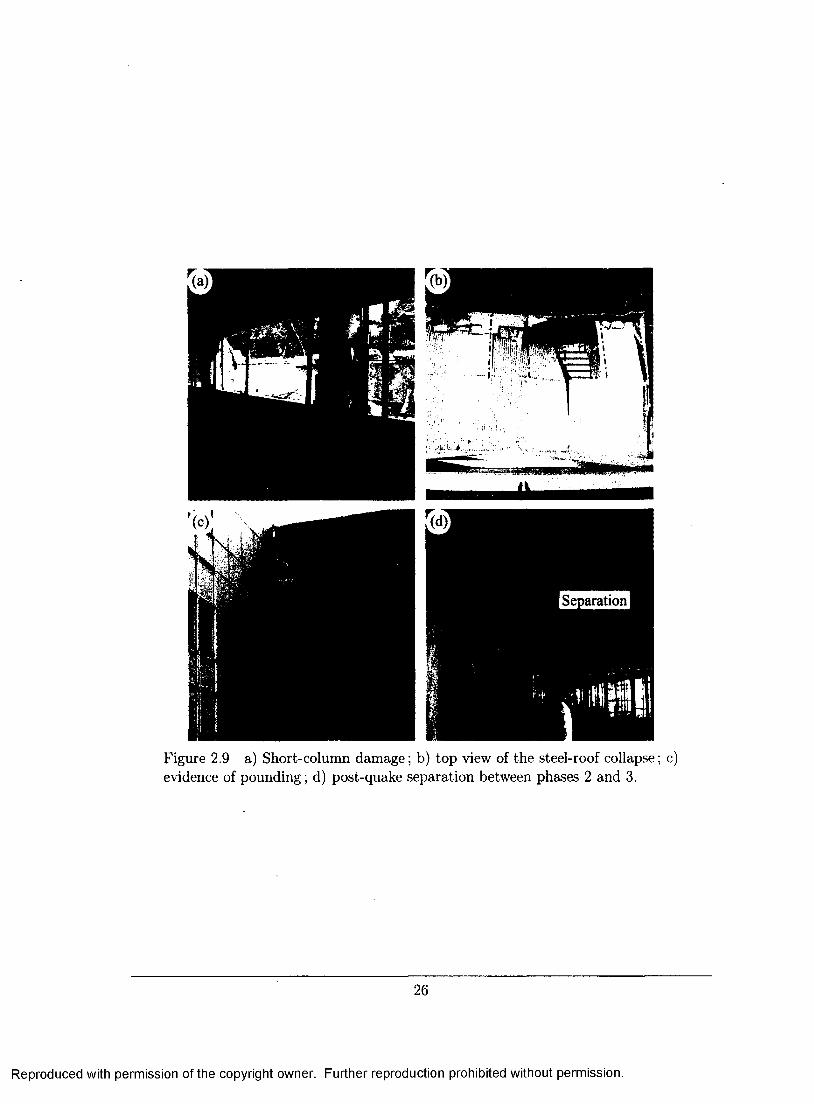
Figure 2.9 a) Short-column damage; b) top view of the steel-roof collapse; c) evidence of pounding; d) post-quake separation between phases 2 and 3.
26
Reproduced with permission of the copyright owner. Further reproduction prohibited without permission.
a) '
0.5
M, n
8. C/5
Transverse (X) reference RMS 0.025 mm/s Low wind
T 1.2s
If1 "W» IP Wp»' 1 13 lT ^ 14 16 18 •*
-0.5
Recorded Corrected
c)
0.5
Longitudinal (Y) reference RMS 0.019 mm/s Low wind
T 1.4s
! 1 CO
6 8 1 0 1 2 l »
-0.5
Recorded Corrected
Time [s] Time [sj
Transverse (X) reference RMS 0.161 mm/s High wind
Longitudinal (Y) reference RMS 0.176 mm/s High wind
T 1.4s T 1.2s Recorded —-Corrected Recorded Corrected
-0.5
Time [s] Time Is]
Figure 2.10 Typical corrected and uncorrected responses of reference sensors for light and high winds.
27
Reproduced with permission of the copyright owner. Further reproduction prohibited without permission.
ir -80
Freq [Hzl
2 3 4 5 Freq [Hz]
Figure 2.11 a) Four first SVD lines of setup 18 with the spectral bells for a 0.8 MAC rejection level; b) SVD lines with standard deviation limits for the setups with and without high winds.
•J'-i "
Mode 1
i
: :/ ;f: " J . . .
Mode 2
mm f•-•' v •
Mode 3
Pi! 1 .1 . .
- . V ' | - : \
IV .. - t
Mode 4 Mode 5 Mode 6
Figure 2.12 Mode shapes found experimentally.
28
Reproduced with permission of the copyright owner. Further reproduction prohibited without permission.
r T F - I T T T
—•— Mode 1 • \ —*— Mode 2 • \\ • Mode 3 .
• ^
—x~ Mode 4 •
Mode 5
1 1 1 0 2048 4096 6144 8192 10240 1228814336 16384
Number of data points used in FFT calcultations
Figure 2.13 Convergence of the damping ratios with the increase of data points used..
N £
(A <ZJ "u c o 3 a* <£ i a .2 B >
w
1 1 T 1 "-7
• •
Updated FEM -
• Pretest FEM
1 1 1 0 1 2 3 4 5
Experimental vibration frequencies [Hz]
Figure 2.14 Comparison of the pretest and updated model vibration frequen-cies with the experimental ones.
29
Reproduced with permission of the copyright owner. Further reproduction prohibited without permission.
Pretest FEM modes Experimental modes
Mode 1
A'
Mode 1
I I Mode 2 Mode 2
Figure 2.15 Comparison of the pretest and updated model vibration modes with the experimental ones.
u
1.0
0.8
0.6
0.4
0.2
0.0
Mode
•Pretest FEM • Pretest + infill FEM Updated FEM
Figure 2.16 Comparison of the MAC values for the pretest and updated models.
30
Reproduced with permission of the copyright owner. Further reproduction prohibited without permission.
CHAPITRE 3
Simulations numeriques
Avant-propos Auteurs et affiliation :
B. Boulanger : etudiant a la maitrise, Universite de Sherbrooke, Faculte de genie, Departement de genie civil. P. Paultre : professeur, Universite de Sherbrooke, Faculte de genie, Departement de genie civil. C.-P. Lamarche : professeur, Universite de Sherbrooke, Faculte de genie, Departement de genie civil.
Date de soumission : 7 mars 2012
Revue : Revue Canadienne de Genie Civil
Etat de l'acceptation : Article soumis
Titre en frangais : Analyse d'un batiment multi-etage en beton arme endommage lors du seisme d'Ha'fti du 12 janvier 2010. Partie II : Analyses numeriques non-lineaires
Contribution au document : Cet article decrit les travaux de modelisation et les re-sultats des analyses numeriques non-lineaires sur le batiment evalue precedemment. Une description en detail des modeles et theories utilises est egalement presentee. Les resultats sont ensuite compares aux dommages observes afin d'ameliorer notre comprehension du comportement de la structure lors du seisme.
31
Reproduced with permission of the copyright owner. Further reproduction prohibited without permission.
Resume frangais : Le seisme d'Hai'ti de 2010 a devaste une partie importante de la region vulnerable de Port-au-Prince. A la suite de cet evenement, le batiment de 12 etages de Digicel, qui s'est bien comporte lors de la secousse, a ete etudie afin de comprendre son comportement dynamique. Cet article complete le premier de la presente serie, dans lequel un modele par elements finis a ete calibre a l'aide des proprietes dynamiques de l'ouvrage evaluees par des essais sous vibrations ambiantes. Les objectifs du present article sont : (1) de comprendre les causes des dommages observes; et (2) d'estimer l'intensite probable du seisme. Les resultats d'une serie d'analyse non-lineaire s de differentes intensites ont ete compares aux dommages observes. Les analyses numeriques ont bien reproduit les dommages et ont permis de les expliquer. Le comportement general du systeme murs-cadres du batiment est clairement domine par la grande rigidite des murs de refend, permettant un bon controle des deplacements inter-etage. La structure generale a repondu lineairement a toutes les analyses, mais l'incompatibilite des deformations des 2 systemes a induit des dommages locaux a l'interface entre les poutres connectees directement aux murs de refend.
Note : A la suite des corrections demandees par le jury, le contenu de cet article differe de celui qui a ete soumis.
32
Reproduced with permission of the copyright owner. Further reproduction prohibited without permission.
Analysis of a damaged 12-storey frame-wall concrete
building during the 2010 Haiti earthquake.
Part II : Nonlinear numerical simulations
Abstract
After the 2010 Haiti earthquake, which destroyed a significant part of the seismically
vulnerable city of Port-au-Prince, the country's capital, a 12-storey, RC building that behaved well was investigated to understand its dynamic response. This paper completes the experimental work presented in a companion paper, in which the dynamic properties of the building were obtained from ambient vibration tests, and from which a finite-element model was updated. This paper's main objectives are : (1) to understand the causes that led to the observed structural damage; and (2) to estimate the likely seismic excitation at the site of the building. Several nonlinear analyses involving various ground motion intensities were conducted and the results were compared with the damages reported during the on-site survey. The numerical models reproduced well the observed damages and helped to explain them. The overall response of the mixed stiff frame-wall structure was clearly dominated by the high stiffness of the shear walls, showing that this type of structural system helps in keeping reasonable inter-storey drift levels. Overall, the building's structure seems to have responded linearly to all the ground motions investigated, but deformation incompatibilities at the interface between beams and shear walls lead to important local damages.
3.1 Introduction
The life-threatening structural damages sustained by a large proportion of the civil-engineering structures located in Port-au-Prince during the 2010 Haiti earthquake (ma-gnitude 7.0) showed once again the vulnerability of poorly engineered structures to severe ground motions [Paultre et al., 2012], This paper is the second of two companion papers on the dynamic behaviour of the 12-storey Digicel building located in Port-au-Prince. The first of the two papers [Boulanger et al., 2012] focused on describing the building and damage observed, the in-situ assessment of the building's dynamic properties from am-bient vibration tests, and the modal updating of a numerical finite-element model. The present paper focuses on the results of several numerical nonlinear incremental analyses performed to attempt to recreate the damage sustained by the building from available
33
Reproduced with permission of the copyright owner. Further reproduction prohibited without permission.
structural information and site characteristics. This paper's main objectives are : (1) to understand the causes that led to the observed structural damage; and (2) to estimate the likely seismic excitation at the site of the building.
From a scientific point of view, the occurrence of seismic events represents an ideal opportunity to learn and study the damage caused by earthquakes to civil-engineering structures. Post-earthquake studies generally abound in observations and findings. Past studies on numerically predicting damage to building structures after medium to severe seismic events can be found in the literature, but they remain few. Now that numerical analysis and design software is a standard part of the seismic design toolbox, such studies can be used for validation purposes, some examples being Shepherd et Plunkett [1983], Maison et Kasai [1992], Chi et al. [1998], and Nagato et Kawase [2004].
The Van Nuys Hotel in California is a good example of a building that suffered damage during the 1971 San Fernando (magnitude 6.6) and 1994 Northridge (magnitude 6.7) ear-thquakes. During the past 20 years, several numerical models results have been compared and validated using the data available for that building. For example, Saiful Islam [1996] reproduced the observed damage patterns with 2-D static pushover analysis, while Li et Jirsa [1998] used both pushover and nonlinear time-history analysis. Llera et al. [2001] proposed a simplified inelastic stick model to match the unexpected torsional response of this quasi-symmetrical building. More recently, Todorovska et Trifunac [2008] used the same results to assess structural-health monitoring tools.
As discussed in the first companion paper, the dynamic response of the Digicel building is almost completely governed by its main structural components, because it has very few nonstructural elements and additional masses. The building therefore is an invaluable candidate for attempting to reproduce the observed damage with state of the art numerical tools.
Notwithstanding the fact that the structural plans are available and the dynamic pro-perties have been identified experimentally [Boulanger et al., 2012], many unknowns still remained. Firstly, the ground accelerations were not recorded during the Haiti earthquake, so its exact intensity and frequency are not precisely known. In addition, the probable lack of modern construction techniques in Port-au-Prince (PaP) may have resulted in the ma-terial properties and homogeneity of the concrete in the structural components differing
34
Reproduced with permission of the copyright owner. Further reproduction prohibited without permission.
from those specified in the construction plans. Given these uncertainties, we limited our study to damage distribution. No specific conclusions were drawn about ductility demands or damage levels.
Some of the damages discussed in the companion paper-such as the shear failure of short columns in the parking facility-were trivial and aren't dealt with here. The severe damage to the other columns in basement-level parking; the beams ends directly connec-ted to the shear walls; and the column bottom on the top storeys of the tower were. Nonlinear time-history analyses involving various earthquake intensities were performed on calibrated models to see why some elements were damaged more than others. This pa-per presents the numerical model and the various ground-motion inputs used; a discussion about the building's overall response; and a discussion about the damage experienced by each structural element of interest.
3.2 Numerical model
3.2.1 Software used
SeismoStruct [SeismoSoft, 2011] finite-element (FE) analysis freeware was used to per-form all the analyses. This fibre-element-based software can predict the large displacements and damage to space frames under static and dynamic loading, accounting for geometric and material nonlinearities. Accurate concrete and steel hysteretic models are available, together with a large number of element types. Analyses performed with this software were compared to experimental data and found accurate in many studies [Pinho et al., 2008] and [Yuksel et Teymur, 2011]. Fig. 3.1 shows the complete 3-D mesh for the Digicel building modelled with SeismoStruct.
3.2.2 Modelling assumptions
Structural members were modeled using force, fibre-section-based, inelastic beam-column elements, which can accurately represent member behaviour in the inelastic range [Cala-brese et al., 2010]. The fibre-based modelling approach was used to represent the cross section of the various structural members, where each fibre is given a uniaxial stress-strain relationship. This approach shortcuts the task of gathering the moment-curvature hysteresis of all members and allows for more direct modelling of the axial-bending inter-
35
Reproduced with permission of the copyright owner. Further reproduction prohibited without permission.
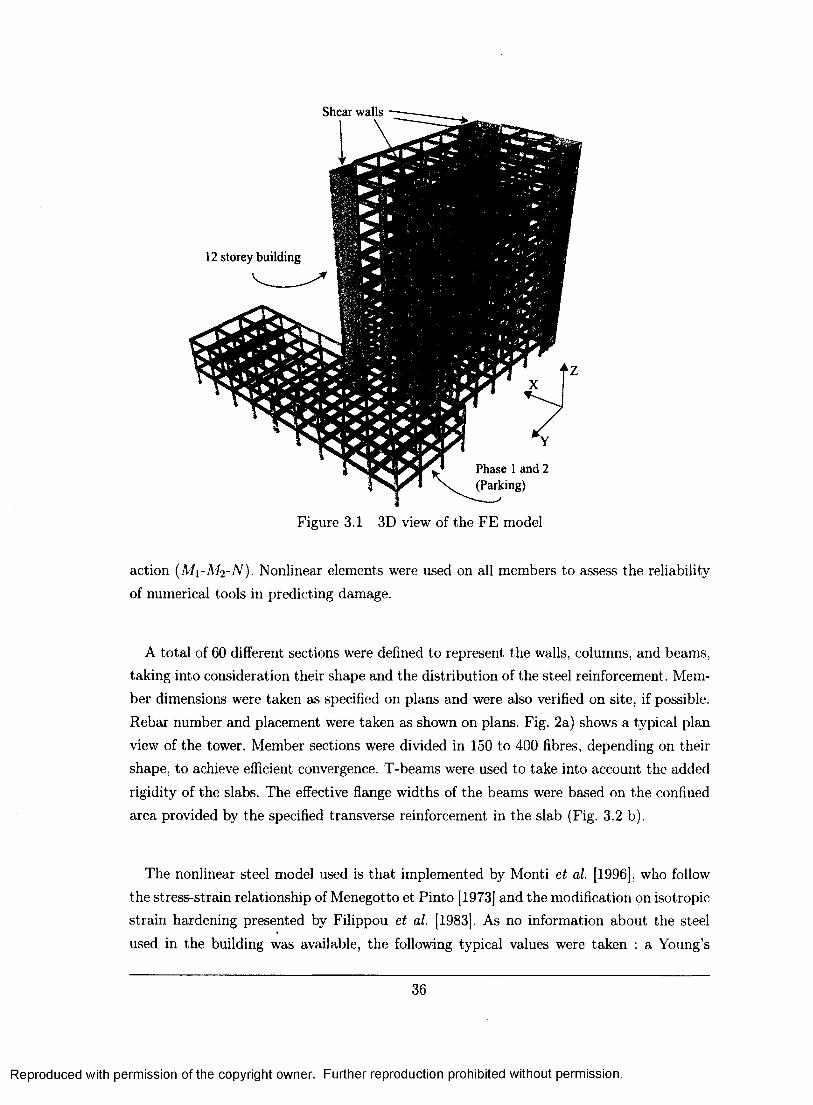
12 storey building
Phase 1 and 2 (Parking)
Figure 3.1 3D view of the FE model
action (Mi-M2-iV). Nonlinear elements were used on all members to assess the reliability of numerical tools in predicting damage.
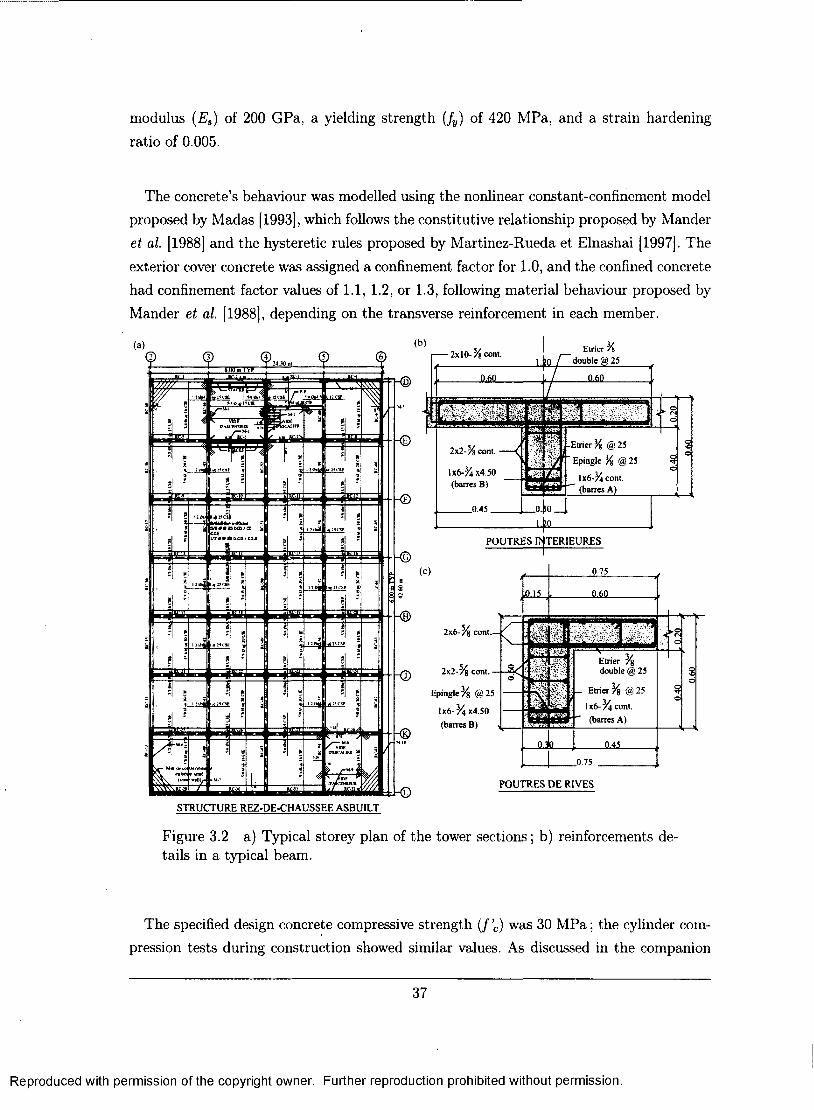
A total of 60 different sections were defined to represent the walls, columns, and beams, taking into consideration their shape and the distribution of the steel reinforcement. Mem-ber dimensions were taken as specified on plans and were also verified on site, if possible. Rebar number and placement were taken as shown on plans. Fig. 2a) shows a typical plan view of the tower. Member sections were divided in 150 to 400 fibres, depending on their shape, to achieve efficient convergence. T-beams were used to take into account the added rigidity of the slabs. The effective flange widths of the beams were based on the confined area provided by the specified transverse reinforcement in the slab (Fig. 3.2 b).
The nonlinear steel model used is that implemented by Monti et al. [1996], who follow the stress-strain relationship of Menegotto et Pinto [1973] and the modification on isotropic strain hardening presented by Filippou et al. [1983]. As no information about the steel used in the building was available, the following typical values were taken : a Young's
36
Reproduced with permission of the copyright owner. Further reproduction prohibited without permission.
modulus ( E s ) of 200 GPa, a yielding strength ( f y ) of 420 MPa, and a strain hardening ratio of 0.005.
The concrete's behaviour was modelled using the nonlinear constant-confinement model proposed by Madas [1993], which follows the constitutive relationship proposed by Mander et al. [1988] and the hysteretic rules proposed by Martinez-Rueda et Elnashai [1997]. The exterior cover concrete was assigned a confinement factor for 1.0, and the confined concrete had confinement factor values of 1.1, 1.2, or 1.3, following material behaviour proposed by Mander et al. [1988], depending on the transverse reinforcement in each member.
A.wJm I VP
ail£25 <11 CSS
VIDE D-UrAim £
Etner /8 2x10-% cont. double
i-ktrier 7% @ 25
Epingle % (a). 25
1x6-% cont (barres A)
2x2-% cont.
1x6-% x4.50 (barres B)
POUTRES INTERIEURES
2x6- /% cont.—
Etrier /% double &). 25
_ Etrier /% <®25
1 x6- % cont (barres A)
2x2-% cont.
E p i n g l e % @ 2 5
1x6-^x4.50 (barres B)
KD POUTRES DE RIVES
STRUCTURE REZ-DE-CHAUSSEE ASBUILT
Figure 3.2 a) Typical storey plan of the tower sections; b) reinforcements de-tails in a typical beam.
The specified design concrete compressive strength (f'c) was 30 MPa; the cylinder com-pression tests during construction showed similar values. As discussed in the companion
37
Reproduced with permission of the copyright owner. Further reproduction prohibited without permission.
paper, however, the concrete quality and homogeneity observed were not very good. Un-fortunately, due to the lack of necessary equipment, no core samples were taken during the site visit. Nevertheless, small pieces of concrete were analyzed at Universite de Sherbroo-ke's laboratories using scanning electron microscopy (SEM) and X-ray diffraction (XRD) technologies to assess the concrete's properties. The results showed that the concrete had high porosity, typical of a high water-cement ratio. They also showed no evidence of typical Portland cement hydrates, suggesting that another type of cement, e.g., masonry cement, was used. Both of these findings are signs of a weak concrete. Based on this and on the ob-served segregation, low concrete rigidity were assumed in the FE model [Boulanger et al., 2012]; the f'c value was taken as 18 MPa with an ultimate strain value of e'c = 0.0016.
Distributed-plasticity fibre-based elements using 4 integration sections were used to model the walls and coupling beams, but a plastic hinge-integration approach was chosen to model the frame members. This approach describes material nonlinearity at the element ends oyer a specific plastic hinge length. Its use considerably reduces the analysis time and helps overcome other convergence-related problems caused by distributed inelasticity in frame members [Scott et Fenves, 2006]. The plastic hinges lengths were set to 15% of each column or beam length, which about the length given by the rule proposed by Paulay et Priestley [1992].
The L and U-shaped walls were assembled with rigid links with the master nodes at the barycentre of the resulting shapes. The fibre-based elements in SeismoStruct do not account for shear deformations. This was not seen as a problem because the walls are very slender (49.6 m high and 6 m wide). The discretization of the element forming the walls followed the recommendations of Beyer et al. [2008].
The few masonry walls in the building were modelled with linear diagonal equivalent struts. Gap elements were used between the tower and the parking facility to account for potential pounding occurrences between the two distinct structures. All masses were assigned to their nearest nodes; rigid diaphragms were used on each floor. To mitigate the potential numerical difficulties caused by the addition of multiple nodal constraints, rigid links were not assigned to the member ends to model the beam-column joints. This hypothesis is often made to compensate for shear deformation in the joints or bond-slipping of reinforcing bars. Jeong et Elnashai [2005] found that their numerical models using this hypothesis gave good results when compared to experimental data.
38
Reproduced with permission of the copyright owner. Further reproduction prohibited without permission.
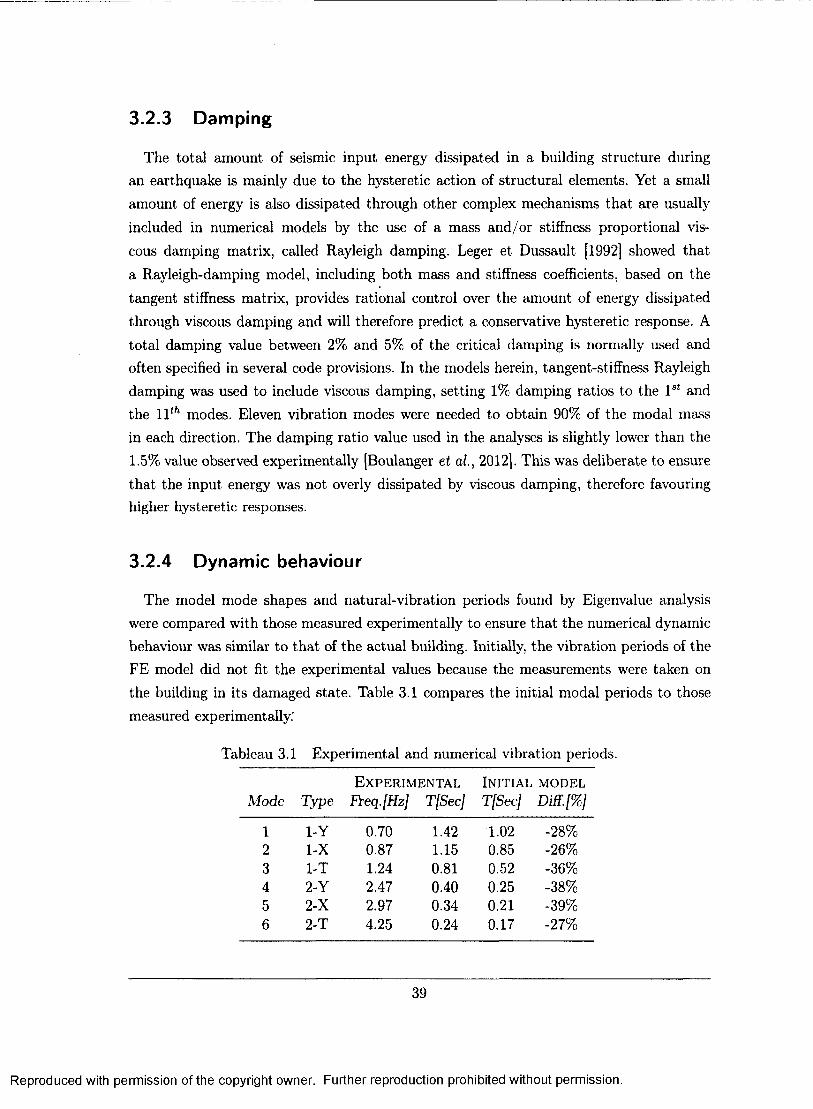
3.2.3 Damping
The total amount of seismic input energy dissipated in a building structure during an earthquake is mainly due to the hysteretic action of structural elements. Yet a small amount of energy is also dissipated through other complex mechanisms that are usually included in numerical models by the use of a mass and/or stiffness proportional vis-cous damping matrix, called Rayleigh damping. Leger et Dussault [1992] showed that a Rayleigh-damping model, including both mass and stiffness coefficients, based on the tangent stiffness matrix, provides rational control over the amount of energy dissipated through viscous damping and will therefore predict a conservative hysteretic response. A total damping value between 2% and 5% of the critical damping is normally used and often specified in several code provisions. In the models herein, tangent-stiffness Rayleigh damping was used to include viscous damping, setting 1% damping ratios to the 1st and the ll"1 modes. Eleven vibration modes were needed to obtain 90% of the modal mass in each direction. The damping ratio value used in the analyses is slightly lower than the 1.5% value observed experimentally [Boulanger et al., 2012]. This was deliberate to ensure that the input energy was not overly dissipated by viscous damping, therefore favouring higher hysteretic responses.
3.2.4 Dynamic behaviour
The model mode shapes and natural-vibration periods found by Eigenvalue analysis were compared with those measured experimentally to ensure that the numerical dynamic behaviour was similar to that of the actual building. Initially, the vibration periods of the FE model did not fit the experimental values because the measurements were taken on the building in its damaged state. Table 3.1 compares the initial modal periods to those measured experimentally.'
Tableau 3.1 Experimental and numerical vibration periods.
EXPERIMENTAL INITIAL MODEL Mode Type Freq. [Hz] T[Sec] T[Sec] Diff.[%]
1 1-Y 0.70 1.42 1.02 -28% 2 1-X 0.87 1.15 0.85 -26% 3 1-T 1.24 0.81 0.52 -36% 4 2-Y 2.47 0.40 0.25 -38% 5 2-X 2.97 0.34 0.21 -39% 6 2-T 4.25 0.24 0.17 -27%
39
Reproduced with permission of the copyright owner. Further reproduction prohibited without permission.
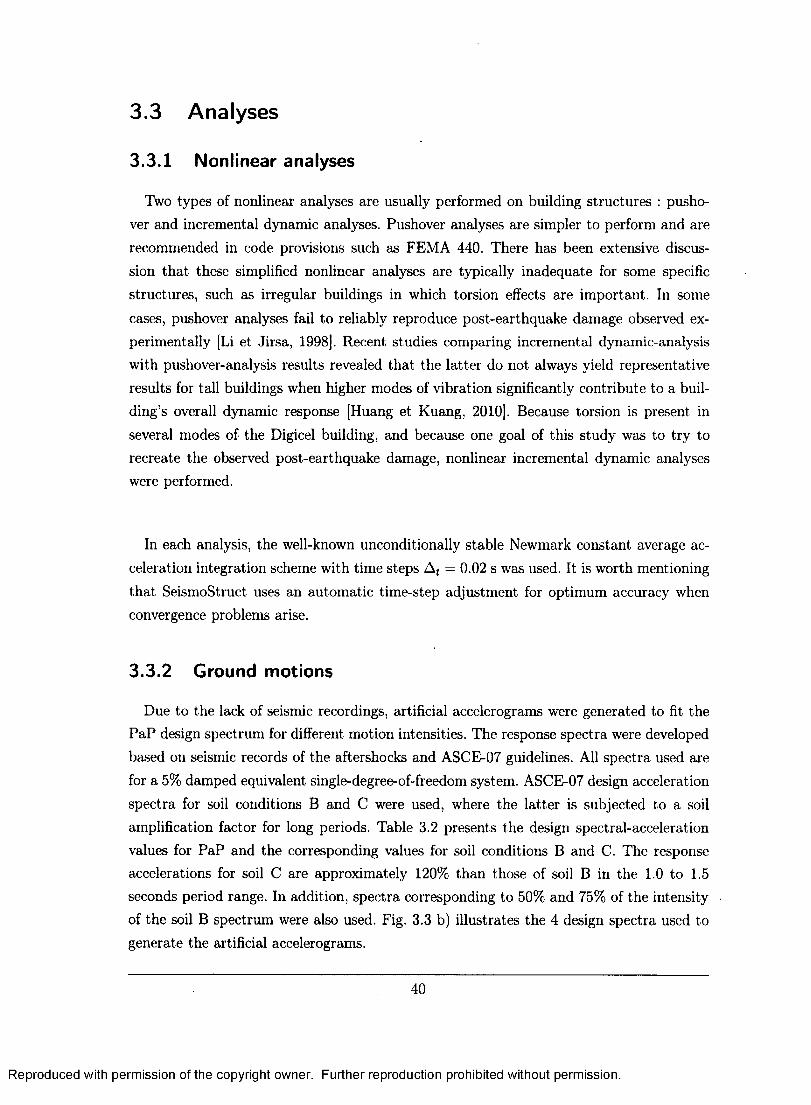
3.3 Analyses
3.3.1 Nonlinear analyses
Two types of nonlinear analyses are usually performed on building structures : pusho-ver and incremental dynamic analyses. Pushover analyses are simpler to perform and are recommended in code provisions such as FEMA 440. There has been extensive discus-sion that these simplified nonlinear analyses are typically inadequate for some specific structures, such as irregular buildings in which torsion effects are important. In some
cases, pushover analyses fail to reliably reproduce post-earthquake damage observed ex-perimentally [Li et Jirsa, 1998]. Recent studies comparing incremental dynamic-analysis with pushover-analysis results revealed that the latter do not always yield representative results for tall buildings when higher modes of vibration significantly contribute to a buil-ding's overall dynamic response [Huang et Kuang, 2010]. Because torsion is present in several modes of the Digicel building, and because one goal of this study was to try to recreate the observed post-earthquake damage, nonlinear incremental dynamic analyses were performed.
In each analysis, the well-known unconditionally stable Newmark constant average ac-celeration integration scheme with time steps At — 0.02 s was used. It is worth mentioning that SeismoStruct uses an automatic time-step adjustment for optimum accuracy when convergence problems arise.
3.3.2 Ground motions
Due to the lack of seismic recordings, artificial accelerograms were generated to fit the PaP design spectrum for different motion intensities. The response spectra were developed based on seismic records of the aftershocks and ASCE-07 guidelines. All spectra used are for a 5% damped equivalent single-degree-of-freedom system. ASCE-07 design acceleration spectra for soil conditions B and C were used, where the latter is subjected to a soil amplification factor for long periods. Table 3.2 presents the design spectral-acceleration values for PaP and the corresponding values for soil conditions B and C. The response accelerations for soil C are approximately 120% than those of soil B in the 1.0 to 1.5 seconds period range. In addition, spectra corresponding to 50% and 75% of the intensity of the soil B spectrum were also used. Fig. 3.3 b) illustrates the 4 design spectra used to generate the artificial accelerograms.
40
Reproduced with permission of the copyright owner. Further reproduction prohibited without permission.
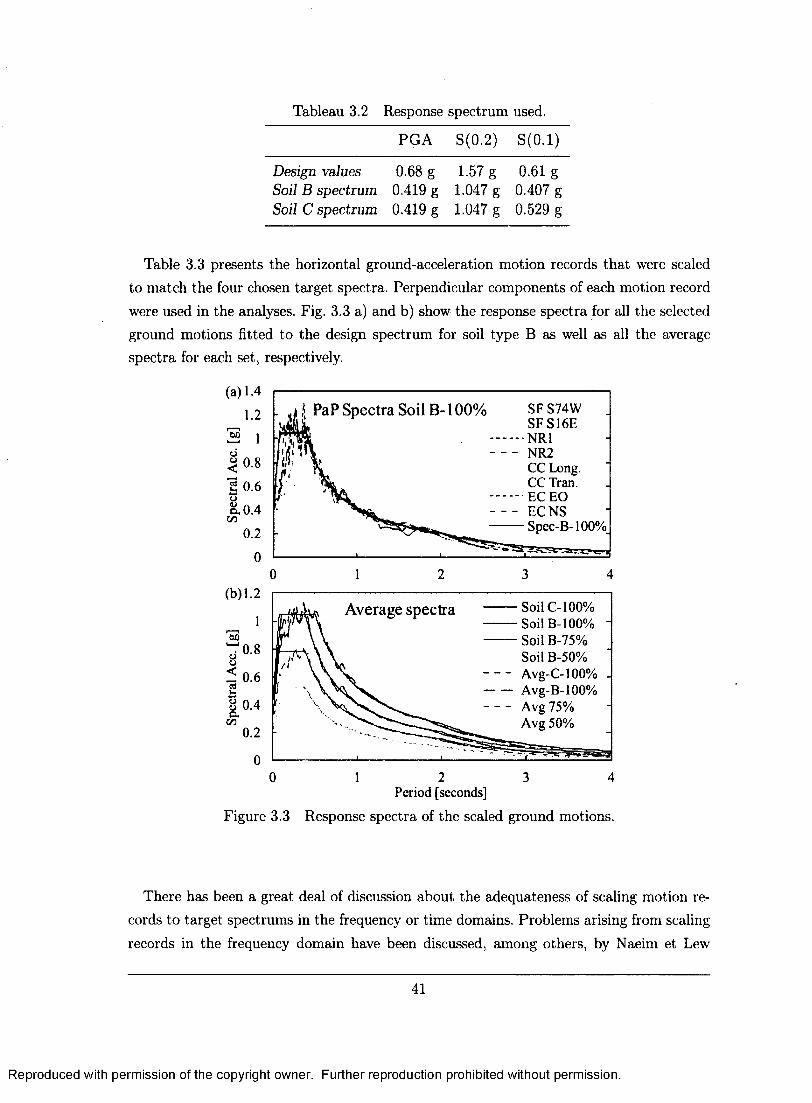
Tableau 3.2 Response spectrum used.
PGA S(0.2) S(0.1)
Design values 0.68 g 1.57 g 0.61 g Soil B spectrum 0.419 g 1.047 g 0.407 g Soil C spectrum 0.419 g 1.047 g 0.529 g
Table 3.3 presents the horizontal ground-acceleration motion records that were scaled to match the four chosen target spectra. Perpendicular components of each motion record were used in the analyses. Fig. 3.3 a) and b) show the response spectra for all the selected ground motions fitted to the design spectrum for soil type B as well as all the average spectra for each set, respectively.
J PaP Spectra Soil B-100% SF S74W SFS16E NR1 NR2 CC Long CC Tran. EC EO FT NS Spec-B-100%
Soil C-100% Average spectra
_ 0.6
Figure
Period [seconds]
3.3 Response spectra of the scaled ground motions.
There has been a great deal of discussion about the adequateness of scaling motion re-cords to target spectrums in the frequency or time domains. Problems arising from scaling records in the frequency domain have been discussed, among others, by Naeim et Lew
41
Reproduced with permission of the copyright owner. Further reproduction prohibited without permission.
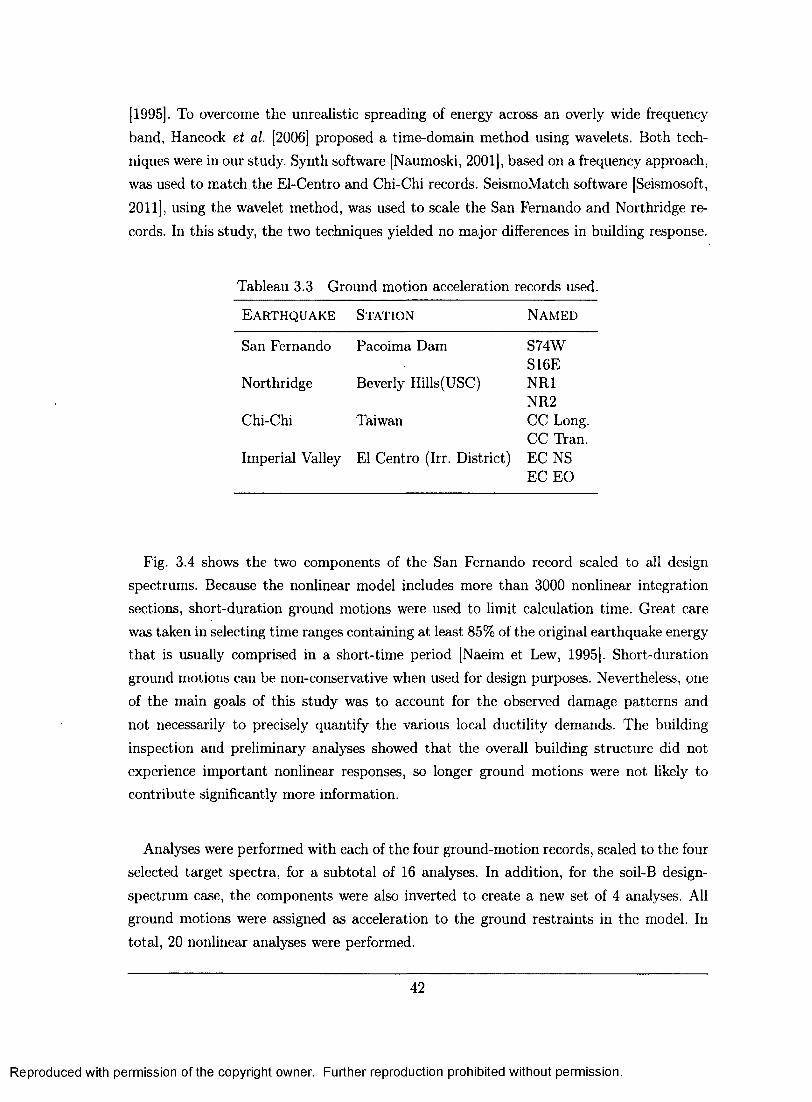
[1995]. To overcome the unrealistic spreading of energy across an overly wide frequency band, Hancock et al. [2006] proposed a time-domain method using wavelets. Both tech-niques were in our study. Synth software [Naumoski, 2001], based on a frequency approach, was used to match the El-Centro and Chi-Chi records. SeismoMatch software [Seismosoft, 2011], using the wavelet method, was used to scale the San Fernando and Northridge re-cords. In this study, the two techniques yielded no major differences in building response.
Tableau 3.3 Ground motion acceleration records used.
EARTHQUAKE STATION NAMED
San Fernando Pacoima Dam S74W S16E
Northridge Beverly Hills(USC) NR1 NR2
Chi-Chi Taiwan CC Long. CC Tran.
Imperial Valley El Centro (Irr. District) EC NS EC EO
Fig. 3.4 shows the two components of the San Fernando record scaled to all design spectrums. Because the nonlinear model includes more than 3000 nonlinear integration sections, short-duration ground motions were used to limit calculation time. Great care was taken in selecting time ranges containing at least 85% of the original earthquake energy that is usually comprised in a short-time period [Naeim et Lew, 1995]. Short-duration ground motions can be non-conservative when used for design purposes. Nevertheless, one of the main goals of this study was to account for the observed damage patterns and not necessarily to precisely quantify the various local ductility demands. The building inspection and preliminary analyses showed that the overall building structure did not experience important nonlinear responses, so longer ground motions were not likely to contribute significantly more information.
Analyses were performed with each of the four ground-motion records, scaled to the four selected target spectra, for a subtotal of 16 analyses. In addition, for the soil-B design-spectrum case, the components were also inverted to create a new set of 4 analyses. All ground motions were assigned as acceleration to the ground restraints in the model. In total, 20 nonlinear analyses were performed.
42
Reproduced with permission of the copyright owner. Further reproduction prohibited without permission.
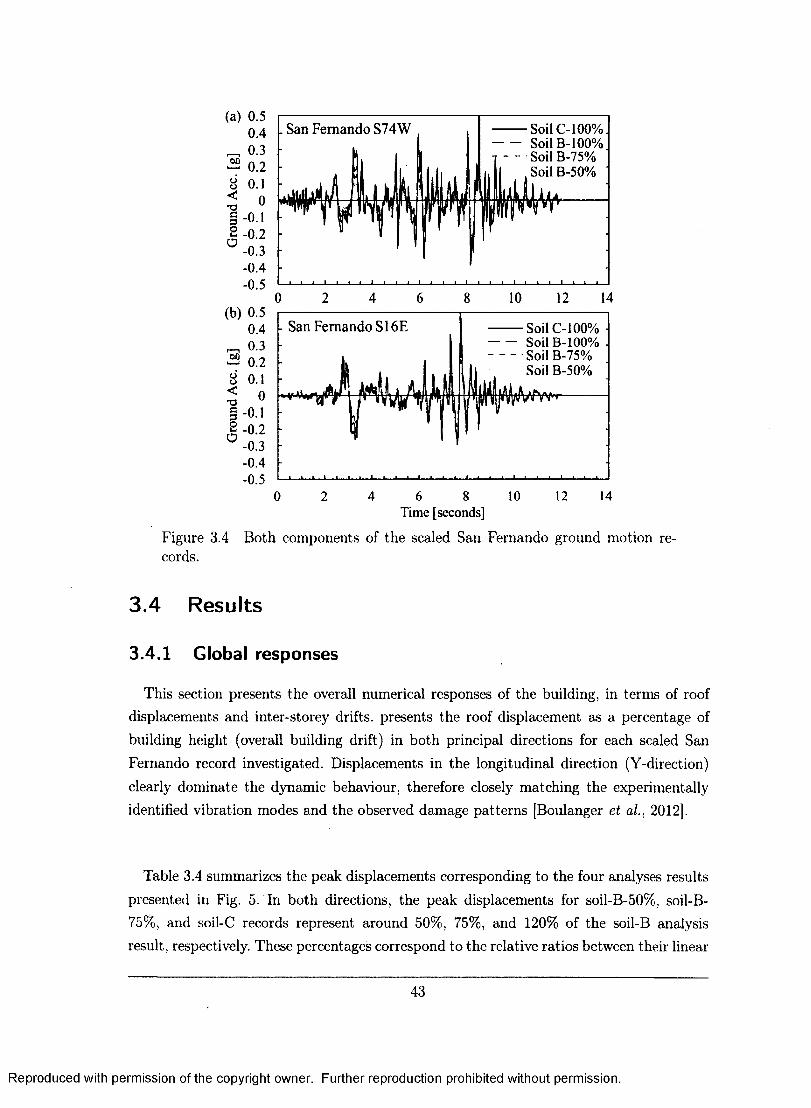
San Fernando S74W Soil C-100% Soil B-100% Soil B-75% Soil B-50%
- San Fernando SI 6E Soil C-100% Soil B-100% Soil B-75% Soil B-50%
w i s -0.1 s -0.2
4 6 8 10 Time [scconds]
Figure 3.4 Both components of the scaled San Fernando ground motion re-cords.
3.4 Results
3.4.1 Global responses
This section presents the overall numerical responses of the building, in terms of roof displacements and inter-storey drifts, presents the roof displacement as a percentage of building height (overall building drift) in both principal directions for each scaled San Fernando record investigated. Displacements in the longitudinal direction (Y-direction) clearly dominate the dynamic behaviour, therefore closely matching the experimentally identified vibration modes and the observed damage patterns [Boulanger et ai, 2012].
Table 3.4 summarizes the peak displacements corresponding to the four analyses results presented in Fig. 5. In both directions, the peak displacements for soil-B-50%, soil-B-75%, and soil-C records represent around 50%, 75%, and 120% of the soil-B analysis result, respectively. These percentages correspond to the relative ratios between their linear
43
Reproduced with permission of the copyright owner. Further reproduction prohibited without permission.
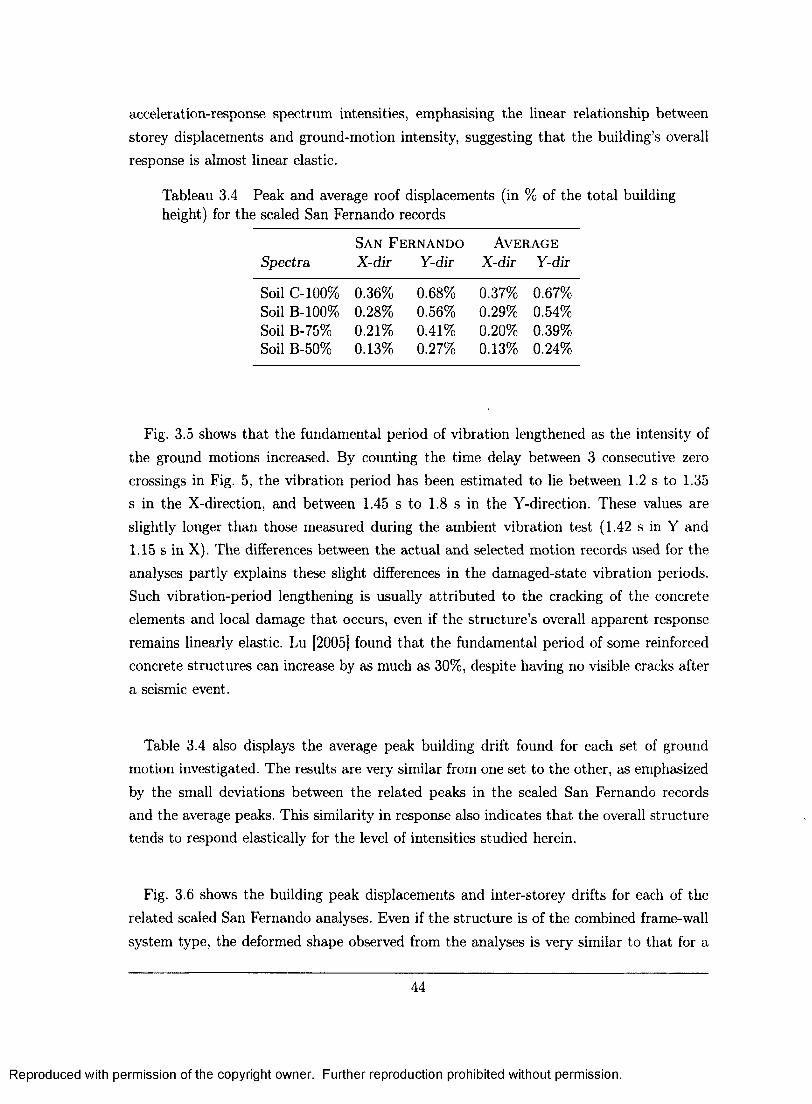
acceleration-response spectrum intensities, emphasising the linear relationship between storey displacements and ground-motion intensity, suggesting that the building's overall response is almost linear elastic.
Tableau 3.4 Peak and average roof displacements (in % of the total building height) for the scaled San Fernando records
SAN FERNANDO AVERAGE Spectra X-dir Y-dir X-dir Y-dir
Soil C-100% 0.36% 0.68% 0.37% 0.67% Soil B-100% 0.28% 0.56% 0.29% 0.54% Soil B-75% 0.21% 0.41% 0.20% 0.39% Soil B-50% 0.13% 0.27% 0.13% 0.24%
Fig. 3.5 shows that the fundamental period of vibration lengthened as the intensity of the ground motions increased. By counting the time delay between 3 consecutive zero crossings in Fig. 5, the vibration period has been estimated to lie between 1.2 s to 1.35 s in the X-direction, and between 1.45 s to 1.8 s in the Y-direction. These values are slightly longer than those measured during the ambient vibration test (1.42 s in Y and 1.15 s in X). The differences between the actual and selected motion records used for the analyses partly explains these slight differences in the damaged-state vibration periods. Such vibration-period lengthening is usually attributed to the cracking of the concrete elements and local damage that occurs, even if the structure's overall apparent response remains linearly elastic. Lu [2005] found that the fundamental period of some reinforced concrete structures can increase by as much as 30%, despite having no visible cracks after a seismic event.
Table 3.4 also displays the average peak building drift found for each set of ground motion investigated. The results are very similar from one set to the other, as emphasized by the small deviations between the related peaks in the scaled San Fernando records and the average peaks. This similarity in response also indicates that the overall structure tends to respond elastically for the level of intensities studied herein.
Fig. 3.6 shows the building peak displacements and inter-storey drifts for each of the related scaled San Fernando analyses. Even if the structure is of the combined frame-wall system type, the deformed shape observed from the analyses is very similar to that for a
44
Reproduced with permission of the copyright owner. Further reproduction prohibited without permission.
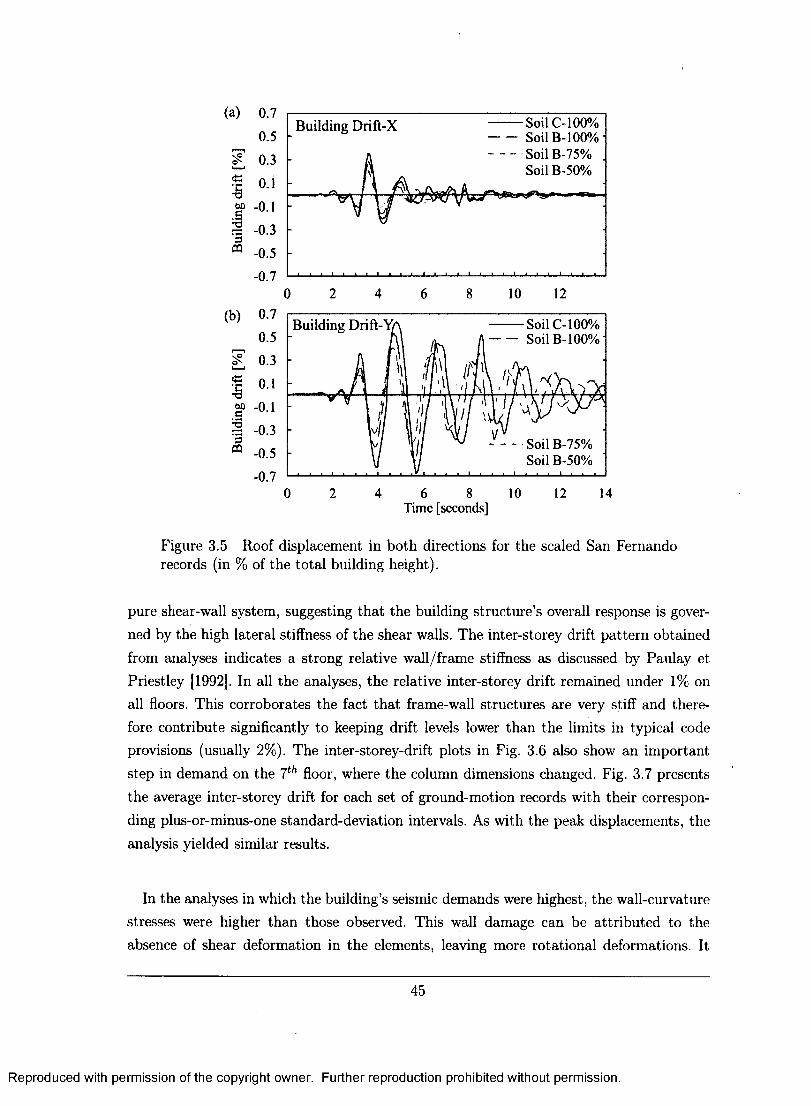
(a) 0.7
0.5
E 0.3
1 °"1
.s "01
i§ -0.3
™ -0.5
-0.7 0 2 4 6 8 10 12
(b) 0.7
0.5
g 0.3
% 0 1
.S '01
§ -0.3
® -0.5
-0.7 0 2 4 6 8 10 12 14
Time [seconds]
Figure 3.5 Roof displacement in both directions for the scaled San Fernando records (in % of the total building height).
pure shear-wall system, suggesting that the building structure's overall response is gover-ned by the high lateral stiffness of the shear walls. The inter-storey drift pattern obtained from analyses indicates a strong relative wall/frame stiffness as discussed by Paulay et Priestley [1992]. In all the analyses, the relative inter-storey drift remained under 1% on all floors. This corroborates the fact that frame-wall structures are very stiff and there-fore contribute significantly to keeping drift levels lower than the limits in typical code provisions (usually 2%). The inter-storey-drift plots in Fig. 3.6 also show an important step in demand on the 7th floor, where the column dimensions changed. Fig. 3.7 presents the average inter-storey drift for each set of ground-motion records with their correspon-ding plus-or-minus-one standard-deviation intervals. As with the peak displacements, the analysis yielded similar results.
In the analyses in which the building's seismic demands were highest, the wall-curvature stresses were higher than those observed. This wall damage can be attributed to the absence of shear deformation in the elements, leaving more rotational deformations. It
45
Building Drift-X Soil C-100% Soil B-100% Soil B-75% . Soil B-50%
Reproduced with permission of the copyright owner. Further reproduction prohibited without permission.
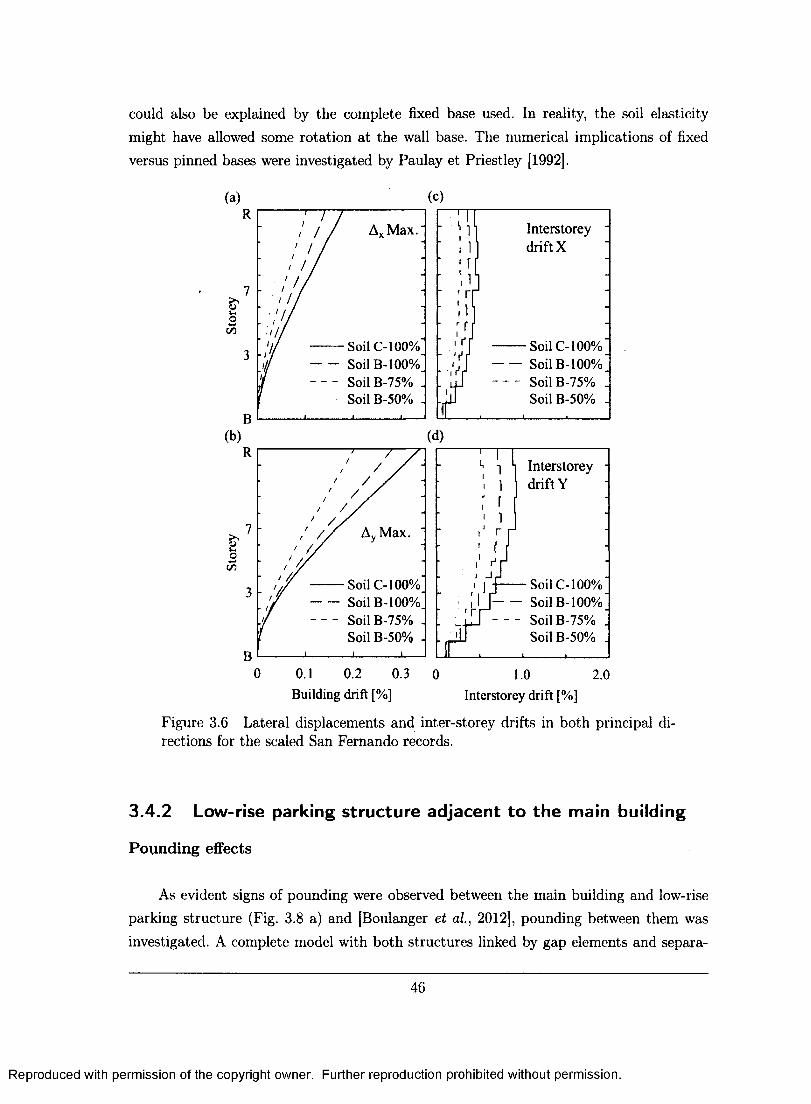
could also be explained by the complete fixed base used. In reality, the soil elasticity might have allowed some rotation at the wall base. The numerical implications of fixed versus pinned bases were investigated by Paulay et Priestley [1992].
(a) (c) R
O o 55
Ax Max.
Soil C-100% Soil B-100% Soil B-75% . Soil B-50% .
Ay Max.
Soil C-100% Soil B-100% Soil B-75% Soil B-50%
- h Interstorey ~ " ! l drift X
" 1 M - 1 n 1 U " r rr • 1 \\
-
111 • r r f -
• iVf Soil C-100%" - Vr1
' ir Soil B-100%"
- Vr1
' ir Soil B-75% .
f Soil B-50% -
Interstorey -i 1 drift Y ; r -
' 1 •
, J r r 1 "
1 1 ' -V
' -V 1J J - -Soil C-100%
; [ IT--- Soil B-100% r pr - Soil B-75% .
i| 1 ' t\ Soil B-50% .
« •
0.1 0.2 0.3
Building drift [%] 1.0 2.0
Interstorey drift [%]
Figure 3.6 Lateral displacements and inter-storey drifts in both principal di-rections for the scaled San Fernando records.
3.4.2 Low-rise parking structure adjacent to the main building
Pounding effects
As evident signs of pounding were observed between the main building and low-rise parking structure (Fig. 3.8 a) and [Boulanger et al, 2012], pounding between them was investigated. A complete model with both structures linked by gap elements and separa-
46
Reproduced with permission of the copyright owner. Further reproduction prohibited without permission.
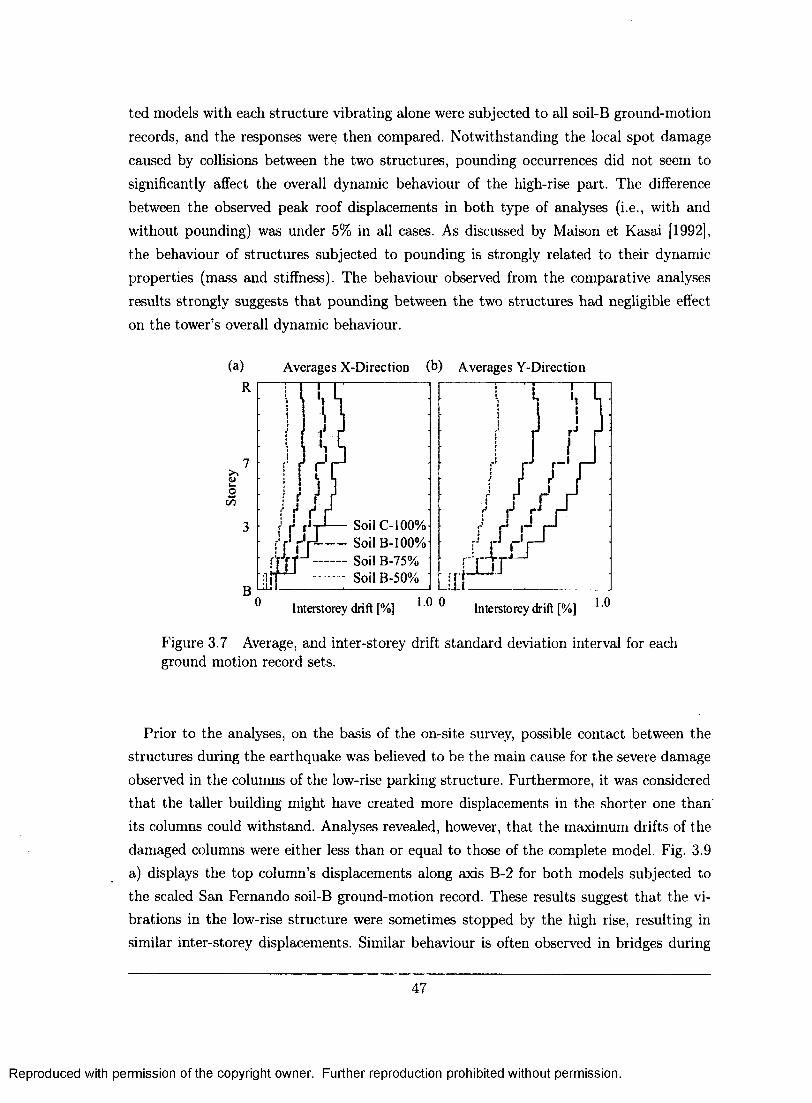
ted models with each structure vibrating alone were subjected to all soil-B ground-motion records, and the responses were then compared. Notwithstanding the local spot damage caused by collisions between the two structures, pounding occurrences did not seem to significantly affect the overall dynamic behaviour of the high-rise part. The difference between the observed peak roof displacements in both type of analyses (i.e., with and without pounding) was under 5% in all cases. As discussed by Maison et Kasai [1992], the behaviour of structures subjected to pounding is strongly related to their dynamic properties (mass and stiffness). The behaviour observed from the comparative analyses results strongly suggests that pounding between the two structures had negligible effect on the tower's overall dynamic behaviour.
(a) Averages X-Direction (b) Averages Y-Direction
R
7
Soil C-100% Soil B-100% Soil B-75% Soil B-50%
3
B 0 Interstorey drift [%] ' ° ^ Interstorey drift [%] 1 ®
Figure 3.7 Average, and inter-storey drift standard deviation interval for each ground motion record sets.
Prior to the analyses, on the basis of the on-site survey, possible contact between the structures during the earthquake was believed to be the main cause for the severe damage observed in the columns of the low-rise parking structure. Furthermore, it was considered that the taller building might have created more displacements in the shorter one than' its columns could withstand. Analyses revealed, however, that the maximum drifts of the damaged columns were either less than or equal to those of the complete model. Fig. 3.9 a) displays the top column's displacements along axis B-2 for both models subjected to the scaled San Fernando soil-B ground-motion record. These results suggest that the vi-brations in the low-rise structure were sometimes stopped by the high rise, resulting in similar inter-storey displacements. Similar behaviour is often observed in bridges during
47
Reproduced with permission of the copyright owner. Further reproduction prohibited without permission.
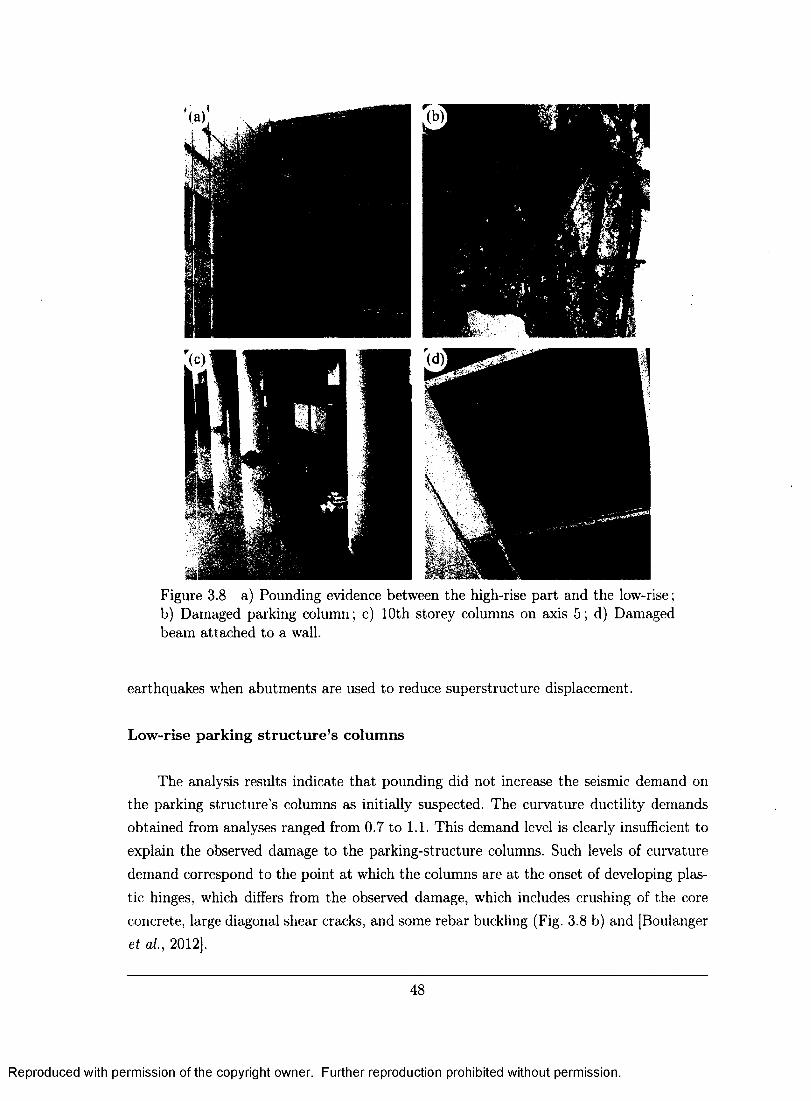
Figure 3.8 a) Pounding evidence between the high-rise part and the low-rise; b) Damaged parking column; c) 10th storey columns on axis 5; d) Damaged beam attached to a wall.
earthquakes when abutments are used to reduce superstructure displacement.
Low-rise parking structure's columns
The analysis results indicate that pounding did not increase the seismic demand on the parking structure's columns as initially suspected. The curvature ductility demands obtained from analyses ranged from 0.7 to 1.1. This demand level is clearly insufficient to explain the observed damage to the parking-structure columns. Such levels of curvature demand correspond to the point at which the columns are at the onset of developing plas-tic hinges, which differs from the observed damage, which includes crushing of the core concrete, large diagonal shear cracks, and some rebar buckling (Fig. 3.8 b) and [Boulanger et ai, 2012].
48
Reproduced with permission of the copyright owner. Further reproduction prohibited without permission.
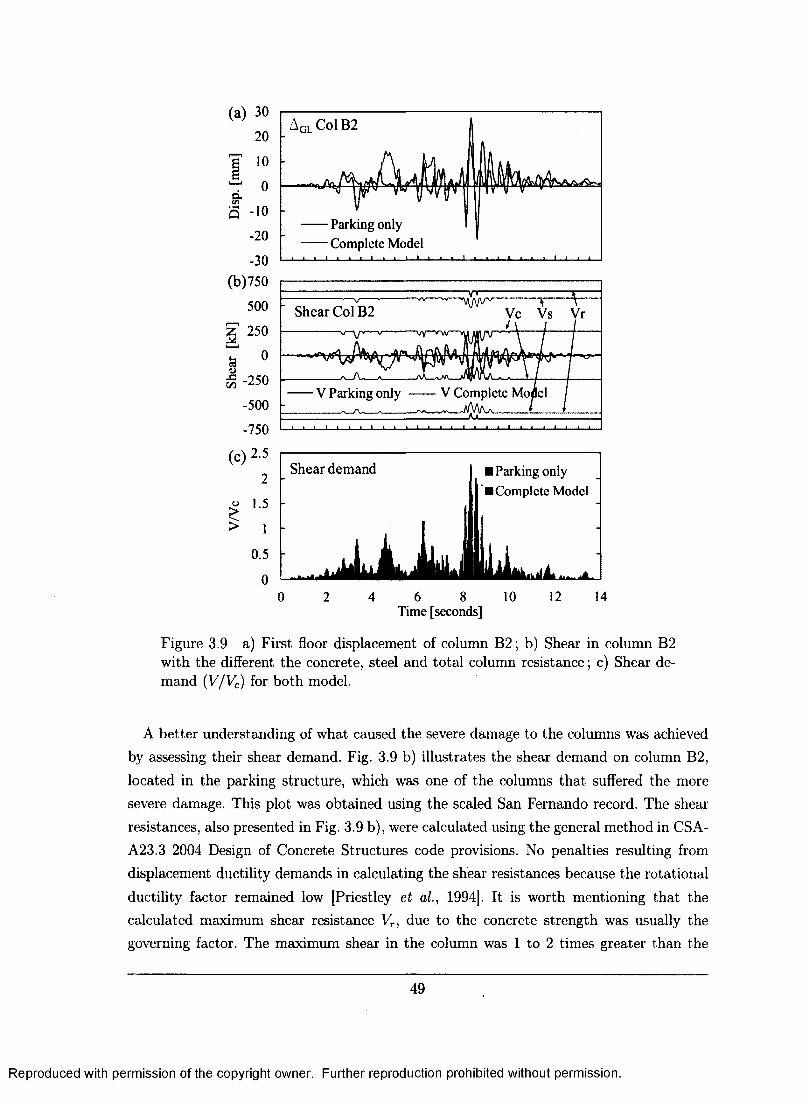
(a) 30
20
I 10 " 0 8* S -io
AGLColB2 J
. . . .
Parking only ' Complete Model
~ "WA/V" Shear Col B2
sr-yv-»-v Vc Vs Vr
V Parking only V Complete Model
AJI
Shear demand Parking only Complete Model
6 8 10 Time [seconds]
Figure 3.9 a) First floor displacement of column B2; b) Shear in column B2 with the different the concrete, steel and total column resistance; c) Shear de-mand (V/Vc) for both model.
A better understanding of what caused the severe damage to the columns was achieved by assessing their shear demand. Fig. 3.9 b) illustrates the shear demand on column B2, located in the parking structure, which was one of the columns that suffered the more severe damage. This plot was obtained using the scaled San Fernando record. The shear resistances, also presented in Fig. 3.9 b), were calculated using the general method in CSA-A23.3 2004 Design of Concrete Structures code provisions. No penalties resulting from displacement ductility demands in calculating the shear resistances because the rotational ductility factor remained low [Priestley et ai, 1994]. It is worth mentioning that the calculated maximum shear resistance Vr, due to the concrete strength was usually the governing factor. The maximum shear in the column was 1 to 2 times greater than the
49
Reproduced with permission of the copyright owner. Further reproduction prohibited without permission.
concrete shear strength (Fig. 3.9 c), but never reached the total resistance, which includes the transverse steel.
The on-site survey revealed that the transverse steel used to resist shear forces was not correctly detailed, with either 90° bent or even straight splices. These types of shear-reinforcement configurations typically do not provide sufficient development lengths to achieve Fs when the concrete has spalled off or cracked. Considering the fact that the maximum shear demand levels largely surpasses Vc, and the initiation of plastic hinges was combined with impact waves induced by pounding strongly suggest that the concrete was sufficiently stressed to sustain major cracking and cover spalling. At that point, the transverse steel could not resist the additional shear, thus leading to large diagonal shear cracks, followed by complete concrete cracking and crushing, leaving only the longitudinal bars to resist both the moment and axial loads.
It is important to mention that the beams were not damaged at all, either on site or in the analyses. The severe column damage leading to the necessity to completely demolish the low-rise part of the building was due to three major design concepts that were not respected. Firstly, the columns were clearly weaker than the beams. Secondly, the transverse reinforcement was improperly detailed. Thirdly, column shear capacity was inadequate to develop any rotational plastic hinges, therefore leading to fragile failures.
3.4.3 Main building
Gravity columns
As explained in the companion paper, most of the columns located on the upper floors were damaged at their base due to high bending moments (Fig. 3.8 c). These da-mages mainly occurred along the Y-direction. The crushing of the concrete cover (cover spalling) observed at the base of the columns was due to high rotational demands, which are difficult to quantify because the level of axial strain in the longitudinal rebars during the earthquake is unknown.
The damage observed at the base of the columns on the upper floors was successfully reproduced in the nonlinear analyses. Fig. 3.10 presents a typical moment-curvature hys-teretic curve corresponding to a column located on the top storey. The results plotted in
50
Reproduced with permission of the copyright owner. Further reproduction prohibited without permission.
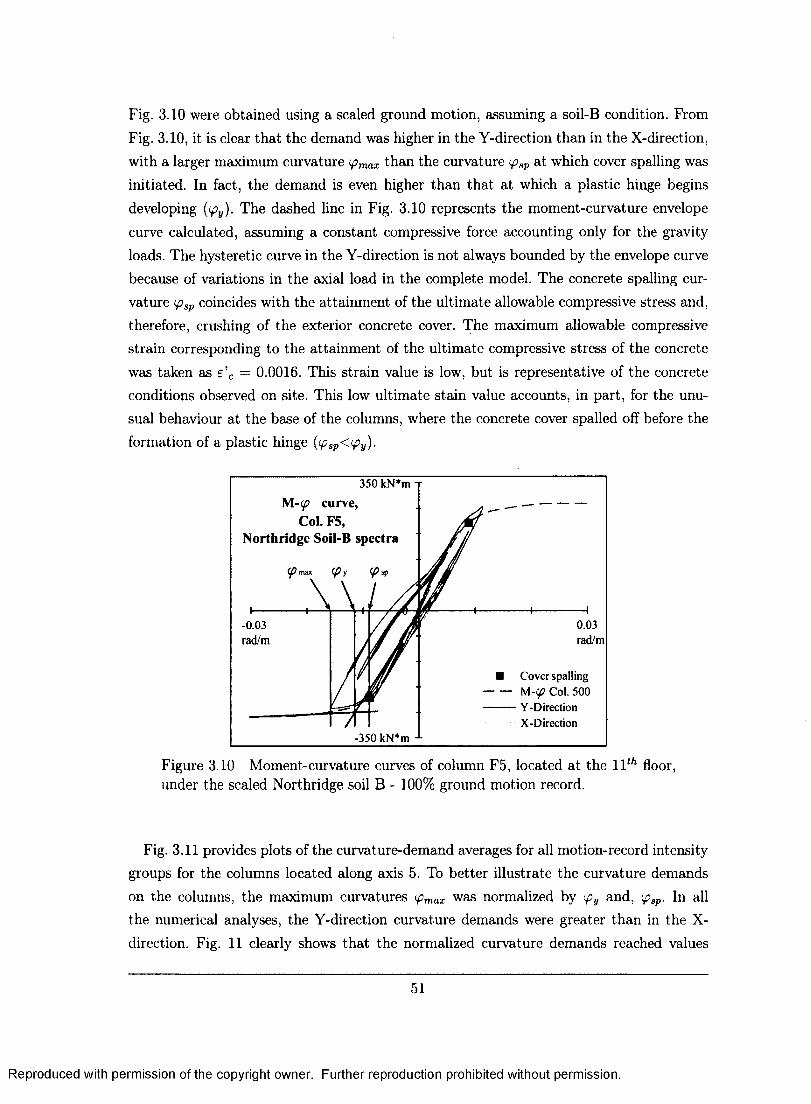
Fig. 3.10 were obtained using a scaled ground motion, assuming a soil-B condition. From Fig. 3.10, it is clear that the demand was higher in the Y-direction than in the X-direction, with a larger maximum curvature <pmax than the curvature <psp at which cover spalling was initiated. In fact, the demand is even higher than that at which a plastic hinge begins developing (<py). The dashed line in Fig. 3.10 represents the moment-curvature envelope curve calculated, assuming a constant compressive force accounting only for the gravity loads. The hysteretic curve in the Y-direction is not always bounded by the envelope curve because of variations in the axial load in the complete model. The concrete spalling cur-vature ipsp coincides with the attainment of the ultimate allowable compressive stress and, therefore, crushing of the exterior concrete cover. The maximum allowable compressive strain corresponding to the attainment of the ultimate compressive stress of the concrete was taken as e'c — 0.0016. This strain value is low, but is representative of the concrete conditions observed on site. This low ultimate stain value accounts, in part, for the unu-sual behaviour at the base of the columns, where the concrete cover spalled off before the formation of a plastic hinge (ipsp<<py).
350 kN*m n M-(p curve J si — "—
Col. F5, Northridge Soil-B spectra
(p max
1 l^\
<py
\
P
A
-0.03 ' 0.03 rad/m / rad/m
/ r /
• Cover spalling M-ipCol. 500 Y-Direction
\A X-Direction -350 kN*m -
Figure 3.10 Moment-curvature curves of column F5, located at the \lth floor, under the scaled Northridge soil B - 100% ground motion record.
Fig. 3.11 provides plots of the curvature-demand averages for all motion-record intensity groups for the columns located along axis 5. To better illustrate the curvature demands on the columns, the maximum curvatures </Wx was normalized by <py and, tpsp. In all the numerical analyses, the Y-direction curvature demands were greater than in the X-direction. Fig. 11 clearly shows that the normalized curvature demands reached values
51
Reproduced with permission of the copyright owner. Further reproduction prohibited without permission.
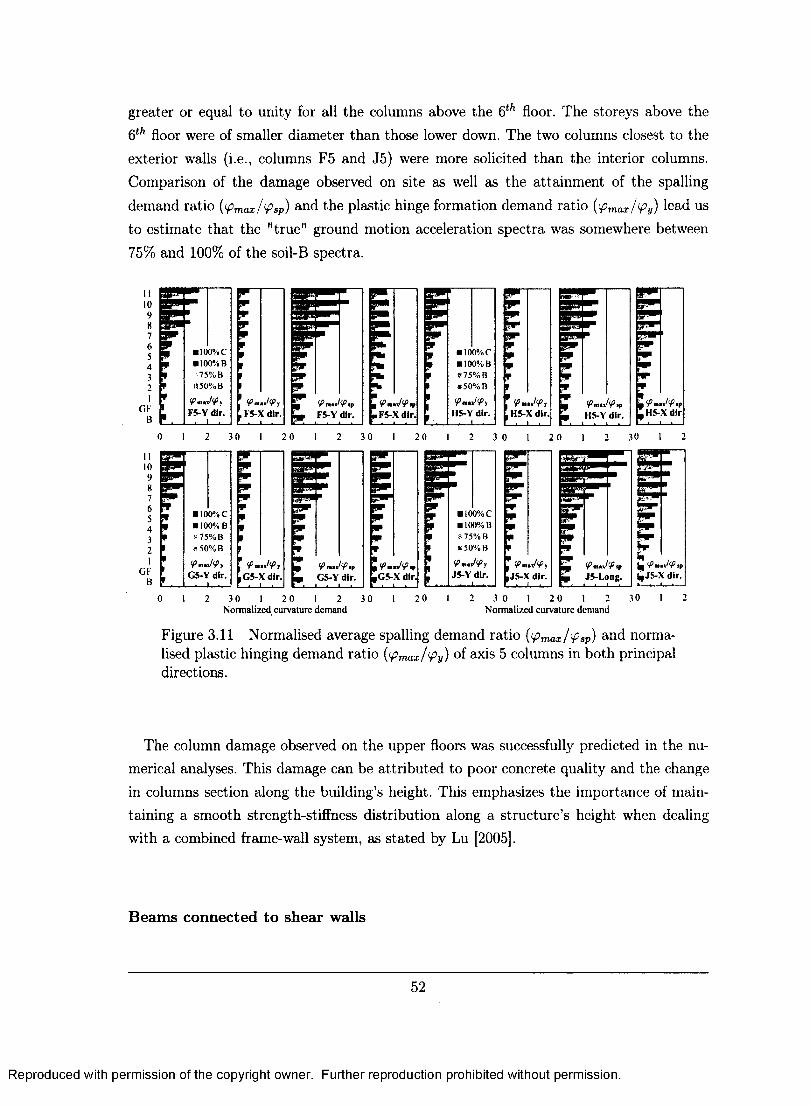
greater or equal to unity for all the columns above the 6 th floor. The storeys above the 6th floor were of smaller diameter than those lower down. The two columns closest to the exterior walls (i.e., columns F5 and J5) were more solicited than the interior columns. Comparison of the damage observed on site as well as the attainment of the spalling demand ratio (<Pmax/fsp) and the plastic hinge formation demand ratio (<Pmax/<Py) lead us to estimate that the "true" ground motion acceleration spectra was somewhere between 75% and 100% of the soil-B spectra.
100%C • 100% B
75% a
H50%B •f IlKl'V V <PmnJ<P
F5-X dir. t f
F5-X dir. F5-Y dir. F5-Y dir.
P™ G5-X dir
7 6 5 4 3 2 1
GF B
•pp * V • 100%C V • 100% B P •' 75% B 1 a 50% B P m wJtfi > F G5-Y dir.
i .
* w m V p V p V
1 <fim J<Py •G5-X dir. . i . GS-Y dir.
2 3 0 1 2 0 1 2 Normalized curvature demand
w w • 100%C 9 • 100% B P »75% B t #50%B 1 <pmnt<py r H 5 -Y dir.
. I .
w w
m p m r t ' 9mJ<Ps , H5-X dir.
5SS9 mm
•p
w
i* <P m.x
W H5-Y dir.
F"
p H5-X dir
3 0 2 0 3 0 1
pi w w
m
9 • 100%C V • 100% B * * 75% B • *50%B i ^m»i !<P y } J5-Y dir.
t .
VmJ<P, J5-X dir.
3 0 1 2 0 1 2 Normalized curvature demand
•T K| fa, <P UJ5-X dir J5-u>ng.
Figure 3.11 Normalised average spalling demand ratio (<pmax/<psp) and norma-lised plastic hinging demand ratio {fmax/^Py) of axis 5 columns in both principal directions.
The column damage observed on the upper floors was successfully predicted in the nu-merical analyses. This damage can be attributed to poor concrete quality and the change in columns section along the building's height. This emphasizes the importance of main-taining a smooth strength-stiffness distribution along a structure's height when dealing with a combined frame-wall system, as stated by Lu [2005].
Beams connected to shear walls
52
Reproduced with permission of the copyright owner. Further reproduction prohibited without permission.
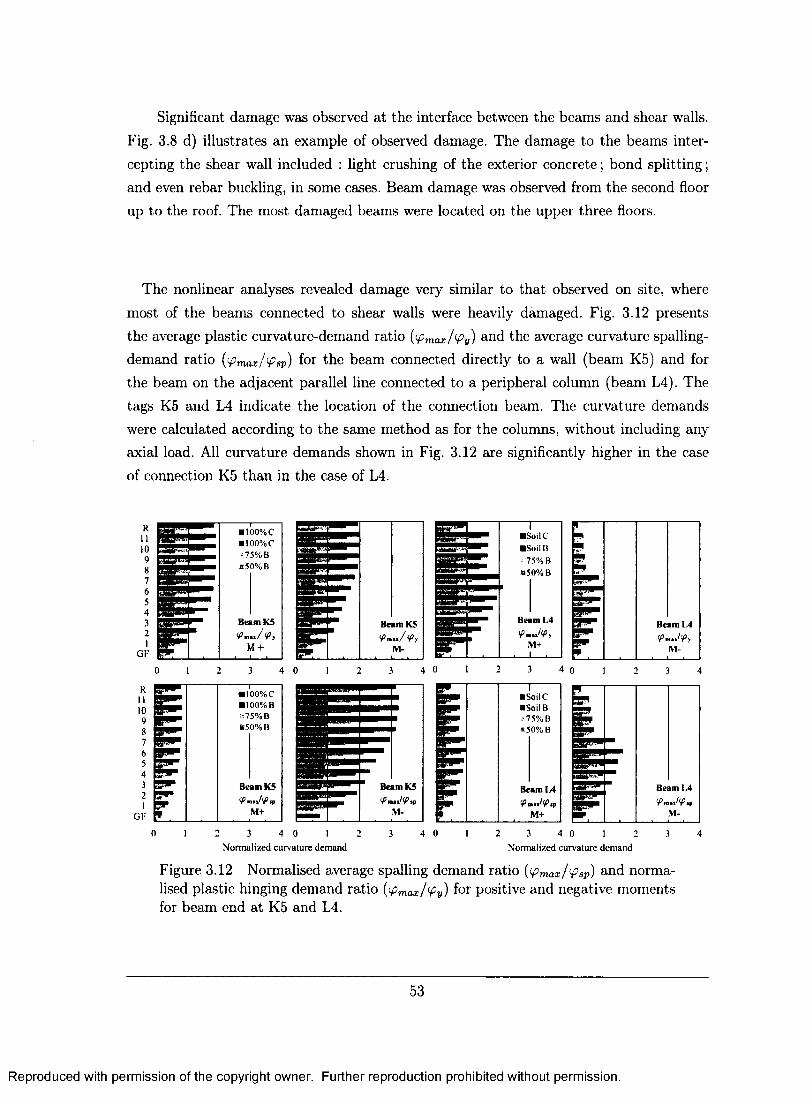
Significant damage was observed at the interface between the beams and shear walls. Fig. 3.8 d) illustrates an example of observed damage. The damage to the beams inter-cepting the shear wall included : light crushing of the exterior concrete; bond splitting; and even rebar buckling, in some cases. Beam damage was observed from the second floor up to the roof. The most damaged beams were located on the upper three floors.
The nonlinear analyses revealed damage very similar to that observed on site, where most of the beams connected to shear walls were heavily damaged. Fig. 3.12 presents the average plastic curvature-demand ratio (<Pmax/<Py) and the average curvature spalling-demand ratio {<Pmax/<Psp) for the beam connected directly to a wall (beam K5) and for the beam on the adjacent parallel line connected to a peripheral column (beam L4). The tags K5 and L4 indicate the location of the connection beam. The curvature demands were calculated according to the same method as for the columns, without including any axial load. All curvature demands shown in Fig. 3.12 are significantly higher in the case of connection K5 than in the case of L4.
• 100%C • ioo%c *75% B
«50%B
Beam K5
M +
R II 10 9 8
i • !00%C • 100% B
R II 10 9 8 £ #75% B
850% B 7 6 •pi* 5 4 3 Beam K5 2 • n ip
OF M+
SoilC
Soil B
75% B
»50%B
Beam L4 9«J<P
M+ Beam K5
SoilC
ISoilB
is75%B
«50%B
Beam K5 Beam \A VmJ<P
M+
Normalized curvature demand 2 3 4 0 1 2 3
Normalized curvature demand
Figure 3.12 Normalised average spalling demand ratio {^max/fsp) and norma-lised plastic hinging demand ratio (<Anax/Vy) f°r positive and negative moments for beam end at K5 and L4.
53
Reproduced with permission of the copyright owner. Further reproduction prohibited without permission.
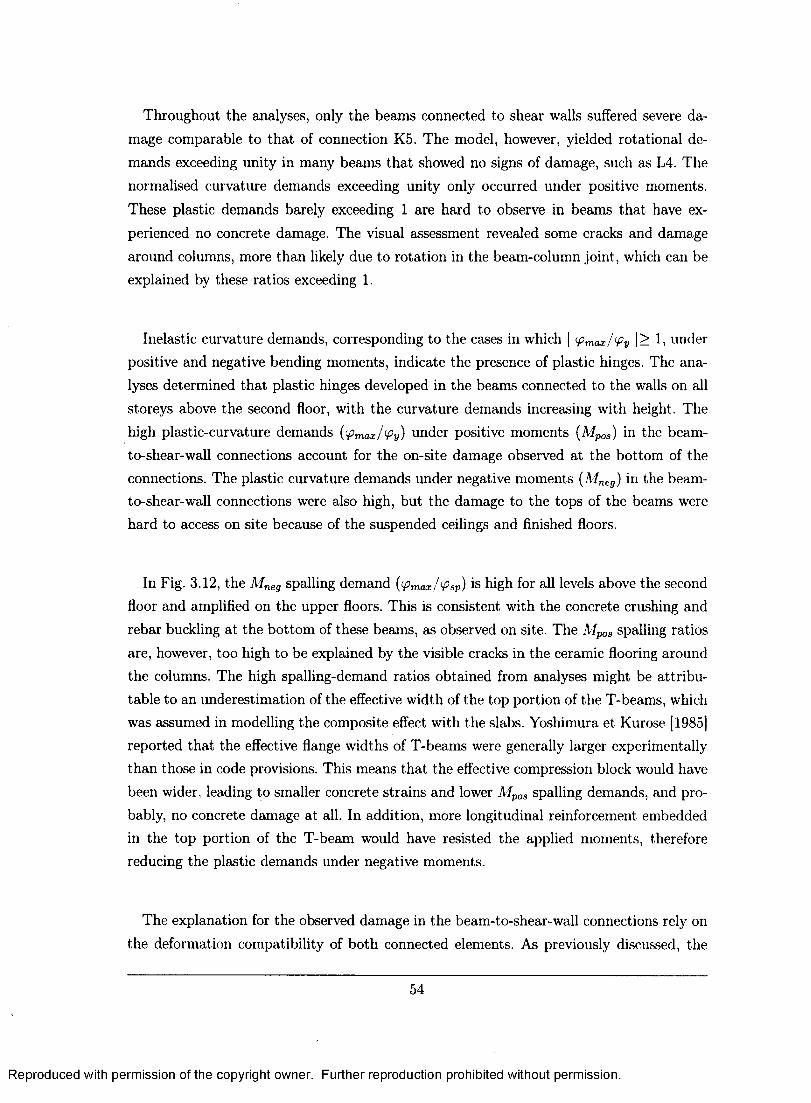
Throughout the analyses, only the beams connected to shear walls suffered severe da-mage comparable to that of connection K5. The model, however, yielded rotational de-mands exceeding unity in many beams that showed no signs of damage, such as L4. The normalised curvature demands exceeding unity only occurred under positive moments. These plastic demands barely exceeding 1 are hard to observe in beams that have ex-perienced no concrete damage. The visual assessment revealed some cracks and damage around columns, more than likely due to rotation in the beam-column joint, which can be explained by these ratios exceeding 1.
Inelastic curvature demands, corresponding to the cases in which | <pmax/<Py I > 1, under positive and negative bending moments, indicate the presence of plastic hinges. The ana-lyses determined that plastic hinges developed in the beams connected to the walls on all storeys above the second floor, with the curvature demands increasing with height. The high plastic-curvature demands (fmax/fy) under positive moments (AIpos) in the beam-to-shear-wall connections account for the on-site damage observed at the bottom of the connections. The plastic curvature demands under negative moments (Mneg) in the beam-to-shear-wall connections were also high, but the damage to the tops of the beams were hard to access on site because of the suspended ceilings and finished floors.
In Fig. 3.12, the Mneg spalling demand [fmax/fsp] is high for all levels above the second floor and amplified on the upper floors. This is consistent with the concrete crushing and rebar buckling at the bottom of these beams, as observed on site. The MpoS spalling ratios are, however, too high to be explained by the visible cracks in the ceramic flooring around the columns. The high spalling-demand ratios obtained from analyses might be attribu-table to an underestimation of the effective width of the top portion of the T-beams, which was assumed in modelling the composite effect with the slabs. Yoshimura et Kurose [1985] reported that the effective flange widths of T-beams were generally larger experimentally than those in code provisions. This means that the effective compression block would have been wider, leading to smaller concrete strains and lower Mpos spalling demands, and pro-bably, no concrete damage at all. In addition, more longitudinal reinforcement embedded in the top portion of the T-beam would have resisted the applied moments, therefore reducing the plastic demands under negative moments.
The explanation for the observed damage in the beam-to-shear-wall connections rely on the deformation compatibility of both connected elements. As previously discussed, the
54
Reproduced with permission of the copyright owner. Further reproduction prohibited without permission.
shape of the laterally deformed building is strongly dominated by its rigid shear walls. Under lateral loads, the deformed shape of the shear walls generated large rotational de-mands in the beams directly connected to them, with the demands increasing with height. Fig. 3.13 shows the increased rotational demand at the ends of beams directly connec-ted to a shear wall. The similar shapes of the building inter-storey drift and K5-beam demand curves also illustrate the connection between the deformation and the damage. Since the displacements were more important in the Y than in the X-direction, the ro-tational demands in the beam-to-wall connections were more important the Y-direction. This is consistent with the damage observed on site. The significant damage to the bottom of these beams can be explained by the smaller effective compression block at the bottom of the beams, leading to concrete crushing under rotational demands.
Figure 3.13 Deformed shape of the building, in the Y-direction, under a seismic input.
This increase in rotational demands at the interface between the beams and shear walls has been reported on in numerical and experimental investigations [Chapdelaine, 1987] and [Bertero et al, 1985]. The interface rotational demands are usually greater under negative moments, because these demands occur on the tension side of the wall, which increasingly deforms or lifts as the steel yields or as wall rocking occurs [Paulay et Priestley, 1992], Lu [2005] experimentally investigated frame-wall structures and found that they were very
55
Reproduced with permission of the copyright owner. Further reproduction prohibited without permission.
efficient in controlling drift because of the high wall stiffness, but result in significant rotational demands in adjacent members where energy can be dissipated. In Lu [2005], the building studied under design earthquakes exhibited overall linear elastic behaviour with no major damage to the shear wall, including rotational damage to adjacent beams. This pattern is exactly what was observed experimentally and numerically in the case of the Digicel building.
3.5 Summary and Conclusions
In the aftermath of the 2010 Haiti earthquake, which left the country in a state of chaos, a research project was undertaken into the seismic behaviour of a 12-storey, frame-wall RC building located in Port-au-Prince. This paper completes an experimental investigation conducted on site that was presented in the first of two companion papers [Boulanger et al., 2012]. In the first paper, the dynamic behaviour was investigated with ambient-vibration tests, and a FE model was updated. This paper is the second of the pair, and its main objectives were to : 1) understand and account for the damage observed after the earthquake; and 2) assess the capability of current numerical tools in predicting such damage.
A total of 20 seismic nonlinear analyses under various earthquake intensities were conducted, and the results were compared with the damage observed on site. The fol-lowing conclusions were drawn from these analyses :
- SeismoStruct finite-element software provided the means to reproduce the observed damage patterns and helped in explaining their various causes.
- Except for local contact damage, the pounding between the high-rise building and the low-rise parking structure did not significantly affect the dynamic behaviour of the high-rise part, which contributed in reducing the motion amplitudes of the low-rise parking facility.
- The assessment of the shear demand in the columns located in the low-rise par-king structure revealed that poor stirrup detailing failed to provide adequate shear resistance and therefore led to intense cracking and concrete crushing.
- The columns located on the top floors of the high-rise building suffered flexural damage in the Y-direction, where more lateral displacements were observed under seismic loading in comparison with the X-direction. The poor concrete mechanical
56
Reproduced with permission of the copyright owner. Further reproduction prohibited without permission.
properties combined with smaller column sections on the 7th floor and up to cause spalling of the concrete at column bases.
- The most severe damage in the high-rise building was observed at the interface bet-ween the beams and shear walls. The rotational demands caused by the geometrical deformation incompatibility between the rigid frames and the shear wall under seis-mic inputs accounted for the severe damage observed, which included : mild crushing of the exterior concrete; bond splitting; and even rebar buckling, in some cases.
- The good overall displacement response of the main building was clearly governed by the high rigidity of the shear walls, showing, one more time, that stiff frame-wall structures are effective in keeping inter-storey drift levels reasonable. Overall, the structure responded linearly to all ground-motion records used in the analyses, but deformation incompatibility between the rigid frame and shear walls led to significant local damage. This typical behaviour of frame-wall structures, where the stiff walls control the drift and frame members dissipate energy, has already been observed and discussed. The design of this type of combined structural systems is complex and proper detailing of the members interfacing both systems is critical.
- Based on analyses, the earthquake's intensity was estimated to lie between 75% and 100% of the soil-B design spectra. The frequency contents of an actual earthquake, however, are rarely widely spread, so the collapse of most small constructions in PaP might be explained by a strong narrow-band, low-frequency-content earthquake that spared long-period building, such as the Digicel.
- Despite poor concrete mechanical properties, poor rebar detailing, and the presence of pounding between the two adjacent buildings, the Digicel building behaved well in response to the tremor and remains functional following the 2010 earthquake.
Acknowledgments
The authors would like to acknowledge the financial support of the Natural Sciences and Engineering Research Council of Canada (NSERC) for the Canadian Seismic Research Network (CSRN), the Quebec Fonds pour la recherche sur la nature et les technologies (FQRNT) for the Centre d'etudes interuniversitaires des structures sous charges extremes (CEISCE), and the Canadian Association for Earthquake Engineering (CAEE). The au-thors would also like to acknowledge the cooperation of Ian Jones, construction manager of the Digicel building, who provided all the necessary information.
57
Reproduced with permission of the copyright owner. Further reproduction prohibited without permission.
CHAPITRE 4
Conclusion
Bien que le seisme d'Haiti ait entrame des centaines de milliers de morts et detruit la ma-jorite des structures de Port-au-Prince, le batiment de la compagnie Digicel a bien resiste et n'a subi que des domrnages reparables. Cornme les etudes post-seismes sont souvent les plus riches en informations et que le batiment etait disponible pour des travaux de recherches, c'etait l'occasion ideale de tenter de comprendre comment s'est comporte le batiment lors du seisme. Les travaux in situ, suivis de la modelisation numerique avaient comme objectifs principaux d'etudier le comportement dynamique de l'ouvrage, de com-prendre la repartition de ses dommages, d'evaluer la capacite des outils numeriques a predire ou a reproduire de tels evenements et d'estimer la puissance de la secousse de janvier 2010.
Une analyse en detail du batiment ainsi que des essais sous vibrations ambiantes ont permis d'evaluer le comportement dynamique de la structure. Les six premiers modes de vibration ainsi que leur amortissement critique ont ete decouvert reaffirmant l'efficacite de ce type d'essais. La calibration d'un modele par elements finis a permis d'obtenir un modele fidele au vrai comportement dynamique du batiment. II a ete demontre que meme si un modele predit bien les frequences propres, il n'est pas trivial qu'il represente son vrai comportement dynamique; 1'allure des modes propres peut etre different. Dans le cas de ce multi-etage, la modelisation des murs de magonnerie etait necessaire afin d'avoir un modele fidele au comportement decouvert lors des essais in situ.
Ce modele calibre a permis de creer un modele plus sophistique afin d'effectuer des analyses numeriques non-lineaires. Les resultats d'une serie d'analyses de differentes intensites ont ete compares aux dommages observes permettant de tirer plusieurs conclusions :
58
Reproduced with permission of the copyright owner. Further reproduction prohibited without permission.
- SeismoStruct s'est avere un outil numerique efficace afin de reproduire fidelement et comprendre les dommages observes.
- Mis a part les dommages locaux decoulant de l'impact des deux structures, leurs contacts lors des oscillations n'ont pas affecte le comportement de la partie multi-etagee, mais ont restreint les deplacements du stationnement.
- Les dommages importants aux colonnes du stationnement ont ete causes par les etriers mal plies qui n'ont pas permis de developper une resistance au cisaillement adequate apportant ainsi beaucoup de fissuration et de l'ecrasement du beton.
- La rotation engendree dans la direction longitudinale (X) des colonnes des etages superieurs de la tour a ete superieure que dans la direction laterale (Y) expliquant les dommages observes. Cette repartition de dommages correspond aux deplacements du batiment et est aussi causee par la plus petite dimension des colonnes aux etages superieurs.
- Les dommages aux extremites des poutres connectees directement aux murs de refend des etages superieurs ont ete les plus importants. La demande en courbure excessive causant ses dommages a ete engendree par la deformation geometrique des murs de refend, qui controle le comportement de la structure.
- Le bon controle des deplacements de la structure a clairement ete obtenu grace a la grande rigidite relative des murs de refend dans ce systeme murs-cadres. La structure generale a repondu lineairement a toutes les analyses, mais l'incompatibilite des deformations des deux systemes a apporte des dommages locaux importants. Ce type de reponse, ou la grande rigidite des murs controle les deplacements et que les cadres dissipent de l'energie, est typique a ce systeme. Le dimensionnement de ce type de systeme est complexe et le ferraillage des elements joignant les deux composantes est critiques afin d'avoir la reponse desiree.
- D'apres les analyses, l'intensite du seisme se retrouve entre les spectres de dimen-sionnement du sol type B a 100% et celui a 75%. Par contre, le contenu frequentiel d'un vrai seisme n'est pratiquement jamais repandu sur toutes les frequences. L'eten-due des dommages aux petits batiments de Port-au-Prince peut done etre expliquee par un seisme tres puissant en hautes frequences, epargnant les batiments a longues periodes comme le batiment de la compagnie Digicel.
59
Reproduced with permission of the copyright owner. Further reproduction prohibited without permission.
Malgre les details de dimensionnement mal realises et la mauvaise qualite du beton utilise, le batiment a bien resiste aux secousses et est demeure operationnel. Ceci reaffirme qu'il est possible de construire des ouvrages securitaires malgre des conditions difficiles.
L'analyse en detail du comportement dynamique du batiment a permis d'evaluer les per-formances d'une autre structure qui a connu un seisme important. Les analyses numeriques ont permis de bien comprendre la repartition des dommages, mais surtout de les expli-quer. Le dimensionnement parasismique est un defi important, et le cas du batiment de la compagnie Digicel en est un parfait exemple. Le pliage des armatures, la separation entre les differentes parties, la qualite des materiaux et l'impact de l'incompatibilite des defor-mations de deux systemes utilises conjointement sont de ces details du genie parasismique que le cas du batiment de la compagnie Digicel a mis a l'avant-scene. II est bien triste de savoir que de tels evenements vont se reproduire, mais si chacun de ces evenements aide la communaute scientifique a mieux comprendre toutes les subtilites du dimensionnement parasismique, les differents codes de dimensionnement continueront a s'ameliorer tout en diminuant la vulnerability des populations aux tremblements de terre.
60
Reproduced with permission of the copyright owner. Further reproduction prohibited without permission.
LISTE DES REFERENCES
Bendat, J. S. et Piersol, A. G. (2000). Random Data : Analysis ans Measurement Proce-dures, 3e edition. Wiley-Interscience, Los Angeles, California.
Bertero, V., Aktan, A. E., Charney, F. et Sause, R. (1985). EARTHQUAKE SIMULATOR TESTS AND ASSOCIATED EXPERIMENTAL, ANALYTICAL, AND CORRELA-TION STUDIES OF ONE-FIFTH SCALE MODEL. American Concrete Inst, Detroit, MI, USA, p. 375-424.
Beyer, K., Dazio, A. et Priestley, M. J. N. (2008). Inelastic wide-column models for u-shaped reinforced concrete walls. Journal of Earthquake Engineering, volume 12, p. 1-33.
Boulanger, B., Lamarche, C.-P., Proulx, J. et Paultre, P. (2012). Analysis of a damaged 12-storey frame-wall concrete building during the 2010 haiti earthquake, part i : Dynamic behaviour assessment. Canadian journal of civil engineering, (submitted).
Brincker, R., Zhang, L. et Andersen, P. (2001). Modal identification of output-only systems using frequency domain decomposition. Dans European COST F3 Conference on System Identification and Structural Health Monitoring, Dept. of Building Technol. Structural Eng., Aalborg Univ., Denmark, volume 10. IOP Publishing, UK, p. 441-5.
Brownjohn, J. M. W. et Xia, P.-Q. (2000). Dynamic assessment of curved cable-stayed bridge by model updating. Journal of structural engineering New York, N. Y., vo-lume 126, numero 2, p. 252-260.
Calabrese, A., Almeida, J. P. et Pinho, R. (2010). Numerical issues in distributed in-elasticity modeling of rc frame elements for seismic analysis. Journal of Earthquake Engineering, volume 14, p. 38-68.
Chapdelaine, M. (1987). Non-linear dynamic analysis of a ductile reinforced concrete frame-wall building.
Chi, W.-M., El-Tawil, S., Deierlein, G. G. et Abel, J. F. (1998). Inelastic analyses of a 17-story steel framed building damaged during northridge. Engineering Structures, volume 20, numero 4-6, p. 481-495.
CSA (2004). Design of concrete structures. CSA standard CSA-A23.3-04- Canadian Stan-dards Association, Mississauga, Ont.
Darbre, G. R. et Proulx, J. (2002). Continuos ambient-vibration monitoring of the arch dam of mauvoisin. Earthquake Engineering and Structural Dynamics, volume 31, nu-mero 2, p. 475-480.
Filippou, F. C., Popov, E. P. et Bertero, V. V. (1983). Modelling of r/c joints under cyclic excitations. Journal of Structural Engineering, volume 109, numero 11, p. 2666-2684.
61
Reproduced with permission of the copyright owner. Further reproduction prohibited without permission.
Hancock, J., Watson-Lamprey, J., Abrahamson, N. A., Bommer, J. J., Markatis, A., Mc-Coy, E. et Mendis, R. (2006). An improved method of matching response spectra of recorded earthquake ground motion using wavelets. Journal of Earthquake Engineering, volume 10, p. 67-89.
Huang, K. et Kuang, J. S. (2010). On the applicability of pushover analysis for seismi-cevaluation of medium-and high-rise buildings. Structural Design of Tall and Special Buildings, volume 19, numero 5, p. 573-588.
Jeong, S. . et Elnashai, A. S. (2005). Analytical assessment of an irregular rc frame for full-scale 3d pseudo-dynamic testing part i : Analytical model verification. Journal of Earthquake Engineering, volume 9, numero 1, p. 95-128.
Lamarche, C.-P. (2005). Etude experimental du comportement dynamique des batiments de faible hauteur en acier.
Lamarche, C. P., Paultre, P., Proulx, J. et Mousseau, S. (2008). Assessment of the fre-quency domain decomposition technique by forced-vibration tests of a full-scale struc-ture. Earthquake Engineering and Structural Dynamics, volume 37, numero 3, p. 487-494.
Lamarche, C.-P., Proulx, J., Paultre, P., Turek, M., Ventura, C., Le, T. P. et Levesque, C. (2009). Toward a better understanding of the dynamic characteristics of single-storey braced steel frame buildings in canada. Canadian Journal of Civil Engineering, volume 36, numero 6, p. 969 - 79.
Leger, M. et Dussault, S. (1992). Seismic-energy dissipation in mdof structures. Journal of structural engineering New York, N.Y., volume 118, numero 5, p. 1251-1269.
Li, Q. S., Xiao, Y. Q., Wong, C. K. et Jeary, A. P. (2004). Field measurements of typhoon effects on a super tall building. Engineering Structures, volume 26, numero 2, p. 233-244.
Li, Y. R. et Jirsa, J. O. (1998). Nonlinear analyses of an instrumented structure damaged in the 1994 northridge earthquake. Earthquake Spectra, volume 14, numero 2, p. 265-283.
Llera, D. L., Chopra, A. K. et Almazan, J. L. (2001). Three-dimensional inelastic response of an rc building during the northridge earthquake. Journal of Structural Engineering, volume 127, numero 5, p. 482-489.
Lu, Y. (2005). Inelastic behaviour of rc wall-frame with a rocking wall and its analysis incorporating 3-d effect. Structural Design of Tall and Special Buildings, volume 14, numero 1, p. 15-35.
Madas, P. (1993). Advanced modelling of composite frames subjected to earthquake loa-ding.
Maison, B. F. et Kasai, K. (1992). Dynamics of pounding when two buildings collide. Earthquake Engineering and Structural Dynamics, volume 21, numero 9, p. 771-786.
62
Reproduced with permission of the copyright owner. Further reproduction prohibited without permission.
Mander, J. B., Priestley, M. J. N. et Park, R. (1988). Theoretical stress-strain model of confined concrete. Journal of structural engineering New York, N.Y., volume 114, numero 8, p. 1804-1826.
Martinez-Rueda, J. et Elnashai, A. S. (1997). Confined concrete model under cyclic load. Materials and Structures/Materiaux et Constructions, volume 30, numero 197, p. 139 147.
Menegotto, M. et Pinto, P. E. (1973). Method of analysis for cyclically loaded r.c. plane frames including changes in geometry and non-elastic behaviour of elements under com-bined normal force and bending. Dans Symposium on the Resistance and Ultimate Deformability of Structures Acted on by Well Defined Repeated Loads. International As-sociation for Bridge and Structural Engineering, p. 15-22.
Monti, G., Nuti, C. et Santini, S. (1996). CYRUS-Cyclic Response of Upgraded Sections (Rapport technique 96-2). University of Chieti.
Naeim, F. et Lew, M. (1995). On the use of design-spectrum compatible time histories. Earthquake Spectra, volume 11, numero 1, p. 111-111.
Nagato, K. et Kawase, H. (2004). Damage evaluation models of reinforced concrete buil-dings based on the damage statistics and simulated strong motions during the 1995 hyogo-ken nanbu earthquake. Earthquake Engineering and Structural Dynamics, vo-lume 33. numero 6, p. 755-774.
Naumoski, N. D. (2001). Program synth - generation of artificial accelerograms compatible with a target spectrum, university of Ottawa, Ottawa, ont.
Paulay, T. et Priestley, M. J. N. (1992). Seismic design of reinforced concrete and masonry buildings.
Paultre, P., Proulx, J., Ambroise, S., Prepetit, C. et Calais, E. (2012). Damage to engi-neered structures during the january 12, 2010, haiti (leogane) earthquake. Canadian journal of civil engineering, (submitted).
Pinho, R., Bhatt, C., Antoniou, S. et Bento, R. (2008). Modelling of the horizontal slab of a 3d irregular building for nonlinear static assessment. Dans The l^th World Conference on Earthquake Engineering.
Priestley, M. J. N., Verma, R. et Xiao, Y. (1994). Seismic shear strength of reinforced concrete columns. Journal of structural engineering New York, N.Y., volume 120, nu-mero 8, p. 2310-2328.
Saiful Islam, M. (1996). Analysis of the northridge earthquake response of a damaged non-ductile concrete frame building. Structural Design of Tall Buildings, volume 5, numero 3, p. 151-182.
Saudi, G., Reynolds, P., Zaki, M. et Hodhod, H. (2009). Finite-element model tuning of global modes of a grandstand structure using ambient vibration testing. Journal of Performance of Constructed Facilities, volume 23, numero 6, p. 467-479.
63
Reproduced with permission of the copyright owner. Further reproduction prohibited without permission.
Scott, M. H. et Fenves, G. L. (2006). Plastic hinge integration methods for force-based beam-column elements. Journal of Structural Engineering, volume 132, numero 2, p. 244-252.
Seismosoft (2011). Seismomatch, a computer program for spectrum matching of earth-quake records.
SeismoSoft (2011). Seismostruct, a computer program for static and dynamic nonlinear analysis of framed structures.
Shepherd, R. et Plunkett, A. W. (1983). Damage analyses of imperial county services building. Journal of Structural Engineering, volume 109, numero 7, p. 1711-1736.
Solutions, S. V. (2005). Artemis extractor.
Tamura, Y., Yoshida, A. et Zhang, L. (2004). Evaluation techniques of damping in buil-dings. Dans CTBUH 2004 World Congress, p. 158-165.
Todorovska, M. I. et Ttifunac, M. D. (2008). Impulse response analysis of the van nuys 7-storey hotel during 11 earthquakes and earthquake damage detection. Structural Control and Health Monitoring, volume 15, numero 1, p. 90-116.
Trifunac, M. D. (1972). Comparisons between ambient and forced vibration experiments. Earthquake Engineering and Structural Dynamics, volume 1, p. 133-150.
Ventura, C. E., Liam Finn, W. D., Lord, J.. et Fujita, N. (2003). Dynamic characteristics of a base isolated building from ambient vibration measurements and low level earthquake shaking. Soil Dynamics and Earthquake Engineering, volume 23, numero 4, p. 313-322.
Ventura, C. E., Lord, J. F., Turek, M., Brincker, R., Andersen, P. et Dascotte, E. (2005). Fem updating of tall buildings using ambient vibration data. Dans Sixth European Conference on Structural Dynamics. Millpress, Rotterdam, p. 237-242.
Ventura, C. E. et Schuster, N. D. (1996). Structural dynamic properties of a reinforced concrete high-rise building during construction. Canadian journal of civil engineering, volume 23, numero 4, p. 950-972.
Yoshimura, M. et Kurose, Y. (1985). INELASTIC BEHAVIOR OF THE BUILDING. American Concrete Inst, Detroit, MI, USA, p. 163-201.
Yuksel, E. et Teymur, P. (2011). Earthquake performance improvement of low rise rc buildings using high strength clay brick walls. Bulletin of Earthquake Engineering, volume 9, numero 4, p. 1157-1181.
64
Reproduced with permission of the copyright owner. Further reproduction prohibited without permission.