Embed Size (px)
Citation preview

7/25/2019 esa notes gsdggb
http://slidepdf.com/reader/full/esa-notes-gsdggb 1/52
U6AEA24 EXPERIMENTAL STRESS ANALYSIS L T P C
3 0 0 3OBJECTIVE
To bring awareness on experimental method of finding the response of the structure to different types
of load.
UNIT I Measureme!s "
Principles of measurements, Accuracy, Sensitivity and range of measurements.
UNIT II E#!es$me!ers "
Mechanical, Optical Acoustical and lectrical extensometers and their uses, Advantages and
disadvantages.
UNIT III E%e&!r'&a% Res's!a&e S!ra' (au)es "
Principle of operation and re!uirements, Types and their uses, Materials for strain gauge. "alibration
and temperature compensation, cross sensitivity, #osette analysis, $heastone bridge and
potentiometer circuits for static and dynamic strain measurements, strain indicators.
UNIT IV P*$!$e%as!'&'!+ "
Two dimensional photo elasticity, "oncept of light % photoelastic effects, stress optic law,
&nterpretation of fringe pattern, "ompensation and separation techni!ues, Photo elastic materials.
&ntroduction to three dimensional photo elasticity.
UNIT V N$ , -es!ru&!'e Tes!') "
'undamentals of ()T, #adiography, ultrasonic, magnetic particle inspection, 'luorescent penetranttechni!ue, ddy current testing, Acoustic mission Techni!ue, 'undamentals of brittle coating
methods.
TOTAL/ 4 1er'$s
TEXT BOOS
*. Srinath, +.S., #aghava, M.#., +ingaiah, ., -aragesha, -., Pant ., and
#amachandra, ., /xperimental Stress Analysis0, Tata Mc-raw12ill, (ew )elhi,
*345.
REERENCE BOOS
*. )ally, 6.$., and #iley, $.'., /xperimental Stress Analysis0, Mc-raw12ill &nc., (ew 7or8,*334.
9. 2etyenyi, M., /2and boo8 of xperimental Stress Analysis0, 6ohn $iley and Sons &nc., (ew
7or8, *3:9.
;. Polloc8 A.A., /Acoustic mission in Acoustics and <ibration Progress0, d. Stephens
#.$.., "hapman and 2all, *33;.
1

7/25/2019 esa notes gsdggb
http://slidepdf.com/reader/full/esa-notes-gsdggb 2/52
UNIT , I
MEASUREMENTSE#1er'me!/
The special observation mode to confirm or disomething doubt 4=*.
S!ress aa%+s's/
&t is an ngineering discipline that determines the stress in materials > structures
sub?ected to static or dynamic forces @or loads.
A'm $5 !*e aa%+s's/ To determine whether the Belement or collection of elementsC
/ST#D"TD#0 can safely with stand the specified forces.
(ormally the safety load can be measured using '.O.S Bfactor of safetyC
ultimate stress
maximum allow the stress=
This 'O.S. given to design engineering for the purpose of design. 'rom the '.O.S the
design Analyst calculate design
/)esign factor /ultimate tensile stress
Maximum calculator tensile stress=
Types of load acting on a structureE
∗Tension
∗"ompression
∗Shear )esign factor is got by use of these variables
∗Torsion
∗ending
Software Dsed y )esign ngg
∗ Pro 1 Mechanica
∗ Analysis
∗ Misc software
∗ (astron
∗ #ohrF Banalysis softwareC
∗ "aesar &&
2

7/25/2019 esa notes gsdggb
http://slidepdf.com/reader/full/esa-notes-gsdggb 3/52
. 7*a! 's measureme!8
The process of obtaining the magnitude of a !uantity such as length or mass relativeto a unit of measurement such as meters or 8ilogram.
∗ The act of measuring or the process of being measured BusedC
∗ The system of measuring
S+s!em 9 u'! 's/
→ &nternational System of units
→ &mperial system
→ Metric system
TYPES O MEASUREMENT/
-enerally two measurements
* VECTOR:S / have an magnitude Ban amountC > a direction
9 SCALAR:S / have an magnitude but have no direction.
On the basis of S.& units the measure divided > classified into following,
+inear Blength or distanceC
Mass BweightC
<olume
Temperature
All measuring instruments have calibrations. These are mar8ings or division in
measuring tool.
L'ear/
+inear measurements are made using a Metric stic8 or Metric #uler.
Measured in meter centimeter millimeter↓ ↓ ↓
m cm mm
Mass/
Mass measurements are made using a balance
There are several 8inds of balance,
o Triple beam balance
o )ial % a gram balance
o lectric G digital balance
o Analytical balance
Measured in gram, 8ilograms, centigrams, milligrams.
3

7/25/2019 esa notes gsdggb
http://slidepdf.com/reader/full/esa-notes-gsdggb 4/52
V$%ume/
The volume of any solid, li!uid, gas, plasma or vacuum is how much ;1) space it occupies
Measured in cubic meters, cubic centimeter liters, milliliters.
Tem1era!ure/
Temperature measurement using modern scientific thermometers > temperature scales.
Measured in 'ahrenheit, elvin, celcius.
Pr'&'1%es $5 measureme!/
The techni!ues of measurement are of immense importance in most facets of
scientific research > human civiliFation.
"omputation with decimals fre!uently involves the addition or subtraction of numbers
do not have the same number of decimal places.
Es!'ma!'$/
stimation is the calculated approximation of a result which is usable even if input
data may be incomplete or uncertain. &t can be computed precisely.
Pre&'s'$/
The Measurement of a precision depends upon how precisely the instrument is
mar8ed. &t is important to realiFe that precision refers to the siFe of the smallest division on
the scale.
Simply we can say, that one instrument is more precise than another does not imply
that the less precise instrument is poorly manufactured.
The precision of measurement system also called reproducibility or repeatability
⇓&t is degree to which repeated measurement under unchanged conditions show the
same resultHs.
Re1r$u&';'%'!+/
&t is one of the main principles of the scientific method > refers to the ability of a test
or experiment to be accurately reproduced.
Re1ea!a;'%'!+/
4

7/25/2019 esa notes gsdggb
http://slidepdf.com/reader/full/esa-notes-gsdggb 5/52
&t is the variation in measurement ta8en by a single, person or instrument on the same
item > under the same conditions.
A&&ura&+/
The accuracy of measurement depends upon the relative siFe of the probable error.
The Accuracy of a measurement system is the degree of closeness of measurements of
a !uantity to its actual BtrueC value.
The measurement system is valid if it is both accurate > precise.
No of true positives + no of true negativesACCURACY =no of true positives & false positives + false negatives + true negatives
No of true positivesPrecision
No of true positives false positives=
+Accuracy I @Sensitivity @prevalence J specificity B*1prevalencyC
Accuracy may be determined from sensitivity > specificity provided prevalence.
Ses'!''!+/
No of true positives
sensitivity No of true positives + no of false negatives=
S1e&'5'&'!+/
specificityINo of true negatives
No of true negatives + no of false positives
E#am1%e/
True positives @TP % sic8 people correctly diagno as sic8
'alse positives @'P K 2ealthy as sic8
True (egatives @T( K 2ealthy correctly indentified as healthy
'alse negatives @'(K Sic8 people incorrectly identified as healthy'alse positives > 'alse negatives also called as Type %& > Type && error
TP → condition present J positive result
'P → condition absent J positive result
'( → condition present J (egative result
T( → condition absent J (egative result
5
7/25/2019 esa notes gsdggb
http://slidepdf.com/reader/full/esa-notes-gsdggb 6/52
E#am1%e/
* ;.:9 inches or 95*: feet
o $e can say ;.:9 inches is more precise
o 95*: feet is more accurate
9 ;= seconds or 94 secondHs
• ;= second is more accurate > Precise.
Err$r/
&t is classified into two types
systematicerrorrandom
Systematic error impacts the accuracy of measurement results
* 'actory instrument
9 'aculty measuring
; Personal bias
Err$rs !$ a$'e s+s!ema!'& err$r/
* &nstrument error
9 Procedural error
; Personal bias
Ra$m err$r:s/
* +east count error
9 Mean value of measurement
Percent of rror Iprobable error
Measured value
6

7/25/2019 esa notes gsdggb
http://slidepdf.com/reader/full/esa-notes-gsdggb 7/52
UNIT , II
EXTENSOMETERS
S!ra' Measureme!
I!r$u&!'$
Strain gauges are mostly used to measure strains on the free surface of a body. The
state of strain at any point on the free surface of a body can be characteriFed in terms of three
"artesian strain components ∈xx,∈y y and γ x y as
∈x x Iu vxy
x y
∂ ∂∈ =∂ ∂
γ L7 Iv u
x y
∂ ∂+
∂ ∂
$here u and v are the displacement components in x and y directions respectively.
These e!uations suggest that if the two displacements u and v can be measured at all points
on the surface of a body, strains at any point on the surface can be determined.
&t is seen from !. @*.* that the "artesian strains are actually the slopes of thedisplacement surfaces u and v. 'or precision in the estimation of the slopes of the
displacement surfaces, the in1plane displacements u and v should be determined !uite
accurately. 2owever, particularly for small elastic strains, the in1plane displacements are
exceedingly small. (o versatile and easy method is yet available for the direct measurement
of these displacements over the entire surface of a body. This difficulty is overcome partially
by using a strain gauge to measure the change in the distance between two points on the
surface of the body due to straining. This change in length is converted to axial strain by the
following relationshipE
∈xx
u
x
∆=∆
2ere ∆ u is the change in length over a distance or the gauge length, ∆x. &t is to be
noted that the strain measured in this manner represents only the average strain over the
gauge length, ∆x. The magnitude of error in the strain measured this way depends on the
strain gradient along the gauge length ∆ x and the length ∆ x. This aspect is discussed further
in Sec.
Strain gauges of all types are essentially devices that sense the change in length,
magnify it and indicate it in some form. They can be classified into broadly five groups on
the basis of the physical employed for the magnification of change in length.
@i Mechanical@ii Optical
7

7/25/2019 esa notes gsdggb
http://slidepdf.com/reader/full/esa-notes-gsdggb 8/52
@iii lectrical
@iv Pneumatic, and
@v Acoustical.
Strain gauges of these types are discussed briefly in the following sections.
Me&*a'&a% S!ra' (au)es/
<a= >u))e;er)er a CEJ E#!es$me!ers
These mechanical devices are generally 8nown as extensometers and are used to
measure strain under static or gradually varying loading conditions. An extensometer is
usually provided with two 8nife edges which are clamped firmly in contact with the test
component at a specific distance or gauge length apart. $hen the test component is strained,
the two 8nife edges undergo a small relative displacement. This is amplified through amechanical lin8age and the magnified displacement or strain is displayed on a calibrated
scale.
The erry strain gauge @'ig. *.* uses a system of a lever and dial gauge to magnify the
small displacement between the 8nife edges. &t can Measure strains down to *= microstrain
over a N= mm gauge length. The mechanical amplifying element in the "6 extensometer is
a twisted metal strip or torsion tape stretched between the 8nife edges.
')ure/ Berr+ S!ra' (au)e
8

7/25/2019 esa notes gsdggb
http://slidepdf.com/reader/full/esa-notes-gsdggb 9/52
')ure/ J$*ass$ e#!es$me!er
2alf the length of this strip is twisted in one direction while the other half is twisted inthe opposite direction. A pointer is attached at the centre. The displacement of the 8nife
edges, i.e. starching of the torsion
')ure/ >u))e;er)er e#!es$me!er
tape is converted into a highly amplified rotational movement of the pointer. The "6
extensometer can measure strain with a sensitivity of N micro strain over a gauge length of
N= mm.
&n the 2uggenberger extensometer @'ig. *.; a set of compound levers is used to
magnify the displacement of the 8nife edges. The extensometer is highly accurate, reliable,
light1weight and self1contained. The movable 8nife edge @ f) rotates the lever c about thelower pivot. The lever c in turn rotates the pointer through the lin8 d. The magnification
ratio is given by 1**9a*a9. xtensometers with this ratio varying between ;== and 9=== and
with gauge lengths in the range .N to *== mm are available. The sensitivity of these
extensometers could be as high as *= micro strain. &t is well suited for applications where its
unusually large height does not pose problems of instability in mounting.
<;= S&ra!&* (au)e
The scratch gauge is a self1contained compact device providing a permanent record of displacement over a period of time. &n this gauge
9

7/25/2019 esa notes gsdggb
http://slidepdf.com/reader/full/esa-notes-gsdggb 10/52
')ure/ S&ra!&* )au)e <Pre?'!! Ass$&'a!es@ USA=
the relative displacement between two stainless steel base planets L and S secured to the testcomponent causes a scriber D to scratch sharply the actual component deformation on a
small brass @targer, T . The target is held in position by two tiny rollers and two stainless
steel brushes. The free end of the long driver brush B engages a peripheral groove of the
target. &t is also guided in a bent tube BT. $hen a tensile deformation is removed or a
compressive deformation is produced, the plates L and S move towards each other. This
causes the driver brush B to rotate the circular target by a small amount. 2owever during a
tensile deformation the driver brush B ?ust slides bac8 in the target groove without rotating
it. Thus tensile movements scribe a line parallel to the gauge axis @'ig. *.N. "ompressive
movements and removal of tensile strain scribe a line at approximately 5N o to the gauge axis.
The height h of the recorded data is the product of the strain and gauge length. The traces on
the target are evaluated by viewing them with a microscope having a calibrated eye1piecescale. The minimum strain that a scratch gauge can sense is about *== micro strain. The
gauge lengths of these gauges are rather large.
')ure/ S&ra!&* )au)e re&$r
The scratch gauge is compact in siFe and weighs less than ;= g. &t can be attached to
almost any surface with clamps or screws or adhesive bonding. &t can measure stresses
under all types of loading1static, fatigue or shoc8. &t can be used to record stresses in all
types of environments1 room and elevated temperatures, under water, under radiation, etc.
10

7/25/2019 esa notes gsdggb
http://slidepdf.com/reader/full/esa-notes-gsdggb 11/52
O1!'&a% (au)es
<a= Me&*a'&a%O1!'&a% (au)es
&n mechanical1optical gauges a combination of mechanical and optical levers are used
to amplify the relative displacement between the 8nife edges. The moving 8nife is pivoted.
So that it rotates while undergoing displacement.
The principle of the signal mirror system is illustrated in 'ig. *.. The pivoting
8nife edge carries a mirror A. The reflection of an illuminated scale B in this mirror is
viewed through the observing telescope. Any deformation of the structure to which this
gauge is fixed, rotates the mirror A and thereby brings different portion of the scale into
view.
')ure/ Mar!es $1!'&a% )au)e
Thus the change in the reading on the scale is directly proportional to the deformation
being measured.
A schematic diagram of the Tuc8erman optical gauge and the autocollimator used
with it is given in 'ig. *.:. The autocollimator carries both the source of a parallel beam
of light and an optical system with reticle to measure the deflection of the reflected ray. A
tungsten1carbide.
11
7/25/2019 esa notes gsdggb
http://slidepdf.com/reader/full/esa-notes-gsdggb 12/52
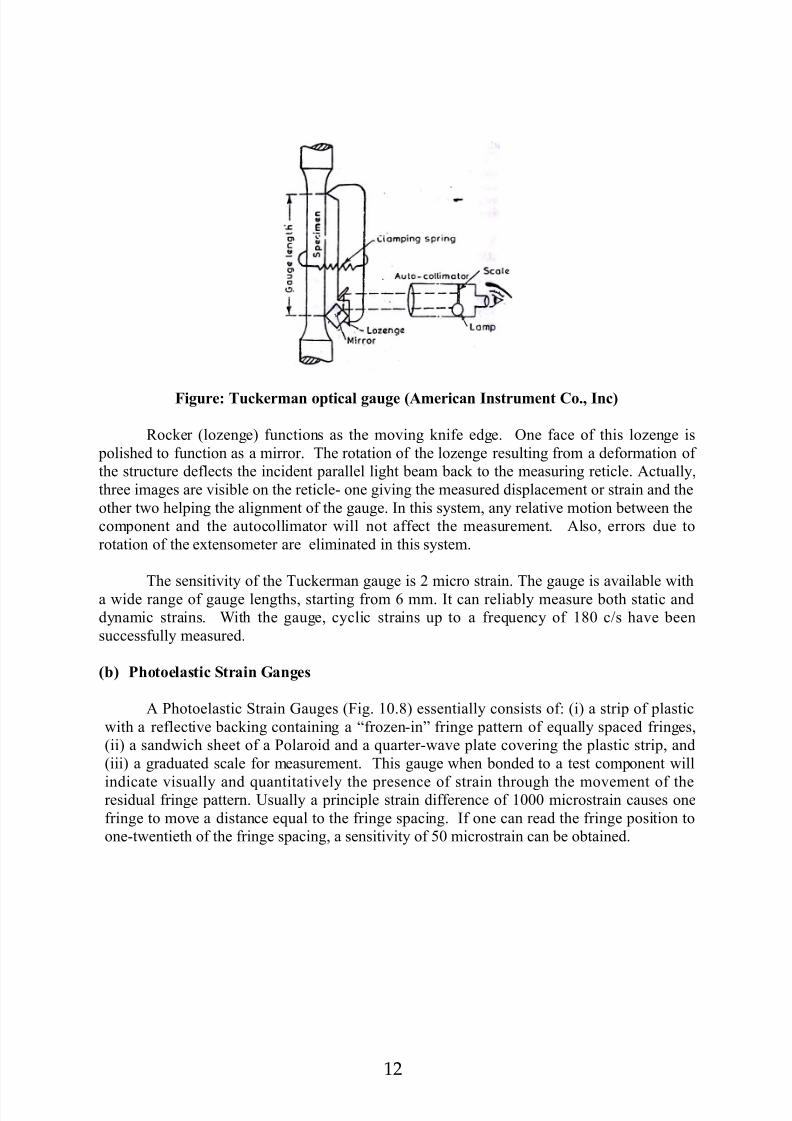
')ure/ Tu&erma $1!'&a% )au)e <Amer'&a Is!rume! C$.@ I&=
#oc8er @loFenge functions as the moving 8nife edge. One face of this loFenge is
polished to function as a mirror. The rotation of the loFenge resulting from a deformation of
the structure deflects the incident parallel light beam bac8 to the measuring reticle. Actually,
three images are visible on the reticle1 one giving the measured displacement or strain and the
other two helping the alignment of the gauge. &n this system, any relative motion between the
component and the autocollimator will not affect the measurement. Also, errors due to
rotation of the extensometer are eliminated in this system.
The sensitivity of the Tuc8erman gauge is 9 micro strain. The gauge is available with
a wide range of gauge lengths, starting from mm. &t can reliably measure both static and
dynamic strains. $ith the gauge, cyclic strains up to a fre!uency of *4= cGs have been
successfully measured.
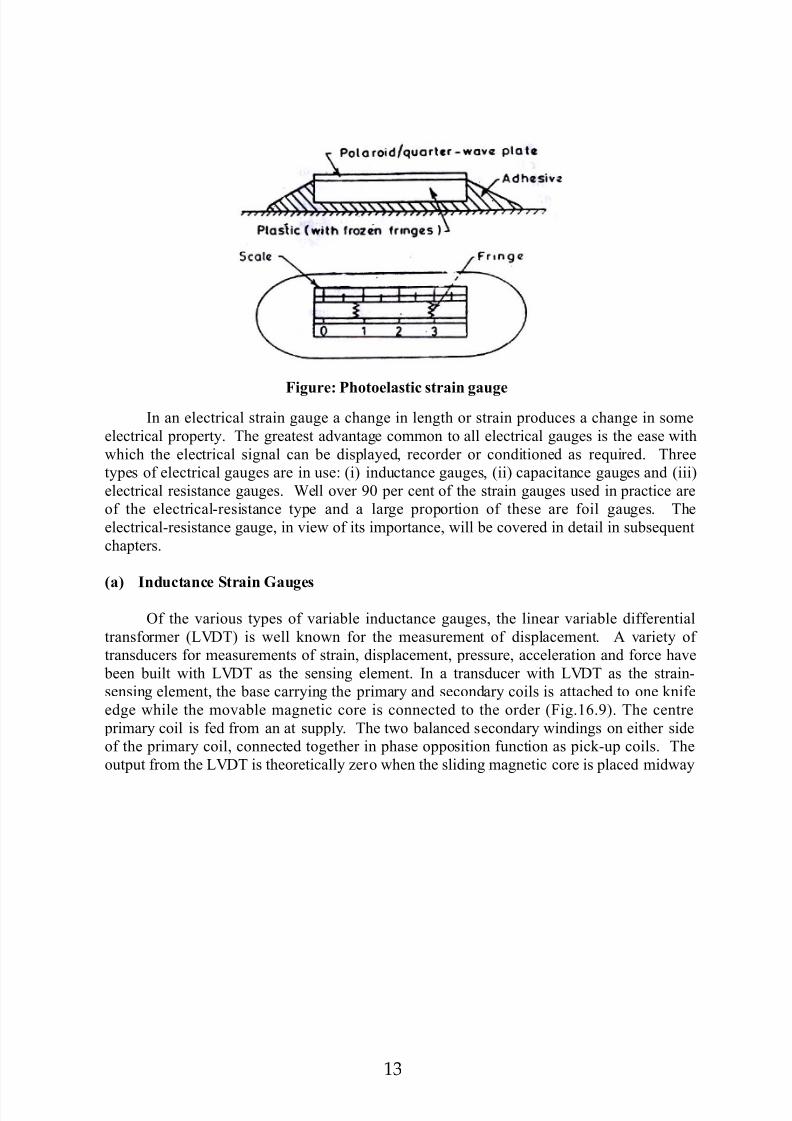
<;= P*$!$e%as!'& S!ra' (a)es
A Photoelastic Strain -auges @'ig. *=.4 essentially consists ofE @i a strip of plastic
with a reflective bac8ing containing a /froFen1in0 fringe pattern of e!ually spaced fringes,
@ii a sandwich sheet of a Polaroid and a !uarter1wave plate covering the plastic strip, and
@iii a graduated scale for measurement. This gauge when bonded to a test component will
indicate visually and !uantitatively the presence of strain through the movement of theresidual fringe pattern. Dsually a principle strain difference of *=== microstrain causes one
fringe to move a distance e!ual to the fringe spacing. &f one can read the fringe position to
one1twentieth of the fringe spacing, a sensitivity of N= microstrain can be obtained.
12
7/25/2019 esa notes gsdggb
http://slidepdf.com/reader/full/esa-notes-gsdggb 13/52
')ure/ P*$!$e%as!'& s!ra' )au)e
&n an electrical strain gauge a change in length or strain produces a change in some
electrical property. The greatest advantage common to all electrical gauges is the ease with
which the electrical signal can be displayed, recorder or conditioned as re!uired. Three
types of electrical gauges are in useE @i inductance gauges, @ii capacitance gauges and @iii
electrical resistance gauges. $ell over 3= per cent of the strain gauges used in practice are
of the electrical1resistance type and a large proportion of these are foil gauges. The
electrical1resistance gauge, in view of its importance, will be covered in detail in subse!uent
chapters.
<a= Iu&!a&e S!ra' (au)es
Of the various types of variable inductance gauges, the linear variable differential
transformer @+<)T is well 8nown for the measurement of displacement. A variety of
transducers for measurements of strain, displacement, pressure, acceleration and force have
been built with +<)T as the sensing element. &n a transducer with +<)T as the strain1
sensing element, the base carrying the primary and secondary coils is attached to one 8nife
edge while the movable magnetic core is connected to the order @'ig.*.3. The centre
primary coil is fed from an at supply. The two balanced secondary windings on either side
of the primary coil, connected together in phase opposition function as pic81up coils. The
output from the +<)T is theoretically Fero when the sliding magnetic core is placed midway
13
7/25/2019 esa notes gsdggb
http://slidepdf.com/reader/full/esa-notes-gsdggb 14/52
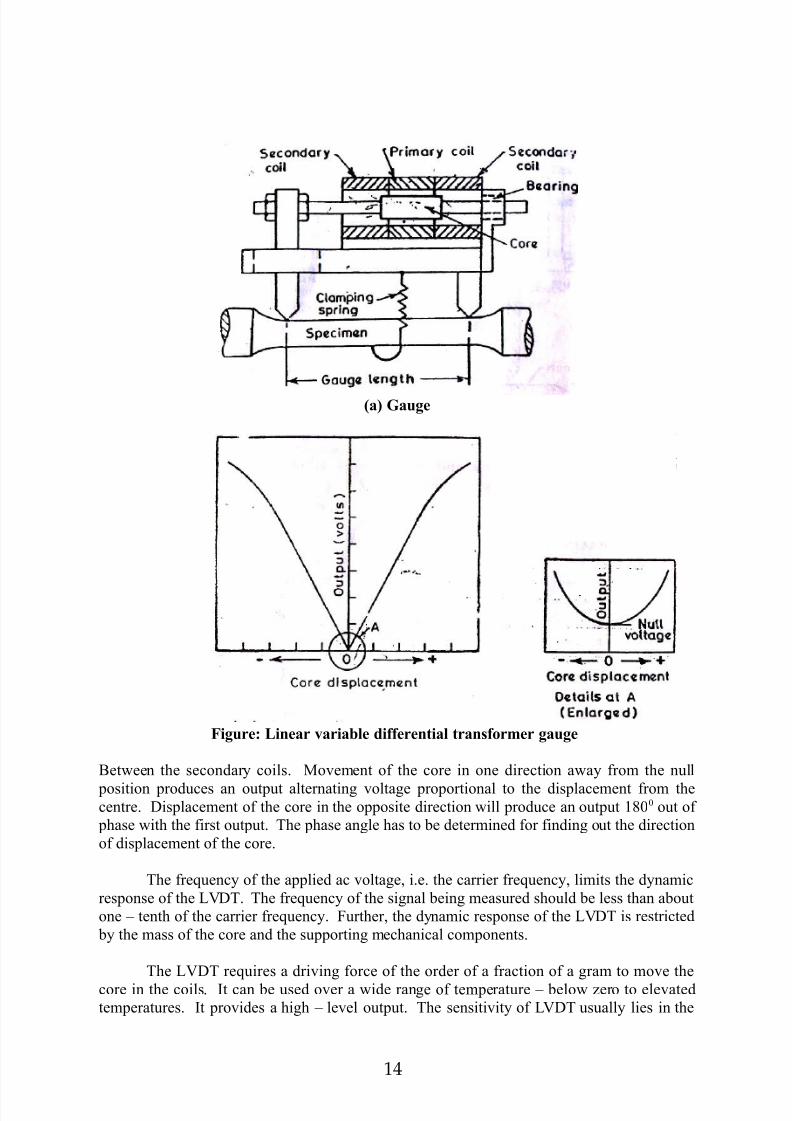
<a= (au)e
<;= Ou!1u! $%!a)e s. &$re 1$s'!'$
')ure/ L'ear ar'a;%e '55ere!'a% !ras5$rmer )au)e
etween the secondary coils. Movement of the core in one direction away from the null
position produces an output alternating voltage proportional to the displacement from thecentre. )isplacement of the core in the opposite direction will produce an output *4== out of
phase with the first output. The phase angle has to be determined for finding out the direction
of displacement of the core.
The fre!uency of the applied ac voltage, i.e. the carrier fre!uency, limits the dynamic
response of the +<)T. The fre!uency of the signal being measured should be less than about
one % tenth of the carrier fre!uency. 'urther, the dynamic response of the +<)T is restricted
by the mass of the core and the supporting mechanical components.
The +<)T re!uires a driving force of the order of a fraction of a gram to move the
core in the coils. &t can be used over a wide range of temperature % below Fero to elevated
temperatures. &t provides a high % level output. The sensitivity of +<)T usually lies in the
14

7/25/2019 esa notes gsdggb
http://slidepdf.com/reader/full/esa-notes-gsdggb 15/52
range =.=9 to =.*N <Gmm displacements per volt of excitation applied to the primary coil. A
point to be noted is that the performance of the +<)T can be severely affected by the
presence of metal masses and stray magnetic fields in its vicinity. The siFe and mass of the+<)T and the problem of mounting through 8nife edges rather restricts its use in strain gauge
wor8.
<;= Ca1a&'!a&e S!ra' (au)es/
The capacitance of a condenser can be varied by either varying the distance between
the condenser plates or by varying the area. &n a capacitance strain gauge the displacement.
#esulting from the strain in the test
<a= Cr$ss , se&!'$ 'e?
<;= (au)e ' a a%')me! 5rame
')ure/ >'!e& &a1a&'!a&e )au)e <>'!e& C$r1$ra!'$@ USA=
"omponent varies its capacitance either by varying the distance between the
condenser plates or by varying the area between the plates. &n the capacitance gauge shown
schematically in figure, capacitance changes occur due to axial sliding of an outer cylinder
relative to two concentric inner cylinders. Temperature compensation is achieved by using a
compensating rod fabricated from a material with the same thermal characteristics as the test
15

7/25/2019 esa notes gsdggb
http://slidepdf.com/reader/full/esa-notes-gsdggb 16/52
component. &t functions satisfactorily at temperatures up to about 4===". $ith a refined
measurement techni!ue, it can measure ± 9=, === µ∈ with a sensitivity of *µ∈.
Peuma!'& S!ra' (au)es
'igure shows the basic arrangement in a pneumatic strain gauge. Air at constant
pressure flows through two orifices of cross % sectional areas A* and A9. The area A9 of the
variable area orifice is a function of the gap d which varies as the distance between the 8nife
edge changes. The pressure ∆ p built up in the chamber is approximately given by
( )0
2
2 11 /
p p
A A∆ =
+
')ure/ Peuma!'& s!ra' )au)e , S')%e 1ressure $u!1u!
Thus the relationship between ∆ p and the displacement of the extensometer d is
nonlinear. 2owever, with proper design this non linear characteristics of the gauge can be
minimiFed and a nearly linear characteristic can be obtained over a narrow range of
displacement.
etter linearity can be obtained in the arrangement shown in figure. Magnifications
up to *==,=== and gauge lengths as small as * mm are possible to achieve in these gauges.
16

7/25/2019 esa notes gsdggb
http://slidepdf.com/reader/full/esa-notes-gsdggb 17/52
')ure/ Peuma!'& s!ra' )au)e , -'55ere!'a% 1ressure $u!1u!
Pneumatic gauges are sensitive, robust and reliable. They are suitable for both static
and dynamic strain measurements.
A&$us!'&a% S!ra' (au)eE
The vibrating wire or acoustical gauge consists essentially of a steel wire tensioned between two supports a predetermined distance apart. <ariation of the distance alters the
natural fre!uency of vibration of the wire and this change in fre!uency may be correlated
with the change in strains causing it. An electro1magnet ad?acent to the wire may be used to
set the wire in vibration and this wire movement will then generate an oscillating electrical
signal. The signal may be compared with the pitch of an ad?ustable standard wire, the degree
of ad?ustment necessary to match the two signal fre!uencies being provided by a tensioning
screw on the standard wire. "alibration of this screw allows a direct determination of the
change of length of a measuring gauge to be made once the standard gauge has been tuned to
match the fre!uency of the measuring wire.
The visual display produced or a "#O renders ad?ustment easier. Tuning is now moreusually accomplished by feeding the two signals into the two pairs of plates of an
oscillograph and ma8ing use of the +issa?ous figure formation to balance the fre!uencies.
Matching of the tones is simplified and made more accurate by tuning out the beats which
results when the vibration fre!uencies of two wires are nearly the same, which can be
compared by using earphones.
The fundamental fre!uency of a stretched wire may be estimated from the expression.
( )/1 1
2 2
E L LP f A
L m L m
δ = =
17

7/25/2019 esa notes gsdggb
http://slidepdf.com/reader/full/esa-notes-gsdggb 18/52
')ure/ A&$us!'&a% S!ra' (au)e
$here A I cross % sectional area of vibrating wire
I 7oungHs modulus of wire material
+ I length of vibrating wire
m I mass per unit length of the wire
P I tensioning force in the wire
δ+ I increment in length of the vibrating wire.
'igureE Shows an acoustical gauge developed by )r. O. Schaefer about *3;;. The
sensitivity of this gauge is very high, with possible determinations of displacement of the
order of =.9N cm. The range is limited to about *G*=== of the wire length. The gauge is
temperature sensitive unless the thermal coefficients of expansion of the base and wire are
closely matched over the temperature range encountered during a test.
Peuma!'& S!ra' (au)e/
The principle of operation of an air or pneumatic gauge depends upon the relative
discharge of air between a fixed orifice and a variable orifice. 'ig. shows a pneumatic gauge.
Air under constant pressure 2, flows through two orifices placed in series. The pressure hwhich
18

7/25/2019 esa notes gsdggb
http://slidepdf.com/reader/full/esa-notes-gsdggb 19/52
')ure/ Peuma!'& s!ra' )au)e
Prevails between these two orifices is a function of the ratio of their areas. The fixed orifice
- is called the noFFle and the second orifice S, which is smaller, is called the exhaust orifice
and is of variable area of cross1section. As a result of it, the pressure h serves to measure the
dimension of S. Air after passing through the orifice -, stri8es the top plate and is vented to
the atmosphere. The flow of air through the two orifices in series must be e!ual if
incompressibility is assumed. This assumption is practically valid as the pressures are !uite
low. +et,
A- I cross % sectional are of noFFle orifice -
AS I cross % sectional area of discharge orifice S "-, "S I coefficients of contraction for the orifices
ρ I density of air
g I acceleration due to gravity
Since the flow through each orifice is the same, hence
( )2 2gh, AsG G
gH hC A Cs
ρ ρ
−=
$hen "S I "- I ", then
( )2
1 /S G
Hh
A A=
+
$hen the specimen is leaded, the distance between the two gauge points changes.
This elongation is transmitted through the levelHs system to the pneumatic gauge, where it
changes the gap between orifice S and the top plate, this changing the area As in direct
proportion to the strain. 'rom !. it is obvious that the manometer reading varies as a
!uadratic function of the strain. 2owever, it has an inflection point when hG2 I or ASGA- I
=.N4. 2ence, for values in this neighbor1 hood, the relation is very nearly linear.
Multiplication factors of *==.=== are possible with this type of pneumatic amplification.
S&ra!&* (au)eE
Of all the gauges available, perhaps the most ingenious because of its simplicity, is the
scratch gauge. The instrument consists of two partsQ a target, and a scratch arm. These parts
may be secured to the test piece by screw, solder, or clamp applied at g and e. The target is a
small plate with a chromium % plated surface and includes a raised clip arm RaH. The scratch
arm b is pivoted at the elastic hinge " and carries, at f, several grit particles embedded in
cured rubber. Motion between e and g is recorded as scratches made by the grit particles f on
the chromium plated target. Propulsion of the scratch arm across the target is accomplished
by the spring action of the elastic hinge C .
19

7/25/2019 esa notes gsdggb
http://slidepdf.com/reader/full/esa-notes-gsdggb 20/52
<a= S&ra!&* re&$r') s+s!em
<;= Ma)'5'e s!ra' re&$r
')ure/ S&ra!&* )au)e
The cross motion is regulated by the pressure of clip a on arm b. This pressure
develops sufficient static friction to restrain the arm, but cross motion is permitted by the
smaller sliding friction, which results from relative motion of the target and arm and the test
piece is strained. The rate of the scratch arm cross travel is a function of the sliding motionoccurring, rather than of time. &t can be controlled by variation of the clip pressure and the
thic8ness of the spring hinge. The several grit particles scratch patterns of varying depth,
depending on the alignment of target and arm. Of course, the most clearly defined pattern is
used for interpreting the record. T he base line is established by moving the arm across the
target while the test piece is in an unloaded condition. The measurements of deformation
indicated by the scratches on the target, is accomplished by means of a microscope. 'igure
@b shows the strain record.
This gauge is used for measuring deformation of rail % road rails because of the load
caused by a passing train. Strain measurements can be made inside pressure vessels, inside
moving mechanisms, under water etc. )ynamic strains pattern on analysis can be separated
into various harmonics of a vibratory deformation. 2owever, this gauge cannot be applied to
small structures or finished surfaces, and extreme care has to exercised in measuring the
scratch record to obtain any degree of precision. The gauge is also little affected by its own
inertia forces. #eadings may be estimated to =.==9N mm.
E%e&!r'&a% S!ra' (au)es/
I!r$u&!'$/
An electrical stain gauge is a device in which a change in length produces a change insome electrical characteristics of the gauge.
20

7/25/2019 esa notes gsdggb
http://slidepdf.com/reader/full/esa-notes-gsdggb 21/52
The electrical strain gauges may be classified as followsE
@a The inductance or magnetic strain gauges.@b The capacitance strain gauges.
@c The electrical resistance strain gauges.
Out of these three types of gauges, the resistance strain gauges @#S- have become
more popular and reliable. 2ence, in this chapter, we shall study the first two types of gauges
briefly and lay more emphasis on the resistance gauges.
The inductance type of strain gauges in which the strain is measured as a change in
the magnetic field, was developed as a strain gauge about *3;= by Shamberger. Since then
this gauge has been used for various applications, particularly in motion measurements. An
important application of inductance type of gauge is the linear variable differentialtransformer, developed by SchaevitF about *35:.
The capacitance types of gauges has found very little use as strain gauges and are not
commercially available. 2owever, these type of gauges have found applications as
transducers to measure pressure, force and displacement.
&n *4N +ord elvin reported that the electrical resistance of certain wires varied with
the tension to which the wires were sub?ected. ridgeman in *39; confirmed elvinHs results
in a series of tests involving wires under hydrostatic pressure. +ittle use was made of this
8nowledge until after *3;=, when attempts were made to apply the phenomenon of strain
sensitivity in wires to the actual measurement of strain in other bodies. The first use of this
principle for strain measurements was made by "arlson and aton about *3;*. A nonmetallic, unbounded resistance gauge was however developed and used by Mc % "ollum and
Peters in *395. A non % metallic, bonded resistance gauge was developed by loach in *3;N.
The bonded wire metallic strain gauge was developed independently and almost
simultaneously in *3;4 by Simmons at the "alifornia &nstitute of Technology and #uge at the
Massachusetts &nstitute of Technology, now commercially 8nown as the S# 5 gauges, and
mar8eted by aldwin % +ima % 2amilton "orporation of D.S.A. Since then the activity in
this field has been on the increase and a lot of improvements has been made in these gauges.
)uring the *3N=Hs considerable attention was given to the foil % type strain gauges. Much of
the credit for development and acceptance of this type of gauge goes to ean, Saunders and
#oe. "urrently the foil gauges have largely displacement the wire gauges.
A uni!uely constructed weld able wire filament strain gauge has been developed
recently for application in may hostile environments and installation by Ailtech @D.S.A
Iu&!a&e S!ra' (au)es/
An electric inductance gauge is a device in which the mechanical !uantity to be
measurement produces a change in the magnetic field, and hence in the impedance, of a
current % carrying coil. The impedance of a coil depends on its inductance and on its
effective resistance, and either or both of these !uantities can be made sensitive to the
mechanical !uantity being measured. The inductance which is changed can be either the self
21

7/25/2019 esa notes gsdggb
http://slidepdf.com/reader/full/esa-notes-gsdggb 22/52
inductance of the coil or its mutual inductance with respect to another coil. )epending upon
the method of varying the impedance, electric % inductance gauges may be classified as
followsE
*. <ariable % air % gap gauges. &n which the reluctance of the magnetic field is varied by
changing the air gap.
9. Movable % core solenoid gauges. &n which the reluctance of the magnetic circuit is
varied by changing the position of the iron core in the coil.
;. ddy current gauges. &n which the losses in the magnetic circuit are varied by changing
the thic8ness or position of the high % loss element inserted in the magnetic field.
5. Magnetostriction gauges. &n which the reluctance of the magnetic circuit is varied by
changing the stress in the magnetic core of the coil.
The impedance of a coil to the passage of alternating current is given by the expressionE
( )2 22Z fL Rπ = +
$here I impedance in ohms
f I fre!uency in hertFHs
+ I inductance of the coil in henrys
# I resistance component in ohms.
&n general, # is negligible as compared to + and the impedance varies almost in proportion to
the inductance. The inductance of a variable % air % gap gauge is given by2
88.1026 10i a
i a
NLl l
a a µ
−= ×+
$here ( I number of turns.
li I length of iron magnetic circuit, cm
la I length of air gap, cm
µ I permeability of magnetic material at the maximum alternating flux
density
ai I cross % section of iron, cm9
aa I cross % section of air gap, cm
9
&f the valve of µ is sufficiently large, theni
i
l
a µ is negligible as compared to
a
a
l
a and we find
that
2 88.1026 10a
a
aL N
l−= × ×
The relationship between the voltage applied across a coil and the flux density in its core is
I =.*=: a(f × *=14
$here I voltage
22

7/25/2019 esa notes gsdggb
http://slidepdf.com/reader/full/esa-notes-gsdggb 23/52
I flux density in lines per s!uare cm
a I cross section of core, cm9.
Thus, we find that under ideal conditions, the impedance of an iron % core coil varies
inversely with the length of the air gap in the magnetic circuit. &f the motion to be measured
is a large percentage of the initial air gap, very large change in impedance can be produced
and large amounts of electric energy become available. Therefore, the variable % air % gap
gauge is one of the best % 8nown methods of converting small motions into high energy
electric signals. 'or large motions, it is more advisable to use the moving % core solenoid.
ddy % current gauges find applications in special fields, such as the measurement of motion
and of the thic8ness of non ferrous sheets Magnetostriction effect is small in most
commercial magnetic irons but is large in nic8el and some nic8el % iron and cobalt % iron
alloys. 'igure shows circuits for some of thee gauges. These gauges are placed in one arm of
an inductance bridge with either a voltmeter or "#O to indicate the out % of % balance potential to the bridge. The bridge is supplied with an alternating current of about *===
hertFs for static strain measurements. 'or dynamic strains, the fre!uency of current source
must be 9= to ;= times the fre!uency of the strain being measured. One serious difficulty is
that magnetic forces set up across the air gap fre!uently give rise to serious vibrations in the
structure. These gauge cannot be applied to light structures. +arge strains cannot be
measured as the strain % inductance relationship is linear only over a small range of strain.
These gauges are weighty, bul8y
and susceptible to magneto % mechanical resonance.
<a= Var'a;%e a'r )a1 )au)e
23
7/25/2019 esa notes gsdggb
http://slidepdf.com/reader/full/esa-notes-gsdggb 24/52
<;= M$') &$'% s$%e$' )au)e
<&= E+ &urre! )au)e')ure/ Iu&!a&e s!ra' )au)es
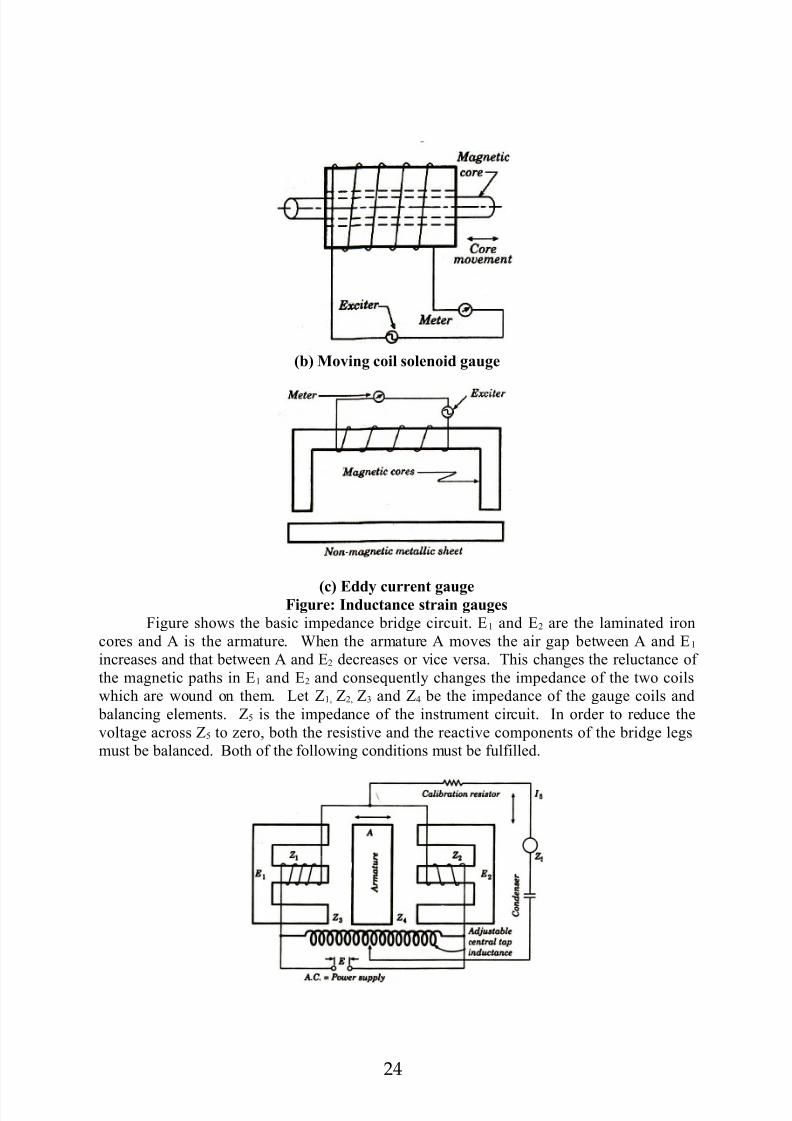
'igure shows the basic impedance bridge circuit. * and 9 are the laminated iron
cores and A is the armature. $hen the armature A moves the air gap between A and *
increases and that between A and 9 decreases or vice versa. This changes the reluctance of
the magnetic paths in * and 9 and conse!uently changes the impedance of the two coils
which are wound on them. +et *, 9, ; and 5 be the impedance of the gauge coils and
balancing elements. N is the impedance of the instrument circuit. &n order to reduce the
voltage across N to Fero, both the resistive and the reactive components of the bridge legs
must be balanced. oth of the following conditions must be fulfilled.
24

7/25/2019 esa notes gsdggb
http://slidepdf.com/reader/full/esa-notes-gsdggb 25/52
')ure/ Bas'& 'm1ea&e ;r')e &'r&u'!
31
2 4
RRR R=
And31
2 4
XX
X X=
E%e&!r$ma)e!'& S!ra' (au)e/
&f a magnetic bar is loaded by a torsional moment, a voltage is recorded by a
galvanometer connected to a coil through which the bar is put. An electromotive force is
induced in the coil of the electromagnet which depends on the torsional moment acting on the
core of the electromagnet which is twisted. This is 8nown as $iedemannHs effect. Thefactors which influence the magnitude and linearity of the induced electromotive force areE
the degree of saturation of magnetic field, the geometry of the attachment to the structure, the
fre!uency of power supply, the siFe of the tube, the number of turns of the wire wound round
the tube, the material of the pipes and its condition. The electromagnetic strain % gauge is
shown in figure. The pic8 up unit, measuring the longitudinal component of the magnetic
flow, consists of a pic8 up coil and a low drain a.c. voltmeter. The influence of the pic8 up
unit depends on the non % inductive resistance # m of the measurement device, on the
inductive resistance wl of the coil, on the non % inductive resistance # c of the coil and on the
slenderness ratio r I l) of the tube. The mathematical formula expressing the influence of
the measurement unit on the variation of the induced electromotive force or the actual, i.e.,
measured slope of the characteristics mH is
')ure/ E%e&!r$ma)e!'& s!ra' )au)e <7'eema:s e55e&!=
'0 2
1
mm
c
c
R xK K
R wl
R
=
+
$here = I ideal slope of the characteristic, for r I =.4.
x I ratio of induced electromotive force for general r to the voltage m for r I
=.4.
25

7/25/2019 esa notes gsdggb
http://slidepdf.com/reader/full/esa-notes-gsdggb 26/52
Ca1a&'!a&e S!ra' (au)e/
The electrical capacity between parallel plates is given byE
( )38.8610 1KA NC
h
−× −=
$here
" I capacitance in pico farads.
I dielectric constant of the medium between the two plates.
( I number of plates
h I distance between plates, mm.
(ow ( )3
28.8610 1KA NC Cdh h h
−
× −= = −
Strain0
h
lε
∆=
2ence0
C C
h
lε
∆=
$here l= is the gauge length
')ure/ S'm1%'5'e 'a)ram $5 a &a1a&'!a&e !rasu&er &'r&u'!
Thus the capacitance of a condenser may be changed either by changing the spacing
between the condenser plates or the condenser plate area may be changed. The variation in
the capacitance because of a change in the plate spacing while the change in capacitance
resulting from a change in area is linear for large changes in the plate area. Two types of
circuits may be used to measure the change in capacitance of a gauge. &n the first methods, a
capacitance bridge is supplied with an a.c., the out % of % balance of the bridge, because of achange in the capacitance of the gauge, is measured by either a voltmeter or "#O. &n the
26
7/25/2019 esa notes gsdggb
http://slidepdf.com/reader/full/esa-notes-gsdggb 27/52
second method, the capacitance gauge may be placed in a circuit, oscillating at resonance. As
the capacitance of the condenser changes as a result of strain the fre!uency of oscillation of
the circuit changes. The output of this resonant circuit is passed through a discriminator, thevariation in fre!uency is indicated on the screen of "#O. The first method employs an
amplitude % modulated signal, while the second method uses a fre!uency % modulated signal.
A simplified diagram of a capacitance transducer circuit is shown in figure.
"apacitance gauges are small in siFe and they have excellent high % fre!uency
response and high temperature resistance, as well as good linearity resolution and ability to
measure both static and dynamic !uantities. These gauges are sensitive to temperature,
vibrations, have high impedance output and complexity of associated electronic e!uipment.
)ielectric, mounting and clamping difficulties ma8e this gauge not too desirable
UNIT , III
E%e&!r'&a% Res's!a&e S!ra' (au)es
&n the electrical resistance strain gauges the displacement or strain is measured as a
function of the resistance change produced by the displacement in the gauging circuit. An
ideal strain gauge should have the following basic characteristicsE
*. The gauge should be of extremely small siFe @gauge length and width so as to
ade!uately estimate strain at a point.
9. The gauge should be of significant mass to permit the recording of dynamic strains.
;. The gauge should be easy to attach to the member being analysed and easy to handle.
5. The strain sensitivity and accuracy of the gauge should be sufficiently high.
N. The gauge should be unaffected by temperature, vibration, humidity or other ambientconditions.
. The calibration constant for the gauge should be stable over a wide range of
temperature and time.
:. The gauge should be capable of indicating both static and dynamic strains.
4. &t should be possible to read the gauge either on location or remotely.
3. The gauge should exhibit linear response to strain.
*=. The gauge and the associated e!uipment should be available at a reasonable cost.
**. The gauge should be suitable for use as a sensing element or other transducer systems.
T+1es $5 Res's!a&e S!ra' (au)es
There are basically four types of electrical resistance strain gauges as classified
belowE
*. Dnbonded gaugesE
@a (on1metallic
@b Metallic
9. onded gauges
@a (on1metallic
@b Metallic@i $ire type
27

7/25/2019 esa notes gsdggb
http://slidepdf.com/reader/full/esa-notes-gsdggb 28/52
@ii 'oil type.
;. $eldable gauges.5. PieForesistive gauges.
. <;= U;$eMe!a%%'& (au)es.
The unbonded nonmetallic gauge is a mechanically actuated gauge that contains a
resistance element so arranged that when one part of the gauge is displaced with respect to
another there is developed a change in pressure on the measuring element of the gauge. This
change in pressure changes the resistance of the element which may be recorded by electrical
means. A gauge of this type was developed in *39; and *395 by Mc"ollum and Peters and is
shown in 'ig. This gauge is composed of a series of carbon plates arranged in a stac8. The
stac8 is so ad?usted that a displacement of one part of the gauge relative to another changesthe pressure, on the stac8 of plates. $hen the strain is applied in the structure to which the
gauge is attached, the change in length is communicated to the carbon1plate stac8. This
change in length re!uires a change in pressure in the stac8, and the resistance of the stac8
changes.
')ure/ U;$e $me!a%%'& s!ra' )au)e.
$ith an increase in pressure, the areas of contact between the plates are enlarged and
new areas come into contact, thus decreasing the resistance of the element. &f the pressure is
released, the areas of contact are reduced, and some of the areas lose contact, thus increasing
the resistance of the element. &f the pressure becomes excessive, so that the elastic limit of
the carbon in the gauges is exceeded or the carbon is even crushed, or if the plates areallowed to shift in the lateral direction with respect to each other, the results become erratic.
esides these difficulties, there is a further defect of mechanical friction and hystertsis in the
mechanical parts of the gauge.
-auge of this 8ind have been used to determine displacements, loads and strains in
flexible cables, airplanes, bridges, vibrating members, dynamometers and pressure gauges.
2owever, with the advancement of metallic gauges the usefulness of these type of gauges has
reduced materially.
. <;=. U;$eMe!a%%'& (au)es.
The principle of the unbonded1metallic gauges is based on the change in electrical
28

7/25/2019 esa notes gsdggb
http://slidepdf.com/reader/full/esa-notes-gsdggb 29/52
resistance of a metallic wire due to the change in tension of the wire. The first device of this
8ind was designed by "arlson and aton in *3;=. This type of gauge is constructed by
winding wire in three coils, the first providing a coil unaffected by the gauge motion, and theother two having tensions altered by the gauge motion, each in an opposite manner. The
whole is mounted in a sleeve that allows only longitudinal movement. The coils are placed
under initial tension into a four arm $heatstone bridge. As the compressive strain is applied,
the prestrain would simply be relieved and the unbonded element would remain taut. 'or the
gauge to register compressive strains, the initial assembly must include a built1in tensile
prestrain in the coils greater than the maximum compressive strain to be measured. A gauge
of this type is shown in 'ig. These type of gauges are rarely used for experimental stress
analysis. 2owever, these type of gauges have been incorporated into accelerometers and
pressure pic8ups.
')ure/ U;$e me!a%%'& s!ra' )au)e.
2.<a= B$e N$Me!a%%'& (au)es.
A strain gauge using direct bonding of a non1metallic resistor element to a material inwhich the strain is so to be measured was reported by loach in *3;N. &n this gauge a carbon
coating is applied directly to the surface of the structure in which strain is to be measured.
'or metallic structures the surface is first coated with a non1conducting material. &f the
underlying surface of such a coating is stretched, the carbon particle would move apart, and
the under1coating is compressed, the particles would move closer together, and the resistance
will change. This resistance change can be interpreted in terms of strain.
-enerally these type of gauges are made by impregnating carbon particles in plastic
sheets. These sheets are then cut into strips about mm wide and 9N mm long. On each end
of the strip a silver band is plated so that lead wires may be attached @fig. The gauge is
bonded directly to the surface to be strained with a common glue.
29

7/25/2019 esa notes gsdggb
http://slidepdf.com/reader/full/esa-notes-gsdggb 30/52
')ure/ B$e $me!a%%'& s!ra' )au)e.
These sensitivity and resistance of the gauge are affected by temperature and
humidity. This gauge is of rugged construction and can withstand rough handling. 2owever,
the cross1sensitivity of the gauge is !uite high.
2. <;= B$e Me!a%%'& (au)es.
The bonded metallic type of strain gauge consists of a length of a strain1sensitive
conductor mounted on a small piece of paper or plastic bac8ing. &n use this gauge is
cemented to the surface of the structural member to be tested. These gauges may be either of
the wire or foil type. &n the case of wire strain gauges, the filament consists of a long length
of wire in the form of a grid fixed in place with a suitable cement. The wire grid may beeither of the flat type @fig. a or wrap1around type @'ig. b. After attaching the lead wires to
the two ends of the grid, a second piece of paper is cemented over the wire as a cover. &n the
wrap around type of wire gauges, the strain1sensitive wire is wound around a cylindrical core
in the form of a close1wound helix. This core is then flattened and cemented between layers
of paper for purpose of protection and insulation. 'ig.@c shows a flat wire grid free filament
construction.
30

7/25/2019 esa notes gsdggb
http://slidepdf.com/reader/full/esa-notes-gsdggb 31/52
')ure <a=/ B$e ?'re 5%a! )r' )au)e.
')ure <;=/ B$e ?'re ?ra1ar$u )au)e.
31

7/25/2019 esa notes gsdggb
http://slidepdf.com/reader/full/esa-notes-gsdggb 32/52
%a! ?'re )r' 5ree 5'%ame! &$s!ru&!'$. B$e 5%a! 5$'% )r' )au)e.
')ure/ T+1es $5 ;$e me!a%%'& )au)es.
The foil type of stain gauge has a grid made from a very thin strain1sensitive foil @fig
d. The width of foil is very large as compared to the thic8ness so that the gauge provide a
much larger area for cementing the gauge. The gauge configuration is obtained by printing
the desired pattern on a sheet of foil with acid resistant in8 and subse!uently etching away the
unprotected metal. Another method of manufacture involves precision punching of the
gauges from a foil sheet. The foil type of gauges have the following advantages over the wiretype gauges.
*. The width of the foil at the end of each loop can be greatly increased to reduce the
sensitivity of the sensitivity of the gauge to transverse strains.
9. The cross1section of the gauge conductor is rectangular, resulting in the high ratio of
surface area to cross1section area. This increases heat dissipation and avoids adhesion
between the grid and the bac8ing material.
;. The gauge factor is higher by 5 to *= per cent that other gauges.
5. These gauges are easier to manufacture.
N. These gauges can be used to measure strain on curved surfaces.
. These gauges are suitable for static and dynamic strain measurements.:. They have very good fatigue properties.
4. Stress relaxation and hysterisis is very less in these gauges.
3. 7e%a;%e S!ra' )au)es.
Some of the limitations of the bonded type of metallic gauges are their comparatively
costly, time consuming and complicated method of bonding. This realiFation led to the
development of the weldable wire resistance strain gauge1a strain gauge capable of being
installed in minutes and in any environment. This uni!ue techni!ue, utiliFing capacitive
discharge spot welding e!uipment eliminates the need for all bonding materials.
The weldable strain gauge consists of a strain sensitive element, the (ic8el "hrome or Platinum Tungsten, housed within a small diameter stainless steel tube. The strain element is
32

7/25/2019 esa notes gsdggb
http://slidepdf.com/reader/full/esa-notes-gsdggb 33/52
insulated from the tube with highly compacted ceramic insulation or metallic oxide powder,
normally high purity magnesium oxide, which also serves as a strain transfer medium from
the housing to strain element. This weldable gauges are e!uipped with a thin flange spotwelded to the strain tube. This flange is subse!uently spotwelded to the structure under test
and provides the bond re!uired to transfer strain.
&ntegral leads are attached to the basic gauge by welding. $hen the gauge is welded
to a specimen and the test specimen put into tension or compression, the stress is transmitted
through the weld to the mounting flange, into the strain tube, and through the magnesium
oxide powder.
The basic construction of a !uarter1bridge or half1bridge, self1temperature
compensated gauge is shown in 'ig. and includes integral metal sheathed or flexible lead
wire configurations. This gauge construction provides inherent mechanical andenvironmental protection for both the main filament and lead wires and is used over a broad
temperature range from cryogenic to No". $eldable strain gauges can be used for a wide
range of static and dynamic measurement applications. Their rugged construction and
positive attachment ma8e it possible to measure strain at higher or low temperatures and in
server environments, including shoc8 and vibration, steam, salt water, chemicals, and other
corrosive atmospheres.
<a= uar!er ;r')e )au)e. <;= >a%5 ;r')e )au)e.
')ure/ 7e%a;%e s!ra' )au)es
4. P'eD$res's!'e s!ra' )au)es.
"rystals of silicon, germanium, !uarts and #ochelle salt show a change in resistance
when deformed by applying pressure. This effect can be utiliFed to measure strain. Such li8e
gauges are called pieFo1resistance strain gauges. $e shall discuss these gauges in details.
Ma!er'a%s 5$r (au)es
A good gauge material should have the following !ualitiesE
*. 2igh gauge factor
33

7/25/2019 esa notes gsdggb
http://slidepdf.com/reader/full/esa-notes-gsdggb 34/52
9. 2igh resistance
;. +ow temperature sensitivity
5. 2igh electrical stabilityN. 2igh yield point stability
. 2igh endurance limit
:. -ood wor8ability
4. -ood solderability and wor8ability
3. +ow hysteresis
*=. -ood corrosion resistance
**. +ow thermal e.m.f. when ?oined with other metals.
The important properties of the most commonly used materials for strain gauges are
given in Table.
Carr'er Ma!er'a%s
A strain1gauge grid is normally supported on some form of carrier material. This
provides the necessary electrical insulation between the grid and the material to be tested,
dimensional stability, and also provides some degree of mechanical protection for the delicate
sensing element. A good carrier material should have the following desirable characteristicsE
*. 2igh mechanical strength
9. Minimum thic8ness
;. 2igh dielectric strength
5. Minimum temperature restrictionsN. -ood adherence to cement used
. (on1hygroscopic.
Tem1era!ure C$m1esa!'$
The ideal strain gauge would change resistance in accordance with stress1producing
deformations in the structural surface to which it was bonded and for no other reason.
Dnfortunately, gauge resistance is affected by many other factors, out of which temperature is
very important.
The total indicated strain occurring at a point in a structure is made up of mechanical
strain and apparent strain. The mechanical strain is that produced by external forces. The
apparent strain is the portion of the total indicated strain induced by thermal effects including
expansion of the base metal, expansion of the gauge metal and change in electrical resistance
of the gauge. Thus, when the ambient temperature increases @say, then
*. The gauge grid will elongate so thatl
.T.l
∆= α ∆
9. The base material on which the gauge is mounted will elongate so thatl.T.
l
∆= β ∆
;. The resistance of the gauge metal will increase because of the influence of the
34

7/25/2019 esa notes gsdggb
http://slidepdf.com/reader/full/esa-notes-gsdggb 35/52
temperature coefficient of resistivity of the gauge material so thatR
.T.R
∆= γ ∆
The combined effect of these three factors will produce a temperature induced change
in resistance of the gauge,T
R
R ∆
∆ ÷
with may be expressed asE
( )T
RT.F .T
Rβ α γ
∆
∆ = − ∆ + ∆ ÷
$here α I thermal coefficient of expansion of the gauge material
β I thermal coefficient of expansion of the base material
γ I temperature coefficient of resistivity of the gauge material
' I gauge factor# I resistance of gauge
T∆ I rise in temperature.
!uation holds only for small values of T∆ , where α,β and γ can be considered
constant. 'or large values of T∆ , average values of these factors might be used without
introducing large errors.
&f α β ≠ , then the gauge will be sub?ected to a mechanical strain, ( ) Tβ α − ∆ , which
does not occur in the specimen.
&f α I β, then this component of apparent strain vanishes. 2owever, the gauge will
still register a change of resistance with temperature if γ is not Fero. &n order to prevent
significant errors due to this effect, some form of /temperature compensation0 is usually
employed when strain gauges are used in applications where the steady state or static
component of strain must be measured. "urrently available methods of compensation for the
apparent strain include the use of a dummy or compensating strain gauge, self1temperature
compensating @ST" gauge, compensation by dissimilar or similar gauges in the $heatstone
bridges and compensation by computation.
. C$m1esa!') -umm+ (au)e/
The earliest form of temperature compensation ma8es use of the electrical bridge
circuit in which the active gauge is connected to balance out unwanted temperature induced
resistance change. This is usually called the /compensating dummy0 arrangement. The
/dummy gauge0 identical to the active gauge in type and lot number, is mounted on an
unstressed piece of the specimen material and placed in the same thermal environment as the
active gauge. The active and compensating gauges are then connected as ad?acent arms of
the bridge circuit in the readout instrument. ffects common to both gauges will preserve
bridge % balance conditions, and no output signal results. Since only the active gauge is
exposed on mechanical or thermal strain caused by specimen stress, bridge unbalance is
proportional to the magnitude of specimen stress producing strain. The method fails entirely
if the temperature does not vary in an identical fashion at both gauge locations.
35

7/25/2019 esa notes gsdggb
http://slidepdf.com/reader/full/esa-notes-gsdggb 36/52
2. Se%5!em1era!ure C$m1esa!e (au)e/
The terms0temperature compensated0 is applied to strain gauges in which theresistance change due to temperature is e!ual to Fero. Self1temperature compensated gauges
will perform properly only when used on materials having the specific value of thermal
expansion coefficient for which they are designed. ST" gauges can be obtained for use on
materials having thermal expansion coefficients from Fero to 9N ppmGo".
Two method are used for obtaining self1temperature compensation. &n the first
method, self1temperature compensation is created by altering the temperature coefficient of
resistance of the grid material so that, when mounted on materials having a certain thermal
expansion coefficient, the apparent strain will be a suitably low value. This is done, in most
cases, by special selection or thermal processing of the grid alloy. The two principal classes
of strain1gauge alloys susceptible to such treatment are "onstantan and arma. The secondmethod includes forming a grid with two lengths of gauge wires ?oined suitably in series so
that the resultant apparent strain is Fero.
-ua%e%eme! se%5 !em1era!ure C$m1esa!'$ ;+ 'ss'm'%ar )au)es.
C$m1esa!e )au)e.
')ure/
3. C$m1esa!'$ ;+ -'ss'm'%ar (au)es/
"ompensation of the temperature effect in a bridge networ8 is accomplished by putting
dissimilar gauges into ad?acent bridge arms as shown in 'igure. The gauge in the first arm
should have a relatively small temperature effect in the same direction. $ith proper, fixed
series and shunt resistances for the gauge in the second arm, it is possible to obtain an overall
temperature effect for the second arm, that is e!ual to that of the first arm. 2ence, the
temperature effects of the two arms will cancel each other with a relatively small loss in the
strain sensitivity of the networ8.
This method would appear to have a better chance of success than the self1
temperature compensated gauge because the relative resistance of the filament is not critical.
&f will always be possible after a gauge has been made, to select the fixed resistance for
proper compensation. 'urthermore, compensation over a greater temperature increases. in
this case, temperature would not have to be 8nown very accurately.
36
7/25/2019 esa notes gsdggb
http://slidepdf.com/reader/full/esa-notes-gsdggb 37/52
4. C$m1esa!'$ ;+ S'm'%ar (au)es/
est possible temperature compensation is obtained for unpredictable effects as for
predictable effects with two similar gauges in ad?acent arms of a $heatstone bridge.
2owever, this circuit arrangement eliminates the hydrostatic component of stress from the
reading and only the shear component of stress is reflected. 2ence, the gauges should be
arranged so as to pic8 up the greatest signal from the shear component of stress. This means
that one gauge should be positioned in the direction of the maximum principal strain, the
other in the direction of minimum principal strain. This method is li8ely to give best results
when the direction of the principal strains is 8nown.
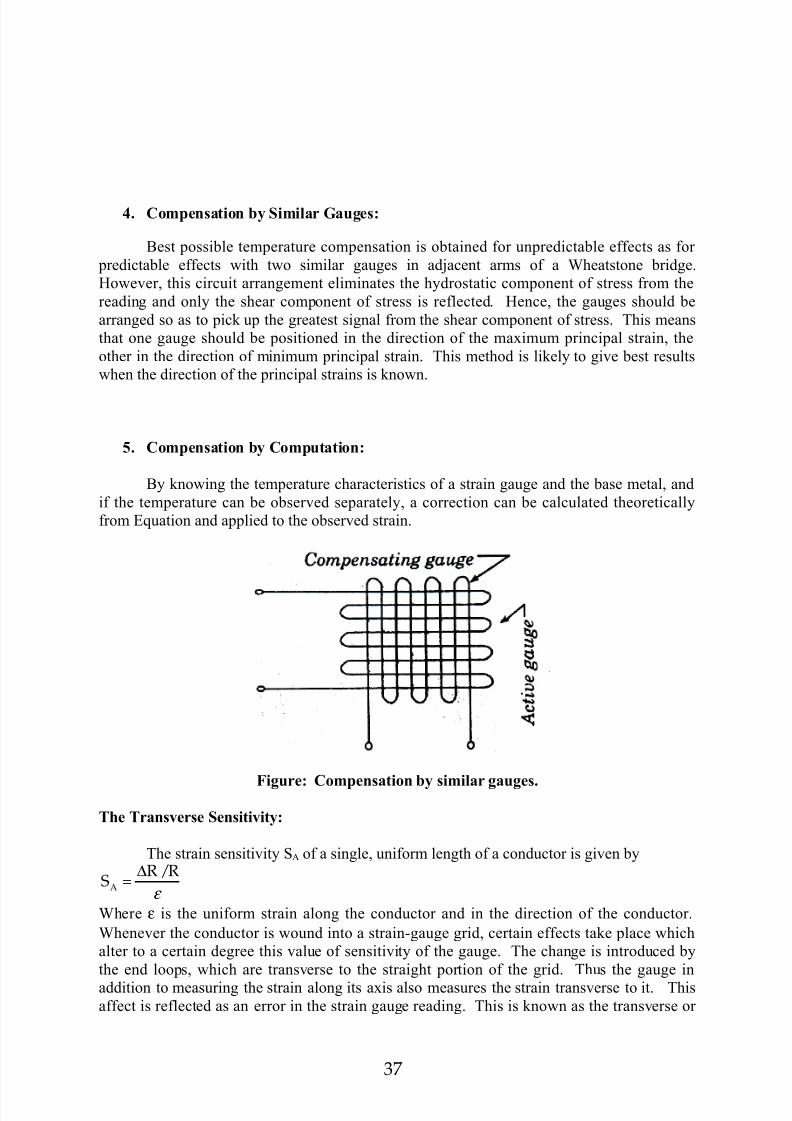
. C$m1esa!'$ ;+ C$m1u!a!'$/
y 8nowing the temperature characteristics of a strain gauge and the base metal, and
if the temperature can be observed separately, a correction can be calculated theoretically
from !uation and applied to the observed strain.
')ure/ C$m1esa!'$ ;+ s'm'%ar )au)es.
T*e Traserse Ses'!''!+/
The strain sensitivity SA of a single, uniform length of a conductor is given by
A
R/RS
ε
∆=
$here ε is the uniform strain along the conductor and in the direction of the conductor.
$henever the conductor is wound into a strain1gauge grid, certain effects ta8e place which
alter to a certain degree this value of sensitivity of the gauge. The change is introduced by
the end loops, which are transverse to the straight portion of the grid. Thus the gauge in
addition to measuring the strain along its axis also measures the strain transverse to it. Thisaffect is reflected as an error in the strain gauge reading. This is 8nown as the transverse or
37

7/25/2019 esa notes gsdggb
http://slidepdf.com/reader/full/esa-notes-gsdggb 38/52
cross1sensitivity of the gauge. (ow
Axial @parallel strain sensitivity
11 y
x
R/RS when 0ε
ε
∆= =
(ormal @perpendicular strain sensitivity
x
y
R/RS when 0ε
ε ⊥
∆= =
Transverse sensitivity factor is defined as
x
y
0
y
0
x
SKS
R/R
R/R
ε
ε
ε
ε
⊥
=
=
=
∆
= ∆
P
-auge factor ' as specified by the manufacturer is
y x
x
R/RF when 0.285ε ε
ε
∆= = −
Assuming that the gauge has been calibrated on steel whose PoissonHs ratio is =.94N.
I!r$u&!'$/
$hen the state of strain at a point and the direction of principal strains is 8nown, then
the strain gauges can be oriented along these directions, and strain measurements may be
made. 2owever, when the state of strain is not 8nown, then three or more gauges may beused at the point to determine the state of strain at the point. The resulting configuration is
termed a strain rosette. Strain1rosette analysis is the art of arranging strain gauges as rosettes
at a number of points on the ob?ect to be investigated, ta8ing the measurements, and
computing the state of stress at these points.
Strain rosette analysis is based on the assumptions of isotropic, homogeneous and
linear material and of strain gradients so small that the strains can be considered as
substantially uniform over the area covered by the rosette gauges. &n this chapter, we shall
study strain rosettes of various configurations currently in use.
38
7/25/2019 esa notes gsdggb
http://slidepdf.com/reader/full/esa-notes-gsdggb 39/52
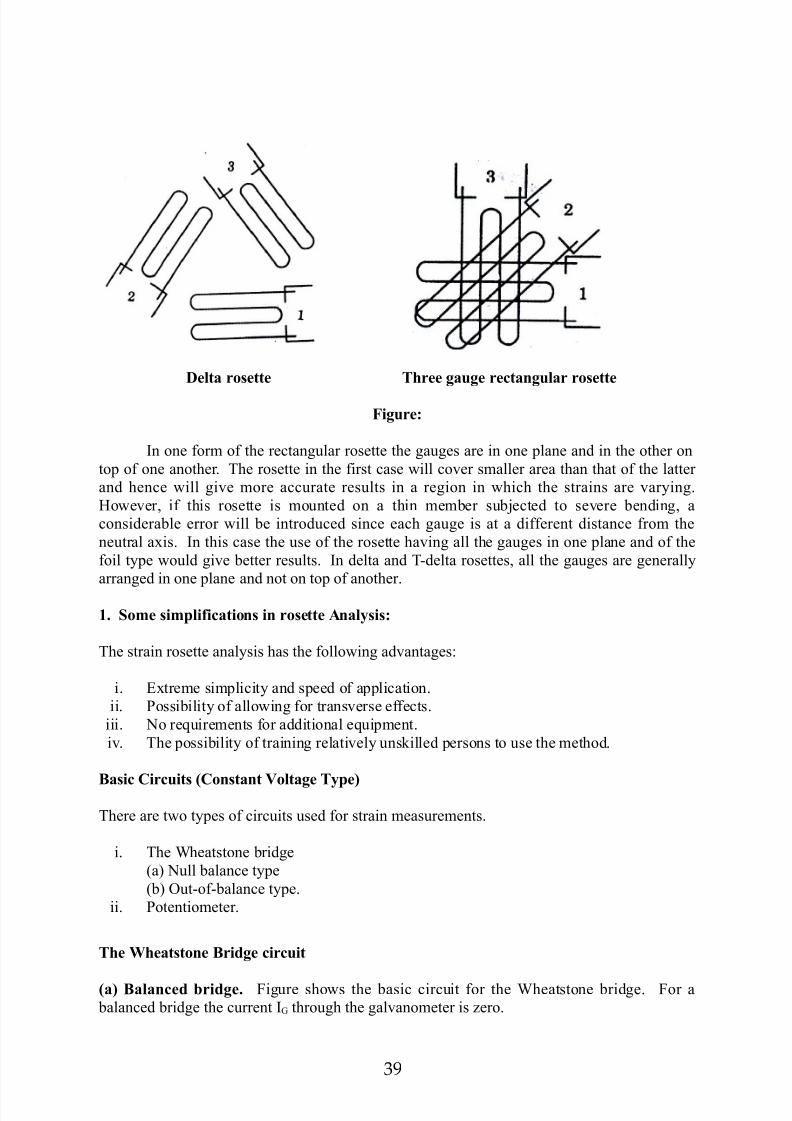
-e%!a r$se!!e T*ree )au)e re&!a)u%ar r$se!!e
')ure/
&n one form of the rectangular rosette the gauges are in one plane and in the other on
top of one another. The rosette in the first case will cover smaller area than that of the latter
and hence will give more accurate results in a region in which the strains are varying.
2owever, if this rosette is mounted on a thin member sub?ected to severe bending, a
considerable error will be introduced since each gauge is at a different distance from the
neutral axis. &n this case the use of the rosette having all the gauges in one plane and of the
foil type would give better results. &n delta and T1delta rosettes, all the gauges are generally
arranged in one plane and not on top of another.
. S$me s'm1%'5'&a!'$s ' r$se!!e Aa%+s's/
The strain rosette analysis has the following advantagesE
i. xtreme simplicity and speed of application.
ii. Possibility of allowing for transverse effects.
iii. (o re!uirements for additional e!uipment.
iv. The possibility of training relatively uns8illed persons to use the method.
Bas'& C'r&u'!s <C$s!a! V$%!a)e T+1e=
There are two types of circuits used for strain measurements.
i. The $heatstone bridge
@a (ull balance type
@b Out1of1balance type.
ii. Potentiometer.
T*e 7*ea!s!$e Br')e &'r&u'!
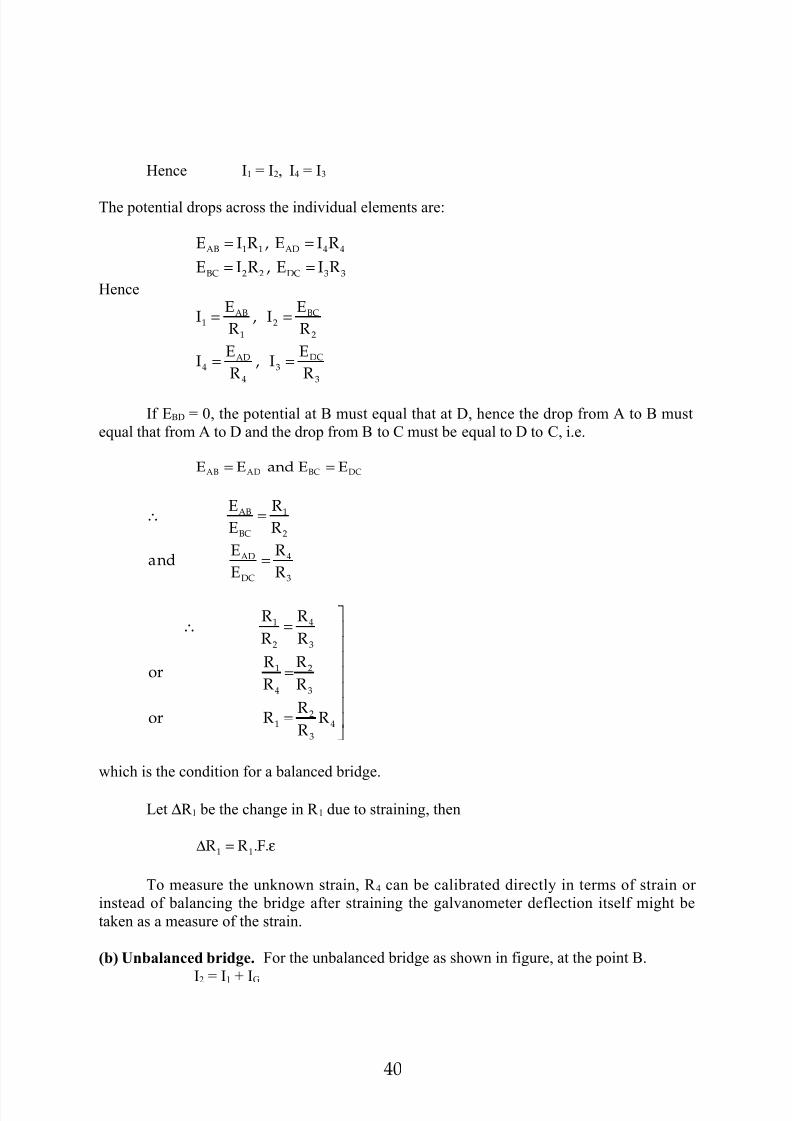
<a= Ba%a&e ;r')e. 'igure shows the basic circuit for the $heatstone bridge. 'or a
balanced bridge the current &- through the galvanometer is Fero.
39
7/25/2019 esa notes gsdggb
http://slidepdf.com/reader/full/esa-notes-gsdggb 40/52
2ence &* I &9, &5 I &;
The potential drops across the individual elements areE
AB 1 1 AD 4 4
BC 2 2 DC 3 3
E IR, E IR
E IR, E IR
= == =
2ence
BCAB1 2
1 2
DCAD4 3
4 3
EEI , I
R R
EEI , I
R R
= =
= =
&f ) I =, the potential at must e!ual that at ), hence the drop from A to must
e!ual that from A to ) and the drop from to " must be e!ual to ) to ", i.e.
AB AD BC DCE E and E E= =
AB 1
BC 2
AD 4
DC 3
E R
E R
E Rand
E R
∴ =
=
1 4
2 3
1 2
4 3
21 4
3
R R
R R
R Ror =
R R
Ror R R
R
∴ =
=
which is the condition for a balanced bridge.
+et ∆# * be the change in # * due to straining, then
1 1R R.F.∆ = ε
To measure the un8nown strain, # 5 can be calibrated directly in terms of strain or
instead of balancing the bridge after straining the galvanometer deflection itself might be
ta8en as a measure of the strain.
<;= U;a%a&e ;r')e. 'or the unbalanced bridge as shown in figure, at the point .
&9 I &* J &-
40

7/25/2019 esa notes gsdggb
http://slidepdf.com/reader/full/esa-notes-gsdggb 41/52
At the point )
&5 % &- I &9
')ure/ Nu%% ;a%a&e 7*ea!s!$e ;r')e
Nu%%Ba%a&e Br')es
&n static applications it is possible to employ a null balance bridge where the
resistance of one or more arms in the bridge is changed to match the effect of the change in
resistance of the active gauge. The null balance system is usually more accurate than the
direction1readout bridge and re!uires less expensive e!uipment for its operation. A relatively
simple null1balance type of $heatstone bridge is shown in 'igure. A slide wire resistance
potentiometer is placed across the bridge from to ) and the point " is connected to a point
"H on the balance resistor. Assume that initially the bridge is balanced with active gauge in
arm * so that # *# ; I # 9# 5 and # N I # . The meter - is at null or Fero voltage. (ow consider
a resistance change in # *, which upsets this balance, causing a voltage indication on meter -.
The slide wire on the potentiometer is ad?usted, ma8ing # N ≠ # , until the bridge is again
balanced. The potentiometer ad?ustment, which is calibrated, is proportional to the resistancechange in the active gauge. Thus the mechanical movement of the potentiometer serves as
the readout means, and the voltage is measured only to establish a Fero or null point.
(ow the e!uivalent resistances are
2 52e
2 5
RRR
R R=
+
41

7/25/2019 esa notes gsdggb
http://slidepdf.com/reader/full/esa-notes-gsdggb 42/52
<a= Para%%e% ;a%a&') &'r&u'!. <;= Eu'a%e! &'r&u'!.
3 63e
3 6RRR R R= +
An ad?ustment of the potentiometer will produce a change in the resistances of # N and #
e!ual to ∆# N and ∆# , so that ∆# N I 1∆# , since the total resistance of potentiometer remains
constant.
The change in e!uivalent resistances become,
2 5 5 2 5 5 2 5 2 52e 2e
2 5 2 5
5 5 5 2 5 5
3e 3e 6 6 6 3 6 6
[R(R R)/(R R R)]RR(R R)R /R
RR /(R R) = (R/R)/[1 (R/R) (1 + R/R)]
R /R (R /R)/[1 (R/R) (1 + R /R)]
+ ∆ + + ∆ − +∆ =
+∆ + ∆∆ = ∆ + ∆
2ence by using an active gauge in arm * and a dummy gauge in arm 5, the change in
voltage output becomes,
21 2e 1 2e 1 1 2e 2e 3e 3e
1 1 2 2e 3e 3e
5 5 5 2 5 5
6 6 6 3
E [VRR /(R R )] [R/R R /R R /R ]
= 0
R/R F R/R R /R
= (R/R)/[(1 R/R)(1 R/R)]
- (R/R)/[(1 R/R) (
∆ = + ∆ − ∆ − ∆
∆ = ε = ∆ − ∆
∆ + + ∆∆ + 6 61+R/R)]∆
'or an initially balanced bridge,
$hen # N I # , # 9 I # ;
and ∆# N I 1∆# , we get
42

7/25/2019 esa notes gsdggb
http://slidepdf.com/reader/full/esa-notes-gsdggb 43/52
1 1
5 2 5 5
2 25 2 5 2 5 5
R/R F
2 (1+R/R)(R/R)
=1 2(R/R)(R/R)[1 R/R)]
∆ = ε∆
+ + − ∆
!uation indicates that the strain reading ε obtained by using a parallel1balance circuit
is nonlinear in terms of the ad?ustment of # N.
gtp
t gextra
RR 1(1 n)T
R TR
∆ ∆= − ∆ α − ÷ ÷ ÷∆
g
g
R1
.T R
∆
∆ represents the combined effect of temperature on actual gauge installation.
Ca%';ra!'$ Me!*$s
Ne&ess'!+ $5 &a%';ra!'$
*. y 8nowing the output of a constant voltage or constant gauge current bridge
circuit and sensitivity @units of deflectionGm< orGµA of the indicator, the indicator deflection
can be related to strain. This is the method generally used for designing strain gauge circuits
and selecting recording or indicating e!uipment. 2owever, it is not suitable for final
calibration of system, since with this method the final accuracy of the system would dependupon the accuracy with which all of the parameters involved could be measure and held
constant during the period of test. 2ence a handy, reliable, and direct calibrations is
extremely important.
9. Since the final output of the strain amplifiers is an electrical signal whose
magnitude depends on the strain to which the gauge is sub?ected, the strain appears as nothing
more than a wave or series of waves on an oscilloscope screen, and some means of ?udging
its absolute magnitude must be provided. The following methods may be used for calibrating
a strain gauge.
. E%e&!r'&a% &a%';ra!'$. <a= S!a!'& S!ra' Ca%';ra!'$
'rs! Me!*$ / S*u! res's!$r. The strain1gauge resistance in one leg of the $heatstone
bridge circuit is shunted by an open1circuited resistor of considerably high value as shown in
'igure.
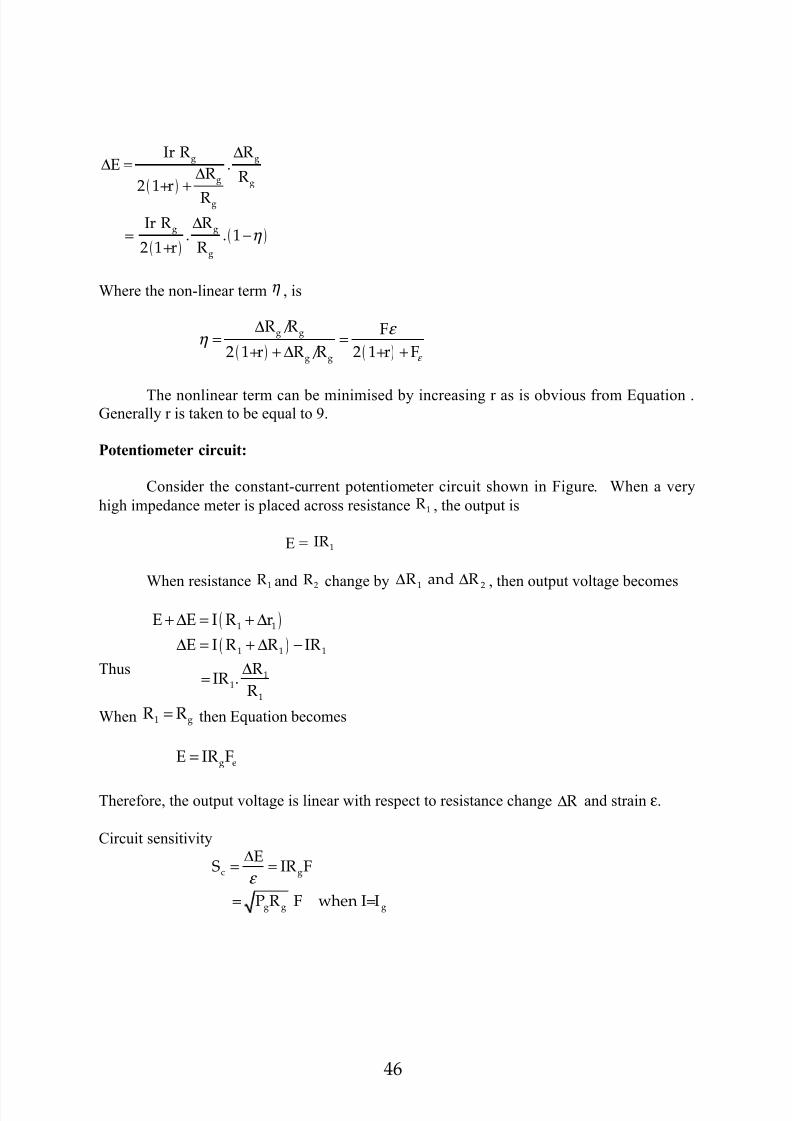
C$s!a!Curre! &'r&u'!s/
Dpto now we have discussed the wheatstone and Pot circuits driven by a constant
voltage source which ideally remains constant with change in resistance of the circuit. The
output of these circuits is non1linear and the non1linearity factor η increases as ∆ #G#
increases. To improve upon the circuit performance a constant current source instead of the
43

7/25/2019 esa notes gsdggb
http://slidepdf.com/reader/full/esa-notes-gsdggb 44/52
constant voltage source may be used. A constant1current power supply is a high impedance
device @of the order of * to *= MΩ which changes output voltage with changing resistive
load to maintain a constant current.
7*ea!s!$e ;r')e &'r&u'!/
"onsider the constant1current source $heatstone bridge circuit as shown in 'igure At
point A
1 2I I I= +
AlsoAB 1 1
AB 2 4
V IR
V IR
==
The output voltage from the bridge can be expressed as
BD AB AD
1 1 2 4
E V V V
= IR IR
= = −−
'or the balanced bridge under no1load conditions,
I =
')ure/ C$s!a! &urre! 7*ea!s!$e ;r')e &'r&u'!.
2ence 1 1 2 4IR IR=
(ow( )
( )
AC 1 1 2
2 3 4
V IR R
= IR R
= +
+
2ence
3 41
2 1 2
R RI
I R R
+
= ÷+
44

7/25/2019 esa notes gsdggb
http://slidepdf.com/reader/full/esa-notes-gsdggb 45/52
Or
3 41
2 1 2
1 2 3 41 2
2 1 2
R RI1 1
I R RR R R RI I
I R R
++ = +
++ + ++=
+
1 22
1 2 3 4
3 41
1 2 3 4
R R I I
R R R R
R Rand I I
R R R R
+∴ = ÷+ + +
+= ÷+ + +
Thus the output voltage becomes
( )
( )1 3 2 4
1 2 3 4
IRR RRE
R R R R
−=
+ + +
$hen the bridge is balanced, I = we get
1 3 2 4RR RR=
&f the resistances. 1 2 3 4R,R,R and R change by the amounts
1 2 3 4R,R,R and R∆ ∆ ∆ ∆ , the output voltage E E+ ∆ measured with a very high impedance
meter is
( )( ) ( ) ( ) ( )1 1 3 3 2 2 4 44
i ii1
1E E R R R R R R R R
R R=
+ ∆ = + ∆ + ∆ − + ∆ + ∆ + ∆∑
'or an initially balanced bridge, we get
( )
1 3 3 31 2 4 1 2 44
1 2 3 4 1 3 2 4i ii1
IRR R RR R R R R RE
R R R R R R R RR R
=
∆ ∆∆ ∆ ∆ ∆ ∆ ∆∆ = − + − + − −
+ ∆∑The output given by !. is nonlinear with respect to ∆# because of the term
4
ii1
R=
∆∑ in the
denominator and the last two terms in the brac8eted !uantity. 2owever, this non1linearity is
much smaller than the constant voltage source circuit. +et 1 4 gR R R,= = 2 3 gR R rR,= =
2R∆ = ∆ 3R 0,= i.e.1R is an active gauge and
4R is temperature1compensating dummy
gauge, then 1 g 4R R,R 0,∆ = ∆ ∆ = !. then reduces to
45
7/25/2019 esa notes gsdggb
http://slidepdf.com/reader/full/esa-notes-gsdggb 46/52
( )
( ) ( )
g g
g g
g
g g
g
Ir R RE .
R R21+r
R
Ir R R = . .1
21+r Rη
∆∆ = ∆
+
∆−
$here the non1linear term η , is
( ) ( )
g g
g g
R/R F
21+r R/R 21+r Fε
ε η
∆= =
+ ∆ +
The nonlinear term can be minimised by increasing r as is obvious from !uation .-enerally r is ta8en to be e!ual to 3.
P$!e!'$me!er &'r&u'!/
"onsider the constant1current potentiometer circuit shown in 'igure. $hen a very
high impedance meter is placed across resistance 1R , the output is
I 1IR
$hen resistance 1
R
and 2
R
change by 1 2
R and R∆ ∆, then output voltage becomes
( )1 1E E IR r+ ∆ = + ∆
Thus
( )1 1 1
11
1
E IR R IR
R = IR.
R
∆ = + ∆ −∆
$hen 1 gR R= then !uation becomes
g eE IRF=
Therefore, the output voltage is linear with respect to resistance change R∆ and strain ε.
"ircuit sensitivity
c g
g g g
ES IRF
= PR F when I=I
ε
∆= =
46
7/25/2019 esa notes gsdggb
http://slidepdf.com/reader/full/esa-notes-gsdggb 47/52
')ure/ C$s!a! &urre! 1$!e!'$me!er &'r&u'!.
&t can be easily seen that the circuit sensitivity of the constant current is higher than
that of the constant1voltage circuit.
Ass$&'a!e Is!rume!a!'$/
S!a!'& s!ra's/
'or most analysis wor8, static strains may be measured by a wheatstone bridge. The
bridge may be either operated on ).". or A.". $hen A." is employed then a carrier systemhas to be used. -enerally null balance system is preferred over the out1of1balance method
because the null balance system is more accurate than the direct readout and is less
expensive. The earlier commercial strain indicators use a reference bridge circuit to provide
the null1balance system as shown in 'igure. $ith commercial strain indicators, the
ad?ustment resistance gives a direct readout in strain. A commercial null1balance system is
shown in 'igure@a and @b. These models can operated either on A.". or battery. 'igure
shows a direct readout amplifier and ?unction box. Switching and balancing units are
available for multiple gauge installations.
')ure/ -'re&! rea$u! am1%'5'er a Fu&!'$ ;$#.
47

7/25/2019 esa notes gsdggb
http://slidepdf.com/reader/full/esa-notes-gsdggb 48/52
&n the manual null1balance strain indicators the output from each gauge is recorded
manually on a data sheet. The data are usually processed by hand or with a simple programmable calculator. 'igure shows a typical strain indicator system. 'igure shows the
).". operation of the $heatstone bridge and 'igure shows the A.". operation. 'igure shows
an automatically balanced bridge, it is necessary to build a phase1sensitive detector into the
rectifying circuit.
The manual direct reading strain indicator is shown in 'igure. $ith this instrument,
the $heatstone bridge is initially balanced and then the voltage output due to stain is
amplified and read out on a digital voltmeter.
')ure/ S?'!&*') a ;a%a&') u'!.
')ure/ -'re&! ')'!a% rea$u! s!ra' ''&a!$r.
48

7/25/2019 esa notes gsdggb
http://slidepdf.com/reader/full/esa-notes-gsdggb 49/52
')ure/ A !+1'&a% s!ra' ''&a!') s+s!em.
$hen relatively large strain1gauge installations are used to analyse a problem then automatic
data1ac!uisition systems should be employed. The automatic data1ac!uisition systemconsists of four basic sub1system which include the controller, the signal conditioner1scanner,
the analog1to1digital converter and the readout devices. The signal conditioner1scanner
consists of the power supply, the $heatstone bridges and the switches used to connect a large
number of gauges in turn to the single voltage recording instrument. ach bridge has a small
control panel with a balance ad?ustment, a span ad?ustment and a calibration switch. The
output from the wheatstone bridge is switched into a high !uality digital voltmeter, which
measures the average of the input voltage over a fixed measuring period.
')ure/ -.C. $1era!'$ $5 7*ea!s!$e ;r')e.
-+am'& S!ra's/
$hile recoding dynamic strains, the fre!uency of the strain signal is an important
consideration in selecting the recording system. The help of the following table may be ta8en
in selecting the recording system depending upon the strain fre!uency.
're!uency #ange #ecording System
<ery low @=1; 2F &ntegrating digital voltmeter, potentiometer
49

7/25/2019 esa notes gsdggb
http://slidepdf.com/reader/full/esa-notes-gsdggb 50/52
recorder and xy1recorder.
&ntermediate @=1*= 82F Oscillograph with a pen @=1*== 2F and a light
writing @=1*= 82F galvanometer.2igh @=19= 82F 'M instrument tape recorder.
<ery high @above 9= 82F "athode ray oscillosope.
'or very low fre!uencies, instruments such as potentiometer @or strip chart recorders
and xy1recorders, which employ servo1motors together with feedbac8 control and null1
balance positioning can be used to measure the output voltage from the strain gauge bridge.
The operating principle of such an instrument is shown in 'igure.
')ure/ O1era!') 1r'&'1%e $5 a ser$r'e u%%;a%a&e &'r&u'! <1$!e!'$me!er= 5$r
$%!a)e measureme!.
Potentiometer recorders can be used to measure voltages from * µ< to *== v. The
chart speeds can be varied over a wide range of 9N mmGh to N= mmGs. ecause of their low
fre!uency response, the potentiometer cannot be used in strain gauge applications where the
strain signal has fre!uency components greater than * 2F. 'igure shows a double beam
oscilloscope.
'or recording strains at high fre!uencies magnetic1tape analog data recording systems
are used. )ata recorded and strode on magnetic tape are usually played bac8 and displayed
on an oscillograph. y varying the tape speed during playbac8, the time base can beextended or compressed. &nformation stored on magnetic tape can be reliably retrieved any
number of times and different analysis made. 'igure shows the schematic s8etch for a
magnetic tape recorder. &n a magnetic tape recorder, the tape @*.9: to 9N.5 mm wide is
driven at a constant speed by a served d.c. capstan motor over either the record or reproduce
heads. The speed of the capstan motor is monitored with a photocell and compared with the
fre!uency from a crystal oscillator to provide the feedbac8 signal in a closed loop servo
system designed to maintain constant tape speeds. The signal written on the tape by the
record magnetic head assemblies is in the form of variations in the level of magnetism
imposed on the magnetic coating of the tape. The reproduce head converts these variations in
magnetism bac8 into electrical signals.
50
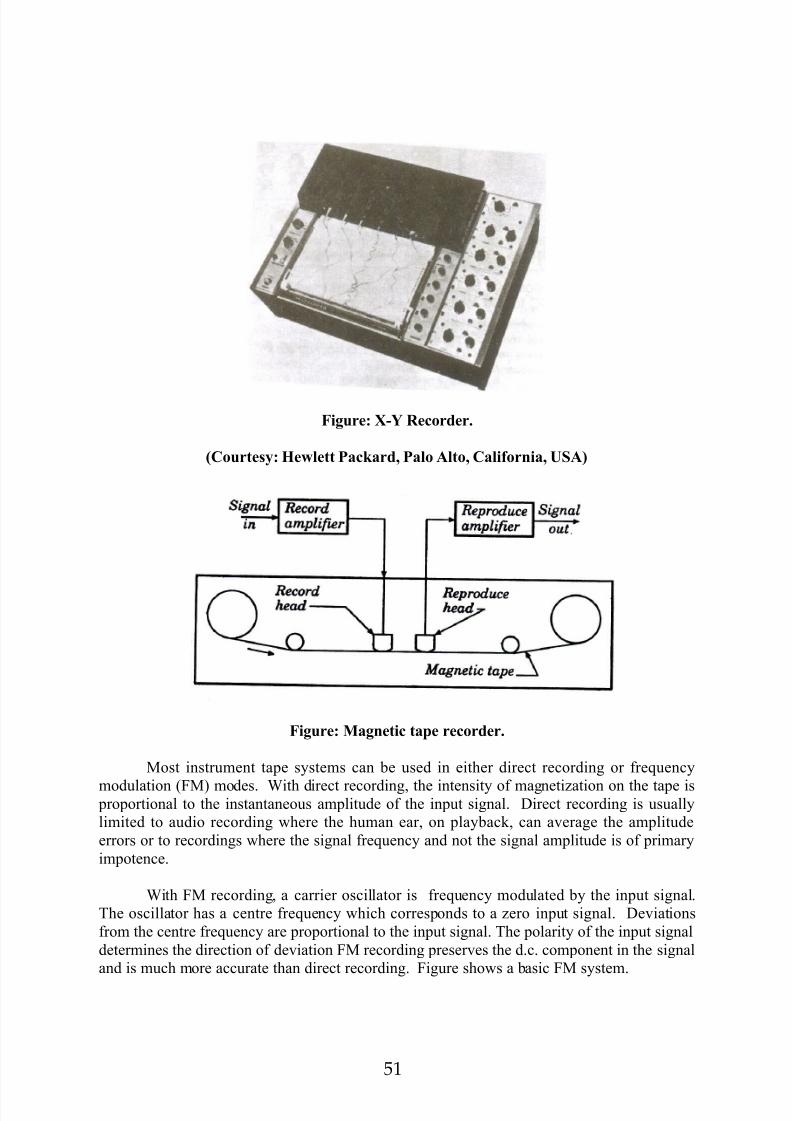
7/25/2019 esa notes gsdggb
http://slidepdf.com/reader/full/esa-notes-gsdggb 51/52
')ure/ XY Re&$rer.
<C$ur!es+/ >e?%e!! Pa&ar@ Pa%$ A%!$@ Ca%'5$r'a@ USA=
')ure/ Ma)e!'& !a1e re&$rer.
Most instrument tape systems can be used in either direct recording or fre!uency
modulation @'M modes. $ith direct recording, the intensity of magnetiFation on the tape is proportional to the instantaneous amplitude of the input signal. )irect recording is usually
limited to audio recording where the human ear, on playbac8, can average the amplitude
errors or to recordings where the signal fre!uency and not the signal amplitude is of primary
impotence.
$ith 'M recording, a carrier oscillator is fre!uency modulated by the input signal.
The oscillator has a centre fre!uency which corresponds to a Fero input signal. )eviations
from the centre fre!uency are proportional to the input signal. The polarity of the input signal
determines the direction of deviation 'M recording preserves the d.c. component in the signal
and is much more accurate than direct recording. 'igure shows a basic 'M system.
51

7/25/2019 esa notes gsdggb
http://slidepdf.com/reader/full/esa-notes-gsdggb 52/52
')ure/ Bas'& .M. s+s!em
<ery high fre!uency recording can be accomplished with cathode ray oscilloscopes
which have bandwidths upto N== M2F. The "#O is, in effect, a voltmeter which can be
employed to measure transient voltage signals. The heart of the "#O is the cathode ray tube
@"#T. The stream of electrons permits the "#T to be employed as a dynamic voltmeter with
an inertialess indicating system. (ow1a1days, storage oscilloscopes are available which
retain the display the image of an electrical wave1form on the tube face after the waveform
ceases to exist. The stored display can be instantaneously erased to ready the tube for displayof the next waveform.
'or dynamic strain1gauge applications, the "#O is an ideal voltage1measuring
e!uipment. The input impedance of the instrument is !uite high @about * MΩQ thus, there is
no appreciable interaction between T2 $heatstone bridge and the measuring instrument.
The fre!uency response of an oscilloscope is usually !uite high, and even a relatively low1
fre!uency model @4== 82F bandpass greatly exceeds the re!uirements for mechanical strain
measurements, which are rarely more than N= 82F. The sensitivity of the "#T is normally
!uite low and it often re!uires *== < to produce 9N mm of deflection on the face of the tube.
This difficulty is generally overcome by providing a built in amplifier in the "#O.
The strain gauge record showing strain as a function of time is obtained by
photographing the face of the "#T as the Spot of light traverses the fluorescent screen. A still
camera or a movie camera may be used to obtain a permanent strain signal record.