Embed Size (px)
Citation preview

Appendix B
STATISTICAL TABLES RELATING TO INCOME,EMPLOYMENT, AND PRODUCTION
203
Digitized for FRASER http://fraser.stlouisfed.org/ Federal Reserve Bank of St. Louis

Digitized for FRASER http://fraser.stlouisfed.org/ Federal Reserve Bank of St. Louis

CONTENTSNational income or expenditure: p a g e
B-l. Gross national product or expenditure, 1929-67 209B-2. Gross national product or expenditure, in 1958 prices, 1929-67 210B-3. Implicit price deflators for gross national product, 1929-67 212B-4. Gross national product by major type of product, 1929-67 214B-5. Gross national product by major type of product, in 1958 prices,
1929-67 215B-6. Gross national product: Receipts and expenditures by major economic
groups, 1929-67 216B-7. Gross national product by sector, 1929-67 218B-8. Gross national product by sector, in 1958 prices, 1929-67 219B-9. Gross national product by industry, in 1958 prices, 1947-66 220B-10. Personal consumption expenditures, 1929-67 221B-l 1. Gross private domestic investment, 1929-67 222B-12. National income by type of income, 1929-67 223B-l3. Relation of gross national product and national income, 1929-67 224B-14. Relation of national income and personal income, 1929-67 225B-15. Disposition of personal income, 1929-67 226B-l6. Total and per capita disposable personal income and personal con-
sumption expenditures, in current and 1958 prices, 1929-67 227B-17. Sources of personal income, 1929-67 228B-18. Sources and uses of gross saving, 1929-67 230B-19. Financial saving by individuals, 1939-67 231B—20. Number and money income of families and unrelated individuals,
1947-66 232
Population, employment, wages, and productivity:B-21. Population by age groups: Estimates, 1929-67, and projections, 1970-85. 233B-22. Noninstitutional population and the labor force, 1929-67 234B-23. Civilian employment and unemployment, by sex and age, 1947-67.. . 236B-24. Selected unemployment rates, 1948-67 237B-25. Unemployment by duration, 1947-67 238B-26. Unemployment insurance programs, selected data, 1940-67 239B-27. Wage and salary workers in nonagricultural establishments, 1929-67. 240B-28. Average weekly hours of work in selected nonagricultural industries,
1929-67 242B-29. Average gross hourly earnings in selected industries, 1929-67 243B-30. Average gross weekly earnings in selected nonagricultural industries,
1929-67 244B-31. Average weekly hours and hourly earnings, gross and excluding over-
time, in manufacturing industries, 1939-67 245B—32. Average weekly earnings, gross and spendable, total private nonagricul-
tural industries, in current and 1957-59 prices, 1947-67 246B—33. Average weekly earnings, gross and spendable, in manufacturing
industries, in current and 1957-59 prices, 1939-67 247B-34. Indexes of output per man-hour and related data, private economy,
1947-67 248
205284-593 0—68 14
Digitized for FRASER http://fraser.stlouisfed.org/ Federal Reserve Bank of St. Louis

Production and business activity: Page
B-35. Industrial production indexes, major industry divisions, 1929-67 249B—36. Industrial production indexes, market groupings, 1947—67. . . 250B-37. Industrial production indexes, selected manufactures, 1947-67 251B-38. Manufacturing output, capacity, and utilization rate, 1948-67 252B-39. Business expenditures for new plant and equipment, 1939 and 1945-
68 253B-40. New construction activity, 1929-67 254B-41. New housing starts and applications for financing, 1929-67 256B-42. Sales and inventories in manufacturing and trade, 1947-67. . 258B-43. Manufacturers' shipments and inventories, 1947-67 259B-44. Manufacturers' new and unfilled orders, 1947-67 260
Prices:
B-45. Consumer price indexes, by major groups, 1929-67 261B-46. Consumer price indexes, by special groups, 1935-67 262B-47. Consumer price indexes, selected commodities and services, 1935-67.. 263B-48. Wholesale price indexes, by major commodity groups, 1929-67 264B-49. Wholesale price indexes, by stage of processing, 1947-67 266
Money supply, credit, and finance:
B-50. Money supply, 1947-67 268B-51. Bank loans and investments, 1929-67 269B-52. Selected liquid assets held by the public, 1946-67 270B-53. Federal Reserve Bank credit and member bank reserves, 1929-67. . . . 271B-54. Bond yields and interest rates, 1929-67 272B—55. Short- and intermediate-term consumer credit outstanding, 1929—67. 274B-56. Instalment credit extended and repaid, 1946-67 275B-57. Mortgage debt outstanding, by type of property and of financing,
1939-67 276B-58. Net public and private debt, 1929-67 277
Government finance:
B-59. Federal budget receipts, outlays, financing, and debt, 1958-69 278B-60. Federal budget receipts and outlays, 1958-69 280B-61. Relation of the receipt-expenditure account of the Federal Govern-
ment to the Federal sector of the national income and productaccounts, 1967-69 282
B—62. Receipts and expenditures of the Federal sector of the national incomeand product accounts, 1946-69 283
B-63. Federal finances under the old concepts, fiscal years 1929-69 284B-64. U.S. Government debt, by kind of obligation, 1929-67 285B-65. Estimated ownership of U.S. Government obligations, 1939-67 286B-66. Average length and maturity distribution of marketable interest-bear-
ing public debt, 1946-67 287B-67. Receipts and expenditures of the Government sector of the national in-
come and product accounts, 1929-67 288B-68. State and local government revenues and expenditures, selected fiscal
years, 1927-66 289
206
Digitized for FRASER http://fraser.stlouisfed.org/ Federal Reserve Bank of St. Louis

Corporate profits and finance: PageB-69. Profits before and after taxes, all private corporations, 1929-67 290B-70. Sales, profits, and stockholders' equity, all manufacturing corpora-
tions (except newspapers), 1947-67 291B—71. Relation of profits after taxes to stockholders' equity and to sales, all
manufacturing corporations (except newspapers), by industry group,1947-67 292
B-72. Sources and uses of funds, nonfarm nonfinancial corporate business,1956-67 294
B-73. Current assets and liabilities of United States corporations, 1939-67. . 295B-74. State and municipal and corporate securities offered, 1934-67 296B-75. Common stock prices, earnings, and yields, and stock market credit,
1939-67 297B-76. Business formation and business failures, 1929-67 298
Agriculture:B-77. Income from agriculture, 1929-67 299B-78. Farm production indexes, 1929-67 300B—79. Farm population, employment, and productivity, 1929—67 301B-80. Indexes of prices received and prices paid by farmers, and parity ratio,
1929-67 302B-81. Selected measures of farm resources and inputs, 1929-67 304B-82. Comparative balance sheet of agriculture, 1929-68 305
International statistics:B-83. United States balance of payments, 1947-67 306B-84. United States merchandise exports and imports, by commodity groups,
1958-67 308B-85. United States merchandise exports and imports, by area, 1961-67 309B-86. United States overseas loans and grants, by type and area, fiscal years
1962-67 310B-87. International reserves, 1949, 1953, and 1962-67 311B-88. United States reserve assets: Gold stock, holdings of convertible foreign
currencies, and reserve position in the International MonetaryFund, 1946-67 312
B—89. Price changes in international trade, 1959—67 313B—90. Consumer price indexes in the United States and other major in-
dustrial countries, 1955-67 314
General Notes
Detail in these tables will not necessarily add to totals because of rounding.Unless otherwise noted, all dollar figures are in current prices.
Symbols used:v Preliminary.
__ Not available (also, not applicable).* Amount insignificant in terms of the particular unit (e.g., less than
$50 million where unit is billions of dollars).
207
Digitized for FRASER http://fraser.stlouisfed.org/ Federal Reserve Bank of St. Louis

Digitized for FRASER http://fraser.stlouisfed.org/ Federal Reserve Bank of St. Louis

NATIONAL INCOME OR EXPENDITURETABLE B-l.—Gross national product or expenditure, 1929-67
[Billions of dollars]
Year or quarter
1929..
1930..1931-1932..1933..1934..1935..1936..1937..1938..1939..
1940..1941..1942..1943-1944..1945..1946-1947..1948..1949..
1950..1951..1952..1953..1954..1955..1956..1957..1958..1959..
I960..1961..1962..1963..1964..1965..1966..1967*.
1965: I . . .II . .III.IV..
1966: I . . .II . .III.IV..
1967: I . . . .I I . . .III.. .IV p .
Totalgross
nationalproduct
103.1
90.475.858.055.665.172.282.590.484.790.5
99.7124.5157.9191.6210.1211.9208.5231.3257.6256.5
284.8328.4345.5364.6364.8398.0419.2441.1447.3483.7
503.7520.1560.3590.5632.4683.9743.3785.1
Per-sonalcon-
sump-tion
expend-itures^
662.7675.4690.0708.4
725.9736.7748.8762.1
766.3775.1791.2807.6
77.2
69.960.548.645.851.355.761.966.563.966.8
70.880.688.599.3
108.3119.7143.4160.7173.6176.8
191.0206.3216.7230.0236.5254.4266.7281.4290.1311.2
325.2335.2355.1375.0401.2433.1465.9491.6
Grossprivate
do-mesticinvest-ment2
16.2
10.35.61.01.43.36.48.5
11.86.59.3
13.117.99.85.77.1
10.630.634.046.035.7
54.159.351.952.651.767.470.067.860.975.3
74.871.783.087.194.0
107.4118.0112.1
Netexportsof goods
andserv-ices 3
1.1
1.0
!4.4.6.1.1.3
1.31.1
1.71.3
*- 2 . 0- 1 . 8- . 67.5
11.56.46.11.83.72.2.4
1.82.04.05.72.2.1
4.05.65.15.98.56.95.15.0
Government purchases of goods and services
Total
8.5
9.29.28.18.09.8
10.012.011.913.013.3
14.024.859.688.696.582.327.025.131.637.8
37.959.174.781.674.874.278.686.194.297.0
99.6107.6117.1122.5128.7136.4154.3176.3
Federal4
Total
1.3
1.41.51.52.03.02.94.94.75.45.1
6.016.951.981.189.074.217.212.516.520.1
18.437.751.857.047.444.145.649.553.653.7
53.557.463.464.265.266.877.089.9
Nationaldefense5 Other
1.2
2.213.849.479.787.473.514.79.1
10.713.3
14.133.645.948.741.238.640.344.245.946.0
44.947.851.650.850.050.160.572.6
1.3
1.41.51.52.03.02.94.94.75.4
3.9
3.83.12.51.41.6.7
2.53.55.86.8
4.34.15.98.46.25.55.35.37.77.6
8.69.6
11.813.515.216.716.517.3
Seasonally adjusted annual rates
420.2428.1436.4447.8
458.2461.6470.1473.8
480.2489.7495.3501.4
105.1105.1108.2112.3
115.2118.5116.4122.2
110.4105.1112.2120.7
6.18.27.46.1
6.15.44.64.3
5.35.35.44.0
131.3133.9138.1142.3
146.5151.2157.7161.7
170.4175.0178.2181.5
64.365.467.669.8
72.174.979.581.5
87.189.590.992.0
48.449.250.352.4
55.158.463.065.6
70.272.573.374.3
15.916.217.317.4
17.116.616.615.9
16,817! 017.617.7
Stateandlocal
7.2
7.87.76.66.06.87.17.07.27.68.2
8.07.97.77.47.58.19.8
12.615.017.7
19.521.522.924.627.430.133.036.640.643.3
46.150.253.758.263.569.677.286.4
66.968.670.472.5
74.376.278.180.2
83.385.487.489.5
»See Table B-10 for major components.2See Table B-ll for detailed components.3 See Table B-6 for exports and imports separately.« Net of Government sales.5 This category corresponds closely to the national defense classification in the "Budget of the United States Govern-
ment for the Fiscal Year ending June 30,1969."
Source: Department of Commerce, Office of Business Economics.
209
Digitized for FRASER http://fraser.stlouisfed.org/ Federal Reserve Bank of St. Louis

TABLE B-2.—Gross national product or expenditure, in 1958prices, 1929-67
[Billions of dollars, 1958 prices]
Year orquarter
1929..
1930..1931..1932..1933..1934..1935..1936-1937..1938..1939..
1940..1941..1942..1943..1944..1945..1946..1947..1948..1949..
i950.
1952..1953..1954..1955..1956..1957..1958..1959..
I960..1961..1962..1963..1964.1965..1966..1967 i
1965: II I — -IIIIV
1966: II I . . . .I I I . . . .IV. . . .
1967: Il l _ . . .I l l—IV *_.
Totalgrossna-
tionalprod-
uct
203.6
183.5169.3144.2141.5154.3169.5193.0203.2192.9209.4
227.2263.7297.8337.1361.3355.2312.6309.9323.7324.1
355.3383.4395.1412.8407.0438.0446.1452.5447.3475.9
487.7497.2529.8551.0581.1616.7652.6669.2
601.5609.7620.7634.4
645.4649.3654.8661.1
660.7664.7672.0679.4
Personal consumptionexpenditures
Total
139.6
130.4126.1114.8112.8118.1125.5138.4143.1140.2148.2
155.7165.4161.4165.8171.4183.0203.5206.3210.8216.5
230.5232.8239.4250.8255.7274.2281.4288.2290.1307.3
316.1322.5338.4353.3373.7398.4418.0429.9
Dura-ble
goods
16.3
12.911.28.48.39.4
11.714.515.112.214.5
16.719.111.710.29.4
10.620.524.726.328.4
34.731.530.835.335.443.241.041.537.943.7
44.943.949.253.759.066.471.372.1
Non-dura-
blegoods
69.3
65.965.660.458.662.565.973.476.077.181.2
84.689.991.393.797.3
104.7110.8108.3108.7110.5
114.0116.5120.8124.4125.5131.7136.2138.7140.2146.8
149.6153.0158.2162.2170.3178.9187.7192.8
Serv-ices
54.0
51.549.445.946.046.147.950.552.050.952.5
54.456.358.561.864.767.772.173.475.877.6
81.884.887.891.194.899.3
104.1108.0112.0116.8
121.6125.6131.1137.4144.4153.2159.1164.9
Gross private domestic investment
Total
40.4
27.416.84.75.39.4
18.024.029.917.024.7
33.041.621.412.714.019.652.351.560.448.0
69.370.060.561.259.475.474.368.860.973.6
72.469.079.482.587.898.0
105.696.9
Fixed investment
Total
36.9
28.019.210.99.7
12.115.620.924.519.423.5
28.132.017.312.915.922.642.351.755.951.9
61.059.057.260.261.469.069.567.662.468.8
68.967.073.476.781.989.193.092.1
Nonresidential
Total
26.5
21.714.18.27.69.2
11.515.818.813.715.3
18.922.212.510.013.419.830.236.238.034.5
37.539.638.340.739.643.947.347.441.644.1
47.145.549.751.957.866.072.873.0
JStruc-tures
13.9
11.87.54.43.33.64.05.47.15.65.9
6.88.14.62.93.85.7
12.511.612.311.9
12.714.113.714.915.216.218.518.216.616.2
17.417.417.917.919.121.923.621.8
/pro-ducers'durableequip-ment
12.6
9.96.63.84.35.67.5
10.311.88.19.4
12.114.27.97.29.6
14.117.724.625.722.6
24.825.524.625.824.527.728.829.125.027.9
29.628.131.734.038.744.149.251.2
Resi-dentialstruc-tures
Seasonally adjusted annual rates
10.4
6.35.12.72.12.94.05.15.65.78.2
9.29.84.92.92.52.8
12.115.417.917.4
23.519.518.919.621.725.122.220.220.824.7
21.921.623.824.824.223.220.219.2
389.1394.1400.7409.9
416.2415.2420.4420.4
424.2430.6431.5433.2
65.064.166.869.5
73.069.371.971.1
69.772.972.773.0
174.7178.0179.3183.6
185.8187.7188.8188.4
191.8193.6192.8193.2
149.4152.0154.6156.8
157.3158.2159.8160.9
162.6164.1166.0167.1
95.995.998.3
101.6
104.0106.5103.6108.4
96.991.396.4
102.9
86.687.989.692.4
94.593.193.091.2
90.290.992.994.5
62.964.566.769.7
71.871.773.674.2
73.072.673.273.2
20.421.721.823.6
24.223.423.723.0
22.921.721.521.2
42.542.844.946.2
47.548.349.951.2
50.151.051.751.9
23.723.423.022.6
22.821.419.417.0
17.318.319.721.3
Changein busi-
ness-inven-tories
3.5
- . 6-2 .4-6 .2- 4 . 3-2 .7
2.43.15.5
-2 .41.2
4.99.64.0
- . 2-1 .9-2 .910.0- . 24.6
-3.9
8.310.93.3.9
-2 .06.44.81.2
- 1 . 54.8
3.52.06.05.85.88.8
12.64.7
9.38.08.79.2
9.513.410.617.2
6.7.4
3.58.4
See footnote at end of table.
2 1 0
Digitized for FRASER http://fraser.stlouisfed.org/ Federal Reserve Bank of St. Louis

TABLE B-2.—Gross national product or expenditure, in 1958 prices, 1929—67—Continued
[Billions of dollars, 1958 prices]
Year or quarter
1929
19301931 . . . .19321933193419351936193719381939
194019411942 .19431944 . .1945 . .1946194719481949
1950 .195119521953..195419551956195719581959
19601961 . . -. .-1962196319641965....19661967 v
1965: 1 . . .| |III . . . .IV
1966: 1IIIllIV.
1967: 1 . . .IIIIIIV v
Net exports of goods and services
Netexports
1.5
1.4.9.6
.3- 1 . 0- 1 . 2- . 71.91.3
2.14
- 2 . 1- 5 . 9- 5 8- 3 . 8
8.412.36.16.4
2.75 33 01.13.03.25.06 22.2
.3
4 35.14.55.68.36.04 43.8
5.26.86.45.6
5.44.84.13.2
4.14.14.22.9
Exports
11.8
10.48.9
7.17.37.78.29 89.9
10.0
11 011.27.86.87.6
10.219.622.618.118.1
16.319 318.217.818.820.924.226.223.123.8
27.328.030.032.136.537.540.842.5
Imports
10.3
9.07.96.67.17.18.79.3
10.58.08.7
8.910.89.9
12.613.413.911.210.312.011.7
13.614.115.216.715.817.719.119.920.923.5
23.022.925.526.628.231.536.438.7
Government purchases of goods andservices
Total
22.0
24.325.424.223.326.627.031.830.833.935.2
36.456.3
117.1164.4181.7156.448.439.946.353.3
52.875.492.199.888.985.285.389.394.294.7
94.9100.5107.5109.6111.2114.3124.5138.6
Federal i
3.5
4 04.34.66.08.07.9
12.211.513.312.5
15.036.298.9
147.8165.4139.730.119.123.727.6
25.347.463.870.056.850.749.751.753.652.5
51.454.660.059.558.157.864.774.0
Seasonally adjusted annual rates
33.538.938.538.9
40.340.441.441.2
42.442.342.842.7
28.432.132.133.3
34.935.637.338.0
38.338.238.639.9
111.3112.9115.3117.4
119.9122.7126.6129.1
135.5138.7139.9140.4
56.357.158.559.3
61.263.466.467.8
72.374.475.174.4
State andlocal
18.5
20.221.119.617.318.619.219.619.420.622.7
21.420.118.316.616.316.718.420.822.725.7
27.527.928.429.732.134.435.637.640.642.2
43.545.947.550.153.256.459.964.6
55.055.856.758.0
58.759.460.161.3
63.264.364.966.0
1 Net of Government sales.Source: Department of Commerce, Office of Business Economics.
211
Digitized for FRASER http://fraser.stlouisfed.org/ Federal Reserve Bank of St. Louis
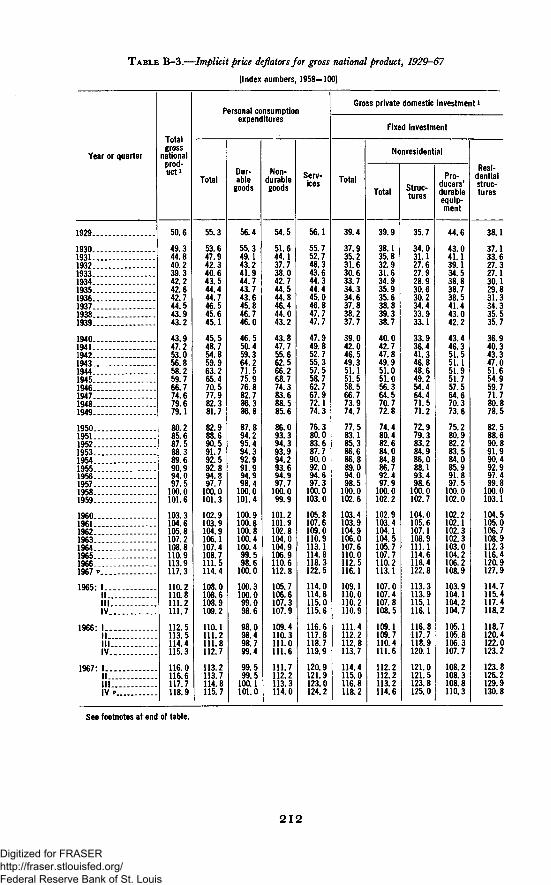
TABLE B-3.—Implicit price deflators for gross national product, 1929-67
[Index numbers, 1958=100]
Year or quarter
1929
1930193119321933193419351936193719381939
194019411942194319441945 - -1946194719481949
1950195119521953195419551956195719581959
19601961196219631964196519661967 '
1965* 1IIIllIV
1966: 1||IIIIV
1967: 1IIIIIIV v
Totalgross
nationalprod-uct^
50.6
49.344.840.239.342.242.642.744.543.943.2
43.947.253.056.858.259.766.774.679.679.1
80.285.687.588.389.690.994.097.5
100.0101.6
103.3104.6105.8107.2108.8110.9113.9117.3
110.2110.8111.2111.7
112.5113.5114.4115.3
116.0116.6117.7118.9
Personal consumption
Total
55.3
53.647.942.340.643.544.444.746.545.645.1
45.548.754.859.963.265.470.577.982.381.7
82.988.690.591.792.592.894.897.7
100.0101.3
102.9103.9104.9106.1107.4108.7111.5114.4
108.0108.6108.9109.2
110.1111.2111.8112.7
113.2113.7114.8115.7
expenditures
Dur-able
goods
56.4
55.349.143.241.944.743.743.645.846.746.0
46.550.459.364.271.575.976.882.786.386.8
87.894.295.494.392.991.994.998.4
100.0101.4
100.9100.6100.8100.4100.499.598.6
100.0
100.3100.099.098.6
98.098.498.799.4
99.599.5
100.1101.0
Non-durablegoods
54.5
51.644.137.738.042.744.544.846.444.043.2
43.847.755.662.566.268.774.383.688.585.6
86.093.394.393.994.293.694.997.7
100.099.9
101.2101.9102.8104.0104.9106.9110.6112.8
105.7106.6107.3107.9
109.4110.3111.0111.6
111.7112.2113.3114.0
Serv-ices
56.1
55.752.748.343.644.344.445.046.847.747.7
47.949.852.755.357.558.762.767.972.174.3
76.380.083.687.790.092.094.697.3
100.0103.0
105.8107.6109.0110.9113.1114.8118.3122.5
114.0114.6115.0115.6
116.6117.8118.7119.9
120.9121.9123.0124.2
Gross private domestic investmentl
Fixed investment
Total
39.4
37.935.231.630.633.734.334.637.838.237.7
39.042.046.549.351.151.558.566.773.974.7
77.583.185.386.686.889.094.098.5
100.0102.6
103.4103.9104.9106.0107.6110.0112.5116.1
109.1110.0110.2110.9
111.4112.2112.8113.7
114.4115.0116.8118.2
Nonresidential
Total
39.9
38.135.832.931.634.935.935.638.839.338.7
40.042.747.849.951.051.056.364.570.772.8
74.480.482.684.084.886.792.497.9
100.0102.2
102.9103.4104.1104.5105.7107.7110.2113.1
107.0107.4107.8108.5
109.1109.7110.4111.6
112.2112.2113.2114.6
Struc-tures
35.7
34.031.127.627.928.930.630.234.433.933.1
33.936.441.346.848.649.254.464.471.571.2
72.979.383.284.986.088.193.498.6
100.0102.7
104.0105.6107.1108.9111.1114.6118.4122.8
113.3113.9115.1116.1
116.8117.7118.9120.1
121.0121.5123.8125.0
Pro-ducers'durableequip-ment
44.6
43.041.139.134.538.838.738.541.443.042.2
43.446.351.551.151.951.757.564.670.373.6
75.280.982.283.584.085.991.897.5
100.0102.0
102.2102.1102.3102.3103.0104.2106.2108.9
103.9104.1104.2104.7
105.1105.8106.3107.7
108.2108.3108.8110.3
Resi-dentialstruc-tures
38.1
37.133.627.327.130.129.831.334.335.535.7
36.940.343.347.051.654.959.771.780.878.5
82.588.690.891.990.492.997.499.8
100.0103.1
104.5105.0106.7108.9112.3116.4120.9127.9
114.7115.4117.4118.2
118.7120.4122.0123.2
123.8126.2129.9130.8
See footnotes at end of table.
2 1 2
Digitized for FRASER http://fraser.stlouisfed.org/ Federal Reserve Bank of St. Louis

TABLE B-3.—Implicit price deflators for gross national product, 1929-67—Continued
[Index numbers, 1958=100]
Year or quarter
1929
1930193119321933193419351936193719381939
1940194119421943194419451946194719481949
1950195119521953195 \19551956195719581959
19601961.196219631964196519661967i» . . . .
1965: 1IIIIIIV
1966: 1IIIIIIV
1967: 1IIIIIIV p.
Exports and imports ofgoods and services1
Exports
59.5
52.341.034.733.740.642.343.446.543.844.1
48.653.061.565.269.971.375.487.392.787.0
84.997.098.895.294.394.997.5
101.3100.098.8
99.9101.9100.8100.6101.5104.5105.4106.7
104.6104.6104.7104.1
104.4105.0105.4106.7
Imports
57.3
49.039.331.528.833.636.036.740.737.938.6
40.843.048.351.253.256.464.979.486.482.2
88.7107.2103.699.1
100.8100.6102.5104.0100.099.3
101.0100.198.599.5
101.5102.4104.1104.3
102.0101.3102.7103.3
103.2104.0104.8104.3
Government purchasesand services
Total
38.6
37.936.333.434.536.837.037.638.438.337.9
38.544 050.953.953.152.655.862.968.171.0
71.878.581.081.884.187.192.196.4
100.0102.4
105.0107.1109.0111.8115.7119.4123.9127.1
117.9118.7119.8121.2
122.2123.1124.6125.2
125.8126.1127.4129.3
Federal
36.0
34.134.531.933.137.437.040.540.740.540.8
40.246 652.554.953.853.157.365.669.873.0
72.979.481.281.483.586.991.795.8
100.0102.2
104.2105.2105.6108.0112.2115.5119.1121.4
114.3114.5115.5117.6
117.9118.3119.7120.2
120.5120.3121.0123.6
of goods
State andlocal
39.1
38.736.633.835.036.637.035.937.136.836.3
37.339 242.344.646 148.653 260.466.468.9
70 876.980 682.885 387.592.797.3
100.0102.6
105.9109.4113.2116.3119.5123.4129.0133.8
121.6122.9124.2124.9
126.6128.3129.9130.8
131.9132.9134.7135.6
Gross national product bysectors
Private2
51.7
50.445.740.939.943.043.543.445.344.643.9
44.748.755.560.962.062.668.276.381.480.6
81.487.489.089.690.891.694.597.9
100.0101.4
102.8103.7104.7105.8107.0108.9111.6114.7
108.3108.8109.1109.5
110.2111.2112.0112.9
113.5114.0115.1116.1
Generalgovernment
34.1
34.134.533.733.534.834.736.536.537.436.8
36.034.737.339.743.348.355.458.560.864.7
67.170.574.476.679.584.088.793.3
100.0104.2
108.6113.6116.6121.5128.4133.5139.2144.5
131.4132.3134.0136.4
137.4138.1140.0141.0
142.3143.4144.5147.9
1 Separate deflators are not available for total gross private domestic investment, change in business inventories, andnet exports of goods and services.
2 Gross national product less compensation of general government employees. See also Tables B-7 and B-8.
Source: Department of Commerce, Office of Business Economics.
213
Digitized for FRASER http://fraser.stlouisfed.org/ Federal Reserve Bank of St. Louis

TABLE B-4.—Gross national product by major type of product, 1929-67
[Billions of dollars]
Year orquarter
Totalgross
na-tionalprod-
uct
103.1
90.475. f58. C55.665.172.282.590.484.790.5
99.7124.5157.9191.6210.1211.9208.5231.3257.6256.5
284.8328.4345.5364.6364.8398.0419.2441.1447.3483.7
503.7520.1560.3590.5632.4583.9743.3785.1
Finalsales
101.4
90.777. C60.557.265.871.281.287.985.690.1
97.5120.1156.2192.2211.1213.0202.1231.8252.9259.6
278.0318.1342.4364.1366.4392.0414.5439.8448.8478.9
500.2518.1554.3584.6626.6674.5729.9780.0
Inven-tory
change
1
_- 1- 2- 1—
7
41567
1.11.2
—
24.1.
—1
- 1 .
3
94
258600
6.4— b4.7
- 3 .
6.10.3.
- 1 .6.4.1.
- 1 .4.
1
8314507358
3.62.06.05. 95.89.4
13.5.
41
Goods output
Total
Totalgoods
Finalsales
IIc to
Durable goods
Total Finalsales
Nondurable goods
Total Finalsales 5.S
Serv-ices
Struc-tures
Grossautoprod-uct
1929
1930193119321933 _.193419351936193719381939
1940194119421943194419451946194719481949 . .
1950195119521953195419551956195719581959
I960..1961196219631964196519661967 v
1965: L - . . II I . . .I l l—IV. . .
1966: I . . . .I I . . .Ill —IV.. .
1967: l _ . . .I I . . .III —IV P . .
56.1
46.937.426.727.034.439.945.851.545.349.0
56.072.593.6
120.4132.3128.9124.9139.7154.2147.5
162.4189.7195.6204.1197.1216.4225.4234.6230.8249.1
259.6262.3284.5298.6319.4346.6379.6396.2
54.3
47.338.629.228.635.138.844.548.946.248.6
53.868.091.9
121.0133.3129.9118.5140.1149.4150.5
155.6179.4192.5203.7198.6210.4220.7233.3232.3244.4
256.0260.2278.5292.7313.6337.2366.2391.1
1.7
- . 4-1 .1-2 .5-1 .6- . 71.11.32.5
- . 9.4
2.24.51.8
- . 6-1 .0-1 .0
6.4- . 54.7
-3 .1
6.810.33.1.4
-1 .56.04.71.3
-1 .54.8
3.62.06.05.95.89.4
13.45.1
17.5
11.47.73.64.97.49.3
12.213.99.9
12.7
16.626.835.554.257.948.936.946.048.747.8
60.473.774.679.472.185.790.394.483.695.6
99.596.5
109.0116.1127.0139.5154.6158.8
16.1
12.59.05.75.47.38.9
11.213.110.812.4
15.423.834.554.258.550.231.644.348.049.9
56.366.873.578.574.682.787.593.186.493.2
97.496.6
106.2113.3122.8132.8144.7155.9
1.4
-1.0-1.2-2.0- . 5
.1
.3
.9
.8- . 9
.3
1.23.01.0
*- . 6-1.3
5.31.7.7
-2.1
4.16.91.1.9
-2.53.02.81.3
-2.82.3
2.1- . 12.82.84.26.79.92.8
38.5
35.529.723.122.127.030.633.637.635.436.3
39.345.658.166.274.480.088.093.7
105.599.7
102.0116.0121.0124.8125.0130.7135.1140.2147.2153.6
160.1165.8175.5182.5192.4207.1225.0237.5
38.2
34.829.623.623.227.829.933.335.835.436.2
38.444.257.466.874.879.786.995.9
101.5100.6
99.3112.6119.1125.2124.1127.7133.2140.2145.9151.1
158.6163.7172.2179.4190.7204.4221.5235.2
0.3
.7
.1- . 4
- 1 .- . 9
!31.8
1.01.4.7
- . 6o
.*21.1
-2.24.0
-1.0
2.73.42.0
- . 51.02.91.9
1.32.4
1.52.13.23.11.62.73.52.3
35.6
34.231.727.525.727.128.331.032.333.234.0
35.440.350.362.571.876.568.070.275.7
87.0101.2110.8118.8123.5132.6142.3154.2163.4176.2
187.3199.5213.3226.2244.2262.9287.2311.0
11.4
9.26.73.82.93.54.05.66.76.27.5
8.311.814.08.76.16.5
15.621.427.728.3
35.437.539.141.744.249.051.552.353.158.3
56.8!
58.362.665.768.874.4,76.577.8
662.7675.4690.0708.4
725.9736.7748.8762.1
766.3775.1791.2807.6
652.0666.5680.6698.5
716.0722.6737.4743.6
759.2774.6787.4798.7
10.68.89.49.9
9.914.011.418.5
7.1.5
3.89.0
336.5341.7349.6359.8
369.5375.7381.8391.7
388.1392.1398.7406.1
Seasonally adjusted annual rates
325.9332.8340.2349.9
359.6361.7370.3373.2
380.9391.6394.9397.1
10.68.89.49.9
9.914.011.418.5
7.1.5
3.89.0
138.2137.0140.9142.9
150.5151.4155.7161.1
153.9155.5161.4164.4
129.6130.0133.9137.9
143.2141.6145.8148.3
150.5156.0157.9159.3
8.77.07.15.0
7.49.79.9
12.8
3.4- . 63.55.1
198.3204.7208.7216.9
219.0224.4226.1230.6
234.2236.6237.3241.8
196.3202.9206.3212.0
216.4220.1224.5224.9
230.5235.5237.0237.8
2.01.82.34.9
2.54.31.55.7
3.71.1.3
4.0
254.6260.1266.0271.0
276.6283.5291.6296.9
303.1307.8313.5319.7
71.673.674.477.6
79.977.475.573.5
75.275.279.081.9
7.28.8
11.9
15.413.512.016.314.621.216.919.514.519.1
21.417.922.525.125.831.429.827.7
32.830.830.631.3
32.329.128.229.6
25.027.827.930.0
Source: Department of Commerce, Office of Business Economics.
214
Digitized for FRASER http://fraser.stlouisfed.org/ Federal Reserve Bank of St. Louis

TABLE B-5.—Gross national product by major type of product, in 1958 prices, 1929-67
[Billions of dollars, 1958 prices]
Year orquarter
Totalgrossna-
tionalprod-
uct
1929
1930193119321933193419351936193719381939
1940194119421943194419451946.194719481949
19501951195219531954. . . . . .19551956195719581959
196019611962196319641965.. . .1966.. . .1967 v
1965: I . . . .I I . . .III . . .IV.. .
1966: I . . . .I I . . .I I I . .IV.. .
1967: II I . . .III. . .IV p .
203.6
183.5169.3144.2141.5154.3169.5193.0203.2192.9209.4
227.2263.7297.8337.1361.3355.2312.6309.9323.7324.1
355.3383.4395.1412.8407.0438.0446.1452.5447.3475.9
487.7497.2529.8551.0581.1616.7652.6669.2
Finalsales
200.1
184.1171.7150.5145.9157.0167.1189.9197.8195.3208.2
222.3254.1293.8337.3363.2358.2302.6310.1319.1328.1
347.0372.5391.8411.8409.0431.6441.2451.2448.8471.1
484.2495.2523.8545.2575.2607.8639.9664.5
Inven-tory
change
3.5
- . 6-2 .4-6 .2-4 .3-2 .7
2.43.15.5
- 2 . 41.2
4.99.64.0
- . 2-1 .9-2 .910.0- . 24.6
- 3 . 9
8.310.93.3.9
-2 .06.44.81.2
-1 .54.8
3.52.06.05.85.88.8
12.64.7
Goods output
Total
Totalgoods
103.9
90.583.268.768.877.988.6
102.2110.2100.5110.7
124.0143.4158.1187.4204.8198.0172.1172.2178.4174.2
192.6208.4214.0225.4215.1236.1239.0239.8230.8247.7
256.0257.3277.3289.7308.6330.0353.7361.
Finalsales
100.4
91.185.774.973.280.586.299.1
104.8102.9109.5
119.0133.8154.1187.6206.7201.0162.1172.4173.8178.1
184.3197.5210.7224.5217.1229.7234.2238.5232.3242.9
252.6255.3271.3283.9302.8321.2341.0356.7
I I
3.5
- . 6-2 .4-6 .2-4 .3-2 .7
2.43.15.5
-2 .41.2
4.99.64.0
- . 2-1 .9-2 .910.0- . 24.6
-3 .9
8.310.93.3.9
-2 .06.44.81.2
-1 .54.8
3.52.06.05.85.88.8
12.64.7
Durable goods
Total
33.6
22.416.38.3
11.716.921.528.731.021.127.6
35.650.057.285.695.984.354.760.161.358.0
73.484.184.691.081.996.596.596.283.694.0
97.894.9
107.0114.2124.6136.3150.0150.
Finalsales
30.9
24.519.213.413.416.720.626.329.123.427.0
32.843.554.485.297.487.446.158.660.061.0
68.376.183.289.984.893.093.595.086.491.6
95.994.9
104.1111.4120.4129.8140.6148.0
I f
2.7
-2.1-3.0-5.1-1.7
.2
.92.41.9
-2.3.6
2.76.62.9.4
-1.5-3.18.61.51.2
-3 .0
5.28.01.51.2
-3.03.43.01.2
-2.82.4
2.0
2.82.84.16.59.32.5
Nondurable goods
Total
70.4
68.067.060.457.61.067.173.579.279.483.0
88.493.4
100.9101.7108.113.7117.4112.2117.1116.2
119.1124.3129.4134.4133.2139.7142.5143.6147.2153.7
158.2162.3170.3175.6184.1193.7203.7211.0
Finalsales
69.5
66.566.561.559.863.865.672.875.779.582.5
86.290.399.7
102.4109.3113.6116.0113.8113.8117.1
116.0121.4127.6134.6132.3136.7140.7143.6145.9151.2
156.7160.3167.2172.5182.3191.4200.4208.8
2-S
0.8
1.5.5
-1.1-2.7-2.8
1.5.7
3.6- . 1
.6
2.23.11.2
- . 6- .4
L4-1.7
3.3- . 9
3.12.91.8
- . 2.9
3.0
1.32.5
1.52.03.13.11.72.33.32.2
Serv-ices
69.3
67.765.861.963.065.368.173.373.974.876.9
80.089.8
107.7131.8144.0144.3113.3106.5109.3112.4
117.5130.5136.3140.3141.8147.5153.0160.1163.4171.2
176.6184.0193.7200.9210.8222.3235.2245.6
Struc-tures
30.3
25.320.213.79.8
11.112.817.519.117.721.8
23.230.531.917.912.412.927.231.236.137.5
45.244.444.747.050.254.354.052.653.157.0
55.055.858.860.461.664.463.762.1
Grossautoprod-uct
Seasonally adjusted annual rates
601.5609.7620.7634.4
645.4649.3654.8661.1
660.7664.7672.0679.4
592.2601.7612.0625.2
636.0635.9644.2643.9
654.0664.3668.5671.0
9.38.08.79.2
9.513.410.617.2
6.7.4
3.58.4
321.7324.9332.2341.2
347.9351.0354.7361.1
356.6359.5362.9366.9
312.4316.8323.5332.0
338.5337.6344.1343.9
349.9359.1359.4358.6
9.38.08.79.2
9.513.410.617.2
6.7.4
3.58.4
134.4133.1137.7139.9
147.5147.3150.8154.2
146.6148.3153.0154.1
126.3126.5131.1135.2
140.5138.0141.6142.3
143.6148.9149.8149.6
8.16.66.64.7
7.09.39.2
11.9
3.0- . 63.24.6
187.4191.7194.5201.3
200.4203.7203.9206.9
210.0211.2209.8212.8
186.1190.3192.4196.8
198.0199.7202.5201.6
206.3210.2209.5209.0
1.31.42.14.5
2.44.11.45.3
3.61.0.3
3.8
216.9220.8224.5226.9
229.7233.5237.9239.8
242.7244.4246.9248.4
62.964.064.066.3
67.864.762.260.2
61.360.862.364.1
10.311.414.8
19.115.913.518.717.124.618.620.214.518.5
21.017.522.024.725.531.430.327.8
32.430.731.031.5
33.029.728.829.9
25.328.227.929.7
Source: Department of Commerce, Office of Business Economics.
215
Digitized for FRASER http://fraser.stlouisfed.org/ Federal Reserve Bank of St. Louis

TABLE B—6.—Gross national product: Receipts and expenditures by major economic groups.1929-67
{Billions of dollars]
Year orquarter
1929..
1930..1931..1932..1933..1934..1935..1936..1937..1938..1939..
1940..194L.1942..1943..1944..1945..1946..1947..1948..1949..
1950195119521953195419551956195719581959
I960. . . .1961196219631964196519661967 v
1965: I . . . .II.__III...IV..
1966: I . . .I I . . .Ill .IV..
1967: I . . . .I I . . .III .IV v.
Persons
Disposable personalincome
Total i
83.3
74.564.048.745.552.458.566.371.265.570.3
75.792.7
116.9133.5146.3150.2160.0169.8189.1188.6
206.9226.6238.3252.6257.4275.3293.2308.5318.8337.3
350.0364.4385.3404.6438.1472.2508.8544.6
Less:Inter-
estpaidand
trans-fer
pay-mentsto for-eigners
1.9
1.2.9.7.7.6.7.8.9.8.9
1.01.1.8
1.01.41.82.22.4
2.93.13.54.34.65.15.96.46.57.1
7.88.18.69.7
10.711.913.114.2
Equals:Total
exclud-ing in-terestand
trans-fers
81.4
73.363.148.044.951.757.865.570.364.669.4
74.791.6
116.1132.7145.5149.3158.6168.0186.9186.2
204.1223.5234.8248.3252.9270.2287.2302.2312.3330.3
342.3356.3376.6394.9427.4460.3495.7530.4
Per-sonalcon-
sump-tionex-
pendi-tures
77.2
69.960.548.645.851.355.761.966.563.966.8
70.880.688.599.3
108.3119.7143.4160.7173.6176.8
191.0206.3216.7230.0236.5254.4266.7281.4290.1311.2
325.2335.2355.1375.0401.2433.1465.9491.6
Per-sonalsaving
ordis-
saving
4.2
3.42.6
- . 6- . 9
.42.13.63.8
2.6
3.811.027.633.437.329.615.27.3
13.49.4
13.117.318.118.316.415.820.620.722.319.1
17.021.221.619.926.227.229.838.7
Government
Net receipts
Taxandnon-taxre-
ceiptsor ac-cruals
11.3
10.89.58.99.3
10.511.412.915.415.015.4
17.725.032.649.251.253.250.956.858.956.0
68.784.889.894.389.7
100.4109.0115.6114.7128.9
139.8144.6157.0168.8174.1188.8213.0227.3
Less:Trans-fers,inter-
est,andsub-
sidies 2
1.8
1.93.12.62.73.13.44.13.23.84.2
4.44.04.44.76.5
10.418.517.318.821.3
22.919.919.019.521.923.425.528.733.034.0
36.541.342.844.446.749.755.563.7
Equals:Netre-
ceipts
9.5
8.96.36.36.77.48.08.8
12.211.211.2
13.321.028.244.444.742.832.439.540.134.7
45.864.970.874.867.876.983.586.881.695.0
103.3103.3114.2124.3127.3139.1157.5163.6
Expenditures
Totalex-
pendi-tures
10.3
11.112.410.610.712.913.416.115.016.817.6
18.428.864.093.3
103.092.745.542.450.359.1
60.879.093.7
101.296.797.6
104.1114.9127.2131.0
136.1149.0159.9166.9175.4186.1209.8240.0
Less:Trans-fers,inter-est,and
sub-sidies 2
1.8
1.93.12.62.73.13.44.13.23.84.2
4.44.04.44.76.5
10.418.517.318.821.3
22.919.919.019.521.923.425.528.733.034.0
36.541.342.844.446.749.755.563.7
Equals:
chasesof
goodsand
serv-ices
8.5
9.29.28.18.09.8
10.012.011.913.013.3
14.024.859.688.696.582.327.025.131.637.8
37.959.174.781.674.874.278.686.194.297.0
99.6107.6117.1122.5128.7136.4154.3176.3
Seasonally adjusted annual rates
456.0464.0479.4489.4
497.5503.3512.4522.0
532.7540.0548.2557. 5
11.411.912.212.4
12.613.013.113.5
13.814.314.314.5
444.6452.1467.2477.0
484.9490.3499.3508.5
518.9525.7533.9543.0
420.2428.1436.4447.8
458.2461.6470.1473.8
480.2489.7495.3501.4
24.524.030.929.3
26.628.729.234.6
38.836.038.541.6
185.4188.3188.3193.2
204.3210.6216.3220.9
222.8223.2229.3
48.748.051.950.4
53.453.156.159.4
63.263.164.464.7
136.7140.3136.4142.8
150.9157.5160.2161.5
159.6160.1164.9
179.8182.0190.0192.6
199.8204.4213.7221.2
233.6238.1242.6246.2
48.748.051.950.4
53.453.156.159.4
63.263.164.464.7
131.3133.9138.1142.3
146.5151.2157.7161.7
170.4175.0178.2181.5
Sur-plusor
deficit(-),
na-tional
in-comeand
prod-uct ac-counts
1.0
- . 3- 2 . 9- 1 . 8- 1 . 4- 2 . 4- 2 . 0- 3 . 1
- L 8- 2 . 2
- . 7- 3 . 8
-31.4-44.1-51.8-39.5
5.414.48.5
- 3 . 2
7.85.8
- 3 . 8- 6 . 9- 7 . 0
2.74.9.7
-12.5- 2 . 1
3.7-4.3-2.9
1.8- 1 . 4
2.73.2
-12.7
5.76.2
- 1 . 7.6
4.66.12.6
- . 3
-10.8-15 .0-13.3
See footnotes at end of table.
2 l 6
Digitized for FRASER http://fraser.stlouisfed.org/ Federal Reserve Bank of St. Louis
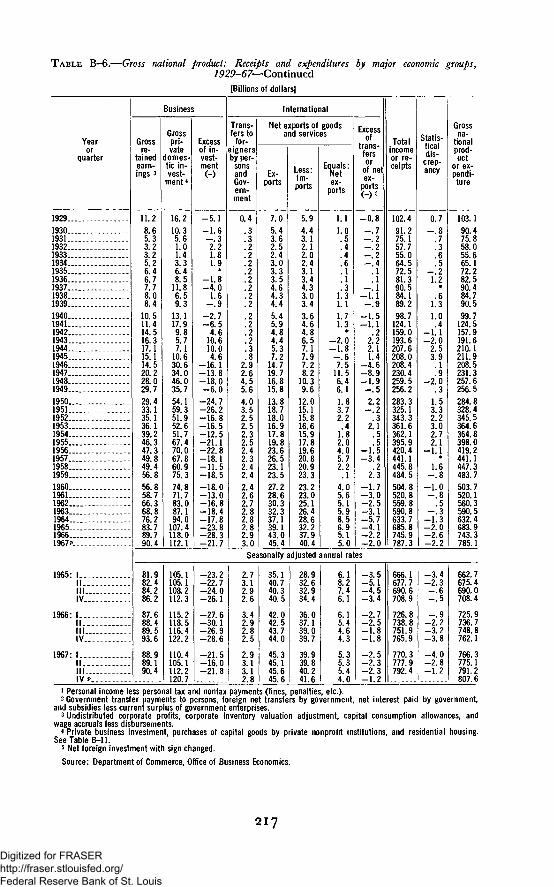
TABLE B-6.—Gross national product: Receipts and expenditures by major economic groups,1929-67— Continued
[Billions of dollars]
Yearor
quarter
192919301931... .19321933193419351936193719381939 -. . . .194019411942194319441945194619471948.19491950. . . .1951195219531954 . . . . . .1955 . . .1956195719581959. . . .1960 . .1961196219631964...19651966..1967*.
1965: 1IIIllIV -
1966: 1IIIIIIV
1967: 1 . .IIIIIIVP
Grossre-
tainedearn-ings 3
11.28.65.33.23.25.26.46.77.78.08.4
10.511.414.516.317.115.114.520.228.029.729.433.135.136.139.246.347.349.849.456.856.858.766.368.876.283.789.790.4
Business
Grosspri-vate
domes-tic in-vest-
ment *
16.210.35.61.01.43.36.48.5
11.86.59.3
13.117.99.85.77.1
10.630.634.046.035.754.159.351.952.651.767.470.067.860.975.374.871.783.087.194.0
107.4118.0112.1
Excessof in-vest-ment
- 5 . 1- 1 . 6- . 32.21.81.9
- 1 . 8- 4 . 0
1.6- . 9
- 2 . 7- 6 . 5
4.610.610.04.6
-16 .1-13 .8-18 .0- 6 . 0
-24 .7-26 .2-1 6 .8-16 .5- 1 2 . 5-21 .1-2 2 .8-18 .1- 1 1 . 5-18 .5- 1 8 . 0-13 .0-16 .8-18 .4-17 .8-23 .8-28 .3-21 .7
International
Trans-fers to
for-eignersby per-
sonsandGov-ern-ment
0.4.3.3.2.2.2.2.22
.2
.2
.2
.2
.2
.2
.3
.82.92.64.55.64.03.52.52 52.32.52.42.32.42.42.42.62.72.82.82.82.93.0
Net exports of goodsand services
Ex-ports
7.05.43.62.52.43.03.33.54 64.34.45.45.94.84.45.37.2
14.719.716.815.813.818.718.016.917.819.823.626.523.123.527.228.630.332.337.139.143.045.4
Less:Im-ports
5.94.43.12.12.02.43.13.44 33.03.43.64.64.86.57.17.97.28.2
10.39.6
12.015.115.816.615.917.819.620.820.923.323.223.025.126.428.632.237.940.4
Equals:Netex-
ports
1.11.0
.'4
.6
.1
.13
1.31.11.71.3
*- 2 . 0- 1 . 8- . 67.5
11 56.46.11.83.72.2
41.82.04.05.72.2
.14.05.65.15.98.56.95.15.0
Excessof
trans-fersor
of netex-
ports
- 0 . 8- . 7- . 2- . 2- . 2- . 4
.1
.1_ l
- 1 . 1- . 9
- 1 . 5- 1 . 1
.22.22.11.4
- 4 . 6- 8 . 9- 1 . 9- . 52.2
- . 2.3
2.1.5.5
- 1 . 5- 3 . 4
.22.3
- 1 . 7- 3 . 0- 2 . 5- 3 . 1- 5 . 7- 4 . 1- 2 . 2- 2 . 0
Totalincomeor re-ceipts
102.491.275.157.755.064.572.581.390 584.189.298.7
124.1159.0193.6207.6208.0208.4230.4259.5256.2283.3325.1343.3361.6362.1395.9420.4441.1445.8484.5504.8520.8559.8590.8633.7685.8745.9787.3
Statis-ticaldis-
crep-ancy
0.7- . 8
.7
.3
.6
.5- . 21.2
.61.31.0.4
- 1 . 1- 2 . 0
2.53.9
.19
- 2 . 0.3
1.53.32.23 02.72.1
- 1 . 1*
1.6- . 8- 1 . 0- . 8
.5- . 3
- 1 . 3- 2 . 0- 2 . 6- 2 . 2
Grossna-
tionalprod-uct
or ex-pendi-ture
103.190.475.858.055.665.172.282.590.484.790.599.7
124.5157.9191.6210.1211.9208.5231.3257.6256.5284.8328.4345.5364.6364.8398.0419.2441.1447.3483.7503.7520.1560.3590.5632.4683.9743.3785.1
Seasonally adjusted annual rates
81.982.484.286.2
87.688.489.593.6
88.989.190.4
105.1105.1108.2112.3
115.2118.5116.4122.2
110.4105.1112.2120.7
-23 .2-22.7-24 .0-26 .1
-27 .6-30 .1-26 .9-28 .6
- 2 1 . 5- 1 6 . 0-2 1 .8
2.73.12.92.6
3.42.92.82.5
2.93.13.12.8
35.140.740.340.5
42.042.543.744.0
45.345.145.645.6
28.932.632.934.4
36.037.139.039.7
39.939.840.241.6
6.18.27.46.1
6.15.44.64.3
5.35.35.44.0
—3.5- 5 . 1- 4 . 5- 3 . 4
- 2 . 7- 2 . 5- 1 . 8- 1 . 8
- 2 . 5- 2 . 3- 2 . 3- 1 . 2
666.1677.7690.6708.9
726.8738.8751.9765.9
770.3777.9792.4
- 3 . 4- 2 . 3- . 6- . 5
- . 9- 2 . 2- 3 . 2- 3 . 8
- 4 . 0- 2 . 8- 1 . 2
662.7675.4690.0708.4
725.9736.7748.8762.1
766.3775.1791.2807.6
1 Personal income less personal tax and nontax payments (fines, penalties, etc.).2 Government transfer payments to persons, foreign net transfers by government, net interest paid by government,
and subsidies less current surplus of government enterprises.3 Undistributed corporate profits, corporate inventory valuation adjustment, capital consumption allowances, and
wage accruals less disbursements.4 Private business investment, purchases of capital goods by private nonprofit institutions, and residential housing.
See Table B - l l .5 Net foreign investment with sign changed.Source: Department of Commerce, Office of Business Economics.
217
Digitized for FRASER http://fraser.stlouisfed.org/ Federal Reserve Bank of St. Louis

TABLE B-7.—Gross national product by sector, 1929-67
[Billions of dollars]
Year orquarter
1929
193019311932193319341935.._1936193719381939
194019411 9 4 2 . . . .194319441 9 4 5 . . . .19461947 . . .19481949
1950195119521953195419551956195719581959
19601961196219631964196519661967*
1965: L . . .IIIII..IV
1966: I.
IllIV
1967: I.
IIIIV v.....
Totalgross
nationalproduct
103.1
90.475.858.055.665.172.282.590.484.790.5
99.7124.5157.9191.6210.1211.9208.5231.3257.6256.5
284.8328.4345.5364.6364.8398.0419.2441.1447.3483.7
503.7520.1560.3590.5632.4683.9743.3785.1
Gross private product1
Total
98.8
85.871.253.650.959.566.375.283.577.082.9
91.9115.1142.8166.0177.9176.8187.7214.6240.1237.0
263.9301.0314.3332.7332.4363.8382.6402.0405.2439.4
456.3469.2505.7532.4569.4616.1666.7699.7
Business
Total Nonfarm2 Farm
95.1
82.468.351.348.957.464.172.981.074.580.3
89.1112.2139.5162.4173.8172.3182.7208.6233.5230.1
256.3292.8305.8323.6322.7352.9370.8389.3391.7425.0
440.7452.3487.4513.0548.2593.4642.4673.8
85.4
74.862.046.844.352.757.166.572.767.974.0
82.6103.3126.5147.2158.5156.4163.9188.5210.2211.4
236.3269.9283.7303.3303.1334.1352.2370.9370.9405.3
420.2431.4466.2491.5527.6569.8617.6649.8
9.7
7.76.34.54.64.77.06.48.36.66.3
6.58.9
13.015.315.315.918.820.223.318.8
20.022.922.220.319.618.818.618.420.819.6
20.520.921.221.520.623.624.824.0
House-holds
2.9
2.72.31.91.71.81.92.02.32.22.3
2.42.52.93.23.74.14.55.15.65.9
6.46.97.27.88.19.19.8
10.511.412.2
13.214.015.016.017.318.520.121.5
Rest ofthe world
Seasonally adjusted annual rates
0.8
.7
. 5
.4
.3
.3
.4
.3
.3
.4
.3
.4
.4
.4
.4
.4
.4
.6
.81.01.0
1.21.31.31.31.61.82.12.22.02.2
2.42.93.33.44.04.24.24.5
Grossgovern-
mentproduct 3
662.7675.4690.0708.4
725.9736.7748.8762.1
766.3775.1791.2807.6
597.3608.8621.6637.5
653.0661.5670.6681.9
683.9690.9705.2719.0
575.3586.1598.7614.6
629.4637.6646.2656.9
658.7665.3679.0692.2
553.1562.2574.6590.3
603.3612.8621.6633.0
635.1641.9654.6667.4
22.223.924.124.2
26.024.824.623.9
23.623.324.424.8
17.618.318.919.2
19.719.720.320.6
21.121.421.222.2
4.34.54.13.8
3.94.24.14.4
4.14.24.94.6
4.3
4.54.74.44.75.65.97.36.97.67.6
7.89.4
15.125.632.235.220.816.717.419.4
?0.927.431.231.932.534.236.639.142.144.3
47.550.954.758.163.067.876.685.4
65.466.568.470.9
72.975.178.280.2
82.584.286.088.7
* Gross national product less compensation of general government employees.2 Includes compensation of employees in government enterprises. Government enterprises are those agencies of
government whose operating costs are at least to a substantial extent covered by the sale of goods and services, in contrastto the general activities of government which are financed mainly by tax revenues and debt creation. Government enter-prises, in other words, conduct operations essentially commercial in character, even though they perform them undergovernmental auspices. The Post Office and public power systems are typical examples of government enterprises. On theother hand, State universities and public parks, where the fees and admissions cover only a nominal part of operating costsare part of general government activities.
3 Compensation of general government employees.Source: Department of Commerce, Office of Business Economics.
218
Digitized for FRASER http://fraser.stlouisfed.org/ Federal Reserve Bank of St. Louis

TABLE B-8.—Gross national product by sector, in 1958 prices, 1929-67
[Billions of dollars, 1958 prices]
Year orquarter
1929
1930. .193119321933 .1934.. .193519361937 .19381939
194019411942194319441945194619471948.1949
1950195119521953 . . . .19541955 .1956195719581959
1960 .196119621963196419651966 .1967 »
1965: L. . .IIIIIIV
1966:1 .IIIIIIV
1967:1IIIIIIV *>.-.-
Totalgross
nationalproduct
203.6
183.5169.3144.2141.5154.3169.5193.0203.2192.9209.4
227.2263.7297.8337.1361.3355.2312.6309.9323.7324.1
355.3383.4395.1412.8407.0438.0446.1452.5447.3475.9
487.7497.2529.8551.0581.1616.7652.6669.2
Gross private productl
Total
190.9
170.1155.8131.0127.5138.3152.4173.1184.3172.6188.7
205.6236.6257.3272.8286.9282.5275.1281.4295.0294.1
324.2344.6353.2371.1366.2397.2404.8410.5405.2433.4
444.0452.3482.9503.2532.0565.9597.5610.2
Business
Total
182.1
161.4147.7123.8120.6131.1144.9165.4176.4164.6180.7
197.1228.1248.7264.9278.9274.6267.0272.8286.0284.7
314.2334.5343.2360.7355.4385.4392.2397.5391.7419.4
429.5436.9466.7486.6514.4547.8578.9590.6
Nonfarm 2
165.1
145.4129.2105.8103.0116.6128.4150.5158.5146.8162.5
179.6209.3228.0245.3259.5256.5248.6255.8267.0266.2
294.9316.2324.2340.7335.0364.4371.4377.2370.9398.3
407.6414.8444.6463.8492.1524.2556.4566.5
Farm
17.0
16.118.518.017.514.616.514.917.917.818.2
17.518.820.619.619.418.118.517.019.018.4
19.418.419.020.020.420.920.820.320.821.1
21.922.222.122.822.323.622.424.1
House-holds
7.4
7.16.66.05.76.26.46.87.16.87.1
7.67.57.87.27.17.17.17.57.98.2
8.78.88.89.19.2
10.110.610.911.411.7
12.212.412.913.213.714.014.715.3
Rest ofthe world
1.4
1.61.41.31.21.01.11.0.8
1.1.9
1.0.9.8.8.9.8.9
1.11.21.2
1.3
1.21.31,61.82.02.12.02.2
2.32.93.43.43.94.14.04.3
Grossgovern-
mentproduct^
12.7
13.313.513.214.016.017.119.918.920 420.6
21.627.240.564.374.472.837.528.628.730.1
31.138.841.841.740.940.741.341.942.142.5
43.744.846.947.849.150.855.059.1
Seasonally adjusted annual rates
601.5609.7620.7634.4
645.4649.3654.8661.1
660.7664.7672.0679.4
551.7559.4569.7582.5
592.3594.8599.0604.2
602.7606.0612.5619.4
534.1541.2551.4564.3
574.0576.3580.2585.1
583.6586.6592.7599.4
510.7517.1527.7541.0
550.8554.4558.0562.7
559.9563.0568.4574.6
23.424.023.723.3
23.222.022.222.4
23.723.624.224.8
13.413.814.214.4
14.614.414.814.9
15.115.315.015.5
4.34.44.03.7
3.84.14.04.3
4.04.04.84.4
49.850.351.151.9
53.154.455.856.9
57.958.759.660.0
1 Gross national product less compensation of general government employees.2 Includes compensation of employees in government enterprises. Government enterprises are those agencies of govern-
ment whose operating costs are at least to a substantial extent covered by the sale of goods and services, in contrast to thegeneral activities of government which are financed mainly by tax revenues and debt creation. Government enterprises, inother words, conduct operations essentially commercial in character, even though they perform them under governmentalauspices. The Post Office and public power systems are typical examples of government enterprises. On the other hand,State universities and public parks, where the fees and admissions cover only a nominal part of operating costs, are partof general government activities.
3 Compensation of general government employees.Source: Department of Commerce, Office of Business Economics.
219
Digitized for FRASER http://fraser.stlouisfed.org/ Federal Reserve Bank of St. Louis

TABLE B-9.—Gross national product by industry, in 1958prices, 1947-66
[Billions of dollars, 1958 prices]
Year
194719481949
195019511952 .19531954
195519561957 . .19581959
19601961196219631964
19651966
Totalgross
na-tional
product
309.9323.7324.1
355.3383.4395.1412.8407.0
438.0446.1452.5447.3475.9
487.7497.2529.8551.0581.1
616.7652.6
Agri-culture,fores-
try,andfish-eries
17.920.019.4
20.419.520.221.221.6
22.122.021.522.022.3
23.123.423.324.023.6
24.923.7
Con-tractcon-
struc-tion
12.914.114.7
16.218.218.318.919.3
20.821.821.120.722.0
21.721.421.721.923.3
23.724.1
Manufacturing
Total
91.896.390.9
105.5116.2118.7128.6119.5
133.6134.1134.6123.7138.9
140.9140.4154.6162.4173.7
190.1206.4
Dur-able
goodsindus-tries
52.355.050.5
60.869.071.579.171.2
80.779.479.669.679.9
81.079.790.095.6
102.4
114.4125.4
Non-durablegoodsindus-tries
39.441.340.4
44.747.247.349.548.3
52.954.654.954.059.0
59.960.764.766.871.3
75.780.9
Trans-porta-tion,com-muni-cation,
andutili-ties
29.630.428.7
30 834.334.635.736.4
38.640.541.340.643.3
44.946.048.951.954.7
59.163.3
Whnlasaleandretailtrade
52.754.255.2
60.461.462.964.965.5
71.673.875.175.180.8
82.383.588.992.898.9
104.7111.0
Finance,insur-ance,andreal
estate
35.636.537.8
41.042.944.746.849.8
52.754.857.059.261.4
64.167.171.274.478.3
82.685.9
Serv-ices
30.631.932.1
33.134.034.535.335.4
38.240.241.842.945.1
46.748.350.852.254.7
57.259.6
Gov-ern-mentand
govern-mententer-prises
32.433.234.7
35.943.947.247.146.1
46.046.246.947.347.9
49.250.652.653.956.1
58.062.2
Allother i
6.77.1
10.6
12.113.014.014.313.5
14.412.713.116.014.1
14.716.317.917.417.8
16.416.2
* Mining, rest of world, and residual (the difference between gross national product measured as sum of final productsand gross national product measured as sum of gross product by industries).
Source: Department of Commerce, Office of Business Economics.
220
Digitized for FRASER http://fraser.stlouisfed.org/ Federal Reserve Bank of St. Louis

TABLE B-10.—Personal consumption expenditures, 1929-67
[Billions of dollars]
Yearor
quarter
1929
193019311932193319341935. . . .1936193719381939
194019411 9 4 2 . - .1943194419451946194719481949
1950195119521953195419551956195719581959
19601961196219631964 . . . .1 9 6 5 . . . .1 9 6 6 . . . .1967 P..
1965:1.II.IllIV
1966: I..IIIIIIV
1967: L.II.II
IVP
tio
np
erso
nal
co
nsu
mp
exp
end
itu
res
ota
l
77.2
69.960.548.645.851.355.761.966.563.966.8
70.880.688.599.308.319.743.460.773.676.8
91.006.316.730.036.554.466.781.4
290.1311.2
325.2335.2355.1375.0401.2433.1465.9491.6
420.2428.1436.4447.8
458.2461.6470.1473.8
480.2489.7495.3501.4
ota
l
H-
9.2
7.25.53.63.54.25.16.36.95.76.7
7.89.66.96.66.78.0
15.820.422.724.6
30.529.629.333.232.839.638.940.837.944.3
45.344.249.553.959.266.070.372.1
65.264.266.168.6
71.668.270.970.6
69.472.572.773.7
Durable goods
no
bile
s an
d p
arts
uto
n
<
3.2
2.21.6.9
1.11.41.92.32.41.62.2
2.73.4.7.8. 8
1.04.06.27.59.9
13.111.611.114.213.618.416.418.315.419.5
20.118.422.024.325.829.929.829.3
30.429.229.830.3
31.428.529.829.6
27.329.729.930.2
ture
an
d h
ou
se-
d e
qu
ipm
en
t£ °u.
4.8
3.93.12.11.92.22.63.23.63.13.5
3.94.94.73.93.84.68.6
10.911.911.6
14.114.414.314.915.016.617.517.317.118.9
18.919.320.522.225.027.029.932.0
25.826.127.328.9
29.429.130.630.6
31.431.932.132.6
the
ro
1.2
1.1.9.6.5.6.7.8
1.0.9
1.0
1.11.41.61.92.22.53.23.33.43.2
3.33.63.94.14.24.65.05.25.45.9
6.36.56.97.58.59.1
10.610.8
9.08.89.19.4
10.810.610.510.4
10.710.910.810.9
ota
l
t -
37.7
34.029.022.722.326.729.332.935.234.035.1
37.042.950.858.664.371.982.490.596.294.5
98.1108.8114.0116.8118.3123.3129.3135.6140.2146.6
151.3155.9162.6168.6178.7191.2207.5217.5
Nondurable goods
excl
ud
ing
alc
o-
ic b
ever
ages
io
od
,h
oi
u_
19.5
18.014.711.410.912.213.615.316.515.615.7
16.619.223.327.429.933.239.043.746.344.8
46.052.154.755.556.558.160.463.966.668.4
70.172.174.476.580.586.093.096.4
ing
an
d s
ho
es
2
fo
9.4
8.06.95.14.65.76.06.66.86.87.1
7.48.8
11.013.414.416.518.218.820.119.3
19.621.221.922.122.123.124.124.324.726.4
27.327.929.630.633.536.140.342.8
ine
and
oil
aso
li
CJ
1.8
1.71.51.51.51.61.71.92.12.12.2
2.32.62.11.31.61.83.03.64.45.0
5.46.16.87.78.29.09.8
10.611.011.6
12.312.412.913.514.015.116.217.5
ther
o
7.0
6.35.74.85.37.27.99.19.89.5
10.1
10.712.214.416.518.420.522.124.425.425.4
27.129.330.531.631.533.134.936.737.940.2
41.643.545.748.050.654.058.060.8
Seasonally adjusted annual rates
184.6189.8192.4198.0
203.2207.1209.5210.3
214.2217.2218.5220.2
82.985.386.489.4
91.593.393.693.5
95.296.096.697.7
34.635.636.237.8
39.539.841.040.8
41.543.243.742.9
14.315.115.315.7
15.816.216.316.6
17.117.517.517.8
52.853.854.455.1
56.357.858.559.5
60.460.560.761.8
Services
ota
l
y-
30.3
28.726.022.220.120.421.322.824.424.325.0
26.028.130.834.237.239.845.349.854.757.6
62.467.973.479.985.491.498.5
105.0112.0120.3
128.7135.1143.0152.4163.3175.9188.1202.1
170.4174.2177.8181.2
183,5186.3189.8192.9
196.6200.0204.1207.5
ooc
ou
si
a:
11.5
11.010.39.07.97.67.78.08.58.99.1
9.410.211.011.512.012.513.915.717.519.3
21.323.926.529.331.733.736.038.541.143.7
46.348.752.055.459.363.667.171.3
61.963.264.265.3
66.266.567.468.5
69.670.671.973.2
iho
ld o
per
atio
n
3>O:c
4.0
3.93.53.02.83.03.23.43.73.63.8
4.04.34.85.25.96.46.87.58.18.5
9.510.411.112.012.614.015.216.217.318.5
20.020.822.023.124.325.727.028.2
24.725.526.126.5
26.126.927.427.7
27.828.128.128.9
po
rtat
ion
ran
s
2.6
2.21.91.61.51.61.71.92.01.92.0
2.12.42.73.43.74.05.05.35.85.9
6.26.77.17.87.98.28.69.09.3
10.1
10.810.611.011.411.612.613.614.7
12.012.512.813.1
13.213.513.714.0
14.414.614.815.1
ther
o
12.2
11.510.38.67.98.28.79.5
10.29.9
10.1
10.411.212.314.015.616.819.721.423.323.9
25.426.928.730.833.235.538.641.344.348.0
51.654.958.062.568.174.080.487.7
71.873.174.776.3
78.079.481.382.7
84.886.689.290.3
1 Quarterly data are estimates by Council of Economic Advisers.2 Includes standard clothing issued to military personnel.3 Includes imputed rental value of owner-occupied dwellings.Source: Department of Commerce, Office of Business Economics (except as noted).
284-593 0—68221
Digitized for FRASER http://fraser.stlouisfed.org/ Federal Reserve Bank of St. Louis
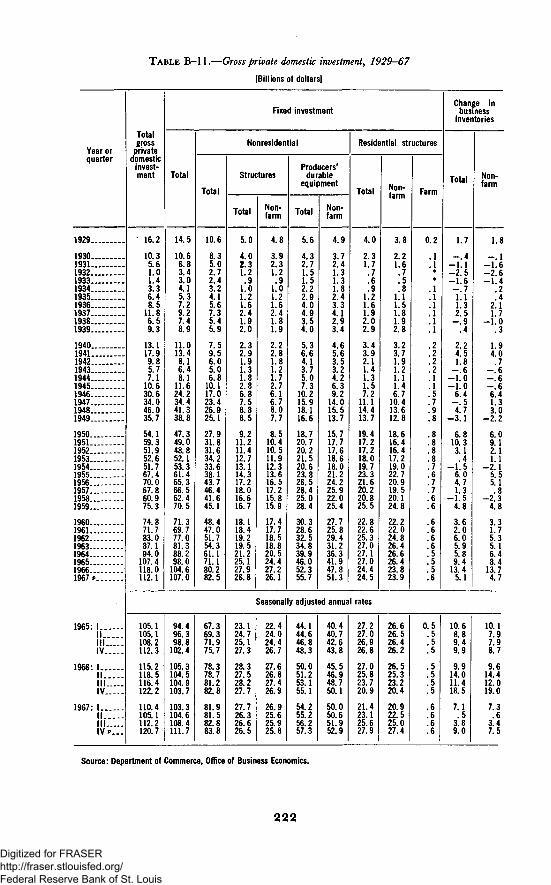
T A B L E B—11.—Gross private domestic investment, 1929—67
[Billions of dollars]
Year orquarter
Totalgross
privatedomestic
invest-ment
Fixed investment
Total
Nonresidential
Total
Structures
Total Non-farm
Producers'durable
equipment
Total Non-farm
Residential structures
Total Non-farm Farm
Change inbusiness
inventories
Total Non-farm
1929..
1930..1931..1932..1933..1934..1935..1936..1937..1938..1939..
1940..1941.1942..1943..1944..1945..1946..1947..1948..1949..
1950..1951..1952..1953..1954..1955..1956..1957..1958-1959..
I960..1961..1962..1963..1964..1965..1966..1967 v
1965: IIII I I . . . . .IV....
1966: IIII I I . . . . .IV....
1967:
" 16.2
10.35.61.01.43.36.48.5
11.86.59.3
13.117.99.85.77.1
10.630.634.046.035.7
54.159.351.952.651.767.470.067.860.975.3
74.871.783.087.194.0
107.4118.0112.1
14.5
10.66.83.43.04.15.37.29.27.48.9
11.013.48.16.48.1
11.624.234.441.338.8
47.349.048.852.153.361.465.366.562.470.5
71.369.777.081.388.298.0
104.6107.0
10.6
8.35.02.72.43.24.15.67.35.45.9
7.59.56.05.06.8
10.117.023.426.925.1
27.931.831.634.233.638.143.746.441.645.1
48.447.051.754.361.171.180.282.5
5.0
4.02.31.2.9
1.01.21.62.41.92.0
2.32.91.91.31.82.86.87.58.88.5
9.211.211.412.713.114.317.218.016.616.7
18.118.419.219.521.225.127.926.8
4.8
3.92.31.2.9
1.01.21.62.41.81.9
2.22.81.81.21.72.76.16.78.07.7
8.510.410.511.912.313.616.517.215.815.9
17.417.718.518.820.524.427.226.1
5.6
4.32.71.51.52.22.94.04.93.54.0
5.36.64.13.75.07.3
10.215.918.116.6
18.720.720.221.520.623.826.528.425.028.4
30.328.632.534.839.946.052.355.7
4.9
3.72.41.31.31.82.43.34.12.93.4
4.65.63.53.24.26.39.2
14.015.513.7
15.717.717.618.618.021.224.225.922.025.4
27.725.829.431.236.341.947.851.3
4.0
2.31.7.7.6.9
1.21.61.92.02.9
3.43.92.11.41.31.57.2
11.114.413.7
19.417.217.218.019.723.321.620.220.825.5
22.822.625.327.027.127.024.424.5
3.8
2.21.6.7
'.S1.11.51.81.92.8
3.23.71.91.21.11.46.7
10.413.612.8
18.616.416.417.219.022.720.919.520.124.8
22.222.024.826.426.626.423.823.9
0.2 1.7
- . 4-1 .1- 2 . 5-1 .6- . 71.11.32.5
- . 9.4
2.24.51.8
- . 6-1 .0- 1 . 0
6.4
~4i7- 3 . 1
6.810.33.1.4
- 1 . 56.04.71.3
-1 .54.8
3.62.06.05.95.89.4
13.45.1
Seasonally adjusted annual rates
IIIIIIV P...
105.1105.1108.2112.3
115.2118.5116.4122.2
110.4105.1112.2120.7
94.496.398.8
102.4
105.3104.5104.9103.7
103.3104.6108.4111.7
67.369.371.975.7
78.378.781.282.8
81.981.582.883.8
23.124.725.127.3
28.327.528.227.7
27.726.326.626.5
22.424.024.426.7
27.626.827.426.9
26.925.625.925.8
44.144.646.848.3
50.051.253.155.1
54.255.256.257.3
40.440.742.643.8
45.546.948.750.1
50.050.651.952.9
27.227.026.926.8
27.025.823.720.9
21.423.125.627.9
26.626.526.426.2
26.525.323.220.4
20.922.525.027.4
0.5.5.5.5
.5
.5
.5
.5
.6
.6
.6
.6
10.68.89.49.9
9.914.011.418.5
7.1.5
3.89.0
1.8
- . 1-1 .6-2 .6- 1 . 4
.2
.42.11.7
-1 .0
1.94.0.7
- . 6- . 6- . 66.41.33.0
- 2 . 2
6.09.12.11.1
-2 .15.55.1.8
-2 .34.8
3.31.75.35.16.48.4
13.74.7
10.17.97.98.7
9.614.412.019.0
7.3.6
3.47.5
Source: Department of Commerce, Office of Business Economics.
222
Digitized for FRASER http://fraser.stlouisfed.org/ Federal Reserve Bank of St. Louis

TABLE B-12.—National income by type of income, 1929-67
[Billions of dollars]
Year orquarter
1929
1930193119321933193419351936193719381939
1940194119421943194419451946194719481949
1950195119521953195419551956195719581959
19601961196219631964196519661 9 6 7 p . . . .
1965:1 — -I I . . .ML.IV...
1966: ! . . .
I IL.IV..
1 9 6 7 : 1 . . . .I I . . .I I L .IV p .
Totalna-
tionalin-
come i
75.459.742.840.349.557.265.073.667.472.6
81.1104.2137.1170.3182.6181.5181.9199.0224.2217.5
241.1278.0291.4304.7303.1331.0350.8366.1367.8400.0
414.5427.3457.7481.9518.1562.4616.7649.6
Compensation ofemployees
Total
51.1
46.839.831.129.534.337.342.947.945.048.1
52.164.885.3
109.5121.2123.1117.9128.9141.1141.0
154.6180.7195.3209.1208.0224.5243.1256.0257.8279.1
294.2302.6323.6341.0365.7393.9435.7469.6
Wagesandsala-ries
50.4
46.239.130.529.033.736.741.946.143.045.9
49.862.182.1
105.8116.7117.5112.0123.0135.4134.5
146.8171.1185.1198.3196.5211,3227.8238.7239.9258.2
270.8278.1296.1311.1333.7359.1394.6423.7
Sup-ple-
mentsto
wagesandsala-ries 2
0.7
.7
.6
.6
.5:6.6
1.01.82.02.2
2.32.73.23.84.55.65.95.95.86.5
7.89.6
10.210.911.513.215.217.317.920.9
23.424.627.529.932.034.941.145.9
Business and pro-fessional income
Total
9.0
7.65.83.63.34.75.56.77.26.97.4
8.611.114.017.018.219.221.620.322.722.6
24.026.127.127.527.630.331.332.833.235.1
34.235.637.137.940.241.943.243.6
In-come
ofunin-corpo-ratedenter-prises
8.8
6.85.13.33.94.85.56.87.26.77.6
8.611.714.417.118.319.323.321.823.122.2
25.126.526.927.627.630.531.833.133.235.3
34.335.637.137.940.342.343.643.9
Inven-toryvalu-ation
adjust-ment
0.1
.8
.6
.3- . 5- . 1
*- . 1
*.2
- . 2*
- . 6- . 4
2- ! i- . i
- 1 . 7- 1 . 5- . 4
.5
- 1 . 1- . 3
.2- . 2
*- . 2- . 5- . 3
j-A
****
- . 1- . 4- . 4- . 3
In-come
offarmpro-prie-tors 3
6.2
4.33.42.12.63.05.34.36.04.44.4
4.56.49.8
11.711.612.214.915.217.512.7
13.515.815.013.012.411.411.411.313.411.4
12.012.813.013.112.114.816.114.8
Rentalin-
comertfOf
per-sons
5.4
4.83.82.72.01.71.71.82.12.62.7
2.93.54.55.15.45.66.67.18.08.4
9.410.311.512.713.613.914.314.815.415.6
15.816.016.717.118.019.019.420.1
Corporate profitsand inventory
Total
10.5
7.02.0
- 1 . 3- 1 . 2
1.73.45.66.84.96.3
9.815.220.324.423.819.219.325.633.030.8
37.742.739.939.638.046.946.145.641.151.7
49.950.355.758.966.374.982.279.1
valuationidjustment
Corpo-
profits
beforetavoc 4taxes *
10.0
3.7- . 4
- 2 . 31.02.33.66.36.84.07.0
10.017.721.525.124.119.724.631.535.228.9
42.643.938.940.638.348.648.847.241.452.1
49.750.355.459.466.876.683.880.1
Inven-toryvalu-ation
adjust-ment
0.5
3.32.41.0
- 2 . 1- . 6- . 2- . 7
*1.0
- . 7
- . 2- 2 . 5- 1 . 2- . 8- . 3- . 6
- 5 . 3- 5 . 9- 2 . 2
1.9
- 5 . 0- 1 . 2
1.0- 1 . 0- . 3
- 1 . 7- 2 . 7- 1 . 5- . 3- . 5
.2- . 1
.35
- ! 5- 1 . 7- 1 . 6- 1 . 0
Seasonally adjusted annual rates
544.9555.3566.5582.8
600.3610.4622.1634.1
636.4641.6653.4
381.5388.6397.2408.4
420.8430.7441.2450.2
459.1463.4472.6483.2
347.7354.2362.0372.4
381.3390.2399.6407.4
414.7418.3426.2435.6
33.834.535.236.0
39.540.541.642.7
44.445.246.447.6
41.441.742.042.5
42.843.343.343.4
43.243.443.844.1
13.615.015.215.3
17.116.015.915.1
14.614.315.015.2
18.618.919.119.2
19.219.319.419.6
19.820.020.220.4
72.673.474.978.7
81.181.381.984.6
78.178.379.2
74.075.675.880.8
83.783.684.083.9
79.078.980.0
- 1 . 4- 2 . 1- . 9
- 2 . 2
- 2 . 6- 2 . 3- 2 . 2
.7
- . 7
Netinter-
est
4.7
4.95.04.64.14.14.13.83.73.63.5
3.33.23.12.72.32.21.51.91.81.9
2.02.32.62.83.64.14.65.66.87.1
8.410.011.613.815.817.920.222.4
17.117.618.218.8
19.319.820.421.1
21.622.122.723.3
1 National income is the total net income earned in production. It differs from gross national product mainly in that itexcludes depreciation charges and other allowances for business and institutional consumption of durable capital goods,and indirect business taxes. See Table B-13.
2 Employer contributions for social insurance and to private pension, health, and welfare funds; compensation forinjuries; directors' fees; pay of the military reserve; and a few other minor items.
3 Includes change in inventories.< See Table B-69 for corporate tax liability and profits after taxes.Source: Department of Commerce, Office of Business Economics.
223
Digitized for FRASER http://fraser.stlouisfed.org/ Federal Reserve Bank of St. Louis

T A B L E B—13.—Relation of gross national product and national income, 1929—67
[Billions of dollars]
Year or quarter
1929
1930193119321933193419351936 - . .193719381939
1940194119421943194419451946194719481949
1950 . .1951195219531954 T19551956195719581959
19601961196219631964196519661967*
1965: 1IIIllIV.
1966: 1IIIIIIV
1967: 1II. - .IIIIV *
Grossna-
tionalprod-uct
103.1
90.475.858.055.665.172.282.590.484.790.5
99.7124.5157 9191.6210.1211.9208 5231.3257.6256.5
284.8328.4345.5364.6364.8398.0419 2441.1447.3483.7
503 7520.1560 3590.5632.4683.9743 3785.1
Less:Capital
con-sump-tion
allow-ances
7.9
8.07.97.47.06.86.97.07.27.37.3
7.58.29 8
10.211.011.39.9
12.214.516.6
18.321.223.225.728.231.534.137.138.941.4
43 445.250 052.656.159.963.567.0
Equals:Net
tionalprod-
uct
95.2
82.468.050.748.658.265.475.483.377.483.2
92.2116.3148.1181.3199.1200.7198.6219.1243.1239.9
266.4307.2322.3338.9336.6366.5385.2404.0408.4442.3
460.3474.9510 4537.9576.3624.0679.8718.1
Plus:Sub-sidiesless
currentsurplusof gov-
ern-mententer-prises
- 0 . 1
- . 1
**
.3
.4*
.1.2
.5
.4
.1
.2
.7
.8
.9- . 2- . 1- . 1
.2
.2- . 1- . 4- . 2- . 1
.8
.9
.9
.21.41.4.8
i.31.22.21.8
Less:
Indirect business taxes
Total
7.0
7.26.96.87.17.88.28.79.29.29.4
10.011.311.812.714.115.517.118.420.121.3
23.325.227.629.629.432.134.937.338.541.5
45.247.751.554.758.462.265.169.7
Federal
1.2
1.0.9.9
1.62.22.22.32.42.22.3
2.63.64.04.96.27.17.87.88.08.0
8.99.4
10.310.99.7
10.711.211.811.512.5
13.513.614.615.316.116.515.916.6
Stateandlocal
5.8
6.16.05.85.45.66.06.46.86.97.0
7.47.77.77.88.08.49.3
10.612.113.3
14.515.817.318.719.721.423.625.527.028.9
31.734.136.939.442.345.749.253.1
Busi-ness
transferpay-
ments
0.6
.5
.6
*7.6.6.6.6.4.5
.4
.5
.5
.5
.5
.5
.5
.6
.7
.8
.8
.910
?.1
1.24587
1.92.02.12.32.52.62.72.8
Sta-tistical
dis-crep-ancy
0.7
— 8.7.36
.5- . 21.2
*.6
1.3
1.0
- 1 1- 2 . 0
2.53.9
1.9
- 2 . 0.3
1.53.32.23.02.72.1
- 1 . 1*
1.6
—1.0- . 8
.5- . 3
— 1.3- 2 . 0—2.6- 2 . 2
Equals:Na-
tionalincome
86.8
75 459.742.840 349 557.265.073 667.472.6
81 1104.2137 1170.3182.6181.5181 9199.0224.2217.5
241 1278.0291.4304.7303.1331.0350 8366.1367.8400.0
414 5427.3457 7481.9518.1562.4616.7649.6
Seasonally adjusted annual rates
662.7675.4690.0708.4
725.9736.7748.8762.1
766.3775.1791.2807.6
58.359.360.561.6
62.463.163.964.7
65.566.467.668.6
604.4616.1629.5646.8
663.6673.6684.9697.4
700.8708.7723.6739.0
1.31.31.11.2
1.42.02.72.6
2.32.01.61.5
61.861.862.263.1
62.964.765.967.0
67.969.170.271.4
17.516.515.716.3
15.215.916.216.3
16.216.516.717.0
44.345.246.446.7
47.748.749.850.6
51.752.653.554.4
2.62.62.62.6
2.62.72.72.8
2.82.82.82.8
- 3 . 4- 2 . 3- . 6- . 5
- . 9- 2 . 2- 3 . 2- 3 . 8
- 4 . 0- 2 . 8- 1 . 2
544.9555.3566.5582.8
600.3610.4622.1634.1
636.4641.6653.4
Source: Department of Commerce, Office of Business Economics.
224
Digitized for FRASER http://fraser.stlouisfed.org/ Federal Reserve Bank of St. Louis

T A B L E B—14.—Relation of national income and personal income, 1929—67
[Billions of dollars]
Year or quarter
1929.
1930.19311932.1933.1934.1935.19361937.1938.1939.
1940.1941.1942.19431944.1945.19461947.1948.1949
1950.1951.1952.1953.1954.1955.1956.1957-1958.1959
I960.1961.1962.1963.1964.1965.19661967
1965: I...II-III.IV..
1966: I...II..
IV.
1967: LII._IIIV
Nationalincome
86.8
75.459.742.840.349.557.265.073.667.472.6
81.1104.2137.1170.3182.6181.5181.9199.0224.2217.5
241.1278.0291.4304.7303.1331.0350.8366.1367.8400.0
414.5427.3457.7481.9518.1562.4616.7649.6
Less:
Corpo-rate
profitsand in-ventory
valuationadjust-ment
544.9555.3566.5582.8
600.3610.4622.1634.1
636.4641.6653.4
10.5
7.02.0
-1 .3-1 .2
1.73.45.66.84.96.3
9.815.220.324.423.819.219.325.633.030.8
37.742.739.939.638.046.946.145.641.151.7
49.950.355.758.966.374.982.279.1
Contri-butions
forsocialinsur-ance
0.2
.3
.3
.3
.3
.3
'.S1.82.02.1
2.32.83.54.55.26.16.05.75.25.7
6.98.28.78.89.8
11.112.614.514.817.6
20.721.424.026.927.929.738.243.0
Wageaccruals
lessdis-
burse-ments
0.2
Plus:
Gov-ernmenttransfer
paymentsto per-
sons
0.9
1.02.11.41.51.61.82.91.92.42.5
2.72.62.62.53.15.6
10.811.110.511.6
14.311.512.012.814.916.117.119.924.124.9
26.630.431.233.034.237.241.249.1
Interestpaid
Govern-ment(net)
and byconsumers
2.5
1.81.81.71.61.71.71.71.91.91.9
2.12.22.22.63.34.25.25.56.16.5
7.27.68.19.09.5
10.111.212.012.113.6
15.115.016.117.619.120.422.324.1
Divi-dends
5.8
5.54.12.52.02.62.84.54.73.23.8
4.04.44.34.44.64.65.66.37.07.2
8.88.68.68.99.3
10.511.311.711.612.6
13.413.815.216.517.819.821.522.8
Busi-ness
transferpay-
ments
Seasonally adjusted annual rates
0.6
.5
.6
.7
.7
.6
.6
.6
.6
.4
.5
.4
.5
.5
.5
.5
.5
.5
.6
.7
. 8
.91.01.21.11.21.41.51.61.7
1.92.02.12.32.52.62.72.8
Equals:
Personalincome
72.673.474.978.7
81.181.381.984.6
78.178.379.2
29.129.429.830.4
36.637.438.939.8
42.242.543.344.1
36.035.339.437.9
39.739.241.344.7
48.148.649.650.1
19.920.320.620.9
21.422.022.423.2
23.723.924.224.7
18.719.420.220.9
21.421.621.621.2
22.223.123.422.4
2.62.62.62.6
2.62.72.72.8
2.82.82.82.8
85.9
77.065.950.247.054.060.468.674.168.372.8
78.396.0
122.9151.3165.3171.1178.7191.3210.2207.2
227.6255.6272.5288.2290.1310.9333.0351.1361.2383.5
401.0416.8442.6465.5497.5537.8584.0626.3
520.3530.1544.6556.1
567.8577.3589.3601.6
612.9619.1631.0642.1
Source: Department of Commerce, Office of Business Economics.
225
Digitized for FRASER http://fraser.stlouisfed.org/ Federal Reserve Bank of St. Louis

TABLE B-15.—Disposition of personal income, 1929-67
Year orquarter
Per-sonal
income
Less:Per-
sonaltaxand
nontaxpay-
ments
Equals:Dispos-
ableper-
sonalincome
Less: Personal outlays
Total
Per-sonalcon-
sump-tion
expend-itures
Interestpaid by
con-sumers
Per-sonal
transferpay-
mentsto for-eigners
Equals:Per-
sonalsaving
Percent of disposablepersonal income
Personaloutlays
Total
Con-sump-
tionexpend-
itures
Per-sonalsaving
1 9 2 9 . . . .
1930.. . . .1931 . . . . .1932. . . .1 9 3 3 . . . .1934. . . .1935. . . .1936193719381939. . . .
1940.. . . .1941 . . . .1942. . . .1943194419451946. . . .1947. . . .1948. . . .1949. . . .
1950. . . .1 9 5 1 . . . .1952. . . .1953 . . . .1954. . . .1955. . . .1956. . . .1957. . . .1958. . . .1959. . . .
I960 . . . .1961196219631964.. . .1965. . . .19661967P
1965: I . . . .I I . . .III —IV..
1966: I . . . .I I . . .Ill —IV. . .
1967: I . . .I I . . .I I I . .
Billions of dollars Percent
85.9
77.065.950.247.054.060.468.674.168.372.8
78.396.0
122.9151.3165.3171.1178.7191.3210.2207.2
227.6255.6272.5288.2290.1310.9333.0351.1361.2383.5
401.0416.8442.6465.5497.5537.8584.0626.3
2.6
2.51.91.51.51.61.92.32.92.92.4
2.63.36.0
17.818.920.918.721.421.118.6
20.729.034.135.632.735.539.842.642.346.2
50.952.457.460.959.465.675.281.7
83.3
74.564.048.745.552.458.566.371.265.570.3
75.792.7
116.9133.5146.3150.2160.0169.8189.1188.6
206.9226.6238.3252.6257.4275.3293.2308.5318.8337.3
350.0364.4385.3 '404.6438.1472.2508.8544.6
79.1
71.161.449.346.552.056.462.767.464.867.7
71.881.789.3
100.1109.1120.7144.8162.5175.8179.2
193.9209.3220.2234.3241.0259.5272.6287.8296.6318.3
333.0343.3363.7384.7411.9445.0479.0505.8
77.2
69.960.548.645.851.355.761.966.563.966.8
70.880.688.599.3
108.3119.7143.4160.7173.6176.8
191.0206.3216.7230.0236.5254.4266.7281.4290.1311.2
325.2335.2355.1375.0401.2433.1465.9491.6
1.5
.9
.7
.5
.5
.5
.5
.6
.7
.7
.7
.8
.9
.7
.5
.5
.5
.81.11.51.9
2.42.73.03.84.04.75.45.85.96.5
7.37.68.19.1
10.111.312.413.4
0.3
.3
.3
.2
.2
.2
.2
.2
.2
.2
.2
.2
.2
.1
.2
.4
.5
.7
.7
.7
.5
.5
.4
.4
.5
.5
.5
.6
.6
.6
.6
.5
.5
.5
.6
.6
.7
.6
.8
520.3530.1544.6556.1
567.8577.3589.3601.6
612.9619.1631.0642.1
Seasonally adjusted annual rates
64.366.165.266.7
70.474.176.979.6
80.279.182.884.6
456.0464.0479.4489.4
497.5503.3512.4522.0
532.7540.0548.2557.5
431.6439.9448.5460.1
470.9474.6483.2487.4
493.9504.0509.6515.9
420.2428.1436.4447.8
458.2461.6470.1473.8
480.2489.7495.3501.4
10.811.211.511.7
12.012.312.512.9
13.113.313.513.8
0.6.7.7.7
.6
.7
.6
.6
.71.0.8.7
4.2
3.42.6
- . 6- . 9
.42.13.63.8.7
2.6
3.811.027.633.437.329.615.27.3
13.49.4
13.117.318.118.316.415.820.620.722.319.1
17.021.221.619.926.227.229.838.7
24.524.030.929.3
26.628.729.234.6
38.836.038.541.6
95.0
95.495.9
101.3102.099.396.394.694.798.996.3
94.988.276.475.074.580.390.595.792.995.0
93.792.492.492.893.694.393.093.393.094.4
95.194.294.495.194.094.294.192.9
94.694.893.694.0
94.794.394.393.4
92.793.393.092.5
92.7
93.894.499.8
100.698.095.293.393.497.695.0
93.686.975.774.474.079.789.694.691.893.8
92.391.090.991.191.992.491.091.291.092.3
92.992.092.292.791.691.791.690.3
92.192.391.091.5
92.191.791.790.8
90.190.790.489.9
5.0
4.64.1
- 1 . 3- 2 . 0
3.'75.45.31.13.7
5.111.823.625.025.519.79.54.37.15.0
6.37.67.67.26.45.77.06.77.05.6
4.95.85.64.96.05.85.97.1
5.45.26.46.0
5.35.75.76.6
7.36.77.07.5
Source: Department of Commerce, Office of Business Economics.
226
Digitized for FRASER http://fraser.stlouisfed.org/ Federal Reserve Bank of St. Louis

TABLE B—16.—Total and per capita disposable personal income and personal consumptionexpenditures, in current and 1958 prices, 1929-67
Year or quarter
1929..
1930-1931..1932..1933..1934-1935..1936..1937..1938..1939..
1940-1941..1942..1943-1944..1945..1946..1947..1948..1949..
1950..1951..1952..1953..1954..1955-1956..1957-1958..1959-
1 9 6 0 . .1 9 6 1 . .1 9 6 2 . .1 9 6 3 . .1 9 6 4 . .1 9 6 5 . .1 9 6 6 . .1967 p.
1965: I . .II.IIIIV
1966: I . .II.IIIIV
1967: l .II.IIIIV
Disposable personal income
Total (billionsof dollars)
Currentprices
83.3
74.564.048.745.552.458.566.371.265.570.3
75.792.7
116.9133.5146.3150.2160.0169.8189.1188.6
206.9226.6238.3252.6257.4275.3293.2308.5318.8337.3
350.0364.4385.3404.6438.1472.2508.8544.6
1958prices
150.6
139.0133.7115.1112.2120.4131.8148.4153.1143.6155.9
166.3190.3213.4222.8231.6229.7227.0218.0229.8230.8
249.6255.7263.3275.4278.3296.7309.3,315.8318.8333.0
340.2350.7367.3381.3407.9434.4456.3476.0
Per capita(dollars)
Currentprices
683
605516390362414459518552504537
573695867976
1,0571,0741,1321,1781,2901,264
1,3641,4691,5181,5831,5851,6661,7431,8011,8311,905
1,9371,9832,0642,1362,2802,4272,5842,735
1958prices
1,236
1,1281,077
921893952
1,0351,1581,1871,1051,190
1,2591,4271,5821,6291,6731,6421,6061,5131,5671,547
1,6461,6571,6781,7261,7141,7951,8391,8441,8311,881
1,8831,9091,9682,0132,1232,2322,3172,391
Personal consumption expenditures
Total (billionsof dollars)
Currentprices
77.2
69.960.548.645.851.355.761.966.563.966.8
70.880.688.599.3
108.3119.7143.4160.7173.6176.8
191.0206.3216.7230.0236.5254.4266.7281.4290.1311.2
325.2335.2355.1375.0401.2433.1465.9491.6
1958prices
139.6
130.4126.1114.8112.8118.1125.5138.4143.1140.2148.2
155.7165.4161.4165.8171.4183.0203.5206.3210.8216.5
230.5232.8239.4250.8255.7274.2281.4288.2290.1307.3
316.1322.5338.4353.3373.7398.4418.0429.9
Per capita(dollars)
Currentprices
Seasonally adjusted annual rates
634
567487389364406437483516492510
536604656726782855
1,0141,1151,1841,185
1,2591,3371,3811,4411,4561,5391,5851,6431,6661,758
1,8001,8241,9021,9802,0882,2262,3662,469
1958prices
456.0464.0479.4489.4
497.5503.3512.4522.0
532.7540.0548.2557.5
422.2427.2440.2448.2
451.8452.6458.4463.2
470.6474.9477.5481.8
2,3542,3882,4592,502
2,5372,5602,5982,639
2,6862,7162,7492,787
2,1792,1992,2582,291
2,3042,3022,3242,341
2,3732,3882,3942,409
420.2428.1436.4447.8
458.2461.6470.1473.8
480.2489.7495.3501.4
389.1394.1400.7409.9
416.2415.2420.4420.4
424.2430.6431.5433.2
2,1692,2042,2392,289
2,3372,3482,3842,395
2,4212,4632,4842,507
1,145
1,0591,016
919897934985
1,0801,1101,0791,131
1,1781,2401,1971,2131,2381,3081,4391,4311,4381,451
1,5201,5091,5251,5721,5751,6591,6731,6831,6661,735
1,7491,7551,8131,8651,9452,0472,1232,159
2,0082,0292,0562,096
2,1222,1122,1322,125
2,1392,1652,1642,166
Popu-lation(thou-
sands) *
121,875
123,188124,149124,949125,690126,485127,362128,181128,961129,969131,028
132,122133,402134,860136,739138,397139,928141,389144,126146,631149,188
151,684154,287156,954159,565162,391165,275168,221171,274174,141177,073
180,684183,756186,656189,417192,120194,592196,920199,118
193,734194,269194,941195,594
196,096196,629197,216197,834
198,356198,852199,425200,006
i Population of the United States including Armed Forces overseas. Annual data are for July 1; quarterly data are formiddle of period, interpolated from monthly data.
Sources: Department of Commerce (Office of Business Economics and Bureau of the Census) and Council of EconomicAdvisers.
227
Digitized for FRASER http://fraser.stlouisfed.org/ Federal Reserve Bank of St. Louis
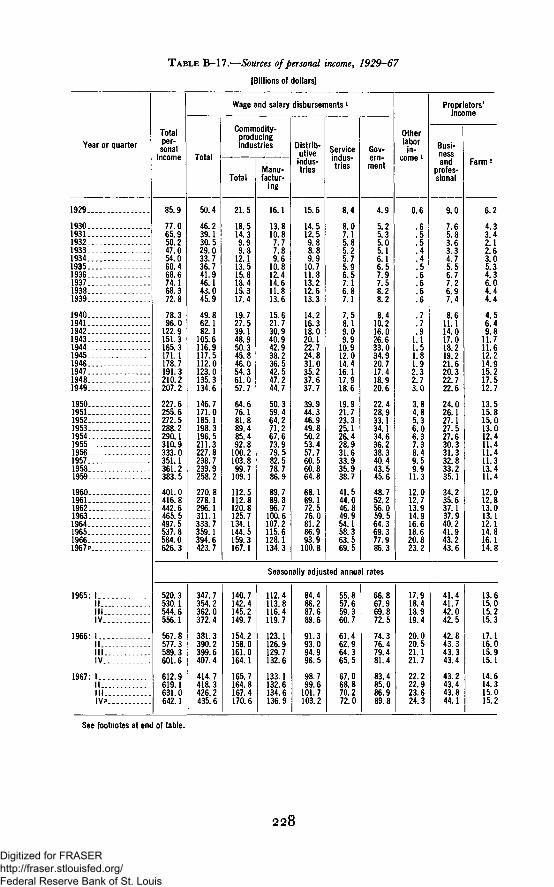
TABLE B-17.—Sources of personal income, 1929-67
[Billions of dollars]
Year or quarterTotalper-
sonalincome
Wage and salary disbursementsl
Total
Commodity-producingindustries
TotalManu-factur-
ing
Distrib-utive
indus-tries
Serviceindus-tries
Gov-ern-ment
Otherlabor
in-come1
Proprietors'income
Busi-nessand
profes-sional
Farm 2
1929..
1930. .1931. .1932..1933..1934..1935..1936..1937..1938..1939..
1940..1941. .1942..1943. .1944..1945..1946..1947..1948..1949..
1950.1951.1952.1953.1954.1955.1956.1957..1958.1959.
I960.1961.1962.1963.1964..1965..1966..
1965: I.
III.IV.
1966: I.
1967:
85.9
77.065.950.247.054.060.468.674.168.372.8
78.396.0
122.9151.3165.3171.1178.7191.3210.2207.2
227.6255.6272.5288.2290.1310.9333.0351.1361.2383.5
401.0416.8442.6465.5497.5537.8584.0626.3
50.4
46.239.130.529.033.736.741.946.143.045.9
49.862.182.1
105.6116.9117.5112.0123.0135.3134.6
146.7171.0185.1198.3196.5211.3227.8238.7239.9258.2
270.8278.1296.1311.1333.7359.1394.6423.7
21.5
18.514.39.99.8
12.113.515.818.415.317.4
19.727.539.148.950.345.846.054.361.057.7
64.676.181.889.485.492.8
100.2103.899.7
109.1
112.5112.8120.8125.7134.1144.5159.3167.1
16.1
13.810.87.77.89.6
10.812.414.611.813.6
15.621.730.940.942.938.236.542.547.244.7
50.359.464.271.267.673.979.582.578.786.9
89.789.896.7
100.6107.2115.6128.1134.3
15.6
14.512.59.88.89.9
10.711.813.212.613.3
14.216.318.020.122.724.831.035.237.637.7
39.944.346.949.850.253.457.760.560.864.8
68.169.172.576.081.286.993.9
100.8
8.4
8.07.15.85.25.75.96.57.16.87.1
7.58.19.09.9
10.912.014.416.117.918.6
19.921.723.325.126.428.931.633.935.938.7
41.544.046.849.954.158.363.569.5
4.9
5.25.35.05.16.16.57.97.58.28.2
8.410.216.026.633.034.920.717.418.920.6
22.428.933.134.134.636.238.340.443.545.6
48.752.256.059.564.369.377.986.3
0.6
.6
.5
.5
.4
.4
.5
.6
.6
.6
.6
.7
.7
.91.11.51.81.92.32.73.0
3.84.85.36.06.37.38.49.59.9
11.3
12.012.713.914.916.618.620.823.2
Seasonally adjusted annual rates
9.0
7.65.83.63.34.75.56.77.26.97.4
8.611.114.017.018.219.221.620.322.722.6
24.026.127.127.527.630.331.332.833.235.1
34.235.637.137.940.241.943.243.6
520.3530.1544.6556.1
567.8577.3589.3601.6
612.9619.1631.0642.1
347.7354.2362.0372.4
381.3390.2399.6407.4
414.7418.3426.2435.6
140.7142.4145.2149.7
154.2158.0161.0164.1
165.7164.8167.4170.6
112.4113.8116.4119.7
123.1126.9129.7132.6
133.1132.6134.6136.9
84.486.287.689.6
91.393.094.996.5
98.799.6
101.7103.2
55.857.659.360.7
61.462.964.365.5
67.068.870.272.0
66.867.969.872.5
74.376.479.481.4
83.485.086.989.8
17.918.418.919.4
20.020.521.121.7
22.222.923.624.3
41.441.742.042.5
42.843.343.343.4
43.243.443.844.1
6.2
4.33.42.12.63.05.34.36.04.44.4
4.56.49.8
11.711.612.214.915.217.512.7
13.515.815.013.012.411.411.411.313.411.4
12.012.813.013.112.114.816.114.8
13.615.015.215.3
17.116.015.915.1
14.614.315.015.2
See footnotes at end of table.
228
Digitized for FRASER http://fraser.stlouisfed.org/ Federal Reserve Bank of St. Louis

T A B L E B—17.—Sources of personal income, 1929—67—Continued
[Billions of dollars]
Year orquarter
Rentalncome
of per-sons
5.4
4.83.82.72.01.71.71.82.12.62.7
2.93.54.55.15.45.66.67.18.08; 4
9.410.311.512.713.613.914.314.815.415.6
15.816.016.717.118.019.019.420.1
Divi-dends
5.8
5.54.12.52.02.62.84.54.73.23.8
4.04.44.34.44.64.65.66.37.07.2
8.88.68.68.99.3
10.511.311.711.612.6
13.413.815.216.517.819.821.522.8
Personalinterestincome
7.2
6.86.76.35.75.85.75.55.65.55.5
5.45.55.35.35.66.36.87.57.98.5
9.29.9
10.611.813.114.215.717.618.920.7
23.425.027.731.434.938.442.446.5
Transfer payments
Total
1.5
1.52.72.22.12.22.43.52.42.83.0
3.13.13.13.03.66.2
11.311.711.212.4
15.112.513.014.016.017.318.521.425.726.6
28.532.433.335.336.739.743.951.9
Old-ageand sur-
vivorsinsur-ance
benefits
**
*0.1.1.2.2.3.4.5.6.7
1.01.92.23.03.64.95.77.38.5
10.2
11.112.614.315.216.018.120.825.7
Stateunem-ploy-
ment in-surancebenefits
*0.4.4
.5
.3
.3
.1
.1
.41.1.8.8
1.7
1.4.8
1.01.02.01.41.41.83.92.5
2.84.02.92.82.62.21.82.1
Vet-erans'
hpnpfitcUvllclllo
0.6
.61.6.8.5
!51.9.6.5.5
.5
.5
.5
.5
.92.86.76.75.85.1
4.93.93.93.73.94.34.34.44.64.6
4.64.84.85.05.35.65.76.6
Other
0.9
.91.11.41.61.81.91.61.81.92.0
2.02.22.22.22.42.73.13.74.14.9
7.95.96.06.36.56.87.27.98.79.4
10.010.911.212.212.913.815.617.5
Less:Personalcontri-butions
for socialinsur-ance
0.1
.1
.2
.2
.2
.2
.2
.2
.6
.6
.6
.7
.81.21.82.22.32.02.12.22.2
2.93.43.84.04.65.25.86.76.97.9
9.39.6
10.311.812.513.417.920.4
Non-agricul-
turalpersonalincome 3
1929
1 9 3 0 . . . .193119321933193419351936193719381939
1940194119421943194419451946194719481949
1950195119521953195419551956195719581959. . .
1960196119621 9 6 3 . . . . . . . . .1964196519661967 v
1965: I.IIIllIV
1 9 6 6 : IIIIllIV
1 9 6 7 : IIIIII
77.6
70.860.846.743.249.853.963.066.762.666.9
72.387.^
111.0137.3151.2156.4161.0173.0189.4191.3
210.9236.4254.1271.9274.7296.4318.5336.6344.3368.5
385.2400.0425.5448.1480.9518.4563.1606.4
Seasonally adjusted annual rates
18.618.919.119.2
19.219.319.419.6
19.820.020.220.4
18.719.420.220.9
21.421.621.621.2
22.223.123.422.4
37.037.938.839.7
40.741.942.844.3
45.246.046.948.0
38.637.842.040.5
42.441.944.047.5
50.851.452.452.9
16.716.620.418.6
19.419.621.023.2
24.725.626.226.4
2.42.22.22.0
2.01.61.81.8
2.12.12.21.9
5.55.65.75.7
5.95.45.46.3
6.56.56.66.7
14.113.413.714.1
15.115.315.816.2
17.617.017.417.9
13.113.313.513.8
17.117.318.418.7
20.020.220.520.8
502.3510.5524.8536.1
545.9556.5568.5581.4
593.1599.6610.9621.8
1 The total of wage and salary disbursements and other labor income differs from compensation of employees inTable B-12 in that it excludes employer contributions for social insurance and the excess of wage accruals overwage disbursements.
2 Includes change in inventories.3 Nonagricultural income is personal income exclusive of net income of unincorporated farm enterprises, farm wages,
agricultural net interest, and net dividends paid by agricultural corporations.Source: Department of Commerce, Office of Business Economics.
229
Digitized for FRASER http://fraser.stlouisfed.org/ Federal Reserve Bank of St. Louis
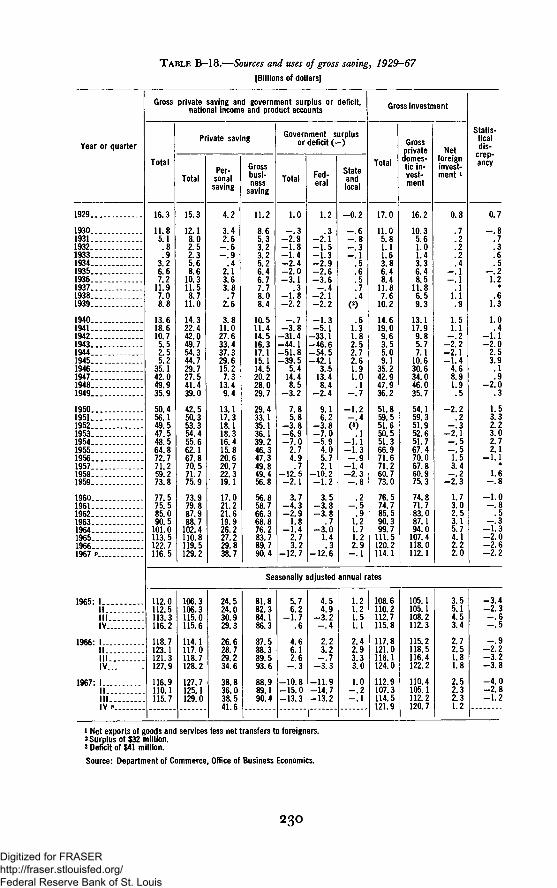
TABLE B-18.—Sources and uses of gross saving, 1929-67
[Billions of dollars]
Year or quarter
1929
1930193119321933193419351936193719381939
194019411942194319441945194619471948 .1949
1950195119521953195419551956195719581959
196019611962 .19631964 . . .196519661967 *
1965: 1IIIIIIV
1966: 1IIIIIIV
1967: 1IIIIIIV v
Gross
Total
16.3
11.85.1.8.9
3.26.67.2
11.97.08.8
13.618.610.75.52.55.2
35.142.049.935.9
50.456.149 547.548.564.872 771 259 273.8
77 575.585.090.5
101.0113.5122.7116.5
private saving and government surplus ornational income and product accounts
Private saving
Total
15.3
12.18.02.52.35.68.6
10.311.58.7
11.0
14.322.442.049.754.344.729.727.541.439.0
42.550.353 354.455.662.167.870 571.775.9
73.979.887.988.7
102.4110.8119.5129.2
Per-sonalsaving
4.2
3.42.6
- . 6- 9
.42.13.63.8
2! 6
3.811.027.633.437.329.615.27.3
13.49.4
13.117.318 118.316.415.820 620 722.319.1
17.021.221.619.926.227.229.838.7
Grossbusi-ness
saving
11.2
8 65.33.23 25.26.46.77.78.08.4
10.511.414 516 317.115.114.520.228.029.7
29.433.135 136 139.246.347 349 849 456.8
56 858.766.368.876.283.789.790.4
deficit,
Government surplusor deficit ( - )
Total
1.0
3- 2 . 9- 1 . 8- 1 . 4- 2 . 4- 2 . 0- 3 . 1
.3- 1 . 8- 2 . 2
- . 7- 3 . 8
-31.4-44.1-51 .8-39 .5
5.414.48.5
- 3 . 2
7.85.8
- 3 . 8- 6 . 9- 7 . 0
2.74.9
-12 .5- 2 . 1
3.7- 4 . 3- 2 . 9
1.8- 1 . 4
2.73.2
-12.7
Fed-eral
1.2
3- 2 . 1- 1 . 5- 1 3- 2 . 9- 2 . 6- 3 . 6
- . 4- 2 . 1- 2 . 2
- 1 . 3- 5 . 1
- 3 3 1-46 .6-54 .5-42.1
3.513.48.4
- 2 . 4
9.16.2
- 3 8- 7 . 0- 5 . 9
4.05.72.1
-10.2- 1 . 2
3.5- 3 . 8- 3 . 8
- 3 . 01.4.3
-12.6
Stateandlocal
- 0 . 2
- 6- . 8- . 3
.5
.6
.5
.7
.4(2)
.61.31 82.52.72.61.91.0.1
- . 7
—1.2- . 4(3)W l
- 1 . 1- 1 . 3- . 9
- 1 . 4- 2 . 3- . 8
.2- . 5
.91.21.71.22.9
- . 1
Gross investment
Total
17.0
11 05.81.11 63.86.48.4
11.87.6
10.2
14.619.09 63.55.09.1
35.242.947.936.2
51.859.551 650.551.366.971.671.260.773.0
76.574.785.590.399.7
111.5120.2114.1
Grossprivatedomes-tic in-vest-ment
16.2
10 35.61.01 43.36.48.5
11.86.59.3
13.117.99.85.77.1
10.630.634.046.035.7
54.159.351.952.651.767.470.067.860.975.3
74.871.783.087.194.0
107.4118.0112.1
Netforeigninvest-ment i
0.8
.7
.2
.2
.2
.4- . 1- . 1
.11.1.9
1.51.1
- . 2- 2 . 2- 2 . 1- 1 . 4
4.68.91.9.5
- 2 . 2.2
- . 3- 2 . 1- . 5- . 51.53.4
- . 2- 2 . 3
1.73.02.53.15.74.12.22.0
Statis-ticaldis-
ancy
0.7
- . 8.7.3.6
-.21.2
*.6
1.3
1.0.4
- 1 . 1- 2 . 0
2.53.9
.9- 2 . 0
.3
1.53.32.23.02.72.1
- 1 . 1*
1.6- . 8
- 1 . 0- . 8
.5- . 3
- 1 . 3- 2 . 0- 2 . 6- 2 . 2
Seasonally adjusted annual rates
112.0112.5113.3116.2
118.7123.1121.3127.9
116.9110.1115.7
106.3106.3115.0115.6
114.1117.0118.7128.2
127.7125.1129.0
24.524.030.929.3
26.628.729.234.6
38.836.038.541.6
81.882.384.186.3
87.588.389.593.6
88.989.190.4
5.76.2
- 1 . 7.6
4.66.12.6
- . 3
-10 .8-15 .0-13.3
4.54.9
- 3 . 2- . 4
2.23.2
- . 7- 3 . 3
-11 .9-14.7-13.2
1.21.21.51.1
2.42.93.33.0
1.0- . 2- . 1
108.6110.2112.7115.8
117.8121.0118.1124.0
112.9107.3114.5121.9
105.1105.1108.2112.3
115.2118.5116.4122.2
110.4105.1112.2120.7
3.55.14.53.4
2.72.51.81.8
2.52.32.31.2
- 3 . 4- 2 . 3- . 6- . 5
- . 9- 2 . 2- 3 . 2- 3 . 8
- 4 . 0- 2 . 8- 1 . 2
1 Net exports of goods and services less net transfers to foreigners.2 Surplus of $32 million.3 Deficit of $41 million.Source: Department of Commerce, Office of Business Economics.
230
Digitized for FRASER http://fraser.stlouisfed.org/ Federal Reserve Bank of St. Louis

TABLE B—19.—Financial saving by individuals, 1939—67l
[Billions of dollars]
Year or quarter
1939
1940194119421943194419451946194719481949
195019511952 .1953..195419551956195719581959
19601961195219631964196519661967P
1965:1IIIIIIV
1966:1-IIIIIIV
1967:1II .Ill
3.0
2.9o o27.135.938.435.013.25.0.51.6
-.38 110.49.08.55.212.215.019.714.0
6.318 922.123.030 029.829.847.8
5.76.010.17.9
5.47.28.78.5
11.510.016.010.?
Total
Cur-rencyandbankde-
posits
3.0
2.94.8
10.916.217.519.010.62.0
- 1 . 8- 1 . 4
3.55.97.04.75.43.44.84.8
10.24.1
2.49.5
17.718.419.423.312.528.9
1.95.08.08.4
- 1 . 64.73.45.9
5.58.4
10.64.5
Sav-ings
shares
0.1
.3
.4
.3
.6
.91.11.21.31.31.6
1.72.33.34.04.75.25.35.26.47.2
8.29.29.9
11.711.49.44.5
11.8
2.12.71.43.4
1.41.1
- . 52.6
2.54.02.03.3
Securities
Total
- 0 . 8
- . 42.6
10.314.115.79.9
-1 .42.23.02.3
.9
.73.43.4
.26.25.25.31.1
10.2
-1 .01.1
- . 4.5
6.13.9
14.5.7
.91.8.7.5
4.93.34.71.6
-1 .6-4 .6
3.53.4
U.S.sav-ings
bonds
OtherGov-
ment3
0.7
.92.88.0
11.111.86.91.02.01.61.5
.3- . 5
.1
.2
.6
.3- . 1
-1 .9
- . 2.8.4
1.2.9.6.6.9
.2
.1
.1
.2
.1
.2
'.2
. 2
.2
.3
.2
- 0 . 9
.42.33.34.64.2
-2 .6- . 2
.5
.1
- . 1- . 51.22.0
- 1 . 13.73.24.4
-1 .111.0
- . 9- . 6
.71.65.13.6
12.3- . 3
.71.4.9.7
4.32.23.91.9
- 1 . 1-4 .4
3.22.1
rateand
other
-0 .6
- . 4- . 5
*- . 3- . 7-1.2
.2
.4
.9
.7
.71.62.11.2.6
2.32.02.72.61.0
.11.0
-1.5-2.4
- ! 41.7.1
.3- . 3- . 4
.51.0.8
- . 6
1.2
Pri-vate
insur-anceandpen-sionre-
serves
1.5
1.61.92.22.62.93.23.13.53.33.5
3.73.84.44.54.75.05.04.64.84.9
4.85.25.76.26.77.66.87.6
1.91.71.92.2
1.91.51.51.9
2.01.51.92.1
Non-in-
suredpen-sion
funds
Gov-ern-mentinsur-anceandpen-sionre-
serves4
0.1
.1
.1
.1
.2
.6
.9
.3
.3
.4
.6
.91.51.72.02.22.32.73.13.23.6
4.04.14.24.54.95.66.27.0
1.41.31.31.7
1.31.51.32.2
1.61.51.82.0
0.3
.3
.3
.71.32.33.12.51.72.01.8
- . 61.71.91.71.71.82.32.62.93.0
3.23.23.74.04.54.85.05.5
1.01.31.31.3
1.11.21.31.4
1.11.41.41.5
Less: Increase indebt
Mort-gagedebts
Con-sumerdebts
0.5
.9
.8
.1- . 4- . 1
.23.13.94.73.9
6.57.06.17.28.3
12.010.6
8.18.2
12.5
10.910.912.514.515.515.912.79.7
3.93.44.14.5
4.43.02.62.7
1.81.62.53.7
0.8
1.0.7
-3 .0-1 .0
.1
.52.32.82.42.6
3.71.04.43.71.06.23.32.5
.26.1
4.21.55.06.97.59.06.53.3
- . 33.52.43.4
- . 42.61.62.8
-1 .91.91.12.2
Secu-rities
loans7
- 0 . 2
- . 2- . 1
.3
.61.41.5
- 2 . 3- . 8
.4
.3
.2- . 3
.6
.4
.9
.6- . 8- . 1
.4
.2
.31.01.1.9.1.1.5
- . 1.7
-2 .01.5
- . 4.5
-1 .11.5
- . 2-1 .2
1.6.6
1 Individuals' saving, in addition to personal holdings, covers saving of unincorporated business, trust funds, and non-profit institutions in the forms specified.
2 Includes shares in savings and loan associations and shares and deposits in credit unions.3 "Other government" includes U.S. Government issues (except savings bonds), State and local government securities,
and nonguaranteed Federal agency issues.* Includes civil service, railroad retirement, and State and local retirement systems.5 Mortgage debt to institutions on one- to four-family nonfarm dwellings.6 Consumer debt owed to corporations. Policy loans on Government and private life insurance have been deducted
from those items of saving.7 Change in bank loans to brokers, dealers, and others for the purpose of purchasing or carrying securities.Note.—In addition to the concept of saving shown above, there are other concepts of individuals' saving, with varying
degrees of coverage, currently in use. The personal saving estimates of the Department of Commerce are derived as thedifference between personal i ncome (after taxes) and personal outlays. For a reconciliation of the two series, see Securitiesand Exchange Commission "Statistical Bulletin," August 1967, and "Survey of Current Business," July 1967.
The flow-of-funds system of accounts of the Board of Governors of the Federal Reserve System includes estimates ofgross saving and net financial investment of households.
Source: Securities and Exchange Commission.
231
Digitized for FRASER http://fraser.stlouisfed.org/ Federal Reserve Bank of St. Louis

TABLE B-20.—Number and money income of families
Year
194719481949 .
19501951195219531954
19551956 --195719581959
I960 .1961196219631964 . . . .
19651966
194719481949 . . .
19501951195219531954 . .
195519561957 -1958 -.1959
I960 .1961196219631964
19651966
and unrelated individuals,1947-66
Families^
Total
Number(millions)
37.238.639.3
39.940.640.841.242.0
42.943.543.744.245.1
45.546.347.047.447.8
48.348.9
Medianincome (1966
prices)
$4,4014,2994,230
4,4794,6364,7605,1615,036
5,3775 7275,7275,7086,041
6,1746,2436,4046,6376,871
7,1547,436
With incomes under $3,000(1966 prices)
Number(millions)
10.811.512.2
11.510.810.39.8
10.6
9.89.09.19.38.9
8.99.08.58.37.8
7.57.0
Percent oftotal
28.929.731.0
28.926.725.323.925.3
22.820.720.921.019.7
19.519.418.117.516.4
15.514.3
Unrelated individuals 2
Total
Number(millions)
8.28.49.0
9.49.19.79.59.7
9.99.8
10.410.910.9
11.111.211.011.212.1
12.112.4
Medianincome (1966
prices)
$1,4371 3951,457
1,4481,4961,7401,7101,484
1,6101,7201,7731,7301,773
1,9081,9161,8961,9192,080
2,2222,270
With incomes under $1,500(1966 prices)
Number(millions)
4.24.54.6
4.84.64.44.54.9
4.84.54.75.04.9
4.84.84.64.64.8
4.54.6
Percent oftotal
51.653.051.2
51.550.145.746.950.4
48.046.145.046.044.9
43.242.541.841.340.0
36.936.7
1 The term "family" refers to a group of two or more persons related by blood, marriage, or adoption and residing together;all such persons are considered members of the same family.
2 The term "unrelated individuals" refers to persons 14 years of age and over (other than inmates of institutions) whoare not living with any relatives.
Source: Department of Commerce, Bureau of the Census.
232
Digitized for FRASER http://fraser.stlouisfed.org/ Federal Reserve Bank of St. Louis

POPULATION, EMPLOYMENT, WAGES, ANDPRODUCTIVITY
TABLE B-21.—Population by age groups: Estimates, 1929-67, and projections, 1970-85[Thousands of persons]
July 1 Total
Age (years)
Under 5 5-13 14-19 20-24 25-44 45-64 65 andover
Estimates:1929
19301931193219331934
19351936193719381939
19401941194219431944
19451946194719481949
19501951195219531954
19551956195719581959
19601961196219631964
196519661967
Projections:l
1970: Series A . . .Series D_._.
1975: Series A . . .Series D
1980: Series A . . .Series D . . .
1985: Series A . . .Series D . . .
121,767
123,077124,040124,840125,579126,374
127,250128,053128,825129,825130,880
132,122133,402134,860136,739138,397
139,928141,389144,126146,631149,188
152,271154,878157,553160,184163,026
165,931168,903171,984174,882177,830
180,684183,756186,656189,417192,120
194,592196,920199,118
208,615204,923
227,929215,367
250,489227,665
274,748241,731
11,734
11,37211,17910,90310,61210,331
10,17010,04410,00910,17610,418
10,57910,85011,30112,01612,524
12,97913,24414,40614,91915,607
16,41017,33317,31217,63818,057
18,56619,00319,49419,88720,175
20,36420,65720,74620,75020,670
20,40419,81119,191
21,31717,625
27,21018,323
31,04020,736
33,28823,030
22,131
22,26622,26322,23822,12921,964
21,73021,43421,08220,66820,253
19,93619,67419,42719,31919,246
19,32619,62520,11820,99021,634
22,42422,99824,50125,70126,887
27,92528,92929,67230,65131,767
32,98533,29633,94334,60635,301
35,88936,54436,965
37,22437,224
37,88434,209
45,21532,695
53,49735,933
13,796
13,93713,98014,01514,07014,163
14,29614,44214,55814,68014,748
14,77014,68214,53414,38114,264
13,94213,59713,44713,17113,006
12,83912,72712,80712,98613,230
13,50113,98114,79515,33715,816
16,21717,56618,48319,07519,812
20,63721,58221,697
23,13623,136
25,13225,132
24,62124,621
26,89421,699
10,694
10,91511,00311,07711,15211,238
11,31711,37511,41111,45311,519
11,69011,80711,95512,06412,062
12,03612,00411,81411,79411,700
11,68011,55211,35011,06210,832
10,71410,61610,60310,75610,969
11,11611,40811,88912,62013,154
13,67914,06315,197
17,261
19,299
20,997
21,068
35,862
36,30936,65436,98837,31937,662
37,98738,28838,58938,95439,354
39,86840,38340,86141,42042,016
42,52143,02743,65744,28844,916
45,67346,10346,49446,78647,002
47,19547,38047,44147,33647,192
47,13447,06146,96946,93346,881
46,80746,85547,077
48,276
53,881
62,374
72,083
21,076
21,57322,03122,47322,93323,435
23,94724,44424,91725,38725,823
26,24926,71827,19627,67128,138
28,63029,06429,49829,93130,405
30,84931,36231,88432,39332,941
33,50734,05834,59135,10935,663
36,20836,75637,31637,86838,438
39,01539,60140,194
41,817
43,364
43,180
42,940
6,474
6,7056,9287,1477,3637,582
7,8048,0248,2578,5088,764
9,0319,2889,5849,86710,147
10,49410,82811,18511,53811,921
12,39712,80313,20313,61714,076
14,52714,93715,38715,80516,248
16,65917,01317,31117,56517,863
18,16218,46418,796
19,585
21,159
23,063
24,978
i Two of four series projected by the cohort method and based on different assumptions with regard to completedfertility, which moves gradually toward a level of 3,350 children per 1,000 women for Series A and 2,450 children per1,000 women for Series 0. For further explanation of method of projection and for additional data, see "Population Esti-mates, Current Population Reports, Series P-25, No. 381," December 1967.
Note.—Data for Armed Forces overseas included beginning 1940.Source: Department of Commerce, Bureau of the Census.
233
Digitized for FRASER http://fraser.stlouisfed.org/ Federal Reserve Bank of St. Louis

TABLE B-22.—Noninstitutional population and the labor force, 1929-67
Year or month
Nonin-stitu-tionalpopu-lation
Totallaborforce
(includ-ing
armedforces)
Armedforces
Civilian labor force
Total
Employment
TotalAgri-cul-tural
Non-agri-cul-tural
Unem-ploy-ment
Totallabor
force aspercentof non-institu-tionalpopu-lation
Unem-ploy-ment
as per-cent ofcivilianlaborforce
Thousands of persons 14 years of age and over
19301931193219331934
19351936193719381939
19401941194219431944
194519461947
100,380101,520102 610103,660104,630
105,530106,520107,608
194719481949
19501951195219531954
19551956195719581959
19601961196219631964
196519661967
1966: Jan..Feb..Mar..Apr..May..June-July.Aug..Sept.Oct-Nov..Dec.
103,418104,527105,611
106,645107,721108,823110,601111,671
112,732113,811115,065116,363117,881
119,759121,343122,981125,154127,224
129,236131,180133,319
130,285130,436130,599130,749130,925131,083
131,236131,419131,590131,772131,949132,121
49,440
50,08050,68051,25051,84052,490
53,14053,74054,32054,95055,600
56,18057,53060,38064,56066,040
65,30060,97061,758
260
260260250250260
270300320340370
5401,6203,9709,02011,410
11,4403,4501,590
49,180
49,82050,42051,00051,59052,230
52,87053,44054,00054,61055,230
55,64055,91056,41055,54054,630
53,86057,52060,168
47,630
45,48042,40038,94038,76040,890
42,26044,41046,30044,22045,750
47,52050,35053,75054,47053,960
52,82055,25057,812
10,450
10,34010,29010,17010,0909,900
10,11010,0009,8209,6909,610
9,5409,1009,2509,0808,950
8,5808,3208,256
37,180
35,14032,11028,77028,67030,990
32,15034,41036,48034,53036,140
37,98041,25044,50045,39045,010
44,24046,93049,557
1,550
4,3408,02012,06012,83011,340
10,6109,0307,70010,3909,480
8,1205,5602,6601,070670
1,0402,2702,356
Thousands of persons 16 years of age and over
60,94162,08062,903
63,85865,11765,73066,56066,993
68,07269,40969,72970,27570,921
72,14273,03173,44274,57175,830
77,17878,89380,793
76,45876,70277,04377,81278,45980,727
80,83880,66578,98279,48879,89579,642
1,5911,4561,617
1,6503,1003,5943,5473,350
3,0492,8572,8002,6362,552
2,5142,5722,8282,7382,739
2,7233,1233,446
2,8902,9242,9743,0083,0453,099
3,1353,1783,2293,2793,3223,390
59,35060,62161,286
62,20862,01762,13863,01563,643
65,02366,55266,92967,63968,369
69,62870,45970,61471,83373,091
74,45575,77077,347
73,56873,77874,06974,80475,41477,628
77,70377,48775,75076,20976,57376,252
57,03958,34457,649
58,92059,96260,25461,18160,110
62,17163,80264,07163,03664,630
65,77865,74666,70267,76269,305
71,08872,89574,372
70,34070,67671,08372,07772,62074,038
74,65574,66673,24873,74473,99573,599
7,8917,6297,656
7,1606,7266,5016,2616,206
6,4496,2835,9475,5865,565
5,4585,2004,9444,6874,523
4,3613,9793,844
3,4493,4783,6454,0204,0974,704
4,5804,3084,1864,1143,8153,360
49,14850,71349,990
51,76053,23953,75354,92253,903
55,72457,51758,12357,45059,065
60,31860,54661,75963,07664,782
66,72668,91570,527
66,89167,19867,43968,05568,52369,333
70,07670,35969,06369,63070,18070,239
2,3112,2763,637
3,2882,0551,8831,8343,532
2,8522,7502,8594,6023,740
3,8524,7143,9114,0703,786
3,3662,8752,975
3,2283,1022,9862,7292,7943,591
3,0482,8212,5052,4662,5772,653
Percent
56.056.758.862.363.1
61.957.257.4
3.2
8.715.923.624.921.7
20.116.914.319.017.2
14.69.94.71.91.2
1.93.93.9
Percent
58.959.459.6
59.960.460.460.260.0
60.461.060.660.460.2
60.260.259.759.659.6
59.760.160.6
58.758.859.059.559.961.6
61.661.460.060.360.560.3
3.93.85.9
5.33.33.02.95.5
4.44.14.36.85.5
5.56.75.55.75.2
4.53.83.8
4.44.24.03.63.74.6
3.93.63.33.23.43.5
See footnotes at end of table.
234
Digitized for FRASER http://fraser.stlouisfed.org/ Federal Reserve Bank of St. Louis

TABLE B-22.—Noninstitutional population and the labor force, 1929-67—Continued
Year or month
1967: Jan..Feb.Mar.Apr.May.June
July.Aug.Sept.Oct..Nov.Dec.
1966: JanFebMar -AprMayJune -
JulyAugSeptOctNovDec
1967: JanFebMarAprMayJune
July...Aug. . .Sept...Oct....Nov.. .Dec. . .
Nonin-stitu-tionalpopu-lation
Totallaborforce
(includ-ing
armedforces)
Armedforces
Civilian labor force
Total
Employment
TotalAgri-cul-tural
Non-agri-cul-tural
Unem-ploy-ment
Thousands of persons 16 years of age and over
132,295132,448132,627132,795132,969133,168
133,366133,645133,847134,045134,224134,405
78,70679,10778,94979,56079,55182,464
82,92082,57180,98281,59581,58281,527
3,3863,4183,4363,4493,4563,444
3,4493,4593,4563,4633,4693,469
75,32075,68975,51376,11176,09579,020
79,47179,11277,52678,13278,11378,057
72,16072,50672,56073,44573,63775,391
76,22176,17074,63175,18175,21875,338
3,3353,2813,4103,7213,8254,395
4,5164,3783,9314,0333,7593,545
68,82669,22569,14969,72469,81270,996
71,70571,79270,70071,14871,46071,793
3,1603,1832,9542,6662,4573,628
3,2502,9422,8952,9512,8942,719
Totallabor
force aspercentof non-institu-tionalpopu-lation
Unem-ploy-ment
as per-cent ofcivilian
laborforce
Seasonally adjusted
78,24578,05078,09178,34978,19478,767
78,90579,24779,26879,36079,93480,154
80,47380,44379,95980,18979,64580,681
80,95481,16081,25981,46081,57682,051
75,35575,12675,11775,34175,14975,668
75,77076,06976,03976,08176,61276,764
77,08777,02576,52376,74076,18977,237
77,50577,70177,80377,99778,10678,582
72,41072,34172,26672,54272,25372,730
72,84673,14173,19573,19973,89773,893
74,25574,13773,74773,91073,28974,147
74,48974,71874,62574,63075 08375,681
4,1444,1554,1134,1993,9023,981
3,9263,9353,8863,7793,8924,011
4,0153,8903,8553,8903,6523,727
3,8563,9923,6763,7073,8294,264
68,26668,18668,15368,34368,35168,749
68,92069,20669,30969,42070,00569,882
70,24070,24769,89270,02069,63770,420
70,63370,72670,94970,92371,25471,417
2,9452,7852,8512,7992,8962,938
2,9242,9282,8442,8822,7152,871
2,8322,8882,7762,8302,9003,090
3,0162,9833,1783,3673,0232,901
Percent
59.559.759.559.959.861.9
62.261.860.560.960.860.7
4.24.23.93.53.24.6
4.13.73.73.83.73.5
3.93.73.83.73.93.9
3.93.83.7
3'. 53.7
3.73.73.63.73.84.0
3.93.84.14.313.9 |3.7J
Mote —Labor force data in Tables B-22 through B-25 are based on household interviews and relate to calendar weekincluding the 12th of the month. For definitions of terms, area samples used, historical comparability of the data, com-parability with other series etc., see "Employment and Earnings and Monthly Report on the Labor Force," February 1968.
Source: Department of Labor, Bureau of Labor Statistics.
235
Digitized for FRASER http://fraser.stlouisfed.org/ Federal Reserve Bank of St. Louis

T A B L E B—23.—Civilian employment and unemployment, by sex and age, 1947—67
[Thousands of persons 16 years of age and over]
Year ormonth
Employment
Total
Males
Total 16-19years
20yearsandover
Females
Total 16-19years
20yearsandover
Unemployment
Total
Males
Total 16-19years
20yearsandover
Females
Total 16-19years
20yearsandover
1947.1948.1949.
57,039 40,99458,344 4157,649 40;
2,218 38,7762,345 39,3822,124138,803
19501951195219531954
58,920 4159,96260,254 41•1,18110,"",110 41
,58041,78041,68442,431",620
16,04516,61816,723
2,186139,3942,156 39,626 _ ,2,106 39,578 18,2,135 40,2961,985 39,634
1955.1956.1957.1958.1959.
I960.1961.1962.1963.1964.
1965.1966.1967.
62,171 ._,53,802 43,54,071 .,53,036 42,54,630 43,
42,62143,38043,357"\423
;, 466
2,095 40,526 19,!2,164 41,216 20,-2,117 41,239 20,;2,012 40,411;
1,550),422), 714
20,6132,198 41,267 21,164
15,778 43,65,746 43:66,70267,762 44,59,305 45,474
1,9041,656
44,177"1,657
088 46,340895 46,919372 47,479
17,34018,18218,57018,75018,490
1,69114,3541,683 14,9371,58815,137
1,517 15,8241,611 16,570
2,360 41,543 212,314 41,342 22;2,362 41,815 22!2,406 42,251
,874!,090!, 525
23,1052,587 42,886 23,831
2,918 43,422 24,3,252 43,667 25,3,186 44,293 26,
1,612 16,9581,584 17,1641,49017,000
1,548 18,0021,654 18,7671,663 19,0521,57019,0431,64019,524
1,769 20,1051,793 20,2961,833 20,6931,849 21,2571,929 21,903
2,118 22,6302,469 23,5072,496 24,397
2,3112,2763,637
3,2882,0551,8831,8343,532
2,8522,7502,8594,6023,740
3,8524,7143,9114,0703,786
3,3662,8752,975
1,6921,5592,572
2,2391,2211,1851,2022,344
1,8541,7111,8413,0982,420
2,4862,9972,4232,4722,205
1,9141,5511,508
270255352
318191205184310
274269299416398
425479407500487
479432448
1,4221,3052,219
1,9221,029980
1,0192,035
1,5801,4421,5412,6812,022
2,0602,5182,0161,9711,718
1,4351,1191,059
619717
1,065
1,049834698632
1,188
9981,0391,0181,5041,320
1,3661,7171,4881,5981,581
1,4521,3241,468
144152223
195145140123191
176209197262256
286349313383386
395404390
475564841
854689559510997
823832821
1,2421,063
1,3681,1751,2161,195
1,056919
1,078
Seasonally adjusted
1966: Jan...Feb...Mar...Apr...May...June..
July..Aug..Sept..Oct...Nov..Dec.
1967: Jan...Feb..Mar..Apr..May..June-July..Aug..Sept..Oct...Nov..Dec.
'2,410'2,3414 ,'2,266 46,85972,542 47,01672,253 46,736
46,849
2,730 46,960
72,846 46,91773,141 ......'3,195 46,76973,199 46,82473,897 47, " *73,893 47,
74,255 47,74,137 47\73,747 47,73,910 47,73,289 47,74,147
74,489 47,74,718 47,74,625 ,74,630 4775,083 47!75,681
,876
7,0117,116
,533',477,358,273,050
47,448
,555,712
47,479'V25,548
47,892
3,256 43,620 25,5343,204 43,645 25,492
25,40725,52625,517
3,242 43,6173,285 43,7313,112 43,6243,345 43,615
3,340 43,577 25,9293,348 43i 688 26,1053,114 43,655 26,426
26,37526,88626,777
3,170 43,6543,300 43,7113,218 43,898
25,770
3,306 44,227 L_,3,239 44,238 26,3,348 44,010 26,3,181 44,092 26,3,128 ._, , _ . .3,292 44,158 26,699
3,213,233,043,050 44;3,068 44,3,094 44,798 27
44,338 26,44,479 27,44,435
•,375,480
26,722~ 662
389637
i,934,006.
27,14627,20527, 535",789
2,3842,3802,3372,3872,3752,499
2,5072,5492,432
23,15023,11223,07023,13923,14223,271
23,42223,55623,994
2,484 23,8912,6082,610
2,5942,6052,5572,635
2,513
2,365
2,4422,441
24,27824,167
24,12824,05723,83424,002
2,466 23,7732,605 24,094
24,4212,448 24,558
24,7812,378 24,827
25,09325,348
2,9452,7852,8512,7992,8962,938
2,9242,9282,8442,8822,7152,871
2,8322,8882,7762,8302,9003,090
3,0162,9833,1783,3673,0232,901
1,6251,5491,5961,5001,5321,593
1,5871,5431,5161,4891,4731,537
1,4261,4521,4131,4721,5631,619
1,5191,5391,4711,6781,6041,436
448411444420449449
441409435420387448
414468376424464461
424459430540521423
1,1771,1381,1521,0801,0831,144
1,1461,1341,0811,0691,0861 ~ ~
1,012986
1,0371,0481,0991,158
1,0951,0801,0411,1381,0831,013
1,3201,2361,2551,2991,3641,345
1,3371,3851,3281,3931,2421,334
1,4061,438,363,358,337,471
,497,444
1,7071,6891,4191,465
393355383419425423
438437384400375362
313422335337380388
402445437424378393
927881872880939922
899948944993867972
1,0931,0141,0281,021957
1,083
1,095999
1,2701,2671,0411,072
Note.-See Note, Table B-22.
Source: Department of Labor, Bureau of Labor Statistics.
236
Digitized for FRASER http://fraser.stlouisfed.org/ Federal Reserve Bank of St. Louis

TABLE B-24.—Selected unemployment rates, 1948-67
[Percent]
Year or month
1948.1949.
1950.1951.1952.1953.1954.
1955.1956.1957.1958.1959.
1960.1961.1962.1963.1964.
1965.1966.1967.
1966:JanFebMar
May."."." ."""June
July..Aug_.Sept..Oct...Nov..Dec...
1967: Jan...Feb..Mar..Apr..May..June.
July..Aug_.Sept..Oct...Nov..Dec .
Allwork-
ers
3.85.9
5.33.33.02.95.5
4.44.14.36.85.5
5.56.75.55.75.2
4.53.83.8
By sex and age
Bothsexes,16-19years
9.213.4
12.28.28.57.6
12.6
11.011.111.615.914.6
14.716.814.717.216.2
14.812.712.9
Men,20
yearsandover
3.25.4
4.72.52.42.54.9
3.83.43.66.24.7
4.75.74.64.53.9
3.22.52.3
Wom-en, 20yearsandover
3.65.3
5.14.03.22.95.5
4.44.24.16.15.2
5.16.35.45.45.2
4.53.84.2
By color
White
5.0
3.93.63.86.14.8
4.96.04.95.04.6
4.13.33.4
Non-white
9.9
8.78.37.9
12.610.7
10.212.410.910.89.6
8.17.37.4
By selected groups
Expe-riencedwageand
salaryworkers
3.76.2
5.63.22.92.66.2
4.84.44.67.25.7
5.76.85.65.55.0
4.33.53.6
Mar-riedmen*
3.4
4.61.51.41.74.0
2.62.32.85.13.6
3.74.63.63.42.8
2.41.91.8
Full-time
work-ers 2
5.4
5.02.62.5
5.2
3.83.74.07.2
6.7
5.54.9
4.33.53.5
Blue-collarwork-ers3
4.28.0
7.23.93.63.47.2
5.85.16.2
10.27.6
7.89.27.47.36.3
5.34.24.4
Laborforce
time lost '
Seasonally adjusted
3.93.73.83.73.93.9
3.93.83.73.83.53.7
3.73.73.63.73.84.0
3.93.84.14.33.93.7
13.012.112.912.913.713.0
13.112.512.912.711.412.2
11.013.210.711.613.112.6
12.613.713.815.114.012.8
2.62.52.62.42.42.6
2.62.52.42.42.42.4
2.22.22.32.32.42.6
2.42.42.32.52.42.2
3.93.73.63.73.93.8
3.73.93.84.03.43.9
4.34.04.14.13.94.3
4.33.94.94.84.04.1
3.53.33.33.33.53.4
3.43.33.23.43.13.3
3.33.33.13.33.33.5
3.53.53.63.83.43.3
6.96.87.37.17.47.5
7.58.07.27.46.97.6
6.67.17.47.37.87.8
7.26.97.98.87.36.9
3.63.43.53.43.73.7
3.53.73.63.53.43.5
3.53.43.43.43.63.8
3.73.64.04.13.63.5
1.91.91.91.81.81.9
2.02.01.91.91.71.7
1.71.61.71.91.92.0
1.82.01.81.91.71.7
3.43.33.33.33.43.7
3.43.43.43.43.43.3
3.13.03.13.33.53.9
3.63.63.83.93.63.3
4.34.14.24.14.34.3
4.54.44.14.04.24.2
4.24.14.24.64.64.7
4.74.44.64.94.44.3
5.15.38.16.6
6.78.06.76.45.8
5.04.24.2
4.34.04.14.14.34.7
4.54.24.24.13.84.1
4.14.04.14.03.84.5
4.34.34.64.74.14.1
1 Married men living with their wives. Data for 1949 and 1951-54 are for April; 1950, for March.2 Data for 1949-61 are for May.3 Includes craftsmen, operatives, and nonfarm laborers. Data for 1948-57 are based on data for January, April, July,
and October.* Man-hours lost by the unemployed and persons on part time for economic reasons as a percent of potentially available
labor force man-hours.
Note.—See Note, Table B-22.
Source: Department of Labor, Bureau of Labor Statistics.
284-593(237
Digitized for FRASER http://fraser.stlouisfed.org/ Federal Reserve Bank of St. Louis

TABLE B-25.— Unemployment by duration, 1947-67
Year or month
194719481949
19501951 .1952..19531954 . . .
19551956195719581959
19601961196219631964
196519661967
1966:JanFebMarAprMayJune . . .
JulyAugSeptOctNovDec
1967: JanFebMarAprMayJune .
JulyAugSept . . .Oct.NovDec
Total un-employ-
ment
Duration of unemployment
4 weeksand under
5-14weeks
15-26weeks
Over26 weeks
Thousands of persons 16 years of age and over
2,3112,2763,637
3,2882,0551,8831,8343,532
2,8522,7502,8594,6023,740
3,8524,7143,9114,0703,786
3,3662,8752,975
1,3001,756
1,4501,1771,1351,1421,605
1,3351,4121,4081,7531,585
1,7191,8061,6591,7511,697
1,6281,5351,634
6691,194
1,055574516482
1,116
815805891
1,3961,114
1,1761,3761,1341,2311,117
983804893
193428
425166148132495
366301321785469
503728534535491
404295271
116256
3571378478
317
336232239667571
454804585553482
351241177
Seasonally adjusted
2,9452,7852,8512,7992,8962,938
2,9242,9282,8442,8822,7152,871
2,8322,8882,7762 8302,9003,090
3 0162,9833,1783,3673,0232,901
1,4811,4501,4941,5361,6041,653
1,5921,5761,5231,4931,3971,562
1,5421,6781,6331 468l'3711,649
1,8051,6601,8891,8471,5861,471
764738796667854816
882891831900789760
787771827900877919
876946945
1,153918954
340327316333262263
228254291293287269
282249259251271298
265231278313310261
299267267257276223
218208202224197227
203190177185143146
170210159176177192
Note.—See Note, Table B-22.
Source: Department of Labor, Bureau of Labor Statistics.
238
Digitized for FRASER http://fraser.stlouisfed.org/ Federal Reserve Bank of St. Louis

TABLE B—26.— Unemployment insurance programs, selected data, 1940-67
Year or month
All programs
Cov-eredem-ploy-
ment1
Insuredunem-ploy-ment
(weeklyaver-
age) 23
Totalbenefits
paid(mil-lions
of dol-lars) 2 4
State programs
Insuredunem-ploy-
ment^
Initialclaims
Ex-haus-tions 5
Insured unem-ployment as per-cent of covered
employment
Unad-justed
Season-ally ad-justed
Benefits paid
Total(mil-
lions ofdol-
lars) *
Aver-age
weeklycheck(dol-lars) e
1940194119421943194419451946194719481949
19501951195219531954..19551956195719581959
196019611962196319641965..19661967*
1966: Jan. .Feb..M a r -Apr..M a y -June.
July..Aug__Sept..Oct...Nov-D e c .
1967: Jan. .Feb..M a r -Apr. .May..June.July..Aug..
Thousands Weekly average, thousands Percent
24,29128,13630,81932,41931,71430,08731,85633,87634,64633,098
34,30836,33437,00638,07236,62240,01842,75143,43644,41145,728
46,33446,26647,77648,43449,63751,58054,739
51,95252,12952,88553,79654,32355,549
55,70556,03456,10955,91155,98456,482
*>54,678*54,659P55, 097P55,591*55,9858 57,017
Nov.
1,331842661149111720
2,8041,7931,4462,474
1,6051,0001,0691,0672,0511,3991,3231,5713,2692,099
2,0712,9941,946
71,9731,7531,4501,1291,268
1,7391,6791,3811,112916842
1,001980802799955
1,313
1,6311,6541,6031,4231,1971,071
1,2451,123
956953
1,0681,338
534.7358.8350.480.567.2
574.92,878.51,785.51,328.72,269.8
1,467.6862.9
1,043.51,050.62,291.81,560.21,540.61,913.04,290.62,854.3
3,022.84,358.13,145.13,025.92,749.22,360.41,890.92,236.9
226.6230.2240.0166.4136.0123.5
121.0152.0114.3100.4122.6166.4
235.8230.9270.1210.5193.1165.4
155.3184.0132.3133.0146.5180.0
1,282814649147105589
1,295997980
1,973
1,513969
1,044990
1,8701,2651,2151,4462,5261,684
1,9082,2901,783
M,8061,6051,3281,0611,206
1,6441,5901,3011,044862793
947928755753903
1,254
1,5581,5831,5331,3601,1421,019
1,1841,060894889997
1,259
2141641223629116189187200340
236208215218304226227270371281
331350302
7 297268232203227
329239171166152156
249173145166208299
300267239244188186
288187158180208278
5.63.02.2.5.4
2.14.33.13.06.2
4.62.82.92.85.23.53.23.66.44.4
4.85.64.44.33.83.02.32.5
3.73.62.92.31.91.8
2.12.01.61.61.92.7
3.33.43.32.92.42.1
2.42.21.81.82.02.6
2.62.62.32.22.22.2
2.42.42.22.12.22.4
2.32.52.62.72.72.6
2.82.62.42.42.22.2
518.7344.3344.179.662.4
445.91,094.9
775.1789.9
1,736.0
1,373.1840.4998.2962.2
2,026.91,350.31,380.71,733.93,512.72.279.0
2,726.73,422.72,675.42,774.72.522.12,166.01,771.32,101.8
212.7217.2225.5155.5126.1114.4
113.8143.1106.593.7
114.8157.6
224.8219.5257.5200.6183.6156.1147.3172.8122.6122.1134.9160.0
10.5611.0612.6613.8415.9018.7718.5017.8319.0320.48
20.7621.0922.7923.5824.9325.0427.0228.1730.5830.41
32.8733.8034.5635.2735.9237.1939.7541.20
39.3239.6639.8339.3738.8538.71
39.0540.6539.6839.8440.5741.39
41.7041.9742.0741.8140.9939.9940.1041.0840.1040.7041.1941.50
1 Includes persons under the State, UCFE (Federal employee, effective January 1955), and RRB (Railroad RetirementBoard) programs. Beginning October 1958, also includes the UCX program (unemployment compensation for ex-service-men).
2 Includes State, UCFE, RR, UCX, UCV (unemployment compensation for veterans, October 1952-January 1960), andSRA (Servicemen's Readjustment Act, September 1944-September 1951) programs. Also includes Federal and Stateprograms for temporary extension of benefits from June 1958 through June 1962, expiration date of program.
3 Covered workers who have completed at least 1 week of unemployment.4 Includes benefits paid under extended duration provisions of State laws, beginning June 1958. Annual data are net
amounts and monthly data are gross amounts.5 Individuals receiving final payments in benefit year.6 For total unemployment only.7 Programs include Puerto Rican sugarcane workers for initial claims and insured unemployment beginning July 1963.s Preliminary; June 1967 is latest month for which data are available fnr all programs combined. Workers covered
by State programs account for about 87 percent of the total.Source: Department of Labor, Bureau of Employment Security.
239
Digitized for FRASER http://fraser.stlouisfed.org/ Federal Reserve Bank of St. Louis

TABLE B-27.—Wage and salary workers in nonagricultural establishments, 1929-67
[All employees; thousands of persons]
Year ormonth
1929
19301931193219331934
19351936193719381939...
19401941194219431944
194519461947 . .19481949
19501951.. .195219531954
1955195619571958 .1959 .
19601961 . .196219631964
196519661967*
Totalwageand
salarywork-
ers
31,339
29,42426,64923,62823 71125,953
27 05329,08231,02629,20930,618
32,37636,55440,12542,45241,883
40,39441,67443,88144,89143,778
45,22247,84948,82550,23249,022
50,67552,40852,89451,36353,313
54,23454,04255,59656,70258,332
60,83263,98266,066
Manufacturing
Total
10,702
9,5628,1706,9317,3978,501
9,0699,827
10,7949,440
10,278
10,98513,19215,28017,60217,328
15,52414,70315,54515,58214,441
15,24116,39316,63217,54916,314
16,88217,24317,17415,94516,675
16,79616,32616,85316,99517,274
18,06219,18619,336
Dura-ble
goods
4,715
5,3636,9688,823
11,08410,856
9,0747,7428,3858,3267,489
8,0949,0899,349
10,1109,129
9,5419,8349,8568,8309,373
9,4599,0709,4809,6169,816
10,40611,25611,325
Non-dura-ble
goods
5,564
5,6226,2256,4586,5186,472
6,4506,9627,1597,2566,953
7,1477,3047,2847,4387,185
7,3407,4097,3197,1167,303
7,3367,2567,3737,3807,458
7,6567,9308,012
Min-ing
1,087
1,009873731744883
897946
1,015891854
925957992925892
836862955994930
901929898866791
792822828751732
712672650635634
632625613
Con-tractcon-
struc-tion
1,497
1,3721,214
970809862
9121,1451,1121,0551,150
1,2941,7902,1701,5671,094
1,1321,6611,9822,1692,165
2,3332,6032,6342,6232,612
2,8022,9992,9232,7782,960
2,8852,8162,9022,9633,050
3,1863,2923,265
Trans-porta-tionandpub-lic
utili-ties
3,916
3,6853,2542,8162,6722,750
2,7862,9733,1342,8632,936
3,0383,2743,4603,6473,829
3,9064,0614,1664,1894,001
4,0344,2264,2484,2904,084
4,1414,2444,2413,9764,011
4,0043,9033,9063,9033,951
4,0364,1514,262
Whole-saleand
retailtrade
6,123
5,7975,2844,6834 7555,281
5,4315,8096,2656,1796,426
6,7507,2107,1186,9827,058
7,3148,3768,9559,2729,264
9,3869,742
10,00410,24710,235
10,53510,85810,88610,75011,127
11,39111,33711,56611,77812,160
12,71613,21113,676
Fi-nance,insur-ance,andreal
estate
1,509
1,4751,4071,3411 2951,319
1,3351,3881,4321,4251,462
1,5021,5491,5381,5021,476
1,4971,6971,7541,8291,857
1,9191,9912,0692,1462,234
2,3352,4292,4772,5192,594
2,6692,7312,8002,8772,957
3,0233,1023,228
Serv-iceandmis-cel-lane-ous
3,440
3,3763,1832,9312 8733,058
3,1423,3263,5183,4733,517
3,6813,9214,0844,1484,163
4,2414,7195,0505,2065,264
5,3825,5765,7305,8676,002
6,2746,5366,7496,8067,130
7,4237,6648,0288,3258,709
9,0879,545
10, 072
Government
Fed-eral
533
526560559565652
753826833829905
9961,3402,2132,9052,928
2,8082,2541,8921,8631,908
1,9282,3022,4202,3052,188
2,1872,2092,2172,1912,233
2,2702,2792,3402,3582,348
2,3782,5642,719
ateandlocal
2,532
2,6222,7042,6662 6012,647
2 7282,8422,9233,0543,090
3,2063,3203,2703,1743,116
3,1373,3413,5823,7873,948
4,0984,0874,1884,3404,563
4,7275,0695,3995,6485,850
6,0836,3156,5506,8687,249
7,7148,3078,897
See footnotes at end of table.
240
Digitized for FRASER http://fraser.stlouisfed.org/ Federal Reserve Bank of St. Louis

TABLE B-27.—Wage and salary workers in nonagricultural establishments,1929-67—Continued
[All employees; thousands of persons]
Year ormonth
1965: Jan. . .Feb...Mar..Apr...May..June._
July..Aug..Sept..Oct...Nov..D e c .
1966: Jan. . .Feb...Mar..A p r -May..June..
July. .Aug . .Sept..Oct. . .Nov . .Dec.. .
1967: Jan. . .Feb.. .Mar..Apr...May..June..
July..Aug...Sept..Oct__.Nov*.Dec*.
Totalwageand
salarywork-
ers
Manufacturing
TotalDura-
blegoods
Non-dura-
blegoods
Min-ing
Con-tractcon-
struc-tion
Trans-porta-tionandpub-lic
utili-ties
Whole-saleand
retailtrade
Fi-nance,insur-ance,andreal
estate
Serv-iceandmis-cel-lane-ous
Government
Fed-eral
Stateandlocal
Seasonally adjusted
59,48459,77860,04860,18660,45360,692
60,92861,13261,31961,55361,93362,319
62,50362,88963,29663,42763,61664,069
64,18064,34564,39464,69465,01465,251
65,56465,69265,74965,65365,63965,903
65,93966,19066,05566,24366,92967,128
17,66117,72617,79717,86017,90218,004
18,10318,17218,22218,30518,44518,556
18,64618,83418,94019,03719,12119,268
19,24219,37119,33719,42219,49819,526
19,55819,50719,44519,33119,23819,285
19,16919,31819,14219,16919,41819,469
10,09610,14910,19410,25310,28810,360
10,44110,51210,54310,58810,68010,770
10,85910,98911,07111,14011,20611,293
11,29011,39511,40111,45711,48511,496
11,50711,48211,43411,32211,28311,285
11,21811,35111,14911,14311,35811,380
7,5657,5777,6037,6077,6147,644
7,6627,6607,6797,7177,7657,786
7,7877,8457,8697,8977,9157,975
7,9527,9767,9367,9658,0138,030
8,0518,0258,0118,0097,9558,000
7,9517,9677,9938,0268,0608,089
637637635634633632
632631623628631631
633630635592626628
629630625623621623
625624624620617619
623606601597597597
3,1313,1663,1803,1183,1593,175
3,1363,1753,1883,2073,2513,334
3,3083,3123,3893,3403,2503,305
3,3073,2733,2603,2393,2413,291
3,3113,3523,3133,2763,1923,187
3,2313,2233,2383,2363,2993,350
3,9383,9844,0154,0204,0254,033
4,0414,0524,0684,0764,0824,093
4,0874,1094,1184,1254,1464,157
4,1444,1264,1844,1904,2124,218
4,2424,2474,2464,2124,2674,266
4,2924,2834,2624,2514,2884,289
12,42912,48812,55012,59112,68512,723
12,76612,78012,82812,85712,90712,956
12,99613,03413,08113,10713,14813,199
13,23213,25913,27913,35413,40613,416
13,51513,54113,55713,57213,60913,648
13,64713,66413,71913,77613,90913,910
2,9882,9962,9993,0033,0103,015
3,0243,0313,0403,0483,0543,062
3,0633,0673,0803,0833,0883,103
3,1123,1143,1183,1203,1323,144
3,1523,1653,1793,1943,2053,227
3,2343,2533,2643,2703,2903,302
8,8898,9298,9679,0089,0429,063
9,1159,1369,1629,1869,2389,293
9,3199,3719,4219,4459,4719,522
9,5689,6119,6199,6759,7449,781
9,8409,8839,9469,9739,987
10,035
10,07410,13010,16110,19910,30110,335
2,3442,3382,3422,3442,3472,355
2,3742,3752,3782,3892,3972,410
2,4282,4512,4752,4982,5212,575
2,5952,5952,5972,6172,6162,653
2,6672,6732,6852,6882,6982,747
2,7592,7462,7152,7122,6982,692
7,4677,5147,5637,6087,6507,692
7,7377,7807,8107,8577,9287,984
8,0238,0818,1578,2008,2458,312
8,3518,3668,3758,4548,5448,599
8,6548,7008,7548,7878,8268,889
8,9108,9678,9539,0339,1299,184
Note.—Data in Tables B-27 through B-33 are based on reports from employing establishments and relate to full- andpart-time wage and salary workers in nonagricultural establishments who worked during, or received pay for, any part ofthe pay period which includes the 12th of the month.
Not comparable with labor force data (Tables B-22 through B-25), which include proprietors, self-employed persons,domestic servants, and unpaid family workers, and which count persons as employed when they are not at work becauseof industrial disputes, bad weather, etc.
For description and details of the various establishment data, see "Employment and Earnings and Monthly Report onthe Labor Force," February 1968.
Source: Department of Labor, Bureau of Labor Statistics.
241
Digitized for FRASER http://fraser.stlouisfed.org/ Federal Reserve Bank of St. Louis

TABLE B-28.—Average weekly hours of work in selected nonagricultural industries, 1929-67
Year or month
1929.1930.1931.1932.1933.1934.1935.1936.1937.1938.1939.
1940...1941...1942...1943...1944...1945...1946...1947...1948...1949...
1950...1951...1952...1953...1954...1955...1956...1957...1958...1959...
1960...1961 —1962...1963...1964...1965...1966.-1967 v.
1966: Jan....Feb—.Mar.—Apr—.M a y -June...July...Aug...Sept...Oct..-Nov...Dec...
1967: Jan....Feb....Mar....Apr....May....June...
July....Aug....Sept...Oct....Nov "..Decp_.
Totalnon-agri-
culturalpri-vate i
40.340.039.4
39.839.939.939.639.139.639.338.838.539.0
38.638.638.738.838.738.838.738.2
Manufacturing
Total
44.242.140.5
38.738.938.938.738.638.738.738.738.838.638.638.4
38.438.238.238.038.038.138.238.238.438.038.337.9
38.338.134.636.639.238.635.637.7
38.140.643.145.045.243.540.340.440.039.140.540.640 740.539.640.740.439.839.240.339.739.840.440.540.741.241.340.6
Durablegoods
32.534.733.837.240.939.934.937.9
39.242.045.046.546.544.040.440.540.439.441.141.541.541.240.141.341.040.339.540.7
40.140.340.941.141.442.042.141.2
Non-durablegoods
41.940.035.136.137.737.436.137.4
37.038.940.342.543.142.340.540.239.638.939.739.539.739.639.039.939.639.238.839.739.239.339.639.639.740.140.239.7
Con-tractcon-
struc-tion
38.238.137.737.438.138.937.937.237.137.537.036.837.0
36.736.937.037.337.237.437.637.6
Retailtrade
43.4
43.242.841.840.941.040.941.3
3 40.340.240.440.440.439.839.139.239.038.638.138.138.238.037.637.437.337.036.635.935.3
Whole-sale
trade
41.642.943.142.341.8
41.341.141.442.343.042.841.641.141.040.840.740.840.740.640.540.740.540.340.240.6
40.540.540.640.640.640.840.840.4
Seasonally adjusted
41.441.641.541.541.441.341.241.441.441.341.341.041.040.340.440.540.340.340.440.740.840.740.740.8
42.342.442.342.442.242.141.942.242.342.142.141.741.741.041.141.041.040.941.041.341.641.341.241.3
40.140.540.340.440.340.340.240.240.140.140.239.940.039.539.539.839.539.539.639.739.939.740.140.0
37.638.138.437.536.337.537.837.237.737.537.438.138.237.637.437.436.437.437.537.538.337.139.437.3
36.236.236.036.035.936.036.036.135.935.735.635.635.535.335.335.135.235.435.435.535.435.135.235.0
40.940.940.840.740.740.840.940.840.740.740.640.640.740.540.540.440.340.5
40.540.540.340.340.340.1
Bitumi-nouscoal
mining
38.133.328.127.029.326.826.228.527.723.326.8
27.830.732.436.343.042.041.340.337.732.334.734.933.834.132.337.337.536.333.335.8
35.835.9
4 37.04 38.94 39.24 40.24 40.64 40.9
Class Irail-
roads
43.7
44.345.847.048.748.948.546.046.446.243.740.841.040.640.640.841.941.741.741.641.9
41.742.342.642.943.543.643.9
Tele-phonecom-muni-cation
38.838.939.1
39.540.140.541.942.3
2 41.739.437.439.238.538.939.138.538.738.939.639.539.038.439.239.639.439.940.040.240.440.639.2
Unadjusted
41.040.941.533.041.742.2
41.241.242.539.542.141.140.039.740.140.541.7
41.140.640.341.7
42.744.744.343.144.144.843.444.744.042.944.243.743.144.143.741.944.143.941.4
39.940.640.340.140.340.741.240.740.940.841.539.939.539.838.839.138.939.4
39.639.039.739.739.3
* In addition to industries shown separately, total includes other mining; other transportation and public utilities;finance, insurance, and real estate; and services.
2 Nine-month average, April through December, because of new series started in April 1945.3 Beginning 1947, data include eating and drinking places. Comparable figure excluding eating and drinking places is
41.0 hours for 1947.4 Eleven-month average; excludes data for July.Note.—Hours and earnings data in Tables B-28 through B-33 relate to production workers in manufacturing and mining,
to construction workers in contract construction, and generally, to nonsupervisory employees in other industries. See TableB-31 for unadjusted weekly hours in manufacturing. See also Note, Table B-27.
Source: Department of Labor, Bureau of Labor Statistics.
242
Digitized for FRASER http://fraser.stlouisfed.org/ Federal Reserve Bank of St. Louis

TABLE B-29.—Average gross hourly earnings in selected industries, 1929-67
Year or month
Totalnon-
agricul-tural
private
Manufacturing
Total Durablegoods
Non-durablegoods
Con-tractcon-
struc-tion
Retailtrade
Whole-sale
trade
Bitu-minouscoal
mining
Class Irail-
roads
Tele-phonecom-
munica-tion
Agri-cul-
ture 2
19291930193119321933193419351936193719381939
1940-1941..1942-1943-1944-1945..1946..1947..1948-1949..
1950-1951-1952..1953..1954..1955.1956-1957..1958..1959-
1960..1961-1962..1963-1964..1965..1966-1967*
1966: Jan . . .Feb.. .Mar . .Apr—May. .June..
July..Aug. .
$1,1311.2251.275
1.3351.451.521.611.651.711.801.891.952.02
2.092.142.222.282.362.452.552.67
Nov. .Dec . . .
1967: Jan. . .Feb.. .M a r -Apr. . .M a y -June..
July..Aug._Sept..Oct._-Nov v.Dec p.
$0.560.546.509.441.437.526.544.550.617.620.627
.655
.726
.851
.9571.0111.0161.0751.2171.3281.378
1.4401.561.651.741.781.861.952.052.112.19
2.262.322.392.462.532.612.722.83
2.502.502.512.532.542.55
2.562.552.602.602.602.59
2.612.622.622.632.642.66
2.682.682.712.712.722.71
2.672.682.682.702.712.71
2.712.702.752.752.762.77
2.782.792.792.802.812.82
2.822.822.852.852.872.90
$0,492.467.550.571.580.667.679.691
.716
.799
.9371.0481.1051.0991.1441.2781.3951.453
1.5191.651.751.861.901.992.082.192.262.36
2.432.492.562.632.712.792.903.00
2.852.862.872.882.882.89
2.882.882.932.942.942.96
2.962.962.962.972.992.99
3.003.003.033.033.053.08
$0,412.419.505.520.519.566.572.571
.590
.627
.709
.787
.844
.886
.9951.1451.2501.295
1.3471.441.511.581.621.671.771.851.911.98
2.052.112.172.222.292,362.452.57
2.402.412.412.432.442.45
2.462.452.472.482.492.50
2.512.532.542.552.552.56
2.572.572.612.612.622.64
$0,659.662.626503
$1. 5411.7131.792
1.8632.022.132.282.392.452.572.712.822.93
3.083.203.313.413.553.703.884.09
3.793.833.803.823.843.83
3.853.893.973.963.963.99
4.024.003.993.994.024.02
4.084.104.184.214.204.22
$0,484
.494
.518
.559
.606
.653
.699
.7974.838.901.951
.9831.061.091.161.201.251.301.371.421.47
1.521.561.631.681.751.821.912.01
1.881.881.881.891.901.91
1.911.901.931.941.951.94
1.971.981.982.002.002.01
2.012.012.032.052.052.03
$0,610.628.658.674.688
.711
.763
.828
.898
.948
.9901.1071.2201.3081.360
1.4271.521.611.701.761.831.942.022.092.18
2.242.312.372.452.522.612.732.88
2.672.682.692.722.732.73
2.732.732.762.772.792.80
2.812.832.842.862.872.88
2.892.882.932.932.942.95
.485
.651
.720
.768
.828
.849
.858
.854
.9601.0301.1011.1471,1991.3571.5821.8351.877
1.9442.142.222.402.402.472.722.922.933.11
3.143.12
6 3.12«3.155 3. 305 3.498 3.655 3.75
3.533.543.523.433.723.71
3.703.743.763.753.76
3.793.713.723.763.733.75
3.743.763.753.74
$0,730
.733
.743
.837
.852
.948
.9551.0871.1861.3011.427
1.5721.731.831.881.931.962.122.262.442.54
2.612.672.722.762.803.003.09
3.093.133.053.083.083.07
3.093.053.093.103.123.14
3.193.263.173.233.193.21
3.25
$0.774.816.822
.827
.820
.843
.870
.9113.9621.1241.1971.2481.345
1.3981.491.591.681.761.821.861.952.052.18
2.262.372.482.562.622.702.792.88
2.762.782.772.772.772.78
2.772.762.792.802.822.89
2.862.882.872.872.882.89
2.882.872.902.902.89
$0.241.226.172129
.115
.129
.142
.152
.172
.166
.166
.169
.206
.268
.353
.423
.472
.515
.547
.580
.559
.561
.625
.661
.672
.661
.675
.705
.728
.757
.798
.818
.834
.856
.880
.904
.9511.031.12
1.06
.945
1.01
T67~
1.14
'.998
1.10
1 For coverage, see footnote 1, Table B-28.2 Weighted average of all farm wage rates on a per hour basis.3 Nine-month average, April through December, because of new series started in April 1945.4 Beginning 1947, data include eating and drinking places. Comparable figure excluding eating and drinking places is
$0,901 for 1947.8 Eleven-month average; excludes data for July.Note.-See Note, Tables B-27 and B-28.Sources: Department of Labor (Bureau of Labor Statistics) and Department of Agriculture.
243
Digitized for FRASER http://fraser.stlouisfed.org/ Federal Reserve Bank of St. Louis

TABLE B—30.—Average gross weekly earnings in selected nonagricultural industries, 1929-67
Year or month
1929..
1930..1931..19321933..1934..1935..1936..1937..1938..1939..
1940..1941..19421943..1944..1945..1946..1947..1948..1949..
1950..1951..1952..1953..1954..1955..1956..1957..1958..1959..
1960.1961.1962.1963..1964..1965.1966..1967 %
1966: Jan . .Feb..M a r -Apr..May..June..
July..Aug..Sept..Oct. .Nov..D e c .
1967: Jan . .Feb..M a r -Apr. .May..June_
July...Aug. . .Sept. .Oct . . . .Nov p..Dec p..
Totalnon-
agricul-turalpri-
vate i
$45.5849.0050.24
53.1357.8660.6563.7664.5267.7270.7473.3375.0878.78
80.6782.6085.9188.4691.3395.0698.69
101.99
96.2596.5097.1497.4198.0499.20
99.8499.71100.88100.6299.8499.97
99.7099.3099.5699.41
100.06101.88
103.18103.45104. 06103.25103.63103.25
Manufacturing
Total
$24.76
23.0020.6416.8916.6518.2019.9121.5623.8222.0723.64
24.9629.4836.6843.0745.7044.2043.3249.1753.1253.88
58.3263.3467.1670.4770.4975.7078.7881.5982.7188.26
89.7292.3496.5699.63102.97107.53112.34114.90
110.00110.95110.95111.24112.47112.74
111.38111.78114.13113.85113.99114.40
113.42111.88112.44112.56113.52114.49
113.65114.77116.57116.28116.81119.19
Dura-ble
goods
$26.84
24.4220.9815.9916.2018.5921.2423.7226.6123.7026.19
28.0733.5642.1748.7351.3848.3646.2251.7656.3657.25
62.4368.4872.6376.6376.1982.1985.2888.2689.2796.05
97.44100.35104.70108.09112.19117.18122. 09123.60
119.99120.69121.11121. 54121.82122.54
119.81120.96123.94124.07123.77124.62
122.84120.77121.36121.18122.89123.19
122.40123.30126.05125.44125.66128.44
Non-durablegoods
$22.47
21.4020.0917.2616.7617.7318.7719.5721.1720.6521.36
21.8324.3928.5733.4536.3837.4840.3046.0349.5050.38
53.4856.8859.9562.5763.1866.6370.0972.5274.1178.61
80.3682.9285.9387.9190.9194.6498.49
102.03
95.5296.8896.8896.9698.3399.23
99.1499.2399.5499.94100.10100.25
99.6599.18100.08100.22100.73101.63
102. 03102.80104.66104.14105.06106.13
Con-tractcon-
struc-tion
$58.8765.2767.56
69.6876.9682.8686.4188.9190.9096.38100.27103.78108.41
113.04118.08122.47127.19132.06138.38145.89153.78
138.34139.41143.26141.34142.46146.69
150.15149.77152.05152.46144.14148.83
149.14143.60146.83147.23149.54153. 56
157.90159.08162.60160.40160.86154.03
Retailtrade
$21.01
21.3422.1723.3724.7926.7728.5932.92
3 33.7736.2238.42
39.7142.8243.3845.3647.0448.7550.1852.2054.1056.15
57.7658.6660.9662.6664.7566.6168.5770.95
67.3067.3067.1267.4767.6469.14
70.4870.1169.0968.8768.6469.65
69.1569.1069.3069.8069.8071.56
72.9672.9671.6671.5571.3471.66
Whole-sale
trade
$26.7525.1925.4425.3826.9628.3628.5128.76
29.3631.3634.2837.9940.7642.3746.0550.1453.6355.49
58.0862.0265.5369.0271.2874.4878.5781.4184.0288.51
90.7293.5696.2299.47
102.31106.49111.38116.35
108.94109.08109.48110.43111.11111.38
112.20111.38112.33112.74113.27114.52
114.09114.05114.74115.26115.66116.64
117.62116.64118.08118.08118.48119.18
Bitumi-nouscoal
mining
$25.11
22.0417.5913.5814.2117.4518.8621.8922.9419.7822.99
23.7429.4733.3739.9749.3250.3656.0463.7569.1860.63
67.4674.6975.0481.8477.5292.13102.00106.0097.57111.34
112.41112.01114.46121.43128.91140.26148.44153.72
144.73144.79146.08113.19155.12156.56
148.03152.44154.09159.80148.13158.30
155.77148.40147.68150.78151.07156.38
157.00153.71152.66151.13155.96
Class Irail-
roads
$31.90
32.4734.0339.3441.4946.3646.3250.0055.0360.1162.36
64.1470.9374.3076.3378.7482.1288.4094.24101. 50106.43
108.84112.94115.87118.40121.80130.80135.65
131.94139.91135.12132.75135.83137.54
134.11136.34135.96132.99137.90137.22
137.49143.77138. 53135.34140.68140.92
134.55
Tele-phonecom-mu-nica-tion
$30.0331.7432.14
32.6732.8834.1436.4538.54
2 40.1244.2944.7748.9251.78
54.3858.2661.2265.0268.4672.0773.4776.0578.7285.46
89.5093.3898.95
102.40105.32109.08113.27112.90
110.12112.87111.63111.08111.63113.15
114.12112.33114.11114.24117.03115.31
112.97114.62111.36112.22112.03113.87
114.05111.93115.13115.13113.58
1 For coverage, see footnote 1, Table B-28.2 Nine-month average, April through December, because of new series started in April 1945.3 Beginning 1947, data include eating and drinking places. Comparable figure excluding eating and drinking places is
$36.94 for 1947.
Note.—See Note, Tables B-27 and B-28.
Source: Department of Labor, Bureau of Labor Statistics.
244
Digitized for FRASER http://fraser.stlouisfed.org/ Federal Reserve Bank of St. Louis

T A B L E B—31.—Average weekly hours and hourly earnings, gross and excluding overtime, inmanufacturing industries, 1939—67
Year or month
All manufacturing industries
Averageweeklyhours
Gross
Ex-clud-
ingover-time
Average hourlyearnings
Gross
Ex-cjud-
ingover-time
Exclud-ing
over-timeand
inter-indus-
try shift(1957-
59=100)
Durable goods manufac-turing industries
Averageweeklyhours
Gross
Ex-clud-
ingover-time
Averagehourly
earnings
Gross
Ex-clud-
ingover-time
Nondurable goods manu-facturing industries
Averageweeklyhours
Gross
Ex-clud-
ingover-time
Averagehourly
earnings
Gross
Ex-clud-
ingover-time
1939. 37.7 $0,627 32.2 37.9 $0,691 37.4 $0.571
19.40194119421943194419451946194719481949
1950195119521953195419551956195719581959
1960.. .1961 . . .1962. . .1963. . .1964. . .1965. . .1966—1967 v.
1966: Jan. .Feb..Mar..Apr..May_.June.
July..Aug..Sept..Oct. .Nov-D e c .
1967: Jan. .Feb..Mar..Apr_.May_.June.
38.140.643.1
.655 39.242.045.046.546.544.040.440.540.439.4
41.141.541.541.240.141.341.040.339.540.7
40.140.340.941.141.442.042.141.2
42.142.242.242.242.342.4
41.642.042.342.242.142.1
41.540.841.040.841.141.2
40.841.141.641.441.241.7
.716 37.038.940.342.543.142.340.540.239.638.9
39.739.539.739.639.039.939.639.238.839.7
39.239.339.639.639.740.140.239.7
39.840.240.239.940.340.5
40.340.540.340.340.240.1
39.739.239.439.339.539.7
39.740.040.139.940.140.2
.590
July...Aug.. . .Sept. . .Oct . . . .Nov v..Dec p. .
45.045.243.540.340.440.039.1
40.540.640.740.539.640.740.439.839.240.3
39.739.840.440.540.741.241.340.6
41.241.441.441.241.541.6
41.141.441.541.441.341.3
40.840.140.340.240.440.6
40.340.740.940.840.741.1
37.637.537.237.6
37.337.437.637.737.637.637.437.2
. 726 $0.
.851
.9571.0111.0161.0751.2171.3281.378
1.4401.561.651.741.781.861.952.052.112.19
2.262.322.392.462.532.612.722.83
37.5 2.6737.6 2.6837.5 2.6837.337.537.6
37.237.437.337.337.437.6
37.436.937.137.137.237.3
37.137.337.237.337.337.5
2.702.712.71
2.712.702.752.752.762.77
2.782.792.792.802.812.82
2.822.822.852.852.872.90
). 691.793.881.933
2.9491.0351.181.291.34
1.391.511.591.681.731.791.891.992.052.12
2.202.252.312.372.442.512.592.72
2.562.562.562.582.582.58
2.592.582.612.622.642.65
2.672.682.692.702.702.71
2.712.712.732.742.762.78
133.4137.5U0.8143.7145.5150.4
57.863.266.1
68.273.677.481.684.386.991.596.2
100.2103.5
106.6109.6112.3115.2118.0121.1125.1130.9
123.3123.5123.8124.3124.5124.8
124.9124.9126.0126.5127.0127.6
128.4129.0129.4129.9130.2130.5
130.8131.1131.9132.3133.1133.6
. 799 $0.
.937
.048
.105
.144
.278
.395
.453
L762.872.966
1.019. 099 21.031
1.1111.241.351.42
627 $0,613
38.037.9
1.5191.651.751.861.901.992.082.19
37.6 2.2638.0 2.36
37.738.038.138.238.138.137.837.7
38.038.037.937.937.938.0
37.537.737.737.737.838.0
37.837.437.637.637.837.8
37.537.737.737.737.738.0
2.432.492.562.632.712.792.903.00
2.852.862.872.882.882.89
2.882.882.932.942.942.96
2.962.962.962.972.992.99
3.003.003.033.033.053.08
1.461.591.681.791.841.912.012.122.212.28
2.362.422.482.542.602.672.762.88
2.722.722.732.742.742.75
2.752.742.782.792.802.82
2.842.842.852.862.872.88
2.882.882.892.902.932.95
37.237.036.637.0
36.736.836.936.936.836.936.836.5
36.736.936.936.636.937.0
.709
.787
.844
.886
.9951.1451.2501.295
1.3471.441.511.581.621.671.771.851.911.98
2.052.112.172.222.292.362.452.57
2.402.412.412.432.442.45
36.8 2.4637.0 2.4536.6 2.4736.736.836.8
36.736.336.436.436.536.6
36.636.736.536.536.836.8
2.482.492.50
2.512.532.542.552.552.56
2.572.572.612.612.622.64
.684
.748
.7982.841.962.11.21.26
31404653586272
.92
1.992.052.092.152.212.272.352.47
2.312.312.322.332.342.34
2.352.342.372.372.392.40
2.422.442.452.462.462.46
2.472.472.502.502.522.53
1 Annual average not available; April used.2 Eleven-month average; August 1945 excluded because of VJ Day holiday period.Note.—See Note, Tables B-27 and B-28.See Table B-28 for seasonally adjusted average gross weekly hours.Source: Department of Labor, Bureau of Labor Statistics.
245
Digitized for FRASER http://fraser.stlouisfed.org/ Federal Reserve Bank of St. Louis

TABLE B-32.—Average weekly earnings, gross and spendable, total private nonagriculturalindustries, in current and 1957-59 prices, 1947-67
Year or month
1947..19481949
1950195119521953195419551956195719581959
19601961196219631964196519661967 v
1966: Jan.. .Feb...Mar . .A p r -May..June..
July..Aug. .Sept..Oct...Nov..Dec...
1967: Jan. . .Feb...Mar . .Apr...May..June-July..Aug. .Sept..Oct...Nov*.Dec p.
Average gross weeklyearnings
Currentprices
$45.5849.0050.24
53.1357.8660.6563.7664.5267.7270.7473.3375.0878.78
80.6782.6085.9188.4691.3395.0698.69
101.99
96.2596.5097.1497.4198.0499.20
99.8499.71
100.88100.6299.8499.97
99.7099.3099.5699.41
100.06101.88
103.18103.45104.06103.25103.63103.25
1957-59prices2
$58.5958.4760.53
63.4063.9365.5768.4168.9372.5874.7074.8374.5677.62
78.2479.2781.5582.9184.4986.5087.2687.70
86.7186.4786.7386.5987.0787.87
88.1287.6288.4187.8887.1287.16
86.9286.5086.5786.2286.5687.83
88.5788.4988.8688.8787.9787.35
Average spendable weekly earnings1
Workers with nodependents
Currentprices
$39.1643.1144.15
46.0248.6850.0752.4553.7656.2758.6360.4761.8364.52
65.5967.0869.5671.0575.0478.9981.1983.50
79.2979.4979.9980.2080.7081.58
82.0781.9782.8682.6682.0782.17
81.7681.4681.6681.5482.0483.42
84.4084.6185.0784.4584.7484.45
1957-59prices -
$50.3351.4453.19
54.9253.7954.1356.2857.4460.3161.9161.7061.4063.57
63.6264.3866.0066.5969.4271.8771.7971.80
71.4371.2371.4271.2971.6772.26
72.4472.0372.6272.1971.6171.64
71.2870.9671.0170.7270.9771.91
72.4572.3872.6571.8771.9471.45
Workers with threedependents
Currentprices
$44.6448.5149.74
52.0455.7957.8760.3160.8563.4165.8267.7169.1171.86
72.9674.4876.9978.5682.5786.3088.5590.98
86.6186.8187.3287.5388.0488.96
89.4789.3790.3090.0989.4789.58
89.1688.8489.0588.9389.4590.90
91.9392.1592.6391.9992.2991.99
1957-59prices2
$57.3857.8959.93
62.1061.6562.5664.7165.0167.9669.5069.0968.6370.80
70.7771.4873.0573.6376.3878.5378.2978.23
78.0377.7977.9677.8078.1978.80
78.9778.5379.1478.6878.0778.10
77.7377.3977.4377.1377.3878.36
78.9178.8379.1078.2978.3477.83
* Average gross weekly earnings less social security and income taxes.2 Earnings in current prices divided by the consumer price index.Note.—"Total private" consists of manufacturing; contract construction; retail and wholesale trade; mining; transporta-
tion and public utilities; finance, insurance, and real estate; and services.See also Note, Tables B-27 and B-28.Source: Department of Labor, Bureau of Labor Statistics.
246
Digitized for FRASER http://fraser.stlouisfed.org/ Federal Reserve Bank of St. Louis

TABLE B—33.—Average weekly earnings, gross and spendable, in manufacturing- industries, incurrent and 1957-59 prices, 1939-67
Year or month
1939
1940 . .194119421943194419451946194719481949
195019511952195319541955 . -1956195719581959
I9601961196219631964196519661967 *
1966- JanFebMarAprMayJune
JulyAug .-SeDtOctNovDec
1967: Jan . .FebMar.AprM a y . . . . . . .June
JulyAugSeptOctNov*-.Dec»
Average gross weeklyearnings
Currentprices
$23.64
24.9629.4836.6843.0745.7044.2043.3249.1753.1253.88
58.3263.3467.1670.4770.4975.7078.7881.5982.7188.26
89.7292.3496.5699.63
102.97107.53112.34114.90
110.00110.95110.95111.24112.47112.74
111.38111.78114.13113.85113.99114.40
113.42111.88112.44112.56113.52114.49
113.65114.77116.57116.28116.81119.19
1957-59prices2
$48.84
51.1557.4764.5871.4374.5570.4963.7163.2063.3964.92
69.5969.9972.6175.6175.3181.1483.1983.2682.1486.96
87.0288.6291.6193.3795.2597.8499.3398.80
99.1099.4299.0698.8899.8899.86
98.3198.22
100.0399.4399.4799.74
98.8897.4697.7797.6298.2098.70
97.5598.1899.5598.9699.16
100.84
Average spendable weekly earnings *
Worker with nodependents
Currentprices
$23.37
24.4627.9631.8035.9537.9936.8237.3142.1046.5747.21
50.2652.9755.0457.5958.4562.5164.9266.9367.8271.89
72.5774.6077.8679.8284.4089.0891.5793.28
89.7990.5190.5190.7391.6791.87
90.8491.1492.9392.7292.8293.13
92.1691 0091.4291.5192.2492.97
92.3493.1994.5594.3394.7396.54
1957-59prices2
$48.29
50.1254.5055.9959.6261.9758.7254.8754.1155.5756.88
59.9858.5359.5061.7962 4567.0068.5568.3067.3570.83
70.3971.5973 8774.8178.0881.0680.9680.21
80.8981 1080.8180.6581.4181.37
80.1880.0981.4580.9880.9981.19
80.3579 2779.5079 3779.7980.15
79 2679.7280.7480.2880.4281.68
Worker with threedependents
Currentprices
$23.40
24.7129.1936.3141.3343.7642.5942.7947.5852.3152.95
56.3660.1862.9865.6065.6569.7972.2574.3175.2379.40
80.1182.1885.5387.5892.1896.7899.45
101.26
97.5898 3498.3498.5799.5599.77
98.6899.00
100.88100.65100.76101.09
100.0898 8699.3099 40
100.16100.93
100 27101.16102.61102. 37102.80104.71
1957-59prices2
$48.35
50.6456.9063.9368.5471 3967.9362.9361.1662.4263.80
67.2666.5068.0970.3970 1474.8076.2975.8374.7178.23
77.7078.8781.1582.0885.2788.0687.9387.07
87.9188 1287.8087.6288.4188.37
87.1086.9988.4187.9087.9288.13
87.2586 1186.3586 2186.6487.01
86.0786.5487.6387.1287.2788.59
„ gross weekly earnings less social security and income taxes.2 Earnings in current prices divided by the consumer price index.Note.—See Note, Tables B-27 and B-28.Source: Department of Labor, Bureau of Labor Statistics.
247
Digitized for FRASER http://fraser.stlouisfed.org/ Federal Reserve Bank of St. Louis

TABLE B-34.—Indexes of output per man-hour and related data, private economy, 1947-67
[1957-59=1001
Year
Output per man-hour
Totalpri-vate
Farm
Nonfarm industries
TotalMan-ufac-tur-ing
Non-man-ufac-tur-ing
Output i
Totalpri-vate
Farm
Nonfarm industries
TotalMan-ufac-tur-ing
Non-man-ufac-tur-ing
Man-hours2
Totalpri-vate
Farm
Nonfarm industries
TotalMan-ufac-tur-ing
Non-ma n-ufac-tur-ing
Establishment basis 3
1947...1948...1949...
1950...1951...1952...1953...1954...
1955...1956...1957...1958...1959...
1960...1961...1962...1963...1964...
1965...1966...1967*.
69.072.074.2
80.382.784.387.889.9
93.994.196.999.8
103.4
105.0108.6113.8117.9122.5
126.3130.2132.0
49.858.056.5
64.464.770.379.683.7
84.488.093.3
103.0104.8
110.7119.4122.2133.1135.5
147.5154.6171.2
74.176.579.5
84.486.387.089.691.6
95.795.297.299.7
103.1
104.4107.4112.3115.7120.0
123.3126.4127.6
72.376.479.3
85.086.987.390.291.8
97.296.298.298.1
103.7
105.5107.9114.3118.9124.7
129.5132.3133.5
75.176.379.6
84.185.686.788.891.5
94.794.396.7
100.6102.9
103.9107.4111.5114.3118.0
120.0123.2124.5
67.670.870.6
77.982.884.889.187.9
95.497.298.697.3
104.1
106.6108.6116.0120.8127.8
135.9143.5146.5
82.191.888.9
93.788.991.896.698.6
101.0100.598.1
100.5101.9
105.8107.2106.8110.1107.7
114.0108.2116.4
66.869.869.7
77.082.584.588.887.4
95.197.198.697.2
104.2
106.7108.7116.5121.4128.8
137.1145.4148.2
69.372.768.7
79.787.889.797.190.3
100.9101.3101.793.4
104.9
106.4106.0116.8122.7131.2
143.6155.9156.5
65.668.370.2
75.779.881.984.586.0
92.294.997.199.1
103.9
106.8110.1116.3120.8127.7
133.8140.1144.0
98.098.495.1
97.0100.1100.6101.597.8
101.6103.3101.897.5
100.7
101.5100.0101.9102.5104.3
107.6110.2111.0
164.8158.4157.3
145.6137.5130.6121.4117.8
119.6114.2105.197.697.2
95.689.887.482.779.5
77.370.068.0
90.191.387.7
91.295.697.199.195.4
99.4102.0101.497.5
101.1
102.2101.2103.7104.9107.3
111.2115.0116.1
95.895.186.6
93.8101.0102.7107.798.4
103.8105.3103.695.2
101.2
100.998.2
102.2103.2105.2
110.9117.8117.2
87.489.588.2
90.093.294.595.294.0
97.4100.6100.498.5
101.0
102.8102.5104.3105.7108.2
111.4113.7115.7
Labor force basis4
1947..1948..1949..
1950..1951..1952..1953..1954..
1955..1956..1957..1958..1959..
I960..1961—1962..1963..1964..
1965..1966..1967*
67.970.271.9
78.582.184.5
1.490.8
94.794.697.299.4
103.4
104.5107.3113.0116.7121.0
124.8129.3131.5
49.858.056.1
64.164.369.979.183.3
84.087.593.3
103.1104.7
110.7119.9122.3133.5135.8
147.7154.4170.4
72.974.576.8
82.485.787.590.492.8
96.795.997.799.2
103.1
103.8105.9111.4114.4118.4
121.5125.2127.0
67.670.870.6
77.982.884.889.187.9
95.497.298.697.3
104.1
106.6108.6116.0120.8127.8
82.191.888.9
93.7
91.896.698.6
101.0100.598.1
100.5101.9
105.8107.2106.8110.1107.7
135.9 114.0143.5 108.2146.5 116.4
66.869.869.7
77.082.584.588.887.4
95.197.198.697.2
104.2
106.7108.7116.5121.4128.8
137.1145.4148.2
99.6100.898.2
99.2100.9100.4100.896.8
100.7102.7101.497.9
100.7
102.0101.2102.7103.5105.6
108.9111.0111.4
164.8158.2158.6
146.2138.3131.3122.1118.3
120.3114.9105.297.597.3
95.689.487.382.579.3
77.270.168.3
91.693.790.8
93.496.396.698.294.2
98.3101.2100.998.0
101.1
102.8102.6104.6106.1108.8
112.8116.1116.7
* Output refers to gross national product in 1958 prices.2 Hours worked by all persons in private industry engaged in production, including man-hours of proprietors and unpaid
family workers.3 Man-hours estimates based primarily on establishment data.4 Man-hours estimates based primarily on labor force data.
Note.—For information on sources, methodology, trends, and underlying factors influencing the measures, see Bureauof Labor Statistics, Department of Labor, Bulletin No. 1249 "Trends in Output per Man-Hour in the Private Economy,1909-58" December 1959.
Source: Department of Labor, Bureau of Labor Statistics.
248
Digitized for FRASER http://fraser.stlouisfed.org/ Federal Reserve Bank of St. Louis

PRODUCTION AND BUSINESS ACTIVITYT A B L E B—35.—Industrial production indexes, major industry divisions, 1929—67
[1957-59=100]
Year or month
1929
193019311932193319341935.1936 .193719381939
1940.194119421943194419451946...194719481949
19501951195219531954... . .19551956195719581959
19601961 . . .1962196319641965... .19661967*.
1966: Jan.FebMarAprMay._June
JulyAugSeptOct.NovDec
1967: JanFebMarAprMayJune
JulyAugSeptOctNovDec p
Total indus-trial
production
38.4
32.026.520.724.426.630.736.339.731.438.3
43.956.469.382.981.770.559.565.768.464.7
74.981.384.391.385.896.699.9
100.793.7
105.6
108.7109.7118.3124.3132.3143.4156 3157.8
Total
38.6
31.725.919.923.726.030.636.439.730.537.9
43.858.373.188.786.373.060.066.468.965.1
75.881.985.292 786.397.3
100.2100.893.2
106.0
108 9109.6118.7124.9133.1145.0158 6159.5
Manufacturing
Durable
38.2
28.419.511.915.518.824.131.235.222.631.4
40.057.779.9
102.9100.978.254.764.367.060.9
74.183.588.599 988.4
101.9104.0104.090.3
105.6
108 5107.0117.9124.5133.5148.4164 8163.8
Nondurable
38.3
34.832.828.932.833.837.441.644.139.144.9
47.357.663.770.768.265.664.867.269.568.3
76.078.580.083.683.691.695.496.796.8
106.5
109.5112.9119.8125.3132.6140.8150.8154.2
Mining
54.2
47.040.333,638.540.343.750.356.749.053.8
60.164.867.069.074.273.072.279.984.074.5
83.291.390.592.990.299.2
104.8104.695.699.7
101.6102.6105.0107.9111.5114.8120.5123.4
Utilities
12.7
13.112.511.711.512.213.214.916.416.518.3
20.322.825.628.330.130.631.836.540.843.4
49.556.461.266.871.880.287.993.998.1
108.0
115.6122.3131.4140.0151.3160.9173.9183.9
Seasonally adjusted
150.7152.4153.8153 9155.4156.5
157.2157.8158.1159.4159 1159.5
158.2156.6156.4156.5155 6155.6
156 6158.1156.8156.6159.3161.6
152.9154.7156.0156 5157.8158.7
159.4160.0160 4161.8161 5161.7
160 1158.5158.2158.2157 2157.0
157 6159.4158.1158.1160.9163.6
157.8160.2161.6162 5164.0164.9
165.8166.4167.2168.9167 7167.7
165.5162.9162.6162.5162.2161.5
162 5163.6161.1160.8164.4168.3
146.8147.8148.9148.9149.9151.0
151.5152.0151.9152.8153.6154.1
153.4152.9152.6152.8151.1151.4
151.5154.0154.2154.7156.5157.7
118.1118.2120.4115.4120.0121.6
122.1121.9121.1121.9121.6123.8
123.2122.4121.5122.0120.2123.8
128.0127.8124.3121.2123.7123.7
165.9168.5169.6171.2171.8173.3
175.0176.3178.0178.9178.5179.4
180.6180.5181.9182.7182.7183.2
184.1184.8184.8187.6188. C188. C
Source: Board of Governors of the Federal Reserve System.
249
Digitized for FRASER http://fraser.stlouisfed.org/ Federal Reserve Bank of St. Louis
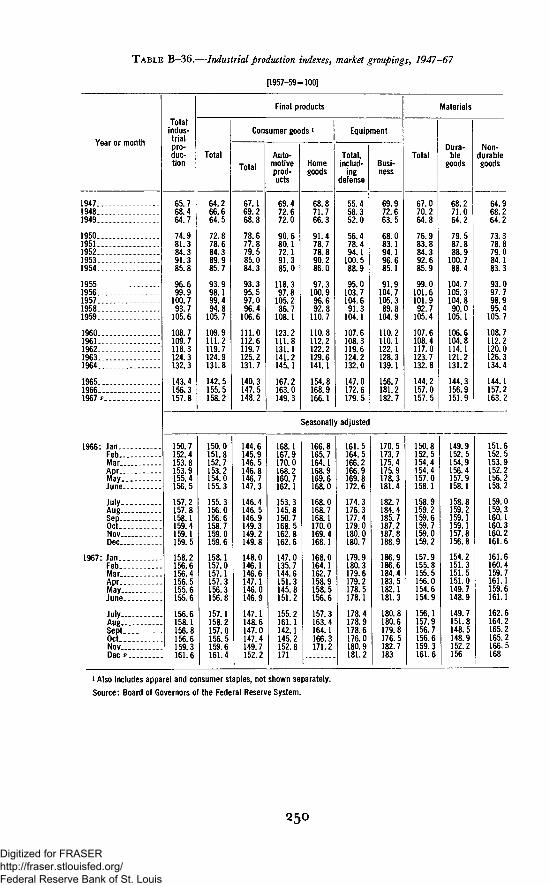
TABLE B-36.—Industrial production indexes, market groupings, 1947-67
[1957-59=1001
Year or month
1947..1948..1949..
1950..1951..1952..1953..1954..
1955..1956.-1957..1958..1959..
1960..1961..1962..1963..1964..
1965..1966..1967 P.
1966 Jan...Feb...Mar_.Apr__.May_.June-July..Aug..
s
Nov..Dec.
1967: Jan..Feb..Mar-Apr_.May..June.
July—Aug..Sept..Oct..Nov..Dec p
Totalindus-trialpro-duc-tion
65.768.464.7
74.981.384.391.385.8
96.699.9
100.793.7
105.6
108.7109.7118.3124.3132.3
143.4156.3157.8
Final products
Total
64.266.664.5
72.878.684.389.985.7
93.998.199.494.8
105.7
109.9111.2119.7124.9131.8
142.5155.5158.2
Consumer goods l
Total
67.169.268.8
78.677.879.585.084.3
93.395.597.096.4
106.6
111.0112.6119.7125.2131.7
140.3147.5148.2
Auto-motiveprod-ucts
69.472.672.0
90.680.172.191.385.0
118.397.8
105.286.7
108.1
123.2111.8131.1141.2145.1
167.2163.0149.3
Homegoods
68.871.766.3
91.478.778.890.286.0
97.3100.996.692.8
110.7
110.8112.2122.2129.6141.1
154.8168.9166.1
Equipment
Total,includ-
ingdefense
55.458.352.0
56.478.494.1
100.588.9
95.0103.7104.691.3
104.1
107.6108.3119.6124.2132.0
147.0172.6179.5
Busi-ness
69.972.663.5
68.083.194.196.685.1
91.9104.7105.389.8
104.9
110.2110.1122.1128.3139.1
156.7181.2182.7
Materials
Total
67.070.264.8
76.983.884.392.685.9
99.0101.6101.992.7
105.4
107.6108.4117.0123.7132.8
144.2157.0157.5
Dura-ble
goods
68.271.064.2
79.587.888.9
100.788.4
104.7105.3104.890.0
105.1
106.6104.8114.1121.2131.2
144.3156.9151.9
Non-durablegoods
64.968.264.2
73.378.879.084.183.3
93.097,798.995.4
105.7
108.7112.2120.0126.3134.4
144.1157.2163.2
Seasonally adjusted
150.7152.4153.8153.9155.4156.5
157.2157.8158.1159.4159.1159.5
158.2156.6156.4156.5155.6155.6
156.6158.1156.8156.6159.3161.6
150.0151.8152.7153.2154.0155.3
155.3156.0156.6158.7159.0159.6
158.1157.0157.1157.3156.3156.8
157.1158.2157.0156.5159.6161.4
144.6145.9146.5146.8146.7147.3
146.4146.5146.9149.3149.2149.8
148.0146.1146.6147.1146.0146.9
147.1148.6147.0147.4149.7152.2
168.1167.9170.0168.2160.7162.1
153.3145.8150.7168.5162.8162.6
147.0135.7144.6151.3145.8151.2
155.2161.1142.1145.2152.8171
166.8165.7164.1168.9169.6168.0
168.0168.7168.1170.0169.4168.1
168.0164.1162.7158.9158.5156.6
157.3163.4164.1166.3171.2
161.5164.5166.2166.9169.8172.6
174.3176.3177.4179.0180.0180.7
179.9180.3179.6179.2178.5178.1
178.4178.9178.6176.0180.9181.2
170.5173.7175.4175.9178.3181.4
182.7184.4185.7187.2187.8188.9
186.9186.6184.4183.5182.1181.3
180.8180.6179.8176.5182.7183
150.8152.5154.4154.4157.0158.1
158.9159.2159.6159.7159.0159.2
157.9155.8155.5156.0154.6154.9
156.1157.9156.7156.6159.3161.6
149.9152.5154.9156.4157.9158.1
158.8159.2159.1159.1157.8156.8
154.2151.3151.5151.0149.7148.9
149.7151.8148.5148.9152.2156
151.6152.5153.9152.2156.2158.2
159.0159.3160.1160.3160.2161.6
161.6160.4159.7161.1159.6161.1
162.6164.2165.2165.2166.5168
1 Also includes apparel and consumer staples, not shown separately.
Source: Board of Governors of the Federal Reserve System.
250
Digitized for FRASER http://fraser.stlouisfed.org/ Federal Reserve Bank of St. Louis

T A B L E B—37.—Industrial production indexes, selected manufactures, 1947—67
[1957-59=100]
Year ormonth
Durable manufactures
Pri-mary
metals
Fabri-catedmetalprod-ucts
Ma-chinery
Trans-porta-tion
equip-ment
Instru-ments
and re-latedprod-ucts
Clay,glassand
lumber
Furni-tureand
miscel-laneous
Nondurable manufactures
Textile,apparel,
andleatherprod-ucts
Paperand
printing
Chem-ical,
petro-leum,and
rubberprod-ucts
Foods,bever-ages,and
tobacco
194719481949
19501951195219531954
19551956195719581959
19601961196219631964
196519661967*
1966: Jan. . .Feb. . .Mar_..Apr . . .May...June..
July..Aug. .Sept..Oct....Nov.. .Dec. . .
1967: Jan.. . .Feb . . .Mar. . .Apr . . .May...June..
July...Aug. . .Sept...Oct... .Nov.. .Dec v..
90.794.379.4
99.9108.799.3
112.591.3
118.4116.4112.287.5
100.4
101.398.9
104.6113.3129.1
137.6142.7132.6
75.977.269.8
85.491.289.0
100.390.2
98.398.8
101.592.9
105.5
107.6106.5117.1123.4132.7
147.8163.0161.6
65.366.559.0
72.783.092.1
100.587.7
96.5107.1104.288.8
107.1
110.8110.4123.5129.2141.4
160.5183.8183.4
42.946.947.1
56.462.973.191.783.8
102.097.4
106.489.5
104.0
108.2103.6118.3127.0130.7
149.2166.9165.9
53.755.249.2
57.365.778.185.382.9
88.795.498.092.1
109.9
116.5115.8123.0130.2136.4
151.4176.5184.7
75.879.772.3
87.792.089.392.789.6
100.7102.097.594.1
108.5
105.7104.5109.3114.4121.1
127.6132.9130.9
73.577.471.6
83.780.282.489.786.8
97.9101.097.693.3
109.0
113.3114.1124.5129.1138.4
151.8165.0162.4
81.084.580.6
89.187.489.590.786.9
95.598.096.995.0
108.1
107.5108.4115.1118.5125.2
135.8141.6138.9
66.769.469.3
76.779.477.782.685.0
92.597.197.897.0
105.2
109.0112.4116.7120.1127.5
135.3146.4149.7
47.550.849.4
60.767.469.975.274.7
86.891.495.695.5
108.9
113.9118.9131.2141.8152.5
164.6181.9189.2
Seasonally adjusted
131.2137.0141.8142.5145.3147.3
147.8148.0146.6145.0140.5137.6
132.6131.9129.2129.1128.9129.0
129.6129.3129.2131.6134.8142
157.7161.6161.7161.4162.9161.8
162.1163.1163.1164.2164.7168.7
166.7165.0162.9161.0160.8160.8
159.8159.1158.1158.1159.6161
174.2176.2176.1178.1180.5182.7
186.7188.7190.0191.1189.8190.3
190.3186.8184.5182.1180.5177.5
180.0182.8182.2179.6183.2183
163.0163.8165.4165.5164.9165.9
164.8163.7166.3172.6170.6169.1
162.6157.5162.6165.7167.5169.3
170.8171.9159.2159.3165.7177
166.8169.4171.9173.7176.4176.5
177.0177.4179.5181.8183.2184.6
186.2183.4185.8185.2185.3184.1
182.9183.2183.1183.2185.4186
134.7135.0136.1136.8135.6133.1
131.7130.2129.2129.5129.1128.8
128.6128.9128.4129.8127.8126.7
127.3126.7129.6131.4134.7137
158.4161.6162.9163.5166.7167.0
163.5167.1165.9166.0167.1168.1
166.3163.9162.4162.9162.3161.5
159.1159.9161.4160.9161.4163
138.9140.1141.4142.6143.1142.4
141.4141.3141.4142.3142.2142.2
140.3137.6135.5135.5135.3134.8
135.3137.6139.1140.6141.9143
141.7142.7144.2143.5146.6148.3
149.6148.6147.2147.9148.5147.4
148.4148.7149.5149.9149.1149.4
148.6150.3148.5148.5150.2151
175.7176.3177.4177.9179.3181.0
181.8183.6185.1186.3188.5188.6
187.1186.5186.8186.4182.2183.0
184.0189.5191.2190.9195.3198
80.780.080.8
83.685.487.388.289.8
93.196.696.799.4
103.9
106.6110.2113.3116.8120.8
123.4128.1131.4
125.8127.2128.0126.9126.4127.6
128.2128.9128.1128.6128.9131.2
131.0131.5131.1131.8130.9131.3
130.9131.0130.4131.1130.8131
Source: Board of Governors of the Federal Reserve System.
251
Digitized for FRASER http://fraser.stlouisfed.org/ Federal Reserve Bank of St. Louis

TABLE B-38.—Manufacturing output, capacity, and utilization rate, 1948-67
Period
19481949 . .
19501951195219531954
1955195619571958 _1959
196019611962 . .19631964
19651966 . . .1967*
1961: 1IIIIIIV
1962- 1II .IllIV
1963: I — .IIIIIIV
1964: 1IIIII . . . . .IV
1965: 1IIIII . .IV
1966: 1IIIIIIV . . .
1967: I vII vIII vIV p
Output Capacity i
1957-59 output=100
68.965.1
75.881 985.292.786.3
97.3100.2100 893 2
106.0
108.9109.6118.7124.9133.1
145 0158.6159.5
76.881.1
84.387 492.798.4
103.3
108.4114.3120 7125.8130.1
134.9139.6144.4149.8155.6
164.0175.0186.5
Utilization rate 2
Total Advancedproducts
Primaryproducts
Percent
89.780.2
90.494 091 394.283.5
90.087.783 674.081.5
80.678.582.183.385.7
88.590.585.1
87.980.3
87.391 091.994.183.8
87.886.082.373.681.0
81.178.982.583.184.4
87.690.585.8
92.280.0
94.898 190.494.483.0
93.290.185.374.682.1
80.078.181.683.687.4
89.790.584.0
Seasonally adjusted
103.1108.4112.3115.0
116.6118.6119.7119.9
121.3124.9126.0127.2
129.4132.5134.7135.9
141.4143.5146.1148.9
154.5157.7159.9161.7
158.9157.5158.4160.9
137.9139.0140.1141.2
142.4143.7145.1146.4
147.8149.1150.5151.8
153.3154.9156.4158.0
160.1162.7165.3167.9
170.6173.5176.4179.3
182.2185.1187.9190.8
74.578.080.281.5
82.082.482.481.8
82.083.983.783.7
84.585.786.386.2
88.588.488.588.6
90.590.990.690.0
87.184.984.184.3
76.378.279.781.3
81.482.883.382.5
82.282.983.683.7
83.884.784.984.4
87.287.187.488.7
90.390.590.690.6
87.886.285.284.2
72.177.780.981.7
82.781.981.180.7
81.785.283.983.8
85.587.188.388.8
90.290.190.188.5
90.991.490.689.1
86.083.182.584.4
1 For description and source of data see "A Revised Index of Manufacturing Capacity," Frank de Leeuw, Frank E.Hopkins,and Michael D. Sherman, "Federal Reserve Bulletin," November 1966, pp. 160571615. See also McGraw-Hill surveys on"Business Plans for New Plants and Equipment" for data on capacity and operating rates.
2 Output as percent of capacity; based on unrounded data.Source: Board of Governors of the Federal Reserve System (output) and sources in footnote 1 (capacity and utilization
rate).
252
Digitized for FRASER http://fraser.stlouisfed.org/ Federal Reserve Bank of St. Louis

TABLE B-39.—Business expenditures for new plant and equipment, 1939 and 1945-68
[Billions of dollars]
Year or quarter
1939
19451946194719481949
1950 . - .1951195219531954 .
1955 .1956195719581959
I9601961196219631964
1965.. .19661967 3
1965' 1| |IIIIV
1966: 1IIIIIIV
1967: 1II| | |_ . .IV 3
1968: i s
11 3
Total i
5.51
8.6914.8520.6122.0619.28
20.6025.6426 4928.3226.83
28.7035.0836 9630.5332.54
35.6834.3737.3139.2244.90
51.9660.6361.48
Manufacturing
Total
1.94
3.986.798 709.137.15
7.4910.8511 6311.9111.04
11.4414.9515 9611.4312.07
14.4813.6814 6815.6918.58
22.4526.9926.84
Dura-ble
goods
0.76
1.593.113.413.482.59
3.145.175.615.655.09
5.447.628.025.475.77
7.186.277.037.859.43
11.4013.9913.78
Non-durablegoods
1.19
2.393 685.305.654.56
4.365.686.026.265.95
6.007.337.945.966.29
7.307.407.657.849.16
11.0513.0013.07
Mining
0.33
.38
.43
.69
.88
.79
.71
.93
.98
.99
.98
.961.241.24.94.99
.99
.981.081.041.19
1.301.471.43
Transportation
Rail-road
0.28
.55
.58
.891.321.35
1.111.471.401 31.85
.921.231.40.75.92
1.03.67.85
1.101.41
1.731.981.55
Other
0.36
.57
.921.301.28.89
1.211.491 501.561.51
1.601.711 771.502.02
1.941.852 071.922.38
2.813.443.88
Publicutili-ties
0.52
.50
.791.542 543.12
3.313.663.894.554.22
4.314.906.206.095.67
5.685.525.485.656.22
6.948.419.59
Com-mer-cialand
other 2
2.08
2.705.337.496.905.98
6.787.247.098.008.23
9.4711.0510.409.81
10.88
11.5711.6813.1513.8215.13
16.7318.3618.20
Seasonally adjusted annual rates
49.0050.3552.7555.35
58.0060.1061.2562.80
61.6561.5060.9062.05
65.0565.85
20.7521.5523.0024.15
25.6026.8027.5527.75
27.8527.0026.1526.55
27.7528.40
10.4010.8011.7512.45
13.1513.8514.3514.50
14.2013.7513.5013.75
14.6015.00
10.4010.7011.2511.70
12.4512.9513.2013.25
13.7013.2512.6512.80
13.1513.40
1.251.301.251.35
1.401.551.451.45
1.401.301.451.50
1.60
1.751.551.701.95
1.752.001.852.35
1.801.551.401.45
1.50
2.552.703.003.00
3.303.503.403.50
3.053.904.104.45
4.75
6.806.856.757.30
8.258.308.558.50
9.209.709.809.60
11.15
15.8516.4017.0017.55
17.7017.9518.4519.25
18.3018.0517.9518.50
18.3537^45
1 Excludes agriculture.3 Commercial and other includes trade, service, finance, communications, and construction.3 Estimates based on anticipated capital expenditures reported by business in late October and November 1967. The
quarterly anticipations include adjustments, when necessary, for systematic tendencies in anticipatory data.Note.—Annual total is the sum of unadjusted expenditures; it does not necessarily coincide with the average of seasonally
adjusted figures.These figures do not agree precisely with plant and equipment expenditures included in the gross national product
estimates of the Department of Commerce. The main difference lies in the inclusion in the gross national product of in-vestment by farmers, professionals, institutions, and real estate firms, and of certain outlays charged to current account.
These series are not available for years prior to 1939 and for 1940 to 1944.Sources: Department of Commerce (Office of Business Economics) and Securities and Exchange Commission.
284-593 0—68 17253
Digitized for FRASER http://fraser.stlouisfed.org/ Federal Reserve Bank of St. Louis

TABLE B-40.—New construction activity, 1929-67
[Value put in place, millions of dollars]
Year or month
1929
193019311932193319341935 . . . . .1936193719381939
194019411942194319441945 .1946
New series5
194619471948.1949
195019511952195319541955195619571958.1959
1960 . .196119621963
New series6
19621963196419651966 - . - .1967 7
Totalnewcon-
struc-tion
10,793
8,7416,4273,5382,8793,7204,2326,4976,9996,9808,198
8,68211,95714,0758,3015,2595,809
12,627
14,30820,04126,07826,722
33,57535,43536,82839,13641,38046,51947,60149,13950,15355,305
53,94155,44759,57662,755
59,66763,42366,20071,91274,37174,680
Private construction
Total
8,307
5,8833,7681,6761,2311,5091,9992,9813,9033,5604,389
5,0546,2063,4151,9792,1863,411
10,396
12,07716,72221,37420,453
26,70926,18026,04927,89429,66834,80434,86935,08034,69639,235
38,07838,29941,70743,859
41,79844,05745,81049,84050,44649,560
Residentialbuilding
(nonfarm)
Total i
3,625
2,0751,565
630470625
1,0101,5651,8751,9902,680
2,9853,5101 715
885815
1,2764,752
6,2479,850
13,12812,428
18,12615,88115,80316,59418,18721,87720,17819,00619,78924,251
21,70621,68024,29225,843
24,29226,18726,25826,26623,81523,597
Newhous-
ingunits
3,040
1,5701,320
485290380710
1,2101,4751,6202,270
2,5603,0401,440
710570720
3,300
4,7957,765
10, 50610,043
15, 55113,20712,85113,41114,93118,24216,14314,73615,44519,233
16,41016,18918,63820,064
18,63820,38520,35420,35117,96417,902
Nonresidential building andother construction
Total
4,682
3,8082,2031,046
761884989
1,4162,0281,5701,709
2,0692,6961,7001,0941,3712,1355,644
5,8306,8728,2468,025
8,58310,29910,24611,30011,48112,92714,69116, 07414,90714,984
16,37216,61917,41518,016
17,50617,87019,55223,57426,63125,963
Com-mer-cial 2
1,135
893454223130173211290387285292
3484091553356
2031,153
1,153957
1,3971,182
1,4151,4981,1371,7912,2123,2183,6313,5643,5893,930
4,1804,6744,9555,200
5,1444,9955,3966,7456,8906,971
In-dus-trial
949
53222174
176191158266492232254
442801346156208642
1,689
1,6891,7021,397
972
1,0622,1172,3202,2292,0302,3993,0843,5572,3822,106
2,8512,7802,9492,962
2,8422,9063,5655,1286,7036,126
Others
2,598
2,3831,528
749455520620860
1,1491,0531,163
1,2791,4861,199
9051,1071,2902,802
2,9884,2135,4525,871
6,1066,6846,7897,2807,2397,3107,9768,9538,9368,948
9,3419,1659,5119,854
9,5209,969
10,59111,70113,03812,866
Public construction
Total
2,486
2,8582,6591,8621,6482,2112,2333,5163,0963,4203,809
3,6285 751
10,6606,3223,0732,3982,231
2,2313,3194,7046,269
6,8669,255
10,77911,24211,71211,71512,73214,05915,45716,070
15,86317,14817,86918,896
17,86919,36620,39022,07223,92525,120
Fed-erallyowned
155
209271333516626814797776717759
1,1823,7519,3135,6092,5051,737
865
865840
1,1771,488
1,6242,9814,1854,1393,4282,7692,7262,9743,3873,724
3,6223,8793,9133,970
3,9134,0103,9054,0223,8813,369
Stateand
locallyowned 4
2,331
2,6492,3881,5291,1321,5851,4192,7192,3202,7033,050
2,4462,0001,347
713568661
1,366
1,3662,4793,5274,781
5,2426,2746,5947,1038,2848,946
10,00611,08512,07012,346
12,24113,26913,95614,926
13,95615,35616,48518,05020,04421,751
See footnotes at end of table.
254
Digitized for FRASER http://fraser.stlouisfed.org/ Federal Reserve Bank of St. Louis

TABLE B-40.—New construction activity, 1929-67— Continued
[Value put in place, millions of dollars]
Year or month
1966: JanF e b . . . .M a r . . . .A p r . . . .May..--J u n e . - .
JulyAugSeptOctNov... .D e c . . .
1967: JanFeb_.. .Mar..-_Apr..._May....June
July. . . .AugSept....OctNOVP. . .
Totalnewcon-
struc-tion
77,17577,58878,42776,94975,18374,540
73,08873,36973,98172,25571,98772,169
74,83674,9%73,08471,96173,90472,374
73,39974,39276,29576,91077,189
Private construction
Total
53,08553,34253,89652,51251,61751,476
50,49250,45650,10747,88347,09646,410
48,33447,96046,90646,04247,81348,052
49,15150,17051,72652,19552,064
Residential build-ing (nonfarm)
Total i
26,78726,61426,33425,91525,57624,859
24,13723,35622,67821,58720,32419,844
19,92820,27820,82921,13022,10722,885
23,65224,61925,30625,97126,575
Newhous-
ingunits
Nonresidential building and other
Total
construction
Com-mer-cial 2
In-dus-trial
Seasonally adjusted annual rate;
20,72620,48220,32820,11219,84219,067
18,21617,42216,83115,85714,64014,177
14,03414,33514,95915,46316,54217,318
17,98918,93219,64420,33020,938
26,29826,72827,56226,59726,04126,617
26,35527,10027,42926,29626,77226,566
28,40627,68226,07724,91225,70625,167
25,49925,55126,42026,22425,489
7,4686,9967,4906,7936,3506,662
6,7636,9167,0786,6856,6897,027
7,9257,6977,1946,9267,0936,683
6,7396,4376,7316,9916,860
6,3976,6106,5786,7986,7187,022
7,0127,1546,8956,6736,8766,469
7,1307,0546,0975,5796,0065,886
6,1546,0116,5776,2405,592
Others
>
12,43313,12213,49413,00612,97312,933
12,58013,03013,45612,93813,20713,070
13,35112,93112,78612,40712,60712,598
12,60613,10313,11212,99313,037
Public
Total
24,09024,24624,53124,43723,56623,064
22,59622,91323,87424,37224,89125,759
26,50227,03626,17825,91926,09124,322
24,24824,22224,56924,71525,125
construction
Fed-erallyowned
4,3164,1364,3824,1193,7543,999
3,7683,7233,6943,5793,7023,679
3,7943,4353,4773,0613,2243,104
3,4813,3623,4063,3363,526
Stateand
locallyowned4
19,77420,11020,14920,31819,81219,065
18,83019,19020,18020,79321,18922,080
22,70823,60122,70122,85822,86721,218
20,76720,86021,16321,37921, 599
* Total includes additions and alterations and nonhousekeeping units not shown separately.2 Office buildings, warehouses, stores, restaurants, and garages.3 Farm, institutional, public utilities, and all other private.4 Includes Federal grants-in-aid for State and locally owned projects.5 New series in 1946 reflects differences due to the new higher level series of housing starts and farm construction ex-
penditures and the reduced level value in place series for public utilities. See "Construction Report C30-61 (Supplement)"for a description of the differences.
6 New series differs from old in that it reflects differences in 1962 due to the introduction of new series for private non-residential buildings and differences in 1963 due to the introduction of new series for State and locally owned publicconstruction. See "Construction Report C30-65S" for a description of the differences.
7 Preliminary estimates by Council of Economic Advisers.Source: Department of Commerce, Bureau of the Census.
255
Digitized for FRASER http://fraser.stlouisfed.org/ Federal Reserve Bank of St. Louis

TABLE B-41.—New housing starts and applications for financing, 1929-67
[Thousands of units]
Year ormonth
Housing starts
Private andpublic i
Total(farm
andnon-
farm)
Non-farm
Private i
Total (farm and nonfarm)
Total
Type ofstructure 2
Onefamily
Two ormore
families
Nonfarm
Total
Governmenthome programs
FHA3 VA
Newprivatehousing
unitsauthor-ized *
Proposedhome con-struction s
Appli-cations
forFHAcom-mit-
ments 3
Re-quests
forVAap:
)rais-als
1929.
1930.1931.1932.1933.1934.
1935.1936.1937.1938.1939.
1940.1941.1942.1943.1944.
509.0 509.0
330.0254.0
330.0254.0134.093.0
126.0
215.7304.2332.4
134.093.0
126.0
221.0319.0336.0406.0515.0
602.6706.1356.0191.0141.8
New series19451946194719481949
1950..1951..1952..1953..1954..
1955..1956..1957..1958..1959.
1960.1961.1962.1963.1964.
1965.,1966.1967i
,553.5
1,296.01,365.01,492.41,642.01,561.6
1,509.61,196.21,322.0
326.1023.2268.5362.1466.1
951.9491.0503.9437.6550.5
646.0349.1223.9382.0531.3
,274.0, 336.8,468.7,614.8,534.7
,487.5,172.8
1,299.0
,516.8
1,252.11,313.01,462.71,610.31,529.3
1,472.91,165.01,291.8
,234.3
994.7974.4991.3
1,020.7971.5
963.8778.5843.1
282.5
257.4338.6471.4589.6557.8
509.1386.5448.7
399.3458.4
529.6619.5301.2183.7138.7
324.91,015.21,265.11,344.01,429.8
1,908.11,419.8,445.4,402.1,531.8
,626.6,324.9
1,174.81,314.21,494.6
1,230.11,284.81,439.01,582.91,502.3
1,450.61,141.51,268.4
13.248.857.0
106.8144.7
176.6217.1160.2126.183.6
38.967.1
178.3216.4252.6
328.2186.9229.1216.5250.9
268.7183.4150.1270.3307.0
225.7198.8197.3166.2154.0
159.9129.1141.9
6 20.647.849.8
131.1179.8
231.2
78.891.3
160.371.190.8
191.2148.6141.3156.5307.0
392.9270.7128.3102.1109.3
74.683.377.871.059.2
49.436.852.5
288.5238.5144.462.9
56.6121.7286.4293.2327.0
1,208.3
998.01,064.21,186.61,334.71,285.8
1,239.8971.9
1,080.9
397.7192.8267.9253.7338.6
306.2197.7198.8341.7369.7
242.4243.8221.1190.2182.1
188.9153.0167.2
Monthly totals, unadjusted
1966: Jan....,Feb...Mar....
May"."."June...
July...Aug...Sept—Oct....Nov...Dec...
164.4226.3251.4535.4
620.8401.5159.4234.2234.0
142.9177.8171.2139.3113.6
102.199.2124.3
81.979.0
122.4143.0133.9123.8
100.1103.791.979.175.162.3
80.977.5
120.2140.7130.6121.5
98.4101.589.777.073.761.1
79.476.2
118.1140.9130.0120.6
99.3101.889.176.672.860.2
46.650.483.294.384.779.8
69.169.459.453.550.237.9
32.825.834.946.645.340.8
30.232.429.723.122.622.3
78.574.8
115.9138.6126.7118.2
97.699.686.974.471.458.9
10.210.215.613.912.812.2
10.611.58.78.38.16.9
2.82.23.23.03.33.9
3.43.33.13.13.02.5
76.073.1
117.8114.1107.095.0
77.479.365.961.356.148.9
13.613.817.716.012.813.0
10.611.613.09.98.7
12.5
5.95.49.110.19.4
8.510:48.99.17.06.6
See footnotes at end of table.
256
Digitized for FRASER http://fraser.stlouisfed.org/ Federal Reserve Bank of St. Louis

TABLE B-41.—New housing starts and applications for financing, 1929-67—Continued
[Thousands of units]
Year ormonth
Housing starts
Private andpublic i
Total(farmandnon-
farm)
Non-farm
PrLvate»
Total (farm and nonfarm)
Total
Type ofstructure 2
Onefamily
Two ormore
families
Nonfarm
Total
Governmenthome programs
FHA3 VA
Newprivatehousing
unitsauthor-ized *
Proposedhome con-struction 5
Ap-plica-tionsforFHAcom-mit-
ments 3
Re-questsforVAapprais-
als
Monthly totals, unadjusted
1967:JanFebMarAprMayJune
JulyAugSeptOctNovDec
61.763.292.9115.9134.2131.6
126.1130.2125.8137.0120.083.4
60.462.090.7114.2131.9129.6
124.9126.5123.4134.6118.382.5
1966: Jan—Feb..Mar. .Apr. .May -June.
July..Aug. .Sept..Oct...Nov..D e c .
1967: Jan.. .Feb. .Mar. .Apr. .May..June.
July..Aug_.Sept-Oct—Nov..D e c .
59.161.491.5113.7132.0125.4
125.3127.4121.9135.4118.280.5
40.140.366.679.887.387.6
82.383.778.281.769.146.2
19.021.124.933.944.737.8
43.043.743.753.749.134.3
57.760.289.2112.0129.7123.4
124.0123.6119.5133.1116.579.5
8.68.311.111.114.814.3
12.313.912.614.111.79.4
3.12.93.94.14.75.2
4.85.64.85.34.53.6
54.853.986.493.7105.1109.1
91.8104.997.6105.894.583.3
10.110.716.614.816.016.3
12.717.114.615.312.910.2
7.17.7
10.311.010.912.8
12.211.610.812.59.57.9
Seasonally adjusted annual rates
1,4331,4081,4301,3771,2621,185
1,0791,1081,048845975931
1,1111,1491,0941,1161,2741,233
1,3691,4071,4451,4961,5871,256
913990981892820771
725719694597686633
806802774759839849
862875923913951788
520418449485442414
354389354248289298
305347320357435384
507532522583636468
1,4031,3811,4001,3561,2321,161
1,0611,0881,020824956910
1,0791,1321,0671,0991,2541,214
1,3561,3811,4151,4781,5641,241
181177187151128121
1171139694107105
150139130125143143
139139147152154149
503742353540
373133343637
524850504952
525555575456
1,2681,2061,2711,1931.104960
930852740718719761
942894928
1,0281,0331,109
1,093L. 127i; 1591,2121.158,362
214179160168133127
124119151122135203
157135152162160166
150176178181194168
7292
1119890
99106104119103104
107104103125108135
145124129155136126
1 Military housing starts, including those financed with mortgages insured by FHA under Section 803 of the NationalHousing Act, are included in publicly financed starts but excluded from total private starts and from FHA starts.
2 Not available prior to 1959 except for nonfarm for 1929-44.3 Units are for 1-4 family housing.4 Data beginning 1963 cover approximately 12,000 permit-issuing places. Data for 1959-62 are based on reports from
approximately 10,000 places. In 1963, the additional 2,000 permit-issuing places accounted for almost 50,000 new privatelyowned housing unit authorizations.
5 Units in mortgage applications or appraisal requests for new home construction.• FHA program approved in June 1934: all 1934 activity included in 1935.7 Monthly estimates for September 1945-May 1950 were prepared by Housing and Home Finance Agency.
Sources: Department of Commerce (Bureau of the Census), Department of Housing and Urban Development, FederalHousing Administration (FHA), and Veterans Administration (VA), except as noted.
257
Digitized for FRASER http://fraser.stlouisfed.org/ Federal Reserve Bank of St. Louis
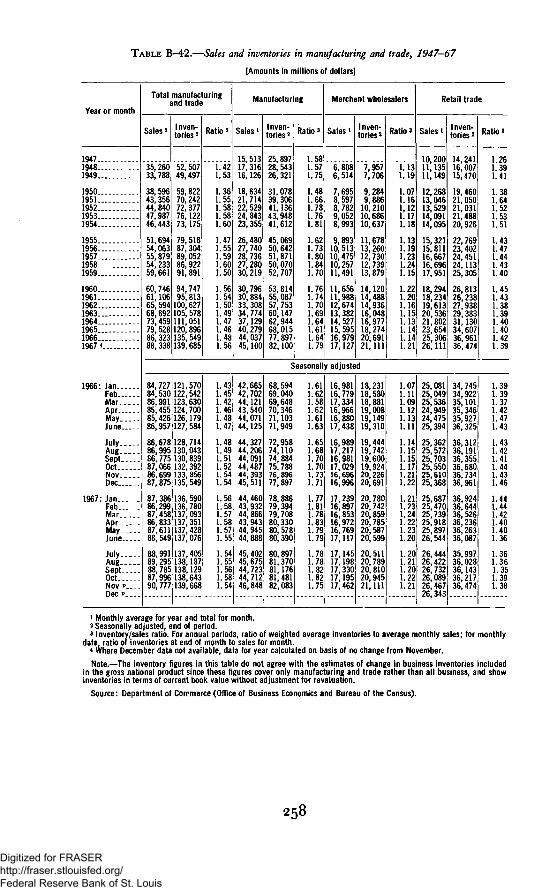
TABLE B-42.—Sales and inventories in manufacturing and trade, 1947-67
[Amounts in millions of dollars]
Year or month
1947...1948...1949—
1950—1951...1952...1953—1954...
1955—1956...1957...19581959—
1960...1961.. .1962...1963...1964...1965...1966...1967 *..
AprMay
1966: Jan..Feb..Mar.AprMay.June..
July..Aug. .Sept..Oct . . .Nov..Dec___
1967: Jan-_F e b —Mar. .Apr.. .May. .June..
July..Aug. .Sept..Oct . . .Nov p_Dec p.
Total manufacturingand trade
Sales »
35,26033,788
38,59643,35644,84047,98746,443
51,69454,06355,87954,23359,661
Inven-tories 2
52,50749,497
59,82270,24272,37776,12273,175
79,51687,30489,05286,92291,891
60,74661,10665,594 100;68,692 105,578
94,74795,8131,627
73,459 111,051" 528 120,896
135,54988J338 139,685
Ratio 3
1.421.53
1.361.551.581.581.60
1.471.551.591.601.50
1.561.541.501.491.471.461.481.56
Manufacturing
Sales i
15,51317,31616,126
18,63421,71422,52924,84323,355
26,48027,74028,73627,28030,219
30,79630,88433,30834,77437,12940,27944,03745,100
Inven-tories 2
25,89728,54326,321
31,07839,30641,13643,94841,612
45,06950,64251,87150,07052,707
53,81455,08757,75360,14762,94468,01577,89782,100
Ratio 3
1.581.571.75
1.481.661.781.761.81
1.621.731.1.841.70
1.761.741.701.691.641.611.641.79
Merchant wholesalers
Sales i
6,514
7,6958,5978,7829,0528,993
9,89310,51310,47510,25711,491
11,65611,98812,67413,38214,52715,59516,97917,127
Inven-tories 2
7,9577,706
9,2849,88610,21010,68610,637
11,67813,26012,73012,73913,879
14,12014,48814,93616,04816,97718,27420,69121,111
Ratios
Retail trade
Sales 1
10,20011,13511,149
12,26813,04613,52914,09114,095
15,32115,81116,66716,69617,951
18,29418,23419,61320,53621,80223,65425,30626,111
Inyen-tories2
14,24116,00715,470
19,46021,05021,03121,48820,926
22,76923,40224,45124,11325,305
26,81326,23827,93829,38331,13034,60736,96136,474
Ratio 3
Seasonally adjusted
84,72784,530 122,'86,99185,45585,42686,957
121,570122,542123,630124,700126,179127,584
86,678 128,71486,995 130,04386,775 130,83987,066 132,39286,699 133,85687,875 135,549
87,386 136,59086,299 136,78087,458 137,09386,833|l37,35187,6111137,42888,549 137,076
88,991 137,40589,295 138,18788,785 138,12987,996 138,64390,777 139,668
1.431.451.421.461.481.47
1.481.491.511.521.541.54
1.561.581.571.581.571.55
1.541.551.561.581.54
42,66542,70244,12143,54044,07144,125
44,32744,20644,09144,48744,39345,511
44,46043,93244,86643,94344,94544,888
45,40245,67544,72344,71246,848
68,59469,04069,64870,34671,10371,949
72,95874,11074,88475,78876.89677.89778,88679,39479,70880,33080, 57880,390
80,89781,37081,17681,48182,083
1.611.621.581.62.61.63
.6568707073
.77
.81
.78
.831.791.79
1.781.781.821.821.75
16,98116,77917,33416,96616,88017,438
16,98917,21716,98117,02916,69616,9%
17,23916,89716,85316,97216,76917,117
18,23118,58018,88119,00819,14919,310
19,44419,74219,60019,92420,22620,691
20,78020,74220,85920,78520,58720,599
17,145 20,51117,198 20,78917,330 20,81017,195 20,94517,462 21,111
1.07.11.09.12.13.11
.15
.15
.17
.21
.22
.21
.23
.24
.22
.23
.20
.20
.21
.20
.221.21
25,08125,04925,53624,94924,47525,394
25,36225,57225,70325,55025,61025,368
25,68725,47025,73925,91825,89726,544
26,44426,42226,73226,08926,46726,343
34,74534,92235,10135,34635,92736,325
36,31236,19136,35536,68036,73436,961
36,92436,64436,52636,23636,26336,087
35,99736,02836,14336,21736,474
1.261.391.41
1.381.641.521.531.51
1.431.471.44.43.40
.45
.43
.381.391.401.401.421.39
1.391.391.371.421.471.43
1.431.421.411.441.431.46
1.441.441.421.401.401.36
1.361.361.351.391.38
1 Monthly average for year and total for month.2 Seasonally adjusted, end of period.3 Inventory/sales ratio. For annual periods, ratio of weighted average inventories to average monthly sales; for monthly
data ratio of inventories at end of month to sales for month.* where December data not available, data for year calculated on basis of no change from November.
Note.—The inventory figures in this table do not agree with the estimates of change in business inventories includedin the gross national product since these figures cover only manufacturing and trade rather than all business, and showinventories in terms of current book value without adjustment for revaluation.
Source: Department of Commerce (Office of Business Economics and Bureau of the Census).
258
Digitized for FRASER http://fraser.stlouisfed.org/ Federal Reserve Bank of St. Louis

TABLE B-43.—Manufacturers* shipments and inventories, 1947-67
[Millions of dollars]
Year or month
1947..1948..1949..
1950..1951..1952..1953-1954..
1955..1956-1957..1958..1959-
1960-1961-1962..1963-1964-
1965..1966-1967 3
1966: J a n . . .Feb—M a r . . .A p r -May . .June..
July..A u g . . .Sept..Oct . .Nov__D e c . .
1967: Jan . . .Feb.. .M a r . . .Apr. . .May. .June..
July..Aug. .Sept..Oct . . .Nov * -Dec p.
Shipments i
Total
15,51317,31616,126
18,63421,71422,52924,84323,355
26,48027,74028,73627,28030,219
30,79630,88433,30834,77437,129
40,27944,03745,100
Dura-ble
goodsindus-tries
6,6947,5797,191
8,84510,49311,31313,34911,828
14,07114,71515,23713,57215,544
15,81715,53217,18418,07119,231
21,02023,00623,000
Non-durablegoodsindus-tries
8,8199,7388,935
9,78911,22111,21611,49411,527
12,40913,02513,49913,70814,675
14,97915,35216,12416,70417,898
19,25821,03222,100
Inventories 2
Total
25,89728,54326,321
31,07839,30641,13643,94841,612
45,06950,64251,87150,07052,707
53,81455,08757,75360,14762,944
68,01577,89782,100
Durable goods industries Nondurable goods industries
Total
13,06114,66213,060
15,53920,99123,73125,87823,710
Mate-rialsandsup-plies
8,9667,894
Workin
process
10,7209,721
26,405 9,194 10,75630,447 10,417 12,31731,728 10,608 12,83730,095 9,847 12,29431,839 10,585 12,952
32,36032,64634,32636,02838,412
42,32450,03753,500
10,28610,23410,57110,87911,688
12,94314,80214,800
12,78013,22514,12914,85715,933
18,10922,26324,700
Fin-ishedgoods
6,2066,040
6,3487,5658,1257,7498,143
9,1909,0889,593
10,29210,791
11,27212,97214,000
Total
12,83613,88113,261
15,53918,31517,40518,07017,902
18,66420,19520,14319,97520,868
21,45422,44123,42724,11924, 532
25,69127,86028,600
Mate-rialsandsup-plies
8,3178,167
8,5568,9718,7758,6719,089
9,1139,5119,7709,7699,619
9,96410,50110,500
Workin
proces:
2,4722,440
2,5712,7212,8642,8002,928
Fin-ishedgoods
7,4097,415
7,6668,6228,6248,4988,857
2,935 9,3533,120 9,7073,304 10,2463,479! 10,8713,522 11,391
3,8624,3334,600
11,86513,02613,500
Seasonally adjusted
42,66542,70244,12L43,54044,07144,125
44,32744,20644,09144,48744,39345,511
44,46043,93244,86643,94344,94544,888
45,40245,67544,72344,71246,848
22,30722,43323,23822,70822,91522,898
23,03122,87422,97123,45123,23723,715
23,06022,62223,13722,26922,90023,052
23,19223,63322,94922,31123,65425,175
20,35820,26920,88320,83221,15621,227
21,29621,33221,12021,03621,15621,796
21,40021,31021,72921,67422,04521,836
22,21022,04221,77422,40123,194
68,59469,04069,64870,34671,10371,949
72,95874,11074,88475,78876,89677,897
78,88679,39479,70880,33080,57880,390
80,89781,37081,17681,48182,083
42,58942,88443,27343,77944,27545,003
45,79046,81447,56848,35249,31050,037
50,62051,07951,21651,59351,78451,809
52,34652,78452,57252,91853,505
12,951 18,285'13,004 18,46812,988 18,80713,146 19,14113,298! 19,30213,507 19,693
11,35311,41211,47811,49211,67511,803
13,653 20,235 11,90213,997! 20,698 12,11914,309! 20,949' 12,31014,465 21,446! 12,44114,599 21,934 12,77714,802 22,263 12,972
14,88014,85614,74814,72114,57614,485
14,53614,66814,59714,71814,779
22,643 13,09722,967 13,25623,140 13,32823,423! 13,44923,5921 13,61623,704 13,620
24,13924,21524,14324,37024,719
13,67113,90113,83213,830,14,007
26,00526,15626,37526,56726,82826,946
27,16827,29627,31627,43627,58627,860
28,26628,31528,49228,73728,79428,581
28,55128,58628,60428, 56328,578
10,02810,07210,15310,30910,43910,562
10,50610,61510,57910,54210,57110,501
10,60910,55310,63710,71210,76710,778
10,66110,72910,71910,58610,551
3,8763,8773,8933,9133,9914,044
12,10112,20712,32912,34512,39812,340
4,062 12,6004,126j 12,5554,169 12,5684,2514,2534,333
4,3494,3491,355t,346,366,421
i,362i,412i,429,539
4,553
12,64312,76213,026
13,30813,41313,50013,67913,66113,382
13,52813,44513,45613,43813,474
year and total for month.2 Book value, seasonally adjusted, end of period.3 Where December data not available, data for year calculated on basis of no change from November.
Source: Department of Commerce, Bureau of the Census.
259
Digitized for FRASER http://fraser.stlouisfed.org/ Federal Reserve Bank of St. Louis

TABLE B-44.—Manufacturers' new and unfilled orders, 1947-67
[Amounts in millions of dollars]
Year or month
New orders1
Total
Durable goodsindustries
TotalMachin-ery andequip-ment
Non-dura-ble
goodsindus-tries
Unfilled orders 2
Total
Dura-ble
goodsindus-tries
Non-dura-ble
goodsindus-tries
Unfilled orders-ship-ments ratio 3
Total
Dura-ble
goodsindus-tries
Non-dura-
blegoodsindus-tries
1947..1948..1949..
1950..1951..1952..1953..1954..
1955..1956..1957..1958..1959..
I960..1961..1962..1963..1964..
1965..1966..1967«.
1966: Jan...Feb..Mar..Apr..May-June.
July..Aug_.Sept-Oct—Nov..Dec.
1967: Jan...Feb..Mar..Apr..May..June..
July..Aug..Sept-Oct...
Dec*-
15,25617,69215,614
20,11023,90723,20323,53322,313
27,42328,38327,51426,90130,679
30,11531,06133,16735,03637,697
41,02345,18245,300
43,98644,12945,83345,06445,32145,833
45,62544,84246,31845,24344,05245,845
43,40843,52743,70043,84945,73846,087
45,97745,90045,27445,78247,088
6,3888,1266,633
10,16512,84112,06112,10510,743
14.95415,38114,07313,17015,951
15,22315,66417,08518,30019,803
21,72824,15323,200
2,0841,770
2,4992,8702,5662,3542,878
2,7912,8543,0903,3263,706
4,1404,7314,700
8,8689,5668,981
9,94511,066il,14211,42811,570
12,46913,00213,44113,73114,728
14,89215,39716,08216,73617,895
19,29521,02922,100
34,41530,71724,506
43,05569,78575,64961,17848,266
60,00467,37553,18348,88254,494
46,13348,34346,78449,79657,044
66,06879,91781,800
28,53226,60120,018
36,83865,83572,48058,63745,250
56,24163,88050,35245,73950,654
43,40145,17344,09446,67653,958
62, 53476,41578,500
5,8834,1164,488
6,2173,9503,1692,5413,016
3,7633,4952,8313,1433,840
2,7323,1702,6903,1203,086
3,5343,5023,300
3.42
3.633.873.35
2.522.442.362.45
2.612.952.98
Seasonally adjusted
4.12
4.274.554.00
3.012.942.852.96
3.163.623.68
23,57823,74124,88824,19724,27624,593
24,37123,51225,27424,24423,02723,960
22,07222,32922,06522,22623,85724,263
23,71523,72623,41623,38123,84326,111
4,4504,5844,5874,7884,8454,753
5,0924,8134,9064,8164,6474,603
4,5454,2424,3154,4434,6074,794
4,8535,0584,6654,6144,8725,133
20,40820,38820,94520,86721,04521,240
21,25421,33021,04420,99921,02521,885
21,33621,19821,63521,62321,88121,824
22,26222,17421,85822,40123,245
67,38868,81470,52772,04973,29775,009
76,31076,94279,17079,92379,58179,917
78,86378,45577,29077,19477,98879.188
79,76479,98580,53781,61081,849
63,80365,11066,76268,25069,60971,308
72,65173,28675,59176,38276,17076,415
75,42775,13174,06074,01674,97376,185
76,71076,80177,26878,34078, 526
3,5853,7043,7653,7993,6883,701
3,6593,6563,5793,5413,4113,502
3,4363,3243,2303,1783,0153,003
3,0543,1843,2693,2703,323
2.652.712.692.782.792.86
2.832.892.973.002.992.95
2.952.992.903.002.953.03
2.982.963.073.122.98
3.213.283,253.373.403.50
3.493.543.643.673.673.62
3.643.683,583.733.693.74
3.713.633.783.883.68
0.96
1.121.04.85
.76
.65
.66
.61
.64
.58
.54
0.65.68.66.68.64.64
.61
.62
.61
.60
.58
.58
.57
.57
.55
.54
.49
.52
.50
.54
.57
.55
.54
1 Monthly average for year and total for month.2 Seasonally adjusted, end of period.3 Ratio of unfilled orders at end of period to shipments for period. Annual figures relate to seasonally adjusted data
for December.<Where December data not available, data for year calculated on basis of no change from November.Source: Department of Commerce, Bureau of the Census.
260
Digitized for FRASER http://fraser.stlouisfed.org/ Federal Reserve Bank of St. Louis

PRICES
TABLE B-45.—Consumer price indexes, by major groups, 1929-67
For city wage earners and clerical workers
[1957-59=100]
Year or month
1929
1930193119321933193419351936193719381939
1940194119421943 . -194419451946194719481949 . .
19501951195219531954 .1955195619571958 . -1959
196019611962 -19631964196519661967
1966: Jan_.FebMar..AprMayJune
JulyAug .SeptOct .NovDec
1967: JanFebMar.AprMayJune
JulyAugSeptOctNovDec
Allitems
59.7
58.253 047.645.146 647 848.350.049 148.4
48 851.356.860.361.362.768.077 883.883.0
83.890.592.593.293.693.394 798.0
100.7101.5
103 1104 2105.4106.7108.1109 9113 1116.3
111.0111 6112.0112.5112.6112.9
113.3113.8114.1114.5114 6114.7
114 7114.8115.0115.3115 6116.0
116 5116.9117.1117.5117.8118.2
Food
55.6
52.943.636.335.339 342.142.544.241.039.9
40.544.251.957.957.158.466.981 388.284.7
85.895.497.195.695.494.094 797.8
101.9100.3
101 4102 6103.6105.1106.4108 8114 2115.2
111.4113 1113.9114.0113.5113.9
114.3115.8115.6115.6114 8114.8
114 7114.2114.2113.7113 9115.1
116 0116 6115.9115.7115.6116.2
Housing
Total
56.357.159.160.159.7
59.961.464.264.966.467.569.374.579.881.0
83.288.289.992.393.494.195.598.5
100.2101.3
103 1103.9104.8106.0107.2108 5111 1114.3
109.2109 4109.6110.3110.7111.1
111.3111.5111.8112.2112 6113.0
113 1113.3113.3113.6113 9114 1
114 3114 7115.0115.3115.5116.0
Rent
85.4
83.178.770.660.857 056.958.360.962 963.0
63.264.365.765.765.966.166.568 773.276.4
79.182.385.790.393.594.896.598.3
100.1101.6
103 1104 4105.7106.8107.8108.9110 4112.4
109.7109 8109.9110.1110.2110.2
110.3110.6110.7111.0111 2111.3
111 4111.7111.8111.9112 1112 2
112 4112 6112.8113.0113.2113.5
Appareland
upkeep
55.3
54.149.243.642.146 146.546.949.349.048.3
48.851.159.662.266.770.176.989 295.091.3
90.198.297.296.596.395.997 899.599.8
100.6
102 2103 0103.6104.8105.7106.8109 6114.0
107.3107 6108.2108.7109.3109.4
109.2109.2110.7111.5112 0112.3
111.3111.9112.6113.0113 8113.9
113.7113.8115.1116.0116.6116.8
Trans-porta-tion
49.449.850.651.049.8
49.551.255.755.555.555.458.364.371.677.0
79.084.089.692.190.889.791 396.599.7
103.8
103 8105.0107.2107.8109.3111.1112 7115.9
111.2111 1111.4112.0112.0112.2
113.5113.5113.3114.3114 5113.8
113.4113.8114.2115.1115.5115.7
116.2116.4116.8117.7118.3117.9
Medicalcare
49.449.650.050 250.2
50 350.652.054.556.257.560.765 769.872.0
73.476.981.183.986.688.691 895.5
100.1104.4
108 1111.3114.2117.0119.4122.3127 7136.7
124.2124 5125.3125.8126.3127.0
127.7128.4129.4130.4131 3131.9
132.9133.6134.6135.1135.7136.3
136.9137.5138.5139.0139.7140.4
Personalcare
42.643.245.746 746.5
46 447.652.257.661.763.668.276 279.178.9
78.986.387.388.188.590.093 797.1
100.4102.4
104 1104 6106.5107.9109.2109.9112 2115.5
110.4110 8111.0111.6112.0112.2
112.5112.7113.0113.3113.4113.7
113.8114.1114.4114.9115.0115.3
115.5116.1116.4116.5116.9117.2
Readingand
recrea-tion
50 251.052.554 354.4
55.457.360.065.072.075.077.582.586.789.9
89.392.092.493.392.492.193.496.9
100.8102.4
104.9107.2109.6111.5114.1115.2117.1120.1
115.7115.9116.6116.8116.8117.0
117.2117.4117.5118.0118.3118.4
118.5118.6118.9119.4119.6119.7
119.8120.0120.5121.4122.0122.2
Othergoodsand
services
52 752.654.054 555.4
57 158.259.963.064.767.369.575 478.981.2
82.686.190.692.894.394.395.898.599.8
101.8
103.8104.6105.3107.1108.8111.4114.9118.2
113.4113.6113.8114.3114.7114.9
115.3115.5115.7115.9116.0115.9
116.2116.3116.4116.6116.7116.9
117.8118.8119.7120.3121.0121.4
Source: Department of Labor, Bureau of Labor Statistics.
26l
Digitized for FRASER http://fraser.stlouisfed.org/ Federal Reserve Bank of St. Louis
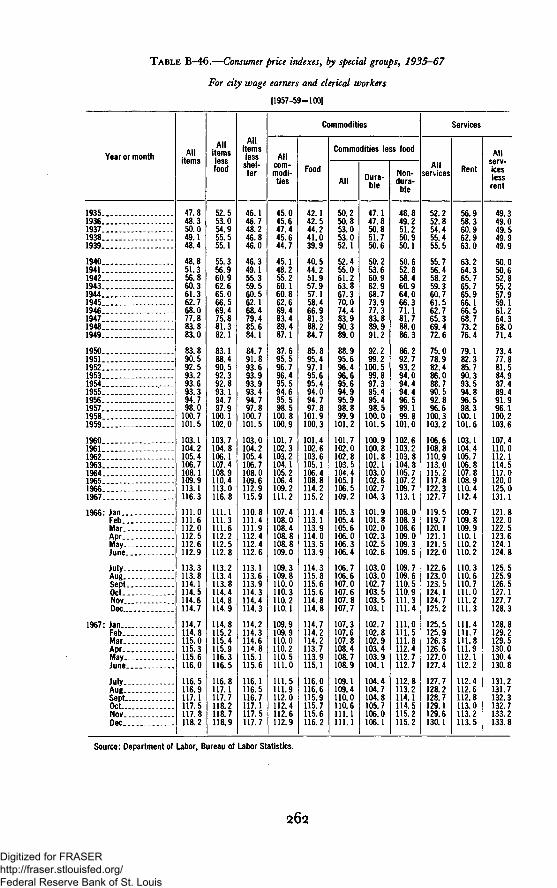
TABLE B-46.—Consumer price indexes, by special groups, 1935—67
For city wage earners and clerical workers
[1957-59=100]
Year or month
1935193619371938 .1939
1940194119421943194419451946194719481949
195019511952195319541955 - - . .1956195719581959
I9601961196219631964196519661967
1966: JanFebMarAprMay.June
July . . .AugSeptOct . .NovDec
1967: Jan.. .FebMarAprMayJune
July . . . . . .AugSeptOctNovDec
Allitems
47.848.350.049.148.4
48.851.356.860.361.362.768.077.883.883.0
83.890.592.593.293.693.394.798.0
100.7101.5
103.1104.2105.4106.7108.1109.9113.1116.3
111.0111.6112.0112.5112.6112.9
113.3113.8114.1114.5114.6114.7
114.7114.8115.0115.3115.6116.0
116.5116.9117.1117.5117.8118.2
Allitemslessfood
52.553.054.955.555.1
55.356.960.962.665.066.569.475.881.382.1
83.188.490.592.392.893.194.797.9
100.1102.0
103.7104.8106.1107.4108.9110.4113.0116.8
111.1111.3111 6112.2112.5112.8
113.2113.4113.8114.4114 8114.9
114.8115.2115.4115.9116.3116.5
116.8117.1117.7118.2118.7118.9
Allitemsless
shel-ter
46.146.748.246.846.0
46.349.155.359.560.562.168.479.485.684.1
84.791.893.693.993.993.494.797.8
100.7101.5
103.0104.2105.4106.7108.0109.6112.9115.9
110.8111.4111.9112.4112.4112.6
113.1113.6113.9114.3114 4114.3
114.2114.3114.6114.8115.1115.6
116.1116.5116.7117.1117.5117.7
Commodities
Allcom-modi-ties
45.045.647.445.644.7
45.148.255.260.160.862.669.483.489.487.1
87.695.596.796.495.594.695.598.5
100.8100.9
101.7102.3103.2104.1105.2106.4109.2111.2
107.4108.0108.4108.8108.8109.0
109.3109.8110.0110.3110 2110.1
109.9109.9110.0110.2110.5111.0
111.5111.9112.0112.4112.6112.9
Food
42.142.544 241.039.9
40.544.251.957.957.158.466.981.388.284.7
85.895.497.195.695.494.094.797.8
101.9100.3
101.4102.6103.6105.1106.4108.8114.2115.2
111.4113.1113.9114.0113.5113.9
114.3115.8115.6115.6114.8114.8
114.7114.2114.2113.7113.9115.1
116.0116.6115.9115.7115.6116.2
Commodities less food
All
50.250.853.053.052.1
52.455.061.263.867.370.074.483.990.389.0
88.995.696.496.695.694.995.998.899.9
101.2
101.7102.0102.8103.5104.4105.1106.5109.2
105.3105.4105.6106.0106.3106.4
106.7106.6107.0107.6107.8107.7
107.3107.6107.8108.4108.7108.9
109.1109.4110.0110.6111.1111.1
Dura-ble
47.147.850.851.750.6
50.253.660.962.968.773.977.383.889.991.2
92.299.2
100.599.897.395.495.498.5
100.0101.5
100.9100.8101.8102.1103.0102.6102.7104.3
101.9101.8102.0102.3102.5102.6
103.0103.0102.7103.5103.5103.1
102.7102.8102.9103.4103.9104.1
104.4104.7104.8105.7106.0106.1
Non-dura-
ble
48.849.251 250.950.1
50.652.858.460.964.066.371.181.788.086.3
86.292.793.294.094.494.496.599.199.8
101.0
102.6103.2103.8104.8105.7107.2109.7113.1
108.0108.3108.6109.0109.3109.5
109.7109.6110.5110.9111.3111.4
111.0111.5111.8112.4112.7112.7
112.8113.2114.1114.5115.2115.2
Services
Allservices
52.252.854 455 455.5
55.756.458.259 360.761.562.765.369.472.6
75.078.982.486.088.790.592.896.6
100.3103.2
106.6108.8110 9113.0115.2117.8122.3127.7
119.5119.7120.1121.1121.5122.0
122.6123.0123.5124.1124.7125.2
125.5125.9126.3126.6127.0127.4
127.7128.2128.7129.1129.6130.1
Rent
56.958.360 962.963.0
63.264.365.765 765.966.166.568.773.276.4
79.182.385.790.393.594.896.598.3
100.1101.6
103.1104.4105.7106.8107.8108.9110.4112.4
109.7109.8109.9110.1110.2110.2
110.3110.6110.7111.0111.2111.3
111.4111.7111.8111.9112.1112.2
112.4112.6112.8113.0113.2113.5
Allserv-iceslessrent
49.349.049 549 949.9
50 050.652.855 257 959.161.264 368.071.4
73.477.881.584.987 489.491.996.1
100.2103.6
107.4110.0112 1114 5117.0120.0125.0131.1
121.8122.0122.5123.6124.1124.8
125.5125.9126.5127.1127.7128.3
128.8129.2129.5130.0130.4130.8
131.2131.7132.3132.7133.2133.8
Source: Department of Labor, Bureau of Labor Statistics.
262
Digitized for FRASER http://fraser.stlouisfed.org/ Federal Reserve Bank of St. Louis

TABLE B—47.—Consumer price indexes, selected commodities and services, 1935-67
For city wage earners and clerical workers
[1957-59 = 100]
Year ormonth
193519361937... .19381939
1940194119421943..1944.... . .19451946....19471948 .1949
1950....195119521953.... . .195419551956195719581959
19601961196219631964 . .196519661967
1966: Jan.. .Feb...Mar...Apr.May...June..
July...Aug...Sept..Oct...Nov...Dec. .
1967: Jan.. .F e b . .Mar...A p r -May...June..
July...Aug...Sept..Oct...Nov...Dec...
Durable commodities
Total
47.147.850.851.750.6
50.253.660.962.968.773.977.383.889.991 2
92.299.2
100.599.897.395 495.498.5
100.0101.5
100.9100.8101.8102.1103.0102.6102.7104.3
101.9101.8102.0102.3102.5102.6
103.0103.0102.7103.5103.5103.1
102.7102.8102.9103.4103.9104.1
104.4104.7104.8105.7106.0106.1
Newcars
40 340 641.443 442.4
42.545.7
67.974.281 2
81.885.793.194.092.589 291.796.599.6
103.9
102.5102.5102.1101.5101.299.097.298.1
97.497.297.197.497.096.8
96.795.894.498.499.398.6
97.697.397.297.096.996.8
97.096.996.1
101.1101.4101.3
Usedcars
108.492.287 283.994.097.4
108.8
101.6105.6115.2116.6121.6120.8117.8121.5
114.8114.0115.4117.4117.5118.2
120.3122.1120.1120.8119.3114.2
113.0114.0115.9118.8121.4122.4
124.8125.2126.2126.0125.6124.8
House-holddura-bles
51.252 156.756 755.6
54.958.765.768 274.680 384.993.999.997.2
98.4107.8105.0103.8101.098 397.999.6
100.3100.2
100.198.998.898.598.496.996.898.2
96.196.196.296.496.796.7
96.997.097.397.497.697.7
97.697.797.898.098.198.0
98.198.298.498.798.899.1
Housefur-nish-ings
48.048 852.852 451.3
50.954.461.963.669.173 980.693.499.195.7
96.3106.8104.2103.7101.9100 098.9
100.599.899.8
100.199.598.998.598.497.998.8
100.8
97.697.898.098.398.598.6
98.898.999.399.599.9
100.0
99.7100.0100.3100.6100.6100.7
100.8100.8101.2101.5101.8102.1
Nondurable commod-ities less food
Total
48.849.251.250.950.1
50.652.858.460.964.066.371.181.788.086.3
86.292.793.294.094.494 496.599.199.8
101.0
102.6103.2103.8104.8105.7107.2109.7113.1
108.0108.3108.6109.0109.3109.5
109.7109.6110.5110.9111.3111.4
111.0111.5111.8112.4112.7112.7
112.8113.2114.1114.5115.2115.2
Apparelcom-mod-ities
46.747.249.849 448.6
49.251.760.463.267.671.278.590.996.592.7
91.6100.299.198.097.597 098.699.799.7
100.6
102.0102.6103.0104.0104.9105.8108.5113.0
106.2106.5107.1107.6108.3108.3
108.1107.9109.7110.4110.9111.2
110.1110.7111.5111.9112.7112.8
112.6112.7114.1115.1115.7115.9
Non-dura-bleslessfoodand
apparel
51.451.953.253 152.4
52.954.757.860.261.963.165.874.981.881.9
82.587.689.391.692.592 895.198.899.9
101.3
102.8103.3104.2105.3106.2108.0110.3113.1
109.1109.3109.4109.8110.0110.1
110.6110.5111.0111.2111.5111.6
111.6111.9112.0112.7112.6112.7
113.0113.4114.1114.2114.8114.7
Services less rent
Total
49.349.049.549.949.9
50.050.652.855.257.959.161.264.368.071.4
73.477.881.584.987.489 491.996.1
100.2103.6
107.4110.0112.1114.5117.0120.0125.0131.1
121.8122.0122.5123.6124.1124.8
125.5125.9126.5127.1127.7128.3
128.8129.2129.5130.0130.4130.8
131.2131.7132.3132.7133.2133.8
House-holdserv-iceslessrent
90.495.7
100.8103.6
108.0109.2110.6113.0114.8117.0121.5127.0
117.9118.1118.5120.2120.9121.7
122.1122.4123.0123.5124.2124.9
125.1125.5125.6126.0126.5126.7
127.0127.5128.1128.4128.6129.1
Trans-porta-tionserv-ices
46.646.245.946.246.4
46.346 649.149.149.049 150.151.757.764.2
68.474.880.185.288.989 190.594.8
100.8104.3
107.0109.5111.2112.4115.0119.3124.3128.4
122.5122.6122.6123.0123.0123.2
125.0125.3125.5125.9126.1126.5
126.9127.2127.4127.6127.7128.1
128.3128.8128.9129.2130.0130.4
Med-icalcareserv-ices
46.346.547.147.247.3
47.347.649.051.653.755.258.463.367.670.1
71.775.380.183.085.588 091.495.3
100.0104.8
109.1113.1116.8120.3123.2127.1133.9145.6
129.5129.9130.8131.4132.1133.0
133.9134.7136.2137.4138.6139.4
140.6141.6142.9143.6144.4145.2
146.0146.7148.0148.7149.6150.4
Other*
93.597.2
100.2102.6
106.2109.7112.6115.3118.5121.8126.5131.5
123.8124.1125.0125.5125.9126.4
126.7127.1127.5128.2128.5128.9
129.1129.4129.7130.3130.8131.3
131.6131.9132.4133.1133.9134.3
1 Includes the services components of apparel, personal care, reading and recreation, and other goods and services.
Source: Department of Labor, Bureau of Labor Statistics.
263
Digitized for FRASER http://fraser.stlouisfed.org/ Federal Reserve Bank of St. Louis

TABLE B-48.— Wholesale price indexes, by major commodity groups, 1929-67
[1957-59=100]
Year or month
1929
1930 - -193119321933193419351936193719381939
1940 . .194119421943194419451946194719481949
1950195119521953195419551956 - -195719581959
I960 .19611962196319641965 -. -.19661967
1966: JanFebMarAprMayJune
JulyAugSeptOct -.NovDec
1967* JanFebMarApr . . .MayJune
JulyAugSeptOctNovDec
All com-modities
52.1
47.339.935.636.141.043.844.247.243.042.2
43.047.854.056.556.957.966.181.287.983.5
86.896.794.092.792.993.296.299.0
100.4100.6
100.7100.3100.6100.3100.5102.5105.9106.1
104.6105.4105.4105.5105.6105.7
106.4106.8106.8106.2105.9105.9
106.2106.0105.7105.3105.8106.3
106.5106.1106.2106.1106.2106.8
Farmproducts
63.9
54.039.629.431.339.948.049.452.741.939.9
41.350.164.674.875.378.390.6
109.1117.1101.3
106.4123.8116.8105.9104.497.996.699.2
103.697.2
96.996.097.795.794.398.4
105.699.7
104.5107.4106.8106.4104.5104.2
107.8108.1108.7104.4102.5101.8
102.6101.099.697.6
100.7102.4
102.899.298.497.196.498.9
Processedfoods and
feeds
92.699.190.0
93.2103.5102.397.699.395.094.897.6
102.599.9
100.0101.6102.7103.3103.1106.7113.0111.7
111.5113.0112.2111.5111.8112.0
113.8115.7115.5113.9112.6112.8
112.8111.7110.6110.0110.7112.6
113.1112.1112.7111.7110.9111.5
Industrial commodities
Total
51 7
48.142.439 740.244.244.044.948.146.146.0
46.850.353.954.755.656.361.775.381.780.0
82.991.589.490.190.492.496.599.299.5
101.3
101.3100.8100.8100.7101.2102.5104.7106.3
103.5103.8104.0104.3104.7104.9
105.2105.2105.2105.3105.5105.5
105.8106.0106.0106.0106.0106.0
106.0106.3106.5106.8107.1107.4
Textileproducts
andapparel
67 8
60.349.841.248.654.753.353.757.350.152.3
55.463.772.873.173.975.187.3
105.7110.3100.9
104.8116.9105.5102.8100.6100.7100.7100.898.9
100.4
101.599.7
100.6100.5101.2101.8102.1102.1
101.9102.0102.1102.2102.2102.2
102.4102.4102.2102.2102.1101.8
102.0102.0101.8101.8101.6101.6
101.5101.7102.0102.2103.0103.8
Hides,skins,
leather,and
relatedproducts
56 6
52 044.738 042 044.946.549 554.348.249.6
52.356.161.161.060.561.370.796.597.592.5
99.9114.892.894.189.989.594.894.996.0
109.1
105.2106.2107.4104.2104.6109.2119.7115.8
116.0117.8118.7120.6122.8122.9
122.7121.2119.9118.7117.5117.3
117.9118.0116.9115.7115.2115.6
115.2114.4114.4114.8115.4116.0
Fuels andrelated
products,and
power
61 5
58 250.052 149.354.354.556 557.556.654.2
53.256.658 259.961.662.366.779.793 889.3
90.293.593.395.994.694.597.4
102.798.798.7
99.6100.7100.299.897.198.9
101.3103.6
100.5100.399.9
100.0100.4101.5
101.4102.0102.2102.6102.7102.4
102.6103.4103.7103.3104.4104.0
103.9104.7104.5103.0102.8102.6
Chemicalsand alliedproducts
46 648.850.951 253 651.050.7
51.656.162 363.163.864 269.492.294 486.2
87.5100.195.096.197.396.997.599.6
100.4100.0
100.299.197.596.396.797.497.898.4
97.697.697.697.697.797.6
97.997.998.097.998.098.2
98.498.598.598.898.898.5
98.398.097.998.298.298.4
See footnotes at end of table.
264
Digitized for FRASER http://fraser.stlouisfed.org/ Federal Reserve Bank of St. Louis

TABLE B-48.—Wholesale price
Year or month
1929
1930193119321933193419351936193719381939
1940194119421943194419451946194719481949 .
195019511952 .1953195419551956 -195719581959
19601961 .196219631964 .196519661967
1966: Jan . . . . .FebMarAprMay . . . . .June „
July.AugSept . - .OctNovDec
1967: JanFebMarApr . . .MayJune
JulyAugSeptOctNovDec
Rubberand
rubberproducts
57.6
50 442.837.139 045.545.849.458.157.159.3
55.359.669.471.370 468.368.668.370.568.3
83.2102.192.586.387.699.2
100.6100.2100.199.7
99.996.193.393.892.592.994.897.0
93.794.194.395.495.495.4
95.195.194.794.695.095.0
95.695.895.995.995.895.8
95.897.898.298.899.199.2
Lumberand
woodproducts
26.4
24 119.616 920 023.522.623.627.925.426.1
28.934.537.539.742.843.449.777.488.581.9
94.1102.599.599.497.6
102.3103.898.597.4
104.1
100.495.996.598.6
100.6101.1105.6105.4
102.8103.7105.6108.4109.6107.7
106.6106.2105.9104.8103.0102.5
102.6103.6103.6104.1104.2104.7
105.3106.1108.7107.3106.7107.6
indexes, by major commodity groups}
[1957-59=100]
Industrial commodities—Continuec
Pulp,paper,and
alliedproducts
75.378.675.2
77.191.389.088.788.891.197.299.0
100.1101.0
101.898.8
100.099.299.099.9
102.6104.0
101.2101.3101.8102.3102.7103.0
103.2103.2103.1103.1103.0103.0
103.1103.3103.6103.9103.9103.9
104.1104.0104.1104.3104.6104.8
Metalsand
metalproducts
44.1
39 735.732.833 637.137.037.843.241.641.2
41 442.242.842.742.743.448.560 268.569.0
72.780.981.083.684.390.097.899.799.1
101.2
101.3100.7100.0100.1102.8105.7108.3109.5
107.0107.5108.0108.2108.4108.7
108.8108.5108.4108.6109.0109.0
109.4109.6109.4109.1108.9108.9
109.0109.2109.6109.8110.5111.0
Machin-ery andequip-ment
46.2
46.347.147.847.447.147.251.960.065.168.2
70.578.878.980.782.184.691.597.9
100.0102.1
102.9102.8102.9103.1103.8105.0108.2111.8
106.0106.5106.9107.2107.8108.1
108.3108.5108.9109.4110.2110.7
111.1111.2111.5111.6111.6111.6
111.6111.8111.9112.2112.6113.2
Furni-ture andhouse-hold
durables
56.4
55 551.145.045 149.048.649.354.753.453.2
54.457.862.562.163 863.967.877.882.583.8
85.692.891.192.993.994.396.999.4
100.2100.4
100.199.598.898.198.598.099.1
101.0
98.398.498.498.698.998.9
99.099.199.299.7
100.3100.4
100.4100.4100.6100.6100.8100.8
100.9101.0101.2101.7102.0102.1
1929-67— Continued
J
Nonme-tallic
mineralproducts
53.4
53 249.746.549 252.652 652.753.952.251.2
51.252.454.554.755.858.161.869.174.776.7
78.683.583.586.988.891.395.298.999.9
101.2
101.4101.8101.8101.3101.5101.7102.6104.3
102.0102.1102.1102.3102.4102.5
102.7102 7103.0103.2103.3103.3
103.6103.7103.8103.9103.8103.9
104.2104.5104.7104.9105.1105.3
Trans-portationequip-ment:Motor
vehiclesand
equip-ment̂
42.8
40 338.337 335 637 536.035.738 240.840.0
41.344.248.248.248 549.457.265 572.477.4
77.081.185.885.485.688.293.297.2
100.3102.5
101.0100.8100.8100.0100.5100.7100.8102.1
100.5100.4100.3100.2100.9100.7
100.7100.5100.1101.7101.7101.7
101.6101.6101.6101.6101.6101.4
101.3101.3101.5103.7104.0104.0
Miscel-laneousproducts
80 383.685.2
86.691.791.293.694.494.595.898.6
100.6100.8
101.7102.0102.4103.3104.1104.8106.8109.2
105.4105.4106.5106.7106.8106.9
107.1107 1107.1107 2107.4107.5
107.9108.0107.7108.0108.0109.6
109.7110.0110.2110.5110.6110.7
* Index for total transportation equipment not available.Source: Department of Labor, Bureau of Labor Statistics.
265
Digitized for FRASER http://fraser.stlouisfed.org/ Federal Reserve Bank of St. Louis
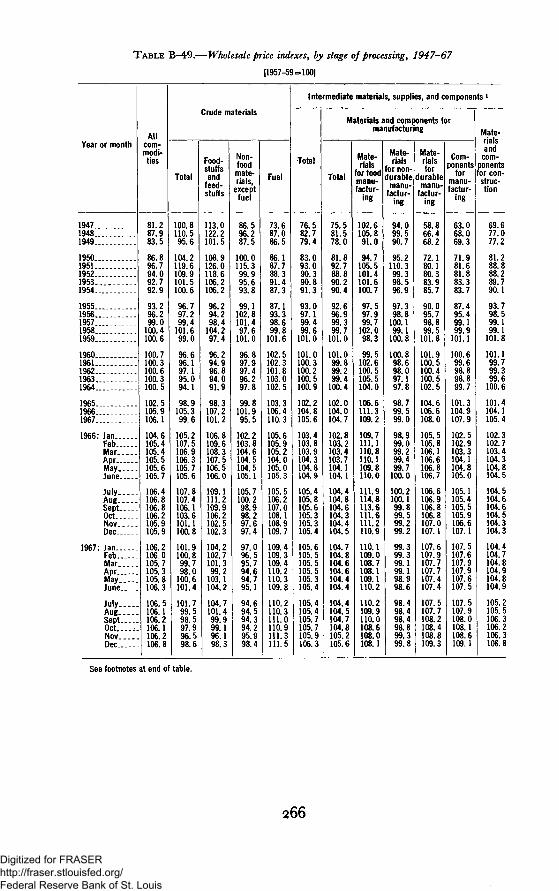
TABLE B—49.—Wholesale price indexes, by stage of processing, 1947—67
[1957-59=100}
Year or month
194719481949..
19501951195219531954.
19551956..195719581959 . .
19601961. .196219631964
196519661967
81.287.983.5
86.896.794.092.792.9
93.296.299.0
100.4100.6
100.7100.3100.6100.3100.5
102.5105.9106.1
1966: Jan...Feb...Mar__A p r -May..June..
July..Aug..Sept..Oct...Nov-_Dec—
May."..
1967: Jan.Feb.Mar.Apr.May.June..
July..Aug..Sept..Oct...Nov..Dec...
Allcom-modi-ties
104.6105.4105.4105.5105.6105.7
106.4106.8106.8106.2105.9105.9
106.2106.0105.7105.3105.8106.3
106.5106.1106.2106.1106.2106.8
Crude materials
Total
100.8110.595.6
104.2119.6109.9101.5100.6
96.797.299.4
101.699.0
96.696.197.195.094.1
98.9105.399.6
105.2107.5106.9106.3105.7105.6
107.8107.4106.1103.6101.1100.8
101.9100.899.798.0
100.6101.4
101.799.598.597.996.598.6
Food-stuffsand
feed-stuffs
113.0122.2101.5
108.9126.0118.6106.2106.2
96.294.298.4
104.297.4
96.294.996.894.091.9
98.3107.2101.2
106.8109.6108.3107.5106.5106.0
109.1111.2109.9106.2102.5102.3
104.2102.7101.399.2
103.1104.2
104.7101.499.999.196.198.3
Non-foodmate-rials,
exceptfuel
86.596.287.5
100.0115.399.995.693.8
99.1102.8101.497.6
101.0
96.897.997.496.297.8
99.8101.995.5
102.2103.8104.6104.5104.5105.1
105.7100.298.998.297.697.4
97.096.595.794.694.795.1
94.694.594.394.295.998.4
Fuel
73.687.086.5
86.187.788.391.487.3
87.193.398.699.8
101.6
102.5102.3101.8103.0102.5
103.3106.4110.3
105.6105.9105.2104.0105.0105.3
105.5106.2107.0108.1108.9109.7
109.4109.3109.4110.2110.3109.8
110.2110.3111.0110.9111.3111.5
Intermediate materials, supplies, and components *
Total
76.582.779.4
83.093.090.390.891.3
93.097.199.499.6
101.0
101.0100.3100.2100.5100.9
102.2104.8105.6
103.4103.8103.9104.3104.8104.9
105.4105.8105.6105.3105.3105.4
105.6105.5105.5105.5105.3105.4
105.4105.4105.7105.7105.9106.3
Materials and components formanufacturing
Total
75.581.578.0
81.892.788.890.290.4
92.696.999.399.7
101.0
101.099.899.299.4
100.4
102.0104.0104.7
102.8103.2103.4103.7104.1104.1
104.4104.8104.6104.3104.4104.5
104.7104.8104.6104.6104.4104.4
104.4104.5104.7104.8105.2105.6
Mate-rials
for foodmanu-factur-
ing
durable durable
102.6105.891.0
94.7105.5101.4101.6100.7
97.597.999.7
102.098.3
99.5102.6100.5105.5104.0
106.6111.3109.2
109.7111.1110.8110.1109.8110.0
111.9114.8113.6111.6111.2110.9
110.1109.0108.7108.1109.1110.2
110.2109.9110.0108.6108.0108.1
Mate-rials
for non-
manu-factur-
ing
94.099.590.7
95.2110.399.398.596.9
97.398.8
100.199.1
100.8
100.898.698.097.197.8
98.799.599.0
98.999.099.299.499.7
100.0
100.2100.199.899.599.299.2
99.399.399.199.198.998.6
98.498.498.498.899.399.8
Mate-rialsfor
manu-factur-
ing
58.866.468.2
72.180.180.383.985.7
90.095.798.899.5
101.8
101.9100.5100.4100.5102.5
104.6106.6108.0
105.5105.8106.1106.6106.8106.7
106.6106.9106.8106.8107.0107.1
107.6107.9107.7107.7107.4107.4
107.5107.7108.2108.4108.8109.3
Com-ponents
formanu-factur-
ing
63.068.069.3
71.981.681.883.383.7
87.495.499.199.9
101.1
100.699.698.898.899.7
101.3104.9107.9
102.5102.9103.3104.1104.8105.0
105.1105.4105.5105.9106.6107.1
107.5107.6107.9107.9107.6107.5
107.5107.9108.0108.1108.6109.1
Mate-rialsand
com-ponentsfor con-struc-tion
69.677.077.2
81.288.888.289.790.1
93.798.599.199.1
101.8
101.199.799.399.6
100.6
101.4104.1105.4
102.3102.7103.4104.3104.8104.5
104.5104.6104.6104.5104.3104.3
104.4104.7104.8104.9104.8104.9
105.2105.5106.3106.2106.3106.8
See footnotes at end of table.
266
Digitized for FRASER http://fraser.stlouisfed.org/ Federal Reserve Bank of St. Louis

TABLE B-49.—Wholesale price indexes, by stage of processing, 1947-67—Continued
11957-59=1001
Year or month
194719481949
19501951195219531954
195519561957 . . . .19581959
19601961196219631964
196519661967
1966*JanFebMarAprMayJune
JulyAugSeptOctNovDec
1967: JanFebMarAprMayJune
JulyAugSeptOctNovDec
Total
80.186.484.0
85.593.693.092.192.3
92.595.198.6
100.8100.6
101.4101.4101.7101.4101.8
103.6106.9108.2
105.6106.3106.4106.3106.2106.4
107.0107.5108.1107.8107.8107.6
107.7107.6107.2107.0107.6108.4
108.7108.3108.7108.6108.9109.3
Finishec1 goods
Consumer finished goods
Total
86.192.688.3
89.898.297.095.495.3
94.796.198.9
101.0100.1
101.1100.9101.2100.7100.9
102.8106.4107.0
105.2106.0106.1105.9105.6105.7
106.4107.1107.8107.2107.0106.6
106.6106.5106.0105.7106.4107.4
107.7107.2107.6107.2107.5107.9
Foods
90.799.091.0
92.8104.2103.397.997.1
94.794.597.8
103.598.7
100.8100.4101.3100.1100.6
104.5111.2109.5
109.5111.5111.5110.7109.6109.5
111.2112.8114 5112.2111.3110.5
110.3109.3107.9106.9108.5110.9
111.5109.6110.5108.8109.1110.1
Othernon-
durablegoods
86.592.088.2
89.696.594.195.095.3
95.897.799.999.3
100.8
101.5101.5101.6101.9101.6
102.8104.8107.2
103.9104.0104.1104.3104.5104.9
105.0105.2105 4105.5105.7105.5
105.8106.3106.4106.4106.9107.2
107.4108.0108.0107.8107.9108.0
Du-rablegoods
75.981.183.2
84.189.790.491.191.8
92.895.998.7
100.1101.3
100.9100.5100.099.599.9
99.6100.2101.7
99.799.799.799.8
100.2100.1
100.2100.1100.0100.9101.2101.3
101.3101.3101.3101.3101.3101.0
101.1101.2101.4102.8103.0103.0
Pro-ducer
finishedgoods
61.867.470.7
72.479.580.882.183.1
85.692.097.7
100.2102.1
102.3102.5102.9103.1104.1
105.4108.0111.5
106.2106.6106.8107.0107 6107.9
108.1108.3108 4109.1109.8110.2
110.5110.6110.7110.8111.1111.2
111.2111.4111.6112.6113.0113.4
Special groups of industrialproducts
Crudemate-rials 2
79.292.584.0
93.6102.993.192.488.0
96.6102.3100.996.9
102.3
98.397.295.694.397.1
100.9104.5100.0
104.0105 7106.6106.1105 9106.5
106.4103.3102 8102.8102.7101.6
101.4101.1100.299.399.499.4
99.099.099.599.4
100.6101.3
Inter-mediate
materials,supplies,and com-ponents3
73.479.877.8
81.491 288.389.489.8
92.597.099.699.4
101.0
101.4100.199.999.6
100.2
101.5103.6104 8
102.4102 6102.9103.4103 8103.9
104.0104.2104 1104.1104.1104.1
104.4104.6104.6104.7104.6104.5
104.5104.6104.9105.0105.3105.7
Con-sumer
finishedgoods ex-
cludingfoods
83.188.486.5
87.894 292 993.794.1
94 897.199.599 6
100.9
101.3101.2101.0101.0100.9
101.6103.2105 2
102.4102 4102.5102.8103 0103.2
103.3103.4103 5103.9104.1104.0
104.2104.5104.5104.6104.8104.9
105.1105.5105.6106.0106.1106.2
1 Includes, in addition to subgroups shown, processed fuels and lubricants, containers, and supplies.2 Excludes crude foodstuffs and feedstuffs, plant and animal fibers, oilseeds, and leaf tobacco.3 Excludes intermediate materials for food manufacturing and manufactured animal feeds.Note.—For a listing of the commodities included in each sector, see Table 2B, "Wholesale Prices and Price Indexes,"
1963 (BLS Bulletin 1513).Source: Department of Labor, Bureau of Labor Statistics.
267
Digitized for FRASER http://fraser.stlouisfed.org/ Federal Reserve Bank of St. Louis

MONEY SUPPLY, CREDIT, AND FINANCETABLE B-50.—Money supply, 1947-67
{Averages of daily figures, billions of dollars]
Year and month
Totalmoneysupply
andtime
depos-itsad-
justed
Money supply
Total
Cur-rencycom-po-
nent^
De-mand
depositcom-
ponent 2
Timede-
positsad-
just-
Totalmoneysupply
andtime
depos-itsad-
justed
Money supply
Total
Cur-rencycom-po-
nent 1
De-mand
depositcom-
ponents
Timede-
positsad-
just-ed 3
U.S.Gov-ern-mentde-
mandde-pos-its «
Seasonally adjusted Unadjusted
1947: Dec.1948: Dec.1949: Dec.
1950: Dec.1951: Dec.1952: Dec.1953: Dec.1954: Dec.
1955: Dec.1956: Dec.1957: Dec.1958: Dec.1959: Dec.
1960: Dec.1961: Dec.1962: Dec.1963: Dec.1964: Dec.
1965: Dec.1966: Dec.1967: Dec p.
1966: Jan...Feb..Mar-Apr..May..June-July..Aug..Sept.Oct...Nov..Dec.
1967: Jan. .Feb..Mar_.Apr -May.June.
July.Aug..Sept.Oct..Nov.Dec*
148.5147.5147.6
152.9160.9168.5173.3180.6
185.2188.8193.3206.5209.3
213.9228.1245.2265.2285.9
313.7329.0365.3
315.5316.6319.0322.3323.6324.5
325.7327.1327.9327.7327.5329.0
331.1335.0339.2340.8344.4348.6
352.5356.3358.2361.1363.7365.3
113.1111.5111.2
116.2122.7127.4128.8132.3
135.2136.9135.9141.1141.9
141.1145.4147.4153.0159.3
166.8170.4181.5
167.9168.3169.2170.5170.2170.6
169.9170.1170.5170.1170.1170.4
170.3171.5173.1172.7174.5176.2
177.9179.1179.2180.3181.2181.5
26.425.825.1
25.026.127.327.727.4
27.828.228.328.628.9
28.929.630.632.534.2
36.338.340.4
36.636.736.937.137.337.4
37.737.837.938.038.138.3
38.538.738.939.139.239.3
39.539.639.839.940.040.4
86.785.886.0
91.296.5
100.1101.1104.9
107.4108.7107.6112.6113.1
112.1115.9116.8120.5125.1
130.5132.1141.1
131.4131.6132.3133.4132.9133.2
132.3132.4132.6132.1132.0132.1
131.8132.8134.2133.6135.3136.8
138.4139.6139.5140.3141.2141.1
35.436.036.4
36.738.241.144.548.3
50.051.957.465.467.4
72.982.797.8
112.2126.6
146.9158.6183.8
147.5148.3149.8151.8153.45154.0
155.7156.9157.4157.6157.4158.6
160.8163.5166.1168.1170.0172.4
174.6177.2178.9180.8182.5183.8
151.0150.0150.0
155.6163.8171.7176.3183.6
188.2191.7196.0209.3212.2
216.8231.2248.2268.2289.2
317.3332.7369.0
320.4316.4318.1323.9320.9323.1
324.2324.5327.1327.6327.6332.7
336.0334.6338.7342.4341.9347.3
351.0353.6357.3360.8363.6369.0
115.9114.3113.9
119.2125.8130.8132.1135.6
138.6140.3139.3144.7145.6
144.7149.4151.6157.3164.0
172.0175.8187.2
173.0167.7167.8171.5166.7168.6
168.0167.0169.7170.5171.5175.8
175.3170.6171.9173.6171.1174.3
175.8175.9178.4180.6182.5187.2
26.826.225.5
25.426.627.828.227.9
28.428.828.929.229.5
29.630.231.233.135.0
37.139.141.2
36.536.436.536.837.037.3
37.837.837.938.138.539.1
38.538.338.538.738.939.3
39.639.639.840.040.441.2
89.188.188.4
93.899.2
103.0103.9107.7
110.2111.5110.4115.5116.1
115.2119.2120.3124.1129.1
134.9136.7146.0
136.5131.3131.2134.7129.7131.4
130.1129.2131.8132.4133.0136.7
136.8132.3133.4134.9132.2135.1
136.2136.2138.6140.6142.1146.0
35.135.736.1
36.438.040.944.248.0
49.651.456.764.666.6
72.181.896.7
111.0125.2
145.2156.9181.8
147.4148.7150.4152.4154.2«154.4
156.2157.4157.4157.1156.1156.9
160.7164.0166.7168.8170.8173.0
175.1177.7178.9180.3181.1181.8
1.01.82.8
2.42.74.93.85.0
3.43.43.53.94.9
4.74.95.65.15.5
4.63.45.0
3.85.14.53.07.16.1
8.05.14.34.83.73.4
4.15.04.94.86.53.9
5.64.35.06.25.25.0
1 Currency outside the Treasury, the Federal Reserve System, and the vaults of all commercial banks.2 Demand deposits at all commercial banks, other than those due to domestic commercial banks and the U.S. Govern-
ment, less cash items in process of collection and Federal Reserve float, plus foreign demand balances at Federal Reservebanks.
s Time deposits adjusted are time deposits at all commercial banks other than those due to domestic commercial banksand the U.S. Government.
4 Deposits at all commercial banks.5 Effective June 1966, balances accumulated for payment of personal loans are reclassified for reserve purposes and are
excluded from time deposits reported by member banks. The estimated amount of such deposits at all commercial banks($1.1 billion) is excluded from time deposits adjusted thereafter.
Source: Board of Governors of the Federal Reserve System.
268
Digitized for FRASER http://fraser.stlouisfed.org/ Federal Reserve Bank of St. Louis

TABLE B-51.—Bank loans and investments, 1929-67[Billions of dollars]
End of year or month 1
1929«1930s1931 5
1932 5
1933 5
1934 5193519361937.193819391940194119421943.. .1944194519461947 . . . .1948
1948.1949 . .1950195119521953.1954..195519561957.1958 . . .195919601961.1962 6 . . .1963619641965...19661967 61966: Jan
Feb .MarApr.MayJuneJulyAug. .SeptOctNovDec
1967: Jan .FebMarAprMayJuneJulyAug. . . .SeptOctp .Nov v . .Dece
All commercial banks
Total loansand invest-
ments 2
49.448.944.936 130.432.736 139.638.438.740.743.950.767.485.1
105.5124.0114.0116.3114.2
Loans 2
35.734.529.221.816.315.715.216.417.216.417.218.821.719.219.121.626.131.138.142.4
Investments
U.S. Govern-ment securities
4.95.06.06.27.5
10.313.815.314.215.116.317.821.841.459.877.690.674.869.262.6
Othersecurities
8.79.49.78.16.56.77.17.97.07.27.17.47.26.86.16.37.38.19.09.2
Seasonally adjusted
113.0118.7124.7130.2133.1143.1153.1157.6161.6166.4181.2185.9194.5209.6227.9246.2267.2294.4
7 310.2344.4297.0298.6300.1302.1303.7
7 306.8307.5309.9309.4308.9309.3310.2314.4318.0321.4323.2324.6325.6332.4337.3339.5342.6344.3344.4
41.542.051.156.562.866.269.180.688.191.595.6
107.5113.8120.5134.1149.7167.7192.4
7 207.8224.0194.6196.7198.4200.6202.3
7 203.4204.5205.8206.2207.2207.5207.8210.4211.0211.3213.5213.5213.9217.1218.2220.2221.8222.3224.0
62.366.461.160.462.262.267.660.357.256.965.157.959.865.264.561.560.757.353.760.057.456.556.055.354.154.954.556.054.953.453.453.754.255.957.856.156.155.458.861.861.662.361.860.0
9.210.312.413.414.214.716.416.816.317.920.520.520.823.929.235.038.744.8
7 48.760.445.045.545.746.247.3
7 48.548.548.048.348.448.448.749.951.152.353.655.056.356.557.357.758.660.260.4
Weekly re-porting largecommercial
banks3
Business loans4
5.14.24.75.37.16.36.46.57.3
11.314.715.6
15.613.917.921.623.423.422.426.730.831.831.730.732.232.935.238.842.1
3 53.160.765.852.953.655.255.056.057.858.758.359.459.560.060.760.360.462.062.361.863.863.762.263.463.163.765.8
1 Data are for last Wednesday of month (except June 30 and December 31 call dates used for all commercial banks).2 Adjusted to exclude interbank loans beginning 1948.3 Loans by weekly reporting large commercial banks beginning 1965 and formerly weekly reporting member banks. See
"Federal Reserve Bulletin," March 1967. ,. .< Commercial and industrial loans and prior to 1956, agricultural loans. Beginning July 1959, loans to financial institu-
tions excluded. Prior to 1943, published data adjusted to include open market paper.5 June data used because complete end-of-year data not available.6 Commercial bank data are estimates for December 31.7 Effective June 1966, balances accumulated for paymen1 of personal loans (about $1.1 billion) are excluded from loans
at all commercial banks, and certain certificates of CCC and Export-Import Bank totaling about $1 billion are included inother securities rather than in loans.
Source: Board of Governors of the Federal Reserve System.
284-593 0—68- -18269
Digitized for FRASER http://fraser.stlouisfed.org/ Federal Reserve Bank of St. Louis
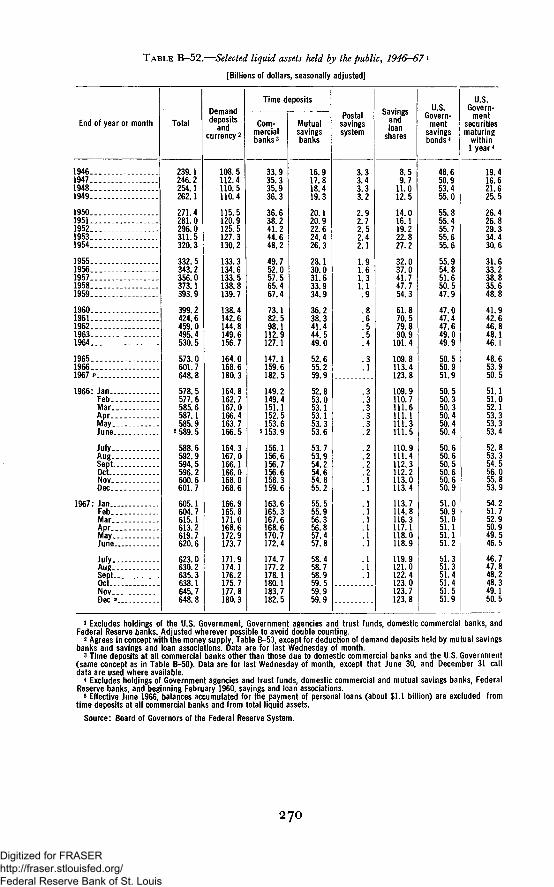
TABLE B-52.—Selected liquid assets held by the public, 1946-671
[Billions of dollars, seasonally adjusted]
End of year or month
1946..1947..1948..1949..
1950..1951..1952.1953.1954.
1955.1956.1957.1958.1959.
1960.1961.1962.1963.1964.
1965...1966...1967 P.
1966: Jan . . .Feb_.Mar . .Apr . . .May. .June-July..Aug. .Sept..Oct.. .Nov..Dec. . .
1967: Jan. . .Feb. .Mar . .Apr . .May. .June-
July. . .Aug . . .Sept...Oct. . . .Nov.- .Dec p..
Total
239.1246.2254.1262.1
271.4281.0296.0311.5320.3
332.5343.2356.0373.1393.9
399.2424.6459.0495.4530.5
573.0601.7648.8
578.5577.6585.6587.1585.9
s 589.5
588.6592.9594.5596.2600.6601.7
605.1604.7615.1613.2619.7620.6
623.0630.2635.3638.1645.7648.8
Demanddeposits
andcurrency 2
108.5112.4110.5110.4
115.5120.9125.5127.3130.2
133.3134.6133.5138.8139.7
138.4142.6144.8149.6156.7
164.0168.6180.3
164.8162.7167.0166.4163.7166.5
164.3167.0166.1166.0168.0168.6
166.9165.8171.0168.6172.9173.7
171.9174.1176.2175.7177.8180.3
Time deposits
Com-mercialbanks 3
33.935.335.936.3
36.638.241.244.648.2
49.752.057.565.467.4
73.182.598.1
112.9127.1
147.1159.6182.5
149.2149.4151.1152.5153.6
M53.9
156.1156.6156.7156.6158.3159.6
163.6165.3167.6168.6170.7172.4
174.7177.2178.1180.1183.7182.5
Mutualsavingsbanks
16.917.818.419.3
20.120.922.624.426.3
28.130.031.633.934.9
36.238.341.444.549.0
52.655.259.9
52.853.053.153.153.353.6
53.753.954.254.654.855.2
55.555.956.356.857.457.8
58.458.758.959.559.959.9
Postalsavingssystem
3.33.43.33.2
2.92.72.52.42.1
1.91.61.31.1.9
.8
.6
.5
.5
.4
.3
.1
.3
.3
.3
.3
.3
.2
.2
.2
.2
.2
.1
.1
.1
.1
.1
.1
.1
.1
.1
.1
.1
Savingsand
shares
8.59.7
11.012.5
14.016.119.222.827.2
32.037.041.747.754.3
61.870.579.890.9
101.4
109.8113.4123.8
109.9110.7111.6111.1111.3111.5
110.9111.4112.3112.2113.0113.4
113.7114.8116.3117.1118.0118.9
119.9121.0122.4123.0123.7123.8
U.S.Govern-
mentsavingsbonds*
48.650.953.455.0
55.855.455.755.655.6
55.954.851.650.547.9
47.047.447.649.049.9
50.550.951.9
50.550.350.350.450.450.4
50.650.650.550.650.650.9
51.050.951.051.151.151.2
51.351.351.451.451.551.9
U.S.Govern-
mentsecuritiesmaturing
within1 year4
19.416.621.625.5
26.426.829.334.430.6
31.633.238.835.648.8
41.942.646.848.146.1
48.653.950.5
51.151.052.153.353.353.4
52.853.354.556.055.853.9
54.251.752.950.949.546.5
46.747.848.248.349.150.5
1 Excludes holdings of the U.S. Government, Government agencies and trust funds, domestic commercial banks, andFederal Reserve banks. Adjusted wherever possible to avoid double counting.
2 Agrees in concept with the money supply, Table B-53, except for deduction of demand deposits held by mutual savingsbanks and savings and loan associations. Data are for last Wednesday of month.
3 Time deposits at all commercial banks other than those due to domestic commercial banks and the U.S. Government(same concept as in Table B-50). Data are for last Wednesday of month, except that June 30, and December 31 calldata are used where available.
< Excludes holdings of Government agencies and trust funds, domestic commercial and mutual savings banks, FederalReserve banks, and beginning February 1960, savings and loan associations.
s Effective June 1966, balances accumulated for the payment of personal loans (about $1.1 billion) are excluded fromtime deposits at all commercial banks and from total liquid assets.
Source: Board of Governors of the Federal Reserve System.
270
Digitized for FRASER http://fraser.stlouisfed.org/ Federal Reserve Bank of St. Louis

T A B L E B—53.—Federal Reserve Bank credit and member bank reserves, 1929—67
[Averages of daily figures, millions of dollars]
Year and month
Reserve Bank credit outstanding
TotalU.S.
Govern-ment se-curities
Memberbank
borrow-ings
Allother,mainlyfloat
Member bank reserves
Total Re-quired Excess
Memberbank freereserves(excessreservesless bor-rowings)
1929: Dec.
1930: Dec.1931: Dec.1932: Dec.1933: Dec.1934: Dec.1935: Dec.1936: Dec.1937: Dec.1938: Dec.1939: Dec.
1940:1941:1942:1943:1944:1945:1946:1947:1948:1949:
1950:1951:1952:1953:1954:1955:1956:1957:1958:1959:
Dec.Dec.Dec.Dec.Dec.Dec.Dec.Dec.Dec-Dec.
Dec.Dec.Dec.Dec.Dec.Dec.Dec.Dec.Dec.Dec.
1960: Dec..1961: Dec.1962: Dec.1963: Dec.1964: Dec.1965: Dec.1966: Dec.1967: Dec*
1966: Jan..Feb..Mar.Apr..
June..
July..Aug..Sept..Oct...Nov..Dec...
1967: Jan—Feb..Mar . .Apr . .M a y -June.
Ju ly -Aug. .Sept..Oct...Nov..Dec p.
1,643
1,2731,9502,1922,6692,4722,4942,4982,6282,6182,612
2,3052,4046,03511,91419,61224,74424,74622,85823,97819,012
21,60625,44627,29927,10726,31726,85327,15626,18628,41229,435
29,06031,21733,21836,61039,87343,85346,86451,268
43,44943,11642,94343,33943,89144,498
45,73745,34845,63145,60446,08746,864
46,80246,58746,52446,90247,32347,547
48,59048,21048,14748,99349,75251,268
446
644777
1,8542,4322,4302,4302,4342,5652,5642,510
2,1882,2195,54911,16618,69323,70823,76721,90523,00218,287
20,34523,40924,40025,63924,91724,60224,76523,98226,31227,036
27,24829,09830,54633,72937,12640,88543,76048,891
40,62640,63540,39840,62941,12941,672
42,22142,28042,73542,83743,34743,760
44,06644,21544,62045,08245,69945,844
46,80746,61246,39847,36748,01048,891
801
33776328195106716
3
35490265334157224134118
142657
1,593441246839688710557906
87149304327243454557238
402478551626722674
766728766733611557
389362199134101123
878990126133238
396
29241057142325857474799
114180483659654702821729842607
1,1191,3801,3061,0271,1541,4121,7031,4941,5431,493
1,7251,9702,3682,5542,5042,5142,5472,139
2,4212,0031,9942,0842,0402,152
2,7502,3402,1302,0342,1292,547
2,3472,0101,7051,6861,5231,580
1,6961,5091,6591,5001,6092,139
2,395
2,4152,0692,4352,5884,0375,7166,6656,8798,745
11,473
14,04912,81213,15212,74914,16816,02716.51717,26119,99016,291
17,39120,31021,18019,92019,27919,24019,53519,42018,899
M8,932
19,28320,11820,04020,74621,60922,71923,83025,256
22,75022,23322,16022,52822,48722,534
23,09022,65523,24023,33323,25123,830
24,07523,70923,40523,36223,28423.518
23,90723,79124,20024,60824,73825,256
2,347
2,3422,0101,909
U,8222,2902,7334,6195,8085,5206,462
7,4039,42210,77611,70112,88414,53615,61716,27519,19315,488
16,36419,48420,45719,22718,57618,64618,88318,84318,38318,450
18,52719,55019,46820,21021,19822,26723,43824,915
22,39221,86221,85522,17022,11722,212
22,68222,31722,84223,03122,86223,438
23,70223,35122,97023,05322,91423,098
23,54823,40423,84224,32224,33724,915
48
7360
5261766
1,7482,9832,0461,0713,2265,011
6,6463,3902,3761,0481,2841,491
900986797803
1,027826723693703594652577516482
756568572536411452392341
358371305358370322
408338398302389392
373358435309370420
359387358286403341
-753
-264-703245671
1,7382,9772,0391,0553,2195,008
6,6433,3852,372958
1,0191,157743762663685
885169
-870252457
-245-36-133-41-424
419268209168- 2
-165103
-44-107-246-268-352-352
-358-390-368-431-222-165
-16- 4236175269297
272298268160270103
* Data from March 1933 through April 1934 are for licensed banks only.2 Beginning December 1959, total reserves held include vault cash allowed.Source: Board of Governors of the Federal Reserve System.
271
Digitized for FRASER http://fraser.stlouisfed.org/ Federal Reserve Bank of St. Louis
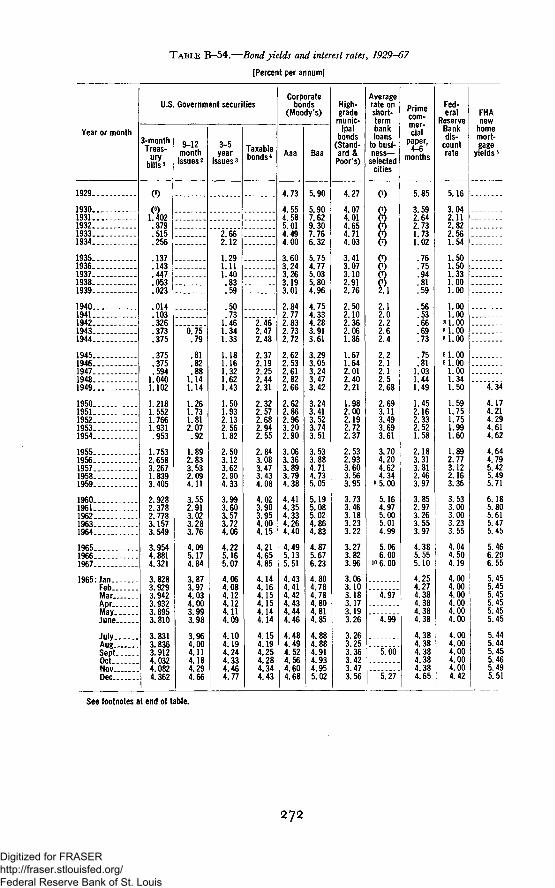
TABLE B-54.—Bond yields and interest rates, 1929-67
[Percent per annum]
Year or month
1929
193019311932. . . .19331934
193519361937..19381939
1940 .1941194219431944
19451946194719481949 - - . .
1950195119521953 .1954
19551956195719581 9 5 9 . .
I96019611962 .19631964
196519661967
1965'JanFebMar
May"June
JulyAugSeptOctNovDec
U.S
3-monthTreas-
urybills i
1 402.879.515.256
.137143
.447
.053
.023
.014
.103326
. 373
.375
375.375
5941.0401.102
1 2181.5521 7661.931
.953
1.7532.6583.2671 8393.405
2.9282.3782.7783.1573.549
3.9544.8814.321
3.8283 9293.9423.9323 8953.810
3.8313.8363.9124 0324.0824.362
Government securities
9-12month
issues2
0.75.79
81.82
881.141.14
1 261.731 812.07
.92
1.892.833.532.094.11
3.552.913.023.283.76
4.095.174.84
3 873 974.034.003 993.98
3.964.004.114 184.294.66
3-5year
issues3
2.662.12
1.291 111.40.83.59
.50
.731.461.341.33
1.181.161 321.621.43
1.501.932.132.561.82
2.503.123.622.904.33
3.993.603.573.724.06
4.225.165.07
4.064 084.124.124 114.09
4.104.194.244.334.464.77
Taxablebonds4
2.462.472.48
2.372.192 252.442.31
2.322.572 682.942.55
2.843.083.473.434.08
4.023.903.954.004.15
4.214.654.85
4.144 164.154.154 144.14
4.154.194.254.284.344.43
Corporatebonds
(Moody's)
Aaa
4.73
4.554.585 014.494.00
3.603.243 263.193.01
2.842.772.832.732.72
2.622.532 612.822.66
2.622.862.963.202.90
3.063.363.893.794.38
4.414.354.334.264.40
4.495.135.51
4.434 414.424.434 444.46
4.484.494.524.564.604.68
Baa
5.90
5.907.629 307.766.32
5.754.775 035.804.96
4.754.334.283.913.61
3.293.053 243.473.42
3.243.413.523.743.51
3.533.884.714.735.05
5.195.085.024.864.83
4.875.676.23
4.804.784.784.804 814.85
4.884.884.914.934.955.02
High-grademunic-
ipalbonds
(Stand-ard &Poor's)
4.27
4.074.014 654.714.03
3.413.073.102.912.76
2.502.102.362.061.86
1.671.642.012.402.21
1.982.002.192.722.37
2.532.933.603.563.95
3.733.463.183.233.22
3.273.823.96
3.063.103.183.173.193.26
3.263.253.363.423.473.56
Averagerate onshort-termbankloans
to busi-ness-
selectedcities
0
0)C)
2.12.02.22.62.4
2.22.12.12.52.68
2.693.113.493.693.61
3.704.204.624.34
9 5.00
5.164.975.005.014.99
5.066.00
io 6.00
4.97
4.99
5.00
5.27
Primecom-
cialpaper,
months
5.85
3.592.642 731.731.02
.76
.7594
.81
.59
.56
.53
.66
.69
.73
.75
.811 031.441.49
1.452.162.332.521.58
2.183.313.812.463.97
3.852.973.263.553.97
4.385.555.10
4.254.274.384.384.384.38
4.384.384.384.384.384.65
Fed-eral
ReserveBankdis-
countrate
5.16
3.042.112.822.561.54
1.501.501.331.001.00
1.001.00
8 1.008 1.008 1.00
8 1.008 1.00
1.001.341.50
1.591.751.751.991.60
1.892.773.122.163.36
3.533.003.003.233.55
4.044.504.19
4.004.004.004.004.004.00
4.004.004.004.004.004.42
FHAnew
homemort-gage
yields 5
4.34
4.174.214.294.614.62
4.644.795.425.495.71
6.185.805.615.475.45
5.466.296.55
5.455.455.455.455.455.45
5.445.445.455.465.495.51
See footnotes at end of table.
272
Digitized for FRASER http://fraser.stlouisfed.org/ Federal Reserve Bank of St. Louis
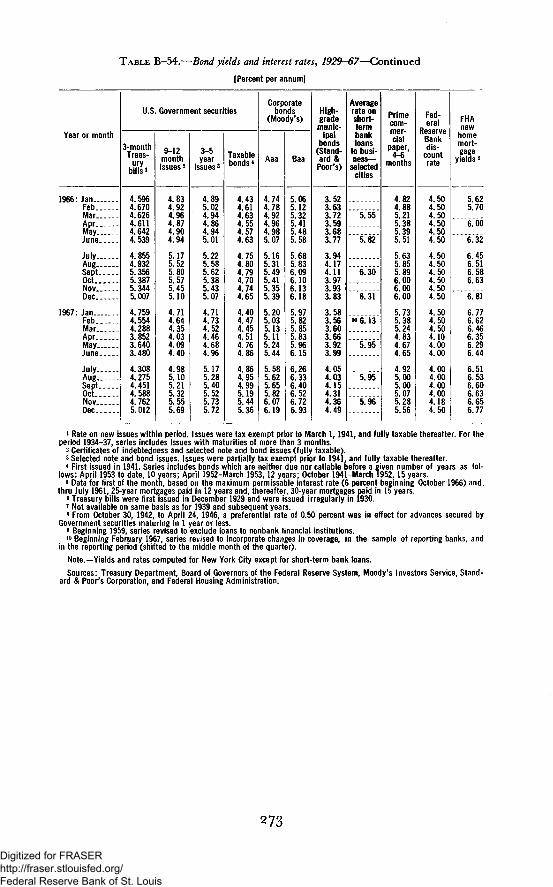
TABLE B-54.—Bond yields and interest rates, 1929-67— Continued
[Percent per annum]
Year or month
1966: JanFebMarAprMayJune
JulyAugSeptOctNovDec
1967: JanFebMarAprMay -June
JulyAugSeptOctNovDec
U.S. Government securities
3-monthTreas-
urybills i
i
i
1.5961.6701.6261.6111.6421.539
1.8551.9325.3565.3875.3445.007
1.7591.5541.2883.8523.6405.480
1.3081.2751.4511.5881.7625.012
9-12monthissues 2
4.834.924.964.874.904.94
5.175.525.805.575.455.10
4.714.644.354.034.094.40
4.985.105.215.325.555.69
3-5year
issues3
4.895.024.944.864.945.01
5.225.585.625.385.435.07
4.714.734.524.464.684.96
5.175.285.405.525.735.72
Taxablebonds4
4.434.614.634.554.574.63
4.754.804.794.704.744.65
4.404.474.454.514.764.86
4.864.954.995.195.445.36
Corporatebonds
(Moody's)
Aaa
4.744.784.924.964.985.07
5.165.315.495.415.355.39
5.205.035.135.115.245.44
5.585.625.655.826.076.19
Baa
5.065.125.325.415.485.58
5.685.836.096.106.136.18
5.975.825.855.835.966.15
6.266.336.406.526.726.93
High-grademunic-
ipalbonds
(Stand-ard &
Poor's)
3.523.633.723.593.683.77
3.944.174.113.973.933.83
3.583.563.603.663.923.99
4.054.034.154.314.364.49
Averagerate onshort-termbankloans
to busi-ness-
selectedcities
5.55
5.82
6.30
6.31
M 6.13
5.95
5.95
5.%
Primecom-mer-cial
paper,
months
4.824.885.215.385.395.51
5.635.855.896.006.006.00
5.735.385.244.834.674.65
4.925.005.005.075.285.56
Fed-eral
ReserveBankdis-
countrate
4.504.504.504.504.504.50
4.504.504.504.504.504.50
4.504.504.504.104.004.00
4.004.004.004.004.184.50
FHAnew
homemort-gage
yields s
5.625.70
6.00
6.32
6.456.516.586.63
6.81
6.776.626.466.356.296.44
6.516.536.606.636.656.77
1 Rate on new issues within period. Issues were tax exempt prior to March 1,1941, and fully taxable thereafter. For theperiod 1934-37, series includes issues with maturities of more than 3 months.
2 Certificates of indebtedness and selected note and bond issues (fully taxable).3 Selected note and bond issues. Issues were partially tax exempt prior to 1941, and fully taxable thereafter.4 First issued in 1941. Series includes bonds which are neither due nor callable before a given number of years as fol-
lows: April 1953 to date, 10 years; April 1952-March 1953,12 years; October 1941-March 1952, 15 years.5 Data for first of the month, based on the maximum permissable interest rate (6 percent beginning October 1966) and,
thru July 1961, 25-year mortgages paid in 12 years and, thereafter, 30-year mortgages paid in 15 years.6 Treasury bills were first issued in December 1929 and were issued irregularly in 1930.7 Not available on same basis as for 1939 and subsequent years.s From October 30, 1942, to April 24, 1946, a preferential rate of 0.50 percent was in effect for advances secured by
Government securities maturing in 1 year or less.9 Beginning 1959, series revised to exclude loans to nonbank financial institutions.10 Beginning February 1967, series revised to incorporate changes in coverage, in the sample of reporting banks, and
in the reporting period (shifted to the middle month of the quarter).
Note.—Yields and rates computed for New York City except for short-term bank loans.
Sources: Treasury Department, Board of Governors of the Federal Reserve System, Moody's Investors Service, Stand-ard & Poor's Corporation, and Federal Housing Administration.
273
Digitized for FRASER http://fraser.stlouisfed.org/ Federal Reserve Bank of St. Louis
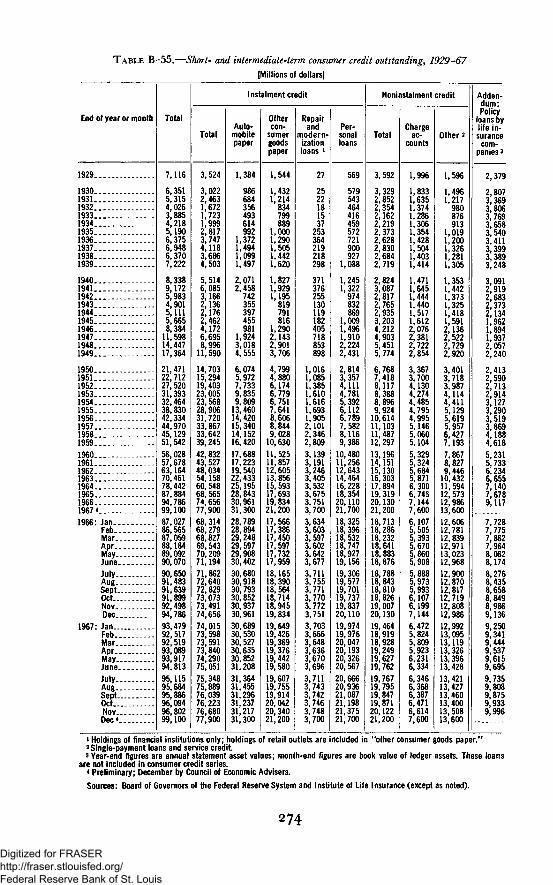
TABLE B-55.—Short- and intermediate-term consumer credit outstanding, 1929-67[Millions of dollars]
End of year or month Total
7,116
6,3515,3154,0263,8854,2185,1906,3756,9486,3707,222
8,3389,1725,9834,9015,1115,6658,384
11,59814,44717,364
21,47122,71227,52031,39332,46438,83042,33444,97045,12951,54256,02857,67863,16470,46178,44287,88494,78699,10087,02786,56587,05988,18489,09290,07090,65091,48391,63991,89992,49894,78693,47992,51792,51993,08993,91794,81395,11595,68495,88696,09496,80299,100
Instalment credit
Total
3,524
3,0222,4631,6721,7231,9992,8173,7474,1183,6864,503
5,5146,0853,1662,1362,1762,4624,1726,6958,996
11,590
14,70315,29419,40323,00523,56828,90631,72033,86733,64239,24542,83243,52748,03454,15860,54868,56574,65677,90068,31468,27968,82769,54370,20971,19471,86272,64072,82973,07373,49174,65674,01573,59873,59173,84074,29075,05175,34875,88976,03976,22376,68077,900
Auto-mobilepaper
1,384
986684356493614992
1,3721,4941,0991,497
2,0712,458
742355397455981
1,9243,0184,555
6,0745,9727,7339,8359,809
13,46014,42015,34014,15216,42017,68817,22319,54022,43325,19528,84330,96131,30028,78928,89429,24829,59729,90830,40230,68030,91830,79330,85230,93730,96130,68930,53030,52730,63530,85231,20831,36431,45531,29631,23731,21731,300
Othercon-
sumergoodspaper
1,544
1,4321,214
834799889
1,0001,2901,5051,4421,620
1,8271,9291,195
819791816
1,2902,1432,9013,706
4,7994,8806,1746,7796,7517,6418,6068,8449,028
10,63011,52511,85712,60513,85615,59317,69319,83421,20017,56617,38617,45017,59717,73217,95918,16518,39018, 56418,71418,94519,83419,64919,42619,36919,37619,44219,58019,60719,75519,91420,04220,34021,200
Repairand
modern-izationloans *
27
2522181537
253364219218298
371376255130119182405718853898
1,0161,0851,3851,6101,6161,6931,9052,1012,3462,8093,1393,1913,2463,4053,5323,6753,7513,7003,6343,6033,5973,6023,6423,6773,7113,7553,7713,7703,7723,7513,7033,6663,6483,6363,6703,6963,7113,7433,7423,7463,7483,700
Per-sonalloans
569
579543464416459572721900927
1,088
1,2451,322
974832869
1,0091,4961,9102,2242,431
2,8143,3574,1114,7815,3926,1126,7897,5828,1169,386
10,48011,25612,64314,46416,22818,35420,11021,70018,32518,39618,53218,74718,92719,15619,30619,57719,70119,73719,83720,11019,97419,97620,04720,19320,32620,56720,66620,93621,08721,19821,37521,700
Noninstalment credit
Total
3,592
3,3292,8522,3542,1622,2192,3732,6282,8302,6842,719
2,8243,0872,8172,7652,9353,2034,2124,9035,4515,774
6,7687,4188,1178,3888,8969,924
10,61411,10311,48712,29713,19614,15115,13016,30317,89419,31920,13021,20018,71318,28618,23218,64118,88318,87618,78818,84318,81018,82619,00720,13019,46418,91918,92819,24919,62719,76219,76719,79519,84719,87120,12221,200
Chargeac-
counts
1,996
1,8331,6351,3741,2861,3061,3541,4281,5041,4031,414
1,4711,6451,4441,4401,5171,6122,0762,3812,7222,854
3,3673,7004,1304,2744,4854,7954,9955,1465,0605,1045,3295,3245,6845,8716,3006,7457,1447,6006,1075,5055,3935,6705,8605,9085,8885,9735,9936,1076,1997,1446,4725,8245,8095,9236,2316,3346,3466,3686,3876,4716,6147,600
Other 2
1,596
1,4961,217
980876913
1,0191,2001,3261,2811,305
1,3531,4421,3731,3251,4181,5912,1362,5222,7292,920
3,4013,7183,9874,1144,4115,1295,6195,9576,4277,1937,8678,8279,446
10,43211,59412,57312,98613,60012,60612,78112,83912,97113,02312,96812,90012,87012,81712,71912,80812,98612,99213,09513,11913,32613,39613,42813,42113,42713,46013,40013,50813,600
Adden-dum:Policy
loans bylife in-surance
com-panies 3
2,379
2,8073,3693,8063,7693,6583,5403,4113,3993,3893,248
3,0912,9192,6832,3732 1341,9621,8941,9372,0572,240
2,4132,5902,7132,9143,1273,2903,5193,8694,1884,6185,2315; 7336,2346,6557,1407,6789,117
7,7287,7757,8627,9648,0628,1748,2768,4358,6588,8498,9869,1369,2509,3419,4449,5379,6159,6959,7359,8089,8759,9339,996
1929
1930193119321933193419351936193719381939
1940194119421943194419451946194719481949
195019511952195319541955195619571958195919601961196219631964196519661967*1966: Jan..
Feb.Mar.Apr.May.June.July.Aug.Sept.Oct..Nov_Dec.
1967: Jan..Feb.Mar.Apr.May.June.July.Aug.Sept.Oct..Nov.Dec4
1 Holdings of financial institutions only; holdings of retail outlets are included in "other consumer goods paper."2 Single-payment loans and service credit.3 Year-end figures are annual statement asset values; month-end figures are book value of ledger assets. These loans
are not included in consumer credit series.« Preliminary; December by Council of Economic Advisers.Sources: Board of Governors of the Federal Reserve System and Institute of Life Insurance (except as noted).
274
Digitized for FRASER http://fraser.stlouisfed.org/ Federal Reserve Bank of St. Louis

T A B L E B—56.—Instalment credit extended and repaid, 1946—67
[Millions of dollars]
Year or month
1946..1947..1948..1949..
1950..1951..1952..1953..1954..
1955..1956..1957..1958..1959..
I960..1961-1962..1963..1964..
1965..1966..1967 1
1966: Jan.. .Feb...Mar..Apr...May..June..
July..Aug..Sept..Oct..Nov..Dec...
1967: Jan..Feb..Mar..Apr..May..June-July..Aug..Sept.Oct..Nov..Dec*.
Total
Ex-tended
8,49512,71315,58518,108
21,55823,57629,51431,55831,051
38,97239,86842,01640,11948,052
49,56048,39655,12661,29567,505
75,50878,89681,200
Re-paid
6,78510,19013,28415,514
18,44522,98525,40527,95630,488
33,63437,05439,86840,34442,603
45,97247,70050,62055,17161,121
67,49572,80578,000
Automobile
Ex-tended
1,9693,6925,2176,967
8,5308,956
11,76412,98111,807
1,4432,7494,1235,430
7,0119,058
10,00310,87911,833
16,73415,51516,46514,22617,779
17,65416,00719,79622,29224,435
27,91428,49127,200
Re-paid
13,08214,55515,54515,41515,579
16,38416,47217,47819,40021,676
24,26726,37326,900
Other consumergoods paper
Ex-tended
3,0774,4985,3835,865
7,1507,4859,1869,2279,117
2,6033,6454,6255,060
6,0577,4047,8928,6229,145
10,64211,72111,80711,74713,982
14,47014,57815,68517,10219,473
21,45423,50225,700
Re-paid
9,75210,75611,56911,56312,402
13,57414,24614,93915,85017,737
19,35521,36124,300
Repair and mod-ernization loans
Ex-tended
423704714734
835841
,217,344,261
,393,582,674,871
2,222
2,2132,0682,0512,1982,204
2,2382,1362,100
Re-
200391579
717772917
1,1191,255
1,3161,3701,4771,6261,765
1,8832,0151,9962,0382,078
2,0962,0602,100
Personalloans
Ex-tended
3,0263,8194,2714,542
5,0436,2947,3478,0068,866
10,20311,05112,06912,27514,070
15,22315,74417,59419,70321,393
23,90224,76726,200
Seasonally adjusted
6,5446,4926,6736,5056,4726,675
6,7326,6896,5786,5226,6576,433
6,5016,4976,5106,6066,5546,823
6,7766,9296,9736,9427,0327,075
5,9475,9546,0245,9745,9796,126
6,1686,0876,1036,1426,2136,112
6,2216,2816,2466,3936,3616,531
6,5516,5856,6896,6316,6146,675
2,3402,3402,4792,3022,2982,419
2,3832,4312,3872,3782,4612,297
2,2402,1772,1992,2172,2382,338
2,2662,2852,3222,3212,3052,350
2,1152,1352,2162,1452,1592,211
2,2382,2232,2132,2442,2552,225
2,2022,2172,1932,2352,2192,281
2,2282,2402,2802,3012,2402,250
1,9831,9571,9591,9581,9331,944
2,0501,9951,9581,9411,9471,928
2,0312,0992,0492,0952,0322,081
2,1472,2122,2342,1652,2422,250
1,7781,7811,7081,7291,7841,767
1,8031,7921,7841,8201,8361,796
1,8821,9151,8991,9681,9481,995
2,0742,0792,1062,0932,1052,125
176171183180186189
189187175166166159
157169169170180190
175175166171180175
176174176175172176
174172168169169161
167176170179178184
175171178170177175
2,0452,0242,0522,0652,0552,123
2,1102,0762,0582,0372,0832,049
2,0732,0522,0932,1242,1042,214
2,1882,2572,2512,2852,3052,300
Re-paid
2,5393,4053,9574,335
4,6605,7516,5937,3368,255
9,48410,37311,27611,74112,857
14,13014,96716,20617,88319,630
21,77723,01124,700
1,8781,8641,9241,9251,8641,972
1,9531,9001,9381,9091,9531,930
1,9701,9731,9842,0112,0162,071
2,0742,0952,1252,0672,0922,125
i Preliminary; December by Council of Economic Advisers.
Source: Board of Governors of the Federal Reserve System (except as noted).
275
Digitized for FRASER http://fraser.stlouisfed.org/ Federal Reserve Bank of St. Louis

TABLE B-57.—Mortgage debt outstanding, by type of property and of financing, 1939-67
[Billions of dollars]
End of yearor quarter
1939
19401941194219431944
19451946194719481949
19501951195219531954
19551956195719581959
1960196119621963 _1964
19651966 P1967*
1964:1III I I —IV.-- .
1965:1l l _ . . .III.—I V . . . .
1966:l»-_--l | p . _ -l l | p _ . _I V P . . .
1 9 6 7 : | p _ . . .l | p _ _ -l l | p _ _ .I V P . . .
Allprop-erties
35.5
36.537.636.735.334.7
35.541.848.956.262.7
72.882.391.4
101.3113.7
129.9144.5156.5171.8190.8
206.8226.3248.6274.3300.1
326.3347.3369.1
279.4286.5293.4300.1
305.3312.5319.5326.3
332.3338.8343.5347.3
350.7356.2362.4369.1
Nonfarm properties
Total
28.9
30.031.230.829.929.7
30.836.943.950.957.1
66.775.684.293.6
105.4
120.9134.6146.1160.7178.7
194.0212.4233.4257.4281.2
305.1324.0344.1
262.1268.4274.9281.2
285.9292.3298.8305.1
310.5316.3320.5324.0
327.0332.0337.8344.1
1- to 4-family houses
Total
16.3
17.418.418.217.817.9
18.623.028.233.337.6
45.251.758.566.175.7
88.299.0
107.6117.7130.9
141.3153.1166.5182.2197.6
213.7224.1235.9
185.4189.8193.9197.6
200.7205.1209.6213.7
216.9220.2222.4224.1
225.5228.3232.1235.9
Government underwritten
Total
1.8
2.33.03.74.14.2
4.36.19.3
12.515.0
18.922.925.428.132.1
38.943.947.250.153.8
56.459.162.265.969.2
73.176.0
66.667.368.469.2
70.170.772.073.1
74.174.675.476.0
76.477.278.3
FHAin-
sured
1.8
2.33.03.74.14.2
4.13.73.85.36.9
8.69.7
10.812.012.8
14.315.516.519.723.8
26.729.532.335.038.3
42.044.8
35.736.337.438.3
39.039.740.942.0
43.043.744.444.8
45.245.746.6
VAguar-
anteed
0.22.45.57.28.1
10.313.214.616.119.3
24.628.430.730.430.0
29.729.629.930.930.9
31.131.2
31.030.931.130.9
31.131.031.131.1
31.130.931.031.2
31.231.531.7
Con-ven-
tional *
14.5
15.115.414.513.713.7
14.316.918.920.822.6
26.328.833.138.043.6
49.355.160.467.677.0
84.893.9
104.3116.3128.3
140.6148.1
118.8122.5125.4128.3
130.6134.4137.5140.6
142.7145.7147.0148.1
149.0151.1153.8
Multi-family andcommercial properties 2
Total
12.5
12.612.912.512.111.8
12.213.815.717.619.5
21.623.925.727.529.7
32.635.638.543.047.9
52.759.366.975.383.6
91.499.9
108.1
76.778.781.183.6
85.287.289.391.4
93.796.198.299.9
101.5103.7105.7108.1
Multi-family
5.6
5.75.95.85.85.6
5.76.16.67.58.6
10.111.512.312.913.5
14.314.915.316.818.7
20.323.025.829.033.2
37.039.542.8
29.830.932.133.2
34.034.936.037.0
37.838.539.139.5
40.241.041.842.8
Com-mer-cial
prop-erties
7.0
6.97.06.76.36.2
6.47.79.1
10.210.8
11.512.513.414.516.3
18.320.723.226.129.2
32.436.441.146.250.4
54.460.465.4
46.947.849.050.4
51.152.353.354.4
55.857.659.160.4
61.362.763.965.4
Farmprop-erties
6.6
6 56.46.05.44 9
4.84.95.15.35.6
6.16.77.27.78.2
9.09.8
10.411.112.1
12.813.915.216.818.9
21.223.325.0
17.318.118.518.9
19.520.220.721.2
21.822.523.023.3
23.724.224.625.0
1 Derived figures.2 Includes negligible amount of farm loans held by savings and loan associations.Source: Board of Governors of the Federal Reserve System, estimated and compiled from data supplied by various
Government and private organizations.
276
Digitized for FRASER http://fraser.stlouisfed.org/ Federal Reserve Bank of St. Louis

TABLE B-58.--Net public and private debt, 1929-67l
[Billions of dollars]
End ofyear 2
1929..
1930..1931..1932..1933..1934..
1935..1936..1937..1938..1939..
1940..1941..1942..1943..1944..
1945..1946..1947..1948..1949..
1950..1951..1952..1953..1954..
1955..1956..1957..1958..1959..
I960..1961..1962..1963..1964..
1965..1966..19675.
Total
190.9
191.0181.9174.6168.5171.4
174.7180.3182.0179.6183.2
189.9211.6259.0313.6370.8
406.3397.4417.4433.6448.4
490.3524.0555.2586.5612.0
672.3707.5738.9782.6846.2
890.2947.7
1,016.71,089.51,166.4
1,257.61,344.91,430.3
Fed-eralGov-ern-mentand
agency
16.5
16.518.521.324.330.4
34.437.739.240.542.6
44.856.3
101.7154.4211.9
252.7229.7223.3216.5218.6
218.7218.5222.9228.1230.2
231.5225.4224.4232.7243.2
241.0248.1257.5262.4269.4
272.5278.7289.9
Stateandlocalgov-ern-
ment2
13.2
14.115.516.616.715.9
16.016.216.116.016.3
16.516.315.814.914.1
13.713.614.416.218.1
20.723.325.828.633.4
38.442.746.750.955.6
60.065.073.779.585.2
95.1100.9110.1
Total
161.2
160.4147.9136.7127.5125.1
124.2126.4126.7123.1124.3
128.6139.0141.5144.3144.8
139.9154.1179.7200.9211.7
250.9282.2306.5329.8348.4
402.5439.4467.8499.1547.4
589.2634.6685.5747.6811.8
890.0965.2
1,030.3
Total
88.9
89.383.580.075.975.5
74.876.175.873.373.5
75.683.491.695.594.1
85.393.5
108.9117.8118.0
142.1162.5171.0179.5182.8
212.1231.7246.7259.5283.3
302.8324.3348.2376.1407.7
451.2497.2533.0
Corporate
Long-term
47.3
51.150.349.247.944.6
43.642.543.544.844.4
43.743.642.741.039.8
38.341.346.152.556.5
60.166.673.378.382.9
90.0100.1112.1121.2129.3
139.1149.3161.2174.4192.9
211.3232.4261.4
Short-term
41.6
38.233.230.829.130.9
31.233.532.328.429.2
31.939.849.054.554.3
47.052.262.865.361.5
81.995.997.7
101.2100.0
122.2131.7134.6138.4154.0
163.6175.0187.0201.7214.8
239.9264.8271.6
Private
Individual and noncorporate
Total
72.3
71.164.456.750.649.6
49.450.350.949.850.8
53.055.649.948.850.7
54.660.670.883.193.7
108.8119.7135.5150.3165.6
190.4207.7221.1239.5264.1
286.4310.3337.3371.5404.1
438.8468.0497.3
Farm3
12.2
11.811.110.19.18.9
8.98.68.69.08.8
9.19.39.08.27.7
7.37.68.6
10.812.0
12.313.615.216.917.6
18.819.520.323.323.0
25.127.530.233.236.0
39.342.145.4
Tnfal1 Old 1
60.1
59.353.346.641.540.6
40.541.742.340.942.0
43.946.340.940.542.9
47.453.062.372.481.8
96.6106.2120.4133.6147.9
171.6188.2200.8216.2241.1
261.4282.8307.1338.3368.1
399.5425.9451.9
Nonfarm
Mort-gage
31.2
32.030.929.026.325.5
24.824.424.324.525.0
26.127.126.826.126.0
27.032.538.845.150.6
59.467.475.283.894.6
108.7121.3131.6144.6160.8
174.5190.4206.3225.5244.4
263.2278.5294.0
Com-mer-cialand
finan-cial ^
22.4
21.617.614.011.711.2
10.811.211.310.19.8
9.510.08.19.5
11.8
14.712.111.912.913.9
15.816.217.818.420.8
24.024.424.326.528.7
30.834.837.642.345.4
48.352.658.8
Con-sumer
6.4
5.84.83.63.53.9
4.96.16.76.37.2
8.39.26.04.95.1
5.78.4
11.614.417.3
21.422.627.431.432.5
38.942.544.845.151.5
56.057.763.270.578.4
87.994.899.1
1 Net public and private debt outstanding is a comprehensive aggregate of the indebtedness of borrowers after elimina-tion of certain types of duplicating governmental and corporate debt. For a further explanation of the concept, see "Surveyof Current Business," October 1950.
2 Data for State and local government debt are for June 30.3 Farm mortgages and farm production loans. Farmers' financial and consumer debt is included in the nonfarm categories.4 Financial debt is debt owed to banks for purchasing or carrying securities, customers' debt to brokers, and debt owed
to life insurance companies by policyholders.5 Estimates.Note.—Revisions for 1929-39 and 1955-57 in the consumer credit data of the Board of Governors of the Federal Reserve
System have not yet been fully incorporated into this series.Sources: Department of Commerce (Office of Business Economics and Bureau of the Census), Treasury Department,
Department of Agriculture, Board of Governors of the Federal Reserve System, and Federal Home Loan Bank Board.
277
Digitized for FRASER http://fraser.stlouisfed.org/ Federal Reserve Bank of St. Louis
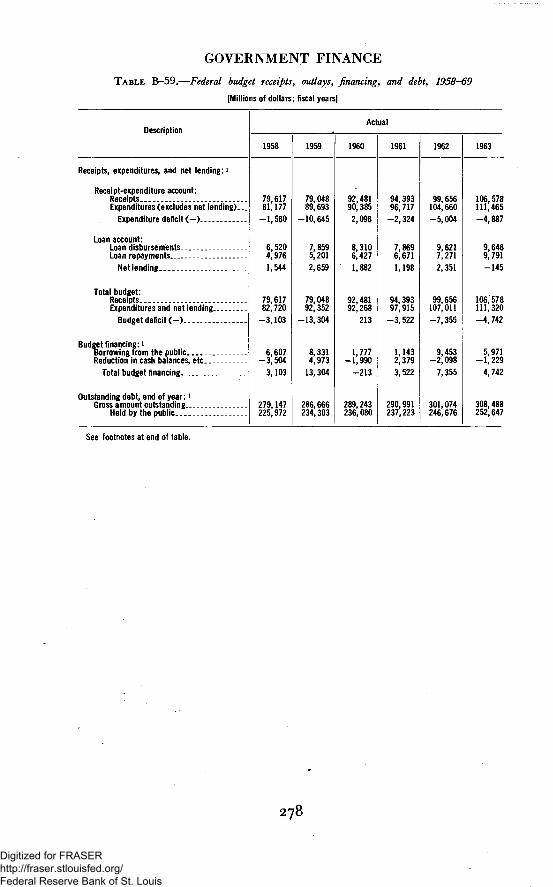
GOVERNMENT FINANCE
TABLE B-59.—Federal budget receipts, outlays, financing, and debt, 1958-69
[Millions of dollars; fiscal years]
DescriptionActual
1958 1959 1960 1961 1962 1963
Receipts, expenditures, and net lending: i
Receipt-expenditure account:ReceiptsExpenditures (excludes net lending)
Expenditure deficit ( - )
Loan account:Loan disbursementsLoan repay me nts
Net lending
Total budget:ReceiptsExpenditures and net lending
Budget deficit ( - )
Budget financing: *Borrowing from the publicReduction in cash balances, etc
Total budget financing
Outstanding debt, end of year:l
Gross a mount outstandingHeld by the public
79,61781,177
-1,560
6,5204,9761,544
79,61782,720
-3,103
6,607-3,504
3,103
279,147225,972
79,04889,693
-10,645
7,8595,201
2,659
79,04892,352
-13,304
8,3314,973
13,304
286,666234,303
92,48190,385
2,096
8,3106,427
1,882
92,48192,268
213
1,777-1,990
-213
289,243236,080
94,39396,717
-2,324
7,8696,671
1,198
94,39397,915
-3,522
1,1432,379
3,522
290,991237,223
99,656104,660
-5,004
9,6217,2712,351
99,656107,011
-7,355
9,453-2,098
7,355
301,074246,676
106,578111,465
-4,887
9,6469,791
-145
106,578111,320
-4,742
5,971-1,229
4,742
308,488252,647
See footnotes at end of table.
278
Digitized for FRASER http://fraser.stlouisfed.org/ Federal Reserve Bank of St. Louis

TABLE B-59.—Federal budget receipts, outlays, financing, and debt, 1958-69—Continued
[Millions of dollars; fiscal years)
DescriptionActual
1964 1965 1966 1967
Estimate
1968
Receipts, expenditures, and net lending:1
Receipt-expenditure account:ReceiptsExpenditures (excludes net lending)..
Expenditure deficit ( - )
Loan account:Loan disbursementsLoan repayments
Net lending
Total budget:ReceiptsExpenditures and net lending
Budget deficit ( - )
Budget financing: *Borrowing from the publicReduction in cash balances, etc
Total, budget financing
Outstanding debt, end of year: *Gross amount outstanding
Held by the public
112,702118,122-5,420
10,2379,693
545
112,702118,667-5,965
2,9782,9875,965
314,377255,625
116,855116,718
137
10,9119,6621,249
116,855117,966-1,111
3,953-2,8421,111
320,806259,578
130,901130.740
161
14,62810,7963,832
130,901134,572-3,671
6,031-2,3603,671
329,473265,609
149,591153,238-3,647
17,78712,6115,176
149,591158,414-8,823
3,5515,2728,823
341,343269,160
155,830169,856-14,026
20,86915,0915,779
155,830175,635-19,805
20,840-1,03519,805
369,993290,000
178,108182,797-4,689
20,37217,1063,265
178,108186,062-7,954
8,000-46
7,954
387,167298,000
i Data represent results of preliminary adjustments to new budget concepts used in the "Budget of the United StatesGovernment for the Fiscal Year Ending June 30,1969" and may be revised later.
Sources: Treasury Department and Bureau of the Budget.
279
Digitized for FRASER http://fraser.stlouisfed.org/ Federal Reserve Bank of St. Louis

TABLE B-60.—Federal budget receipts and outlays, 1958-69
[Millions of dollars; fiscal years]
Description
Receipts.
I ndividual income taxesCorporation income taxesEmployment taxesUnemployment insurancePremiums for other insurance and retire-
mentExcise taxesEstate and gift taxesCustomsOther receipts
MEMORANDUM:
(Excluded above; offset against expendi-tures)
Interfund and intergovernmental transac-tions
Proprietary receipts from the public
Expenditures.
National defenseInternational affairs and financeSpace research and technologyAgriculture and agricultural resourcesNatural resourcesCommerce and transportationHousing and community developmentHealth, labor, and welfareEducationVeterans benefits and services..InterestGeneral governmentSpecial allowances —Undistributed adjustments to amounts
above
Net lending.
National defenseI nternational affairs and financeAgriculture and agricultural resourcesNatural resourcesCommerce and transportationHousing and community developmentHealth, labor, and welfareEducationVeterans benefits and servicesGeneral government .-
Total expenditures and net lending.
Actual
1958
79,617
34,72420,0748,6241,924
68210,6381,393
781777
4,119
81,177
44,4612,912
892,5411,2032,922
- 3 615,763
3755,0766,9361,010
- 2 , 0 7 6
1,544
1433472
356
165
165261
- 1 2
82,720
1959
79,048
36,71917,3098,8212,131
76910,5781,333925463
40,71521,49411,2482,668
76811,6761,6061,1051,200
5,330
89,693
46,6672,790
1454,7181,2334,367
3018,019
5505,1837,0701,159
-2,239
2,659
- 1 2418700
671
1,064
180245
- 1 4
92,352
1960
92,481
5,309
90,385
45,8483,310
4012,8931,0844,643
2119,105
6595,0638,2991,332
- 2 , 2 7 2
1,882
- 7- 2 3 5
4571127
1,078
204363
- 1 5
92,268
1961
94,393
41,33820,95512,6792,904
11,8601,896
982913
6,508
96,717
47,5323,242
7442,8771,6264,929
15722,368
7405,3928,1081,508
-2,506
1,198
-41127462187464*
201296
97,915
1962
99,656
45,57120,52312,8353,337
87312,5342,0161,142825
5,654
104,660
51,1794,0341,2573,4911,7365,193160
23,963842
5,3788,3211,653
-2,547
2,351
52864821193490
231248
107,011
1963
106,578
47,58821,57914,7464,112
94413,1942,1671,2061,042
7,099
111,465
52,2754,2792,5524,3981,6075,516
19325,677
9535,6669,2151,799
- 2 , 6 6 6
- 1 4 5
- 6 4- 9 5731
18145
- 1 , 0 1 2
288- 1 4 6
- 1 1
111.320
See Note at end of table.
280
Digitized for FRASER http://fraser.stlouisfed.org/ Federal Reserve Bank of St. Louis

TABLE B-60.—Federal budget receipts and outlays, 1958-69—Continued
[Millions of dollars; fiscal years]
Description
Receipts
Individual income taxesCorporation income taxesEmployment taxesUnemployment insurancePremiums for other insurance and retire-
mentExcise taxesEstate and gift taxesCustomsOther receipts
MEMORANDUM:
(Excluded above; offset against expendi-tures)
Interfund and intergovernmental transac-tions
Proprietary receipts from the public
Expenditures-
National defenseInternational affairs and financesSpace research and technologyAgriculture and agricultural resourcesNatural resourcesCommerce and transportationHousing and community developmentHealth, labor, and welfareEducationVeterans benefits and servicesI nte restGeneral governmentSpecial allowancesUndistributed adjustments to amounts
above
Net lending.
National defenseInternational affairs and financeAgriculture and agricultural resourcesNatural resourcesCommerce and transportationHousing and community developmentHealth, labor, and welfareEducationVeterans benefits and servicesGeneral government
Total expenditures and net lending.
Actual
1964
112,702
48,69723,49216,9594,045
1,00613,7312,3941,2521,126
} 6,655
118,122
53,6824,4344,1714,5452,0426,283151
27,2011,1095,5529,8102,072
-2,931
545
-31-28364223139
-3012
225129
118,667
1965
116,855
48,79225,46117,3583,819
1,07914,5702,7161,4421,617
6,761
116,715
49,5864,1965,0914,0322,1407,043116
28,1431,3095,63410,3582,231
-3,164
1,249
- 3-2177716
275-147
192298816
117,966
1966
130,901
55,44630,07320,6623,777
1,12613,0613,0661,7671,923
7,592
130,740
56,7714,3435,9322,7642,1676,789442
33,1942,4495,70711,2852,316
-3,421
3,832
- 110091119193
1,984323762145
134,572
1967
149,591
61,52633,97127,8233,652
1,85313,7192,9781,9012,168
6,5884,948
153,238
70,0954,1105,4243,1562,1137,308578
39,5123,6026,366
12,5482,452
- 4 , 0 2 2
5,176
- 3540
1,22119
1381,708
572445532
2
158,414
Estimate
1968
155,830
67,70031,30029,7303,660
2,04913,8483,1002,0002,443
7,4154,430
169,856
76,4914,3304,8044,4122,4167,695698
46,3964,1576,79813,5352,618
100
-4,591
5,779
- 271689916158
3,25721384370-40
175,635
1969
178,108
80,90034,30034,1543,594
2,27514,6713,4002,0702,744
8,2414,617
182,797
79,7924,4784,5744,4742,4837,9961,428
51,9454,3647,131
14,4002,8271,950
-5,049
3,265
- 4675
1,135
1251,355- 5 3 8
335211
- 3 7
186,062
Note.—New budget concepts in the "Budget of the United States Government for the Fiscal Year Ending June 30,1969,"are used in this table.
Sources: Bureau of the Budget and Treasury Department.
281
Digitized for FRASER http://fraser.stlouisfed.org/ Federal Reserve Bank of St. Louis

T A B L E B-61.—Relation of the receipt-expenditure accounts of the Federal Government to the Federalsector of the national income and product accounts, 1967—69
[Billions of dollars; fiscal years]
Receipts and Expenditures 1967actual
1968estimate
1969estimate
RECEIPTS
Total receipts, budget.
Employer share, employee retirement..Other netting and grossing.Adjustment to accrualsOther
Federal sector, national income and product accounts, receipts..
EXPENDITURES
Total expenditures, budget..
Employer share, employee, retirement._.Other netting and grossingDefense timing adjustment..Lending in the expenditure account...Dollar expenditures to finance agricultural exports.Other
149.6
1.71.1
-4 .8
147.6
153.2
1.71.1
- . 4-1 .4- . 81.6
Federal sector, national income and product accounts, expenditures... 155.1
155.8
1.91.22.2
161.1
169.9
1.91.2.3
-1 .7- . 7
.2
171.1
178.1
2.01.21.1
182.5
182.8
2.01.2.4
-2 .1- . 51.1
185.0
Note.—See Special Analysis B, "Budget of the United States Government for the Fiscal Year Ending June 30, 1969,"for description of these categories.
Sources: Bureau of the Budget and Department of Commerce (Office of Business Economics).
282
Digitized for FRASER http://fraser.stlouisfed.org/ Federal Reserve Bank of St. Louis

T A B L E B-62.—Receipts and expenditures of the Federal sector of the national income andproduct accounts, 1946—69
[Billions of dollars]
Year or quarter
Receipts
Total
Per-sonaltaxandnon-taxre-
ceipts
Cor-po-rate
profitstaxac-
cruals
Indi-rect
busi-nesstaxandnon-taxac-cru-als
Con-tribu-tionsfor
socialinsur-ance
Expenditures
Total
Pur-chases
ofgoodsand
serv-ices
Transferpayments
Toper-
Tofor-
eign-ers
(net)
Grants-in-aid
to Stateandlocal
govern-ments
Netin-
ter-est
paid
Subsi-dieslesscur-rentsur-plusof
gov-ern-mententer-prises
Sur-plusor
defi-cit
na-tion-
alin-
comeand
prod-uctac-
counts
Fiscal year:1946. . . .194719481949
1950..1951..1952..1953..1954..1955..1956..1957..1958..1959..
196019611962196319641965196619671968119691
Calendar year:1946194719481949195019511952 _.1953195419551956195719581959
19601961196219631964196519661967*
Calendar quar-ter:
1965: I . . . .I I . . .I I I . .IV..jif.".".'ML.IV . . .
1967: I . . . .I I . . . .I I I . .IV p.
1966:
38.442.743.640.0
42.060.865.169.365.867.275.880.777.985.494.895.3
104.2110.2115.5120.6132.9147.6161.1182.5
39.143.243.338.949.964.067.270.063.872.177.681.678.789.796.598.3
106.4114.5115.0124.8143.2151.5
123.4124.9123.4127.6137.0141.6145.6148.6149.1148.1152.7
16.918.820.016.316.523.228.831.430.329.733.636.736.338.242.543.647.349.650.751.357.564.671.083.8
17.219.619.016.118.126.131.032.229.031.435.237.436.839.943.644.748.651.548.653.861.766.5
8.310.611.211.011.921.519.319.717.318.721.120.617.821.5
22.320.322.923.525.727.831.031.434.337.2
8.610.711.89.8
17.021.518.519.517.020.620.620.218.022.521.721.822.724.626.429.332.330.7
7.47.97.98.08.29.59.7
10.710.410.010.811.711.611.913.213.314.215.015.616.915.815.917.118.1
7.87.88.08.0'8.99.4
10.310.99.7
10.711.211.811.512.513.513.614.615.316.116.515.916.6
5.85.54.64.85.56.67.37.57.88.7
10.211.712.213.816.718.119.922.123.524.528.635.738.743.4
5.55.14.54.95.97.17.47.48.19.3
10.612.212.414.817.718.220.523.123.825.233.337.7
55.529.550.939.642.444.666.075.874.267.369.876.083.190.991.398.0
106.4111.4116.9118.3131.9155.1171.1185.0
35.629.834.941.340.857.871.077.069.768.171.979.688.991.093.0
102.1110.3113.9118.1123.4142.9164.1
40.113.013.219.319.025.146.656.153.243.945.247.750.754.752.755.560.963.465.764.371.784.592.899.4
17.212.516.520.118.437.751.857.047.444.145.649.553.653.753.557.463.464.265.266.877.089.9
8.38.78.1
11.38.18.59.3
10.512.112.814.417.819.820.623.625L126.427.328.331.737.7
44.949.9
1.82.65.04.33.12.62.11.72.11.81.91.71.8
1.82.12.12.12.22.12.32.1
9.28.87.68.7
10.88.58.89.5
11.512.413.415.719.520.121.524.925.527.027.830.333.740.7
2.21.93.85.13.63.12.12.01.82.01.91.81.81.81.92.12.22.22.22.22.32.2
0.91.51.82.12.42.42.52.82.93.03.23.74.76.26.86.97.68.49.8
10.912.715.418.020.0
1.11.72.02.22.32.52.62.82.93.13.34.25.66.86.57.28.09.1
10.411.214.815.8
3.74.24.24.3
4.44.64.84.85.04.95.15.55.75.97.06.86.87.58.18.59.0
10.110.711.2
4.24.24.34.4
4.54.74.74.95.04.95.35.75.66.47.16.67.27.78.38.79.5
10.4
Seasonally adjusted annual rates
2.1.7
'.S1.01.31.1.9
1.01.31.72.82.52.42.33.23.83.63.84.14.55.34.64.5
1.6.6.7.8
1.21.31.0.8
1.11.52.42.62.72.12.53.84.03.64.24.35.45.2
-17.113.212.7
.4- . 516.2
-1 .0- 6 . 5- 8 . 5- . 16.04.7
- 5 . 1- 5 . 5
3.5-2 .7- 2 . 1- 1 . 2-1 .4
2.3.9
- 7 . 5-10.0- 2 . 5
3.513.48.4
-2 .49.16.2
- 3 . 8- 7 . 0- 5 . 9
4.05.72.1
-10.2-1 .2
3.5-3.8-3.8
- 1 01.4
-12.6
52.954.553.354.657.760.963.165.265.564.067.569.0
28.328.929.030.932.232.232.432.330.330.330.6
17.516.515.716.315.215.916.216.316.216.516.717.0
24.724.925.325.831.932.534.034.737.037.238.038.6
118.9119.9126.6128.0134.8138.4146,3151.9160.9162.8165.9167.5
64.365.467.669.872.174.979.581.587.189.590.992.0
29.228.432.530.932.531.933.736.940.040.341.241.4
2.02.42.22.02.82.32.21.92.22.02.32.1
10.410.711.312.213.814.615.315.615.615.316.016.4
8.68.68.78.99.19.49.6
10.010.410.410.510.7
4.44.34.24.44.65.36.05.95.65.35.04.9
4.54.9
-3 .2- . 42.23.2
- . 7- 3 . 3
-11.9-14.7-13.2
i Estimates.Note.—Includes the transactions of the trust accounts and excludes certain financial transactions. Corporate profits
taxes are included in receipts on an accrual basis; expenditures are timed with the delivery; and CCC guaranteed price-support crop loans financed by banks are counted as expenditures when the loans are made, not when CCC redeems them.
See Table B-61.Sources: Department of Commerce (Office of Business Economics) and Bureau of the Budget.
283
Digitized for FRASER http://fraser.stlouisfed.org/ Federal Reserve Bank of St. Louis

TABLE B-63.—Federal finances under the old concepts, fiscal years 1929-69
[Millions of dollars]
Fiscal year
1929 . . . . .
19301931 . .19321933193419351936193719381939 .
1940194119421943194419451946 . . . .194719481949
1950195119521953195419551956195719581959
196019611962196319641965196619671968»1969» . . . . . . . . -
Administrative budget
Netreceipts
3,861
4,0583,1161,9241,9973,0153,7063,9974,9565,5884,979
5,1377,096
12,54721,94743,56344,36239,65039,67741,37537,663
36,42247,48061,28764,67164,42060,20967,85070,56268,55067,915
77,76377,65981,40986,37689,45993,072
104,727115,849118,575135,587
Expendi-tures
3,127
3,3203,5774,6594,5986,6456,4978,4227,7336,7658,841
9,05513,25534,03779,36894,98698,30360,32638,92332,95539,474
39,54443,97065,30374,12067,53764,38966,22468,96671,36980,342
76,53981,51587,78792,64297,68496, 507
106,978125,718137,182147,363
Surplus ordeficit ( - )
734
738- 4 6 2
- 2 , 7 3 5- 2 , 6 0 2- 3 , 6 3 0- 2 , 7 9 1- 4 , 4 2 5- 2 , 7 7 7- 1 , 1 7 7- 3 , 8 6 2
- 3 , 9 1 8- 6 , 1 5 9
-21 ,490-57 ,420-51 ,423-53 ,941-20 ,676
7548,419
- 1 , 8 1 1
- 3 , 1 2 23,510
- 4 , 0 1 7- 9 , 4 4 9-3 ,117- 4 , 1 8 0
1,6261,596
- 2 , 8 1 9-12,427
1,224- 3 , 8 5 6- 6 , 3 7 8- 6 , 2 6 6- 8 , 2 2 6- 3 , 4 3 5- 2 , 2 5 1- 9 , 8 6 9
-18,607-11 ,776
Cash receipts from and paymentsto the public
Cashreceipts
47,80050,20043,53743,53145,35741,576
40,94053,39068,01171,49571,62667,83677,08782,10581,89281,660
95,07897,242
101,865109,739115,530119,699134,479153,596158,823181,146
Cashpayments
94,00095,20061,73836,93136,49340,570
43,14745,79767,96276,76971,85870, 53772,54680,00683,47294,752
94,32899, 542
107,662113,751120,332122,395137,818155,142175,981188,725
Excess ofreceipts
or of pay-ments (—)
-46 ,100-45 ,000-18,201
6,6008,8641,006
- 2 , 2 0 77,593
49- 5 , 2 7 4
- 2 3 2- 2 , 7 0 2
4,5422,099
- 1 , 5 8 0-13 ,092
750- 2 , 3 0 0-5 ,797- 4 , 0 1 2-4 ,802-2 ,696-3 ,337- 1 , 5 4 6
-17,157- 7 , 5 7 9
Grosspublic
debt atend of
year andguar-
anteedissues
16,931
16,18516,80119,48722,53927,73432,82438,49741,08942,01845,890
48,49755,33276,991
140,796202,626259,115269,898258,376252,366252,798
257,377255,251259,151266,123271,341274,418272,825270,634276,444284,817
286,471289,211298,645306,466312, 526317,864320,369326,733351,599363,540
» Estimates.Note.—The old concepts in this table are those used in budgets of the U.S. Government for years prior to fiscal 1969.Sources: Bureau of the Budget and Treasury Department.
284
Digitized for FRASER http://fraser.stlouisfed.org/ Federal Reserve Bank of St. Louis

TABLE B-64.—U.S. Government debt, by kind of obligation, 1929-57{Billions of dollars]
End of year or month
1929193019311932 . . .193319341935 . .193619371938 - . ,-19391940 . . .19411942 -194319441945194619471948 . . - .194919501951195219531954195519561957195819591960 . . .1961196219631964 . . .196519661967 .1966- Jan
FebMar . . . . .AprMayJ u n e . . .-JulyA u g . . . . .S e p tO c t . . . . . . . .NovD e c . .
1 9 6 7 : JanF e b . . . . . . .MarA p r . . . . . .MayJuneJulyAugSeptOct.. . .Nov . . .Dec .
Grosspublic
debt andguar-
anteedissues *
16.316.017.820.824.031.535.139.141.944.447.650.964.3
112.5170.1232.1278.7259.5257.0252.9257.2256.7259.5267.4275.2278.8280.8276.7275.0283.0290.9290.4296.5304.0310.1318.7321.4329.8345.2322.4323.7321.5320.1322.8320.4319.8324.9325.2327.4329.9329.8329.4330.1331.5328.3331.4326.7331.2336.4336.4341.0345.6345.2
Interest-bearing public debt
Marketable publicissues
Short-term
issues 2
3.32.92.85.97.5
11.114.212.512.59.87.77.58.0
27.047.169.978.257.147.745.950.258.365.668.777.376.081.379.582.192.2
103.5109.2120.5124.6121.2115.5110 4118.9131.2113.5114.5112.0111 9111.8107.2107.2110.8111.3114.8118 1118.9119.7120.2120 9118.1118.8113.3117.6120.9121 3126.0130.8131.2
Treasurybonds
11.311.313.513.414.715.414.319.520.524.026.9
• 28.033.449.367.991.6
120.4119.3117.9111.4104.894.076 979.877.281.881.980.882.183.484.879.875.578.486.497.0
104 299.295.2
104.2103.2103.1103 1102.0101.9101.9100.6100.5100.599 299.299.199.199 099.097.997.497.497.497.397.395.395.2
Nonmarketablepublic issues
UnitedStatessavingsbonds
0.2.5
1.01.42.23.26.1
15.027.440.448.249.852.155.156.758.057.657.957.757.757.956.352.551.248.247.247.547.548.849.750 350.851.650.350.350.450 450.550.550.650.650.650.750 850.850.850.951.051.151.151.251.351.451.451.551.651.6
Invest-ment
bonds 3
1 61.01.01.0
13.013.412.912.712.311.610.39.07.66.25.14.43.73.42 82.72.62.82.82.82.72.72.72.72.72.72.72.72.72.72.62.62.62.62.62.62.62.62.62.62.6
Specialissues *
0.6.8.4.4.4.6
.62.23.24.25.47.09.0
12.716.320.024.629.031.733.933.735.939.241.242.643.945.645.844.843.544.343.543.443.746.146.352.057.244.445.846.044.948.851.150.753.253.151.952.552.051.351.552.151.655.256.256.258.357.757.257.457.2
1 Total includes non-interest-bearing debt, fully guaranteed securities (except those held by the Treasury), Postal Savingsbonds, prewar bonds, adjusted service bonds, depositary bonds. Armed Forces leave bonds, Rural Electrification Adminis-tration series bonds, foreign series certificates and notes, foreign currency certificates, notes and bonds, Treasury certi-ficates, and U.S. retirement plan bonds, not shown separately. Not all of total shown is subject to statutory debt limitation.
2 Bills, certificates of indebtedness, and notes.3 Series A bonds through September 1965 and, beginning April 1951, series B convertible bonds.* Issued to U.S. Government investment accounts. These accounts also held $18.8 billion of public marketable and
nonmarketable issues on December 31, 1967.Note.—See Note, Table B-66.Source: Treasury Department.
284-593 O—68- -19285
Digitized for FRASER http://fraser.stlouisfed.org/ Federal Reserve Bank of St. Louis

TABLE B-65.—Estimated ownership of U.S. Government obligations, 1939-67[Par values,i billions of dollars]
End of year ormonth
Gross public debt and guaranteed issues 2
Total
Heldby U.S.Govern-
mentinvest-mentac-
counts
Heldby
FederalReservebanks
Held by "the public"
TotalCom-
mercialbanks 3
Mutualsavingsbanks
and in-surance
com-panies
Othercorpo-
rations4
Stateandlocal
govern-ments 5
Indi-viduals «
Miscel-laneousinves-tors 7
193919401941194219431944194519461947..19481949
1950195119521953195419551956195719581959
196019611962196319641965. . .1966 .-1967 8
1966: J a n . . .Feb. . .Mar.. .Apr. . .May. .June..July. .Aug...Sept..Oct . . .Nov...Dec.. .
1967: J a n . . .Feb. . .Mar.. .Apr. . .May..June..July...Aug...soec?! : - .Nov...Dec 8..
47.650.964.3
112.5170.1232.1278.7259.5257.0252.9257.2
256.7259.5267.4275.2278.8280.8276.7275.0283.0290.9290.4296.5304.0310.1318.7321.4329.8345.2322.4323.7321.5320.1322.8320.4319.8324.9325.2327.4329.9329.8329.4330.1331.5328.3331.4326.7331.2336.4336.4341.0345.6345.2
6.57.69.5
12.216.921.727.030.934.437.339.439.242.345.948.349.651.754.055.254.453.7
55.154.555.658.060.661.968.876.0
60.061.761.760.564.566.766.469.369.268.068.968.868.269.670.770.474.675.875.577.276.475.976.276.0
2.52.22.36.2
11.518.824.323.322.623.318.920.823.824.725.924.924.824.924.226.326.627.428.930.833.637.040.844.349.1
40.640.240.740.741.542.242.442.542.943.043.944.343.544.044.945.546.146.746.846.646.947.448.949.1
38.641.152.594.0
141.6191.6227.4205.2200.1192.2198.9
196.8193.4196.9201.0204.2204.3197.8195.5202.3210.6207.9213.1217.6218.5221.1218.7216.8220.1221.9221.9219.2218.9216.8211.5211.0213.1213.2216.4217.1216.8217.6216.6215.9212.4210.8204.2208.9212.6213.1217.7220.5220.1
15.917.321.441.159.977.790.874.568.762.566.8
61.861.663.463.769.262.059.559.567.560.362.167.267.264.364.060.857.563.760.958.757.057.055.154.853.855.054.855.355.557.557.857.458.157.256.455.558.360.261.163.663.563.7
9.410.111.915.821.228.034.736.735.932.731.5
29.626.325.525.124.123.121.320.219.919.5
18.117.517.617.116.815.814.312.915.915.815.715.415.214.814.714.614.614.414.414.314.013.913.713.313.?12.912.913.013.012.912.912.9
2.22.04.0
10.116.421.422.215.314.114.816.8
19.720.719.921.519.123.218.717.718.121.4
18.718.518.618.718.215.814.913.016.617.615.915.916.414.214.314.513.814.916.014.914.714.714.112.913.611.111.912.410.711.813.213.0
0.4.5.7
1.02.14.36.56.37.37.98.1
9.611.112.714.415.416.316.616.518.0
18.719.020.121.121.222.925.024.323.724.724.425.125.324.525.125.025.225.225.125.024.825.025.125.225.125.024.725.124.924.624.524.3
10.110.613.623.737.653.364.164.265.765.566.3
66.364.665.264.863.565.065.964.963.769.4
66.165.966.068.269.872.174.673.973.173.474.574.173.973.173.473.974.775.475.374.6
74.974.674.072.771.970.970.871.472.573.073.673.9
0.7.7.9
2.34.47.09.18.18.48.99.4
10.510.611.713.213.915.616.116.616.622.1
24.225.028.029.231.231.430.532.331.831.731.531.330.830.029.730.030.131.130.730.531.431.030.931.130.528.830.330.530.931.832.832.3
1 United States savings bonds, series A-F and J, are included at current redemption value.2 Excludes guaranteed securities held by the Treasury. Not all of total shown is subject to statutory debt limitation.3 Includes commercial banks, trust companies, and stock savings banks in the United States and Territories and island
possessions; figures excjude securities held in trust departments. Since the estimates in this table are on the basis of parvalues and include holdings of banks in United States Territories and possessions, they do not agree with the estimatesin Table B-51, which are based on book values and relate only to banks within the United States.
4 Exclusive of banks and insurance companies.8 Includes trust, sinking, and investment funds of State and local governments and their agencies, and of Territories
and possessions.8 Includes partnerships and personal trust accounts.7 Includes savings and loan associations, nonprofit institutions, corporate pension trust funds, dealers and brokers,
and investments of foreign balances and international accounts in this country. Beginning with December 1946, the in-ternational accounts include investments by the International Bank for Reconstruction and Development, the InternationalMonetary Fund, the International Development Association, the Inter-American Development Bank, and various UnitedNations' funds, in special non-interest-bearing notes and bonds issued by the U.S. Government. Beginning with June 30,1947, includes holdings of Federal land banks.
8 Preliminary estimates by Council of Economic Advisers.Note.-See Note, Table B-€6.Source: Treasury Department (except as noted).
286
Digitized for FRASER http://fraser.stlouisfed.org/ Federal Reserve Bank of St. Louis

TABLE B—66.—Average length and maturity distribution of marketable interest-bearingpublic debt, 1946-67
End of year or monthAmount
out-standing
Maturity class
Within1 year
1 to 5years
5 to 10years
10 to 20years
20 yearsAverage length
Millions of dollars Years
Fiscal year:1946—1947...1948...1949—
1950—1951—1952...1953—1954...
1955...1956—1957—1958...1959...
I960—1961—1962...1963...1964...
1965...1966—1967...
1966:Jan..Feb..Mar..
May"June.
July..Aug..Sept.Oct..Nov..Dec .
1967: Jan..Feb..Mar.Apr..May.June.
July.Aug.Sept.Oct..Nov..Dec.
189,606168,702160,346155,147
155,310137,917140,407147,335150,354
155,206154,953155,705166,675178, 027
183,845187,148196,072203, 508206,489
208,695209,127210,672
217,656217,690215,150215,004213,764209,127
209,108211,402211,771215,313217,239218,025
218,796219,245219,914217,127216,650210,672
214,968218,258218,637223,271226,081226,476
61,97451,21148,74248,130
42,33843,90846,36765,27062,734
49,70358,71471,95267,78272,958
70,46781,12088,44285,29481,424
87,63789,13689,648
96,46194,22691,70491,82092,23189,136
89,13892,23892,64296,656104,398105,218
106,021101, 549102,24299,67095, 52489,648
93,95795,04095, 442100,208102,158104,363
24,76321,85121,63032, 562
51,29246,52647,81436,16129,866
39,10734,40140,66942, 55758,304
72,84458,40057,04158,02665,453
56,19860,93371,424
60,60862,89364,30664,07662,45360,933
60,93262,95762,95262.49559,45959,447
59,43466,71766,72266,54170,23871,424
71,43376,24478,19878,08877,32078,159
41,80735, 56232,26416,746
7,7928,70713,93315,65127,515
34,25328,90812,32821,47617,052
20,24626,43526,04937,38534,929
39,16933,59624,398
35,01335,00833,60733,60333,60033,596
33,59230,78330,77430,77128,00828,005
28,00225,65525,65025,64525,64124,378
24,37621,79319, 84019,83721,48718,859
17,46118, 59716,22922,821
28,03529,97925,70028,66228,634
28,61328,57826,40727,65221,625
12,63010,2339,3198,3608,355
8,4498,4398,425
8,4448,4438,4428,4418,4408,439
8,4398,4378,4368,4358,4348,433
8,4328,4318,4308,4288,4268,425
8,4238,4228,4218,4198,4188,417
43,59941,48141,48134,888
25,8538,7976,5941,5921,606
3,5304,3514,3497,208
7,65810,96015,22114,44416,328
17,24117,02316,797
17,13117,12017,09217,06517,04017,023
17,00716,98716,96716,95716,94016,923
16,90816,89316,87016,84316,81916,797
16,78016,75816,73716,71916,69716,679
Months
104937
1110
4117
101111101111
101110
Note.—All issues classified to final maturity except partially tax-exempt bonds, which were classified to earliest calldate (the last of these bonds were called on August 14,1962, for redemption on December 15,1962).
The concept of the public debt in this table is that used in budgets of the U.S. Government for years prior to fiscal 1969.Detail for the new concept are not yet available.
Source: Treasury Department.
287
Digitized for FRASER http://fraser.stlouisfed.org/ Federal Reserve Bank of St. Louis

T A B L E B-67.—Receipts and expenditures of the government sector of the national income and productaccounts, 1929-67
[Billions of dollars]
Calendar year or quarter
19291930193119321933 . . .19341935193619371938193919401941194219431944194519461947194819491950195119521953195419551956195719581959196019611962196319641965.19661967 v
1965: 1IIIII . . . .IV
1966: 1
IllIV
1967: 1IIIII . . . .IV v
Total government
Re-ceipts
11.310.89.58.99.3
10.511.412.915.415.015.417.725.032.649.251.253.250.956.858.956.068.784.889.894.389.7
100.4109.0115.6114.7128.9139.8144.6157.0168.8174.1188.8213.0227.3
Ex-pendi-tures
10.311.112.410.610.712.913.416.115.016.817.618.428.864.093.3
103.092.745.542.450.359.160.879.093.7
101.296.797.6
104.1114.9127.2131.0136.1149.0159.9166.9175.4186.1209.8240.0
Sur-plus ordeficit
nationalincome
andprod-
uct ac-counts
1.0- . 3
- 2 . 9- 1 . 8- 1 . 4- 2 . 4- 2 . 0- 3 . 1
.3- 1 . 8- 2 . 2- . 7
- 3 . 8-31 .4-44.1-51 .8-39 .5
5.414.48.5
- 3 . 27.85.8
- 3 . 8- 6 . 9- 7 . 0
2.74.9
-12.'5- 2 . 1
3.7- 4 . 3- 2 . 9
1.8- 1 . 4
2.73.2
-12.7
Federal Government *
Re-ceipts
3.83.02.01.72.73.54.05.07.06.56.78.6
15.422.939.341.042.539.143.243.338.949.964.067.270.063.872.177.681.678.789.796.598.3
106.4114.5115.0124.8143.2151.5
Ex-pendi-tures
2.62.84.23.24.06.46.58.77.48.68.9
10.020.556.185.895.584.635.629.834.941.340.857.871.077.069.768.171.979.688.991.093.0
102.1110.3113.9118.1123.4142.9164.1
Sur-plus ordeficit
nationalincome
andprod-
uct ac-counts
1.2.3
- 2 . 1
- L 3- 2 . 9- 2 . 6- 3 . 6
- 2 . 2- 1 . 3- 5 . 1
-33 .1-46.6-54 .5-42.1
3.513.48.4
- 2 . 49.16.2
- 3 . 8- 7 . 0- 5 . 9
4.05.72.1
-10 .2- 1 . 2
3.5- 3 . 8- 3 . 8
L4
-12.'6
State and localgovernment
Re-ceipts
7.67.87.77.37.28.69.18.69.19.39.6
10.010.410.610.911.111.612.915.317.619.321.123.325.227.228.831.434.738.241.646.049.953.658.663.469.575.184.791.6
Ex-pendi-tures
7.88.48.57.67.28.18.68.18.49.09.69.39.18.88.48.59.0
11.014.317.420.022.323.725.327.029.932.735.639.544.046.849.654.157.662.267.873.981.891.7
Sur-plus ordeficit
nationalincome
andprod-
uct ac-counts
- 0 . 2- . 6- . 8
-A
.5
.4
.61.31.82.52.72.61.91.0.1
- . 7- 1 . 2- . 4
j
- 1 . 1- 1 . 3- . 9
- 1 . 4- 2 . 3- . 8
.2- . 5
1.21.71.22.9
- . 1Seasonally adjusted annual rates
185.4188.3188.3193.2204.3210.6216.3220.9222.8223.2229.3
179.8182.0190.0192.6199.8204.4213.7221.2233.6238.1242.6246.2
5.66.3
- 1 . 7.6
4.56.22.6
- . 3-10 .8-14.9-13 .3
123.4124.9123.4127.6137.0141.6145.6148.6149.1148.1152.7
118.9119.9126.6128.0134.8138.4146.3151.9160.9162.8165.9167.5
4.54.9
- 3 . 2- . 42.23.2
- 1 3-11 .9-14.7-13 .2
72 474.176.277.881.183.686.087.989.390.492.6
71.372.874.776.878.880.682.784.988.390.692.795.1
1.21.21.51.12.42.93.33.01.0
- . 1
1 See Note, Table B^62.2 Surplus of $32 million.3 Deficit of $41 million.Note.—Federal grants-in-aid to State and local governments are reflected in Federal expenditures and State and local
receipts and expenditures. Total government receipts and expenditures have been adjusted to eliminate this duplication.Source: Department of Commerce, Office of Business Economics.
288
Digitized for FRASER http://fraser.stlouisfed.org/ Federal Reserve Bank of St. Louis
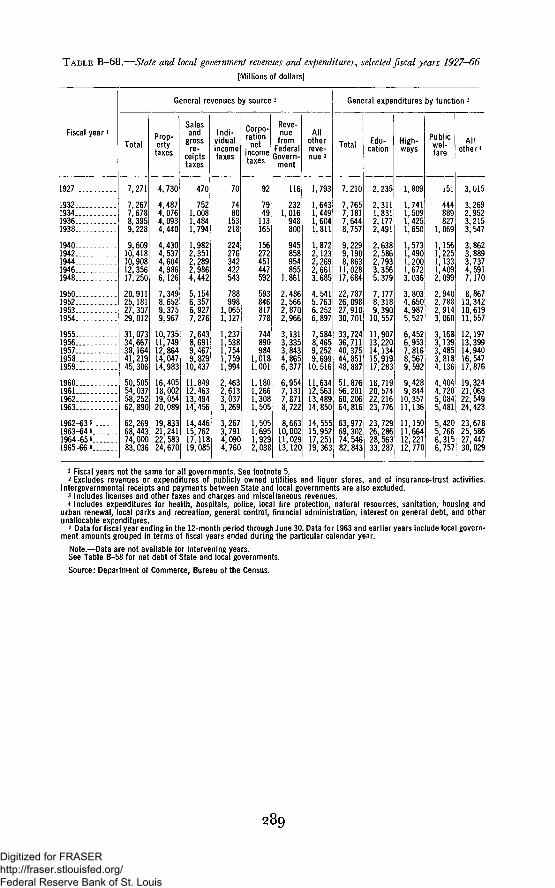
TABLE B-68.—State and local government revenues and expenditures, selected fiscal years 1927—66[Millions of dollars]
Fiscal yearl
1927
1932193419361938
19401942194419461948
1950195219531954
19551956195719581959
1960196119621963
1962-63 5.1963-64 5.1964-65 s.1965-66 s.
General revenues by source -
Total
7,271
7,2677,6788,3959,228
9,60910,41810,90812,35617,250
20,91125,18127,30729, 012
31,07334,66738,16441,21945,306
50,50554,03758,25262,890
62,26968,44374,00083,036
Prop-ertytaxes
4,
4,4,4,4
4444
730
487076093440
430537604986
6,126
7 3498,65299
1011121414
16
375967
735749864047983
40518,00219 05420,089
19212224
833241583670
Salesandgross
ceiptstaxes
470
7521,0081,4841,794
1,9822,3512,2892,9864,442
5,1546,3576,9277,276
7,6438,6919,4679,82910,437
11,84912,46313,49414,456
14,44615,76217,11819,085
Indi-vidualincometaxes
70
153218
224276342422543
788998
1,0651,127
1,2371,5381,7541,7591,994
2,4632,6133,0373,269
3,2673,7914,0904,760
Corpo-ration
netincometaxes
Reve-nue
fromFederalGovern-
ment
92
7949
113165
156272451447592
593846817778
744890984
1,0181,001
1,1801,2661,3081,505
1,5051,6951,9292,038
116
2321,016948800
945858954855
1,861
2,4862,5662,8702,966
3,1313,3353,8434,8656,377
6,9547,1317,8718,722
8,66310,00211,02913,120
Allotherreve-nue s
1,793
1,6431,4491,6041,811
1,8722,1232,2692,6613,685
4,5415,7636,2526,897
General expenditures by function -
Total
7,210
7,7657,1817,6448,757
9,2299,1908,863
11,02817,684
22,78726,09827,91030,701
7,584 33,7248,465 36,7119,252 40,3759,699 44,851
10,516 48,887
11,63412,56313,48914,850
14,55515,95217,25119,363
51,87656,20160,20664,816
63,97769,30274,54682,843
Edu-cation
2,235
2,3111,8312,1772,491
2,6382,5862,7933,3565,379
7,1778,3189,39010, 557
11,90713,22014,13415,91917,283
18,71920,57422,21623,776
23,72926,28628,56333,287
High-ways
1,809
1,7411,5091,4251,650
1,5731,4901,2001,6723,036
3,8034,6504,9875,527
6,4526,9537,8168,5679,592
9,4289,84410,35711,136
11,15011,66412,22112,770
Publicwel-fare
151
444889827
1,069
1,1561,2251,1331,4092,099
2,9402,7882,9143,060
3,1683,1393,4853,8184,136
4,4044,7205,0845,481
5,4205,7666,3156,757
Allotheri
3,015
3,2692,9523,2153,547
3,8623,8893,7374,5917,170
8,86710,34210,61911,557
12,19713,39914,94016,54717,876
19,32421,06322,54924,423
23,67825,58627,44730,029
1 Fiscal years not the same for all governments. See footnote 5.2 Excludes revenues or expenditures of publicly owned utilities and liquor stores, and of insurance-trust activities.
Intergovernmental receipts and payments between State and local governments are also excluded.3 Includes licenses and other taxes and charges and miscellaneous revenues.* Includes expenditures for health, hospitals, police, local fire protection, natural resources, sanitation, housing and
urban renewal, local parks and recreation, general control, financial administration, interest on general debt, and otherunallocable expenditures.
s Data for fiscal year ending in the 12-month period through June 30. Data for 1963 and earlier years include local govern-ment amounts grouped in terms of fiscal years ended during the particular calendar year.
Note.—Data are not available for intervening years.See Table B-58 for net debt of State and local governments.
Source: Department of Commerce, Bureau of the Census.
289
Digitized for FRASER http://fraser.stlouisfed.org/ Federal Reserve Bank of St. Louis

CORPORATE PROFITS AND FINANCET A B L E B—69.—Profits before and after taxes, all private corporations, 1929—67
[Billions of dollars]
Year orquarter
Corporate
Allin-
dus-tries
10.57.02.0
- 1 . 3- 1 . 2
1.73.45.66.84.96.39.8
15.220.324.423.819.219.325.633.030.837.742.739.939.638.046.946.145.641.151.749.950.355.758.966.374.982.279.1
profits (before taxes)inventory valuation adjustment
Manufacturing
Total
5.23.91.3
- . 5- . 41.12.13.23.82.33.35.59.5
11.813.813.29.79.0
13.617.616.220.924.621.622.019.926.024.724.019.326.324.423.326.628.832.738.743.139.0
Dur-able
goodsin-
dus-tries
2.61.5
*- 1 . 0- . 4
.3
.91.71.7.8
1.73.16.47.28.17.44.52.45.87.58.1
12.013.211.711.910.514.312.813.39.3
13.612.011.414.115.817.822.224.421.0
Non-dur-able
goodsin-
dus*tries
2.62.41.3.5*
.81.11.52.11.61.72.43.14.65.75.95.26.67.8
10.08.18.9
11.49.9
10.19.4
11.811.910.710.012.712.411.912.513.014.916.518.718.0
Trans-porta-tion,com-muni-cation,
andpublic
utilities
1.81.2.5.2
.4
.4
.7
.8
.51.01.32.03.44.43.92.71.82.23.03.04.04.64.95.04.75.65.95.85.97.07.57.98.59.5
10.111.211.912.0
and
Allother
in-dus-tries
3.41.9.2
- . 9- . 8
.3
.91.72.22.12.03.03.75.16.26.76.78.59.9
12.511.612.713.513.312.613.415.215.615.815.918.417.919.120.520.623.525.027.228.1
Cor-po-rateprof-itsbe-fore
taxes
10.03.7
- . 4- 2 . 3
1.02.33.66.36.84.07.0
10.017.721.525.124.119.724.631.535.228.942.643.938.940.638.348.648.847.241.452.149.750.355.459.466.876.683.880.1
Cor-po-ratetaxlia-bil-ity i
1.4.8.5.4.5.7
1.01.41.51.01.42.87.6
11.414.112.910.79.1
11.312.510.417.822.319.420.317.721.621.721.219.023.723.023.124.226.328.331.434.533.0
Corporate profitsafter taxes
Total
8.62.9
- . 9-2 .7
.41.62.64.95.32.95.67.2
10.110.111.111.29.0
15.520.222.718.524.921.619.620.420.627.027.226.022.328.526.727.231.233.138.445.249.347.2
Divi-dendpay-
ments
5.85.54.12.52.02.62.84.54.73.23.84.04.44.34.44.64.65.66.37.07.28.88.68.68.99.3
10.511.311.711.612.613.413.815.216.517.819.821.522.8
Un-dis-trib-utedprof-its
2.8- 2 . 6- 4 . 9- 5 . 2- 1 . 6- 1 . 0- . 2
.4
.6- . 21.83.25.75.96.66.54.49.9
13.915.611.316.013.011.011.511.316.515.914.210.815.913.213.516.016.620.625.427.824.4
Corpo-rate
capitalcon-
sump-tion
allow-ances 2
4.24.34.34.03.83.63.63.63.63.73.73.84.25.05.46.16.44.75.87.07.98.8
10.311.513.215.017.418.920.822.023.524.926.230.131.833.936.539.041.4
Profitsplus
capitalcon-
sump-tion
allow-ances 3
1929.1930.1931.1932.1933.1934.1935.19361937.1938.1939.1940.1941.1942.1943.1944.1945.1946.1947.1948.1949.1950.1951.1952.1953.1954.1955.1956.1957.1958-1959.1960.1961-1962-1963-1964.1965.1966.1967
1965: I.
IV.
Seasonally adjusted annual rates
1966: I . . . .II...-IllIV...
1967: L . . .II.—III
72.673.474.978.781.181.381.984.678.178.379.2
37.537.738.641.042.742.542.744.439.638.938.2
21.621.622.123.724.324.023.925.321.121.120.5
15.916.016.517.418.318.518.819.218.417.817.7
10.610.911.212.011.712.011.812.011.711.912.1
24.524.825.225.626.726.827.328.226.927.528.9
74.075.675.880.883.783.684.083.979.078.980.0
30.330.931.133.134.534.534.634.632.532.532.9
43.744.644.847.749.249.249.449.346.546.547.1
18.719.420.220.921.421.621.621.222.223.123.422.4
25.025.224.626.827.827.627.828.224.223.423.6
35.236.036.937.838.338.739.239.840.340.941.842.5
12.87.23.51.34.25.26.38.58.96.69.3
11.014.415.216.417.215.420.226.029.726.533.731.831.033.535.544.446.146.844.352.051.653.561.364.872.381.788.388.6
78.980.681.785.587.587.988.689.186.787.488.8
1 Federal and State corporate income and excess profits taxes.2 Includes depreciation and accidental damages.s Corporate profits after taxes plus corporate capital consumption allowances.Note.—Beginning 1962 data reflect the new depreciation guidelines issued by the Treasury Department July 11,1962,
and the investment tax credit provided in the Revenue Act of 1962.Source: Department of Commerce, Office of Business Economics.
290
Digitized for FRASER http://fraser.stlouisfed.org/ Federal Reserve Bank of St. Louis

TABLE B-70.—Sales, profits, and stockholders' equity, all manufacturing corporations (exceptnewspapers), 1947-67
[Billions of dollars]
Year orquarter
194719481949
19501951195219531954..
1955....1956195719581959
19601961196219631964
1965
1966
1965: IIIIII.—IV....
1966: IIIIII....IV
1967: I
11....
Sales(net)
150.7165.6154.9
181.9245.0250.2265.9248.5
278.4307.3320.0305.3338.0
345.7356.4389.9412.7443.1
492.2554.2
114.9124.0121.5131.9
129.9141.0137.8145.5
137.0145.1141.5
All manufacturingcorporations
Profits
Beforetaxes
16.618.414.4
23.227.422.924.420.9
28.629.828.222.729.7
27.527.531.934.939.6
46.551.8
10.712.311.012.5
12.414.012.313.1
11.412.611.0
Aftertaxes
10.111.59.0
12.911.910.711.311.2
15.116.215.412.716.3
15.215.317.719.523.2
27.530.9
6.27.26.67.5
7.28.47.47.9
6.77.66.7
Stock-holders'equity *
65.172.277.6
83.398.3
103.7108.2113.1
120.1131.6141.1147.4157.1
165.4172.6181.4189.7199.8
211.7230.3
205.4209.7213.6218.1
222.4228.6233.4236.8
240.9245.6249.7
Durable goods industries
Sales(net)
66.675.370.3
86.8116.8122.0137.9122.8
142.1159.5166.0148.6169.4
173.9175.2195.5209.0226.3
257.0291.7
60.066.062.069.0
68.075.471.177.3
71.177.072.6
Profits
Beforetaxes
7.68.97.5
12.915.412.914.011.4
16.516.515.811.415.8
14.013.616.718.521.2
26.229.2
6.17.25.87.1
7.08.26.57.5
6.27.25.4
Aftertaxes
4.55.44.5
6.76.15.55.85.6
8.18.37.95.88.1
7.06.98.69.5
11.6
14.516.4
3.34.03.34.0
3.84.63.74.2
3.44.13.1
Stock-holders'equity i
31.134.137.0
39.947.249.852.454.9
58.865.270.572.877.9
82.384.989.193.398.5
105.4115.2
102.2104.6106.4108.2
110.0114.2117.1119.3
121.6123.7126.0
Nondurable goodsindustries
Sales(net)
84.190.484.6
95.1128.1128.0128.0125.7
136.3147.8154.1156.7168.5
171.8181.2194.4203.6216.8
235.2262.4
54.958.059.462.9
61.965.666.768.2
65.968.268.9
Profits
Beforetaxes
9.09.57.0
10.312.110.010.49.6
12.113.212.411.313.9
13.513.915.116.418.3
20.322.6
4.65.15.25.4
5.45.85.85.6
5.25.45.6
Aftertaxes
5.66.24.6
6.15.75.25.55.6
7.07.87.56.98.3
8.28.59.2
10.011.6
13.014.6
2.93.23.33.5
3.43.73.73.7
3.33.53.6
Stock-holders'equity *
34.038.140.6
43.551.153.955.758.2
61.366.470.674.679.2
83.187.792.396.3
101.3
106.3115.1
103.2105.1107.2109.9
112.4114.3116.3117.5
119.3121.8123.6
1 Annual data are average equity for the year (using four end-of-quarter figures).Note.—For explanatory notes concerning compilation of the series, see "Quarterly Financial Report for Manufacturing
Corporations," Federal Trade Commission and Securities and Exchange Commission.Data are not necessarily comparable frr :-J x "— J— x- -L :-
classifications, sampling procedures, etc.:visions is contained in the following issuefirst quarter 1959, and first quarter 1965.
Comparability for certain industries was affected by changes noted in the following reports: fourth quarter 1952, firstquarter 1955, second quarter 1960, third quarter 1960, fourth quarter 1965, and second quarter 1966.
Sources: Federal Trade Commission and Securities and Exchange Commission.
291
Digitized for FRASER http://fraser.stlouisfed.org/ Federal Reserve Bank of St. Louis

TABLE B—71.—Relation of profits after taxes to stockholders' equity and to sales, all manufac-turing corporations (except newspapers), by industry group, 1947—67
Year orquarter
194719481949
1950195119521953195419551956195719581959
196019611962196319641965 . . .1966
1966:1IIIIIIV
1967:1IIIll
194719481949
19501951. .1952195319541955 .1956195719581959
1960196119621963196419651966 .
1966: 1III I I . . -IV
1967: 1III I I . . -
Allman-ufac-tur-ing
cor-pora-tions(ex-cept
news-pap-ers)
15.616.011.6
15.412.110.310.59.9
12.612.310.98.6
10.4
9.28.99 8
10.311.613.013.4
13.014.712.713.4
11.212.410.8
6.77.05.8
7.14.84 34 34.55.45.34.84.24.84.44.34.54.75.25.65.65.65.95.45.54.95.24.7
Totaldur-able i
Mo-tor
vehi-clesand
equip-ment
Air-craftand
parts
Elec-tricalma-
chin-ery,
equip-ment,and
sup-plies
t
MaIYI3-rhincnin-ery
(ex-ceptelec-
trical)
)urable goods industries
Fab-ri-
catedmetalprod-ucts
Pri-maryironandsteel
in-dus-tries
Drirri-
marynon-farrer-rous
metalinin-
dus-tries
Stone,clay,and
glassprod-ucts
Ratio of profits after Federal taxes (annual rate) to stockholders'
14.415.712.1
16 913.011.111.110.313.812.811.38.0
10.4
8 58.19.6
10.111.713.814.2
14.016.212.614.1
11.213.29.8
6.77.16.4
7.75.34 54 24.65.75.24.83.94.84.03.94.44.55.15.75.65.66.25.25.44.85.34.3
16.419.922.1
25 314.313.913.914.121.713.114.28.2
14.5
13.511.416.316.716.919.515.9
20.619.75.5
17.812.516.43.8
6.06.97.9
8.34.74 73.95.16.95.25.44.06.35.95.56.96.97.07.26.27.37.12.86.45.36.31.9
17.713 28.1
7 39.8
12.711 312.215.214.4
14.615.912.714.4
11 712.512.4
~~2.~9~2.41.61.41.82.42.32.63.33.03.13.22.72.92.62.52.6
19.016.113.6
20 914.013.713.112.412.311.412.510 212.5
9 58.9
10.010 111.213.514.8
14.315.514.614.6
12 212.811.9
15.716.311.6
14 113.011.39.88.6
10.312.610.76 99.7
7 57.89.19 6
12.514.115.0
14.417.014.814.0
12 315.212.2
17.617.010.4
16 013.410.19.87.6
10.010.79.37 38.0
5 65.97.98 3
10.113.214.7
13.916.615.612.8
12 714.211.7
12.014.710.0
14 312^38.5
10.78.1
13.512.711.47 28.0
7 26 15.47 08 89 8
10.2
9.112.29.7
10.0
7 97.96.0
12.414.28.1
15 113.811.611.110.415.516.49.36 07.9
7 l7.17.57 69.8
11.914.8
14.016.213.615.2
13 712.87.8
14.015.013.1
17 714.211.711.812.515.614.912.410 212.7
9 98.98.98 79 6
10.39.9
5.912.912.38.4
3 39.4
10.4
Profits after taxes per dollar of sales—cents
6 35.95.7
7 25.04 54 14.54.43.84.23.84.43.53.53.73.84.24.84.84.85.14.94.64.24.44.2
7 27.36.4
7.35.54 84 24.45.15.44.83.74.83.94.14.54.75.86.26.46.36.96.45.95.76.35.5
7.47.15.1
6 85.04.03 63.13.84.03.63.13.22.42.53.13.23.74.54.94.85.35.14.24.64.94.2
6 67.66.5
7 95.84 75 35 37.26.76.65.45.45.14.63.94.85.65.75.85.46.45.45.84.84.83.9
8.99.06.9
10.27.86 76 36.68.39.36.64.75.85.45.35.55.36.57.38.28.08.57.78.48.17.75.3
7.98.68.6
10.17.16 66 57.48.68.27.56.87.96.65.85.65.35.65.95.63.96.86.54.92.35.45.7
Furrur-
nitureandfjyTIX-
tures
Lum-berand
woodprod-ucts(ex-cept
furni-ture)
In-stru-mentsandre-
latedprod-ucts
equity—percent 2
18.015.98.1
15 211.38.68.26.09.2
11.68.56.38.9
6 54.97.98.3
10.113.414.2
12.415.914.514.1
10.612.012.4
6.05.53.3
5.13.42.72.62.12.93.42.62.02.72.11.62.32.42.93.73.93.64.23.93.73.23.53.6
22.919.29.1
17 511.98.57.16.3
11.18.74.75 79.4
3 64.15.68 29.9
10.110.0
8.114.611.26.2
5 58.6
10.5
11.49.95.9
9.45.54.13.53.45.43.92.32.84.21.71.92.53.33.94.03.83.35.24.12.52.43.44.0
14.414.012.1
16 713.211.611.412.312.512.412.010.613.1
11.610.612.012.114.417.520.9
17.620.522.023.2
15 716.918.7
7.77.87.1
8.66.14.84.65.56.05.85.75.46.55.95.45.96.07.28.69.58.59.3
10.19.98.07.98.8
Mis-cella-neousman-ufac-tur-ing
(in-clud-
ingord-
nance)
14.012.27.2
12 39.77.08.27.58.5
11.67.78.29.3
9.29.99 48.89.5
10.715.4
12.213.415.719.6
12.812.513.2
6.35.63.6
5.63.72.72.92.83.13.62.53.03.53.53.63.43.33.63.84.94.24.35.15.74.24.14.2
See footnotes at end of table.
292
Digitized for FRASER http://fraser.stlouisfed.org/ Federal Reserve Bank of St. Louis

TABLE B-71.—Relation of profits after taxes to stockholders* equity and to sales, all manufac-turing corporations {except newspapers), by industry group, 1947—67—Continued
Year orquarter
19471948.1949195019511952. .1953195419551956195719581959.1960.1961196219631964196519661966: I . . . . .
I I . . . .III . . .IV... .
1967: 1I I . . . .III . . .
1947.194819491950195119521953..19541955. .19561957.. .19581959.. .19601961..19621963.19641965. .19661966: 1
I I . . . .III. . .IV. . .
1967: 1II . . . .III . . .
Nondurable goods industries
Totalnon-dur-
able^
16.616.211.214.111 29.79.99 6
11.411.810 69 2
10.49.89.69 9
10.411.512.212.712.113.112.812.711.211.611.7
6.76.85.46.54.54.14.34.45.15.34.94.44.94 84.74.74.95.45.55.65.55.75.65.55.15.25.2
Foodandkin-dredprod-ucts
To-baccoman-ufac-tures
Tex-tilemill
prod-ucts
Ap-pareland
relatedprod-ucts
Paperand
alliedprod-ucts
Print-ingandpub-lish-ing
(ex-cept
news-pa-
pers)
Chem-icalsand
alliedprod-
ucts
Ratio of profits after Federal taxes (annual rate) to stockholders
17 612.811.812.38 17 68.18 18 99.38 78 79 38 78.98 89 0
10 010.711 210.011.212.311.19.4
10.311.7
4.23.33.33.42 01.92.02 12.32.42.22 22.42 32.32 32.42.72.72.72.62.82.92.62.32.52.8
10 113 612.611.59 58 49.4
10 211 411 712 513 513 413 413 613 113 413 413.514 112.114.815.314.012.114.715.8
4 15.25.14.93 83.23.74 24.85.05.25 45.45 55.75 75.95.95 95.95.46.26.35.85.15.86.4
19 518 77.6
12.78 24 24.61 85 75 84 23 57 55 85 06 26 18 5
10 910 19.4
10.910.49.55.97.17.8
18 912.17.5
10.12 94 45.14 56 18 16 34 98 67 77 29 37 7
11 712 713 311.013.814.613.69.68.6
14.4
22 016 410.716.213 910 510.19 9
11 511 68 98 19 58 57.98 18 19 39 4
10 610.211.310.011.09.09.58.6
17 214 711.411.510 39 19.49 2
10 213 011 79 0
11 410 68 5
10 39 2
12 614 215 615.015.616.415.312.113.514.1
15 915 813.217.812 210 910.711 614 714 213 311 413 712 211.812 412 914 415.215 115.216.614.713.913.013.712.2
Profits after taxes per dollar of sales—cents
8 28 34.15.83 41 92 21 02 62.61 91 63 02 52 12 42.33.13.83.63.43.93.73.42.42.72.9
4 63 12.12.8
61.01.21 i1.31.61 31 01.51 41.31 61.42.12.32.42.12.52.52.41.81.72.8
10 78 56.58.86 65 75 45 66 16.15.04 75.25 04.74 64.55.14.95.45.35.65.05.44.84.94.5
6 15.24.54.53 73.33 43 43.64.23.73 14.03 62.83 43.24.34.85.15.15.15.54.94.34.64.9
8 88.88.2
10.36 56.16.16 88.38.07.67 07.97 57.37 47.57.97.97.88.08.27.67.46.97.06.5
Petro-leumrefin-
ing
Rub-berandmis-
cella-neousplasticprod-ucts
' equity—percent 2
15 213 313.412 713 413.912 510 09 8
10 110.310 111 311 411.812 412.212.212.113.212.612.312.1
ii i10.110.410 611.111.610.69.59.59.9
10.39.7
10.810.911.111.211.111.011.211.411.210.910.7
12.412.38.7
16.914 811.111.310 613 212.211 19 1
11 09.19.39 69 2
10.611.712 211.013.311.912.59.39.09.2
4.44.73.85.84.53.63.84.04.44.44.23.54.03.63.83.73.64.14.34.44.04.64.44.53.73.43.6
Leatherand
leatherprod-ucts
14.010.46.2
10.92 15.86.05 98.57.27 05.78.56.34.46.96.9
10.511.612.913.212.712.613.112.87.9
12.1
4.33.32.23.7
.61.81.81.92.52.12.01.72.21.61.11.81.82.62.83.03.13.C3.C3.03.22.13.0
1 Includes certain industries not shown separately.2 Annual ratios based on average equity for the year (using four end-of-quarter figures). Quarterly ratios based on equity
at end of quarter only.Note.—Ratios based on data in millions of dollars.For explanatory notes concerning compilation of the series, see "Quarterly Financial Report for Manufacturing Cor-
porations," Federal Trade Commission and Securities and Exchange Commission. See also Note, Table B-70.
Sources: Federal Trade Commission and Securities and Exchange Commission.
293
Digitized for FRASER http://fraser.stlouisfed.org/ Federal Reserve Bank of St. Louis

TABLE B—72.—Sources and uses ojfunds, nonfarm nonfinancial corporate business, 1956-67[Billions of dollars]
Source or use of funds 1956
47.2
28.9
13.2
-2.7
18.4
18.3
2.33.6.44.4*
5.7-2.03.9
43.2
35.9
30.7
4.9
7.2
-4.2
.1*
-4.5.1
.47.53.4
-4.1
1957
42.0
30.6
11.8
-1.5
20.3
11.4
2.46.3.41.1
'.5-2.12.2
40.0
34.7
33.4
.6
5.3
-.1
**
-.4.3
.22.62.5
-1.9
1958
42.2
29.5
8.3
-.3
21.4
12.7
2.15.71.2-.6
4*. 3-2.62.4
42.1
27.3
28.41.4
-2.5
14.8
2.5
1.5.9
*.1
7.93.4
-.1
1959
55.5
35.0
12.6
-.5
22.9
20.5
2.23.01.23.0.34.92.43.6
54.4
36.9
31.11.7
4.1
17.4
5.6
-1.0-.4
6.6.4
.87.23.3
-1.1
1960
47.3
34.4
10.0
.2
24.2
12.9
1.63.5.71.31.03.1
-2.24.0
45.2
39.2
34.91.3
3.0
6.1
-3.9
-.51.3
-5.4.7
.26.33.7
-2.0
1961
54.7
35.6
10.2
-.1
25.4
19.1
2.54.61.8.1
6*. 61.21.9
55.0
37.0
33.22.2
1.5
18.0
3.5
1.71.9
-.2.1
.110.04.6
.3
1962
63.3
41.8
12.4
.3
29.2
21.5
.64.62.92.5.74.41.14.7
61.7
44.7
37.03.0
4.7
16.9
4.1
-.93.7
.5
.9
.98.24.1
-1.6
1963
65.9
43.9
13.6
-.5
30.8
22.0
~3.93.52.9.56.01.54.0
65.8
46.7
38.63.7
4.3
19.1
4.3
-.83.9
.5
.7
8'. 54.8
-.1
1964
70.2
50.5
18.3
-.5
32.8
19.7
1.44.03.33.61.33.4.91.8
66.9
53.5
44.03.6
5.9
13.4
.6
-2.53.2
-1.41.4
1.09.12.5
-3.3
1965
88.5
55.7
22.1
-1.7
35.3
32.7
*5.43.29.31.37.32.04.2
88.0
63.6
52.23.7
7.7
24.4
.7
-1.93.9
-2.1.8
1.213.78.2
-.5
1966
97.7
60.3
24.2
-1.6
37.7
37.4
1.210.22.17.62.17.7-.46.8
94.9
75.4
60.42.7
12.3
19.5
1.1
.7-.7
-1.22.3
1.110.95.6
-2.8
1967
Sources, total
Internal sources1
Undistributed profits L .Corporate inventory
valuation adjustment.Capital consumption
allowances1
External sources.
StocksBondsMortgagesBank loans, n.e.c...Other loansTrade debtProfits tax liability.Other liabilities....
Uses, total.
Purchases of physical assets.
Nonresidential fixedinvestment
Residential structures-Change in business
inventories
Increase in financial assets 2..
Liquid assetsDemand deposits and
currencyTime depositsU.S. Government
securities
Open-market papers-
Consumer creditTrade creditOther financial assets...
Discrepancy (uses lesssources).
92.4
59.8
20.5
- . 8
40.1
32.6
1.715.03.56.11.84.2
- 4 . 64.9
89.9
72.5
62.43.7
6.4
17.4
2.9
.74.0
-2 .71.0
1.17.65.8
- 2 . 5
!The figures shown here for "internal sources," "undistributed profits," and "capital consumption allowances"differ from those shown for "cash flow, net of dividends," "undistributed profits" and "capital consumption allowances"in the gross corporate product table in the national income and product accounts of the Department of Commerce forthe following reasons: (1) these figures include, and the statistics in the gross corporate product table exclude, branchprofits remitted from foreigners net of corresponding U.S. remittances to foreigners; and (2) these figures exclude, andthe gross corporate product figures include, the internal funds of corporations whose major activity is farming.
2 Includes some categories not shown separately.Source: Board of Governors of the Federal Reserve System.
294
Digitized for FRASER http://fraser.stlouisfed.org/ Federal Reserve Bank of St. Louis

TABLE B-73.—Current assets and liabilities of United States corporations, 1939—67[Billions of dollars]
End of yearor quarter
1939
194019411942 .19431944
1945194619471948.. .1949 \"_
1950....1951195219531954
1955195619571958...1959 V.
19601961New series 319611962 "196319641965
1966
1965: I.IIIIIIV
1966: IIIIIIIV
1967: I...II
Cur
Total
54.5
60.372.983.693.897.2
97.4108.1
123.6133.0133,1
161.5179.1186.2190.6194.6
224.0237.9244.7255.3277.3
289.0306.8
304.6326.5351.7372.2406.6
439.6
377.3385.2394.4406,6
412.1421.8429.5439.6
440.2441.1448.9
Cashon
handandin
banks
10.8
13.113.917.621.621.6
21.722.8
25.025.326.5
28.130.030.831.133.4
34.634.834.937.436.3
37.241.1
40.743.746.547.349.7
49.8
44.746.146.049.7
47.348.147.349.8
46.947.448.8
U.S.Gov-ern-ment
securi-ties
2.2
2.04.0
10.116.420.9
21.115.3
14.114.816.8
19.720.719.921.519.2
23.519.118.618.822.8
20.120.0
19.219.620.218.616.5
15.2
18.115.915.616.5
16.715.014.315.2
14.111.310.6
Current assets
Re-ceiv-ablesfromU.S.Gov-ern-ment1
0.1.6
4.05.04.7
2.7.7
Notesandac-
countsreceiv-able
22.1
23.927.423.321.921.8
23.230.0
38.342.443.0
1.12.72.82.62.4
2.32.62.82.82.9
3.13.4
3.43.73.63.43.9
4.5
3.33.23.63.9
3.94.04.24.5
4.44.64.7
55.758.864.665.971.2
86.695.199.4
106.9117.7
126.1135.8
133.3144.2156.8169.9187.9
202.6
173.2178.4183.7187.9
190.8196.7201.1202.6
202.6204.9208.9
In-ven-
tories
18.0
19.825.627.327.626.8
26.337.6
44.648.945.3
55.164.965.867.265.3
72.880.482.281.988.4
91.895.2
95.2100.7107.0113.5125.7
143.2
116.5118.8122.5125.7
129.2133.4138.3143.2
146.8147.9149.9
Othercur-rentas-
sets -'
1.4
1.51.41.31.31.4
2.41.7
1.61.61.4
1.72.12.42.43.1
4.25.96.77.59.1
10.611.4
12.914.717.819.622.9
24.2
21.422.722.922.9
24.324.624.424.2
25.424.926.0
Current liabilities
Total
30.0
32.840.747.351.651.7
45.851.9
61.564.460.7
79.892.696.198.999.7
121.0130.5133.1136.6153.1
160.4171.2
155.8170.9188.2202.2226.5
250.2
205.1210.5216.6226.5
229.3234.7241.5250.2
248.5248.2252.6
Ad-vances
andpre-pay-
ments,U.S.Gov-ern-
ment1
0.6.8
2.02.21.8
.9
.1
Notesandac-
countsPay-able
21.9
22.625.624.024.125.0
24.831.5
37.639.337.5
.41.32.32.22.4
2.32.42.31.71.7
1.81.8
1.82.02.52.73.1
4.4
2.82.93.13.1
3.33.54.04.4
4.95.45.7
47.953.657.057.359.3
73.881.584.388.799.3
105.0112.8
110.0119.1130.4140.3158.0
173.7
141.7146.4150.7158.0
158.3164.0167.8173.7
171.2174.6176.1
Fed-eralin-
cometax
liabili-ties
1.2
2.57.1
12.616.615.5
10.48.5
10.711.59.3
16.721.318.118.715.5
19.317.615.412.915.0
13.514.1
14.215.216.517.018.8
18.8
16.615.916.918.8
18.916.517.718.8
18.412.513.3
Othercur-rentlia-
bili-ties
6.9
7.17.28.78.79.4
9.711.8
13.213.514.0
14.916.518.720.722.5
25.729.031.133.337.0
40.142.5
29.834.538.742.246.6
53.3
44.045.345.946.6
48.850.852.153.3
54.155.757.4
Network-
capi-tal
24.5
27.532.336.342.145.6
51.656.2
62.168.672.4
81.686.590.191.894.9
103.0107.4111.6118.7124.2
128.6135.6
148.8155.6163.5170.0180.1
189.4
172.2174.7177.8180.1
182.7187.1188.0189.4
191.7192.8196.3
1 Receivables from and payables to U.S. Government do not include amounts offset against each other on corporations'books or amounts arising from subcontracting which are not directly due from or to the U.S. Government. Wherever possible,adjustments have been made to include U.S. Government advances offset against inventories on corporations' books.
2 Includes marketable securities other than U.S. Government.3 Generally reflects definitions and classifications used in "Statistics of Income" for 1961.
Note.—Data relate to all United States corporations, excluding banks, savings and loan associations, insurance com-panies, and beginning with the new series for 1961, investment companies. Year-end data through 1964 are based on"Statistics of Income" (Treasury Department), covering virtually all corporations in the United States. "Statistics ofIncome" data may not be strictly comparable from year to year because of changes in the tax laws, basis for filing returns,and processing of data for compilation purposes. All other figures shown are estimates based on data compiled from manydifferent sources, including data on corporations registered with the Securities and Exchange Commission.
Source: Securities and Exchange Commission.
295
Digitized for FRASER http://fraser.stlouisfed.org/ Federal Reserve Bank of St. Louis
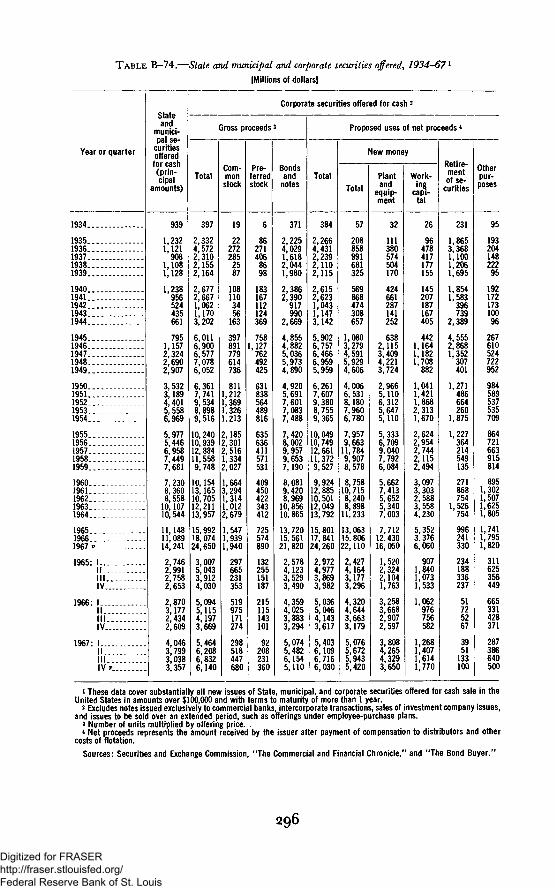
TABLE B—74.—State and municipal and corporate securities offered, 1934^67l
[Millions of dollars]
Year or quarter
1934
19351936 . . . . .193719381939
19401941 . .194219431944
194519461947 .19481949
195019511952 .19531954
19551956195719581959
19601961196219631964
196519661967 P
1965: 1I I . . .IIIIV
1966: 1IIIIIIV
1967: 1IIIIIIV v
Qtotaand
munici-
curitiesofferedfor cash(prin-cipal
amounts)
939
1 2321,121
9081 1081,128
1,238956524435661
7951,1572,3242 6902,907
3,5323,1894,4015,5586,969
5,9775,4466,9587,4497,681
7,2308,3608,558
10,10710,544
11,14811,08914,241
2,7462,9912,7582,653
2,8703,1772,4342,609
4,0463,7993,0383,357
Total
397
2 3324,5722,3102 1552,164
2,6772,6671,0621 1703,202
6 0116,9006,5777 0786,052
6,3617,7419,5348,8989,516
10,24010,93912,88411,5589,748
10,15413,16510,70512,21113,957
15,99218,07424,650
3,0075,0433,9124,030
5,0945,1154,1973,669
5,4646,2086,8326,140
Corporate securities offered for cash -
Sross proceeds 3
Com-monstock
19
22272285
2587
1081103456
163
397891779614736
8111,2121,3691,3261,213
2,1852,3012,5161,3342,027
1,6643,2941,3141,0122,679
1,5471,9391,940
297665231353
519975171274
298518447680
Pre-ferredstock
6
86271406
8698
183167112124369
7581 127
762492425
631838564489816
635636411571531
409450422343412
725574890
132255151187
215115143101
92208231360
Bondsand
notes
371
2 2254,0291,6182 0441,980
2,3862,390
917990
2,669
4 8554,8825,0365,9734,890
4,9205,6917,6017,0837,488
7,4208,0029,9579,6537,190
8,0819,4208,969
10,85610,865
13,72015, 56121,820
2,5784,1233,5293,490
4,3594,0253,8833,294
5,0745,4826,1545,110
Total
384
2,2664,4312,2392,1102,115
2,6152,6231,0431 1473,142
5 9026,7576,4666,9595,959
6,2617,6079,3808,7559,365
10,04910,74912,66111,3729,527
9,92412,88510,50112,04913,792
15,80117,84124,260
2,9724,9773,8693,982
5,0365,0464,1433,617
5,4036,1096,7166,030
Proposed uses of net proceeds4
1
Total
57
208858991681325
569868474308657
1,0803,2794,5915,9294,606
4,0066,5318,1807,9606,780
7,9579,663
11,7849,9078,578
8,75810,7158,2408,898
11,233
13,06315,80622,110
2,4274,1643,1773,296
4,3204,6443,6633,179
5,0765,6725,9435,420
l̂ew money
Plantand
equip-ment
32
111380574504170
424661287141252
6382,1153,4094,2213,724
2,9665,1106,3125,6475,110
5,3336,7099,0407,7926,084
5,6627,4135,6525,3407,003
7,71212,43016,050
1,5202,3242,1041,763
3,2583,6682,9072,597
3,8084,2654,3293,650
Work-ing
capi-tal
26
96478417177155
145207187167405
4421,1641,1821,708
882
1,0411,4211,8682,3131,670
2,6242,9542,7442,1152,494
3,0973,3032,5883,5584,230
5,3523,3766,060
9071,8401,0731,533
1,062976756582
1,2681,4071,6141,770
Retire-mentof se-
curities
231
1 8653,3681,1001,2061,695
1,8541,583
396739
2,389
4 5552,8681,352
307401
1,271486664260
1,875
1,227364214549135
271868754
1,526754
996241330
234188336237
51725267
3951
133100
Otherpur-poses
95
19320414822295
19217217310096
267610524722952
984589537535709
864721663915814
8951,3021,5071,6251,805
1,7411,7951,820
311625356449
665331428371
28738664C50C
» These data cover substantially all new issues of State, municipal, and corporate securities offered for cash sale in theUnited States in amounts over $100,000 and with terms to maturity of more than 1 year.
2 Excludes notes issued exclusively to commercial banks, intercorporate transactions, sales of investment company issues,and issues to be sold over an extended period, such as offerings under employee-purchase plans.
3 Number of units multiplied by offering price.* Net proceeds represents the amount received by the issuer after payment of compensation to distributors and other
costs of flotation.
Sources: Securities and Exchange Commission, "The Commercial and Financial Chronicle," and "The Bond Buyer."
296
Digitized for FRASER http://fraser.stlouisfed.org/ Federal Reserve Bank of St. Louis

TABLE B—75.—Common stock prices, earnings, and yields, and stock market credit, 1939—67
Year or month
Standard & Poor's common stock data
Price index1
Total(500
stocks)
Indus-trials(425
stocks)
Publicutilities
(50stocks)
Rail-roads(25
stocks)
Divi-dend
yield 2(per-cent)
Price/earn-ings
ratio 3
Stock market credit
Customer credit (excludingU.S. Government
securities)
Total
Netdebitbal-
ances «
Bankloans
to"others" 5
Bankloans tobrokers
anddealers 6
1939.1940.1941.1942.1943.1944.1945.1946.1947.1948.1949.
1950.1951.1952.1953.1954.1955.1956.1957.1958.1959.
1960.1961.1962.1963.1964..1965..1966.1967.
1966: Jan...Feb...Mar..Apr...May..June..
July..Aug..Sept..Oct..Nov..Dec...
1967: Jan...Feb...Mar..Apr...May..June..
July..Aug..Sept..Oct..Nov..Dec.
1941-43=10 Millions of dollars
12.0611.029.828.67
11.5012.4715.1617.0815.1715.5315.2318.4022.3424.5024.7329.6940.4946.6244.3846.2457.38
55.8566.2762.3869.8781.3788.1785.2691.93
93.3292.6988.8891.6086.7886.0685.8480.6577.8177.1380.9981.3384.4587.3689.4290.9692.5991.43
93.0194.4995.8195.6692.6695.30
11.7710.699.728.78
11.4912.3414.7216.4814.8515.3415.0018.3322.6824.7824.8430.2542.4049.8047.6349.3661.4559.4369.9965.5473.3986.1993.4891.0999.18
99.5699.1195.0498.1792.8592.1491.9586.4083.1182.0186.1086.5089.8893.3595.8697.5499.5998.61
100.38102.11103.84104.16100.90103.91
16.3415.0510.937.74
11.3412.8116.8420.7618.0116.7717.8719.9620.5922.8624.03'27.5731.3732.2532.1937.2244.1546.8660.2059.1664.9969.9176.0868.2168.10
74.5071.8769.2170. 0668.4967.5167.3063.4163.1165.4168.8268.8670.6370.4570.0371.7070.7067.39
67.7768.0367.4564.9363.4864.61
9.829.419.398.81
11.8113.4718.2119.0914.0215.2712.8315.5319.9122.4922.6023.9632.9433.6528.1127.0535.09
30.3132.8330.5637.5845.4646.7846.3446.72
53.6854.7851.5252.3347.0046.35
45.5042.1240.3139.4441.5741.44
44.4846.1346.7845.8047.0048.19
49.9150.4349.2746.2842.9543.46
4.055.596.827.244.934.864.173.854.935.546.596.576.135.805.804.954.084.094.353.973.233.472.983.373.173.013.003.403.20
3.023.063.233.153.303.36
3 373.603.753.763.663.593.513.363.293.243.193.19
3.153.113.073.073.183.09
13.8010.248.268.80
12.8413.6616.3317.699.366.906.64
6.639.27
10.479.69
11.2511.5014.0512.8916.6417.05
17.0921.0616.6817.6218.0817.0814.92
16.31
14.71
13.92
14.74
17.86
17.01
17.81
1,374976
1,032968
1,2491,7981,8261,9802,4453,4364,0303,9843,5764,5374,4614,4155,6025,4947,2427,0537,7057,443
10,347
7,7267,9507,8237,9917,9058,001
7,8707,8117,5257,3027,3527,4437,3457,4157,8087,9698,0858,333
8,8008,8699,162.9,534.9,43210,347
942473517499821
1,2371,2531,3321,6652,3882,7912,8232,4823,2853,280
3,2224,2594,1255,5155,0795,5215,3297,883
5,5515,7535,6455,8355,7685,7705,6675,6095,3555,1695,2175,3295,2905,3495,7185,8195,9266,166
6,6036,6076,8257,0097,0557,883
353432503515469428
561573648780
1,0481,2391,1611,0941,2521,181
1,1931,3431,3691,7271,974
s 2,1842,1152,464
5 2,2442,2702,2432,2252,2062,235
2,2032,2022,1702,1332,1352,115
2,0552,0662,0902,1502,1592,167
2,1972,2622,3372,4232,4422,464
715584535850
1,3282,1372,7821,471784
1,3311,608
1,7421,4192,0022,2482,6882,8522,2142,1902,5692,584
2,6143,3984,3524,7544,631
6 4,2774,5015,082
6 4,0953,6213,8644,5424,3804,652
3,6864,1793,5453,2683,1064,4964,6724,0454,4844,3854,0753,813
4,1954,6854,8144,6704,2965,082
1 Annual data are averages of monthly figures and monthly data are averages of daily figures.2 Aggregate cash dividends (based on latest known annual rate) divided by the aggregate monthly market value of the
stocks in the group. Annual yields are averages of monthly data.3 Ratio of quarterly earnings (seasonally adjusted annual rate) to price index for last day in quarter. Annual ratios are
averages of quarterly data.4 As reported by member firms of the New York Stock Exchange carrying margin accounts. Includes net debit balances
of all customers (other than general partners in the reporting firm and member firms of national exchanges) whose com-bined accounts net to a debit. Balances secured by U.S. Government obligations are excluded. Data are for end of period.
3 Loans by weekly reporting member banks (weekly reporting large commercial banks beginning 1965) to others thanbrokers and dealers for purchasing or carrying securities except U.S. Government obligations. Data are for last Wednesdayof period.
« Loans by weekly reporting member banks (weekly reporting large commercial banks beginning 1965) for purchasingor carrying securities, including U.S. Government obligations. Data are for last Wednesday of period.
Sources: Board of Governors of the Federal Reserve System, Standard & Poor's Corporation, and New York StockExchange.
297
Digitized for FRASER http://fraser.stlouisfed.org/ Federal Reserve Bank of St. Louis

TABLE B-76.—Business formation and business failures, 1929-67
Year or month
19291930193119321933 3
193419351936193719381939 3
1940194119421943194419451946194719481949195019511952195319541955195619571958 .195919601961196219631964196519661967
1966: JanFebMarAprMay .JuneJuly.AugSeptOct.NovDec
1967: JanFebMarAprMayJuneJulyAugSeptOct.NovDec
Indexof net
businessformation
(1957-59 =100)
123.196.7
102.3102.8108.0103.599.8
107.6103.298.397.1
104.699.895.498.0
100.6104.5106.0105.5
Newbusinessincorpo-rations(num-
ber)
132,916112,63896,10185,49192,92583,64992,819
102,545117,164139,915141,163137,112150,781193,067182,713181,535182,057186,404197,724203,797200,010
Business failures l
Busi-ness
failurerate^
103.9121.6133.4154.1100.361.161.747.845 961.169.663.054 544.616.46 54.25.2
14.320.434.434.330.728.733.242.041.648.051.755.951.857.064.460.856.353.253.351.649.0
Seasonally adjusted
109.1109.6109.6107.6106.8106.2104.8103.9102.7103.3100.6101.4102.2103.2103.3104.0105.7109.0108.4110.3110.2110.3112.9
18,08717,45117,26617,05716,64416,57716,07416,34315,76416,23316,20616,58316,70315,98716,24416,76017,62717,79916,07217,38818,40917,90818,621
50.744.150.247.445.849.452.360.856.657.255.652.454.957.149.752.148.648.643.249.349.147.442.243.2
Number of failures
Total
22,90926,35528,28531,82219,85912,09112,2449,6079 490
12,83614,76813,61911,8489,4053,2211 222
8091,1293,4745,2509,2469,1628,0587,6118,862
11,08610,96912,68613,73914,96414,05315,44517,07515,78214,37413,50113,51413,06112,364
1,084946
1,2261,106
9971,0771,0171,2491,0421,1501,1121,0551,1911,2161,2161,1601,1001,047
8431,017
913949881831
Liability sizeclass
Under$100,000
22,16525,40827,23030 19718,88011,42111,6919,2859 203
12,55314,54113,40011 6859,2823,1551 176
7591,0023 1034,8538,7088,7467,6267,0818,075
10,22610,11311,61512,54713,49912,70713,65015,00613,77212,19211,34611,34010,83310,144
916800
1,037924847885879999867957919803
1,003995981966917850708793758782718673
$100,000andover
744947
1,0551 625
979670553322287283111219163123664650
127371397538416432530787860856
1,0711,1921,4651,3461,7952,0692,0102,1822,1552,1742,2282,220
168146189182150192138250175193193252188221235194183197135224155167163158
Amount of currentliabilities (millions
of dollars)
Total
483.3668.3736.3928.3457.5334.0310.6203.2183 3246.5182.5166.7136.1100.845.331.730.267.3
204.6234.6308.1248.3259.5283.3394.2462.6449.4562.7615.3728.3692.8938.6
1,090.11,213.61,352.61,329.21,321.71,385.71,265.2
103.295.5
103.5110.196.4
123.669.9
178.1129.2108.0106.7161.5108.2113.5119.3103,893.4
104.672.6
108.993.981.670.0
195.4
Liability sizeclass
Under$100,000
261.5303.5354.2432.6215.5138.5135.5102.8101.9140.1132.9119.9100.780.330.214.511.415.763.793.9
161.4151.2131.6131.9167.5211.4206.4239.8267.1297.6
. 278.9327.2370.1346.5321.0313.6321.7321.5297.9
27.124.228.626.123.926.526.230.725.429.629.024.230.229.328.727.827.124.720.823.722.222.521.319.6
$100,000andover
221.8364.8382.2495.7242.0195.4175.1100.481.4
106.449.746.835.420.515.117.118.851.6
140.9140.7146.797.1
128.0151.4226.6251.2243.0322.9348.2430.7413.9611.4720.0867.1
1,031.61,015.61,000.01,064.1
967.3
76.071.374.884.172.597.143.6
147.4103.878.477.8
137.277.984.190.676.166.380.051.785.271.859.148.7
175.81 Commercial and industrial failures only. Excludes failures of banks and railroads and, beginning 1933, of real estate-
insurance, holding, and financial companies, steamship lines, travel agencies, etc.2 Failure rate per 10,000 listed enterprises.3Series revised; not strictly comparable with earlier data.Sources: Department of Commerce (Bureau of the Census) and Dun & Bradstreet, Inc.
298
Digitized for FRASER http://fraser.stlouisfed.org/ Federal Reserve Bank of St. Louis

AGRICULTURE
Year orquarter
1929
1930193119321933193419351936193719381939
19401941194219431944 .19451946194719481949
1950 .195119521953 . .195419551956195719581959
1960 .1961196219631964 . . . . . .19651966 .1967 v
1966: 1IIIIIIV
1967: L .IIIIIIV v
TABLE B—77.—Income from
Personal incomereceived by totalfarm population
Fromall
sources
5.47.77.29.07.27.4
7.610.114.116.516.617.220.021.123.819.5
20.422.722.119.818.417.617.817.719.518.1
18.719.019.218.718.020.321.320.1
Fromfarm
sources1
3.25.44.66.24.74.8
4.86.8
10.112.112.212.815.515.818.013.3
14.116.215.413.412 511.411.211 012.811.0
11.412.112.212.011.213.414.413.2
non-farm
sources2
2.22.32.62.72.52.6
2.83.33.94.44.44.44.65.35.86.2
6.36.56.76.45.96.26.66.66.77.0
7.26.97.06.76.86.96.96.9
agriculture, 1929-67
Income received from farming
Realized gross
Total 3
Cashreceipts
frommarket-
ings
Billions of dollars
13.9
11.58.46.47.18.69.7
10.811.410.110.6
11.113.918.823.424.425.829.534.134.731.6
32.337.136.835.033.633.134.334.037.937.5
37.939.641 142.142.444.849.748.9
11.3
9.16.44.75.36.47.18.48.97.77.9
8.411.115.619.620.521.724.829.630.227.8
28.532.932.531.029.829.530.429.733.533.5
34.034.936.237.237.139.143.242.5
Produc-tion ex-penses
7.7
6.95.54.54.44.75.15.66.25.96.3
6.97.8
10.011.612.313.114.517.018.818.0
19.422.322.621.321.621.922.423 325.226.1
26.227.028 529.629.430.933.334.4
Net to farmoperators
Exclud-ing netinven-tory
change
6.3
4.52.91.92.73.94.65.15.24.24.3
4.26.18.8
11.812.112.815.017.115.913.6
12.914.814.113.712.011.211.910 712.711.4
11.712.612.512.513.013.916.414.5
Seasonally adjusted annual rates
49 549.550.049.9
49.349.149.248.1
43 343.143.343.2
42.642.442.942.1
32 633.133.534.0
34.334.534.434.2
16 916.416.515.9
15.014.614.813.9
Includ-ing netinven-tory
change4
6.2
4.33.32.02.62.95.34.36.04.44.4
4.56.59.9
11.711.712.315.115.417.712.8
13.716.015.113.112 511.511.411 313.511.5
12.012.913 113.112.214.916.214.9
17 316.216.115.3
14.814.515.215.4
Net income perfarm, includingnet inventory
change
Currentprices
1967prices»
Dollars
945
651506304379431775639905668685
7061,0311,5881,9271,9502,0632,5432,6153,0442,233
2,4212,9462,8962,6262,6062,4632,5352,5903,1892,795
3,0433,3893,5623,6713,5104,4134,9884,705
5,3204,9804,9504,710
4,6704,5804,8004,860
1,969
1,4471,297
9211.1151,1341,9871,6382,2621,7581,851
1,8582,5783,4523,7783,5453,6194,0373,5343,9032,938
3,1443,5493,4483,1263,1022,9322,9822,9433,5833,106
3,3813,7243,8723,9473,7744,6455,0904,705
5,4805,0805,0004,760
4,7204,5804,7504,810
1 Net income to farm operators including net inventory change less net income of nonresident operators plus wagesand salaries and other labor income of farm resident workers less contributions of farm resident operators and workersto social insurance.
2 Consists of income received by farm residents from nonfarm sources, such as wages and salaries from nonfarm em-ployment, nonfarm business and professional income, rents from nonfarm real estate, dividends, interest, royalties,unemployment compensation, and social security payments.
3 Cash receipts from marketings, Government payments, and nonmoney income furnished by farms.4 Includes net change in inventory of crops and livestock valued at the average price for the year.5 Income in current prices divided by the index of prices paid by farmers for family living items on a 1967 base.Source: Department of Agriculture.
299
Digitized for FRASER http://fraser.stlouisfed.org/ Federal Reserve Bank of St. Louis

TABLE B-78.—Farm production indexes, 1929-67
[1957-59 = 1001
Year
1929...
1930...1931...1932...1933...1934...
1935...1936...1937...1938...1939...
1940...1941...1942...1943...1944...
1945...1946...1947...1948...1949...
1950...1951...1952...1953...1954...
1955...1956...1957...1958...1959...
1960...1961...1962...1963...1964...
1965...1966...1967 P..
Farmout-put »
62
6166645951
6155696768
7073828083
8184818887
8689929393
969795102103
106107108112112
115113117
Crops
Total 2
73
6977736554
7059817675
7879898388
8589859792
8991959493
969593104103
108107107112109
115112116
Feedgrains
62
5663735633
6038676565
6671817478
7582639180
8175797781
868593101106
1099910011097
111111124
Hayand
forage
79
6672746964
8266758175
8686939190
9387848483
8992909292
989410110297
103102105105105
112110115
Foodgrains
68
7479634745
5554747763
6979837288
929511110792
868510910088
83878212197
11510698102114
117118134
Vege-tables
73
7475767380
8175828181
8384899792
94105919794
9689909593
9610298102100
103110108108103
110110112
Fruitsandnuts
75
7392757671
9070938496
9399988498
891061019298
98100979899
9910394102104
S810998102111
110122100
Cot-ton
120
11313810510578
861011549796
1028810593100
747197122131
82124124134111
1201088993118
116116121125124
1217862
To-bacco
88
9589588063
76689180110
84738181113
114134122115114
117135130119130
12712696100104
112119134135129
107107116
Oilcrops
13
1414131113
2116182229
3437566050
5452556761
7165636371
78929111198
105122123128128
153165171
Livestock and products
Total 3
63
6465666761
5963626570
7175849186
8683828085
8892929396
99999799104
102106107111113
111114117
Meatani-mals
62
6366677059
5360586371
7276879788
8482817983
8995959498
1031009698106
103106108114116
111116118
Dairyprod-ucts
75
7678797978
7879798182
8489929192
9594939093
9392929798
9910110110099
101103104103105
103100100
Poul-tryandeggs
44
4544444441
4144444548
4954627171
7469686774
7881828487
869495101104
104112111115118
124131139
1 Farm output measures the annual volume of farm production available for eventual human use through sales fromfarms or consumption in farm households. Total excludes production of feed for horses and mules.
2 Includes production of feed for horses and mules and certain items not shown separately.3 Includes certain items not shown separately.
Source: Department of Agriculture,
300
Digitized for FRASER http://fraser.stlouisfed.org/ Federal Reserve Bank of St. Louis

T A B L E B—79.—Farm population, employment, and productivity, 1929—67
Year
1929
19301931193219331934
1935 . . . .1936193719381939
19401941194219431944 . . . .
1945.194619471948 . . .1949
19501951195219531954
19551956195719581959
I960..1961196219631964
196519661967 v
Farm population(April l ) i
Num-ber
(thou-sands)
30,580
30,52930,84531,38832,39332,305
32,16131,73731,26630,98030,840
30, 54730,11828 91426,18624,815
24,42025,40325,82924,38324,194
23,04821,89021,74819,87419,019
19,07818,71217,65617,12816,592
15,63514,80314,31313,36712,954
12,36311,59511,000
As per-cent of
totalpopu-
lation 2
25.1
24.824.925.125.825.5
25.324.824.223.823.5
23.122.621.419.217.9
17.518.017.916.616.2
15.214.213.912.511.7
11.511.110.39.89.4
8.78.17.77.16.7
6.45.95.5
Farm employment(thousands) *
Total
12,763
12,49712,74512,81612,73912,627
12,73312,33111,97811,62211,338
10,97910,66910,50410,44610,219
10,00010,29510,38210,3639,964
9,9269,5469,1498,8648,651
8,3817,8537,6007,5037,342
7,0576,9196,7006,5186,110
5,6105,2144,953
Familyworkers
9,360
9,3079,6429,9229,8749,765
9,8559,3509,0548,8158,611
8,3008,0177,9498,0107,988
7,8818,1068,1158,0267; 712
7,5977,3107,0056,7756,570
6,3455,9005,6605,5215,390
5,1725,0294,8734,7384,506
4,1283,8543,693
Hiredworkers
3,403
3,1903,1032,8942 8652,862
2,8782,9812,9242,8072,727
2,6792,6522,5552,4362,231
2,1192,1892,2672,3372,252
2,3292,2362 1442,0892,081
2,0361,9531,9401,9821,952
1,8851,8901,8271,7801,604
1,4821,3601,260
Farm output
Perunit oftotalinput
63
6369696559
6962737472
7275827982
8285828886
8586899091
949696
103101
105106107110109
112108109
Per man-hour
Total
28
2830302827
3129333535
3639424244
4649505657
6162687174
808691
103106
115120127135142
155161167
Crops Live-stock
ndex, 1957-59=10C
28
2730302727
3128333534
3739434144
4650505757
6361676973
778390
105105
114119124132133
146151173
48
4747474643
4446464850
5051565856
5859616266
6872747680
858992
100108
113120127137147
159170176
Cropproduc-
tionper
acre *
69
6472686151
6656767374
7677867883
8286829285
8485908988
919293
105102
109113116119116
122120121
Live-stockpro-
ductionper
breed-
unit
68
7070696862
6970717575
7580817875
7978798286
8689899392
939596
10G104
105108108111112
111118121
1 Farm population as defined by Department of Agriculture and Department of Commerce, i.e., civilian populationliving on farms, regardless of occupation.
2 Total population of United States as of July 1 includes Armed Forces abroad.3 Includes persons doing farmwork on all fan
h. . • A • • • rr r > t _ • _ • * .
r o ._ farms. These data, published by the Department of Agriculture, StatisticalReporting Service, differ from those on agricultural employment by the Department of Labor (see Table B-22) because ofdifferences in the method of approach, in concepts of employment, and in time of month for which the data are collected.For further explanation, see monthly report on "Farm Labor," September 10,1958.
Sources: Department of Agriculture and Department of Commerce (Bureau of the Census).
284-593 0—68301
Digitized for FRASER http://fraser.stlouisfed.org/ Federal Reserve Bank of St. Louis

T A B L E B—80.—Indexes of prices received and prices paid byfarmers, and parity ratio, 1929—67
[1957-59=100]
Year or month
1929 .
19301931193219331934193519361937..19381939
194019411942194319441945194619471948 .1949
195019511952195319541955195619571958 .1959
I9601961196219631964196519661967
1966' Jan 15Febl5Mar 15Apr 15 . .May 15June 15
July 15Augl5Sept 15 . .Oct 15Nov 15Dec 15
1967- Jan 15Feb 15Mar 15 .Apr 15 . ...May 15June 15
July 15Aug 15Sept 15Oct 15Nov 15Dec 15
Prices received by farmers
Allfarmprod-
61
52362729374547514039
425166
6 808 82e 866 98114119103
107125119105102969597104100
999910110098103110104
109112112110109109
111112112110107106
105104103101104105
106106104104103105
Crops
Allcrops *
61
52342632444649533637
414865848991102118114100
10411912010810810410510110099
99102104107107105105100
103105104106107108
110107105104103103
10110010010099102
10110097100102104
Foodgrains
55
44272131434651573534
40465770788195128118103
1061151161111101071061069896
969910710690778784
818281808289
969493898990
888589878985
798079827980
Feed grainsand hay
Total
74
67463136606865794546
54587296108106127161162112
1221431471301281161151059798
969598104105110114110
111112110110111111
115118120116115118
117116117115115116
11210410510197101
Feedgrains
77
68442836607068844544
54587397109104131171170109
1231471501321301161161059798
949496102103108112108
108109107108110110
114117119114113115
115114115114114115
111103103979397
Cot-ton
57
40241926393838362728
3243606466699110510494
10812911910210510410310197102
97100104104100948273
868789929295
966969737171
646766666465
687169889889
To-bacco
35
29201822323533413631
28325166727478777882
8390898991909396100104
103109109102101106114114
111112113113113113
114116117116115116
115116116115115115
115116111111112115
Oil-bear-ing
crops
62
48321925455552564242
4560808897100114158153106
1201481291221331091111069896
93112108113112116128121
117121119121124128
138148133128128129
128125126125124125
122117115114114115
Livestock and products
Alllive-stockandprod-ucts^
62
52382827324446494341
42536677768294111122106
10813011910497908894106100
9898999591101113107
114118117113110110
111116116114110109
109107105102108108
110110110107104105
Meat
mals
50
43302019223838423736
3546606662
6676 81107117101
1101331159492807689109102
96971019488104116109
120124123119117117
115119115111105105
107107105104114115
116114112107103103
Dairy
ucts
65
55433334404549514543
475563
6 77
6 896 10410611798
9711211810496969910199100
1011019999100102114119
108108108106104104
112118125127126125
121119117113112112
114118122125125125
Poul-tryandeggs
102
81625147567473706961
627796121112126127141153140
11814413014011312111210?10890
101929292909210?84
10110811110395
97103106101103100
9690918?8078
848184777782
See footnotes at end of table.
302
Digitized for FRASER http://fraser.stlouisfed.org/ Federal Reserve Bank of St. Louis

T A B L E B-80.—Indexes of prices received and prices paid by farmers, and parity ratio, 1929—67—Continued[1957-59=100J
Year or month
Prices paid by farmersAll
items,in-
terest,taxes,
andwagerates
(parityindex)
Commodities and services
Allitems
Fam-
livingitems
Production items
Allproduc-
tionitems1
FeedMotor
ve-hicles
Farmma-
chin-ery
Fer-til-izer
Inter-ests Taxes3 Wage
rates*
Parityratio «
1929193019311932193319341935193619371938193919401941194219431944194519461947194819491950195119521953195419551956195719581959196019611962196319641965196619671966: Jan 15....
Feb 15...Mar 15.Apr 15...May 15...Junel5._July 15...Augl5...Sept 15...Oct 15Nov 15...Dec 15...
1967: Jan 15...Feb 15...Mar 15...Apr 15...May 15...June 15..July 15..Aug 15...Sept 15..Oct 15...Nov 15...Dec 15...
8796989595949598100102102103105107107110114117112112113114114114114114115115115115116116116116117117118117117118117118
555144383843454548454445485561646672859288901001009696959698101101101101103104104106109111107108109109109109109110111110110110111111111111111111112111111112111112
545043373843434345434242455258616471838885
8694959494959699100101102102103104105107110112108109110110110110110111111111111111111111111111112112113113113113114114
565243383844464650474647505763666773859591941041049797969598100102101101103104103105108110107108108108108108109109110109109109110110110110110111111110110110109110
6861433237525355624747505466788786100118125103105118126114113106103101991009898100104103104109109105106105105106106110111113112111113113112112112110110109107107106105106
3635353434363738394240404245475153556371787883878686878996100104102102105109111113117122
116
116118
117119118118
119
121121
122124124
4343424039404142434443434346484949515867767883868787879296100104107110111113116119124130
122
124'
126
126
127
130
132
8583756661696864676766646471767779798896989410010210310210110010010010010010010010099100100100
100100
100
100
100
100101
101
100
100
11611310810190807468646058565451464341404243454954596368748391100109120131145162182206232259232232232232232232232232232232232232261261261261261261261257257257257257
5657565144383636363837383838373739434856606568717477818793100107117125132139147156166178165165165165165165165165165165165166178178178178178178178178178178178178
323024181517182022222222263445546266727674738187888889929699105109110114116119125135146127127127138138138135135135140140140137137137146146146148148148152152152
77 8581 (88)93 (98)105 (109)113 (116)108 (110)109 (111)113 (115)115 (116)110 (111)100 (100)101 (102)107 (108)100 (101)92 (93)89 (89)
86)(85)(85)
75 (80)74 (80)74 (79)72 (77)74 (79)74 (80)74 (80)75 (80)73 (7873 (7873 (7873 (79
1 Includes items not shown separately.- Interest payable per acre on farm real estate debt.3 Farm real estate taxes payable per acre (levied in preceding year).4 Monthly data are seasonally adjusted.5 Percentage ratio of prices received for all farm products to parity index, on a 1910-14=100 base. The adjusted parity
ratio (shown in parentheses in the table) reflects Government payments made directly to farmers.6 Includes wartime subsidy payments.Source: Department of Agriculture.
303
Digitized for FRASER http://fraser.stlouisfed.org/ Federal Reserve Bank of St. Louis

Year
1929
19301931193219331934
19351936193719381939
194019411942.19431944
19451946194719481949
1950 ....1951195219531954 ....
19551956195719581959
1960196119621963.1964
196519661967 v
T A B L E B-81.—Selected measures of farm resources and inputs
Cropsharvested(millionsof acres) 1
Total
365
369365371340304
345323347349331
341344348357362
354352355356360
345344349348346
340324324324324
324303295300301
298295308
Exclu-sive ofuse forfeed forhorsesandmules
298
304303311281247
289269295301286
298304309320326
322323329332338
326326334335335
330315316317318
319299291296297
294291304
Live-stockbreed-ingunits(1957-59 =100)2
92
9293959898
8690878793
9594104117114
1091071049899
102103103100104
10610410199100
979899100101
1009797
Man-hoursof
farmwork(bil-lions)
23.2
22.923.422.622.620.2
21.120.422.120.620.7
20.520 020.620.320.2
18.818.117.216.816.2
15.115.214 514.013.3
12.812.011.110.510.3
9.89.59.18.88.4
7.97.57.4
Total
98
9796939186
8889949194
9797100101101
999999100101
101104103103102
1021019999102
101101101102103
103105107
Index
Farmlabor
218
216220213212190
198192208193194
192188194191190
177170162158152
142143136131125
1201131049997
9289858379
747070
, 1929-67
numbers of inputs (1957-59 = 100)
Farmreal
estate 3
92
9189868786
8889909192
9292918988
8891929595
97989999100
10099100100100
100100101101102
1009998
Me-chani-cal
powerandma-
chinery
38
4038353232
3335384040
4244485051
5458647280
8692969798
999910099101
100979799101
101104108
Ferti-lizerandlime
21
2116111214
1720242324
2830343843
4553565761
6873808388
90919497109
110116124141155
164185200
Feed,seed,andlive-stockpur-
chases 4
27
2623242424
2331293037
4546576364
7269737269
7280818082
869193101106
109123121124123
124128126
Miscel-laneous
76
7678797669
6668687072
7374757676
7677787482
8588889191
949895100105
106109113115120
124127135
1 Acreage harvested (excluding duplication) plus acreages in fruits, tree nuts, and farm gardens.2 Animal units of breeding livestock, excluding horses and mules.3 Includes service buildings and improvements on land.* Nonfarm inputs associated with farmers' purchases.Source: Department of Agriculture.
304
Digitized for FRASER http://fraser.stlouisfed.org/ Federal Reserve Bank of St. Louis

TABLE B-82.—Comparative balance sheet of agriculture, 1929-68
[Billions of dollars]
Beginning ofyear
1929
19301931193219331934
19351936193719381939
19401941.194219431944
19451946194719481949
195019511952 . . . .19531954
19551956195719581959
19601961196219631964
1965196619671968 v
Assets
Total
68.5
52.955.062.973.784.6
94.2103.5116.4127.9134.9
132.5151.5167.0164.3161.2
165.1169.6177.9185.8202.5
203.5203.9212.4220.7230.0
'38.5255.7?69.5281.2
Realestate
48.0
47.943.737.230.832.2
33.334.335.235.234.1
33.634.437 541.648.2
53.961.068.573.776.6
75.386.695.196.595.0
98.2102.9110.4115.9124.4
129.9131.4137.4143.6152.3
161.3172.2182.0191.5
Other physical assets
Live-stock i
6.6
6.54.93.63.03.2
3.55.25.15.05.1
5.15.37 l9.69.7
9.09.7
11.913.314.4
12.917.119.514.811.7
11.210.611 013.917.7
15.615.616.417.315.8
14.417.518.8
Ma-chin-eryand
motorvehi-cles
3.2
3.43.33.02.52.2
2.22.42.63.03.2
3.13.34.04.95.4
6.55.45.37.4
10.1
12.214.116.717.418.4
18.619.320.220.222.1
?2.322.022.522.724.1
25.527.128.9
Crops 2
2.5
2.73.03.85.16.1
6.76.37.19.08.6
7.67.98.89.09.2
9.68.38.37.69.3
7.88.08.79.29.9
8.99.7
10.0
House-hold
furnish-ingsand
equip-ment
4.0
4.24.24.95.05.3
5.66.17.78.59.1
8.69.7
10.39.99.9
10.010.510.09.99.8
9.68.99.19.08.8
8.68.68.5
67.7
Financial assets
De-positsandcur-rency
3.6
3.23.54.25.46.6
7.99.4
10.29.99.6
9.19.19.49.49.4
9.49.59.49.5
10.0
9.28.78.89.29.2
9.610.010.3
U.S.savingsbonds
.2
.45
1.12.2
3.44.24.24.44.6
4.74.74.74.64.7
5.05.25 15.15.2
4.74.64.54.44.2
4.24.14.0
Invest-mentin co-opera-tives
0.6
.8
.99
1.01.1
1.21.41.51.71.9
2.12.32.52.72.9
3.13.33 53.74.0
4.44.75.05.35.7
6.06.57.0
22.0
Claims
Total
68.5
52.955.062 973.784.6
94.2103.5116.4127.9134.9
132.5151.5167.0164.3161.2
165.1169.6177.9185.8202.5
203.5203.9212.4220.7230.0
238.5255.7269.5281 2
Realestatedebt
9.8
9.69.49.18.57.7
7.67.47.27.06.8
6.66.56 46.05.4
4.94.84.95.15.3
5.66.16.77.27.7
8.29.09.8
10.411.1
12.112.813.915.216.8
18.921.223.325.0
Otherdebt
5.0
3.43.94 14.03.5
3.43.23.64.26.1
6.87.08.08.99.2
9.49.89 6
10.012.6
12.813.414.816.618.1
18.620.422.424 9
Pro-prie-tors'equi-ties
53.9
42.944.652 463.775.7
85.995.5
107.9118.6123.5
120.1138.4152.3148.2144.3
147.5150.8158 5165.4178.8
178.6177.7183.7188.9195.1
201.0214.1223.8231 3
1 Beginning with 1961, horses and mules are excluded.2 Includes ail crops held on farms and crops held off farms by farmers as security for Commodity Credit Corporation
loans. The latter on January 1,1967, totaled $447 million.
Source: Department of Agriculture.
305
Digitized for FRASER http://fraser.stlouisfed.org/ Federal Reserve Bank of St. Louis

INTERNATIONAL STATISTICSTABLE B-83.—United States balance of payments, 1947-67
[Millions of dollars]
Year or quarter
Exports of goods and services
TotalMer-
chan-dise^
Mili-tarysales
Income oninvestments
Pri-vate
Gov-ern-ment
Otherserv-ices
Imports of goods and services
TotalMer-chan-dise^
Mili-taryex-
pend-itures
Otherserv-ices
Bal-anceon
goodsand
serv-ices
Remit-tances
andpen-sions
194719481949
19501951195219531954
19551956195719581959
I9601961196219631964
196519661967
1 9 6 5 : L .I I .I l lIV.
1 9 6 6 : I . .I I .Il lIV.
1 9 6 7 : I . .I I .
19,73716,78915J770
13,80718,74417,99216,94717,759
19,80423,59526,48123,06723,489
27,32528,63130,35032,42637,099
39,14743,03945,603
16,01513,19312,149
10,11714,12313,31912,28112,799
14,28017,37919,39016,26416,295
19,48919,95420,60422,07125,297
26,24429,16830,716
192182
200161375300302
335402656657747
844847
1,173
1,0361,2381,297
1,4841,6841,6241,6581,955
2,1702,4682,6122,5382,694
3,0013,5613,9484,1514,929
5,3765,6505,969
6610298
109198204252272
274194205307349
349380471498460
512595643
2,6202,2562,226
2,0972,7392,8452,5642,551
2,8803,3933,8993,6583,849
4,1514,3344,6715,0495,666
6,1716,7797,101
8,20810,3499,621
12,02815,07315,76616,56115,931
17,79519,62820,75220,86123,342
23,32423,12225,30526,57328,637
32,20337,93740,203
5,9797,5636,879
9,10811,20210,83810,99010,354
11,52712,80413,29112,95215,310
14,73214,51016,18716,99218,621
21,47225,51026,367
455799621
5761,2702,0542,6152,642
2,9012,9493,2163,4353,107
3,0692,9813,0832,9362,861
2,9213,6944,249
1,7741,9872,121
2,3442,6012,8742,9562,935
3,3673,8754,2454,4744,925
5,5235,6316,0356,6457,155
7,8108,7339,587
11,5296,4406,149
1,7793,6712,226386
1,828
2,0093,9675,7292,206
147
4,0015,5095,0455,8538,462
6,9445,1025,400
-728-631-641
-533-480-571-644-633
-597-690-729-745-815
-697-722-778-891-896
-1,024-1,010-1,364
Seasonally adjusted annual rates
35,07240,72040,32040,476
42,04442,47243,65243,988
45,44445,44845,916
22,51227,52027,24427,700
28,81228,72429,52829,608
30,70430,86830,576
840768920848
836888824840
1,3561,344820
5,4245,6565,3125,112
5,2645,5285,7766,032
5,6925,5446,672
572592584300
612612572584
620644664
5,7246,1846,2606,516
6,5206,7206,9526,924
7,0727,0487,184
28,92832,55632,93234,396
35,98837,06039,04839,652
40,01640,15240,440
18,67621,90022,22423,088
24,10024,90026,32026,720
26,64826,23226,220
2,6842,8443,0163,140
3,4443,6443,8123,876
4,1804,2804,288
7,7,7,
568812692
8,168
8,4448,8,9
999
516916056
188640932
6,8,7,6,
6,
144164388080
0565,4124,4,
5,5,5,
604336
428296476
- 9 2 8-1,200
-996-972
-964-980
-1,112-984
-1,056-1,580-1,456
See footnotes at end of table.
306
Digitized for FRASER http://fraser.stlouisfed.org/ Federal Reserve Bank of St. Louis

TABLE B-83.—United States balance of payments, 1947-67—Continued
[Millions of dollars]
Year orquarter
U.S.Gov-ern-ment
grantsand
capi-tal,net a
U.S. private capital,net
Directinvest-ment
Otherlong-term
Short-term
For-eigncapi-tal,net 2
Errorsand
unre-cordedtrans-actions
Li-quiditybasis 3
Balance
Offi-cial
reservetrans-actionsbasis *
Changes in selected lia-bilities (decrease ( - ) ) «
To foreignofficial holders«
Liquid Non-liquid
Toother
foreignhold-
Changesin goldconvert-ible cur-rencies,
andIMFgold
trancheposition
(increase( ) )
1947.1948.1949.
1950.1951.1952.1953.1954.
1955.1956.1957.1958.1959.
1960.1961 .1962.19631964.
1965.1966.1967 i
1965:1 . . . .II —ML.IV...
1966:1 . . . .II —I I L .IV...
1967:1IIIII
-6,121-4,918-5,649
-3,640-3,191-2,380-2,055-1,554
-2,211-2,362-2,574-2,587-1,986
-2,769-2,780-3,013-3,581-3,560
-3,375-3,446-4,249
- 7 4 9- 7 2 1- 6 6 0
- 6 2 1- 5 0 8- 8 5 2- 7 3 5- 6 6 7
- 8 2 3-1,951-2,442-1,181-1,372
-1,674-1,599-1,654-1,976-2,435
-3,418-3,543-2,885
- 4 9- 6 9- 8 0
- 4 3 5- 4 3 7- 2 1 4
185- 3 2 0
- 2 4 1- 6 0 3- 8 5 9
-1,444- 9 2 6
- 8 5 6-1,025-1,227-1,695-1,961
-1,078- 2 5 7
-1,144
- 1 8 9- 1 1 6
187
- 1 4 9- 1 0 3
- 9 4167
- 6 3 5
- 1 9 1- 5 1 7- 2 7 6- 3 1 1
- 7 7
-1,349-1,556
- 5 4 4- 7 8 5
-2,146
753- 4 1 3
-1,023
- 4 3 2- 3 6 1
44
18154052
146249
297615545186736
365707
1,021689685
2782,5123,897
9491,193
786
- 1 1500627366191
515568
1,184511423
- 9 2 2- 9 0 4
-1,053- 2 8 5- 9 4 9
- 4 1 5- 3 0 2- 9 1 5
4,210817136
- 3 , 4 8 9- 8
- 1 , 2 0 6- 2 , 1 8 4- 1 , 5 4 1
- 1 , 2 4 2- 9 7 3
578- 3 , 3 6 5- 3 , 8 7 0
-3,901-2,370-2,203-2,671-2,800
-1,335-1,357-2,283
- 3 , 4 0 3- 1 , 3 4 7- 2 , 7 0 5- 2 , 0 4 4- 1 , 5 4 9
- 1 , 3 0 4225
- 2 , 8 9 7
• 1,4480 681»456
1,6731,075
- 1 8- 1 , 5 9 5
254
303
100802
3081,083
214620
1,554
1312,384
-3,315-1,736
- 2 6 6
1,758- 3 3
- 4 1 51,256
480
182- 8 6 9
-1,1652,2921,035
2,145606
1,533378171
1,222568
Seasonally adjusted annual rates Quarterly totals unadjusted
3,3123,8602,8803,448
3,9003,9523,0362,896
4,8044,0523,892
-4,-3,-2,-2,
832456512872
-2,536-4,024-3,600-4,
-2,-2,-3,
012
488592576
-2,640372
-1,360-684
-1,008-276-20276
-724-688
-2,020
8441,528332308
-380-240-108-924
-616-1,268-1,184
1,240-300-820
1,
992
0604,3641,3,
34,3,
504120
292908492
212-452-980-440
-932-7921,108-592
-1,148-2,212
616
-3,272796
-1,828-1,036
-2,604-488-660
-1,676
-2,116-2,188-2,544
-3,336956828
-3,664
-1,772- 7 0 03,444
- 7 2
-7,260-3,312
l f "
-861-107253697
-85254
-598-199
-78547281
-23-16-18157
25263111403
333562118
201-149712
-633
47527
1,211671
-71194
1,302
8426841
271
4246882
1,027- 4 1 9- 3 7 5
1 Adjusted from customs data for differences in timing and coverage.2 Includes certain special Government transactions.3 Equals changes in liquid liabilities to foreign official holders, other foreign holders, and changes in official reserve assets
consisting of gold, convertible currencies, and the U.S. gold tranche position in the IMF.* Equals changes in liquid and nonliquid liabilities to foreign official holders and changes in official reserve assets con-
sisting of gold, convertible currencies, and the U.S. gold tranche position in the IMF.5 Includes short-term official and banking liabilities, foreign holdings of U.S. Government bonds and notes, and certain
nonliquid liabilities to foreign official holders.o Central banks, governments, and U.S. liabilities to the IMF arising from reversible gold sales to, and gold deposits with
the U.S. Data for years before 1960 include estimates of official transactions in marketable U.S. Government bonds andnotes.
7 Private holders; includes banks and international and regional organizations, excludes IMF.•Not reported separately.9 Includes change in Treasury liabilities to certain foreign military agencies; excluding these changes, data ($ millions)
are 1,258 (I960), 741 (1961), 918 (1962). Includes changes in liabilities to international nonmonetary institutions.10 Average for the first 3 quarters on a seasonally adjusted annual rates basis.
Note.—Data exclude military grant-aid and U.S. subscriptions to International Monetary Fund.
Source: Department of Commerce, Office of Business Economics.
307
Digitized for FRASER http://fraser.stlouisfed.org/ Federal Reserve Bank of St. Louis

TABLE B—84.—United States merchandise exports and imports, by commodity groups, 1958—67
[Millions of dollars]
Year or quarter
19581959
19601961196219631964
196519661967 v
1965:1IIIllIV
1966: 1IIIIIIV
1967:1IIIIIIV v
Merchandise exports i
Total, includ-ing reexports 2
Sea-sonally
ad-justed
5,5896,9406,9207,090
7,1947,2577,4397,500
7,7757,7777,7757,688
Unad-justed
16,37316,418
19,63520,19020,97322,42725,690
26,70029,37930,942
5,5937,1306,4817,496
7,0787,4357,0257,841
7,6857,9677,2768,014
Domestic exports
Total 2 *
16,20816,234
19,43419,94420,70322,14325,338
26,35728,94430,555
5,5227,0446,3917,400
6,9787,3056,9197,742
7,5887,8677,1787,922
Food,bever-ages,
and to-bacco
2,6882,852
3,1673,4663,7434,1884,637
4,5205,1864,713
8461,1631,1771,334
1,2521,2571,3101,367
1,1291,1571,1341,295
Crudemate-rialsand
fuels s
3,0512,996
3,9423,8633,3553,7744,336
4,2744,4034,723
9161,170
9861,202
1,0231,0861,0271,267
1,1591,2021,1251,233
Man-ufac-tured
goods6
11,54611,171
12,55912,74813,65514,25916,388
17,38819,10820,752
3,7664,7184,1514,753
4,6434,8884,5315,046
5,2005,4544,8365,297
Merchandise imports
General imports 3
Total*
Sea-sonally
ad-justed
4,6665,4565,4255,736
6,0216,3366,5926,661
6,6886,5936,5427,102
Unad-justed
13,26215,629
15,01914,71616,39217,14018,684
21,36625,54226,816
4,6095,4865,3705,901
5,8946,3346,5456,769
6,6206,5836,4047,209
Food,bever-ages,
and to-bacco
3,5503,580
3,3923,4553,6743,8634,022
4,0134,5894,701
8281,027
9121,246
1,1121,1651,1121,200
1,2121,1251,1001,264
Crudemate-rialsand
fuels «
4,0624,580
4,3804,3034,6404,6924,976
5,3855,6745,337
1,2931,3881,3021,402
1,4101,4381,4561,370
1,3851,3471,2541,360
Man-ufac-tured
goodse
5,2837,090
6,8476,5237,6268,0669,096
11,23814,41315,717
2,3312,8972,7523,258
3,1843,5173,7653,947
3,8123,8463,7804,280
Grossmer-chan-dise
tradesur-plus,sea-
sonallyad-
justed 7
3,111789
4,6165,4744,5815,2877,006
5,3343,8374,126
9231,4841,4951,354
1,173921847839
1,0871,1841,233
586
1 Beginning I960, data have been adjusted for comparability with the revised commodity classifications effective in 1965.2 Totals exclude Department of Defense shipments of grant-aid military supplies and equipment under the Military
Assistance Program.3 Total arrivals of imported goods other than intransit shipments.4 Total includes commodities and transactions not classified according to kind.5 Includes fats and oils.« Includes machinery, transportation equipment, chemicals, metals, and other manufactures. Export data for these
items include military grant-aid shipments.7 Exports, excluding military grant-aid, less general imports; quarterly data seasonally adjusted.
Note.—Data are as reported by the Bureau of the Census. Export statistics cover all merchandise shipped from the U.S.customs area, except supplies for U.S. Armed Forces. Export values are f.a.s. port of export and include shipments underAgency for International Development and Food for Peace programs as well as other private relief shipments. Importvalues are defined generally as the market value in the foreign country, excluding the U.S. import duty and transportationcosts such as ocean freight and marine insurance.
Because of revisions, subgroups do not include all data in the totals.
Source: Department of Commerce, Bureau of International Commerce.
308
Digitized for FRASER http://fraser.stlouisfed.org/ Federal Reserve Bank of St. Louis

TABLE B—85.—United States merchandise exports and imports, by area, 1961—67
[Millions of dollars]
Area 1961 1962 1963 1964 1965 1966
January-November
1966 1967
Exports (including reexportsand special category ship-ments): Total
Developed countriesDeveloping countries
CanadaOther Western HemisphereWestern Europe iEastern EuropeAsiaAustralia and OceaniaAfrica .
General imports: Total
Developed countriesDeveloping countries
CanadaOther Western Hemisphere-Western Europe iEastern EuropeAsiaAustralia and OceaniaAfricaUnidentified countries 2 . . . .
20,999
13, 5637,303
3,8263,8477,237
1334,652
445859
14,716
8,9095,719
3,2703,7254,062
812,583
320672
3
21,700
13,9857,589
4,0453,6797,633
1254,676
5191,023
16,392
10,2506,035
3,6603,9314,544
792,960
44075424
23,347
15,1248,056
4,2513,6928,171
1675,448
5651,053
17,140
10,8076,242
3,8294,0214,731
813,192
502777
7
26,508
17,2028,966
4,9154,2929,096340
5,802804
1,259
18,684
11,8956,676
4,2394,1515,208
993,62044091710
27,478
18,3159,023
5,6434,2749,224
1406,012956
1,229
21,366
14,0687,144
4,8324,3716,155
1374,52845387812
30,320
20,01010,112
6,6614,7699,805
1986,733805
1,349
25,542
17,5907,762
6,1254,7047,678
1795,2765949797
27,603
18,2579,164
6,0774,3158,979
1826,094730
1,226
23,302
15,9877,144
5,4974,3216,994
1614,871551899
28,751
19,4009,169
6,5514,3069,178
1826,588
8521,094
24,394
17,2187,005
6,4314,2327,292
1624,916
529825
7
1 Includes Finland, Yugoslavia, Greece, and Turkey.2 Consists of certain low-valued shipments and some uranium imports, not identified by country.
Note.—Developed countries include Canada, Western Europe, Japan, Australia, New Zealand, and the Republic ofSouth Africa. Developing countries include rest of the world except Communist areas in Eastern Europe and Asia andunidentified countries.
Source: Department of Commerce, Bureau of International Commerce.
309
Digitized for FRASER http://fraser.stlouisfed.org/ Federal Reserve Bank of St. Louis

TABLE B-86.—United States overseas loans and grants, by type and area, fiscal years 1962-67[Millions of dollars]
Type of program and fiscalperiod
Total economic and militaryloans and grants:1
1962-66 average.LoansGrants
1967 2Loans . .Grants
Total economic loans and grants:1962-66 average
Loans..Grants
1967LoansGrants
Developed countries:1
1962-66 averageLoansGrants
1967LoansGrants
Less developed countries:3
1962-66 averageLoans.Grants
1967LoansGrants
Economic loans and grants forless developed countries, byprogram:
Agency for InternationalDevelopment:
1962-66 average1967.. - . . . : : : " "
Food for Freedom:1962-66 average1967
Export-Import Bank long-term loans:
1962-66 average1967
Other economic programs:4
1962-66 average1967
Addendum—Repayments andinterest on economic and mili-tary loans:5
1962-66 average1967
Net obligations and loan authorizations
Total
6,2552,6473,6076,9383,7493,188
4,7022,5102,1925,2903,0462,244
14011030
520512
8
4,5622,4002,1624,7712,5352,236
2,3012,249
1,5321,031
270947
459543
1,2081,591
NearEastand
SouthAsia
1,9981,243
7561,6731,107
566
1,6681,224
4431,251
994258
1,6681,224
4431,251
994258
811506
790535
57196
914
239341
LatinAmerica
1,213730483
1,486990496
1,125720404
1,398973425
1,125720404
1,398973425
557556
17670
117497
275276
258367
Vietnam
510*
511542- 1542
308
308542- 1542
308
308542- 1542
241467
6875
352
EastAsia
942200742996293702
526194332588292297
6363
9898
462130332490194297
222244
187138
1964
3444
128166
Africa
430169261421206215
407169238388200188
407169238388200188
212184
139165
3414
2125
3653
Europe
590245344986856130
23918752
503490
13
744628
322314
8
16514124
181176
5
2*
1186
44176
524581
Otherandnon-
regional
57260
511834297537
42916
413620100520
311
100100
42715
412520
520
255292
5243
119185
2131
1 Includes military loans and grants averaging $1,553 million for 1962-66 and totaling $1,647 million in 1967. Of theseamounts, $431 million and $695 million, respectively, were to developed countries; and $1,122 million and $952 million,respectively, were to less developed countries. Military loans and grants include grant-aid and credit assistance underthe Foreign Assistance Act (FAA) on a delivery basis, direct military loans by the Export-Import Bank, and military grantsunder other acts. FAA military data are from the Department of Defense.
2 The 1967 data for military loans and grants under the Foreign Assistance Act and several minor economic programsunder "Other" are preliminary.
3 Countries have been classified "less developed" on the basis of the standard list of less developed countries usedby the Development Assistance Committee of the Organization for Economic Cooperation and Development. On thisbasis, "less developed" countries include all countries receiving U.S. loans or grants except the following which areconsidered "developed": Japan, Australia, New Zealand, Republic of South Africa, and all of Europe except Malta,Spain, and Yugoslavia.
4 Includes capital subscriptions and contributions to the Inter-American Development Bank, the International De-velopment Association, and the Asian Development Bank (1962-66 average for the three recipients, $214 million; 1967,$374 million); and Peace Corps (1962-66 average, $72 million; 1967, $105 million).
5 Data for certain programs from Department of Commerce (Office of Business Economics) and Department of Defense.Source: Agency for International Development (except as noted).
310
Digitized for FRASER http://fraser.stlouisfed.org/ Federal Reserve Bank of St. Louis

TABLE B-87 .—International reserves, 1949, 1953, and 1962-67
[Millions of dollars; end of period]
Area and country 1949 1953 1962 1963 1964 1965 1966
1967
Sep-tember
De-cember
All countries
Developed areas
United States
United Kingdom
Other Western Europe..AustriaBelgiumFranceGermanyItalyNetherlandsScandinavian coun-
tries (Denmark,Finland, Norway,and Sweden) . ._
SpainSwitzerlandOther2_
Canada
Japan
Australia, New Zealand,and South Africa
Less developed areas 3
Latin AmericaMiddle EastOther AsiaOther Africa
45,515
37,240
26,024
1,752
6,46092978580196
537
x%1,225
1,197
(01,582
8,280
2,7751,4753,3954 290
51,780
41,390
23,458
2,670
10,515325
1,144829
1,773768
1,232
1,026150
1,7681,500
1,902
892
1,952
10,390
3,4001,2003,8401,800
62,905
54,510
17,220
3,308
27,2401,0811,7534,0496,9564,0681,946
1,6101,0452,8711,861
2,547
2,022
2,175
8,395
2,2301,7752,7951,505
66,275
56,890
16,843
3,147
29,4901,2291,9404,9087,6503,6192,102
1,8751,1473,0741,946
2,603
2,058
2,748
9,385
2,7152,2503,0851,255
68,500
58,995
16,672
2,316
32,3351,3172,1925,7247,8823,8242,349
2,3801,5133,1202,034
2,881
2,019
2,773
9,505
2,8452,3153,0551,220
70,245
59,465
15,450
3,004
33,6251,3112,3046,3437,4294,8002,416
2,3241,4093,2442,045
3,027
2,152
2,205
10,780
3,2802,6753,3801,385
71,615
60,205
14,881
3,100
34,9651,3332,3206,7338,0284,9112,448
2,3401,2053,3242,326
2,693
2,119
2,448
11,415
3,1652,8453,8301,510
72,185
60,040
14,649
2,733
35,6851,4392,5516,7508,0145 4452,475
2,3911,1083,1562,356
2,682
2,047
2,244
12,145
3,2803,2703,9551,575
14,830
2,695
1,4842,5306,9948,1555,4602,619
2,238
3,555
2,709
2,030
2,307
1 Not available separately.2 In addition to other Western European countries, includes unpublished gold reserves of Greece and an estimate of
gold to be distributed by the Tripartite Commission for the Restitution of Monetary Gold.3 Includes unpublished gold holdings not allocable by area.< Estimate.
Note.—Includes gold holdings, reserve positions in the International Monetary Fund, and foreign exchange of all countriesexcept U.S.S.R., other Eastern European countries, Communist China, Cuba (after March 1964), and Indonesia (after July1965).
Beginning 1959, when most of the major currencies of the world became convertible, data exclude known holdings ofinconvertible currencies, balances under payments agreements, and the bilateral claims arising from liquidation of theEuropean Payments Union.
Source: International Monetary Fund, "International Financial Statistics."
Digitized for FRASER http://fraser.stlouisfed.org/ Federal Reserve Bank of St. Louis

TABLE B-88.—United States reserve assets: gold stock, holdings of convertible foreign currencies,and reserve position in the International Monetary Fund, 1946-67
[Millions of dollars]
End of year or month Total reserveassets
Gold stock 1
Total 2 Treasury
Convertibleforeign
currencies 3
Reserveposition in
InternationalMonetary Fund4
1946194719481949
19501951195219531954
19551956195719581959
19601961196219631964
196519661967
1966: Jan. .Feb_.Mar_.Apr. .May..June.
July_.Aug_.Sept..Oct...Nov..D e c .
1967: Jan..Feb..Mar.Apr..May..June.
July..Aug..Sept.Oct..Nov..D e c .
20,70624,02125,75826,024
24,26524,29924.71423,45822,978
22,79723,66624,83222,54021,504
19,35918,75317,22016,84316,672
15,45014,88214,830
15,22414,96215,02614,91614,90514,958
15,14815,01514,87614,88014,71514,882
14,19613,99813,85513,90613,94314,274
14,22414,60514,64914,92715,43814,830
20,70622,86824,39924,563
22,82022,87323,25222,09121,793
21,75322,05822,85720,58219,507
17,80416,94716,05715,59615,471
M3,80613,23512,065
M3,81113,81113,73813,66813,58213,529
13,41313,31913,35613,31113,26213,235
13,20213,16113,18413,23413,21413,169
13,13613,07513,07713,03912,96512,065
20,52922,75424,24424,427
22,70622,69523,18722,03021,713
21,69021,94922,78120,53419,456
17,76716,88915,97815,51315,388
5 13,73313,15911,982
5 13,73213,73013,63413,63213,53213,433
13,33213,25913,25813,25713,15913,159
13,15713,10713.10713,10913,10913,110
13.10813,00813,00612,90512,90811,982
11699212432
7811,3212,345
639377559522628722
1,0931,2991,1481,2131,1081,321
645480314315363738
7191,1621,2001,5092,0922,345
1,1531,3591,461
,445,426,462,367,185
,044,608,975,958
1,997
1,5551,6901,0641,035769
5 863326420
5 774774729726695707
642397372356345326
349357357357366367
369368372379381420
1 Includes gold sold to the United States by the International Monetary Fund with the right of repurchase whichginning September 1965 also includes gold deposited by the IMF toamounted to $800 million on December 31,1967. BeginningdlllUUIIlCU Ivl «POUU IIIIIIIUII Ull L/GlrGIIIUGI J l , 1JU/ . UGgllllllllg OOJJ „ - ,
mitigate the impact on the U.S. gold stock of purchases by foreign countries for gold subscriptions on increased IMFquotas. Amount outstanding was $233 million on December 31,1967. The United States has a corresponding gold liabilityto the IMF.
2 Includes gold in Exchange Stabilization Fund.3 Includes holdings of Treasury and Federal Reserve System.4 In accordance with Fund policies the United States has the right to draw foreign currencies equivalent to its reserve
position in the Fund virtually automatically if needed. Under appropriate conditions the United States could draw addi-tional amounts equal to the United States quota.
5 Reserve position includes, and gold stock excludes, $259 million gold subscription to the Fund in June 1965 for a US.quota increase which became effective on February 23, 1966. In figures published by the Fund from June 1965 throughJanuary 1966, this gold subscription was included in the U.S. gold stock and excluded from the reserve position.
Note.—Gold held under earmark at Federal Reserve Banks for foreign and international accounts is not included inthe gold stock of the United States.
Sources: Treasury Department and Board of Governors of the Federal Reserve System.
312
Digitized for FRASER http://fraser.stlouisfed.org/ Federal Reserve Bank of St. Louis

TABLE B-89.—Price changes in international trade, 1959-67
[1958=1001
Area or commodity class 1959 1960 1961 1962 1963 1964 1965 1966
1967
Thirdquarter
Developed areas
Total:
ExportsTerms of trade».
United States 2
Exports
Terms of trade»
Developing areas
Total:ExportsTerms of trade
Latin America
ExportsTerms of trade L
Southern and Eastern Asia 4
ExportsTerms of t rade l .
Primary commodities: Total.
Foodstuffs
Coffee, tea, and cocoa..Cereals —
Other agricultural commodities •_
Fats, oils, and oilseeds..Textile fibers
WoolRubber
MineralsMetal ores..
Manufactured goods: Total »...
Nonferrous base metals»_.
99102
100102
106108
Unit value indexes by area
100103
101101
9899
9596
111109
101104
103105
9597
9395
104104
101105
102107
9395
9193
101102
102104
102105
9597
9497
102102
103104
103104
9797
101103
103100
104104
106106
9797
101102
104100
106104
107105
9997
is
106103
World export price indexes5
97
93
8397
105
10098106134
9497
99
111
97
91
7796
107
94104108141
9398
101
114
95
90
7298
103
97105107107
92100
102
110
94
90
70103
99
89101106102
9299
102
109
100
103
73102
103
9511212795
9296
103
110
103
106
87105
105
9811613191
94104
104
135
100
99
80101
104
10810511093
96110
106
155
101
100
OO
O
105
10510611599
97110
108
178
106106
3 1053 104
9997
3 1003 98
3 1063 100
98
99
80108
99
891009985
95102
109
153
* Terms of trade indexes are unit value indexes of exports divided by unit value indexes of imports.2 Includes foreign trade of Alaska, Hawaii, and Puerto Rico.3 Data are for second quarter 1967.* Excludes Japan.1 Data for manufactured goods are unit value indexes.8 Includes nonfood fish and forest products.
Note.—Data exclude trade of Communist areas in Eastern Europe (except Yugoslavia) and Asia.
Sources: United Nations and Department of Commerce (Bureau of International Commerce).
313
Digitized for FRASER http://fraser.stlouisfed.org/ Federal Reserve Bank of St. Louis

TABLE B-90.—Consumer price indexes in the United States and other major industrial countries,1955-67
Period
19551956195719581959
19601961196219631964..
19651966.._19671
1964:IIIIII..IV
1965:
IIIIIIV
1966:1II . .IllIV
1967:1II..IllIV 2
UnitedStates
90.591.995.197.798.5
100.0101.1102.2103.5104.9
106.6109.7112 8
104.5104.7105.0105.4
105.6106.4106.8107.4
108.2109.3110.3111.2
111.4112.1113.3114.3
Canada
90.992.395 297.798.8
100.0100.9102.1103.9105.8
108.4112.4116.4
105.0105.6106.2106.3
107.2103.0108.9109.4
110.9112.1113.1113.7
114.2115.8117.6117.8
[1960=
Japan
92.793.095 995.596.5
100.0105.3112.5121.1125.7
134.1140.9146.4
122.4125.1126.1128.8
131.5134.1134.1136.7
139.1140.9141.0142.4
145.0144.9145.6150.0
=100]
France
75.576.979 090.996.5
100.9103.3108.3113.5117.4
120.3123.5126.9
116.3116.6117.5118.2
119.1120.4120.6121.2
122.2123.1123.8124.6
125.7126.1127.0128.6
Germany
91.49S.7991697.798.6
100.0102.3105.4108.5111.1
114.9118.9120.6
110.3110.9111.3111.8
113.0114.4115.6116.2
117.8119.2119.0119.5
120.3121.0120.7120.2
Italy
91.294.395 598.297.8
100.0102.1106.9114.8121.6
127.1130.1134.4
119.1120.5122.5124.3
125.7126.5127.7128.5
129.4129.7130.1131.2
133.1133.9134.9135.5
Nether-lands
8889959798
100101103107113
119126129
110114114114
115120120120
123128126126
127131130129
UnitedKingdom
87.892.195 698.599.0
100.0103.4107.8110.0113.6
119.0123.7126.7
111.3113.4114.3115.3
116.4119.3119.8120.6
121.4123.8124.2125.2
125.9126.9126.3127.5
1 Eleven month average except United States.2 For other than United States, data are averages of October and November.Sources: Department of Labor and Organization for Economic Cooperation and Development.
314U.S. GOVERNMENT PRINTING OFFICE: 1968 O — 2 8 4 - 5 9 3
Digitized for FRASER http://fraser.stlouisfed.org/ Federal Reserve Bank of St. Louis