Embed Size (px)
Citation preview

Appendix B
Statistical Tables Relating to Employment,Production, and Purchasing Power
CONTENTSNational income or expenditure: Page
B-l. Gross national product or expenditure, 1929-51. . . 225B-2. Gross national product or expenditure in 1939 prices, 1929-50 226B-3. Gross national product or expenditure in first half of 1951 prices,
1929-51 227B-4. Personal consumption expenditures, 1929-51 228B-5. Gross private domestic investment, 1929-51 229B-6. National income by distributive shares, 1929-51 230B-7. Personal income, 1929-51 231B-8. Relation of national income and personal income, 1929-51 232B-9. Disposition of personal income, 1929-51 233B-10. Total and per capita disposable personal income in current and first
half of 1951 prices, 1929-51 234Employment and wages:
B—11. Labor force, employment, and unemployment, 1929—51 235B—12. Number of wage and salary workers in nonagricultural establishments,
1929-51 236B—13. Average weekly hours in selected industries, 1929-51 237B-14. Average hourly earnings in selected industries, 1929-51 238B-15. Average gross weekly earnings in selected industries, 1929—51 239
Production and business activity:B-16. Physical production index of goods and selected services, 1929-51 . . . . 240B-17. Industrial production index, 1929-51 241B-18. Percentage changes in production and consumption of selected com-
modities, United States and other free world, 1939 to 1950 242B-19. New construction activity, 1929-51 243B-20. Business expenditures for new plant and equipment, 1929-51 244B-21. Inventories and sales in manufacturing and trade, 1939-51 245B-22. Manufacturers' inventories by stage of fabrication and as ratios to
sales, 1946-51 246B—23. Sales, stocks, and outstanding orders at 296 department stores,
1939-51 247Prices:
B-24. Consumers' price index, 1929-51 248B-25. Wholesale price index, 1929-51 249B-26. Indexes of prices received and prices paid by farmers, and parity ratio,
1929-51 250B-27. Percentage increases in wholesale prices in the United States and
foreign countries since June 1950 .... 251
223
Digitized for FRASER http://fraser.stlouisfed.org/ Federal Reserve Bank of St. Louis
Money, banking, and credit: PageB-28. Consumer credit outstanding, 1929-51 252B-29. Loans and investments of all commercial banks and weekly reporting
member banks, 1929-51 253B-30. Deposits and currency, 1929-51 254B-31. Estimated ownership of Federal securities, 1939-51 255B-32. United States Government debt—volume and kind of securities,
1929-51 256B-33. Bond yields and interest rates, selected years, 1929-51 257
Corporate profits and finance:B-34. Profits before and after tax, all private corporations, 1929-51 258B-35. Sales and profits of large manufacturing corporations, 1939-51 259B-36. Relation of profits before and after taxes to stockholders' equity,
private manufacturing corporations, by industry group, 1949-51... 260B-37. Relation of profits before and after taxes to sales, private manufactur-
ing corporations, by industry group, 1949-51 261B-38. Relation of profits before and after taxes to stockholders' equity and to
sales, all private manufacturing corporations, by size class, 1949-51. 262B-39. Sources and uses of corporate funds, 1947-51 263
International transactions:B-40. International transactions of the United States, 1948-51 264B—41. United States Government grants, other unilateral transfers, and loans
to foreign countries, 1948-51 265B-42. United States merchandise export surplus, by area, 1936-38 quarterly
average and 1947-51 266B-43. United States merchandise exports, including reexports, by area,
1936-38 quarterly average and 1947-51 267B-44. Indexes of quantity and unit value of United States domestic mer-
chandise exports, by economic class, 1936-38 quarterly average and1947-51 268
B—45. United States general merchandise imports, by area, 1936—38 quar-terly average and 1947-51 269
B—46. United States merchandise imports for consumption, by economicclass, 1936-38 quarterly average and 1947-51 270
B—47. Indexes of quantity and unit value of United States merchandise im-ports for consumption, by economic class, 1936-38 quarterly averageand 1947-51 271
Summary:B-48. Changes in selected economic series since 1939 and 1950 272
224
Digitized for FRASER http://fraser.stlouisfed.org/ Federal Reserve Bank of St. Louis

Statistical Tables Relating to Employment,Production, and Purchasing Power
TABLE B-l.—Gross national product or expenditure, 1929-51
[Billions of dollars]
Period
1929
19301931193219331934 _
1935 •19361937 .1938 _..1939
194019411942 . . . .19431944
19451946194719481949
1950
1950— First halfSecond half
1951— First baif i _ _
1950— First quarterSecond quarterThird quarter..Fourth quarter . _ _
1951 — First quarterSecond quarter * .
Grossnationalproduct
103.8
90.975.958.355.864.9
72.282.590.284.791.3
101.4126.4161.6194.3213.7
215.2211.1233.3259. 0257.3
282.6
Personalconsump-
tion ex-penditures
78.8
70.861.249.246.351.9
56.262.567.164.567.5
72.182.391.2
102.2111.6
123.1146.9165.6177.9180.2
193.6
Grossprivate
domesticinvestment
15.8
10.25.4.9
1.32.8
6.18.3
11.46.39.9
13.918.310.95.77.7
10.728.730.242.733.0
48.9
Net foreigninvestment
0.8
.7
.2
.2
.2
.4
—.1-.1
.11.1.9
1.51.1
-.2-2.2-2.1
-1.44.68.91.9.5
-2.3
Govern-ment purchases of-
goods andservices
8.5
9.29.28.18.09.8
9.911.711.612.813.1
13.924.759.788.696.5
82.830.928.636.643.6
42.5
Seasonally adjusted annual rates
269.7295. 6
323.8
264.4275.0287.4303.7
318.5329.0
186.7200.4
205.6
184.7188.7202.5198.4
208.2203.0
44.053.8
61.8
40.147.947.360.2
59.664.0
-1.6-3.0
-.9
-1.7-1.6-3.2-2.7
-2.3.5
40.744.3
57.2
41.340.140.847.8
52.961.5
i Estimates based on incomplete data; second quarter by Council of Economic Advisers.
NOTE.—The figures beginning with 1948 are based on the revised series of national income and productof the Department of Commerce. For detail, see the "National Income Supplement to the Survey ofCurrent Business," July 1951.
Detail will not necessarily add to totals because of rounding.
Source: Department of Commerce (except as noted).
225
Digitized for FRASER http://fraser.stlouisfed.org/ Federal Reserve Bank of St. Louis

TABLE B-2.—Gross national product or expenditure in 1939prices, 1929-50l
[Billions of dollars, 1939 prices]
Period
1929
1930193119321933.1934
19351936-193719381939
19401941194219431944
19451946194719481949 .
1950
Totalgrossna-
tionalprod-uct
85.9
78.172.361.961.567.9
73.983.987.984.091.3
100.0115.5129.7145.7156.9
153.4138.4138.6143.5143.5
154.3
Personal consumptionexpenditures
Total
62.2
58.656.651.851.154.0
57.262.865.063.967.5
71.376.675.878.081.1
86.395.798.3
100.3102 9
108.7
Dur-able
goods
8.0
6.45.33.93.84.4
5.46.67.05.76.7
7.78.95.75.04.6
5.310.412.312.612 9
15.5
Non-dur-able
goods
29.1
27.727.525.224.927.0
28.631.832.933.435.3
37.140.141.342.644.5
47.950.249.549.7504
51.7
Serv-ices
25.1
24.523.922.722.422.6
23.224.425.124.825.5
26.527.628.830.432.0
33.235.236.438.039.6
41.6
Gross private domesticinvestment
Total
14.9
10.15.91.11.63.5
6.79.3
11.46.39.9
13.717.19.35.46.6
8.320.319.322.717.8
24.8
Newcon-
struc-tion
7.4
5.43.82.11.51.7
2.23.13.83.34.9
5.46.13.31.92.0
2.66.06.98.07.9
9.4
Pro-duc-er?'dur-able
equip-ment
6.1
4.83.31.92.02.7
3.64.85.53.94.6
6.07.24.43.65.1
6.79.9
11.812.611.6
13.2
Changein
busi-ness
inven-tories
1.5
-.2-1.1-3.0-1.8-.8
.91.42.1
-1.0.4
2.33.81.6-.1-.5
-1.04.4.6
2.1-1.7
2.2
Netfor-eignin-
vest-ment
0.8
.6
.3
.2
.1
.3
-.12
!i1.0.9
1.2.7
-.4-2.1-2.2
-1.82.74.81.4.6
Government pur-chases of goods
and services
Total
7.9
8.79.48.98.7
10.1
10.111.911.412.713.1
13.821.145.064.371.3
60.619.616.119.222.2
20.8
Fed-eral
1.3
1.51.61.72.33.1
3.04.94.45.35.2
6.113.838.358.265.4
54.612.88.5
10.913.0
11.0
Stateandlocal
6.6
7.37.87.26.47.0
7.17.16.97.47.9
7.77.36.7 |6.16.0
6.06.87.68.29.2
9.8
Pri-vategrossna-
tion'1!prod-uct 2
81.5
73.567.757.456.562.0
67.676.480.976.483.7
92.1108.2116.5125.3133.0
129.7125.6128.8133.7133.2
143.8
1 See "Survey of Current Business," January 1951, and the National Income Supplement to the "Survey,"July 1951, for explanation of conversion of estimates in current prices to those in 1939 prices.
2 Total gross national product less compensation of general government employees.NOTE.—Detail will not necessarily add to totals because of rounding.Source: Department of Commerce.
226
Digitized for FRASER http://fraser.stlouisfed.org/ Federal Reserve Bank of St. Louis
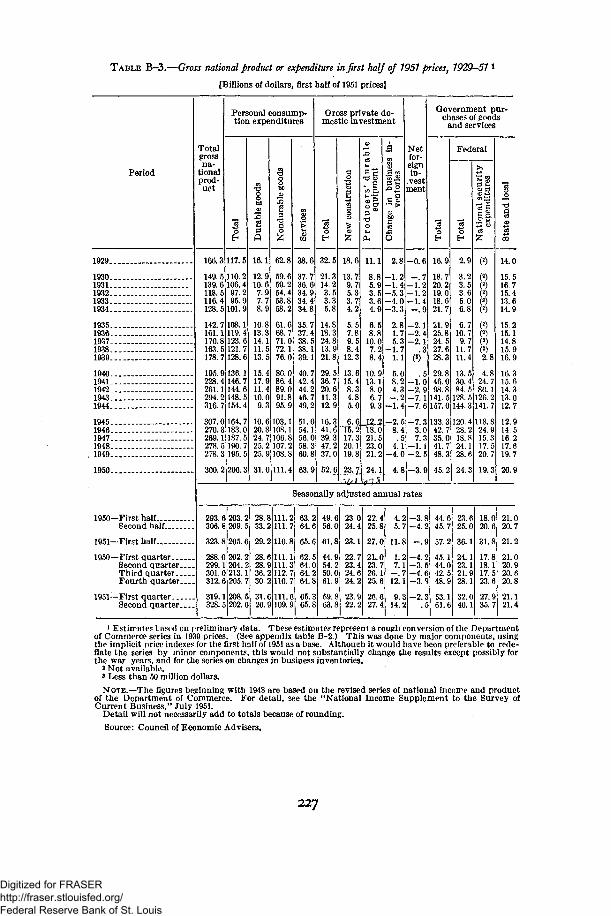
TABLE B-3.—Gross national product or expenditure in fast half of 1951 prices, 1929-51l
[Billions of dollars, first half of 1951 prices]
Period
1929
19301931 _193219331934
19351936193719381939 - - -
1940 - -19411942.19431944
19451946194719481949
1950
1950— First halfSecond half
1951— First half
1950— First quarter.Second quarterThird quarterFourth quarter
1951— First quarterSecond quarter
Totalgrossna-
tionalprod-uct
166.3
149 5139.6118.5116.4128.5
142.7161. 1170.8163.5178.7
195. 9228.4261.1294.2316.7
307.0270 3269 1278.5278 3
300.2
Personal consump-tion expenditures
1H
117.5
110.2106.497.295.9
101.9
108.1119.4123.6121.7128.6
136.1146.7144.6148.5154.4
164.7183.0187 5190.7195.5
206.3
be
32fi
16.1
12.910.67.97.78.9
10.813.314.111.513.5
15.417.911.410.09.3
10.620.824.725.225.9
31.0
bJOcu
I162.8
59.659.254.453.858.2
61.668.771.072.176.0
80.086.489.091.895.9
103.1108.1106.8107.2108.8
111 4
'>&38.6
37.736.634.934.434.8
35.737.438.538.139.1
40.742.444.246.749.2
51.054.156.058.360.8
63.9
Gross private do-mestic investment
1e
32.5
21.314.23.53.35.8
14.818.324.813.921.8
29.536.720.611.312.9
16.341. tf39.347.237.0
52.6
|o
i5?
18.6
13.79.75.33.74.2
5.57.89.58.4
12.3
13.615.48.34.85.0
6.6-15.2'
17.320.119.8
23.7
•',fr I
<o303t-3"g•a £"to O.
®s.§*•aO$_t
PH
11.1
8.85.93.53.64.9
6.58.8
10.07.28.4
10.913.18.06.79.3
J2.218.021.523.021.2
24.1)«~i 5
.a1§ ccS-c•°2eg•- t>obx>§£3O
2.8
-1.2-1.4-5.3-4.0-3.3
2.81.75.3
-1.71.1
5.08.24.3-.2
-1.4
-2.58.4f4.1
-4.0
4.8
Netfor-eignin-
.vestment
-0.6
-.7-1.2-1.2-1.4-.9
-2.1-2.4-2.1
(3)5
-LO-2.9-7.1-7.6
-7.33.07.3
-1.1-2.5
-3.9
Government pur-chase? of goods
and services
*03
£
16.9
18.720.219.018.621.7
21.925.824.527.628.3
29.846.098.8
141.5157.0
133.342.735.041.748.3
45.2
Federal
3ofr
2.9
3.23.53.65.06.8
6.710.79.7
11.711.4
13.530.484.5
128.5144.3
120.428.218.824.128.6
24.3
K*»
llo pOJ4-»
~3.2 *.»-> 0>08
fc
(2)
(2)(2)(2)(2)(2)
(2)(2)(2)(2)2.8
4.824.780.1
126. 2141.7
118.824.915. 317.520.7
19.3
iiCQ
14.0
15.516.715.413.614.9
15.215.114.815.916.9
16.315.614.313.012.7
12.914.516.217.619.7
20.9
Seasonally adjusted annual rates
293.6306.8
323.8
288.0299.1301.0312.6
319.1328.5
203.2209.5
205.6
202.2204.2213. 1205.7
208.5202.6
28.833.2
29.2
28.628.936.230.2
31.626.9
111.2111.7
110.8
111.1111.3112.7110.7
111.6109.9
63.264.6
65.6
62.564.064.264.8
65.365.8
49.656.0
61.8
44.954.250.061.9
59.863.8
23.024.4
23.1
22.723.424.624.2
23.922.2
22.425.8
27.0
21,. 023.726. 125.6
26.627.4
4.25.7
11.8
1.27.1
— . 712.1
9.314.2
-3.8-4.2
-.9
-4.2-3.5—4 6-3.9
-2.3.5
44.645.7
57.2
45.144.042 548.9
53.161.6
23.625.0
36.1
24.123.121.928.1
32.040.1
18.020.6
31.8
17.818.117.523.6
27.935.7
21.020.7
21.2
21.020.920.620.8
21.121.4
' Estimates based on preliminary data. These estimate? represent a rough conversion of the Departmentof Commerce series in 1939 prices. (See appendix table B-2.) This was done by major components, usingthe implicit price indexes for the first half of 1951 as a base. Although it would have been preferable to rede-flate the series by minor component?, this would not substantially change the results except possibly forthe war years, and for the series on changes in business inventories.
2 Not available.3 Less than 50 million dollars.
NOTE.—The figures beginning with 1948 are based on the revised series of national income and productof the Department of Commerce. For detail, see the "National Income Supplement to the Survey ofCurrent Business," July 1951.
Detail will not necessarily add to totals because of rounding.
Source: Council of Economic Advisers.
227
Digitized for FRASER http://fraser.stlouisfed.org/ Federal Reserve Bank of St. Louis

TABLE B-4.—Personal consumption expenditures, 1929-51
[Billions of dollars]
Period
1929
193019311932 _19331934.
1935 .1936193719381939 -
19401941194219431944 .
1945 . . .1946194719481949
I960- -
1950— First half.Second half
1951— First half 4
1950— First quarter _Second quarter _Third quarterFourth quarter
1951 — First quarterSecond quarter 4
Totalex-
pendi-tures
78.8
70.861.249.246.351.9
56.262.567.164.567.5
72.182.391.2
102.2111.6
123.1146.9165.6177.9180.2
193.6
Durable goods
Total
9.4
7.35.63.73.54.3
5.26.47.05.86.7
7.99.87.16.87.1
8.516.621.422.923.9
29.2
Auto-mo-bilesand
parts
3.2
2.21.6.9
1.01.4
1.92.32.41.62.1
2.73.3.7.8.9
1.14.26.67.59.4
12.2
Other
6.1
5.14.02.82.52.9
3.34.14.64.14.6
5.16.46.46.06.2
7.412.414.815.414.5
17.0
Nondurable goods
Total
37.7
34.129.022.722.326.7
29.432.935.234.035.3
37.644.052.961.067.1
74.985.895.1
100.998.7
102.3
Food'
19.7
18.114.811.411.514.3
16.318.520.019.019.3
20.724.430.535.338.9
43.050.356.659.758.6
60.9
Cloth-ing 2
9.2
7.96.85.04.65.6
5.96.56.76.67.0
7.48.8
11.013.715.3
17.118.619.120.118.9
18.8
Other
8.9
8.17.46.46.26.9
7.27.98.68.48.9
9.510.811.411.912.9
14.816.919.421.121.2
22.6
Services
Total
31.7
29.526.622.820.620.9
21.723.324.924.725.5
26.628.531.234.437.4
39.744.549.154.157.6
62.1
Hous-ing*
11.4
11.010.29.07.87.5
7.67.98.48.78.9
9.29.9
10.611.111.7
12.213.014.616.518.1
19.9
Other
20.2
18.516.413.812.713.4
14.115.416.516.016.5
17.418.720.623.325.7
27.531.434.537.639.5
42.2
Seasonally adjusted annual rates "
186. 7200.4
205.6
184.7188.7202.5198.4
208.2203.0
26.431.8
29.2
26.326.634.329. -1
31.527.0
10.913.6
12.0
10.411.414.312.9
12.511.5
15.618.3
17.2
15.915.220.016.5
19.015.5
99.4105.2
110.8
98.4100.4105.5104.9
111.5110.0
59.262.6
67.0
58.759.762.662.7
67.067.0
18.219.4
19.8
17.918.519.619.2
20.419.2
22.023.2
24.0
21.822.223.323.0
24.123.8
60.863.4
65.6
60.161.662.764.0
65.266.0
19.520.3
21.0
19.319.720.120.5
20.921.2
41.443.0
44.6
40.841.942.643.5
44.344.8
1 Includes alcoholic beverages.2 Includes shoes and standard clothing issued to military personnel.3 Includes imputed rental value of owner-occupied dwellings.« Estimates based on incomplete data; second quarter by Council of Economic Advisers.
NOTE.—The figures beginning with 1948 are based on the revised series of national income and productof the Department of Commerce. For detail, see the "National Income Supplement to the Survey ofCurrent Business," July 1951.
Detail will not necessarily add to totals because of rounding.
Source: Department of Commerce (except as noted).
228
Digitized for FRASER http://fraser.stlouisfed.org/ Federal Reserve Bank of St. Louis

TABLE B-5.—Gross private domestic investment, 7929-57
[Billions of dollars]
Period
1929
19301931193219331934
19351936198719381939
19401941194219431944
1945194619471948 . . _...1949
1950
1950— 1st half2d half
1951— 1st half 8
1950— 1st quarter....2d quarter...3d quarter4th quarter ...
1951— 1st quarter....2d quarter *__
Totalgrosspri-vate
domes-tic
invest-ment
15.8
10.25.4.9
1.32.8
6.18.3
11.46.39.9
13.918.310.95.77.7
30.728.730.242.733.0
48.9
Nonfarm producers'plant and equipment
Total i
9.8
7.64.62.52.33.1
3.85.26.64.75.7
7.49.35.84.66.3
8.715.520.323.422.0
25.6
Equip-ment2
5.6
4.32.81.61.62.2
2.93.94.73.44.0
5.36.64.13.54.7
6.310.714.616.715.6
18.8• • • ' &
Con-struetion i •
4.2
3.41.81.0.7.9
1.01.31.91.41.7
2.12.71.71.11.6
2.4- 4.8
5.76.76.4
6.8
Farm equipment andconstruction
Total 4
1.1
.9
.5
.3
.3
.4
.6
.81.0.8.8
1.01.31.0.9
1.2
1.42.43.84.64.7
4.8
Equip-ment
0.8
.7
.4
.3
.3
.3
.5
.6
.8
.6
.6
.81.0.7.6.9
1.1-1.6
2.53.23.4
3.6
Con-struc-tion
0.3
.2
.1O0
.1
.2
.2
.2
.2
.2
.3
.3
.3
.3
.3
.91.31.41.3
1.2' , .1
Resi-dential
con-struc-tion(non-
farm)! *
2.8
1.412.5.3
.71.11.41.52.7
3.03.41.81 0.8
1 14.06.3868.3
12.6
Otherpri-vatecon-struc-tion •
0.5
.5
.4
.2
.1
.1
.1
.1
.2
.2
.2
.2
.3
.1(7).1
.2
.6
.71.01.3
1.5
Net change in busi-ness inventories
Total
1.6
-.3-1.4-2.6-1.6-1.1
.91.02.3
-1.0.4
2.33.92.1-.9-.8
-.76.1-.85.0
-3.2
4.3
Non-farmafter
revalu-ation
adjust-ment
1.8
(7)-1.7-2.6-1.3
'.2
.42.11.8
-1.1.3
2.03.4.8
-.5-.3
-.66.31.43.7
-2.5
3.6
Farm
-0.3
-.2.3
°,-1.3
.5-1.1
.5
.1
.1
.2
.51.3
-.4-.5
-.1-.2
-2.21.3-.7
.8
Seasonally adjusted annual rates
44.053.8
61.8
40.147.947.360.2
59.664.0
23.028.2
31.0
22.024.027.528.9
30.431.6
16.820.9
22.8
15.817.820.521.3
22.423.2
6.27.2
8.2
6.26.27.07.5
8.18.4
4.65.0
5.4
4.34.85.24.8
5.35.5
3.43.8
4.2
3.13.64.03.7
4.14.3
1.21.2
1.2
1.21.21.21.1
1.21.2
11.813.4
11.8
11.212.413.713.1
12.910.7
1.51.6
1.8
1.51.51.51.6
1.71.9
3.15.6
11.8
1.15.1-.711.8
9.314.3
2.84.4
10.6
1.14.4
-1.810 6
8.113.2
.41.2
1.2
(7)
i!i1.2
1.21.1
i Items for 1945 and earlier years are not comparable with those for later years, nor with figures shown inappendix tables B-19 and B-20.
3 Total producers' durable equipment less "farm machinery and equipment" and farmers' purchases of"tractors" and "business motor vehicles." These figures assume that farmers purchase 85 and 15 percent,respectively, of all tractors and motor vehicles used for productive purposes.
3 Industrial buildings, public utilities, gas- and oil-well drilling, warehouses, office and loft buildings,stores, restaurants, and garages. Includes hotel construction prior to 1946 only.
4 Farm construction (residential and nonresidential) plus "farm machinery and equipment" and farmers'purchases of "tractors" and "business motor vehicles." (See footnote 2.)
5 IncI udes construction of hotels, tourist cabins, motor courts, and dormitories since 1946 only.fl Includes religious, educational, social and recreational, hospital and institutional, miscellaneous non-
residential, and all other private.' Less than 50 million dollars.• Estimates based on incomplete data; second quarter by Council of Economic Advisers.
NOTE.—The figures beginning with 1948 are based on the revised scries of national iocome and productof the Department of Commerce. For detail, see the "National Income Supplement to the Survey ofCurrent Business," July 1951.
Detail will not necessarily add to totals because of rounding.Source: Department of Commerce (except as noted).
229
Digitized for FRASER http://fraser.stlouisfed.org/ Federal Reserve Bank of St. Louis
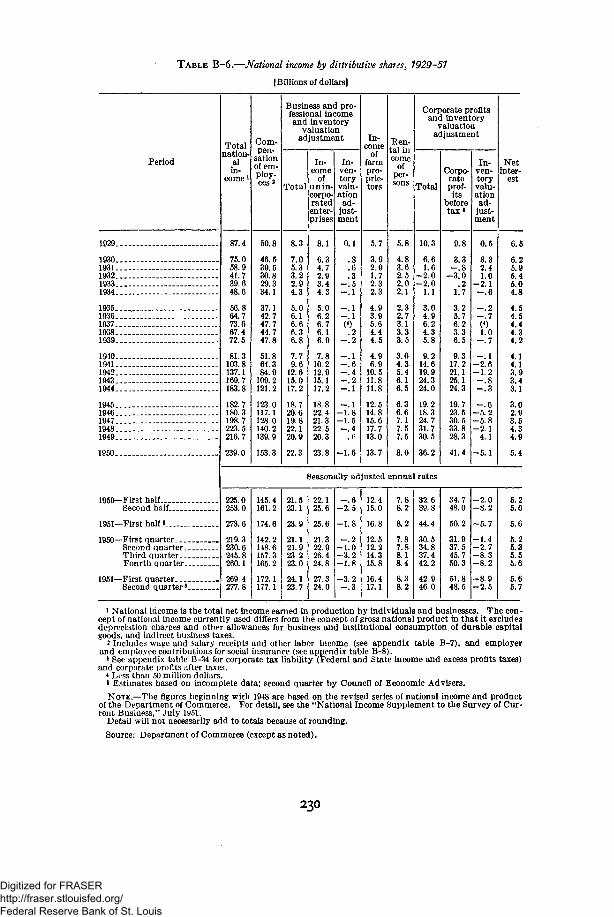
TABLE B-6.—National income by distributive shares, 1929-51
[Billions of dollars]
Period
1929
19301931193219331934
19351936 - -193719381939
19401941 _..194219431944
19451946194719481949
1950
1950— First halfSecond half
1951— First half *
1950— First quarter _ _Second quarter _Third quarterFourth quarter _
1951 — First quarterSecond quarter 8 .. ..
Totalnation-
alin-
come1
87.4
75.058.941.739.648.6
56.864.773.667.472.5
81.3103.8137.1169.7183.8
182.7180.3198.7223.5216.7
239.0
Com-pen-
sationof em-ploy-ees2
50.8
46.539.530.829.334.1
37.142.747.744.747.8
51.864.384.9
109.2121.2
123.0117.1128.0140.2139.9
153. 3
Business and pro-fessional incomeand inventory
valuationadjustment
Total
8.3
7.05.33.22.94.3
5.06.16.66.36.8
7.79.6
12.615.017.2
18.720.619.822.120.9
22.3
In-come
ofunin-corpo-ratedenter-prises
8.1
6.34.72.93.44.3
5.06.26.76.16.9
7.810.212.915.117.2
18.822.421.322.520.3
23.8
In-ven-toryvalu-ation
ad-just-ment
0.1
.8
.6
.3-.5-.1
-.1t(«).2
—.2
-.1-.6-.4
-!l
-.1-1.8-1.5-.4
. ( >
-1.6
In-come
offarmpro-prie-tors
5,7
3.92.91.72.32.3
4.93.95.64.44.5
4.96.9
10.511.811.8
12.514.815.617.713.0
13.7
Ren-tal income
ofper-sons
5.8
4.83.62.52.02.1
2.32.73.13.33.5
3.64.35.46.16.5
6.36.67.17.57.5
8.0
Corporate profitsand inventory
valuationadjustment
Total
10.3
6.61.6
-2.0-2.0
1.1
3.04.96.24.35.8
9.214.619.924.324.0
19.218.324.731.730.5
36.2
Corpo-rateprof-its
beforetax «
9.8
3.3-.8
-3.0.2
1.7
3.25.76.23.36.5
9.317.221.125.124.3
19.723.530.533.828.3
41.4
In-ven-toryvalu-ationad-
just-ment
0.5
3.32.41.0
-2.1-.6
-.2-.7(4)1.0-.7
-.1-2.6-1.2-.8-.3
-.6-5.2-5.8-2.1
4.1
-5.1
Netinter-
est
6.5
6.25.95.45.04.8
4.54.54.44.34.2
4.14.13.93.43.1
3.02.93.54.34.9
5.4
Seasonally adjusted annual rates
225.0253.0
273.6
219.3230.6245.8260.1
269.4277.8
145.4161.2
174.6
142.2148.6157.3165.2
172.1177.1
21.523.1
23.9
21.121.923 223.0
24.123.7
22.125.6
25.6
21.322.926.424.8
27.324.0
-.6-2.5
-1.8
-.2-1.0-3.2-1.8
-3.2-.3
12.415.0
16.8
12.512.214.315.8
16.417.1
7.88.2
8.2
7.87.88.18.4
8.38.2
32.639.8
44.4
30.534.837.442.2
42.946.0
34.748.0
50.2
31.937.545.750.3
51.848.5
-2.0-8.2
-5.7
-1.4-2.7-8.3-8.2
-8.9-2.5
5.25.6
5.6
5.25.35.55.6
5.65.7
1 National income is the total net income earned in production by individuals and businesses. The con-cept of national income currently used differs from the concept of gross national product in that it excludesdepreciation charges and other allowances for business and institutional consumption of durable capitalgoods, and indirect business taxes.
2 Includes wage and salary receipts and other labor income (see appendix table B-7), and employerand employee contributions for social insurance (see appendix table B-8).
* See appendix table B-34 for corporate tax liability (Federal and State income and excess profits taxes)and corporate profits after taxes.
4 L*'ss than 50 million dollars.« Estimates based on incomplete data; second quarter by Council of Economic Advisers.
NOTE.—The figures beginning with 1948 are based on the revised series of national income and productof the Department of Commerce. For detail, see the "National Income Supplement to the Survey of Cur-rent Business," July 1951.
Detail will not necessarily add to totals because of rounding.
Source: Department of Commerce (except as noted).
230
Digitized for FRASER http://fraser.stlouisfed.org/ Federal Reserve Bank of St. Louis
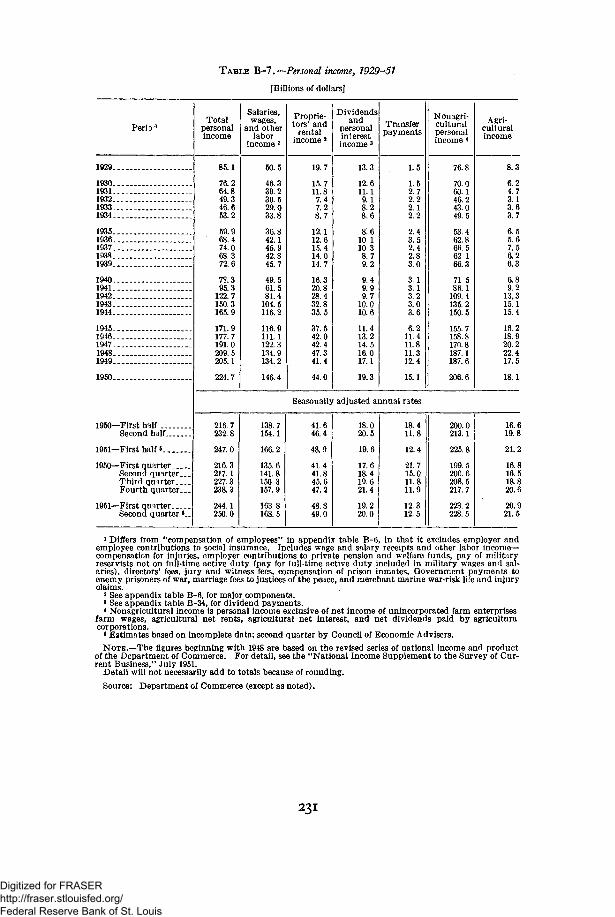
TABLE B-7.—Personal income, 1929-51
[Billions of dollars]
Perio-1
1929
19301931193219331934
19351936193719381939 . . .
19401941..194219431944
19451946194719481949
1950
1950— First halfSecond half
1951— First half «
1950— First quarterSecond quarter...Third quarterFourth quarter. _.
1951— First quarterSecond quarter 5_.
Totalpersonalincome
85.1
76.264.849.346.653.2
59.968.474.068.372.6
78.395.3
122.7150. 3165.9
171.9177.7191.0209.5205.1
224.7
Salaries,wages,
and otherlabor
income 1
50.5
46.339.230.529.033.8
36.842.145.942.845.7
49.561.581.4
104.5116.2
116.9111.1122.3134. 9134.2
146.4
Proprie-tors' and
rentalincome J
19.7
15.711.87.47.28.7
12.112.615.414.014.7
16.320.828.432.835.5
37.542.042.447.341.4
44.0
Dividendsand
personalinterestincome 3
13.3
12.611. 19.18.28.6
8.610.110.38.79.2
9.49.99.7
10.010.6
11.413.214.516.017.1
19.3
Transferpayments
1.5
1.52.72.22.12.2
2.43.52.42.83.0
3.13.13.23.03.6
6.211.411.811.312.4
15.1
Nonagri-culturalpersonalincome *
76.8
70.060.146.243.049.5
53.462.866.562 166.3
71.586.1
109.4135.2150.5
155.7158.8170.8187.1187.6
206.6
Agri-culturalincome
8.3
6.24.73.13. 63.7
6.55.67.56.26.3
6.89.2
13.315.115.4
16.218.920.222.417.5
18.1
Seasonally adjusted annual rates
216.7232.8
247.0
216.3217.1227.3238.3
244.1250.0
138.7154.1
166.2
135.6141.8150.3157.9
163.8168.5
41.646.4
48.9
41.441.845.647.2
48.849.0
18.020.5
19.6
17.618.419.621.4
19.220.0
18.411.8
12.4
21.715.011.811.9
12.312.5
200.0213.1
225.8
199.5200.6208.5217.7
223.2228.5
16.619.8
21.2
16.816.518.820.6
20.921.5
1 Differs from "compensation of employees" in appendix table B-6, in that it excludes employer andemployee contributions to social insurance. Includes wage and salary receipts and other labor income-compensation for injuries, employer contributions to private pension and welfare funds, pay of militaryreservists not on full-time active duty (pay for full-time active duty included in military wages and sal-aries), directors' fees, jury and witness fees, compensation of prison inmates, Government payments toenemy prisoners of war, marriage fees to justices of the peace, and merchant marine war-risk life and injuryclaims.
2 See appendix table B-6, for major components.3 See appendix table B-34, for dividend payments.* Nonagrictiltural income is personal income exclusive of net income of unincorporated farm enterprises
farm wages, agricultural net rents, agricultural net interest, and net dividends paid by agriculturacorporations.
fi Estimates based on incomplete data; second quarter by Council of Economic Advisers.NOTE.—The figures beginning with 1948 are based on the revised series of national income and product
of the Department of Commerce. For detail, see the "National Income Supplement to the Survey of Cur-rent Business," July 1951.
Detail will not necessarily add to totals because of rounding.
Source: Department of Commerce (except as noted).
231
Digitized for FRASER http://fraser.stlouisfed.org/ Federal Reserve Bank of St. Louis
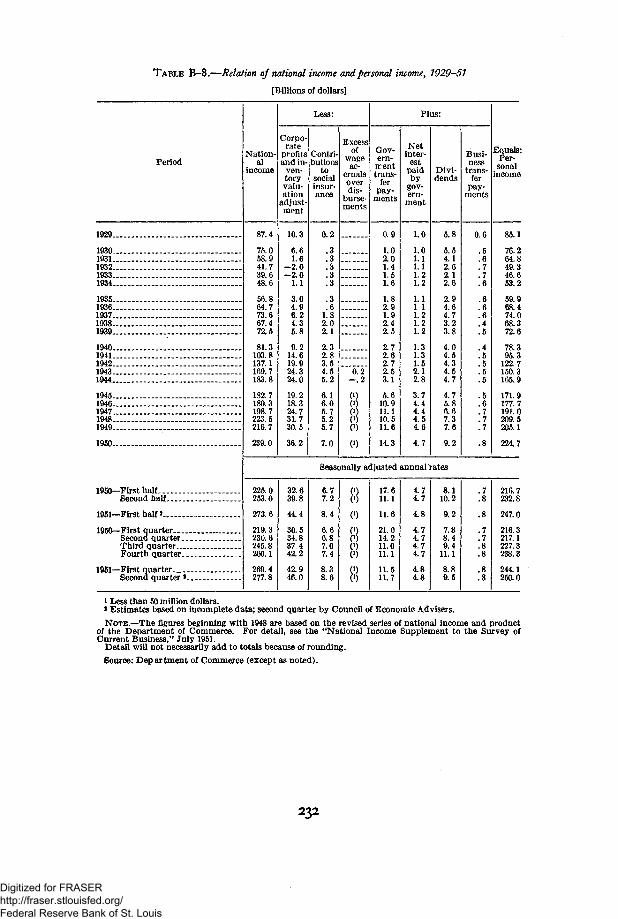
TABLE B-8.—Relation of national income and personal income, 1929—51
[Billions of dollars]
Period
1929
1930 . .1931193219331934
19351936193719381939 ,.
1940 _1941194219431944
1945 . .1946194719481949— „
1950
I960— First halfSecond half
1951 — First half *
1950 — First quarterSecond quarterThird quarterFourth quarter __ _ .
1951— First quarter.Second quarter 8_ _ _ _
Nation-al
income
87 4
75.068.941.739.648.6
56.864 773.667.472.5
81.3103.8137.1169.7183.8
132.7180.3198.7223.5216.7
239.0
Less:
Corpo-rate
profitsand in-
ven-toryvalu-ation
adjust-ment
10 3
6.61.6
-2.0-2.0
1.1
3.04.96.24.35.8
9.214.619.924.324.0
19.218.324.731.730.5
36.2
Contri-butions
tosocialinsur-ance
0 2
.3
.3
.3
.3
.3
.3
.61.82.02.1
2.32.83.54.55.2
6.16.05.75.25.7
7.0
Excessof
wageac-
crualsoverdis-
burse-ments
0.2-.2
0)0)(00)0)
0)
Plus:
Gov-ern-rrenttrans-
ferpay-
ments
0.9
1.02.01.41.51.6
1.82.91.92.42.5
2.72.62.72.53.1
5.610.911.110.511.6
14.3
Netinter-
estpaidby
gov-ern-
ment
1.0
.0
.1
.1
.2
.2
.11
.2
.2
.2
.3
.3
.52.12.8
3.74.44.44.54.6
4.7
Divi-dends
5.8
5.54.12.62.12.6
2.94.64.73.23.8
4.04.54.34.54.7
4.76.86.67.37.6
9.2
Busi-ness
trans-fer
pay-ments
0.6
.5,6.7.7.6
.6
.6
.6
.4
.5
.4
.5
.5
.5
.5
,5.6.7.7.7
.8
Equals:Per-
sonalincome
85.1
76.264.849.346.653.2
59.968.474.068.372.6
78.395.3
122.7150.3165.9
171.9177.7191.0209.5205.1
224.7
Seasonally adjusted annual rates
225.0253.0
273.6
219.3230.6245.8260.1
269.4277.8
32.639.8
44.4
30.534.837.442.2
42.946.0
6.77.2
8.4
6.66.87.07.4
8.38.6
0)(0
0)
0)0)
88
17.611.1
11.6
21.014.211.011.1
11.511.7
4.74,7
4.8
4.74,74.74.7
4.84,8
8.110.2
9.2
7.88.49.4
11.1
8.89.5
.7
.8
.8
.7
.7
.8
.8
.8
.8
216.7232.8
247.0
216.3217.1227.3238.3
244.1250.0
1 Less than 50 million dollars.« Estimates based on incomplete data; second quarter by Council of Economic Advisers.
NOTE.--The figures beginning with 1948 are based on the revised series of national income and productof the Department of Commerce. For detail, see the "National Income Supplement to the Survey ofCurrent Business," July 1951.
Detail will not necessarily add to totals because of rounding.
Source: Department of Commerce (except as noted).
232
Digitized for FRASER http://fraser.stlouisfed.org/ Federal Reserve Bank of St. Louis
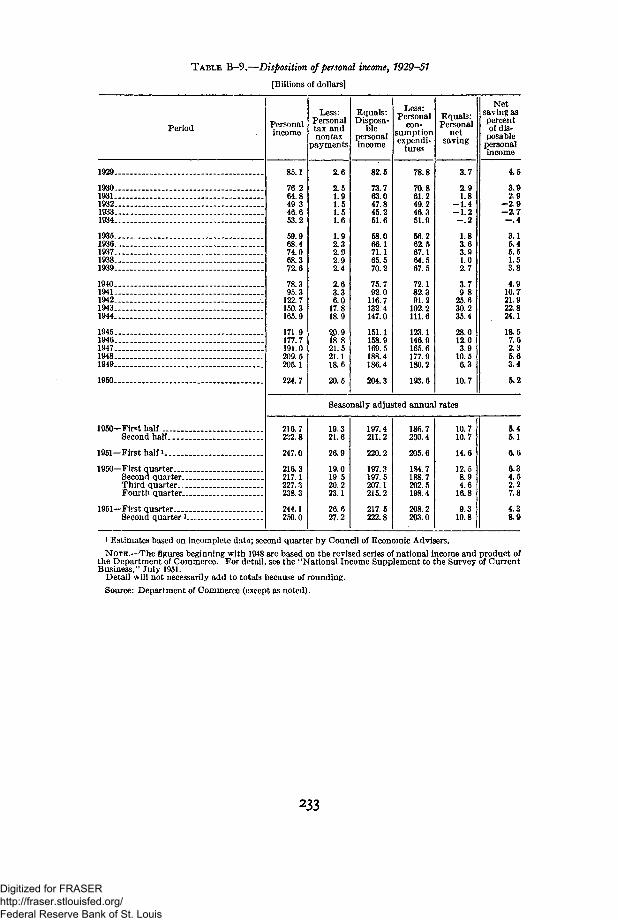
TABLE B-9.—Disposition of personal income, 1929-51
[Billions of dollars]
Period
1929
19301931 . -193219331934
19351936193719381939 . .
19401941194219431944
19451946 .19471948. _1949
1950
1950— First half .Second half ... _ _ ~
1951— First half i_. _ . . . .
1950— First quarter-Second quarter... _.Third quarterFourth quarter
1951— Frst quarter .. ..Second quarter * .
Personalincome
85.1
76264.849 346.653.2
59.968.474.068.372.6
78.395.3
122.7150.3165.9
171.9177.7191. 0209.5205.1
224.7
Less:Personaltax andnontax
payments
2.6
2.51.91.51.51.6
1.92.32.92.92.4
2.63.36.0
17.818.9
20 9is. 821.521.118.6
20.5
Equals:Disposa-
blepersonalincome
82.5
73.763.047.845.251.6
58.066.171.165.570.2
75.792.0
116.7132 4147.0
151.1158.9169. 5188.4186.4
204.3
Less:Personal
con-sumptionexpendi-
tures
78.8
70.861.249.246.351.9
56.262.567.164.567.5
72.182.391.2
102.2111.6
123.1146.9165. 6177.9180.2
193.6
Equals:Personal
netsaving
3.7
2.91.8
-1.4-1.2-.2
1.83.63.91.02.7
3.79 8
25.630.235.4
28.012.03.9
10.56.3
10.7
Netsaving aspercentof dis-posablepersonalincome
4.5
3.92.9
-2.9-2.7-.4
3.15.45.51.53.8
4.910.721.922.824.1
18.57.62.35.63.4
5.2
Seasonally adjusted annual rates
216.7232.8
247.0
216.3217.1227.3238.3
244.1250.0
19.321.6
26.9
19.019 520.223.1
26.627.2
197.4211.2
220.2
197. 3197.5207.1215.2
217.5222.8
186.7200.4
205.6
184.7188.7202.5198.4
208.2203.0
10.710.7
14.6
12.58.94.6
16.8
9.319.8
5.45.1
6.6
6.34.52.27.8
4.38.9
i Estimates based on incomplete data; second quarter by Council of Economic Advisers.NOTE.—The figures beginning with 1948 are based on the revised series of national income and product of
the Department of Commerce. For detail, see the "National Income Supplement to the Survey of CurrentBusiness," July 1951.
Detail will not necessarily add to totals because of rounding.
Source: Department of Commerce (except as noted).
233
Digitized for FRASER http://fraser.stlouisfed.org/ Federal Reserve Bank of St. Louis
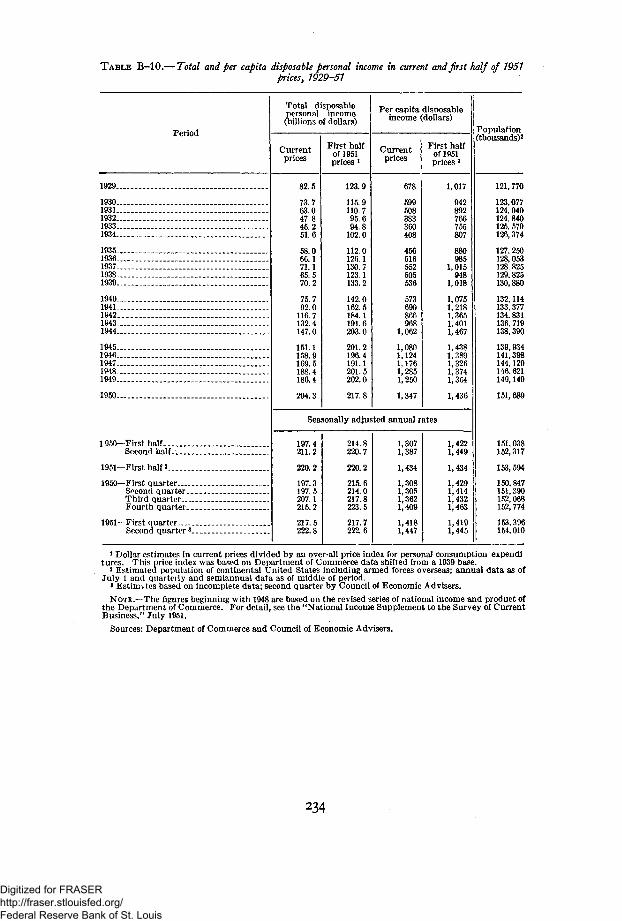
TABLE B—10.— Total and per capita disposable personal income in current and fast half of 1951prices, 1929-51
Period
1929
19301931193219331934
19351936 _-.1937 _.._19381939— _
19401941 . .194219431944
1945.19461947 _ . .19481949 .
1950
1 950— First half _ __.Second half
1951— First half 3
1950— First quarterSecond quarterThird quarter.Fourth quarter
1951— First quarter-.Second quarter 3_
Total disposablepersonal income(billions of dollars)
Currentprices
82.5
73.763.047.845.251.6
58.066.171.165.570.2
75.792.0
116.7132. 4147.0
151.1158.9169.5188.4186.4
204.3
First halfof!951prices 1
123.9
115.9110.795.694.8
102.0
112.0126.1130.7123.1133.2
142.0162.5184.1191.6203.0
201.2196.4191.1201.5202.0
217. 8
Per capita disposableincome (dollars)
Currentprices
678
599508383360408
456516552505536
573690866968
1,062
1,0801,1241.1761,2851,250
1,347
First halfof 1951prices l
1,017
942892766755807
880985
1,015948
1,018
1,0751,2181,3651,4011,467
1,4381, 3891,3261,3741,354
1,436
Seasonally adjusted annual rates
197.4211.2
220.2
197.3197.5207.1215.2
217.5222.8
214.8220.7
220.2
215.6214.0217.8223.5
217.7222.6
1, 3071,387
1,434
1,3081, 3051,3621,409
1,4181,447
1,4221,449
1,434
1,4291,4141, 4321,463
1,4191,445
Population(thousands)2
121, 770
123,077124. 040124. 840125. 579126, 374
127, 250128,053128. 825129. 825130, 880
132, 114133, 377134, 831136, 719138, 390
139, 934141,398144,129146. 621149, 149
151, 689
151,038152,317
153, 594
150,847151,390152,068152, 774
153,396154,010
1 Dollar estimates in current prices divided by an over-all price index for personal consumption expend!tures. This price index was based on Department of Commerce data shifted from a 1939 base.
2 Estimated population of continental United States including armed forces overseas; annual data as ofJuly 1 and quarterly and semiannual data as of middle of period.
s Estim.tes based on incomplete data; second quarter by Council of Economic Advisers.NOTE.—The figures beginning with 1948 are based on the revised series of national income and product of
the Department of Commerce. For detail, see the "National Income Supplement to the Survey of CurrentBusiness," July 1951.
Sources: Department of Commerce and Council of Economic Advisers.
234
Digitized for FRASER http://fraser.stlouisfed.org/ Federal Reserve Bank of St. Louis
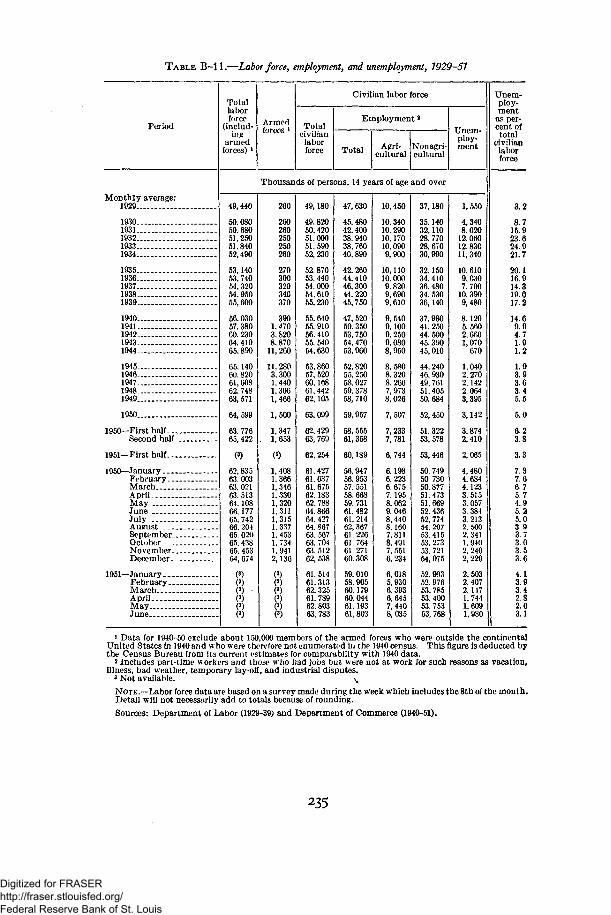
TABLE B-ll.—Labor force, employment, and unemployment, 1929-51
Period
Monthly average:1929
1930 -. -.193119321933 -_-1934
19351936193719381939
1940 — _1941194219431944
19451946194719481949
1950
1950— First halfSecond half
1951— First half
1950 — JanuaryFebruaryMarchAprilMay _JuneJuly _AueustSeptemberOctoberNovember ..December
1951 — JanuaryFebruaryMarchAprilMayJune -
Totallaborforce
(includ-ing
armedforces) *
Armedforces i
Civilian labor force
Totalcivilianlaborforce
Employment a
Total Agri-cultural
Nonagri-cultural
Unem-ploy-ment
Thousands of persons, 14 years of age and over
49, 440
50, 08050. 68051, 25051, 84052, 490
53, 14053, 74054, 32054. 95055,600
56. 03057, 38060. 23064. 41065, 890
65, 14060. 82061,60862. 74863, 571
64,599
63. 77665, 422
(3)
62, 83563. 00363, 02163, 51364. 10866,17765. 74266, 20465. 02065. 43865. 45364, 674
00(3)(3)
(3)(3)(3)
260
260260250250260
270300320340370
390M703. 8208,870
11, 260
11, 2803,3001,4401.3061,466
1,500
1.347. 1, 653
(3)
1,4081,3661, 3461.3301,3201,3111,3151.3371.4531.7341,9412,136
8(')(3)(3)(3)
49, 180
49.82050, 42051, 00051, 59052, 230
52, 87053, 44054.00054, 61055,230
55. 64055. 91056. 41055. 54054, 630
53,86057, 52060.10861,44262, 105
63, 099
62, 42963,769
62,254
61,42761. 63761. 67562. 18362. 78864. 86664. 42764. 86763. 56763. 70463, 51262, 538
61. 51461.31362. 32561. 78962. 80363, 783
47, 630
45. 48042. 40038. 94038, 76040,890
42, 26044,41046, 30044.22045, 750
47, 52050. 35053, 75054, 47053, 960
52,82055. 25058, 02759, 37858, 710
59, 957
58, 55561, 358
60, 189
56, 94756. 95357. 55158. 66859. 73161. 48261.21462, 36761,22661. 76461. 27160, 308
59,01058. 90560. 17960. 04461. 19361, 803
10, 450
10. 34010. 29010, 17010, 0909,900
10, 11010, 0009.8209,6909,610
9,5409,1009.2509,0808,950
8,5808.3208,2667,9738,026
7,507
7,2337,781
6,744
6,1986.2236.6757,1958,0629.0468,4408.1607.8118.4917, 5516,234
6.0185,9306.3936,6457,4408,035
37, 180
35. 14032,11028. 77028, 67030, 990
32, 15034,41036, 48034, 53036, 140
37.98041.25044. 50045. 39045, 010
44. 24046. 93049, 76151.40550,684
52, 450
51, 32253, 578
53, 446
50. 74950. 73050, 87751.47351, 66952. 43652. 77454. 20753.41553. 27353. 72154, 075
52. 99352. 97653, 78553. 40053. 75353,768
1,550
4,3408.020
12. 06012.83011, 340
10. 6109,0307,700
10, 3909,480
8,1205. 5602.6601,070
670
1.0402.2702.1422.0643,395
3,142
3,8742,410
2,065
4,4804,6844.1233.5153.0573.3843.2132,5002,3411,9402,2402,229
2,5032,4072,1471.7441,6091,980
Unem-ploy-ment
as per-cent oftotal
civilianlaborforce
3.2
8.7I 15.9
23.624.921.7
20.116.914.3
! 19.017.2
14.69.94.71.91.2
1.93.93.63.45.5
5.0
6-23.8
3.3
7.37.66.75.74.95.25.03.93.73.03.53.6
4.13.93.42.82.63.1
1 Data for 1940-50 exclude about 150,000 members of the armed forces who were outside the continentalUnited States in 1940 and who were therefore not enumerated iti the 1940 census. This figure is deducted bythe Census Bureau from its current estimates for comparability with 1940 data.
2 Includes part-time workers and those who had jobs but were not at work for such reasons as vacation,illness, bad weather, temporary lay-off, and industrial disputes.
3 Not available. \
NOTE.—Labor force data are based on a survey made during the week which includes the 8th of the month.Detail will not necessarily add to totals because of rounding.Sources: Department of Labor (1929-39) and Department of Commerce (1940-51).
235
Digitized for FRASER http://fraser.stlouisfed.org/ Federal Reserve Bank of St. Louis

TABLE B—12.—Number of wage and salary workers in nonagricultural establishments, 1929—51l
[Thousands of employees]
Period
Monthly average:1929
19301931...19321933.1934
1935 .19361937.19381939
194019411942 .1943.1944
1945...1946194719481949
1950
1950-First halfSecond half—
1951— First half < _ _ _ _
1950— JanuaryFebruaryMarchAprilMayJuneJulyAugust _SeptemberOctoberNovemberDecember
1951 — JanuaryFebruaryMarchApril *May <June 4
Totalwageand
salarywork-
ers
31, 041
29, 14326. 38323. 37723. 46625, 699
26. 79228. 80230. 71828. 90230, 287
32, 03136, 16439. 69742, 04241, 480
40, 06941, 41243, 37144, 20143, 006
44, 124
42. 71045, 538
45, 841
42, 12541, 66142, 29542. 92643', 31143, 94544. 09645.08045. 68445, 89845, 87346, 595
45. 24645,39045, 85045,96046, 19146,410
Manufacturing
Total
10, 534
9,4018,0216,7977,2588,346
8,9079.653
10. 6069,253
10, 078
10, 78012. 97415.05117,38117, 111
15, 30214, 46115, 24715. 28614, 146
14,884
14,22015, 549
15,902
13, 98013. 99714, 10314, 16214. 41314, 6K614, 77715, 45015,68515. 82715, 76515, 789
15, 78415. 97816,02215, 92815,83915,864
Dur-able
goods
C)
(')(»)(')(')(')
(*)
8(3)
4,683
5,3376,9458.804
11,07710, 858
9,0797,7398,3738,3157,465
8,008
7,5688,449
8,914
7,3427.3247,4187,5487,8097,9647,9788,2948,4238, 6188,6648,717
8,7428,8778,9698,9778, 9598,960
Non-dura-
blegoods
0
C)(')(8)(')(»)(8)(»)(3)(3)
5,394
5,4436.0286.2476,3046,253
6.2226,7226.8746,9706,681
6,876
6,6537,100
6,988
6,6386.6736,6856.6146,6046.7026.7997. 1567,2627,2097.1017,072
7,0427,1017,0536, 9516,8806,904
Min-ing
1,078
1,000864722735874
888937
1,006882845
916947983917883
826852943981932
904
870939
921
«861«595
938939940946922950946939938937
932930924910912917
Con-tractcon-
struc-tion
1,497
1, 3721,214
970809862
9121,1451,1121. 0551,150
1,2941.7902.1701, 5671,094
1,1321,6611.9822.1652,156
2,318
2.0702,565
2,429
1,9191.8611.<W72.0762.2452,4142. 5322.6292. 6262,6312,5712,403
2,2812.2282.3262,4722. 5922,674
Trans-porta-tionand
publicutili-ties
3, 907
3,6753.2432. 8042.6592,736
2,7712. 9563,1142.8402,912
3.0133.2483,4333. 6193,798
3,8724,0234,1224,1513,977
4,010
3,9034,117
4,117
3.8693. 8113.8733,9283,8854,0234,0624.1204.1394,1324,1234,125
4,0724,0824,1124,1324,1394,164
Trade*
6,401
6,0645,5314.9074.99Q5,552
5,6926.0766, 5436. 4536,612
6,9407.4167,3337.1897,260
7,5228,6029, 1969.4919,438
9,524
9,2819,766
9,640
9,2469,1529.2069. 3469.3269.4119.3909,4749,6419, 7529,896
10, 443
9. 5929. 5549,7139.6189.6709,695
Fi-nance
1,431
.398
.333,270,225,247
,262.313,355.347,382
,419,462,440,401,374
,394,586,641,716
1,763
1,812
1,7971,827
1,860
1,7721,7771,7911.8031,8121.8271,8311, 8371,8271,8211,8201,828
1,8311,8391,8541,8651,8751,893
Serv-ice »
3,127
3.0842,9132 6«22.6142,784
2, 8833,0603. 2333,1963,321
3,4773.7053,8573.9193,934
4.0554,6214, 7F64.7994,782
4,761
4,7464,776
4,728
4,7014,6964.7084,7574.7904.8264.8414,8274.8164,7574,7234,694
4.6664,6574,6824. 7434,7874,830
Gov-ern-
ment(Fed-eral,
State,and
local)
3,066
3,1493,2643 2253.1673,298
3,4773 6623.7493 8763,987
4.1924.6225.4316.0496,026
5.9675.6075,4545,6135,811
5,910
5,8225,998
6,245
5,7775,7425, 7695,9155,9005,8325.7415,7936.0046,0396,0376,376
6,0836,1226,2176.2926,3776,373
i Includes all full- and part-time wage and salary workers in nonagricultural establishments who workedor received pay during the pay period ending nearest the 15th of the month. Excludes proprietors, self-employed persons, domestic servants, and personnel of the armed forces. Not comparable with estimatesof nonagricultural employment of the civilian labor force reported by the Department of Commerce(appendix table B-11) which include proprietors, self-employed persons, and domestic servants, whichcount persons as employed when they are not at work because of industrial disputes, bad weather, or tem-porary lay-offs, and which are based on an enumeration of population, whereas the estimates in this tableare based on reports from employing establishments.
* Data for the trade and service divisions, beginning with 1939, are not comparable with data shown forearlier years because of the shift of the automotive repair service industry from the trade to the servicedivision.
* Not available.« Estimates based on incomplete data.» Data reflect work stoppages in bituminous coal mining.NOTE.—Detail will not necessarily add to totals because of rounding.Adjustments have been made to levels indicated by data of unemployment insurance agencies and the
Bureau of Old-Age and Survivors Insurance through 1947, and have been carried forward from 1947 bench-mark levels, thereby providing consistent series.
Source: Department of Labor.
236
Digitized for FRASER http://fraser.stlouisfed.org/ Federal Reserve Bank of St. Louis

TABLE B-13.—Average weekly hours in selected industries, 1929-51
Period
Monthly average:1929
19301931 . .193219331934 . . .
19351936-.193719381939
1940194119421943 _ .1944
19451946194719481949
1950
1950— First halfSecond half. _
1951— First half *.._
1950 — JanuaryFebruaryMarchAprilMay.. .JuneJulyAugustSeptember- _.OctoberNovember. . .December
1951— JanuaryFebruaryMarchApril *May<June *
Manufacturing
Total
44.2
42.140.538.338.134.6
36.639.238.635.637.7
38.140.642.944.945.2
43.440.440.440.139.2
40.5
39.941.1
40.9
39.739.739.739.739.940.540.541.241.041.341.141.4
41.040. fl41.141.040.740.8
Durablegoods
0)
0)0)32.634.833.9
37.341.040.035.038.0
39.342.145.146.646.6
44.140.240.640.539.5
41.2
40.541.8
41.8
40.040140.240.740.841.341.141.841.742.141.842.2
41.541.641.942.041.741.9
Non-durablegoods
0)
0)0)41.940.035.1
36.137.737.436.137.4
37.038.940.342.543.1
42.340.540.139.638.8
39.7
39.140.2
89.8
39.439.339.238.538.939.539.840.540.140.340.340.5
40.240.040.039.639.339.4
Bitumi-nouscoal
mining
38.4
33.528.327.229.527.0
26.428.827.923.527.1
28.131.132.936.643.4
42.341.640.738.032.6
35.0
32.336.1
34.5
«24.5»25.4
39.236.034.134.734.635.535.536.136.438.5
37.634.133.634.033.4(0
Build-ingcon-
struc-tion
0)
0)0)0)
&•30.132.833.432.132.6
33.134.836.438.439.6
39.038.137.6
»37.336.7
36.3
35.437.1
36.4
34.833.734.535.636.537.036.937.636.737.437.336.7
36.735.335.836.837. 60)
Class Isteamrail-
roads
44.8
43.141.138.938.840.4
41.142-543.242.543.4
44.045.646.948.749.1
48.545.946.346.143.5
40.8
40.541.0
0)
39.839.841.639.940.241.939.442.740.541.841.440.0
42.241.242.00)0)(')
Tele-phone
0)
0)0)(00)0)
0)0)38.838.939.1
39.540.140.541.942.3
(2)39.437.439.238.5
38.9
38.739.1
38.9
38.538.638.538.738.939.139.439.339.639.438.039.1
38.939.238.938.738.9(0
Whole-sale
trade
0)
0)0)(00)V1)
0)0)100)0)
88(0
0)(')41.040.940.7
40.7
40.440.9
40.7
40.640.340.340.140.440.640.940.940.740.940.841.2
40.840.640.640.740.9(0
Retailtrade
0)
0)i1)0)0)0)
o880)0)0)0)0)
0)0)40.340.340.4
40.5
40.440.6
40.0
40.440.440.340.240.440.941.241.140.440.340.040.7
40.340.139.740.039.90)
Hotels(year-
round)
(0
(00)
8(0
80)<ro0)
0)0)0)0)0)
0)0)45.244.344.2
43.9
43.943.9
43.4
43.943.843.844.044.143.843.844.043.844.043.743.9
43.443.243.343.543.4
'(')
> Not available.* Average for year not available because new series was started in April 1945. Beginning with June 1949
data relate to nonsupervisory employees only.* Not strictly comparable with previous data.4 Estimates based on incomplete data.* Data reflect work stoppages, or 3-day workweek.
NOTE.—Data are for production workers in manufacturing and mining, hourly-rated employees in rail-roads, and for nonsupcrvisory employees in other industries. Data are for payroll periods ending closest tothe middle of the month except in railroads whore monthly data are used.
Adjustments have been made to levels indicated by data of unemployment insurance agencies and theBureau of Old-Age and Survivors Insurance through 1947, and have been carried forward from 1947 bench-mark levels, thereby providing consistent series.
The half-year data are straight arithmetic averages of the monthly figures and not strictly comparablewith the annual averages which have been weighted by data on man-hours.
Source: Department of Labor.
237
Digitized for FRASER http://fraser.stlouisfed.org/ Federal Reserve Bank of St. Louis
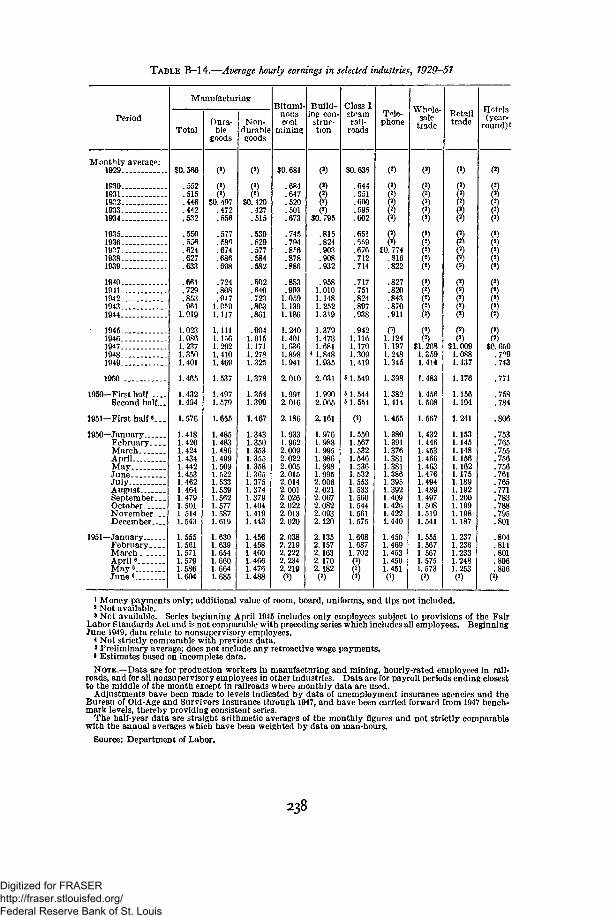
TABLE B-14.—Average hourly earnings in selected industries, 1929—51
Period
Monthly average:1929 ' _ _ _
1P30193119.°.219331934 _.
1935193619?719381939
194Q19 H1942 . _19431944 _ .
1945 .1946194719481949
1950
1950— First hn IfSecond half...
1951— First half «...
1950 — JanuaryFebruaryMarchAprilMayJuneJulyAugust _SeptemberOctoberNovember...December
1951— January.FebruaryMarchApril 8...May 6June 8
Manufacturing
Total
$0. 566
.552
.515
.446
.442
.532
.550
.5G6
.624
.627
.633
.661
.729
.853om
1.019
1. 0231.0861. 2371 3501.401
1. 465
1.4321.494
1.576
1.4181.4201.4241.4341.4421.4531.4621.4641.4791.5011.5141.543
1.5551.5611.5711.5791.5861.604
Dura-ble
goods
(8)
(2)(2)
$0 497.472. 556
.577
. 58^
.674
.686
.698
.724
.808
.9471. 0591.117
1.1111. l.r>61.2921.4101.469
1.537
1. 4971.570
1.655
1. 4851.4831.4861.4991.5091.5221.5331.5391.5621.5771.5871.619
1.6301.6391.6541.6601.6641.685
Non-durablegoods
(')
(2)(2)
$0. 420.427.515
.530
.529
.577
.584
.582
.602
.640
.723
.803
.861
.9041.0151.1711. 2781. 325
1,378
1.3541.399
1.467
1.3431.3501. 3531.3551.3581. 3051.3751.3741.3791.4041.4191.443
1.4561.4581.4601.4661.4761.488
Bitumi-nouscoal
mining
$0. 681
.684
.647
.520
.501
.673
.745
.794
.8-F6
.878
.886
.883
.993
.059
.139
.186
.240
.401
. 6361.8981,941
2.010
1.9912.016
2.186
1.9331.9622.0092.0222.0052.0152.0142.0012.0262.0222. 0132.020
2.0382.2192.2222.2342.219(2)
Build-in? con-
struc-tion
(2)
(2>(2)(2)(2)
$0. 795
.815
.824
.903
.90S
.932
.9581.0101.1481. 2521.319
1.3791.4731.681
« 1.8481.935
2. 031
1.9002. 065
2.161
1.9761.9881.9951.9861.9981.9952.0062.0212.0672.0822.0932.120
2.1352.1572.1632.1702.182(2)
Class Istrainrail-
roads
$0.636
.644
.651
.600
. 595
.602
.651
.659
.676
.712
.714
.717
.751
.824
.897
.938
.9421.1161.1701. 3091.419
« 1. 549
« 1. 5448 1. 554
(2)
1.5501.5671.5321.5461.5361.5321.5531.5331.5601.5441.5611.575
1.6081.6871.702(2)
8
TVle-phone
(2)
(2)
§8(2)(2)
$0. 774.816.822
.827
.820
.843
.870
.911
0)1.1241.1971.2481.345
1.398
1.3821. 414
1.455
1.3801.3911.3761.3811.3811.3861.3951.3921.4091.4261.4221.440
1.4501.4691.4531.4501.451(2)
Whole-sale
trade
(2)
(2)
8(2)(2)
(2)
8(2)(2)(2)(2)(2)(2)(2)
8$1. 268
1. 3591. 414
1.483
1. 4561.508
1.567
1.4321.4461.4531.4661.4631.4761.4941.4891.4971.5081.5191.541
1.5551.5671.5671.5751.573(2)
"Retailtrade
(2)
(2)(2)(2)(2)(2)
(2)(2^
(2)(2)(2)
(2)(2)(2)(2)(2)
(2)(2)
$1.0091.0881.137
1.176
.156
.194
.241
.153
.145
.148
.156
.162
.175
.189
.192
.200
.199
.198
.187
.237
. 236
.233
.248
.253(2)
Hotels(year-
round)!
f2)
(2)
8888(2)
(2)(2)(2)(2)(2)
(2)(«>
$0. 650.7n9.743
.771
.758
.784
.806
.753
.765
.755
.756
.756
.761
.765
.771
.783
.788
.795
.801
.804
.811
.801
.806
.806(2)
nents only; additional value of room, board, uniforms, and tips not included.3 Not available.* Not available. Series beginning April 1945 includes only employees subject to provisions of the Fair
Labor Standards Act and is not comparable with preceding series which includes all employees. BeginningJune 1949, data relate to nonsupervisory employees.
4 Not strictly comparable with previous data.5 Preliminary average; does not include any retroactive wage payments.• Estimates based on incomplete data.NOTE.—Data are for production workers in manufacturing and mining, hourly-rated employees in rail-
roads, and for all nonsupervisory employees in other industries. Data are for payroll periods ending closestto the middle of the month except in railroads where monthly data are used.
Adjustments have been made to levels indicated by data of unemployment insurance agencies and theBureau of Old-Age and Survivors Insurance through 1947, and have been carried forward from 1947 bench-mark levels, thereby providing consistent series.
The half-year data are straight arithmetic averages of the monthly figures and not strictly comparablewith the annual averages which have been weighted by data on man-hours.
Source: Department of Labor.
238
Digitized for FRASER http://fraser.stlouisfed.org/ Federal Reserve Bank of St. Louis

TABLE B-l 5.—Average gross weekly earnings in selected industries > 1929-51
Period
Monthly average:1929
193019311932..19331934
19351936, _193719.181939
194019411942...19431944
19451946194719481949
1950 —
1950-First halfSecond half..
1951— First half e...
1950 — January ._FebruaryMarchAprilMav .JuneJulyAugustSeptemberOctoberNovemberDecember
1951 — JanuaryFebruaryMarchAprilsMay 6
June 6
Manufacturing
Total
$25. 03
23.2520.8717.0516.7318.40
20.1321.7824.0522.3023.86
25.2029 5836. 6543.1446.08
44.3943.8249.9754. 1454.92
59.33
57.0861.38
64.48
56.2956.3750.5356.9357.5458.8559.2160.3260.6461.9962.2363. 88
63.7663.8464.5764.7464.5565.44
Dura-ble
goods
$27. 22
24.7721.2816.2116.4318.87
21. 5224.0426.9124.0126.50
28.4434.0442.7349. 3052.07
49.0546.4952.4657. 1158.03
63.32
60.6865.59
69.14
59.4059.4759.7461.0161.5762.8663.0164.3365.1466.3966. 3468.32
67.6568.1869. 3069.7269. 3970.60
Non-durablegoods
$22.93
21.8420.5017.5716.8918.05
19.1119. 9121.5321.0521.78
22.2724 9229.1334.1237.12
38.2941.1446.9650.6151.41
54.71
52.9956.32
58.32
52.9153.0653. 0452.1752.8353.9254.7355.6555.3056.5857.1958.44
58.5358.3258. 4058.0558.0158.63
Bitumi-nouscoal
mining
$25. 72
22.2117.6913.9114.4718.10
19.5822.7123.8420.8023.88
24.7130.8635. 0241.6251.27
52.2558.0366. 5972.1263. 28
70.35
64.5072.78
75.417 47. 36i 49. 83
78.7572.7968.3769.9269. 6871.0471.9272.9973.2777.77
76.6375.6774. 6675.9674.11(2)
Build-ing con
struc-tion
(2)
(2)(2)(2)(2)
$22. 97
24.5127.0130.1429.1930.39
31.7035.1441.8048.1352.18
53. 7356.2463.30
< 68. 8570.95
73.73
70.3476.60
78.77
68.7667.0068.8370.7072.9373.8274.0275.9975.8677.8778.0777.80
78.3576.1477.4479.8682.04(2)
Class Isteamrail-
roads
$28.49
27.7626.7623.3423. 0924.32
26.7628.0129.2030.2630. 99
31.5534.2538.6543.6846.06
45.6951.2254.1760.3461.73
8 63. 20
s 62. 57« 63. 67
(2)
61.6962.3763.7361.6961.7564.1961.1965.4663.1864.5464.6363.00
67.8669.5071.48(2)(2)(a)
Tele-phone
(2)
(2)(2)(2)
8§
$29. 8131.5331.94
32.4432.7433. 9736.3038.39
(3)44.0444.7748.9251.78
54.38
53.5255.33
56.61
53.1353.6952.9853.4453.7254.1954.9654.7155.8056.1854.0456.30
56. 4157.5856.5256.1256.44(2)
Whole-sale
trade
(')
(2)(2)(2)(2)(2)
8(')(2)(2)
(2)(2)(2)0)(2)
(2)(2)
$51. 9955.5857.55
60.36
58. 8061.68
63.82
58.1458.2758.5658.7959.1159.9361.1060.9060.9361.6861.9863.49
63. 4463.6263. 6264.1064.34(2)
Retailtrade
(2)
(')(2)(2)
8(2)(2)(2)
8(2)(2)1?!
$40. 6643.8545.93
47.63
46.7648.50
49.65
46.5846.2646.2646.4746.9448.0848.9948.9948.4848. 3247.9248.31
49.8549.5648.9549.9249.99(a)
Hotels(year-
round) *
(*)
8(2)(2)(2)
(3)(2)(2)
8(')(2)(2)(2)(2)
(')0)
$29. 3631.4132.84
33.85
33.2634.38
34.93
33.0633.5133.0733.2633.3433.3333.5133.9234.3034.6734.7435.16
34.8935.0434. 6835.0834.98(»)
1 Money payments only; additional value of room, board, uniforms, and tips not included.8 Not available.* Not available. Series beginning April 1945 includes only employees subject to provisions of the Fair
Labor Standards Act and is not com parable with preceding series which includes all employees. BeginningJune 1949, data relate to nonsupervisory employees.
4 Not strictly comparable with previous data.« Preliminary average; does not include any retroactive wage payments.fl Estimates based on incomplete data.7 Data reflect work stoppages, or 3-day workweek.
NOTE.—Data are for production workers in manufacturing and mining, hourly-rated employees in rail-roads, and for all nonsupervisory employees in other industries. Data are for payroll periods ending closestto the middle of the month except in railroads where monthly data are used.
Adjustments have been made to levels indicated by data of unemployment insurance agencies and theBureau of Old-Age and Survivors Insurance through 1947. and have been carried forward from 1947 bench-mark levels, thereby providing consistent series.
The half-year data are straight arithmetic averages of the monthly figures and not strictly comparablewith the annual averages which have been weighted by data on man-hours.
Source: Department of Labor.
239
Digitized for FRASER http://fraser.stlouisfed.org/ Federal Reserve Bank of St. Louis
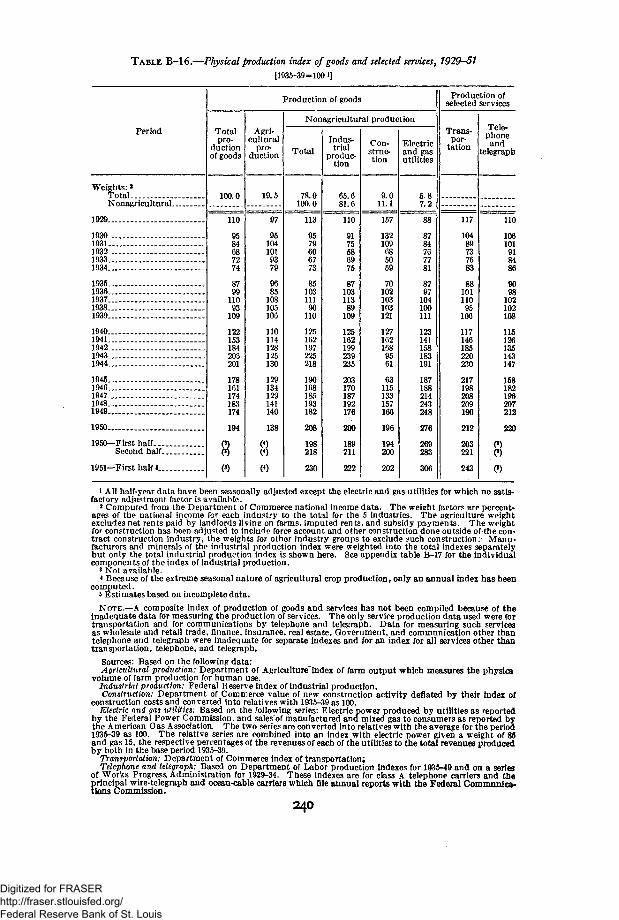
TABLE B-16.—Physical production index of goods and selected services, 1929—51
[1935-39=100 i]
Period
Weights: »TotalNonagricultural
1929
19301931193219331934 - -
1935193619371938 _-. _ _1939
19401941194219431944
1945194619471948 _ _1949
1950
1950— First halfSecond half
1951— First half «
Production of goods
Totalpro-
ductionof goods
100.0
110
9584687274
8799
11093
109
122153184205201
178161174183174
194
8(3)
Agri-cultural
pro-duction
19.5
97
951041019379
9685
108105106
110114128125130
129134129141140
138
(4)(4)
(4)
Nonagrictiltural production
Total
78.0100.0
113
9579606773
8510311190
110
125162197225218
190168185193182
208
198218
230
Indus-trial
produc-tion
65.681.6
110
9175586975
8710311389
109
125162199239235
203170187192176
200
189211
222
Con-struc-tion
9.011.1
157
132109685059
70102103103121
1271621689561
63115133157166
196
194200
202
Electricand gasutilities
5.87.2
88
8784767781
8797
104100111
123141158183191
187188214243248
276
269283
306
Production ofselected services
Trans-por-
tation
nT
10489737683
8810111095
106
117146185220230
217198208209190
212
203221
243
Tele-phoneand
telegraph
no106101918486
9098
102102108
115126135143147
158182196207212
220
.8(3)
1 All half-year data have been seasonally adjusted except the electric and gas utilities for which no satis-factory adjustment factor is available.2 Computed from the Department of Commerce national income data. The weight factors are percent-ages of the national income for each industry to the total for the 5 industries. The agriculture weightexcludes net rents paid by landlords living on farms, imputed rents, and subsidy payments. The weightfor construction has been adjusted to include force account and other construction done outside of the con-tract construction industry, the weights for other industry groups to exclude such construction. Manu-facturers and minerals of the industrial production index were weighted into the total indexes separatelybut only the total industrial production index is shown here. See appendix table B-17 for the individualcomponents of the index of industrial production.
3 Not available.* Because of the extreme seasonal nature of agricultural crop production, only an annual index has been
computed.s Estimates based on incomplete data.NOTE.—A composite index of production of goods and services has not been compiled because of the
inadequate data for measuring the production of services. The only service production data used were fortransportation and for communications by telephone and telegraph. Data for measuring such servicesas wholesale and retail trade, finance, insurance, real estate, Government, and communication other thantelephone and telegraph were inadequate for separate indexes and for an index for all services other thantransportation, telephone, and telegraph.
Sources: Based on the following data:Agricultural production: Department of Agriculture index'of farm output which measures the physica
volume of farm production for human use.Industrial production: Federal Reserve index of industrial production.Construction: Department of Commerce value of new construction activity deflated by their index of
construction costs and converted into relatives with 1935-39 as 100.Electric and gas utilities: Based on the following series: Electric power produced by utilities as reported
by the Federal Power Commission, and sales'of manufactured and mixed gas to consumers as reported bythe American Gas Association. The two series are converted into relatives with the average for the period1935-39 as 100. The relative series are combined into an index with electric power given a weight of 85and gas 15, the respective percentages of the revenues of each of the utilities to the total revenues producedby both in the base period 1935-39.
Transportation: Department of Commerce index of transportation;Telephone and telegraph: Based on Department of Labor production indexes for 1935-49 and on a series
of Works Progress, Administration for 1929-34. These indexes are for class A telephone carriers and theprincipal wire-telegraph and ocean-cable carriers which file annual reports with the Federal Communica-tions Commission.
240
Digitized for FRASER http://fraser.stlouisfed.org/ Federal Reserve Bank of St. Louis
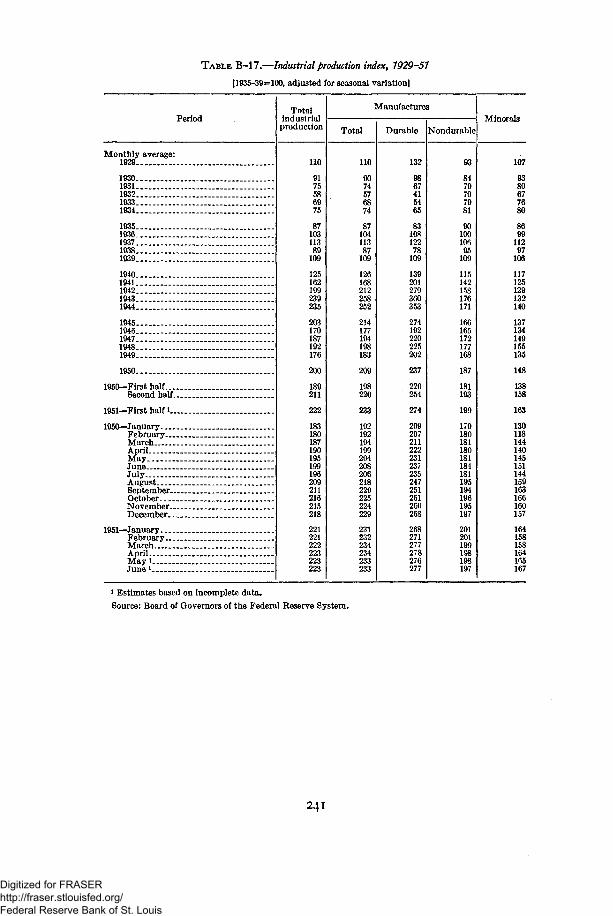
TABLE B-17.—Industrial production index, 192Q-51
[1935-39=100, adjusted for seasonal variation]
PeriodTotal
industrialproduction
Manufactures
Total Durable NondurableMinerals
Monthly average:1929
19301931193219331934
19351936193719381939
19401941194219431944
19451946194719481949
1950
1950—First half....Second half..
1951—First half»...
1950—JanuaryFebruary—MarchAprilMayJuneJulyAugustSeptember-OctoberNovember...December. _.
1951—JanuaryFebruaryMarchAprilMayiJune*
110
9175586975
8710311389
109
125162199239235
203170187192176
200
189211
222
183180187190195199196209211216215218
221221222223223223
110
9074576874
8710411387109
126168212258252
214177194198183
209
198220
233
192192194199204208206218220225224229
231232234234233
132
9867415465
8310812278109
139201279300353
274192220225202
237
220254
274
209207211222231237235247251261260268
268271277278276277
93
8479707981
9010010695109
115142158176171
166165172177168
187
181193
199
179180181180181184181195194196195197
201201199198198197
107
93806776
11297106
117125129132140
137134149165135
148
138158
163
130118144140145151144159163166160157
164158158164165167
i Estimates based on incomplete data.Source: Board of Governors of the Federal Reserve System.
241
Digitized for FRASER http://fraser.stlouisfed.org/ Federal Reserve Bank of St. Louis

Table B-18.—Percentage changes in production and consumption of selected commodities, UnitedStates and other free world, 7939 to 1950
[Percent]
Commodity
Commodities in which United States is substantiallyself-sufficient:
Bread grains 'Coarse grains 3 5 _ __ _.Cotton 3
Fats and oils 8 . _ _ _ . . .Fertilizer (nitrogenous)Lumber.. . . . .Meat8
Sulfur — native
Commodities of which United States has substantialimports:
Aluminum... . .Cobalt •Copper9
Coffee (green) 3 _ _.Iron ore .Lead9
Manganese ore _ .Newsprint-Nickel 9
PetroleumRubber: Natural and synthetic-
Natural only __ _.Sugar (raw equivalent)Tin9 __Tungsten 9
Wood pulp (mechanical and chemical) ...Wool 3
Zinc9
Production
UnitedStates
+27+34-24+64
+402+43+47
+148
+340+560+25
+90+4
+343+4
+561° + 47, 500
+24
+15+74-26+6
Other freeworld
+11+14+10-9
+52-50+3
-31
+59+-6g-8
-20-18+31+10+14
+172+89+85+35
-+437
+14+9
+14
Consumption *
UnitedStates
+5+39
'+547+30
7+237+59
7+33+158
+560+266+1087+53
+96+123+144+64+50+91
7+1127 +227+26
+57+80+75
7+71+60
Other freeworld 2
87-32+11
7+57(<)(«)
+50
+17-20-40-14-7
-20-15
(«)-35+91
7+797+74
+1-35
(4)(4)
7+22-8
1 Apparent consumption, i. e., production plus imports minus exports, except as noted in footnote 7.2 Estimated.» Change from 1935/36 to 1939/40 average to 1950/51.4 Not available.• Barley, corn, and oats.8 Change from 193-V36 to 1938/39 average to 1950/51. Oil-content basis. Includes butter and peanuts.7 Represents estimated actual rather than apparent consumption.« Change from 1937/38 to 1941/42 average to 1950/51.9 Production represents metal content of mine production.10 This very high percentage results from the low absolute level of production of synthetic rubber in
1939.Source: Compiled by the Department of State.
242
Digitized for FRASER http://fraser.stlouisfed.org/ Federal Reserve Bank of St. Louis

TABLE B-19.—New construction activity, 1929-51
[Value put in place, millions of dollars]
Period
1929
19301931 .193219331934 _ _
1935193619371938 _ . .1939
194019411942. _.19431944
1945 .1946 _194719481949
1950
1950— First half.Second half
1951 First half
1950 — JanuaryFebruaryMarch ___A prilMay _ _June _July .August .SeptemberOctoberNovember _December
1951 — JanuaryFebiuaryMarch _AprilMay__ __ _June
Totalnewcon-
struc-tion
10, 793
8,7416,4273,5382,8793,720
4,2326,4976.9996,9808,198
8,68211,95714,0758 3015,259
5, 63312,00016, 62721,57222, 584
27,902
Private construction
Totalpri-
vate1
8,307
5,8833,7681,6761,2311,509
1,9992,9813,9033, 5604,389
5,0546,2063,4151,9792,186
3,2359,638
13,13116,66516, 181
20, 789
Resi-den-tial
build-ing
(non-farm)
3,625
2,0751,565
630470625
1,0101,5651,8751,9902,680
2.9853,5101,715
885815
1,1004,0156,3108,5808,267
12,600
Non-resi-den-tial
build-ing
(non-farm)
2,694
2,0031,099
502406456
472713
1,085764786
1,0251,482
635233351
1,0203,3413,1423,6213,228
3,777
Otherpri-vate2
1,988
1,8051,104
544355428
517703943806923
1,0441,2141,065
8611,020
1,1152,2823,6794,4644,686
4,412
Public construction
Totalpublic
2,486
2,8582,6591,8621,6482,211
2, 2333,5163,0963,4203,809
3,6285, 751
10, 6606, 3223,073
2,3982, 3623,4964,9076,403
7,113
Mili-taryand
naval
19
2940343647
37293762
125
3851,6205,0162,550
837
690188204158137
177
Non-resi-den-tial
build-ing
659
660612415230363
328701550672970
6151,6463,6852,0101,361
937354599
1,3012,068
2,402
High-ways
1,266
1,5161, 355
958847
1,000
8451,3621,2261,4211,381
1,3021,066
734446362
398895
1,5141,8562,129
2,350
Otherpub-lic'
542
653652455535801
1,0231,4241,2831,2651,333
1,3261,4191.2251,316
513
373925
1,1791,5922,069
2,184
Seasonally adjusted annual rates
26,54229, 262
30, 756
25, 14025, 76426. 64027. 00026,91627, 79228.16428. 88429, 53229.74829,97629, 268
30, 01230, 86432. 06431. 74030.21629, 640
19, 57622, 002
21, 796
18, 14419, 18819, 32019, 71620. 24420. 84421.61222, 08022, 32022, 32021.99621, 684
21.90022. 89622. 99222, 15220, 65220,184
11, 79413, 406
11, 798
10,48811, 54411,55612. 00012.31212.86413. 48813. 81213, 93213. 60812, 93612, 660
12, 58813. 23612. 93611,89210. 3089,828
3,3664,188
5,228
3. 2523.3243.2883,3243,4803.5283,6723,8043,9964, 3204,6444,692
4,7405,0285,2565,4125,4845,448
4,4164,408
4,770
4.4044,3204,4764,3924,4524,4524,4524,4644,3924,3924,4164,332
4,5724, 6324,8004.8484,8604,908
6,9667,260
8,960
6.9966.5767, 3207,2846.6726,9486. 5526.8047.2127,4287,9807,584
8,1127,9689.0729,5889,5649,456
124230
728
156132120120108108108168216276288324
432468576792
1,0321,068
2,2222,582
3,326
2.1002,1962,1842,1962, 3642.2922,1602.2562.5082.7722,8802,916
3,0603, 0003,2043,5043,6123,576
2.4102,290
2,430
2, 4602.0762,8202, 7362.0042,3642,2562, 3042,3762,1722,5202,112
2.3282,1722,8082,7002,3282,244
2,2102,158
2,476
2,2802.1722.1962,2322,1962, 1842,0282.0762,1122.2082,2922,232
2.2922,3282,4842,5922,5922,568
1 Excludes construction expenditures for crude petroleum and natural-gas drilling, and therefore does notagree with the new construction expenditures included in the gross national product.2 Includes public utility, farm, and other private construction, not separately sh »wn.
3 Includes residential, sewer and water, miscellaneous public service enterprises, conservation and develop-ment, and all other public construction not separately shown.
Sources: Department of Commerce and Department of Labor.
243
Digitized for FRASER http://fraser.stlouisfed.org/ Federal Reserve Bank of St. Louis
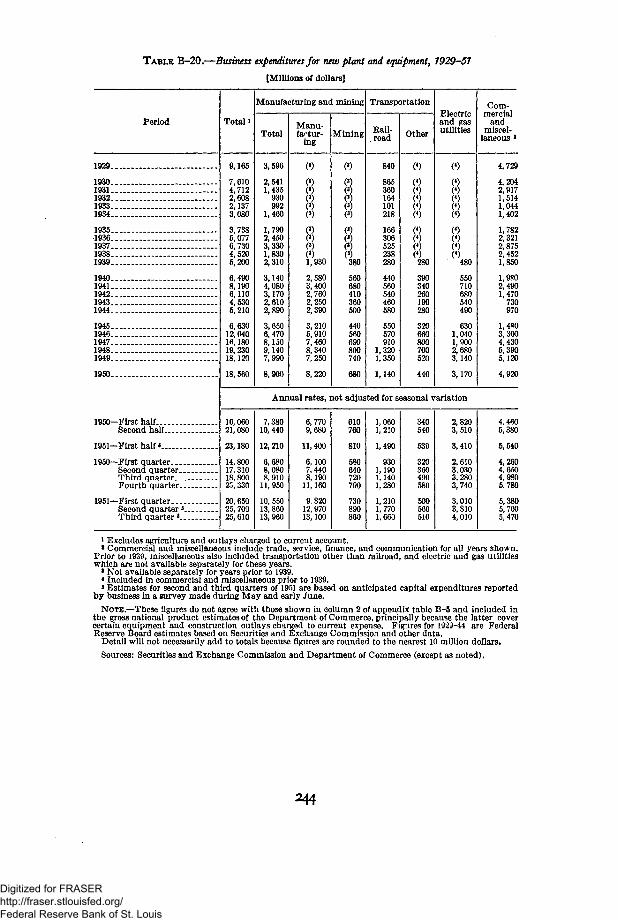
TABLE B-20.—Business expenditures for new plant and equipment, 1929-51
[Millions of dollars]
Period
1929
193019311932 .19331934
19351936 -_19371938 -.-1939
19401941 .194219431944
19451946194719481949
1950
1950— First halfSecond half
1951— First half*
1950— First quarterSecond QuarterThird quarterFourth quarter
1951 — First quarterSecond quarter •Third quarter *. . .
Total i
9,165
7,6104,7122,6082,1373,080
3,7385,0776,7304,5205,200
6,4908,1906,1104,5305,210
6,63012,04016, 18019, 23018,120
18,560
Manufacturing and mining
Total
3,596
2,5411,435
930992
1,460
1,7902,4503,3301,8302,310
3,1404,0803,1702,6102,890
3,6506,4708,1509,1407,990
8,900
Manu-factur-
ing
(')
(«)
88(3)(3)(3)0)1,930
2,5803,4002,7602, 2502,390
3,2105,9107,4608,3407,250
8,220
Mining
(')
(*)(')(3)(3)(3)
0)(')(')(8)380
560680410360500
440560690800740
680
Transportation
Rail-.road
840
865360164101218
166306525238280
440560540460580
550570910
1,3201,350
1,140
Other
(4)
(4)
88(4)(4)(4)(4)280
390340260190280
320660800700520
440
Electricand gasutilities
(«)
(4)(4)(4)(4)(4)
(4)(4)(4)(4)
480
550710680540490
6301,0401,9002,6803,140
3,170
Com-mercial
andmiscel-
laneous *
4,729
4,2042,9171,5141,0441,402
1,7822,3212,8752,4521,850
1,9802,4901,470
730970
1,4803,3004,4305,3905,120
4,920
Annual rates, not adjusted for seasonal variation
16,06021, 080
23,180
14, 80017,31018, 80023,330
20,65025,70025, 610
7,38010, 440
12, 210
6,6808,0808,910
11, 950
10, 55013, 86013, 960
6,7709,680
11, 400
6,1007,4408,190
11, 160
9,82012, 97013, 100
610760
810
580640720790
730890860
1,0601,210
1,490
9301,1901,1401,280
1,2101,7701,660
340540
530
320360490580
500560610
2,8203,510
3,410
2,6103, 0303,2803,740
3,0103,8104,010
4,4605,380
5,540
4,2604,6504,9805.780
5,3805,7005,470
1 Excludes agriculture and outlays charged to current account.* Commercial and miscellaneous include trade, service, finance, and communication for all years shown.
Prior to 1939, miscellaneous also included transportation other than railroad, and electric and gas utilitieswhich are not available separately for these years.1 Not available separately for years prior to 1939.
< Included in commercial and miscellaneous prior to 1939.»Estimates for second and third quarters of 1951 are based on anticipated capital expenditures reported
by business in a survey made during May and early June.NOTE.—These figures do not agree with those shown in column 2 of appendix table B-5 and included in
the gross national product estimates of the Department of Commerce, principally because the latter covercertain equipment and construction outlays charged to current expense. Figures for 1929-44 are FederalReserve Board estimates based on Securities and Exchange Commission and other data.
Detail will not necessarily add to totals because figures are rounded to the nearest 10 million dollars.Sources: Securities and Exchange Commission and Department of Commerce (except as noted).
244
Digitized for FRASER http://fraser.stlouisfed.org/ Federal Reserve Bank of St. Louis

TABLE B-21.—Inventories and sales in manufacturing and tradet 1939-51
[Adjusted for seasonal variation]
Period
1939 .
19401941194219431944
19451946194719481949
1950—.
1950: First half....Second half.
1951: First half*..
1950: JanuaryFebruary.-.MarchAprilMayJune . ..JulyAugustSeptember. .OctoberNovember, .December. _.
1951: JanuaryFebruary ...March *April*May*
Total manufacturingand trade
Millions ofdollars
Inven
tori
es *
20, 172
22,18428, 77231,01331,14330, 887
30, 57142, 38950, 79456, 75651, 608
61, 569
54,24161,569
69,926
52, 02451, 82552, 48452,90553, 55354, 24]53, 24354,49656,40458,66060, 26961, 569
63.38864, 42466. 45468, 47669, 926
OT
£m
11,109
12, 52016,41219, 24022,37224,084
24.18127, 57633, 58137, 00334, 857
39, 615
36, 72442, 498
45, 203
34, 24435, 30536, 59935, 64538, 65239, 89641, 98245, 27542, 14241,82141,31842. 452
46, 65545. 35645,19643, 54645, 261
Ra
tio
o
f av
erag
ein
ve
nto
rie
s to
mo
nth
ly s
ales
*
1.73
1.681.531.601.361.30
1.271.291.411.461.56
1.38
1.431.34
1.45
1.511.471.431.481.38.35.28.19.32.38.44.44
.34
.411.451. 551.53
Manufacturing
Millions ofdollars
Inven
tori
es >
11,465
12, 81916, 96019, 28720,09819, 507
18,39024. 49828,92032, 27628, 879
34, 061
30,02834, 061
38,824
29. 03528,99029, 07329.38429. 65930, 02829. 83029, 85830, 73231, 77033, 00734, 061
34, 92835, 47436.41537, 84938, 824
CQ
5,100
5,8528,168
10. 42512. 82213, 788
12,88312,61715, 91817, 81116, 666
19, 574
17, 87421, 337
23,063
16,21616, 87717, 79717,20619, 30919, 83820,26922, 95621, 15421, 24621,11221, 284
23,16622, 64623. 39922, 38923, 715
Ra
tio
of
aver
age
inv
en
tori
es
tom
on
thly
sal
es '
2.11
2.061.781.771.611.45
1.481.661.711.721.85
1.54
1.641.46
1.57
1.791.721.631.701.531.501.481.301.431.471.531.58
1.491.551.541.601.62
Wholesale trade
Millions ofdollars
Inven
tori
es *
3,175
3,3254,1823, 8583.6843,980
4,6386,6658,6539,5119,031
10, 754
9.49310, 754
11,988
8,9919, 0359,1299,3849.4789,4939,2889,5629,879
10, 19310, 47510,754
11,03811, 13311,39711, 65111, 988
«832,505
2,8023,6204,0124,2734,561
4,9836.6017,7548,3557,509
8,354
7,6529,019
9,581
7,1737, 3277,6777,3598,0168,3599,0139,6378,8558.8168,8198,974
10, 1829,6359,4739,1329,481
<U Ob£+>03t* •«03 M W^ O3 en
Ra
tio
o
f ai
inv
en
tori
mo
nth
ly s
al
1.21
1.161.031.02.86.86
.82
.811.031.091.23
1.14
1.201.10
1.18
1.261.231.181.261.181.131.04.98
1.101.141.171.18
1.071.151.191.261.25
Retail trade
Millions ofdollars
Inven
tori
es *
5,532
6,0407,6307,8687,3617,400
7,54311,22613, 22114,96913,698
16,754
14,72016, 754
19, 114
13, 99813,80014,28214, 13814.41614, 72014, 12515,07615,79316, 69716, 78716, 754
17, 42217, 81718, 64218, 97619, 114
e»
8a3,504
3,8664,6244,8035,2776,735
6,3158,3589,909
10.83710, 682
11,687
11,19812, 142
12, 559
10, 85511, 10111,12511, 08011,32711,69912, 70012,68212, 13311, 75911,38712,194
13,30713, 07512. 32412. 02512, 065
Ra
tio
o
f av
erag
ein
ve
nto
rie
s to
mo
nth
ly s
ales
*
1.53
1.471.461.711.381.31
1.201.111.221.321.34
1.28
1.261.29
1.44
1.281.251.261.281.261.251.141.151.271.381.471.38
1.281.351.481.561.58
1 Book value, end of period.* Monthly average shown for year and half-year and total for month.* Average inventories based on centered averages of end-of-period figures.* Estimates based on incomplete data.
NOTE.—The inventory figures in this table do not agree with the estimates of "change in businessinventories" included in the gross national product since they cover only manufacturing and trade ratherthan all business, and show inventories in terms of current book value without adjustment for revaluation.
Source: Department of Commerce.
245
Digitized for FRASER http://fraser.stlouisfed.org/ Federal Reserve Bank of St. Louis
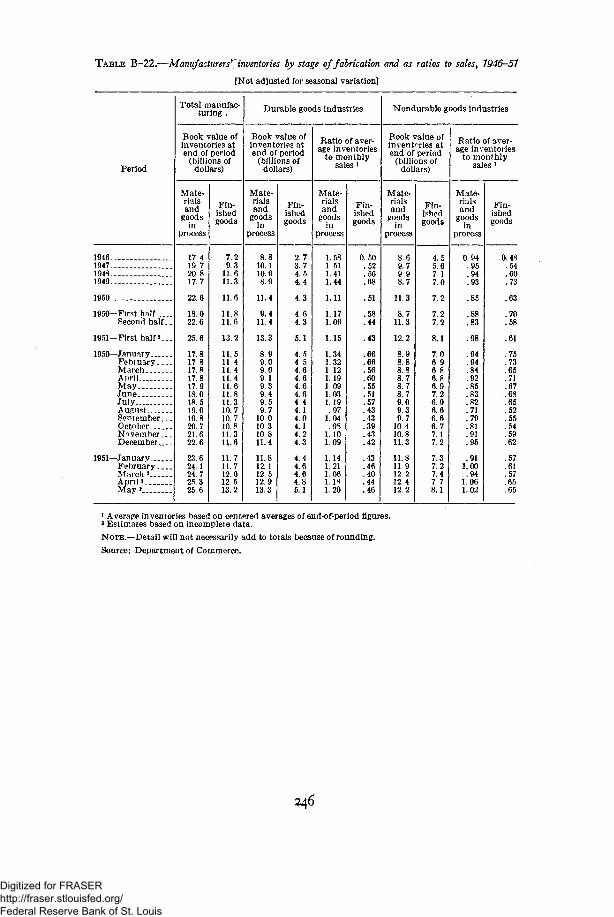
TABLE B—22.—Manufacturers' inventories by stage of fabrication and as ratios to sales, 1946-51
[Not adjusted for seasonal variation]
Period
194619471948 .1949
1950
1950— First half ....Seconci half. .
1951— First half*...
1950— JanuaryFebruaryMarchAprilMayJuneJulyAugust _.September...OctoberNovember...December
1951— JanuaryFebruaryMarch 2
April *May *
Total manufac-turing ,
Book value ofinventories atend of period
(billions ofdollars)
Mate-rialsand
goodsin
process
17 419 720.817.7
22.6
18.022.6
25.6
17.817 817.817.817.918.018.519.019.820.721.622 6
23.624.124.725.325.6
Fin-ishedgoods
7.29.3
11.611.3
11.8
11.811.6
13.2
11.511 411.411.411.611.811.310.710.710.811 311.6
11.711.712.012 513.2
Durable goods industries
Book value ofinventories atend of period
(billions ofdollars)
Mate-rialsand
goodsin
process
8.810.110.98.9
11.4
9.411.4
13.3
8.99.09.09 19.39.49.59.7
10 010.310.811.4
11.812.112.512.913.3
Fin-ishedgoods
2.73.74.54.4
4.3
4.64.3
5.1
.55
.6
.6
.64.64 44.14.04.14.24.3
4.44.64.64.85.1
Ratio of aver-age inventories
to monthlysales *
Mate-rialsand
goodsin
process
1.581 511.411.44
1.11
1.171.06
1.15
1.341.321.121.191 091.031.19.97
1.04.98
1.101.09
1.141.211.061.181.20
Fin-ishedgoods
0.50.52.56.68
.51
.58
.44
.43
.66
.66
.56
.60
.55
.51
.57
.43
.43
.39
.43
.42
.43
.46
.40
.44
.46
Nondurable goods industries
Book value ofinventories atend of period
(billions ofdollars)
Mate-rialsand
goodsin
process
8.69.79.98.7
11.3
8.711.3
12.2
8.98.88.88.78.78.79.09.39.7
10 410.811.3
11.811 912.212.412.2
Fin-ishedgoods
4.55.67 17.0
7.2
7.27.2
8.1
7.06 96.86.86.97.26.96.66.66.77.17.2
7.37.27.47.78.1
Ratio of aver-age inventories
to monthlysales i
Mate-rialsand
goodsin
process
0.94.95.94.93
.85
.88
.83
.98
.94
.94
.84
.92
.85
.83
.82
.71
.79
.81
.91
.95
.911.00.94
1.061.02
Fin-ishedgoods
0.48.54.60.73
.63
.70
.58
.61
.75
.73
.65
.71
.67
.68
.65
.52
.55
.54
.59
.62
.57
.61
.57
.65
.65
1 Average inventories based on centered averages of end-of-period figures.2 Estimates based on incomplete data.NOTE.—Detail will not necessarily add to totals because of rounding.
Source: Department of Commerce.
246
Digitized for FRASER http://fraser.stlouisfed.org/ Federal Reserve Bank of St. Louis
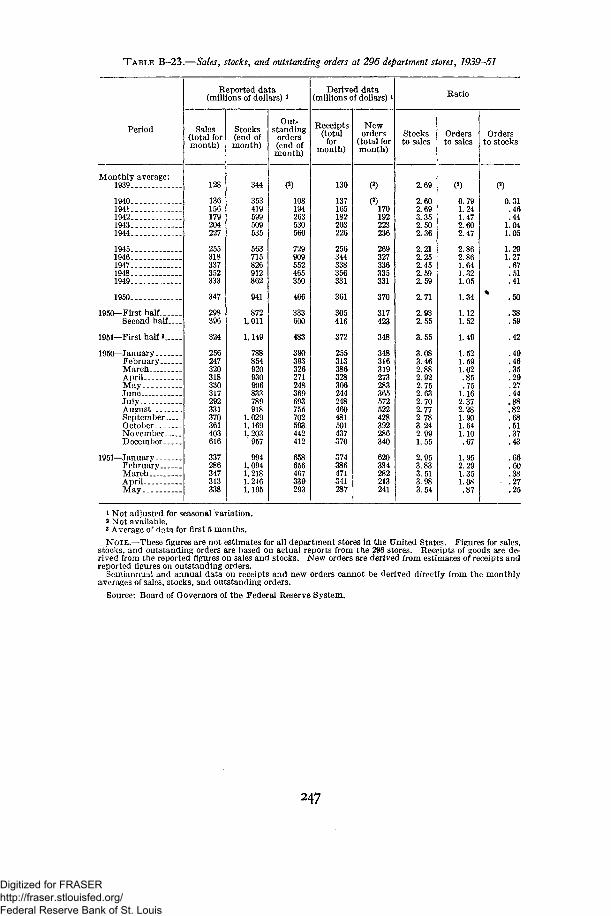
TABLE B-23.—Sales, stocks, and outstanding orders at 296 department stores, 1939-51
Period
Monthly average:1939
1940194119421943.1944
19451946194719481949
1950
1950— First halfSecond half
1951— First half 3
195Q — JanuaryFebruaryMarch _.AprilMay -JuneJulyAusustSeptemberOctober .NovemberDecember
1951 — JanuaryFebruaryMarchAprilMay
Reported data(millions of dollars) *
Sales(total formonth)
128
136156179204227
255318337352333
347
298396
324
256247320318330317292331370361403616
337286347313338
Stocks(end ofmonth)
344
353419699509535
563715826912862
941
8721,011
1,149
788854920930906833789918
1,0291.1691,203
957
9941,0941,2181,2461,195
Out-standing
orders(end ofmonth)
(2)
108194263530560
729909552465350
466
333600
483
390393326271248369693755702593442412
658656467339293
Derived data(millions of dollars) !
Receipts(total
formonth)
130
137165182203226
256344338356331
361
305416
372
255313386328306244248460481501437370
374386471341287
Neworders
(total formonth)
(2)
(2)170192223236
269327336335331
370
317423
348
348316319273283365572522428392286340
620384282213241
Ratio
Stocksto sales
2.69
2.602.693.352. 502.36
2.212.252.452.592.59
2.71
2.932.55
3.55
3.083.462.882.922.752.632.702.772.783.242.991.55
2.953.833.513.983.54
Ordersto sales
(2)
0.791.241.472.602.47
2.862.861.641.321.05
1.34
1.121.52
1.49
1.521.591.02.85.75
1.162.372.281.901.641.10.67
1.952.291.351.08.87
Ordersto stocks
(2)
0.31.46.44
1.041.05
1.291.27.67.51.41
% .50
.38
.59
.42
.49
.46
.35
.29
.27
.44
.88
.82
.68
.51
.37
.43
.66
.60
.38
.27
.25
1 Not adjusted for seasonal variation.2 Not available.3 Average of data for first 5 months.NOTE.—These figures are not estimates for all department stores in the United States. Figures for sales,
stocks, and outstanding orders are based on actual reports from the 296 stores. Receipts of goods are de-rived from the reported figures on sales and stocks. New orders are derived from estimates of receipts andreported figures on outstanding orders.
Semiannual and annual data on receipts and new orders cannot be derived directly from the monthlyaverages of sales, stocks, and outstanding orders.
Source: Board of Governors of the Federal Reserve System.
247
Digitized for FRASER http://fraser.stlouisfed.org/ Federal Reserve Bank of St. Louis
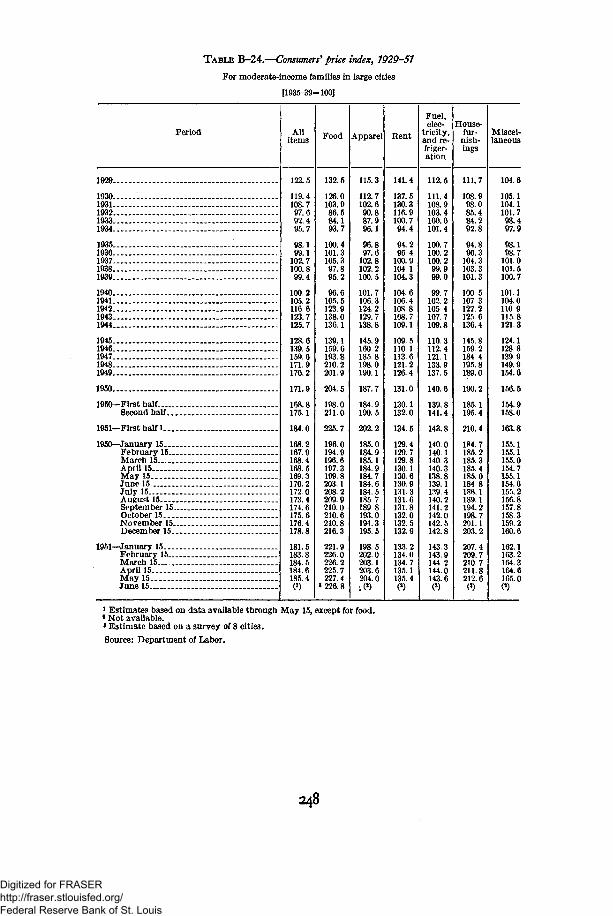
TABLE B-24.—Consumers* price index, 1929-51
For moderate-income families in large cities
[1935-39=100]
Period
1929 . _
1930 . . .193119321933 . .1934 _ _
19351936193719381939 . . . . . _
1940 „- —19411942 -.19431944 - -
194519461947 - -19481949 .- .
1950
1950— First halfSecond half
1951— First half 1 _
1950 — January 15 .February 15March 15...April 15May 15June 15July 15August 15 . _September 15October 15November 15December 15
1951 — January 15. _ . ._February 15March 15April 15May 15June 15 .
Allitems
122 5
119 4108.797 692 495.7
98 199 1
102 7100 899 4
100 2105 2116 6123 7125 7
128 6139 5159 6171.9170 2
171 9
168 8175.1
184.0
168 2167 9168.4168 5169 3170.2172 0173 4174 6175.6176 4178.8
181.5183 8184.5184.6185 4(2)
Food
132.5
126 0103.986 584 193.7
100 4101 3105 397 895 2
96 6105 5123 9138 0136 1
139 1159 6193 8210.2201 9
204 5
198 0211.0
225.7
196 0194 9196. 6197 3199 8203.1208.2209 9210 0210.6210.8216.3
221.9226 0226.2225 7227 4
3 226. 8
Apparel
115 3
112 7102.690 887 996.1
96 897 6
102 8102 2100 5
101 7106 3124 2129 7138 8
145 9160 2185 8198 0190 1
187 7
184 9190.5
202.2
185 0184 9185.1184 9184 7184.6184 5185 7189 8193. 0194 3195.5
198 5202 0203 1203 6204 01 (a)
Rent
141.4
137.5130.3116 9100 794.4
94 296 4
100 9104 1104 3
104.6106 4108 8108 7109.1
109 5110 1113 6121.2126 4
131 0
130 1132.0
134.5
129 4129 7129.8130 1130 6130.9131.3131.6131 8132.0132.5132.9
133. 2134 0134.7135 1135 4(2)
Fuel,elec-
tricity,and re-friger-ation
112 5
111 4108.9103 4100 0101.4
100 7100 2100 299 999 0
99 7102 2105 4107 7109 8
110 3112 4121 1133 9137 5
140 6
139 8141.4
143.8
140 0140 1140 3140 3138 8139.1139 4140 2141 2142 0142 5142.8
143 3143 9144 2144 0143 6(2)
House-fur-
nish-ings
111.7
108 998.085 484 292.8
94 896 3
104 3103 3101 3
100 5107 3122 2125 6136 4
145 8159 2184 4195. 8189 0
190 2
185 1195.4
210.4
184 7185 2185.3185 4185 0184 8186 1189 1194 2198 7201 1203.2
207 4209 7210 7211 8212 6
(2)
Miscel-laneous
104.6
105.1104.1101 798 497.9
98 198 7
101.0101 5100.7
101 1104 0110 9115 8121 3
124.1128 8139 9149.9154 6
156 5
154 9158.0
163.8
155 1155. 1155.0154 7155 1154.6155. 2156.8157 8158 3159 2160.6
162.1163 2164.3164.6165 0(2)
i Estimates based on data available through May 15, except for food.8 Not available.1 Estimate based on a survey of 8 cities.
Source: Department of Labor.
248
Digitized for FRASER http://fraser.stlouisfed.org/ Federal Reserve Bank of St. Louis
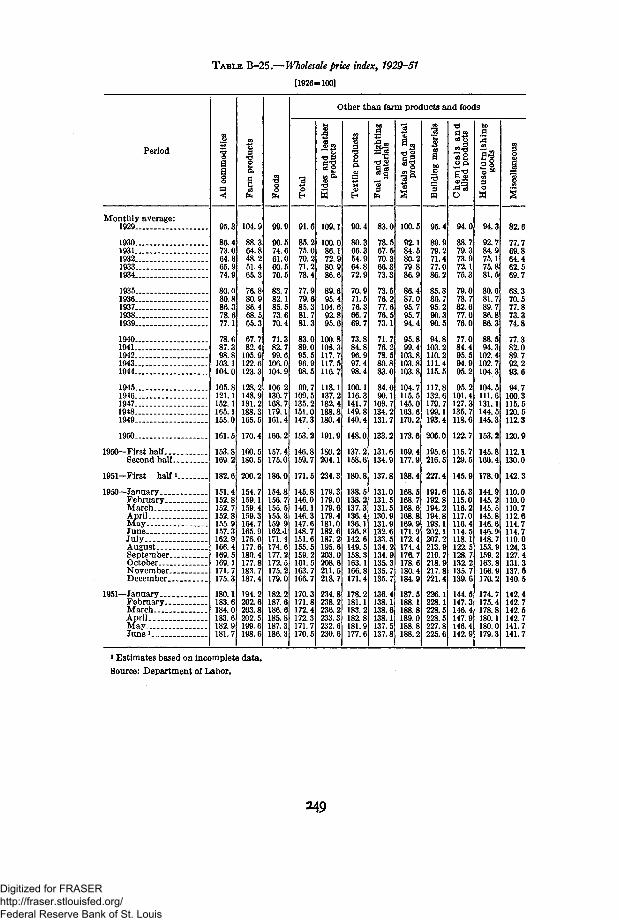
TABLE #-25.—Wholesale price index, 1929-51
[1926=100]
Period
Monthly average:1929 . .
1930193119321933 . .1934
19351936193719381939
1940.—1941194219431944 . .
19451946194719481949
1950
1950— First halfSecond half
1951— First half1
1950 — January „FebruaryMarchApril .MayJuneJulyAugust _SeptemberOctoberNovemberDecember
1951 — January ..February.. . ..MarchApril. .May.June * _
All
com
mod
itie
s95.3
86.473.064 865.974.9
80.080 886.378.677.1
78.687.398.8
103 1104.0
105.8121.1152.1165.1155.0
161.5
153.8169 2
182.6
151.4152.8152.7152 8155 9157 3162 9166.4169.5169.1171.7175 3
180.1183.6184.0183.6182.9181.7
1
&
104.9
88.364.848.251.465.3
76.880 986.468.565 3
67.7Of) A
105.9122 6123.3
128.2148.9181.2188.3165.5
170.4
160.5180 5
200.2
154.7159 1159. 4159. 3164 7165 9176 0177 6180 4177.8183.7187 4
194.2202.6203 8202.5199.6198.6
&
99.9
90.574.661.060.570.5
83.782. 185.573.670 4
71.382.799.6
106.0104.9
106 2130.7168.7179.1161.4
166.2
157.4175.0
186.0
154.8156.7155. 5155.3159 9162.4171 4174.6177.2172.5175.2179 0
182.2187.6186 6185.8187.3186.3
3e91.6
85.275.070 271.278.4
77.979 685.381.781.3
83.089 095.596.998.5
99.7109.5135.2151.0147.3
153.2
146.8159.7
171.5
145.8146.0146.1146 3147 6148 7151 6155.5159 2161.5163.7166 7
170.3171.8172 4172 3171.7170.5
0
Jh•e sC'O* £o<
B
109.1
100.086.172 980.986.6
89.695 4
104.692.895.6
100.8108.3117.7117.5116.7
118.1137.2182.4188.8180.4
191.9
180.2204 1
234.3
179.3179.0179.6179.4181 0182 6187 2195.6203 0208.6211.5218 7
234.8238 2236 2233.3232.6230.6
ther tl
1
He90.4
80.366.354.964.872.9
70.971.576.366.769.7
73.884.896.997.498.4
100.1116.3141.7149.8140.4
148.0
137.2158.6
180.8
138.5138.2137.3136.4136 1136 fl142 6149.5158 3163.1166.8171 4
178.2181. 1183 2182 8181.9177 6
ian far
1If•2-S9|"3S3
PM
83.0
78.567.570.366.373.3
73.576 277.676.573.1
71.776.278.580.883.0
84.090.1
108.7134.2131.7
133.2
131. 6134 9
137.8
131.0131.5131.5130.9131 9132 6133 5134 2134 9135.3135.7135 7
136.4138. 1138 6138.1137.5137.8
mproc
3*%11•2 ft
«
100.5
92.184.580.279.886.9
86.487.095.795.794.4
95.899.4
103.8103.8103.8
104.7115.5145.0163.6170.2
173.6
169.4177.9
188.4
168.5168 7168.6168.8169 9171 9172 4174 4176 7178.6180 4184.9
187.5188 1188 8189 0188.8188.2
Lucts aj
Bui
ldin
g m
ater
ials
95.4
89.979.271.477.086.2
85.386.795.290.390 5
94.8103.2110.2111.4115.5
117.8132.6179.7199.1193.4
206.0
195.6216.5
227.4
191.6192.8194.2194.8198 1202 1207 2213.9219 7218.9217 8221 4
226.1228.1228 5228 5227.8225.6
ad fooc
Ch
em
ica
ls
an
dal
lied
prod
ucts
94.0
88.779.373.972.175.3
79.078.782.677.076.0
77.084.495.594.995.2
95.2101.4127.3135.7118.6
122.7
115.7129.5
145.9
115.3115.0116.2117.0116 4114 5118 1122.5128 7132.2135.7139 6
144.5147.3146 4147.9146.4142.9
Is
Ho
use
furn
ish
ing
good
s
94.3
92.784.975 175.881.5
80.681 789.786.886 3
88.594.3
102.4102 7104.3
104.5111.6131.1144.5145.3
153.2
145.8160.4
178.0
144.9145.2145.5145.8146 6146 9148 7153.9lf>9 2163. 8166 9170 2
174.7175.4178 8180 1180.0179.3
Mis
cella
neou
s
82.6
77 769.864 462 569.7
68.370 577 873.374 8
77.382 089.792 293.6
94 7100 3115.5120 5112.3
120.9
112.1130 0
142.3
110.0110 0110.7112 6114 7114 7119 0124 3127 4131.3137 6140 5
142.4142 7142 5142 7141.7141.7
i Estimates based on incomplete data.Source: Department of Labor.
249
Digitized for FRASER http://fraser.stlouisfed.org/ Federal Reserve Bank of St. Louis

TABLE B-26.—Indexes of prices received and prices paid by farmers, and parity ratio, 1929-51
[1910-14=100]
Period Pricesreceived
Prices paid(including in-terest, taxes,
and wagerates)
Parityratio *
Monthly average:1929 -
1930.193119321933 -1934
1935,..1936.-193719381939 —
19401941 __1942.19431944
194519461947 —19481949.....
1950
1950—First halfSecond half
1951—First half
1950—January 15February 15 _ _March 15April 15May 15..June 15July 15Aujrust 15September 15.October 15November 15_December 15. .
1951—January 15February 15 _ _March 15April 15May 15 _.June 15 _-
148
12587657090
1091141229795
100123158
21922196
22062234
275285249
256
241272
306
235237237241247247263267272268276286
300313311309305301
160
151130112109120
124124131124122
124132151170182
189207239259250
255
250260
280
248248250250253254256257260261263265
272276280283283283
67586475
937877
8193105113108
109113115110100
100
96105
110
959695
97103104105103105108
110113111109108106
i Ratio of prices received to prices paid (including interest, taxes, and wage rates).a Includes subsidy payments between October 1943 and June 1946.
Source: Department of Agriculture.
250
Digitized for FRASER http://fraser.stlouisfed.org/ Federal Reserve Bank of St. Louis
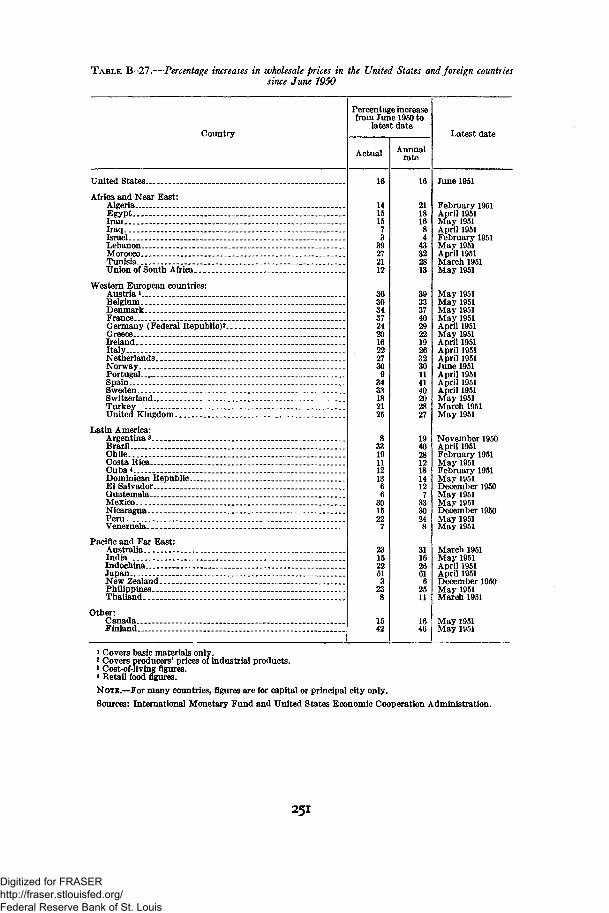
TABLE B-27.—Percentage increases in wholesale prices in the United States and foreign countriessince June 1950
Country
Percentage increasefrom June 1950 to
latest date
Actual Annualrate
Latest date
United States
Africa and Near East:AlgeriaEgyptIranIraq __IsraelLebanon _Morocco _TunisiaUnion of South Africa
Western European countries:Austria 1 _BelgiumDenmarkFranceGermany (Federal Republic)*..Greece _IrelandItaly.. _NetherlandsNorwayPortugal. _Spain.Sweden _Switzerland- __.TurkeyUnited Kingdom
Latin America:Argentina *BrazilChileCosta Rica __ _Cuba < _ _ _Dominican RepublicEl SalvadorGuatemalaMexico _ _ _ _ _NicaraguaPeru _ _ ._Venezuela. _ _ _
Pacific and Far East:AustraliaIndia..__ _Indochina.Japan.New ZealandPhilippinesThailand _
Other:CanadaFinland
16 16
61
June 1951
February 1951April 1951May 1951April 1951February 1951May 1951April 1951March 1951May 1951
May 1951May 1951May 1951May 1951April 1951May 1951April 1951April 1951April 1951June 1951April 1951April 1951April 1951May 1951March 1951May 1951
November 1950April 1951February 1951May 1951February 1951May 1951December 1950May 1951May 1951December 1950May 1951May 1951
March 1951May 1951April 1951April 1951December 1950May 1951March 1951
May 1951May 1951
1 Covers basic materials only.2 Covers producers' prices of industrial products.* Cost-of-living figures.«Retail food figures.NOTE.—-For many countries, figures are for capital or principal city only.Sources: International Monetary Fund and United States Economic Cooperation Administration.
251
Digitized for FRASER http://fraser.stlouisfed.org/ Federal Reserve Bank of St. Louis
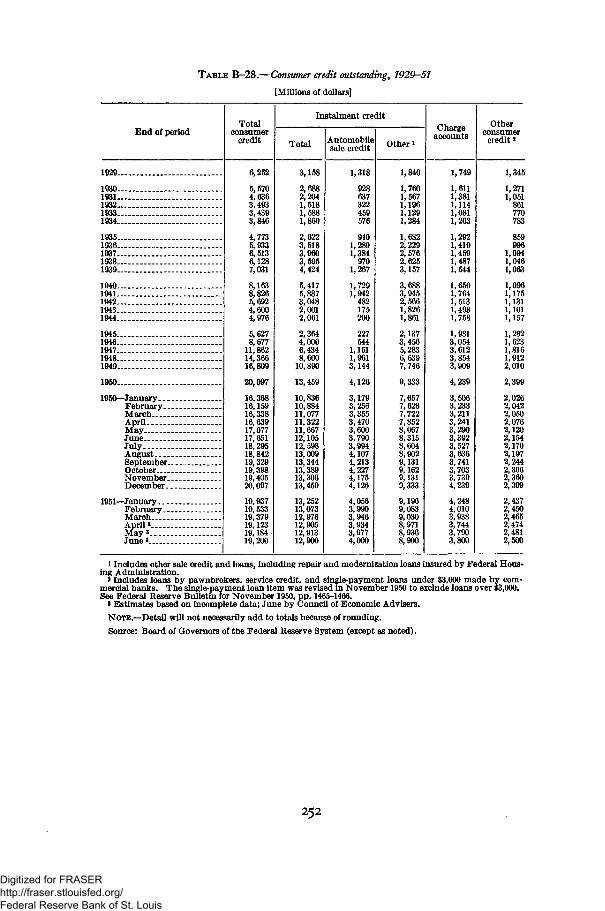
TABLE B-28.—Consumer credit outstanding, 1929-51
[Millions of dollars]
End of period
1929 ..
1930 -193119321933 .1934 — .
1935 .1936—193719381939. .
1940194119421943. .1944
1945...1946194719481949
1950
1950 — JanuaryFebruaryMarchAprilMayJuneJulyAugustSeptember.OctoberNovemberDecember ._ _ __
1951 — JanuaryFebruary ._MarchApril *May 3June 3
Totalconsumer
credit
6,252
5,5704,6363,4933,4393,846
4,7735,9336, 5136,1287,031
8,1638,8265,6924,6004,976
5,6278,677
11,86214,36616,809
20,097
16,36816, 15916,33816,63917,07717,65118,29518, 84219,32919, 39819, 40520,097
19, 93719, 53319,37919,12319, 18419,200
Instalment credit
Total
3,158
2,6882,2041, 5181,5881,860
2,6223,5183,9603,5954,424
5,4175,8873,0482,0012,061
2,3644,0006,4348,600
10,890
13,459
10,83610,88411, 07711, 32211,66712, 10512, 59813,00913, 34413,38913, 30613,459
13, 25213,07312,97612,90512, 91312,900
Automobilesale credit
1,318
928637322459576
9401,2891,384
9701,267
1,7291,942
482175200
227544
1,1511,9613,144
4,126
3,1793,2563,3553,4703,6003,7903,9944,1074,2134,2274,1754,126
4,0563,9903,9463,9343,9774,000
Other »
1,840
1,7601,5671,1961,1291,284
1,6822,2292,5762,6253,157
3,6883,9452,5661,8261,861
2, 1373,4565,2836,6397,746
9,333
7,6577,6287,7227,8528,0678,3158,6048,9029,1319,1629,1319,333
9,1969,0839,0308,9718,9368,900
Chargeaccounts
1,749
1,6111,3811,1141,0811,203
1,2921,4191,4591,4871,544
1,6501,7641,5131,4981,758
1,9813,0543,6123,8543,909
4,239
3,5063,2333,2113,2413,2903,3923,5273,6363,7413,7033,7394,239
4,2484,0103,9383,7443,7903,800
Otherconsumer
credit 2
1,345
1,2711,051
861770783
859996
1,0941,0461,063
1,0961,1751,1311,1011,157
1,2821,6231,8161,9122,010
2,399
2,0262,0422,0502,0762,1202,1542,1702,1972,2442,3062,3602,399
2,4372,4502,4652,4742,4812,500
i Includes other sale credit and loans, including repair and modernization loans insured by Federal Hous-ing Administration.
* Includes loans by pawnbrokers, service credit, and single-payment loans under $3,000 made by com-mercial banks. The single-payment loan item was revised in November 1950 to exclude loans over $3,000.See Federal Reserve Bulletin for November 1950, pp. 1465-1466.
* Estimates based on incomplete data; June by Council of Economic Advisers.
NOTE.—Detail will not necessarily add to totals because of rounding.
Source: Board of Governors of the Federal Reserve System (except as noted).
252
Digitized for FRASER http://fraser.stlouisfed.org/ Federal Reserve Bank of St. Louis
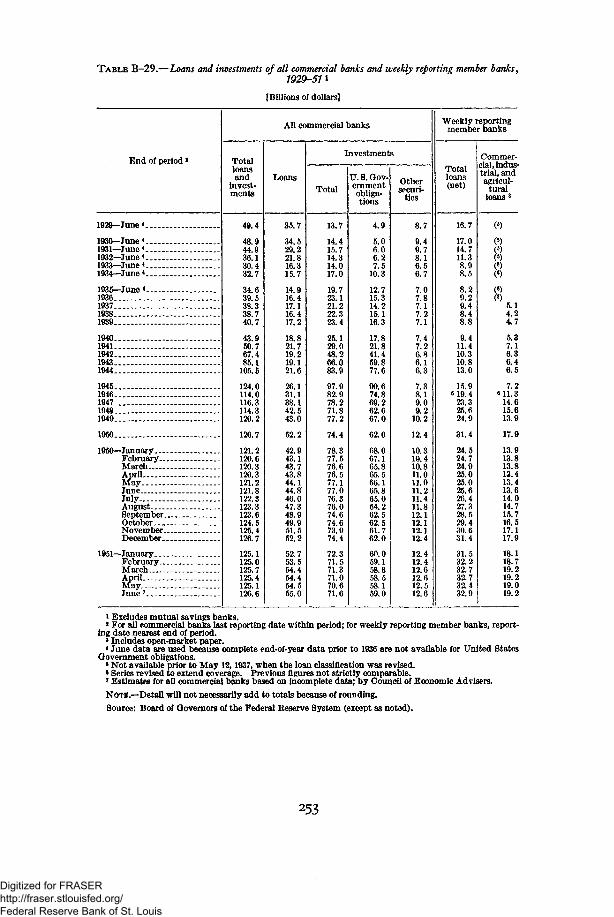
TABLE B-29.—Loans and investments of all commercial banks and weekly reporting member banks,1929-51*
[Billions of dollars]
End of period s
1929— June4
1930— June* _1931— June*1932— June *1933— June* _1934— June *
1935_june *1936193719381939
194019411942 -19431944
194519461947194g1949
1950
1950 — January _ _ .FebruaryMarch _. _.April -May _ _JuneJuly . .AugustSeptember _ .OctoberNovember _December. _
1951 — JanuaryFebruary . . ._MarchApril ..MayJune *_„, , -.,_, _ _
All commercial banks
Totalloansand
invest-ments
49.4
48.944.936.130.432.7
34.639.538.338.740.7
43.950.767.485.1
105.5
124.0114.0116.3114.3120.2
126.7
121.2120.6120.3120.3121.2121.8122.3123.3123.6124.5125.4126.7
125.1125.0125.7125.4125.1126.6
Loans
35.7
34.529.221.816.315.7
14.916.417.116.417.2
18.821.719.219.121.6
26.131.138.142.543.0
52.2
42.943.143.743.844.144.8'46.047.348.949.951.552.2
52.753.554.454.454.555.0
Investments
Total
13.7
14.415.714.314.017.0
19.723.121.222.323.4
25.129.048.266.083.9
97.982.978.271.877.2
74.4
78.377.576.676.577.177.076.376.074.674.673.974.4
72.371.571.371.070.671.6
U. 8. Gov-ernmentobliga-tions
4.9
5.06.06.27.5
10.3
12.715.314.215.116.3
17.821.841.459.877.6
90.674.869.262.667.0
62.0
68.067.165.865.566.165.865.064.262.562.561.762.0
60.059.158.858.558.159.0
Othersecuri-
ties
8.7
9.49.78.16.56.7
7.07.87.17.27.1
7.47.26.86.16.3
7.38.19.09.2
10.2
12.4
10.310.410.811.011.011.211.411.812.112.112.112.4
12.412.412.612.612.512.6
Weekly reportingmember banks
Totalloans(net)
16.7
17.014.711.38.98.5
8.29.29.48.48.8
9.411.410.310.813.0
15.9819.4
23.325.624.9
31.4
24.524.724.925.025.025.626.427.328.529.430.631.4
31.532.232.732.732.432.9
Commer-cial, indus-trial, andagricul-
turalloans 3
(5)
(»)(8)(8)(6)(8)
(«)(«)
5.14.24,7
5.37.16.36.46.5
7.2« 11.3
14,615.613.9
17.9
13.913.813.813.413.413.614.014.715.716.517.117.9
18.118.719.219.219.019.2
i Excludes mutual savings banks.* For all commercial banks last reporting date within period; for weekly reporting member banks, report-
ing date nearest end of period.• Includes open-market paper.4 June data are used because complete end-of-year data prior to 1936 are not available for United States
Government obligations.* Not available prior to May 12,1937, when the loan classification was revised.• Series revised to extend coverage. Previous figures not strictly comparable.f Estimates for all commercial banks based on incomplete data; by Council of Economic Advisers.NOTE.—Detail will not necessarily add to totals because of rounding.Source: Board of Governors of the Federal Reserve System (except as noted).
253
Digitized for FRASER http://fraser.stlouisfed.org/ Federal Reserve Bank of St. Louis

TABLE B-30.—Deposits and currency, 1929-51
[Millions of dollars]
End of period >
1929
1930193119321933—1934
1935193619371938 _1939
1940194119421943—1944
19451946194719481949
1950
1950— JanuaryFebruaryMarchAprilMayJune, .,. , ,JulyAugustSeptemberOctoberNovemberDecember . .
1951 — JanuaryFebruaryMarchAprilMayJune V . „.. , ~ - , . , -
Total de-posits andcurrency
54,742
53,57248,37945,37042, 55148,106
52, 72657, 59556, 78159,87864,733
71,12979, 098
100,500123, 391151, 428
176,378167, 500172, 330172, 693173, 851
180, 574
173, 600172, 800172, 400172, 500173,000174, 715174, 400175, 500176, 400176, 300177, 400180, 574
178, 800178, 900179,900179,800179, 100180,900
U. S. Gov-ernmentdeposits/
187
324518516
1,0191,836
1,4531,235
9661,8121,480
1,1212,7629,201
11,00321, 203
25, 5853,4962,3223,5744,070
3,657
3,9004,6005,3004,1003,8004,7514,1004,5004,8003,5003,5003,657
3,6004,7007,4006,5005,4006,500
Deposits adjusted and currency (privately heldmoney supply) *
Total
54, 555
53,24847,86144,85441,53246,270
51, 27356,36055, 81558,06663,253
70,00876, 33691,299
112, 388130,225
150,793164,004170,008169, 119169, 781
176, 917
169, 700168,200167, 100168,400169, 200169, 964170, 200171,000171, 600172, 800173, 900176, 917
175, 200174, 200172, 500173,300173, 700174, 400
Currencyoutsidebanks
3,557
3,6054,4704,6694.7824,655
4,9175,5165,6385,7756,401
7,3259,615
13,94618,83723,505
26,49026, 73026, 47626,07925, 415
25, 398
24, 50024, 70024,60024,60024, 70025, 18524,40024, 50024,50024,60024,90025,398
24,60024,60024,40024,60024,90025,000
Adjusteddemanddeposits *
22,809
20,96717, 41215,72815, 03518, 459
22. 11525; 48323,95925,98629,793
34,94538,99248, 92260, 80366,930
75, 85183,31487, 12185,52085,750
92, 272
86, 40084,50083,20084,30085,00085,04086,50087, 40088,00089,20090,30092, 272
91,60090,60089, 00089, 50089, 50089,900
Timedeposits '
28, 189
28,67625,97924,45721, 71523,156
24, 24125, 36126, 21826, 30527,059
27, 73827,72928,43132, 74839,790
48, 45253,96056, 41157,52058, 616
59, 247
58,70059,00059, 30059, 50059, 50059, 73959,40059, 10059,00059, 00058,70059, 247
59,00059,00059, 10059,20059, 30059,500
1 Last reporting date during the period.* Includes United States Government deposits at Federal Reserve Banks and commercial and savings
banks, and, beginning with 1938, includes United States Treasurer's time deposits, open account.«Includes deposits and currency held by State and local governments.4 Includes demand deposits, other than interbank and United States Government, less cash items in
process of collection.'«Includes deposits in commercial banks, mutual savings banks, and Postal Savings System, but excludes
interbank deposits.«Estimates based on incomplete data; by Council of Economic Advisers.NOTE.—Detail will not necessarily add to totals because of rounding.Source: Board of Governors of the Federal Reserve System (except as noted).
254
Digitized for FRASER http://fraser.stlouisfed.org/ Federal Reserve Bank of St. Louis
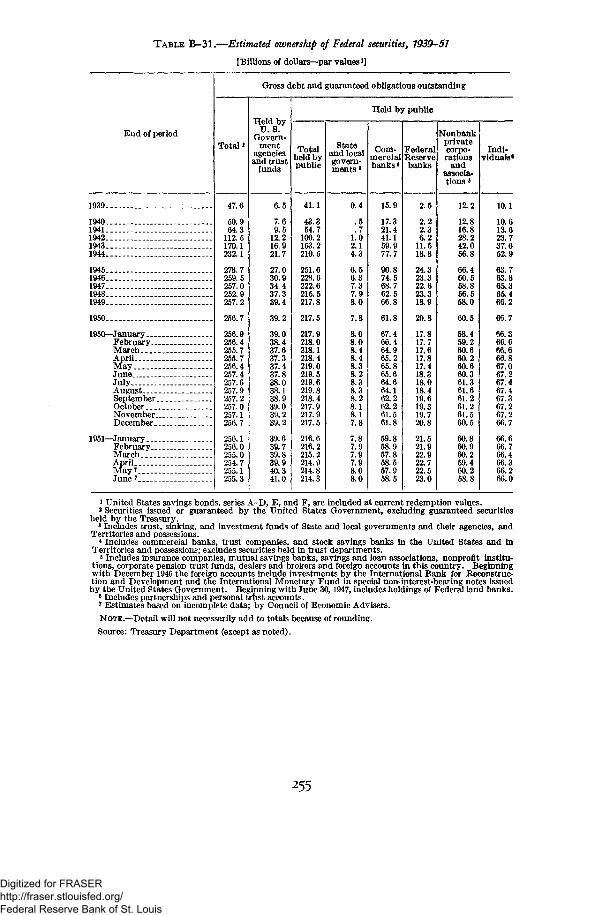
TABLE B-31.—Estimated ownership of Federal securities, 1939-51
[Billions of dollars—par values1]
End of period
1939 .
19401941194219431944
19451946194719481949
1950
1950 — January.. _ _FebruaryMarch . .AprilMayJune. _ _ _ _ ._JulyAugustSeptemberOctoberNovember . _ _December.-
1951 — JanuaryFebruaryMarchAprilMay? _June 7
Gross debt and guaranteed obligations outstanding
Total*
47.6
50.964.3
112.5170.1232.1
278.7259.5257.0252.9257.2
256.7
256.9256.4255.7255.7256.4257.4257. 6257.9257.2257.0257.1256.7
256.1256.0255.0254.7255.1255.3
Held byU.S.
Govern-ment
agenciesand trust
funds
6.5
7.69.5
12.216.921.7
27.030.934.437.339.4
39.2
39.038.437.637.337.437.838.038.138.939.039.239.2
39.639.739.839.940.341.0
Held by public
Totalheld bypublic
41.1
43.354.7
100.2153.2210.5
251.6228.6222.6215.5217.8
217.5
217.9218.0218.1218.4219.0219.5219.6219.8218.4217.9217.9217.5
216.6216.2215.2214.9214.8214.3
Stateand localgovern-ments 8
0.4
.5
.71.02.14.3
6.56.37.37.98.0
7.8
8.08.08.48.48.38.28.38.38.28.18.17.8
7.87.97.97.98.08.0
Com-mercialbanks4
15.9
17.321.441.159.977.7
90.874.568.762.566.8
61.8
67.466.464.965.265.865.664.664.162.262.261.561.8
59.858.957.858.557.958.5
FederalReservebanks
2.5
2.22.36.2
11.518.8
24.323.322.623.318.9
20.8
17.817.717.617.817.418.318.018.419.619.319.720.8
21.521.922.922.722.523.0
Nonbankprivatecorpo-rations
andassocia-tions «
12.2
12.816.828.242.056.8
66.460.568.856.558.0
60.5
58.459.260.660.260.660.361.361.661.261.261.560.5
60.860.960.259.460.258.8
Indi-viduals6
10.1
10.613.623.737.652.9
63.763.865.365.466.2
66.7
66.366.666. 666.867.067.267.467.467.367.267.266.7
66.666.766.466.366.266.0
1 United States savings bonds, series A-D, E, and F, are included at current redemption values.2 Securities issued or guaranteed by the United States Government, excluding guaranteed securities
held by the Treasury.3 Includes trust, sinking, and investment funds of State and local governments and their agencies, andTerritories and possessions.
< Includes commercial banks, trust companies, and stock savings banks in the United States and inTerritories and possessions; excludes securities held in trust departments.
6 Includes insurance companies, mutual savings banks, savings and loan associations, nonprofit institu-tions, corporate pension trust funds, dealers and brokers and foreign accounts in this country. Beginningwith December 1946 the foreign accounts include investments by the International Bank for Reconstruc-tion and Development and the International Monetary Fund hi special non-interest-bearing notes issuedby the United States Government. Beginning with June 30,1947, includes holdings of Federal land banks.
6 Includes partnerships and personal trust accounts.f Estimates based on incomplete data; by Council of Economic Advisers.NOTE.—Detail will not necessarily add to totals because of rounding.Source: Treasury Department (except as noted).
255
Digitized for FRASER http://fraser.stlouisfed.org/ Federal Reserve Bank of St. Louis

TABLE B-32.—United States Government debt—volume and kind of securities, 1929-51
[Billions of dollars]
End of period
1929
19301931193219331934
193519361937 —19381939
19401941194219431944.
194519461947 _1948-1949
1950
1950 — January _ _ .FebruaryMarchAprilMayJune .. _July _ .AugustSeptemberOctoberNovemberDecember
1951 — January _FebruaryMarchApril . . . .MayJune _
Grosspublic
debt andguaran-
teedissues i
16.3
16.017.820.824.031.5
35.139.141.944.447.6
50.964.3
112.5170.1232.1
278.7259.5257.0252.9257.2
256.7
256.9256.4255.7255.7256.4257.4257.6257.9257.2257.0257.1256.7
256.1256.0255.0254.7255. 1255.3
Interest-bearing public debt
Marketable publicissues
Short-term
issues'
3.3
2.92.85.97.5
11.1
14.212.512.59.87.7
7.58.0
27.047.169.9
78.257.147.745.950.2
58.3
49.949.851.551.652.052.452.252.256.956.055.958.3
57.457.457.457.457.458.9
Treasurybonds
11.3
11.313.513.414.715.4
14.319.520.524.026.9
28.033.449.367.991.6
120.4119.3117.9111.4104.8
94.0
104.8104.8102.8102.8102.8102.8102.8102.896.796.796.794.0
94.094.094.080.580.578.8
Nonmarketablepublic issues
UnitedStates
savingsbonds
0.2.5
1.01.42.2
3.26.1
15.027.440.4
48.249.852.155.156.7
58.0
57.057.257.357.457.5
' 57.557.657.557.458.058.058.0
58.057.857.857.757.657.6
Treas-ury
tax andsavings
notes
2.56.48.69.8
8.25.75.44.67.6
8.6
7.98.08.08.18.38.58.68.98.99.08.98.6
8.78.78.38.18.27.8
Specialissues 3
0.6
.8
.4
.4
.4
.6
.7
.62.23.24.2
5.47.09.0
12.716.3
20.024.629.031.733.9
33.7
33.532.932.131.881.932.432.532.733.433.533.733.7
34.033.933.533.634.034.7
Nonin-terest
bearingdebt
0.3
.3
.3
.4
.4
.5
1.0.7.6.5.6
.6
.5
.91.41.8
2.41.52.72.22.1
2.4
2.02.02.22.22.22.22.12.12.22.22.22.4
2.42.62.42.42.42.4
Fullyguar-
anteedsecuri-
ties
0.23.1
4.54.74.65.05.7
5.96.34.34.21.5
.6
.3
.1
.1(*)
(<)
(<)(<)<)
?34)3*)«)
(4)8(*)
8i Total includes Postal Savings bonds, depositary bonds. Armed Forces leave bonds, and Treasury
investment bonds, not shown separately.* Includes Treasury bills, certificates of indebtedness, and Treasury notes.3 Issued to United States investment accounts; these accounts also held 6.3 billion dollars of public market-
able and nonmarketable issues on June 30,1951.* Less than 50 million dollars.Source: Treasury Department.
256
Digitized for FRASER http://fraser.stlouisfed.org/ Federal Reserve Bank of St. Louis

TABLE B-33.—Bond yields and interest rates, selected years, 1929-51
[Percent per annum]
Period
Average:19291933193519371939
19411943
1945194619471948 . ...1949
I960
1950 — First quarterSecond quarterThird quarterFourth quarter
1951 — First quarterSecond quarter
United States Governmentsecurity yields— New York
3-monthTreas-ury
bills i
(3)0.515.137.447.023
.103
.373
.375
.375
.5941.0401.102
1.218
1.118.166.233.353
.400
.532
9-12monthissues 2
(4)(4)(«)(«)(*)
(4)0.75
.81
.82
.881.141.14
1.26
1.141.191.271.44
1.671.84
Taxablebonds
15 yearsand over
(8)(5)0)
8(«)2.47
2.372.192.252.442.31
2.32
2.242.312.342.38
2.422.61
CorporateAaa
bonds(Moody's)
4.734.493.603.263.01
2.772.73
2.622.532.612.822.66
2.62
2.582.612.632.67
2.702.90
Averageof ratescharged
by bankson short-
termloans-selectedcities
(')(6)(6)(6)2.1
2.02.6
2.22.12.12.52.7
2.7
2.602.682.632.84
3.023.07
Primecommer-
cialpaper,
months-NewYork
5.851.73.76.94.59
.54
.69
.75
.811.031.441.48
1.45
1.311.311.471.71
1.962.20
Bankersaccept-ances.
90days-NewYork
5.03.63.13.43.44
.44
.44
.44
.61
.871.111.12
1.15
1.061.061.181.31
1.511.63
FederalReserveBank
discountrate —NewYork
5.162.561.501.331.00
1.00U.OO
n.oo'1.00
1.001.341.50
1.59
1.50.60.61.75
.75
.75
i Rate on new issues within period.3 Includes certificates of indebtedness, when outstanding in proper maturity range, and selected note and
bond issues.3 Treasury bills were first issued in December 1929.< Not available before August 1942.«Taxable bonds in this classification were first issued in March 1941.« Not available on same basis.7 From October 30,1942, to April 24, 1946, a preferential rate of 0.50 percent was in effect for advances
secured by Government securities maturing or callable hi one year or less.Sources: Treasury Department, Moody's Investors Service, and Board of Governors of the Federal
Reserve System.
257
Digitized for FRASER http://fraser.stlouisfed.org/ Federal Reserve Bank of St. Louis
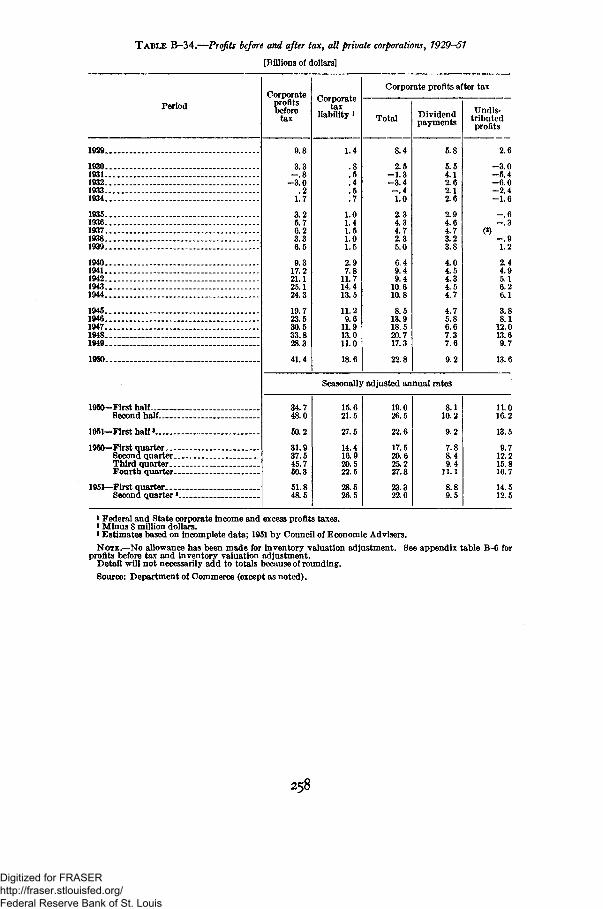
TABLE B-34.—Profits before and after tax, all private corporations, 1929-51
[Billions of dollars]
Period
1929
19301931 . . -193219331934
19351936193719381939
19401941194219431944
19451946194719481949
1950
I960— First half ..Second half
1951— First half » . - -
1950 — First quarter _Second quarter . -_Third quarterFourth quarter
1951— First quarterSecond quarter *
Corporateprofitsbefore
tax
9.8
3.3-.8
-3.0.2
1.7
3.25.76.23.36.5
9.317.221.125.124.3
19.723.630.533.828.3
41.4
Corporatetax
liability 1
1.4
.8
.5
.4
.5
.7
1.01.41.51.01.5
2.97.8
11.714.413.5
11.29.6
11.913.011.0
18.6
Corporate profits after tax
Total
8.4
2.5-1.3-3.4-.41.0
2.34.34.72.35.0
6.49.49.4
10.610.8
8.513.918.520.717.3
22.8
Dividendpayments
5.8
5.54.12.62.12.6
2.94.64.73.23.8
4.04.54.34.54.7
4.75.86.67.37.6
9.2
Undis-tributedprofits
2.6
-3.0-5.4-6.0-2.4-1.6
-.6-.3
W -.91.2
2.44.95.16.26.1
3.88.1
12.013.69.7
13.6
Seasonally adjusted annual rates
34.748.0
50.2
31.937.545.750.3
51.848.6
15.621.5
27.5
14.416.920.522.5
28.526.5
19.026.5
22.6
17.520.625.227.8
23.322.0
8.110.2
9.2
7.88.49.4
11.1
8.89.5
11.016.2
13.5
9.712.215.816.7
14.512.5
i Federal and State corporate income and excess profits taxes.» Minus 8 million dollars.' Estimates based on incomplete data; 1951 by Council of Economic Advisers.NOTE.—No allowance has been made for inventory valuation adjustment. See appendix table B-6 for
profits before tax and inventory valuation adjustment.Detail will not necessarily add to totals because of rounding.Source: Department of Commerce (except as noted).
258
Digitized for FRASER http://fraser.stlouisfed.org/ Federal Reserve Bank of St. Louis

TABLE B—35.—Sales and prof ts of large manufacturing corporations, 1939—51
[Millions of dollars]
Period
1939
19401941194219431944 ..
1945—19461947 ..1948 _1949
1950
1950— First halfSecond half
1950 — First quarterSecond quarterThird quarter. _Fourth quarter
1951 — First quarter 2
Durable goods industries(106 corporations) »
Sales
6,748
8,75012,80615, 36220,63322,085
18, 16112, 38719, 50223, 59123,914
29, 240
Profits
Before taxes
734
1,2262,1752,3262, 3892,192
1,288607
2,3123,1073,192
5,191
After taxes
597
830982782755726
574295
1,3551,8361,888
2,540
Nondurable goods industries(94 corporations) *
Sales
3,843
4,2575,4856,4087,6078,263
8,3718,940
11, 31313, 36412,790
14,710
Profits
Before taxes
476
617980
1,0691,2931,339
1,1331,4261,7872,2081,843
2,701
After taxes
400
443538438506520
555968
1,1671,4741,211
1,510
Totals for period, not adjusted for seasonal variation
13, 20016, 039
6,0047,1967,8518,188
8,375
2,1363,055
8961,2401,4031,652
1,381
1,1871,353
494693777576
530
6,7048,005
3,2513,4533,9394,066
4,280
1,0851,615
504681782833
840
660850
307353468382
368
1 See Federal Reserve Bulletin, June 1949, and subsequent issues, for similar data for the following indus-try groups: primary metals and products, machinery, automobiles and equipment, foods and kindredproducts, chemicals and allied products, and petroleum refining.
2 Estimates based on incomplete data.
NOTE.—Detail will not necessarily add to totals because of rounding
Source: Compiled by the Board of Governors of the Federal Reserve System and based on publishedreports of various industrial corporations.
259
Digitized for FRASER http://fraser.stlouisfed.org/ Federal Reserve Bank of St. Louis
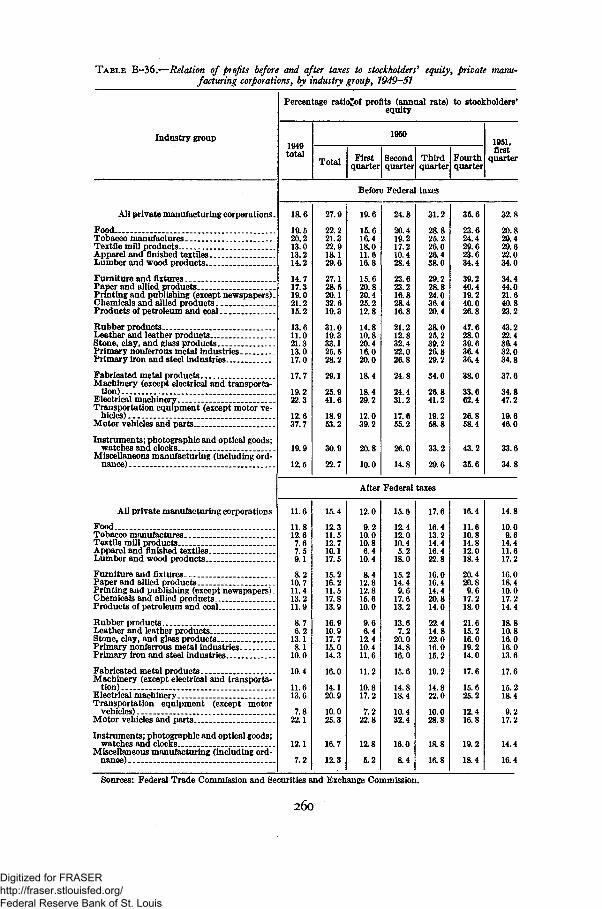
TABLE B-36.—Relation of profits before and after taxes to stockholders' equity, private manu-facturing corporations, by industry group, 1949-51
Industry group
All private manufacturing corporations .
Food... .Tobacco manufactures .Textile mill productsApparel and finished textilesLumber and wood products ..
Furniture and fixturesPaper and allied productsPrinting and publishing (except newspapers).Chemicals and allied productsProducts of petroleum and coal
Rubber products _Leather and leather productsStone, clay, and glass productsPrimary nonferrous metal industries-Primary iron and steel industries
Fabricated metal productsMachinery (except electrical and transporta-
tion) , _ _Electrical machineryTransportation equipment (except motor ve-
hicles)Motor vehicles and parts
Instruments; photographic and optical goods;watches and clocks
Miscellaneous manufacturing (including ord-nance) ._
All private manufacturing corporations-
FoodTobacco manufactures..Textile m ill productsApparel and finished textiles _Lumber and wood products.. . .
Furniture and fixturesPaper and allied products.. .Printing and publishing (except newspapers).Chemicals and allied productsProducts of petroleum and coal
Rubber products-Leather and leather products . .Stone, clay, and glass productsPrimary nonferrous metal industriesPrimary iron and steel industries
Fabricated metal products.Machinery (except electrical and transporta-
tion) ...Electrical machineryTransportation equipment (except motor
vehicles) .Motor vehicles and parts
Instruments; photographic and optical goods;watches and clocks ..
Miscellaneous manufacturing (including ord-nance)
Percentage ratio^of profits (annual rate) to stockholders'equity
1949total
1950
Total Firstquarter
Secondquarter
Thirdquarter
Fourthquarter
1951,first
quarter
Before Federal taxes
18.6
19.520.213.013.214.2
14.717.319.021.215.2
13.611.021.313.017.0
17.7
19.232.3
12.637.7
19.9
12.5
27.9
22.221.322.918.129.6
27.128.520.132.619.3
31.019.333.125.528.2
29.1
25.941.6
18.953.2
30.9
22.7
19.6
15.616.418.011.616.8
15.620.820.425.212.8
14.810.820.416.020.0
18.4
18.429.2
12.039.2
20.8
10.0
24.8
20.419.217.210.428.4
23.623.216.828.416.8
21.212.832.422.026.8
24.8
24.431.2
17.655.2
26.0
14.8
31.2
28.825. 226.026.438.0
29.228.824.036.420.4
38.025.239.226.829.2
34.0
26.841.2
19.258.8
33.2
29.6
35.6
23.624.429.623.634.4
39.240.419.240.026.8
47.628.039.636.436.4
38.0
33.662.4
26.858.4
43.2
35.6
32.8
20.820.429.622.034.0
34.444.021.640.823.2
43.222.436.432.034.8
37.6
34.847.2
19.646.0
33.6
34.8
After Federal taxes
11.6
11.812.67.67.59.1
8.210.711.413.211.9
8.76.2
13.18.1
10.0
10.4
11.613.6
7.822.1
12.1
7.2
15.4
12.311.512.710.117.5
15.216.211.517.813.9
16.910.917.715.014.3
16.0
14.120.9
10.025.3
16.7
12.3
12.0
9.210.010.86.4
10.4
8.412.812.815.610.0
9.66.4
12.410.411.6
11.2
10.817.2
7.222.8
12.8
5.2
15.6
12.412.010.45.2
18.0
15.214.49.6
17.613.2
13.67.2
20.014.816.0
15.6
14.818.4
10.432.4
16.0
8.4
17.6
16.413.214.416.422.8
16.016.414.420.814.0
22.414.822.016.015.2
19.2
14.822.0
10.028.8
18.8
16.8
16.4
11.610.814.812.018.4
20.420.89.6
17.218.0
21.615.216.019.214.0
17.6
15.625.2
12.416.8
19.2
18.4
14.8
10.09.6
14.411.617.2
16.018.410.017.214.4
18.810.816.016.013.6
17.6
15.218.4
9.217.2
14.4
16.4
Sources: Federal Trade Commission and Securities and Exchange Commission.
260
Digitized for FRASER http://fraser.stlouisfed.org/ Federal Reserve Bank of St. Louis
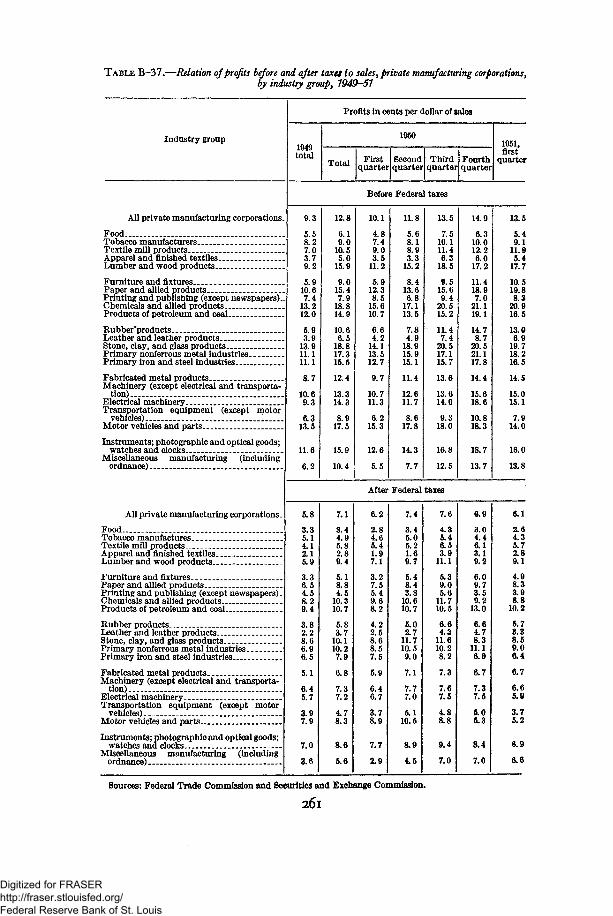
TABLE B-37.—Relation of profits before and after taxe$ to sales, private manufacturing corporations,by industry group, 1949-51
Industry group
All private manufacturing corporations.
FoodTobacco manufacturers _ _Textile mill productsApparel and finished textilesLumber and wood products
Furniture and fixtures _Paper and allied productsPrinting and publishing (except newspapers).Chemicals and allied productsProducts of petroleum and coal
Rubber'products _Leather and leather productsStone, clay, and glass productsPrimary nonferrous metal industriesPrimary iron and steel industries
Fabricated metal productsMachinery (except electrical and transporta-
tion)Electrical machineryTransportation equipment (except motor
vehicles)Motor vehicles and parts
Instruments; photographic and optical goods;watches and clocks . _
Miscellaneous manufacturing (includingordnance)
All private manufacturing corporations-
Food.Tobacco manufacturesTextile mill products - . .Apparel and finished textilesLumber and wood products
Furniture and fixturesPaper and allied products.. ..Printing and publishing (except newspapers).Chemicals and allied productsProducts of petroleum and coal
Rubber products _Leather and leather products . -Stone, clay, and glass productsPrimary nonferrous metal industriesPrimary iron and steel industries
Fabricated metal productsMachinery (except electrical and transporta-
tion)Electrical machinery _ . _.Transportation equipment (except motor
vehicles)Motor vehicles and parts _ _ . ..
Instruments; photographic and optical goods;watches and clocks
Miscellaneous manufacturing (includingordnance) . . „, ,^
Profits in cents per dollar of sales
1949total
1950
Total Firstquarter
Secondquarter
Thirdquarter
Fourthquarter
1951,first
quarter
Before Federal taxes
9.3
5.58.27.03.79.2
5.910.67.4
13.212.0
5.93.9
13.911.111.1
8.7
10.69.3
6.313.5
11.6
6.2
12.8
6.19.0
10.55.0
15.9
9.015.47.9
18.814.9
10.66.5
18.817.315.5
12.4
13.314.3
8.917.5
15.9
10.4
10.1
4.87.49.03.5
11.2
5.912.38.5
15.610.7
6.64.2
14.113.512.7
9.7
10.711.3
6.215.3
12.6
5.5
11.8
5.68.18.93.3
15.2
8.413.66.8
17.113.5
7.84.9
18.915.915.1
11.4
12.611.7
8.617.8
14.3
7.7
13.5
7.510.111.46.3
18.6
9.515.69.4
20.515.2
11.47.4
20.517.115.7
13.0
13.614.0
9.318.0
16.8
12.5
14.9
6.310.012.26.0
17.2
11.418.97.0
21.119.1
14.78.7
20.521.117.8
14.4
15.618.6
10.818.3
18.7
13.7
13.5
5.49.1
11.95.4
17.7
10.519.88.3
20.916.5
13.06.9
19.718.216.5
14.5
15.015.1
7.914.0
16.0
13.8
After Federal taxes
5.8
3.35.14.12.15.9
3.36.54.58.29.4
3.82.28.66.96.5
5.1
6.45.7
3.97.9
7.0
3.6
7.1
3.44.95.82.89.4
5.18.84.5
10.310.7
5.83.7
10.110.27.9
6.8
7.37.2
4.78.3
8.6
5.6
6.2
2.84.65.41.97.1
3.27.55.49.68.2
4.22.58.68.57.5
5.9
6.46.7
3.78.9
7.7
2.9
7.4
3.45.05.21.69.7
5.48.43.8
10.610.7
5.02.7
11.710.59.0
7.1
7.77.0
5.110.5
8.9
4.5
7.6
4.35.46.53.9
11.1
5.39.05.6
11.710.5
6.64.3
11.610.28.2
7.3
7.67.5
4.S8.8
9.4
7.0
6.9
3.04.46.13.19.2
6.09.73.59.2
13.0
6.64.78.3
11.16.9
6.7
7.37.5
5.05.3
8.4
7.0
6.1
2.64.35.72.89.1
4.98.33.98.8
10.2
5.73.38.59.06.4
6.7
6.65.9
3.75.2
6.9
6.6
Sources: Federal Trade Commission and Securities and Exchange Commission.
26l
Digitized for FRASER http://fraser.stlouisfed.org/ Federal Reserve Bank of St. Louis

TABLE B-38.—Relation of profits before and after taxes to stockholders' equity and to sales,all private manufacturing corporations, by size class, 1949-51
Assets elass(thousands of dollars)
All sizes1 to 249250 to 9991.000 to 4,9995,000 to 99,999 ._109,000 and over
All sizes1 to 249250 to 9991 000 to 4,9996,009 to 99,999 . . .100,000 and over _
All sizes .1 to 249250 to 999.1,000 to 4,9995,000 to 99,999100,000 and over .
All sizes1 to 249250 to 9991,000 to 4,999 . .5,000 to 99,999 _106,000 ana over
1949total
1950
Total Firstquarter
Secondquarter
Thirdquarter
Fourthquarter
1951,first
quarter
Ratio of profits before Federal taxes (annual rate) to stockholders' equity
18.69.8
14.115.417.726.8
27.917.123.525.227.729.5
19.68.8
13.217.218.421.6
24.815.221.221.623.627.2
31.226.430.428.831.232.0
35.616.828.432.836.836.8
32.823.628.833.234.432.0
Profits before Federal taxes in cents per dollar of sales
9.32.65.26.59.0
11.8
12.84.37.99.5
12.515.5
10.12.55.17.39.5
12.8
11.84.27.48.5
11.314.4
13.56.29.8
10.313.316.0
14.93.88.7
11.014.918.2
13.55.48.8
10.913.815.4
Ratio of profits after Federal taxes (annual rate) to stockholders' equity
11.64.97.88.9
10.913.5
15.410.513.214.015.216.4
12.04.07.2
10.011.213.6
15.69.6
12.813.214.817.2
17.619.218.816.417.217.6
16.48.0
14.016.017.616.4
14.814.414.815.615.214.4
Profits after Federal taxes in cents per dollar of sales
5.81.32.93.85.57.6
7.12.64.45.2fl.98.6
6.21.12.74.25.88.1
7.42.74.45.27.09.2
7.64.56.05.97.48.9
6.91.94.35.47.18.2
6.13.34.55.26.07.0
Sources: Federal Trade Commission and Securities and Exchange Commission.
262
Digitized for FRASER http://fraser.stlouisfed.org/ Federal Reserve Bank of St. Louis

TABLE B-39.—Sources and uses of corporate funds, 1947-51l
[Billions of dollars]
Source or use of funds
Uses:Plant and equipment outlaysInventories (change in book value) _ .Change in customer receivablesCash and U. 8. Government securitiesOther current assets
Total uses
Sources:Internal:
Retained profits and depletion allowances.Depreciation allowances
Total internal sources
External:Change in trade debtChange in Federal income tax liability. --Other current liabilitiesChange in bank loansChange hi mortgagesNet new issues
Total external sources
Total sources
Discrepancy (sources less uses)
1947
15.07.17.61.0
—.1
30.6
11.66.2
16.8
4.42.31.02.6.6
4.4
15.3
32.3
1.7
1948
17.44.24.21.9
(4)
27.7
12.86.2
19.0
1.1.5
(4)1.1.8
5.9
9.4
28.4
.7
1949
16.1-4.3-.63.0
—.2
14.0
9.17.0
16.1
-2.2-2.0—.1
—1.9.7
5.3
-.2
15.9
1.9
1950
17.27.6
10.05.0.5
40.3
13.07.5
20.5
5.97.21.02.5.8
3.7
21.1
41.6
1.3
19
Firsthalf »
7.31.52.72.0
2
13.7
5.23.8
9.0
.62.0.4
-.4.3
2.3
5.2
14.2
.5
50
Secondhalf*
9.96.17.33.0.3
26.6
7.83.7
11.5
5.35.2.6
2.9.5
1.4
15.9
27.4
.8
1951,first
half2 3
10.56.53.01.0
21.0
6.54.4
10.9
2.41.6.5
2.01.02.7
10.2
21.1
.1
i Excludes banks and insurance companies.3 Not adjusted for seasonal variation.3 Preliminary estimates based on incomplete data; by Council of Economic Advisers.4 Less than 50 million dollars.
NOTE.—Detail will not necessarily add to totals because of rounding.
Sources: Department of Commerce estimates based on Securities and Exchange Commission and otherfinancial data (except as noted).
263
Digitized for FRASER http://fraser.stlouisfed.org/ Federal Reserve Bank of St. Louis
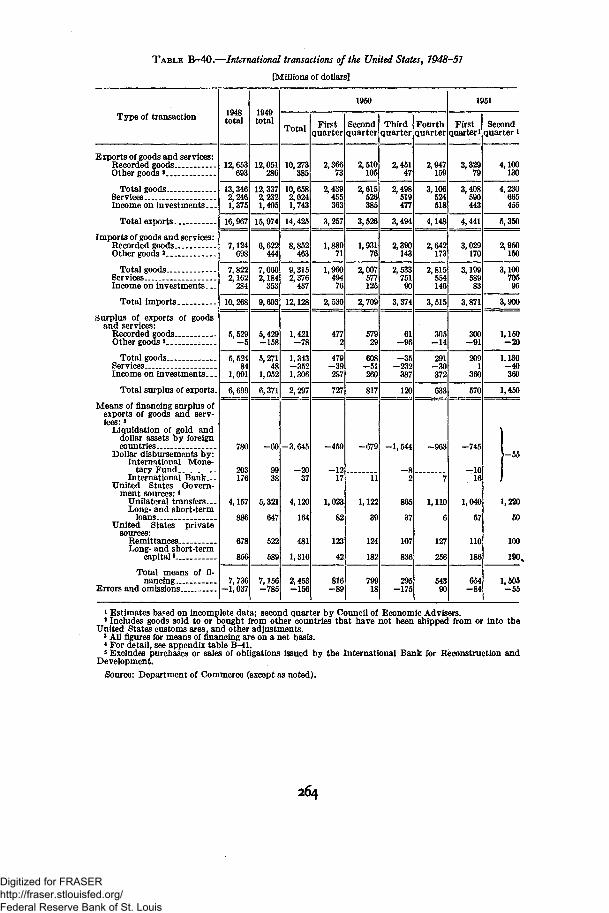
TABLE B-40.— International transactions of the United States, 1948-51
[Millions of dollars]
Type of transaction
Exports of goods and services:Recorded goodsOther goods l
Total goodsServices _ _ _ _ _ _ _Income on in vestments _--
Total exports
Imports of goods and services:Recorded goodsOther goods *
Total goodsServices _ _ _Income on in vestments. __
Total imports
Surplus of exports of goodsand services:
Recorded goodsOther goods * _ _
Total goodsServicesIncome on investments. _ _
Total surplus of exports _
Means of financing surplus ofexports of goods and serv-ices: *
Liquidation of gold anddollar assets by foreigncountries , _ __„_
Dollar disbursements by:International Mone-
tary FundInternational Bank.__
United States Govern-ment sources: *
Unilateral transfers.. _Long- and short-term
loansUnited States private
sources:"RemittancfisLong- and short-term
capital 5
Total means of fi-nancing
Errors and omissions
1948total
12, 653693
13, 3462,2461,375
16,967
7,124698
7,8222,162
284
10,268
5,529-5
5,52484
1,091
6,699
780
203176
4,157
886
678
856
7,736-1, 037
1949total
12,051286
12,3372,2321,405
15,974
6,622444
7,0662,184
353
9,603
5,429-158
5,27148
1,052
6,371
-60
9938
5,321
647
522
589
7,156-785
1950
Total
10,273385
10,6582,0241,743
14, 425
8,852463
9,3152,376
437
12,128
1,421-78
1,343-3521,306
2,297
-3, 645
-2037
4,120
164
481
1,316
2,453-156
Firstquarter
2,36673
2,439455363
3,257
1,88971
1,96049476
2,530
4772
479-39287
727
-459
-1217
1,023
82
123
42
816-89
Secondquarter
2,510105
2,615526385
3,526
1,93176
2,007577125
2,709
57929
608-51260
817
-679
11
1,122
39
124
182
79918
Thirdquarter
2,45147
2,498519477
3,494
2,390143
2,53375190
3,374
61-96
-35-232
387
120
-1, 544
—82
865
37
107
836
295-175
Fourthquarter
2,947159
3,106524518
4,148
2,642173
2,815554146
3,515
305-14
291-30372
633
-963
7
1,110
6
127
256
54390
1951
Firstquarter1
3,32979
3,408590443
4,441
3,029170
3,19958983
3,871
300-91
2091
360
570
-745
-1016
1,040
57
110
186
654-84
Secondquarter 1
4,100130
4,230665455
5,350
2,950150
3,10070595
3,900
1,150-20
1,130-40360
1,450
-55
1,220
50
100
190,
1,505-55
» Estimates ba«ed on incomplete data; second quarter by Council of Economic Advisers.J Includes goods sold to or bought from other countries that have not been shipped from or into theUnited States customs area, and other adjustments.3 All figures for means of financing are on a net basis.4 For detail, see appendix table B-41.
& Excludes purchases or sales of obligations issued by the International Bank for Reconstruction andDevelopment.
Source: Department of Commerce (except as noted).
264
Digitized for FRASER http://fraser.stlouisfed.org/ Federal Reserve Bank of St. Louis

TABLE B-41.—United States Government grants, other unilateral transfers, and loans to foreigncountries, 1948-51
[Millions of dollars]
Type of aid
Unilateral payments:Military aid programs:
Mutual defense assistanceprogram
Greek-Turkish aid. ..Chinese aid
EGA programs:European Recovery Program.Other
Army Civilian Supply Program *.Point Four assistancePhilippine Rehabilitation Act...Interim aid and post-UNRRA ._International Refugee Organiza-
tion and other United Nationsrelief organizations
Other
Total unilateral paymentsLess: Unilateral receipts
Equals: Net unilateral pay-ments .
Long-term loans and investments:United Kingdom loan. _.EGA programsExport-Import Bank loans _.Surplus property credits, in-
cluding ship salesRaw-materiaFcredits to occupied
areasUnited Nations building loanOther
Total long-term loans andinvestments .. _.
Less: Repayments
Equals: Net long-term loansand in vestments .
Outflow of short-term capital (net)
Total net unilateral payments,loans and investments
1948
34971
1,39796
1,468
130627
117107
4 362'205
4,157
300476454
168
639
1,416443
973
-87
5,043
1949
17144
3,73092
1,082
2032
104157
5 585264
5,321
428163
30
262012
679205
474
173
5,968
Total
516625
2,719114500
7166
84122
4 295175
4,120
163193
2
28226
414287
127
37
4,284
Firstquar-ter
5352
75445
1221
39
2339
1 06542
1,023
5650
2
6112
12751
76
6
1,105
1950
Secondquar-ter
6612
(3)
82944
1381
27
2333
1,17351
1,122
3058
2152
11697
19
20
1,161
Thirdquar-
ter
140g1
5469
1134
34
2425
90439
865
4941
131
9559
36
1
902
Fourthquar-ter
30572
59016
1271
66
1425
1 15343
1,110
2844
31
7680
—4
10
1,116
19
Firstquar-ter^
3223
(3)
595277514
1437
1 07838
1,040
3983
32
12760
67
-10
1,097
51
Secondquar-ter i
(2)(2)(3)
(2)(2)
0)(2)
(2)
(2)(2)
(2)(2)
1,220
(2)(2)
(2)
8(5)(2)
50
1,270
i Estimates based on incomplete data: second quarter by Council of Economic Advisers.» Not available.* Less than 500 thousand dollars.< Includes disbursements by EGA from funds appropriated under the Army Civilian Supply Program,Source: Department of Commerce (except as noted).
265
Digitized for FRASER http://fraser.stlouisfed.org/ Federal Reserve Bank of St. Louis
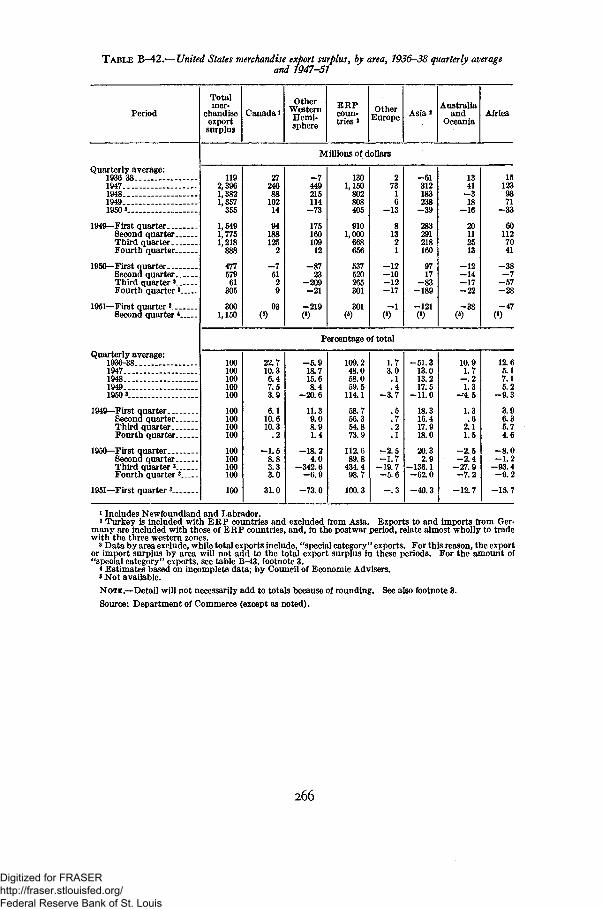
TABLE B-42.—United States merchandise export surplus, by area, 1936-38 quarterly averageand 1947-51
Period
Quarterly average:1936-381947194819491950S
1949— First quarterSecond quarterThird quarterFourth quarter
1950 — First quarterSecond quarterThird quarter »Fourth quarter «
1951 — First quarter 8
Second quarter *
Quarterly average:1936-38194719481949 . .I960'
1949— First quarterSecond quarterThird quarterFourth quarter
1950 — First quarterSecond quarterThird quarter 3Fourth quarter 3
1951 — First quarter 3
Totalmer-
chandiseexportsurplus
Canada 1Other
WesternHemi-sphere
ERPcoun-tries*
OtherEurope Asia 2
Australiaand
OceaniaAfrica
Millions of dollars
1192,3961,3821,357
355
1,5491,7751,218
888
47757961
305
3001,150
2724688
10214
94188125
2
rj
5129
93(8)
-7449215114
-73
17516010912
-8723
-209-21
-219(•)
1301,150
802808405
9101,000
668656
537520265301
301(6)
27316
-13
81321
-12-10-12-17
-1(6)
-61312183238
-39
283291218160
9717
-83-189
-121(8)
1341-318
-16
20112513
-12-14-17-22
-38(fi)
151239871
-33
601127041
-38-7
-57-28
-47(8)
Percentage of total
100100100100100
100100100100
100100100100
100
22.710.36.47.53.9
6.110.610.3
• 2
-1.58.83.33.0
31.0
-5.918.715.68.4
-20.6
11.39.08.91.4
-18.24.0
-342. 6-6.9
-73.0
109.248.058.059.5
114.1
58.756.354.873.9
112.689.8
434.498.7
100.3
1.73.0.1.4
-3.7
.5
.7
.2
.1
-2.5-1.7
-19.7-5.6
-.3
-51.313.013.217.5
-11.0
18.316.417.918.0
20.32.9
-136. 1-62.0
-40.3
10.91.7-.21.3
-4.5
1.3.6
2.11.5
-2.5-2.4
-27.9-7.2
-12.7
12.65.17.15.2
-9.3
3.96.35.74.6
-8.0-1.2
-93.4-9.2
-15.7
1 Includes Newfoundland and Labrador.2 Turkey is included with ERP countries and excluded from Asia. Exports to and imports from Ger-
many are included with those of ERP countries, and, in the postwar period, relate almost wholly to tradewith the three western zones.
3 Data by area exclude, while total exports include, "special category" exports. For this reason, the exportor import surplus by area will not add to the total export surplus in these periods. For the amount of"special category" exports, see table B-43, footnote 3.
* Estimates based on incomplete data; by Council of Economic Advisers.«Not available.
NOTE.—Detail will not necessarily add to totals because of rounding. See also footnote 3.
Source: Department of Commerce (except as noted).
266
Digitized for FRASER http://fraser.stlouisfed.org/ Federal Reserve Bank of St. Louis

TABLE B-43.—United States merchandise exports, including reexports, by area, 1936—38 quarterlyaverage and 1947-51
Period
Quarterly average:1936-3819471948. _ _19491950S
1949— First quarter _.Second quarterThird quarterFourth quarter
1950— First quarterSecond quarterThird quarter 3Fourth quarter 8
1951— First quarter 3Second quarter *
Quarterly average:1936-381947 -.194819491950 5
1949— First quarterSecond quarterThird quarterFourth quarter
1950— First quarterSecond quarterThird quarter 3Fourth quarter 8
1951— First quarter 3
TotalexDorts
includingreexports
Canada lOther
WesternHemi-sphere
ERPcountries2
OtherEurope Asia 2
Australiaand
OceaniaAfrica
Millions of dollars
7423,8353, 1643,0132,568
3,3383,3762,6952,643
2.3662,5102,4512,947
3,3294,100
115528486490504
472571473444
397530505583
622(5)
1361,017
841725703
837740671653
640668706797
863(5)
2821,3241,0461,019
720
1,1601,190
843884
777763587756
815(s)
31118494134.
42463539
33353733
62(5)
122561507534370
611593483448
399381334365
471(s)
2380384936
54504744
37383038
44(fi)
3220519615590
163186142130
849679
103
120(5)
Percentage of total
100100100100100
100100100100
100100100100
100
15.513.815.416.319.6
14.116.917.616.8
16.821.120.619.8
18.7
18.326.526.624.127.4
25.121.924.924.7
27.026.628.827.0
25.9
38.034.533.133.828.0
34.835.231.333.4
32.830.423.925.7
24.5
4.23.11.51.41.3
1.31.41.31.5
1.41.41.51.1
1.9
16.414.616.017.714.4
18.317.617.917.0
16.915.213.612.4
14.1
3.12.11.21.61.4
1.61.51.71.7
1.61.51.21.3
1.3
4.35.36.25.13.5
4.95.55.34.9
3.63.83.23.5
3.6
1 Includes Newfoundland and Labrador.8 Turkey is included with ERP countries and excluded from Asia. Exports to Germany are included
with those of ERP countries and, in the postwar period, relate almost wholly to exports to the three westernzones.
8 Data by area exclude, while total exports include, "special category" exports. For this reason, ex-ports by area will not add to total exports hi these periods. "Special category" exports amounted to 173million dollars in the third quarter of 1950, 272 million in the fourth quarter, and 333 million in the firstquarter of 1951.
4 Estimates based upon incomplete data; by Council of Economic Advisers.5 Not available.NOTE.—Data hi this table cover all merchandise, including reexports, shipped from the United States
customs area to foreign countries, including, in 1947 to 1951, goods destined to United States armed forcesabroad for distribution in occupied areas as civilian supplies.
Detail will not necessarily add to totals because of rounding. See also footnote 3.Source: Department of Commerce (except as noted).
267
Digitized for FRASER http://fraser.stlouisfed.org/ Federal Reserve Bank of St. Louis
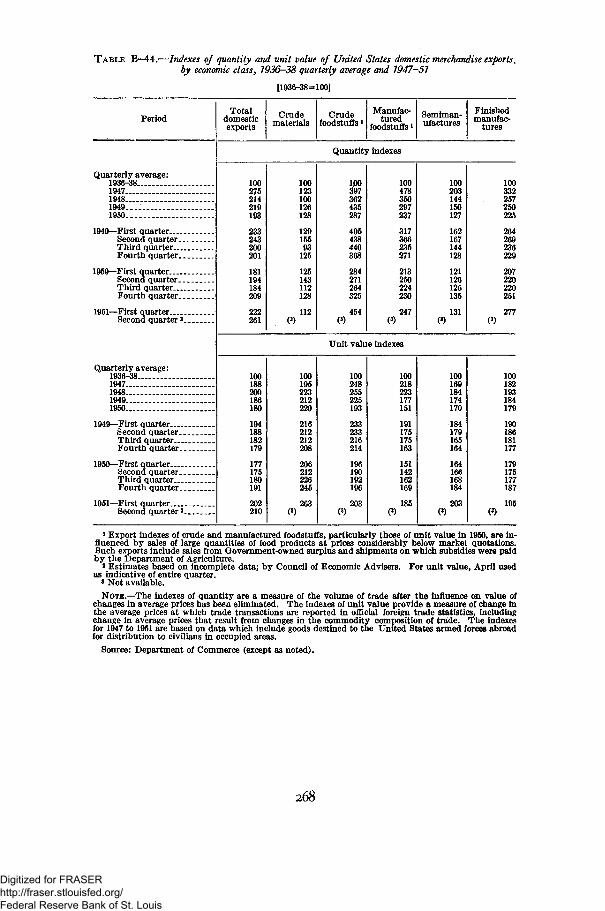
TABLE B—44.—Indexes of quantity and unit value of United States domestic merchandise exports,by economic class, 1936—38 quarterly average and 1947—51
[1936-38=100]
Period
Quarterly average:1936-381947194819491950
1949— First quarterSecond quarterThird quarter _.Fourth quarter
1950 — First quarterSecond quarterThird quarterFourth quarter
1951— First quarterSecond quarter 2
Quarterly average:1936-381947194819491950
1949 — First quarterSecond quarterThird quarterFourth quarter
1950 — First quarterSecond quarterThird quarterFourth quarter
1951— First quarterSecond quarter 2
Totaldomesticexports
Crudematerials
Crudefoodstuffs i
Manufac-tured
foodstuffs iSemiman-ufactures
Finishedmanufac-
tures
Quantity indexes
100275214219193
233243200201
181194184209
222261
100123100126128
12915593
125
125143112128
112(3)
1,00397362435287
495438440368
284271264325
454(3)
100478350297237
317366235271
213250224230
247(3)
100203144150127
162167144128
121126125135
131(')
100332257250225
264269236229
207220220251
277(3)
Unit value indexes
100188200186180
194188182179
177175180191
202210
100195223212220
216212212208
206212226245
263(3)
100248255225193
233233216214
196190192196
203(3)
100218223177151
191175175163
151142162169
185(3)
100169184174170
184179165164
164166168184
203(3)
100182193184179
190186181177
179175177187
195(3)
i Export indexes of crude and manufactured foodstuffs, particularly those of unit value in 1950, are in-fluenced by sales of large quantities of food products at prices considerably below market quotations.Such exports include sales from Government-owned surplus and shipments on which subsidies were paidby the Department of Agriculture.
* Estimates based on incomplete data; by Council of Economic Advisers. For unit value, April usedas indicative of entire quarter.
3 Not available.
NOTE.—The indexes of quantity are a measure of the volume of trade after the influence on value ofchanges in average prices has been eliminated. The indexes of unit value provide a measure of change inthe average prices at which trade transactions are reported in official foreign trade statistics, includingchange in average prices that result from changes in the commodity composition of trade. The indexesfor 1947 to 1951 are based on data which include goods destined to the United States armed forces abroadfor distribution to civilians hi occupied areas.
Source: Department of Commerce (except as noted).
268
Digitized for FRASER http://fraser.stlouisfed.org/ Federal Reserve Bank of St. Louis
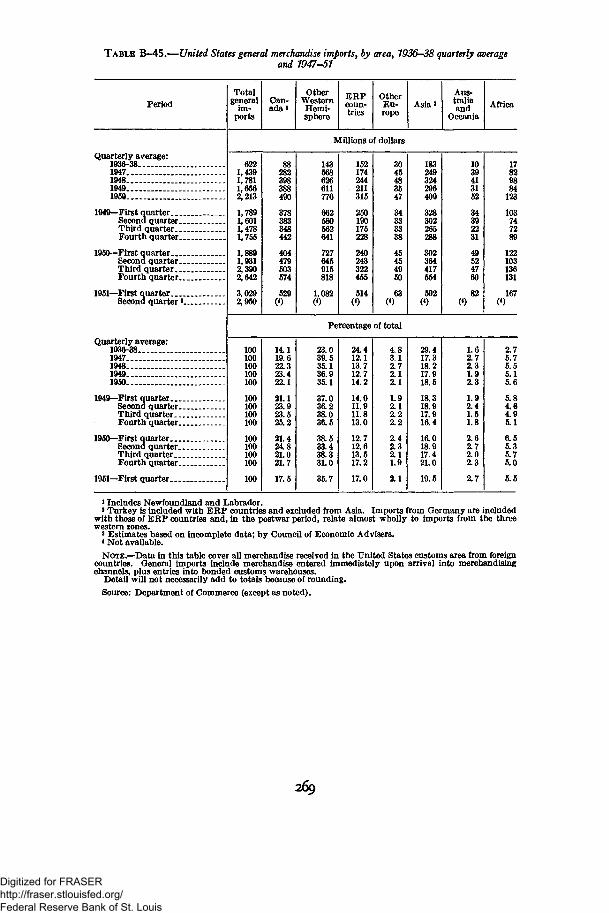
TABLE B-45.—United States general merchandise imports, by area, 1936-38 quarterly averageand 1947-51
Period
Quarterly average:1936-3819471948 _1949 .I960
1949— First quarterSecond quarterThird quarterFourth quarter
1950—First quarterSecond quarterThird quarterFourth quarter
1951— First quarter.Second quarter 3
Quarterly average:1936-38.1947194819491950
1949— First quarterSecond quarter.. ._ _Third quarter _.Fourth quarter
I960— First quarter.Second quarter..Third quarterFourth quarter
1951— First quarter
Totalgeneral
im-ports
Can-ada i
OtherWesternHemi-sphere
ERPcoun-tries
OtherEu-rope
Asia aAus-traliaand
OceaniaAfrica
Millions of dollars
6221,4391,7811,6562,213
1,7891,6011,4781,755
1,8891,9312,3902,642
3,0292,950
88282398388490
378383348442
404479503574
529<«)
143568626611776
662580562641
727645915818
1,082(«)
152174244211315
250190175228
240243322455
514(4)
3045483547
34333338
45454950
63(4)
183249324296409
328302265288
302364417554
592(<)
1039413152
34392231
49524760
82(<)
17829884
123
103747289
122103136131
167(4)
Percentage of total
100100100100100
100100100100
100100100100
100
14.119.622.323.422.1
21.123.923.525.2
21.424.821.021.7
17.5
23.039.535.136.935.1
37.036.238.036.5
38.533.438.331.0
35.7
24.412.113.712.714.2
14.011.911.813.0
12.712.613.517.2
17.0
4.83.12.72.12.1
1.92.12.22.2
2.42.32.11.9
2.1
29.417.318.217.918.5
18.318.917.916.4
16.018.917.421.0
19.5
1.62.72.31.92.3
1.92.41.51.8
2.62.72.02.3
2.7
2.75.75.55.15.6
5.84.64.95.1
6.55.35.75.0
5.5
*Includes Newfoundland and Labrador.»Turkey is included with ERP countries and excluded from Asia. Imports from Germany are included
with those of ERP countries and, in the postwar period, relate almost wholly to imports from the threewestern zones.
3 Estimates based on incomplete data; by Council of Economic Advisers.* Not available.
NOTE.—Data in this table cover all merchandise received in the United States customs area from foreigncountries. General imports include merchandise entered immediately upon arrival into merchandisingchannels, plus entries into bonded customs warehouses.
Detail will not necessarily add to totals because of rounding.
Source: Department of Commerce (except as noted).
269
Digitized for FRASER http://fraser.stlouisfed.org/ Federal Reserve Bank of St. Louis

TABI*E B-46.—United States merchandise imports for consumption, by economic class, 1936-38quarterly average and 1947—51
Period
Quarterly average:1936-381947194819491950
1949 — First quarterSecond quarterThird quarterFourth quarter
1950 — First quarterSecond quarterThird quarter .._Fourth quarter - . _
1951— -First quarterSecond quarter *
Quarterly average:1936-381947. .194819491950
1949 — First quarter -Second quarterThird quarter _._Fourth quarter
1950— First quarter _Second quarter . -Third quarterFourth quarter
1951 — First quarter
Totalimportsfor con-
sumption
Crudematerials
Crudefoodstuffs
Manufac-tured
foodstuffsSemimanu-
facturesFinishedmanufac-
tures
Millions of dollars
6151,4161,7731,6482,186
1,7571,5901,5011,744
1,8731,9082,3492,614
2,9572,850
190441537463617
503449424478
536516635781
925(2)
85254318333437
340302287403
423347516463
642(3)
95164183185224
182198194167
185213275224
256(2)
126311408355531
396336306381
417481544683
664(2)
120246327311376
336305290315
312352378462
470(2)
Percentage of total
100100100100100
100100100100
100100100100
100
30.931.130.328.128.2
28.628.228.227.4
28.627.027.029.9
31.3
13.817.917.920.220.0
19.419.019.123.1
22.618.222.017.7
21.7
15.411.610.311.210.2
10.412.512.99.6
9.9ll.fi11.78.6
8.7
20.522.023.021.524.3
22.521.120.421.8
22.325.223.226.1
22.5
19.517.418.418.917.2
19.119.219.318.1
16.718.416.117.7
15.9
* Estimates based on incomplete data; by Council of Economic Advisers.2 Not available.NOTE.—Imports for consumption include merchandise entered immediately upon arrival into merchan-
dising or consumption channels, plus withdrawals from bonded customs warehouses for consumption.Detail will not necessarily add to totals because of rounding.Source: Department of Commerce (except as noted).
270
Digitized for FRASER http://fraser.stlouisfed.org/ Federal Reserve Bank of St. Louis

TABLE B-47.—Indexes of quantity and unit value of United States merchandise imports forconsumption, bv economic class, 1936—38 quarterly average and 1947—51
[1936-38=1001
Period
Quarterly average:1936-3819471948 . . _1949_.._1950
1949 — First quarterSecond quarter .Third quarterFourth quarter
1950 — First quarterSecond quarter. .. ..Third quarterFourth quarter
1951 — First quarterSecond quarter * . _ .
Quarterly average:1936-381947194819491950 . . . . .
1949 — First quarterSecond quarter.Third quarterFourth quarter _
1950— First quarterSecond quarterThird quarterFourth quarter
1951 — First quarterSecond quarter *
Totalimports forconsump-
tion
Crudematerials
Crudefoodstuffs
Manufac-tured food-
stuffs
Semi-manufac-
tures
Finishedmanufac-
tures
Quantity indexes
100108123120146
121116111131
137136154158
163158
100129139125152
129118116136
152140156161
161(2)
10096
109119113
121116104135
12194
125111
149(2)
100839197
117
9310510088
98113143113
126(2)
100130149143219
140129130169
189213220247
225(2)
10084
103101125
1059894
106
107119125147
141(2)
Unit value indexes
100213235224243
235224220217
223229248270
295308
100180203195214
206200193185
185194215255
302(2)
100311343330454
330306324352
410433485491
508(2)
100208212202203
205199205201
199199203210
214(2)
100191217198193
225208187180
176179197220
234(2)
100245266258252
267261258249
245248253262
278(2)
i Estimates based on incomplete data; by Council of Economic Advisers. For unit value, April used asin dicative of entire quarter,
a Not available.NoTE.—The indexes of quantity are a measure of the volume of trade after the influence on value of changes
in average prices has been eliminated. The indexes of unit value provide a measure of change in the averageprices at which trade transactions arc reported in official foreign trade statistics, including changes in averageprices that result from changes in the commodity composition of trade.
Source: Department of Commerce (except as noted).
271
Digitized for FRASER http://fraser.stlouisfed.org/ Federal Reserve Bank of St. Louis

TABLE B—48.—Changes in selected economic series since 1939 and 1950
Source:Ap-
pendixTableNo.
B-l....
B-3.._.
B-6
B-7- —
B-10...
B-11--
B-15...
B-16...
B-17...
B-19...
B-20...
B-21__.
B-24.,.
See foe
Economic series
Gross national product .Personal consumption expendi-
turesGross private domestic investment .Government purchases of goods
and services . .
Gross national product in first half of1951 prices _
Personal consumption expendi-tures
Gross private domestic investment -Government purchases of goods
and services... _ .
National incomeCompensation of employees
Personal incomeDisposal personable income _Personal net saving
Per capita disposable personal income:Current pricesFirst half of 1951 prices
Labor force, including armed forcesCivilian labor force
Employment _ _AgriculturalNonagri cultural. . . .
Unemployment
Average gross weekly earnings:Manufacturing
Durable goodsNondurable goods
Building construction ._
Physical production index of goodsAgriculturalNonagricultural. _
Industrial productionDurable manufacturesNondurable manufacturesMinerals
New constructionPrivate
Residential (nonfarm)NonresidentialOther private
Public ...
Business expenditures for new plantand equipment
Manufacturing
Inventories, end of periodManufacturing..Wholesale tradeRetail trade
SalesManufacturingWholesale traote .Retail trade
Consumers* price index: All itemsFoodApparelRentHousefurnishings.
ttnotes at end of table.
1939=100
1950
Total
310
287494
324
168
160241
160
330321
310291396
251141
11611413178
14533
249239251243
178130189
183217172140
340474470481478187
357426
305297339303357384333334
173215187126188
Firsthalf
295
277444
311
164
158228
158
310304
298281396
244140
11511312875
14241
239229243231
(3)(3)180
173202166130
324446440428478183
309351
269262299266331350305320
170208184125183
Secondhalf
324
297543
338
172
163257
161
349337
321301396
259142
11811513481
14825
257248259252
(3)(3)198
194233177149
357501500533478191
405502
305297339303383418360347
176222190127193
1951,firsthalf*
355
305624
437
181
160283
202
377365
340314541
268141
(3)11313270
14822
270261268259
(3)(3)209
204251183154
375497440665517235
446591
347339378346407452382358
185237201129208
Percentage increase *
1950, firsthalf, to
1951, firsthalf
20.1
10.140.5
40.5
10.3
1.224.6
28.3
21.620.1
14.011.636.4
9.7.8
(3)-.a2.8
-6.84.1
-46.7
12.913.910.112.0
(3)
0,217.524.59.9
18.1
15.911.3
.055.38.0
28.6
44.368.4
28.929.326.329.923.129.025.212.2
9.014.09.43.4
13.7
1950, sec-ond half,to 1951,
first half 2
9.5
2.614.9
29.1
5.5
-1.910.4
25.2
8.18.3
6.14.3
36.4
3.4-1.0
(3)-2.4-1.9
-13.3-.2
-14.3N
5.15.43.62.8
8'5.5
5.27.93.13.2
5.1-.9
-12.024. 88. 2
23.4
10.017.8
13.614.011.514.16.48.16.23.4
5.17.06.11.97.7
272
Digitized for FRASER http://fraser.stlouisfed.org/ Federal Reserve Bank of St. Louis
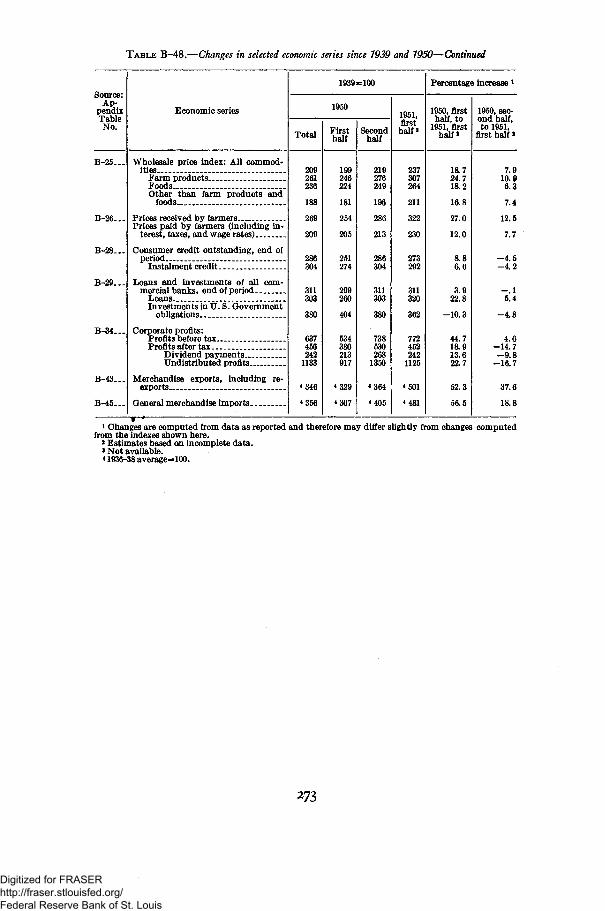
TABLE B-48.—Changes in selected economic series since 1939 and 1950—Continued
Source:Ap-
pendixTableNo.
B-25...
B-26...
B-28...
B-29...
B-34...
B-43...
B-45...
Economic series
Wholesale price index: All commod-ities . . .
Farm productsFoods.Other than farm products and
foods .
Prices received by farmersPrices paid by farmers (including in-
terest, taxes, and wage rates)
Consumer credit outstanding, end ofperiod _.
Instalment credit . .
Loans and investments of all com-mercial banks , end of period
LoansInvestments in U. S. Government
obligations
Corporate profits:Profits before tax..Profits after tax
Dividend paymentsUndistributed profits
Merchandise exports, including re-exports . _.
General merchandise imports
1939=100
1950
Total
209261236
188
269
209
286304
311303
380
637456242
1133
*346
*356
Firsthalf
199246224
181
254
205
251274
299260
404
534380213917
*329
*307
Secondhalf
219276249
196
286
213
286304
311303
380
738530268
1350
<364
4405
1951,firsthalf3
237307264
211
322
230
273292
311320
362
772452242
1125
4501
4481
Percentage increase *
1950, firsthalf, to
1951, firsthalf8
18.724.718.2
16.8
27.0
12.0
8.86.6
3.922.8
-10.3
44.718.913.622.7
52.3
56.5
1950, sec-ond half,to 1951,
first half «
7.910.96.3
7.4
12.5
7.7
-4.5-4.2
-.15.4
-4.8
4.6-14.7-9.8
-16.7
37.6
18.8
i Changes are computed from data as reported and therefore may differ slightly from changes computedfrom the indexes shown here.
> Estimates based on incomplete data.»Not available.41936-38 average=100.
273
Digitized for FRASER http://fraser.stlouisfed.org/ Federal Reserve Bank of St. Louis

Digitized for FRASER http://fraser.stlouisfed.org/ Federal Reserve Bank of St. Louis