Embed Size (px)
Citation preview

Appendix BSTATISTICAL TABLES RELATING TO INCOME,
EMPLOYMENT, AND PRODUCTION
Digitized for FRASER http://fraser.stlouisfed.org/ Federal Reserve Bank of St. Louis

Digitized for FRASER http://fraser.stlouisfed.org/ Federal Reserve Bank of St. Louis

CONTENTS
NATIONAL INCOME OR EXPENDITURE:Page
B-l. Gross domestic product, 1959-96 300B-2. Real gross domestic product, 1959-96 302B-3. Chain-type price indexes for gross domestic product, 1959-96 304B-4. Quantity and prices indexes for gross domestic product, and per-
cent changes, 1959-96 306B-5. Percent changes in real gross domestic product, 1960-96 307B-6. Gross domestic product by major type of product, 1959-96 308B-7. Real gross domestic product by major type of product, 1959-96 309B-8. Gross domestic? product by sector, 1959-96 310B-9. Real gross domestic product by sector, 1959-96 311B-10. Gross domestic product by industry, 1959-94 312B-ll. Real gross domestic product by industry, 1977-94 313B-12. Gross domestic product of nonfinancial corporate business, 1959-
96 314B-13. Output, costs, and profits of nonfinancial corporate business,
1959-96 315B-14. Personal consumption expenditures, 1959-96 316B-15. Real personal consumption expenditures, 1959-96 317B-16. Private gross fixed investment by type, 1959-96 318B-17. Real private gross fixed investment by type, 1959-96 319B—18. Government consumption expenditures and gross investment by
type, 1959-96 320B-19. Real government consumption expenditures and gross invest-
ment by type, 1959-96 321B-20. Inventories and final sales of domestic business, 1959-96 322B-21. Real inventories and final sales of domestic business, 1959-96 .... 323B-22. Foreign transactions in the national income and product ac-
counts, 1959-96 324B-23. Real exports and imports of goods and services and receipts and
payments of factor income, 1959-96 * 325B-24. Relation of gross domestic product, gross national product, net
national product, and national income, 1959-96 326B-25. Relation of national income and personal income, 1959-96 327B-26. National income by type of income, 1959-96 328B-27. Sources of personal income, 1959-96 330B-28. Disposition of personal income, 1959-96 332B-29. Total and per capita disposable personal income and personal
consumption expenditures in current and real dollars, 1959-96 333B-30. Gross saving and investment, 1959-96 334B-31. Median money income (in 1995 dollars) and poverty status of
families and persons, by race, selected years, 1977-95 336
295
Digitized for FRASER http://fraser.stlouisfed.org/ Federal Reserve Bank of St. Louis

PagePOPULATION, EMPLOYMENT, WAGES, AND PRODUCTIVITY:
B-32. Population by age group, 1929-96 337B-33. Civilian population and labor force, 1929-96 338B-34. Civilian employment and unemployment by sex and age, 1948-
96 340B-35. Civilian employment by demographic characteristic, 1954-96 341B-36. Unemployment by demographic characteristic, 1954-96 342B-37. Civilian labor force participation rate and employment/popu-
lation ratio, 1948-96 343B-38. Civilian labor force participation rate by demographic char-
acteristic, 1954-96 344B-39. Civilian employment/population ratio by demographic char-
acteristic, 1954-96 345B-40. Civilian unemployment rate, 1948-96 346B-41. Civilian unemployment rate by demographic characteristic,
1954-96 347B-42. Unemployment by duration and reason, 1950-96 348B-43. Unemployment insurance programs, selected data, 1963-96 349B-44. Employees on nonagricultural payrolls, by major industry, 1948-
96 350B-45. Hours and earnings in private nonagricultural industries, 1959-
96 352B-46. Employment cost index, private industry, 1980-96 353B-47. Productivity and related data, business sector, 1959-96 354B-48. Changes in productivity and related data, business sector, 1960-
96 355
PRODUCTION AND BUSINESS ACTIVITY:B-49. Industrial production indexes, major industry divisions, 1947-96 356B-50. Industrial production indexes, market groupings, 1947-96 357B-51. Industrial production indexes, selected manufactures, 1947-96 ... 358B-52. Capacity utilization rates, 1948-96 359B-53. New construction activity, 1959-96 360B-54. New housing units started and authorized, 1959-96 361B-55. Manufacturing and trade sales and inventories, 1954-96 362B-56. Manufacturers' shipments and inventories, 1954-96 363B-57. Manufacturers' new and unfilled orders, 1954-96 364
PRICES:B-58. Consumer price indexes for major expenditure classes, 1954-96 365B-59. Consumer price indexes for selected expenditure classes, 1954—
96 366B-60. Consumer price indexes for commodities, services, and special
groups, 1954-96 368B-61. Changes in special consumer price indexes, 1958-96 369B-62. Changes in consumer price indexes for commodities and services,
1929-96 370B-63. Producer price indexes by stage of processing, 1954-96 371B-64. Producer price indexes by stage of processing, special groups,
1974-96 373B-65. Producer price indexes for major commodity groups, 1954-96 374B-66. Changes in producer price indexes for finished goods, 1958-96 .... 376
296
Digitized for FRASER http://fraser.stlouisfed.org/ Federal Reserve Bank of St. Louis

PageMONEY STOCK, CREDIT, AND FINANCE:
B-67. Money stock, liquid assets, and debt measures, 1959-96 377B-68. Components of money stock measures and liquid assets, 1959-96 378B-69. Aggregate reserves of depository institutions and monetary base,
1959-96 380B-70. Bank credit at all commercial banks, 1972-96 381B-71. Bond yields and interest rates, 1929-96 382B-72. Credit market borrowing, 1987-96 384B-73. Mortgage debt outstanding by type of property and of financing,
1940-96 386B-74. Mortgage debt outstanding by holder, 1940-96 387B-75. Consumer credit outstanding, 1955-96 388
GOVERNMENT FINANCE:B-76. Federal receipts, outlays, surplus or deficit, and debt, selected
fiscal years, 1929-98 389B-77. Federal budget receipts, outlays, surplus or deficit, and debt, as
percent of gross domestic product, fiscal years 1934-98 390B-78. Federal receipts and outlays, by major category, and surplus or
deficit, fiscal years 1940-98 391B-79. Federal receipts, outlays, and debt, fiscal years 1992-98 392B-80. Federal Government receipts and current expenditures, national
income and product accounts (NIPA), 1978-96 393B-81. Federal and State and local government receipts and current ex-
penditures, national income and product accounts (NIPA),1959-96 394
B-82. Federal and State and local government receipts and current ex-penditures, national income and product accounts (NIPA), bymajor type, 1959-96 395
B-83. State and local government receipts and current expenditures,national income and product accounts (NIPA), 1959-96 396
B-84. State and local government revenues and expenditures, selectedfiscal years, 1927-93 397
B-85. Interest-bearing public debt securities by kind of obligation,1967-96 398
B-86. Maturity distribution and average length of marketable interest-bearing public debt securities held by private investors, 1967-96 399
B-87. Estimated ownership of public debt securities by private inves-tors, 1976-96 400
CORPORATE PROFITS AND FINANCE:B-88. Corporate profits with inventory valuation and capital consump-
tion adjustments, 1959-96 401B-89. Corporate profits by industry, 1959-96 402B-90. Corporate profits of manufacturing industries, 1959-96 403B-91. Sales, profits, and stockholders' equity, all manufacturing cor-
porations, 1952-96 404B-92. Relation of profits after taxes to stockholders' equity and to sales,
all manufacturing corporations, 1947-96 405B-93. Common stock prices and yields, 1955-96 406B-94. Business formation and business failures, 1955-96 407
297
Digitized for FRASER http://fraser.stlouisfed.org/ Federal Reserve Bank of St. Louis

PageAGRICULTURE:
B-95. Farm income, 1945-96 408B-96. Farm business balance sheet, 195O-95 409B-97. Farm output and productivity indexesv4948-94 410B-98. Farm input use, selected inputs, 1948-96 411B-99. Indexes of prices received and prices paid by farmers, 1975-96 412B-100. U.S. exports and imports of agricultural commodities, 1940-96 ... 413
INTERNATIONAL STATISTICS:B-101. U.S. international transactions, 1946-96 414B-102. U.S. international trade in goods by principal end-use category,
1965-96 416B-103. U.S. international trade in goods by area, 1987-96 417B-104. U.S. international trade in goods on balance of payments (BOP)
and Census basis, and trade in services on BOP basis, 1974-96 418
B-105. International investment position of the United States at year-end, 1987-95 419
B-106. Industrial production and consumer prices, major industrialcountries, 1970-96 420
B-107. Civilian unemployment rate, and hourly compensation, major in-dustrial countries, 1970-96 421
B-108. Foreign exchange rates, 1970-96 422B-109. International reserves, selected years, 1952-96 423B-110. Growth rates in real gross domestic product, 1978-96 424
298
Digitized for FRASER http://fraser.stlouisfed.org/ Federal Reserve Bank of St. Louis

General Notes
Detail in these tables may not add to totals because of rounding. In addition,because of the formula used for calculating real gross domestic product (GDP),the chained (1992) dollar estimates for the detailed components do not add tothe chained-dollar value of GDP or to any intermediate aggregates.
Unless otherwise noted, all dollar figures are in current dollars.
Symbols used:P Preliminary..... Not available (also, not applicable).
Data in these tables reflect revisions made by the source agencies fromFebruary 1996 through late January 1997.
299
Digitized for FRASER http://fraser.stlouisfed.org/ Federal Reserve Bank of St. Louis

NATIONAL INCOME OR EXPENDITURE
TABLE B-l.—Gross domestic product, 1959-96[Billions of dollars, except as noted; quarterly data at seasonally adjusted annual rates]
Year orquarter
1959I96019611962196319641965196619671968196919701971197219731974197519761977 . .19781979
19801981198219831984198519861987198819891990199119921993199419951990:1
III l lIV
1991-1IIIllIV
1992:1||IllIV
1993-1IIIllIV
1994-1I IHIIV
1995-1IIIllIV
1996:1IIIII
Grossdomesticproduct
507.2526.6544.8585.2617.4663.0719.1787.8833.6910.6982.2
1,035.61,125.41,237.31,382.61,496.91,630.61,819.02,026.92,291.42,557.52,784.23,115.93,242.13,514.53,902.44,180.74.422.24,692.35,049.65,438.75,743.85,916.76,244.46,553.06,935.77,253.85,660.45,751.05,782.45,781.55,822.15,892.35,950.06,002.36,121.86,201.26,271.76,383.06,442.66,506.26,574.46,688.66,776.06,890.56,993.17,083.27,149.87,204.97,309.87,350.67,426.87,545.17,616.3
Personal consumption expenditures
Total
318.1
332.2342.6363.4383.0411.4444.3481.9509.5559.8604.7648.1702.5770.7851.6931.2
1,029.11,148.81,277.11,428.81,593.51,760.41,941.32,076.82,283.42,492.32,704.82,892.73,094.53,349.73,594.83,839.33,975.14,219.84,454.14,700.94,924.93,759.23,811.83,879.23,907.03,910.73,961.04,001.64,027.14,127.64,183.04,238.94,329.64,367.64,424.84,481.04,543.14,600.94,666.24,738.34,798.24,840.64,910.54,957.94,990.55,060.55,139.45,165.4
Durablegoods
42.7
43.341.846.951.656.763.368.370.480.885.9
85.096.9
110.4123.5122.3133.5158.9181.1201.4213.9213.5230.5239.3279.8325.1361.1398.7416.7451.0472.8476.5455.2488.5530.7580.9606.4493.3477.6473.24619449.0452.7462.0457.3474.1481.3492.5506.2508.3525.2536.7552.3562.6573.1585.3602.7
593.0604.0615.8612.8625.2637.6630.5
Non-durablegoods
148.5152.9156.6162.8168.2178.7191.6208.8217.1235.7253.2272.0285.5308.0343.1384.5420.6458.2496.9549.9624.0695.5758.2786.8830.3883.6927.6957.2
1,014.01,081.11,163.81,245.31,277.61,321.81,368.91,429.71,485.91,220.71,230.21,256.21,274.11,268.31,279.71,283.41,279.01,303.11,308.41,326.31,349.51,354.11,364.11,371.31,386.11,399.71,416.61,443.41,459.01,471.51,486.71,491.21,494.21,522.11,544.71,546.5
Serv-ices
127.0136.0144.3153.7163.2176.1189.4204.8222.0243.4265.5291.1320.1352.3384.9424.4475.0531.8599.0677.4755.6851.4952.6
1,050.71,173.31,283.61,416.11,536.81,663.81,817.61,958.12,117.52,242.32,409.42.554.62,690.32,832.62,045.32,104.12,149.82,171.02,193.52,228.62,256.32,290.72,350.42,393.32,420.12,473.92,505.22,535.42,572.92,604.72,638.62,676.52,709.62,736.62,776.12,819.82,850.92,883.52,913.22,957.12,988.5
Gross private domestic investment
Total
78.8
78.877.987.993.4
101.7118.0130.4128.0139.9155.0150.2176.0205.6242.9245.6225.4286.6356.6430.8480.9465.9556.2501.1547.1715.6715.1722.5747.2773.9829.2799.7736.2790.4871.1
1,014.41,065.3
822.5835.2804.9736.1723.6716.2743.9760.9755.2790.8799.7816.1843.6855.9873.8911.2957.6
1,016.51,033.61,050.11,072.01,050.31,074.81,064.01,068.91,096.01,156.2
Fixed investment
Total
74.675.575.081.887.796.7
108.3116.7117.6130.8145.5
148.1167.5195.7225.4231.5231.7269.6333.5403.6464.0473.5528.1515.6552.0648.1688.9712.9722.9763.1797.5791.6738.5783.4850.5954.9
1,028.2813.9794.0791.2767.5739.7736.2738.6739.5755.4780.5788.1809.7
823.8834.3851.8892.3917.4942.0968.9991.4
1,013.91,016.31,036.61.046.21,070.71,088.01,119.6
Nonresidential
Total
46.5
49.248.652.855.662.474.184.485.292.1
102.9106.7111.7126.1150.0165.6169.0187.2223.2272.0323.0350.3405.4409.9399.4468.3502.0494.8495.4530.6566.2575.9547.3557.9598.8667.2738.5581.2571.6580.3570.6555.4550.2544.3539.2544.1556.8561.0569.6580.3591.1599.2624.6638.8653.5678.5697.9723.6734.4746.3749.7769.0773.8807.0
Struc-tures
18.119.619.720.821.223.728.331.331.533.637.7
40.342.747.255.061.261.465.974.691.4
114.9133.9164.6175.0152.7176.0193.3175.8172.1181.3192.3200.8181.7169.2171.8180.2199.7201.9202.4203.5195.4
192.3187.6176.1170.8171.6170.4167.6167.1
170.2169.7171.4175.8171.8179.1181.0188.8
194.5197.6202.5204.0208.4207.4213.5
Pro-ducers'durableequip-ment
28.329.728.932.134.438.745.853.053.758:565.266.469.178.995.1
104.3107.6121.2148.7180.6208.1216.4240.9234.9246.7292.3308.7319.0323.3349.3373.9375.1365.6388.7427.0487.0538.8379.3369.2376.7375.1363.1362.6368.2368.4372.5386.3393.4402.5410.1421.3427.7448.8467.0474.4497.5509.1
529.0536.8543.8545.7560.6566.3593.5
Resi-dential
28.1
26.326.429.032.134.334.232.332.438.742.641.455.869.775.366.062.782.5
110.3131.6141.0123.2122.6105.7152.5179.8186.9218.1227.6232.5231.3215.7191.2225.6251.7287.7289.8232.7222.4210.91969184.3185.9194.3200.3211.3223.7227.1240.1
243.5243.2252.6267.7278.5288.5290.4293.5290.4281.9290.3296.5301.7314.2312.6
Changein
busi-ness
inven-tories
4.2
3.22.96.15.75.09.7
13.810.59.19.52.28.59.9
17.514.1-6.316.923.127.216.9-7.628.2
-14.5-4.967.526.2
9.624.210.931.7
8.0-2.3
7.020.659.537.08.6
41.213.8
-31.4
-16.1-19.9
5.321.4
-.310.211.66.4
19.921.622.018.840.274.564.758.7
58.134.038.217.8-1.78.0
36.6
See next page for continuation of table.
300
Digitized for FRASER http://fraser.stlouisfed.org/ Federal Reserve Bank of St. Louis

TABLE B-l.—Gross domestic product, 1959-96—Continued
[Billions of dollars, except as noted; quarterly data at seasonally adjusted annual rates]
Year orquarter
1959
I960196119621963196419651966196719681969
1970197119721973197419751976197719781979
19801981 ..: :.:19821983198419851986198719881989
199019911992199319941995
1990:1IIIllIV
1991:1IIIllIV
1992:1IIIIIIV
1993:1IIIllIV
1994:1IIIllIV
1995- 1IIIllIV
1996:1IItil
Net exports of goodsand services
Netexports
-1.7
2.43.42.43.35.53.91.91.4
-1.3-1.2
1.2-3.0-8.0
.6-3.113.6-2.3
-23.7-26.1-24.0-14.9-15.0-20.5-51.7
-102.0-114.2-131.5-142.1-106.1-80.4
-71.3-20.5-29.5-62.7-94.4-94.7-74.3-60.3-78.5-72.0-32.9-12.3-22.0-14.8-8.9
-29.0-37.6-42.7-47.9-59.6-74.5-68.8
-78.8-93.0
-107.0-98.7
-108.7-115.3-87.6-67.2
-86.3-99.2
-120.2
Exports
20.6
25.326.027.429.433.635.438.941.445.349.3
57.059.366.291.8
124.3136.3148.9158.8186.1228.7278.9302.8282.6277.0303.1303.0320.7365.7447.2509.3557.3601.8639.4657.8719.1807.4541.6554.8555.5577.3577.4602.7602.6624.4632.4635.9640.2649.1646.9660.4645.3678.7
678.9707.4729.2761.0776.1797.3819.0837.0839.5850 C844.3
Imports
22.3
22.822.725.026.128.131.537.139.946.650.5
55.862.374.291.2
127.5122.7151.1182.4212.3252.7293.8317.8303.2328.6405.1417.2452.2507.9553.2589.7628.6622.3669.0720.5813.5902.0615.9615.1634.1649.2610.3615.0624.5639.3641.3664.9677.8691.8694.8720.0719.8747.5757.6800.4836.1859.6884.8912.6906.6904.2925.8949.2964.5
Government consumption expendituresand gross investment
Total
112.0113.2120.9131.4137.7144.4153.0173.6194.6212.1223.8236.1249.9268.9287.6323.2362.6385.9416.9457.9507.1
572.8633.4684.8735.7796.6875.0938.5992.8
1,032.01,095.11,176.11,225.91,263.81,290.41,314.71,358.31,153.01,164.31,176.91,210.41,220.61,227.41,226.51,229.21,247.91,256.41,270.71,280.01,279.31,285.11,294.11,303.21,296.41.300.J1,328.21,333.51,345.81,359.41,364.61,363.41,383.71,408.81,414.8
Federal
Total
67.2
65.669.176.578.179.481.894.1
106.6113.8115.8115.9117.1125.1128.2139.9154.5162.7178.4194.4215.0248.4284.1313.2344.5372.6410.1435.2455.7457.3477.2503.6522.6528.0522.6516.4516.6496.4500.1501.2516.7525.6528.2520.9515.5521.8523.2532.0535.0525.5520.1521.3523.5511.3509.4523.8520.9519.7522.0516.8507.7
518.6529.6525.5
Nation-al
de-fense
55.7
54.957.762.362.261.362.073.485.592.092.4
90.688.793.294.7
101.9110.9116.1125.8135.6151.2174.2202.0230.9255.0282.7312.4332.4350.4354.0360.6373.1383.5375.8362.7352.0345.5369.7370.6368.9383.3389.7389.3382.1373.0372.8374.1380.9375.3365.7362.7361.2361.3346.7349.3362.3349.7347.6351.7345.7337.1
343.9353.7348.8
Non-de-
fense
11.5
10.811.414.215.918.119.720.721.021.823.4
25.328.331.933.538.043.646.652.658.963.8
74.282.282.389.489.997.7
102.9105.3103.3116.7130.4139.1152.2159.9164.3171.0126.7129.5132.3133.3136.0138.9138.8142.6149.0149.1151.1159.7159.8157.4160.1162.2
164.6160.0161.5171.2
172.1170.3171.1170.6174.7175.8176.7
Stateandlocal
44.8
47.651.855.059.665.071.279.588.198.3
108.0120.2132.8143.8159.4183.3208.1223.1238.5263.4292.0324.4349.2371.6391.2424.0464.9503.3537.2574.7617.9672.6703.4735.8767.8798.4841.7656.6664.2675.7693.7695.0699.2705.5713.6726.1733.2738.7745.1753.8765.0772.7779.7785.0791.4804.4812.6
826.1837.3847.7855.7
865.1879.2889.3
Finalsales ofdomes-
ticproduct
503.0523.3541.9579.1611.7658.0709.4774.0823.1901.4972.7
1,033.41,116.91,227.41,365.21,482.81,636.91,802.02,003.82,264.22,540.62,791.93,087.83,256.63,519.43,835.04,154.54,412.64,668.15,038.75,407.05,735.85,919.06,237.46,532.46,876.27,216.75,651.85,709.85,768.75,812.95,838.25,912.25,944.75,980.96,122.16,191.06,260.16,376.66,422.86,484.66,552.36,669.86,735.96,816.06,928.57,024.67,091.77,170.97,271.57,332.87,428.67,537.17,579.6
Grossdomes-
ticpur-
chases '
508.9524.1541.5582.8614.1657.6715.3785.9832.2911.8983.4
1,034.41,128.41,245.31,382.01,500.01,617.11,821.22,050.52,317.52,581.52,799.13,130.93,262.63,566.24,004.54,294.94,553.74,834.55,155.65,519.15,815.15,937.26,274.06,615.77,030.17,348.45,734.75,811.35,861.05,853.55,855.05,904.65,972.06,017.16,130.76,230.26,309.36,425.76,490.56,565.86,648.86,757.4
6,854.86,983.57,100.17,181.97,258.47,320.27,397.37,417.87,513.27,644.37,736.5
Adden-dum:Gross
nationalprod-uct'
510.1529.8548.4589.4621.9668.0724.5793.0839.1916.7988.4
1,042.01,133.11,246.01,395.41,512.61,643.91,836.12,047.52,313.52,590.42,819.53,150.63,273.23,546.53,933.54,201.04,435.14,701.35,062.65,452.85,764.95,932.46,255.56,563.56,931.97,246.75,681.45,767.85,796.85,813.65,849.05,904.55,959.46,016.66,138.36,212.26,281.16,390.56,458.66,516.56,587.16,691.96,781.06,888.36,987.07,071.4
7,146.87,202.47,293.47,344.37,426.67,537.57,598.9
Percent changefrom preceding
period
Grossdomes-
ticprod-uct
3.83.57.45.57.48.59.55.89.27.95.48.79.9
11.78.38.9
11.511.413.011.6
8.911.94.18.4
11.07.15.86.17.67.7
5.63.05.54.95.84.69.16.62.2
2.84.94.03.68.25.34.67.33.84.04.37.1
5.36.96.15.33.83.16.02.34.26.53.8
Grossdomes-
ticpur-
chases '
3.03.37.65.47.18.89.95.99.67.85.29.1
10.411.08.57.8
12.612.613.011.4
8.411.94.29.3
12.37.36.06.26.67.05.42.15.75.46.34.58.85.53.5
it4.63.17.86.75.27.64.14.75.26.7
5.97.76.84.7
4.33.44.31.15.27.24.9
1 Gross domestic product (GDP) less exports of goods and services plus imports of goods and services.2 GDP plus net receipts of factor income from rest of the world.Source: Department of Commerce, Bureau of Economic Analysis.
301
Digitized for FRASER http://fraser.stlouisfed.org/ Federal Reserve Bank of St. Louis

TABLE B-2.—Real gross domestic product, 1959-96
[Billions of chained (1992) dollars, except as noted; quarterly data at seasonally adjusted annual rates]
Year orquarter
1959I96019611962196319641965196619671968196919701971197219731974197519761977197819791980198119821983198419851986 III!"198719881989199019911992199319941995
1990:1IIIllIV
1991-1IIIIIIV
1992-.II IIllIV
1993:1IIIllIV
1994:1IIIllIV
1995:|III l lIV
1996-1IIIll
Grossdomesticproduct
2,212.32,261.72,309.82,449.12,554.02,702.92,874.83,060.23,140.23,288.63,388.03,388.23,500.13,690.33,902.33,888.23,865.14,081.14,279.34,493.74,624.04,611.94,724.94,623.64,810.05,138.25,329.55,489.95,648.45,862.96,060.4
6,138.76,079.06,244.46,386.46,608.76,742.96,154.16,174.46,145.26,081.06,047.96,074.16,089.36,104.4
6,175.36,214.26,260.96,327.36,326.46,356.56,393.46,469.1
6,508.56,587.66,644.96,693.9
6,701.06,713.56,776.46,780.7
6,814.36,892.66,928.4
Personal consumption expenditures
Total
1,394.61,432.61,461.51,533.81,596.61,692.31,799.11,902.01,958.62,070.22,147.52,197.82,279.52,415.92,532.62,514.72,570.02,714.32,829.82,951.63,020.23,009.73,046.43,081.53,240.63,407.63,566.53,708.73,822.33,972.74,064.64,132.24,105.84,219.84,339.54,473.24,577.84,128.94,134.74,148.54,116.4
4,084.54,110.04,119.54,109.14,173.84,196.44,226.74,282.34,289.74,318.84,359.54,390.0
4,420.54,458.74,489.44,524.0
4,534.84,569.94,597.34,609.4
4,649.14,687.64,693.5
Durablegoods
103.1105.2101.2113.0124.0135.5152.6165.5168.1186.6193.3187.0205.7231.9255.8238.2238.1268.5293.4308.8307.3282.6285.8285.5327.4374.9411.4448.4454.9483.5496.2
493.3462.0488.5524.1562.0579.8511.2495.4490.4476.3458.6460.5467.3461.5476.1481.1491.9505.0
506.0519.6528.9541.9549.6555.4563.1579.8
566.5576.2589.1587.5
599.2615.6611.6
Non-durablegoods
606.3615.4626.7646.5660.0692.5729.3769.2781.4816.9838.6859.1874.5912.9942.9924.5938.3984.8
1,010.41,045.71,069.7
1,065.11,074.31,080.61,112.41,151.81,178.31,215.91,239.31,274.41,303.51,316.11,302.91,321.81,348.81,390.51,421.91,319.21,316.91,319.81,308.4
1,300.61,308.01,307.11,295.71,314.41,312.01,321.11,339.8
1,336.91,344.51,354.01,359.9
1,372.91,383.91,397.01,408.11,416.61,422.91,424.71,423.2
1,436.11,440.91,442.2
Services
687.4717.4746.5783.4818.7868.4914.6961.0
1,007.61,059.61,110.81,155.41,197.91,262.51,319.41,351.21,398.31,457.11,518.21,589.31,639.81,670.71,696.11,728.21,809.01,883.01,977.32,041.42,126.92,212.42,262.32,321.32,341.02,409.42,466.72,521.42,577.02,295.72,321.12,337.32,331.22,325.32,341.52,345.02,352.02,383.22,403.22,413.62,437.6
2,446.82,454.92,476.72,488.5
2,498.52,519.92,530.02,537.3
2,552.52,571.62,584.62,599.32,614.72,632.32,640.6
Gross private domestic investment
Total
274.2
270.5265.2298.5318.1344.6392.5423.5406.9429.8454.4
419.5467.4522.1583.5544.4440.5536.6627.1686.0704.5626.2689.7590.4647.8831.6829.2813.8820.5826.0861.9817.3737.7790.4857.3979.6
1,010.2844.1856.1820.8748.1725.5718.0744.9762.4
757.9792.8798.6812.4834.8843.2857.6893.5
933.6984.8994.2
1,005.91,023.7
996.81,015.21,004.9
1,011.91,038.61,093.4
Fixed investment
Total
267.1269.2267.9292.0313.7343.7378.5399.1391.0418.1442.9432.1464.9,520.3567.5530.2471.0517.6593.7660.8695.6648.4660.6610.4654.2762.4799.3805.0799.4818.3832.0805.8741.3783.4836.4921.1975.9834.7811.2803.1774.4
742.6739.4741.0742.0758.3782.4787.3805.8815.4821.1835.4873.5
892.4911.4930.8949.7
969.5965.7980.0988.5
1,013.31,031.11,057.5
Nonresidential
Total
147.7155.9154.5168.0176.4197.1231.3259.4255.3266.4285.6282.8282.4307.7352.5354.4317.3332.6371.8422.6463.3461.1485.7464.3456.4535.4568.4548.5542.4566.0588.8585.2547.7557.9593.6652.1714.3595.3583.4588.1573.9555.1550.9545.3539.5544.4557.5560.6569.1577.5586.4593.1617.6628.5639.5660.5679.7
704.4710.5719.0723.3
743.5750.5781.4
Struc-tures
85.892.693.998.199.2
109.5126.9135.6132.2134.1141.3141.7139.4143.7155.4152.2136.2139.6146.4162.3182.7195.0210.4207.2185.7212.2227.8203.3195.9196.8201.2203.3181.6169.2166.3168.8181.1206.5205.5205.2196.0192.2187.2175.5171.4172.7171.0167.4165.6167.0164.8165.1168.2163.0169.0169.1174.3178.5180.0182.8183.2186.6184.9188.6
Pro-ducers'durableequip-ment
71.474.372.581.087.198.1
115.9133.8132.5140.5152.2149.5150.7169.8201.2205.4183.9195.2225.6259.6280.7
268.2278.2260.3272.4324.6342.4345.9346.9369.2387.6
381.9366.2388.7427.6484.1534.5388.8377.8383.0377.9362.9363.8369.8368.1371.7386.4393:1403.5
410.5421.7428.2449.8
466.4471.1492.5506.5527.2531.7537.4541.4558.3567.5595.0
Resi-dential
131.1121.8122.2133.9149.6158.3153.7140.0135.6154.0158.6149.1190.0223.7222.3176.4153.5189.7229.8245.0236.0186.1171.2140.1197.6226.4229.5257.0257.6252.5243.2
220.6193.4225.6242.7268.9262.8239.4227.8214.9200.3187.4188.3195.6202.4
213.9224.9226.7236.7
237.9234.8242.2255.8
263.6271.6270.3270.3
265.9256.5262.2266.3271.1281.5277.8
Changein
busi-ness
inven-tories
13.510.68.9
20.018.115.630.242.332.126.927.25.7
22.725.239.024.0
-11.029.038.042.323.1
-10.033.1
-15.6-5.974.829.810.926.211.633.310.4-3.0
7.319.158.933.111.043.814.9
-28.2-17.5-20.8
4.921.4
in12.15.8
18.520.819.517.4
40.574.564.556.154.530.533.014.6-3.0
7.134.5
See next page for continuation of table.
302
Digitized for FRASER http://fraser.stlouisfed.org/ Federal Reserve Bank of St. Louis

TABLE B-2.—Real gross domestic product, 1959-96—Continued
[Billions of chained (1992) dollars, except as noted; quarterly data at seasonally adjusted annual rates]
Year orquarter
1959I9601961196219631964 .. .19651966196719681969
19701971197219731974197519761977 . .1978197919801981 .19821983 ....198419851986198719881989199019911992199319941995
1990:1IIIIIIV
1991:1IIIllIV
1992:1II ..IllIV
1993:1IIIllIV
1994:1II ..IllIV
1995:1IIIll .w .............
1996:1IIIll
Net exports of goodsand services
Netexports
-34.8-21.3-19.1-26.5-22.7-15.9-27.4-40.9-50.1-67.2-71.3-65.0-75.8-88.9-63.0-35.6-7.2
-39.9-64.2-65.6-45.3
10.15.6
-14.1-63.3
-127.3-147.9-163.9-156.2-114.4-82.7-61.9-22.3-29.5-72.0
-105.7-107.6-67.1-66.7-71.2-42.5-24.3-17.1-29.8-17.9-14.8-32.5-30.8-40.0-56.0-64.4-86.2-81.5-99.3
-107.3-111.7-104.3-122.5-121.4-101.6-343
-104.0-114.7-137.4
Exports
il*86.888.393.0
100.0113.3115.6123.4126.1135.3142.7158.1159.2172.0209.6229.8228.2241.6247.4273.1299.0331.4335.3311.4303.3328.4337.3362.2402.0465.8520.2564.4599.9639.4658.2712.0775.4555.2566.8561.8573.9572.3600.3603.6623.5633.0635.8639.7649.1647.1660.0645.5
. 680.3677.6703.1719.6747.6752.3763.2783.0803.1806.7817.9816.1
Imports
106:6108.1107.3119.5122.7129.2143.0164.2176.2202.5214.0223.1235.0261.0272.6265.3235.4281.5311.6338.6344.3321.3329.7325.5366.6455.7485.2526.1558.2580.2603.0626.3622.2669.0730.2817.6883.0622.3633.5633.0616.4596.6617.4633.4641.4647.8668.3670.5689.1703.1724.4731.7761.8777.0810.4831.3851.9874.9884.6884.5888.0910.7932.6953.5
Government consumption expendituresand gross investment
Total
-618.5617.2647.2686.0701.9715.9737.6804.6865.6892.4887.5866.8851.0854.1848.4862.9876.3876.8884.7910.6924.9941.4947.7960.1987.3
1,018.41,080.11,135.01,165.91,180.91,213.91,250.41,258.01,263.81,261.01,260.01,260.21,246.51,248.21,246.81,259.91,262.61,263.81,255.11,250.71,258.51,257.51,266.51,272.51,257.71,258.41,261.61,266.21,252.41,249.81,271.21,266.61,262.71,265.11,263.41,249.61,254.71,278.21,276.1
Federal
Total
360.5349.4363.0393.2391.8385.2385.2429.1471.7476.3459.9427.2397.0390.2371.1368.8367.9364.3370.1377.7383.3399.3415.9429.4452.7463.7495.6518.4534.4524.6531.5541.9539.4528.0509.2489.8472.3542.9543.0538.2543.5547.3547.1536.3526.9525.1523.3529.6534.0516.1509.7505.9505.0489.9483.3496.7489.2481.0479.4472.5456.2462.9473.4469.3
Nation-al
de-fense
307.6301.3313.8332.4324.0309.9303.8348.2393.5400.9381.6349.0313.7300.3281.2273.5269.7264.7266.4266.7271.0280.7296.0316.5334.6348.1374.1393.4409.2405.5401.6401.5397.5375.8355.4337.0319.6404.1402.8396.1403.1408.4405.0395.0381.7374.2373.3378.7376.8361.6356.9351.6351.2334.8335.5346.2331.3325.0325.5319.1308.8311.9319.4314.9
Non-de-
fense
58.854.155.566.872.979.284.685.784.782.584.383.086.391.991.596.499.1
100.4104.3111.4112.7119.0120.4113.3118.5115.9121.8125.2125.3119.1130.1140.5142.0152.2153.8152.6152.3138.9140.4142.2140.5139.0142.2141.4145.3150.8150.0150.9157.1154.4152.7154.2153.7154.9147.8150.4157.5155.6153.5153.1147.0150.6153.7153.9
Stateandlocal
256.8267.2283.8292.1309.7330.9353.2375.9394.2416.5428.0440.0454.4464.5478.5495.6510.0514.3516.4534.7543.5543.6532.8531.4534.9555.0584.7616.9631.8656.6682.6708.6718.7735.8751.8770.5788.6703.8705.4708.7716.5715.5716.8718.8723.8733.5734.2736.9738.5741.6748.8755.7761.3762.7766.8774.7777.7782.2786.3791.5794.4792.6805.5807.7
Finalsales ofdomes-
ticproduct
2,206.92,264.22,318.02,445.42,552.42,705.12,860.43,033.53,125.13,278.03,377.23,406.53,499.83,689.53,883.93,873.43,906.44,061.74,240.84,464.44,614.44,641.94,691.64,651.24,821.25,061.65,296.95,480.95.626.05,855.16,028.76,126.76,082.66,237.46,365.56,550.76,708.96,144.66,127.56,126.66,108.16,065.46,095.96,085.46,083.86,175.86,203.86,249.56,320.76,307.16,334.56,371.36,449.26,467.76,514.96,582.16,638.16,647.46,682.46,741.46,764.26,815.26,884.76,892.7
Grossdomes-
ticpur-
chases1
2,270.42.303.12,349.72,497.42,598.92,740.52,925.93,124.93,214.23,377.43,480.13,469.13,592.53,794.03,975.23,925.73,867.24,122.94,351.54,565.74,668.24,578.64,697.34,622.74,870.75,274.45,488.85,666.15,815.75,983.96,146.16,202.16,101.16,274.06,457.66,711.86,847.16,222.96,242.96,218.46,124.36,072.26,091.16,119.16,122.36,190.06,246.86,291.96,367.36,382.16,420.46,478.66,549.36,605.96,692.36,753.76,795.36,819.86,830.96,874.86,862.96,914.67,003.07,060.7
Adden-dum.Gross
nationalprod-uct2
2,224.32,274.82,324.62,465.92,572.02,722.32,895.23,078.93,159.43,309.23,407.83,407.73,522.23,714.33,936.03,927,13,894.54,116.94,320.24,534.44,680.84,667.74,774.14,665.44,851.25,176.15,352.75,503.45,657.25,876.26,074.06,159.46,094.46,255.56,397.16,606.06,737.16,174.36,190.86,158.86,113.46,074.86,085.86,098.36,118.76,191.66,225.16,270.46,334.86,342.56,366.96,406.36,472.56,514.06,586.26,640.06,683.56,699.16,711.96,762.06,775.«6,814.96,886.56,913.7
Percent changefrom preceding
period
Grossdomes-
ticprod-uct
2.22.16.04.35.86.46.42.64.73.0
.03.35.45.7
"!65.64.95.02.9-.32.5
-2.14.06.83.73.02.93.83.41.3
-1.02.72.33.52.04.11.3
-1.9-4.1-2.2
1.71.01.04.72.53.04.3
L92.34.82.54.93.53.0
.4
3J
2.04.72.1
Grossdomes-
ticpur-
chases1
1.42.06.34.15.46.86.82.95.13.0
ie5.64.8
-1.2-1.5
6.65.54.92.2
-1.92.6
-1.65.48.34.13.22.62.92.7
.9-1.6
2.82.93.92.03.21.3
-1.6-5.9-3.4
1.21.9
4.53.72.94.9
.92.43.74.43.55.33.72.51.4
2.6
3.05.23.3
1 Gross domestic product (GOP) less exports of goods and services plus imports of goods and services.2 GDP plus net receipts of factor income from rest of the world.Source: Department of Commerce, Bureau of Economic Analysis.
303
Digitized for FRASER http://fraser.stlouisfed.org/ Federal Reserve Bank of St. Louis

TABLE B-3.—Chain-type price indexes for gross domestic product, 1959-96
[Index numbers, 1992=100, except as noted; quarterly data seasonally adjusted]
Year orquarter
195919601961 . ...196219631964196519661967196819691970 . .19711972197319741975197619771978197919801981198219831984198519861987 .198819891990199119921993199419951990:1
IIIllIV
1991-1IIIllIV
1992:1IIIllIV
1993:1IIIIIIV
1994:1IIHIIV
1995:1IIIll . .IV
1996:1IIHI
Grossdomes-
ticproduct
23.023.323.623.924.224.625.025.726.627.729.030.632.133.535.438.542.244.647.550.955.360.466.170.273.275.978.680.683.186.189.793.697.3
100.0102.6105.0107.692.093.294.295.196.397.097.798.399.199.8
100.2100.9-
101.8102.4102.8103.4104.1104.6105.2105.8106.7107.3107.9108.4109.0109.6110.2
Personal consumption expenditures
Total
22.823.223.423.724.024.324.725.326.027.028.229.530.831.933.637.040.042.345.148.452.858.563.767.470.573.175.878.081.084.388.492.996.8
100.0102.6105.1107.691.092.293.594.995.796.497.198.098.999.7
100.3101.1101.8102.5102.8103.5104.1104.7105.5106.1106.7107.5107.8108.3108.9109.8110.2
Durablegoods
41.441.241.341.541.641.841.441.341.943.344.545.447.147.648.351.356.059.261.765.269.675.680.683.885.586.787.888.991.693.395.396.698.5
100.0101.3103.4104.696.596.496.596.997.998.498.899.199.6
100.1100.1100.2100.5101.1101.5101.9102.4103.2104.0103.9104.7104.8104.5104.3104.6104.1104.0
Non-durablegoods
24.524.825.025.225.525.826.327.127.828.930.231.732.633.736.441.644.846.549.252.658.365.370.672.874.676.778.778.781.884.889.394.698.1
100.0101.5102.8104.592.693.495.297.497.597.898.298.799.299.7
100.4100.7101.3101.5101.3101.9102.0102.4103.3103.6103.9104.5104.7105.0106.0107.3107.3
Services
18.519.019.319.619.920.320.721.322.023.023.925.226.727.929.231.434.036.539.542.646.151.056.260.864.968.271.675.378.282.286.691.295.8
100.0103.6106.7109.989.190.792.093.194.395.296.297.498.699.6
100.3101.5102.4103.3103.9104.7105.6106.2107.1107.9108.8109.7110.3110.9111.5112.4113.2
Gross private domestic investment
Total
29.629.729.729.729.629.830.230.831.632.834.435.837.639.341.345.351.053.857.562.468.074.581.485.685.486.087.089.091.093.596.198.499.7
100.0101.7103.6105.497.698.098.699.399.799.799.799.799.699.8
100.1100.5101.0101.6101.9102.1102.8103.3104.0104.3104.6105.3105.8105.9105.8105.8106.4
Fixed investment
Total
27.928.128.028.028.028.128.629.230.131.332.934.336.037.639.743.749.252.156.261.166.773.079.984.584.485.086.288.690.493.295.998.299.6
100.0101.7103.7105.497.597.998.599.199.699.699.799.699.699.8
100.1100.5101.0101.6102.0102.2102.8103.4104.1104.4104.6105.2105.8105.9105.9106.0106.6
Presidential
Total
31.531.631.531.531.531.732.132.533.434.636.037.839.641.042.646.853.356.360.064.469.776.083.588.387.587.588.390.291.393.796.298.499.9
100.0100.9102.3103.497.698.098.799.4
100.199.999.899.999.999.9
100.1100.1100.5100.8101.0101.1101.6102.2102.8102.7102.7103.4103.8103.7103.7103.7104.2
Struc-tures
21.221.121.021.221.421.722.323.123.825.026.728.430.632.835.440.245.047.250.956.362.968.778.284.482.282.984.986.587.992.195.6
1%100.0103.3106.7110.297.898.599.299.7
100.1100.2100.499.799.399.7
100.1100.9101.9103.0103.8104.6105.5106.0107.1108.4109.0109.8110.8111.3111.7112.2113.2
Pro-ducers'durableequip-ment
39.740.039.939.739.539.539.639.740.641.742.944.545.946.547.350.958.662.265.969.674.180.786.690.290.690.090.192.293.294.696.498.299.8
100.099.9
100.6100.897.597.798.499.3
100.199.899.599.9
100.2100.0100.199.899.999.999.999.8
100.1100.7101.1100.5100.3100.9101.2100.9100.7100.6100.9
Resi-dential
21.421.621.621.621.521.622.323.123.925.126.927.729.431.133.937.440.943.548.053.759.766.271.675.577.279.481.584.988.392.195.197.898.8
100.0103.7107.0110.397.297.698.198.398.498.799.399.098.899.5
100.2101.5102.3103.6104.3104.7105.7106.2107.4108.6109.2109.9110.7111.3111.3111.7112.6
See next page for continuation of table.
304
Digitized for FRASER http://fraser.stlouisfed.org/ Federal Reserve Bank of St. Louis
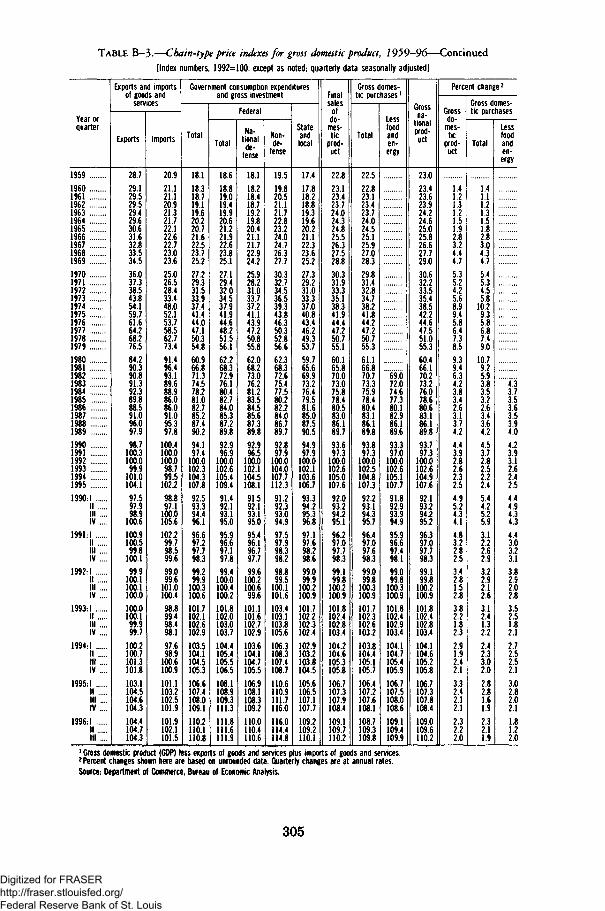
TABLE B-3-—Chain-type price indexes for gross domestic product, 1959-96—Continued
[Index numbers, 1992=100, except as noted; quarterly data seasonally adjusted]
Year orquarter
19591960196119621963196419651966196719681969197019711972197319741975197619771978197919801981198219831984198519861987198819891990199119921993199419951990:1
IIIll ....IV ....
1991:1IIIll ....IV ....
1992:1IIIll ....IV ....
1993:1IIIll ....IV ....
1994:1IIIll ....IV ....
1995:1IIIll ....IV ....
1996:1
Ill '""
Exports and imports
services
Exports
28.729.129.529.529.429.630.631.632.833.534.536.037.338.543.854.159.761.664.268.276.584.290.390.891.392.389.888.591.096.097.998.7
100.3100.0
99.9101.0104.1
97.597.998.9
100.6100.9100.5
99.8100.199.9
100.1100.1100.0100.0100.1
99.999.7
100.2100.7101.3101.8103.1104.5104.6104.3104.4104.7104.3
Imports
20.921.121.120.921.321.722.122.622.723.023.625.026.528.433.448.052.153.758.562.773.491.496.493.189.688.986.086.091.095.397.8
100.4100.0100.098.799.5
102.298.897.1
100.0105.6102.299.798.599.699.099.6
101.0100.498.899.498.498.197.698.9
100.6100.9101.1103.2102.5101.9101.9102.1101.5
Government consumption expendituresand gross investment
Total
18.118.318.719.119.620.220.721.622.523.725.227.229.331.533.937.441.444.047.150.354.860.966.871.374.578.281.082.785.287.490.294.197.4
100.0102.3104.3107.892.593.394.496.196.697.297.798.399.299.9
100.3100.6101.7102.1102.6102.9103.5104.1104.5105.3106.6107.4108.0109.1110.2110.1110.8
Cp/faralrcucfdl
Total
18.618.819.019.419.920.621.221.922.623.825.127.129.432.034.537.941.944.648.251.556.162.268.372.976.180.482.784.085.387.289.892.996.9
100.0102.6105.4109.4
91.492.193.195.095.996.697.197.899.4
100.0100.4100.2101.8102.0103.0103.7104.4105.4105.5106.5108.1108.9109.3111.3111.8111.6111.9
Na-tionaldp.ue-
fense
18.118.218.418.719.219.820.421.121.722.924.225.928.231.033.737.241.143.947.250.855.862.068.273.076.281.283.584.585.687.389.892.996.5
100.0102.1104.5108.1
91.592.193.195.095.496.196.797.799.6
100.2100.699.6
101.1101.6102.7102.9103.6104.1104.7105.5106.9108.1108.3109.2110.0110.4110.6
Non-de-
fense
19.519.820.521.121.722.823.224.024.726.327.730.332.734.536.539.343.846.350.352.856.662.368.372.675.477.580.282.284.086.789.792.897.9
100.0104.0107.7112.391.292.393.094.997.597.998.398.298.899.5
100.1101.6103.4103.1103.8105.6106.3108.3107.4108.7110.6110.9111.7116.0116.0114.4114.8
Stateandlocal
17.417.818.218.819.319.620.221.122.323.625.227.329.231.033.337.040.843.446.249.353.759.765.669.973.276.479.581.685.087.590.594.997.9
100.0102.1103.6106.7
93.394.295.396.897.197.698.298.699.099.9
100.2100.9101.7102.2102.3102.4102.9103.2103.8104.5105.6106.5107.1107.7109.2109.2110.1
Final
ni01rtn-uu-
mes-tic
prod-uct
22.823.123.423.724.024.324.825.526.327.528.830.331.933.335.138.341.944.447.250.755.160.165.870.073.075.878.480.583.086.189.793.697.3
100.0102.6105.0107.692.093.294.295.196.297.097.798.399.199.8
100.2100.9101.8102.4102.8103.4104.2104.6105.3105.8106.7107.3107.9108.4109.1109.7110.2
Gross domes-tic purchases
Total
22.522.823.123.423.724.024.525.125.927.028.329.831.432.834.738.241.844.247.250.755.361.166.870.773.375.978.480.483.186.189.893.897.3
100.0102.5104.8107.3
92.293.194.395.796.497.097.698.399.099.8
100.3100.9101.7102.3102.6103.2103.8104.4105.1105.7106.4107.2107.6108.1108.7109.3109.8
Lessfoodanden-ergy
"69'.072.074.677.380.182.986.189.693.397.0
100.0102.6105.1107.791.892.993.994.995.996.697.498.199.099.8
100.3100.9101.8102.4102.9103.4104.1104.7105.4105.9106.7107.5108.0108.6109.1109.4109.9
Grossna-
tionalprod-uct
23.023.423.623.924.224.625.025.826.627.729.030.632.233.535.438.542.244.647.551.055.360.466.170.273.276.078.680.683.186.189.893.797.3
100.0102.6104.9107.6
92.193.294.295.296.397.097.798.399.199.8
100.2100.9101.8102.4102.8103.4104.1104.6105.2105.8106.7107.3107.8108.4109.0109.6110.2
Percent change 2
«uiOSSdo-
mes-tic
prod-uct
1.41.21.31.21.51.92.83.24.44.75.35.24.25.68.99.45.86.47.38.59.39.46.34.23.83.42.63.13.74.24.43.92.82.62.32.54.95.24.34.14.83.22.82.53.42.81.52.83.82.21.82.32.91.92.42.13.32.42.12.12.32.22.0
Gross domes-tic purchases
Total
1.41.11.21.31.51.82.83.04.34.75.45.34.55.8
10.29.35.86.87.49.0
10.79.25.93.83.53.22.63.43.64.24.53.72.82.52.22.45.44.25.25.93.12.22.62.93.22.92.12.63.12.41.32.22.42.33.02.02.82.81.61.92.32.11.9
Lessfoodanden-
ergy
4"33.73.53.63.53.94.04.23.93.12.62.42.54.44.94.34.34.43.03.23.13.82.92.02.83.52.51.82.12.72.52.52.13.02.82.02.11.81.22.0
1 Gross domestic product (GDP) less exports of goods and services plus imports of goods and services.2 Percent changes shown here are based on unrounded data. Quarterly changes are at annual rates.Source: Department of Commerce, Bureau of Economic Analysis.
305
Digitized for FRASER http://fraser.stlouisfed.org/ Federal Reserve Bank of St. Louis

TABLE B-4.—Quantify and price indexes for gross domestic product, and percent changes, 1959-96
[Quarterly data are seasonally adjusted]
Year or quarter
1959I96019611962 .196319641965196619671968196919701971197219731974197519761977197819791980 .1981198219831984198519861987198819891990199119921993199419951990-1
||IIIIV
1991-1IIIllIV
1992-1III I IIV
1993-1IIIllIV
1994-1IIIllIV
1995-1IIIllIV
1996:1IIIII
Gross domestic product
Index numbers, 1992=100
Currentdollars
8.18.48.79.49.9
10.611.512.613.314.615.716.618.019.822.124.026.129.132.536.741.044.649.951.956.362.567.070.875.180.987.192.094.8
100.0104.9111.1116.2
90.692.192.692.693.294.495.396.198.099.3
100.4102.2103.2104.2105.3107.1108.5110.3112.0113.4114.5115.4117.1117.7118.9120.8122.0
Chain-typequantity
index
35.436.237.039.240.943.346.049.050.352.754.354.356.159.162.562.361.965.468.572.074.173.975.774.077.082.385.387.990.593.997.198.397.3
100.0102.3105.8108.098.698.998.497.496.997.397.597.898.999.5
100.3101.3101.3101.8102.4103.6104.2105.5106.4107.2107.3107.5108.5108.6109.1110.4111.0
Chain-typeprice index
23.023.323.623.924.224.625.025.726.627.729.030.632.133.535.438.542.244.647.550.955.360.466.170.273.275.978.680.683.186.189.793.697.3
100.0102.6105.0107.6
92.093.294.295.196.397.097.798.399.199.8
100.2100.9101.8102.4102.8103.4104.1104.6105.2105.8106.7107.3107.9108.4
109.0109.6110.2
Implicitprice
deflator
22.923.323.623.924.224.525.025.726.527.729.030.632.233.535.438.542.244.647.451.055.360.465.970.173.175.978.480.683.186.189.793.697.3
100.0102.6104.9107.692.093.194.195.196.397.097.798.399.199.8
100.2100.9101.8102.4102.8103.4104.1104.6105.2105.8106.7107.3107.9108.4
109.0109.5109.9
Percent change from preceding period '
Currentdollars
3.83.57.45.57.48.59.55.89.27.95.48.79.9
11.78.38.9
11.511.413.011.68.9
11.94.18.4
11.07.15.86.17.67.75.63.05.54.95.84.69.16.62.2-.12.84.94.03.68.25.34.67.33.84.04.37.15.36.96.15.33.83.16.02.34.26.53.8
Chain-typequantity
index
2.22.16.04.35.86.46.42.64.73.0
.03.35.45.7-.4-.65.64.95.02.9-.32.5
-2.14.06.83.73.02.93.83.41.3
-1.02.72.33.52.04.11.3
-1.9-4.1-2.2
1.71.01.04.72.53.04.3-.11.92.34.82.54.93.53.0
.4
3.B
2.04.72.1
Chain-typeprice index
1.41.21.31.21.51.92.83.24.44.75.35.24.25.68.99.45.86.47.38.59.39.46.34.23.83.42.63.13.74.24.43.92.82.6
II4.95.24.34.14.83.22.82.53.42.81.52.83.82.21.82.32.91.92.42.13.32.42.12.12.32.22.0
Implicitprice
deflator
1.51.31.31.21.52.02.93.14.34.75.45.24.35.78.79.65.66.37.78.59.29.26.34.23.93.32.73.13.74.24.34.02.72.6
II4.95.24.24.25.13.12.92.53.32.71.52.93.82.11.92.22.81.92.52.23.42.42.12.02.21.81.7
1 Percent changes shown here are based on unrounded data. Quarterly percent changes are at annual rates.
Source: Department of Commerce, Bureau of Economic Analysis.
306
Digitized for FRASER http://fraser.stlouisfed.org/ Federal Reserve Bank of St. Louis

TABLE B-5.—Percent changes in real gross domestic product, 1960-96
[Percent change from preceding period; quarterly data at seasonally adjusted annual rates]
Year orquarter
1960 . . .196119621963196419651966196719681969
197019711972197319741975197619771978 ::::..:.::....:1979
1980 . . .198119821983198419851986198719881989
199019911992199319941995
1990:1IIIllIV
1991:1IIIllIV
1992:1IIIllIV
1993:1||IllIV
1994-1IIIIIIV
1995:1IIIllIV
1996-1IIIll
Grossdomes-
ticproduct
2.22.16.04.35.86.46.42.64.73.0
.03.35.45.7-.4-.65.64.95.02.9
£5-2.1
4.06.83.73.02.93.83.41.3
-1.02.72.33.52.04.11.3
-1.9-4.1
-2.21.71.01.04.72.53.04.3
1:92.34.82.5493.53.0
.4
3i8
2.04.72.1
Personal consumptionexpenditures
Total
2.72.04.94.16.06.35.73.05.73.7
2.33.76.04.8
2.25.64.34.32.3
L21.25.25.24.74.03.13.92.31.7-.62.82.83.12.33.4
U-3.1
-3.12.5
.9-1.0
6.42.22.95.4
.72.73.82.8
2.83.52.83.1
1.03.12.41.1
3.53.4
Dura-ble
goods
2.0-3.811.79.79.2
12.78.51.6
11.03.6
-3.210.012.710.3-6.9
.012.89.35.3
-8.01.2
14>14.59.79.01.56.32.6-.6
-6.45.87.37.23.2
16.3-11.8-4.0
-11.0-14.1
1.76.1
-4.9
13.34.39.3
11.0
.811.2
7.310.2
5.8435.6
12.4
-8.97.09.3
-1.0
8.211.4-2.6
Non-dura-ble
goods
1.51.83.12.14.95.35.51.64.52.72.41.84.43.3
-2.01.55.02.63.52.3-.4
.9
.62.93.52.33.21.92.82.31.0
-1.01.52.03.12.31.3
~9-3.4
-2.42.3
-3.4
5.9-.72.85.8-.92.32.81.7
3.9323.83.22.41.8.5
-.4
3.71.3
Serv-ices
4.44.14.94.56.15.35.14.85.24.8
4.03.75.44.52.43.54.24.24.73.21.91.51.94.74.1
35i4.24.02.32.6.8
2.92.42.22.21.74.52.8
-1.0
-1.02.8
.61.25.43.41.74.01.51.33.61.91.63.51.61.22.43.02.02.32.42.71.3
Gross private domesticinvestment
Nonresidential fixed
Total
5.6-.98.75.0
11.817.312.1-1.6
4.37.2
-1.0
w14.6
-,oi4.8
11.813.79.6
?3-4.4-1.717.36.2
-3.5-1.1
4.44.0-.6
-6.41.96.49.89.54.5
-7.8
-8-12.5-3.0-4.0-4.1
3.610.02.26.26.06.34.7
17.5
7.371
13.812.2
15.43.54.92.5
11.63.8
17.5
Struc-tures
7.91.44.51.1
10.415.96.8
-2.51.45.4
-lie3.18.2
-2.1-10.5
2.54.9
10.912.6
6.77.9
-1.5-10.4
14.37.3
-10.8-3.6
2.21.1
-10.7-6.8-1.7
1.57.36.8
-1.9
-16i6-7.7
-10.0-22.7-8.9
2.9-3.9-8.1-4.3
3.5-5.3
.87.5
-11.815.7
13iO
9.93.46.31.07.7
-3.78.4
Pro-ducers'dura-
bleequip-ment
4.1-2.411.67.6
12.618.215.5-1.0
6.18.3
-1.8.8
12.718.52.1
-10.56.1
15.615.18.1
-4.43.7
-6.44.6
19.25.51.0
645.0
-1.5-4.1
6.210.013.210.4
3.3-10.8
5.5-5.2
-14.9.9
6.8-1.8
3.916.97.1
11.0
7.111.46.3
21.7
15.541
19.411.9
17.43.54.33.0
13.16.7
20.9
Resi-dential
-7.1.3
9.611.85.8
-2.9-*.9-3.113.63.0
-«.o27.417.8-.6
-20.6-13.0
23.621.26.6
-3.7
-21.1-*.o
-18.241.114.61.4
12.0
-2.0-3.7
-9.3-12.3
16.67.6
10.8-2.3
5.9-18.0-20.8-24.5-23.4
2.016.414.7
24.722.23.3
18.7
2.1-5.113.224.3
12.812.7-1.8
-6.3-13.4
9.26.47.4
16.3-5.2
Exports and im-ports of goodsand services
Ex-ports
20.81.75.47.5
13.32.06.72.27.35.5
10.8
8il21.89.6
5.92.4
10.49.5
10.81.2
-7.1-2.6
8.32.77.4
11.015.911.7
8.56.36.62.98.28.9
15.58.6
-3.58.9
21 !02.3
13.8
6.31.82.56.0
-1.38.3
-8.523.4
-1.515.99.7
16.5
2.65.9
10.710.7
1.85.6-.9
Im-ports
1.3
in2.75.3
10.614.97.3
14.95.7
4.35.3
11.04.5
-2.7-11.3
19.610.78.71.7
-6.72.6
-1.312.624.36.58.46.13.93.93.9
7i59.2
12.08.05.97.4
-io!i-12.2
14.710.85.14.1
13.31.3
11.6
8.312.74.1
17.5
8.218.410.710.3
11.24.5
.01.6
10.69.99.3
Government consump-tion expenditures and
gross investment
Total
-0.24.96.02.32.0
H7.63.1-.6
-2.3-1.8
.4
U1.5
!92.91.61.8
L32.83.16.15.12.71.32.83.0
.6
.5
~.'o6.0
-44.3
.9
-2.7-1.4
2.5
2i91.9
-4.6
l!u1.5
-4.3-.87.0
-14
-1.2.8
-.6-4.3
1.67.7-.6
Fed-eral
-3.13.98.3
-17
11*9.91.0
-3.4
-7.1-7.1-1.7-4.9-.6
-U)1.62.11.54.24.23.25.42.46.94.63.1
-1.81.32.0
-2!l-3.6-3.8-3.6
6.1
-3!54.02.8
-77-6.8
-1.4-1.4
4.93.4
-12.7-4.9-2.9-.7
-11.4-5.311.5-5.9
-6.5-1.3-5.6
-13.2
6.094
-3.5
Stateandlocal
4.16.22.96.06.86.76.4
»2.8
2.83.32.23.03.62.9
43.61.6.0
-2.0-.3
3.85.35.52.43.94.03.81.42.42.22.52.4
6.0.9
1.94.5-.6
.71.22.85.44
1.4.9
1.73.93.83.0
.72.24.21.6
2.32.12.71.5-.96.71.1
Source: Department of Commerce, Bureau of Economic Analysis.
307
Digitized for FRASER http://fraser.stlouisfed.org/ Federal Reserve Bank of St. Louis

TABLE B-6.—Gross domestic product by major type of product, 1959-96
[Billions of dollars,- quarterly data at seasonally adjusted annual rates]
Year orquarter
195919601961196219631964196519661967196819691970197119721973197419751976 . . .1977197819791980198119821983198419851986198719881989199019911992199319941995...-1990:1
IIIllIV
1991-1 . .III l lIV
1992:1III I IIV
1993:1||IIIIV
1994-1IIIllIV
1995 1IIIllIV
1996:1IIIII
Grossdomesticproduct
507.2526.6544.8585.2617.4663.0719.1787.8833.6910.6982.2
1,035.61,125.41,237.31,382.61,496.91,630.61,819.02,026.92,291.42,557.52,784.23,115.93,242.13,514.53,902.44,180.74,422.24,692.35,049.65,438.75,743.85,916.76,244.46,553.06,935.77,253.85,660.45,751.05,782.45,781.55,822.15,892.35,950.06,002.36,121.86,201.26,271.76,383.06,442.66,506.26,574.46,688.66,776.06,890.56,993.17,083.27,149.87,204.97,309.87,350.67,426.87,545.17.616.3
Finalsales ofdomes-
ticproduct
503.0523.3541.9579.1611.7658.0709.4774.0823.1901.4972.7
1,033.41,116.91,227.41,365.21,482.81,636.91,802.02,003.82,264.22,540.62,791.93,087.83,256.63,519.43,835.04,154.54,412.64,668.15,038.75,407.05,735.85,919.06,237.46,532.46,876.27,216.75,651.85,709.85,768.75,812.95,838.25,912.25,944.75,980.96,122.16,191.06,260.16,376.66,422.86,484.66,552.36,669.86,735.96,816.06,928.57,024.67,091.77,170.97,271.57,332.87,428.67,537.17.579.6
Changein
busi-ness
inven-tories
4.23.22.96.15.75.09.7
13.810.59.19.52.28.59.9
17.514.1-6.316.923.127.216.9-7.628.2
-14.5-4.967.526.2
9.624.210.931.78.0
-2.37.0
20.659.537.08.6
41.213.8
-31.4-16.1-19.9
5.321.4-.3
10.211.66.4
19.921.622.018.840.274.564.758.758.134.038.217.8-1.7
8.036.6
Goods1
Total
Total
252.0257.8260.4281.2292.7313.2342.9380.6394.5426.7455.8467.5493.2539.8619.2665.7718.1804.0883.7996.5
1,115.21,191.11,342.61,333.21,426.91,607.01,669.81,720.61,804.81,942.92,124.02,203.82,234.02,321.02,422.02,593.92,699.22,194.92,223.62,210.72,186.12,207.92,225.12,249.22,253.82,281.12,301.32,329.42,372.22,382.22,414.22,417.42,474.32,523.22,574.72,619.32,658.62,673.92,680.22,727.02,715.82,747.52,790.12.821.6
Finalsales
247.8254.6257.5275.1287.1308.1333.3366.8384.0417.6446.2465.3484.7529.9601.8651.6724.5787.1860.6969.3
1,098.31,198.71,314.51,347.71,431.81,539.61,643.61,711.01,780.61,932.02,092.32,195.82,236.32,314.02,401.42,534.42,662.22,186.32,182.42,196.92,217.52,224.02,245.02,243.92,232.42,281.42,291.02,317.82,365.82,362.32,392.62,395.42,455.42,483.02,500.12,554.62,600.02,615.82,646.22,688.82,698.02,749.32,782.02.785.0
Changein
busi-ness
inven-tories
4.23.22.96.15.75.09.7
13.810.59.19.52.28.59.9
17.514.1-6.316.923.127.216.9-7.628.2
-14.5-4.967.526.29.6
24.210.931.78.0
-2.37.0
20.659.537.08.6
41.213.8
-31.4-16.1-19.9
5.321.4-.3
10.211.66.4
19.921.622.018.840.274.564.758.758.134.038.217.8-1.7
8.036.6
Durable goods
Finalsales
92.395.194.3
104.5111.0120.5133.3149.0153.8167.8178.6180.2187.0209.3241.4256.7288.1322.5366.9416.9475.0502.9546.0544.4586.1655.1713.2741.3764.7837.0907.3935.7926.6965.9
1,014.31,086.11,147.3
957.9932.7929.3922.9912.1936.0933.6924.8944.6955.7969.2994.2985.8
1,015.31,009.31,046.61,061.51,069.5,101.3,112.3,116.9,138.6,167.2,166.4
1,192.11,219.11.225.5
Changein
busi-ness
inven-tories
3.11.7
142.74.06.7
10.25.54.66.3
.03.27.2
14.611.0-7.510.610.220.312.5-2.7
7.5-15.5
4.043.68.6
2L516.421.32.5
-16.6-10.9
15.731.934.8
1.416.99.9
-18.4-38.7-29.5
5.9-4.2
-18.81.1
-11.1-14.9
13.111.314.224.325.135.134.233.154.428.529.227.312.39.9
34.7
Nondurable goods
Finalsales
155.5159.5163.2170.7176.1187.6199.9217.8230.2249.8267.6285.1297.7320.6360.3394.9436.4464.6493.7552.5623.3695.8768.4803.3845.7884.5930.4969.7
1,015.91,095.01,185.01,260.11,309.71,348.11,387.21,448.31,514.91,228.41,249.71,267.71,294.61,311.81,309.01,310.31,307.61,336.81,335.41,348.61,371.61,376.51,377.31,386.01,408.81,421.51,430.61,453.31,487.71,498.81,507.71,521.61,531.71,557.11,562.91.559.5
Changein
busi-ness
inven-tories
1.11.63.02.73.01.03.03.65.04.53.22.25.32.72.93.11.26.3
12.86.94.3
-4.920.6
1.0-8.923.917.69.02.8
-5.510.55.6
14.317.94.9
27.62.27.2
24.33.9
-13.122.69.5-.6
25.518.59.1
22.721.36.8
10.37.9
-5.515.139.530.525.63.75.49.1
-9.4
-14.0-1.9
2.0
Serv-ices1
192.7206.8220.8236.1252.0271.4291.5319.2349.5383.9418.2458.5503.8550.5600.5665.6745.8823.8916.4
1,023.11,131.71,274.11,423.31,566.91,720.91,871.82,054.62,224.22,398.12,600.02,795.33,016.93,201.33,411.13,584.03,746.53,926.92,924.92,997.83,051.33,093.73,131.63,186.73,221.93,264.93,338.43,387.53,432.13,486.43,528.93,556.73,607.53,642.73,678.23,724.03,773.43,810.53,856.23,908.93,950.23,992.44,027.94,087.04.122.0
Struc-tures
62.561.963.667.872.778.484.788.089.6
100.0108.3109.7128.4146.9162.9165.6166.7191.2226.8271.8310.6319.1350.0342.0366.8423.6456.3477.4489.3506.7519.4523.1481.4512.3547.0595.3627.6540.6529.6520.5501.7482.6480.5478.9483.6502.3512.4510.1524.4531.5535.4549.5571.6574.7591.9600.5614.1619.8615.7632.6642.3651.4668.0672.6
1 Exports and imports of certain goods, primarily military equipment purchased and sok) by the Federal Government, are included in serv-ices.
Source: Department of Commerce, Bureau of Economic Analysis.
308
Digitized for FRASER http://fraser.stlouisfed.org/ Federal Reserve Bank of St. Louis

TABLE B-7.—Real gross domestic product by major type of product, 1959-96
[Billions of chained (1992) dollars; quarterly data at seasonally adjusted annual rates]
Year orquarter
1959196019611962196319641965196619671968.196919701971197219731974 .19751976197719781979198019811982198319841985198619871988198919901991 . . ..19921993 . .199419951990:1
IIIllIV
1991-1IIIllIV
1992:1IIIIIIV
1993:1I IIllIV
1994:1IIIllIV
1995:1IIIllIV
1996-1IIIll
Grossdomesticproduct
2,212.32,261.72,309.82,449.12,554.02,702.92,874.83:060.23,140.23,288.63,388.03,388.23,500.13,690.33,902.33,888.23,865.14,081.14,279.34,493.74,624.04,611.94,724.94,623.64,810.05,138.25,329.55,489.95,648.45,862.96,060.46,138.76,079.06,244.46,386.46,608.76,742.96,154.16,174.46,145.26,081.06,047.96,074.16,089.36,104.46,175.36,214.26,260.96,327.36,326.46,356.56,393.46,469.16,508.56,587.66,644.96,693.96,701.06,713.56,776.46,780.76,814.36,892.66,928.4
Finalsales ofdomes-
ticproduct
2,206.92,264.22,318.02,445.42,552.42,705.12,860.43,033.53,125.13,278.03,377.23,406.53,499.83,689.53,883.93,873.43,906.44,061.74,240.84,464.44,614.44,641.94,691.64,651.24,821.25,061.65,296.95,480.95,626.05,855.16,028.76,126.76,082.66,237.46,365.56,550.76,708.96,144.66,127.56,126.66,108.16,065.46,095.96,085.46,083.86,175.86,203.86,249.56,320.76,307.16,334.56,371.36,449.26,467.76,514.96,582.16,638.16,647.46,682.46,741.46,764.26,815.26,884.76,892.7
Changein
busi-ness
inven-tories
13.510.68.9
20.018.115.630.242.332.126.927.2
5.722.725.239.024.0
-11.029.038.042.323.1
-10.033.1
-15.6-5.974.829.810.926.211.633.310.4-3.0
7.319.158.933.111.043.814.9
-28.2-17.5-20.8
4.921.4
in12.15.8
18.520.819.517.440.574.564.556.154.530.533.0146-3.0
7.134.5
Goods1
Total
Total
786.4795.6796.0853.5882.4936.7
1,013.01,099.91,114.71,166.61,200.31,181.61,209.31,296.51,413.21,400.91,373.41,478.31,560.01,644.41,700.61,687.41,765.71,684.11,754.81,924.81,971.72,020.92,076.92,178.92,300.22,307.12,262.32,321.02,390.02,524.32,589.22,328.32,335.62,304.62,260.12,251.82,256.12,271.12,270.12,288.92,301.12,327.42,366.72,356.72,386.52,385.62,431.12,467.22,510.92,542.62,576.52,576.22,573.02,610.22,597.52,615.72,647.12,682.1
Finalsales
780.9795.6799.7848.6878.8935.8999.9
1,077.91,101.21,156.51,189.91,193.41,206.11,293.21,396.01,386.51,404.41,459.91,525.71,617.81,690.71,711.21,735.11,706.71,762.61,853.31,940.62,011.72,055.02,171.02,269.22,295.42,265.92,314.02,369.02,465.62,555.12,318.82,289.52,286.42,286.82,269.02,277.72,267.22,249.62,289.32,290.72,316.02,360.12,337.32,364.42,363.42,411.12,425.92,437.32,478.92,520.22,522.02,542.02,575.02,581.52,617.62,640.02,646.2
Change
busi-ness
inven-tories
13.510.68.9
20.018.115.630.242.332.126.927.2
5.722.725.239.024.0
-11.029.038.042.323.1
-10.033.1
-15.6-5.974.829.810.926.211.633.310.4-3.0
7.319.158.933.111.043.814.9
-28.2-17.5-20.8
4.921.4
11312.15.8
18.520.819.517.440.574.564.556.154.530.533.014.6-3.0
7.134.5
Durable goods
Finalsales
221.1227.3224.3247.7262.0283.8313.9350.0359.2378.7391.2383.2385.8431.8496.6496.9495.8520.9567.0615.3654.6638.1638.8604.4637.6703.1758.2793.6819.8897.0951.9963.9934.2965.9
1,007.41,068.11,124.1
991.4963.8955.6944.7926.0944.9938.2927.5945.2953.8970.0994.8982.1
1,008.51,000.91,038.01,047.51,050.01,078.91,095.91,095.21,115.41,142.91,143.01,166.31,196.41,206.9
Changein
busi-ness
inven-tories
9.95.2
10>8.3
12.120.430.916.313.217.4
8^018.034.620.6
-13.918.917.231.718.4-3.6
9.1-17.8
4.949.710.0
23^517.622.4
2.7-16.6-10.9
15.430.632.8
1.917.310.2
-18.4-38.9-29.5
6.1-4.2
-18.71.2
-11.4-14.8
13.111.213.523.624.333.932.931.551.526.727.025.811.89.3
33.0
Nondurable goods
Finalsales
595.6602.6612.1634.7648.2682.7713.4751.8765.4801.8822.6837.8848.8885.4916.7905.9926.7956.4970.8
1,011.71,042.91,085.61,111.01,122.61,142.61,160.91,189.01,223.51,239.21,274.81,317.21,331.31,331.81,348.11,361.71,397.81,431.81,326.51,325.51,330.81,342.21,343.31,332.81,329.01,322.11,344.21,336.91,346.01,365.31,355.21,356.01,362.51,373.31,378.61,387.51,400.51,424.71,427.11,427.31,433.21,439.41,452.61,445.71,441.7
Changein
busi-ness
inven-tories
3.55.39.39.19.83.09.2
10.915.613.69.65.9
14.87.26.04.52.3
10.220.810.55.1
-6.323.62.0
-10.425.619.710.22.2
-6.211.07.6
13.418.33.7
28.2
9.126.34.7
-9.921.08.4
-1.325.618.610.123.720.85.49.76.1
-6.416.240.731.624.5
2.73.65.8
-11.4-14.7-2.2
1.5
Serv-ices1
1,115.31,167.11,219.91,277.51,336.91,406.31,472.51,557.81,639.41,712.01,774.11,824.01,875.81,936.12,004.42,063.32,123.52,182.92,250.52,334.32,391.32,441.42,475.82,518.72,598.42,678.02,797.82,903.23,011.63,128.63,208.53,295.43,332.33,411.13,467.13,526.13,583.93,264.83,293.93,310.13,312.73,308.83,335.03,338.33,347.23,379.43,398.63,424.23,442.33,448.93,451.03,478.33,490.33,495.63,517.33,541.13,550.53,556.13,579.03,595.13,605.63,614.23,648.83,652.0
Struc-tures
299.4296.5304.7322.2343.9367.0385.4385.9380.2403.6408.8391.1427.4459.0469.0420.5382.3418.3458.7498.1511.7475.9468.8428.5460.7523.1550.3558.4554.6550.8546.0533.3484.5512.3529.4559.8571.8555.9541.4528.2507.5487.3483.4480.1487.3507.1514.4509.4518.5520.9519.3529.5548.1546.6560.6562.8569.1570.8563.4573.7579.4586.4598.8597.5
'Exports and imports of certain goods, primarily military equipment purchased and sold by the Federal Government, are included in serv-ices.
Source: Department of Commerce, Bureau of Economic Analysis.
309
Digitized for FRASER http://fraser.stlouisfed.org/ Federal Reserve Bank of St. Louis
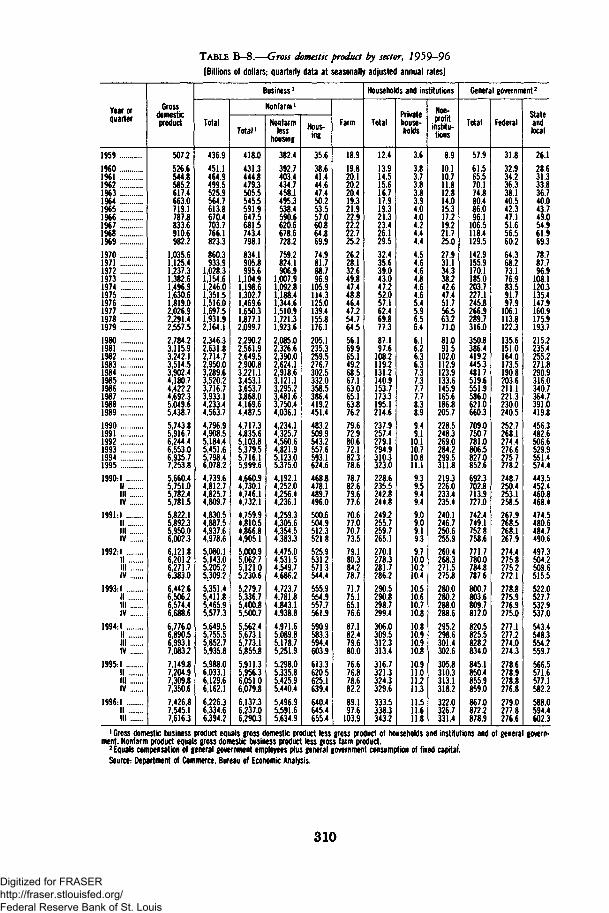
TABLE B-8.—Gross domestic product by sector, 1959-96
[Billions of dollars; quarterly data at seasonally adjusted annual rates]
Year orquarter
19591960196119621963196419651966196719681969 :..1970197119721973197419751976197719781979 ..19801981198219831984198519861987198819891990199119921993199419951990:1
IIIllIV
1991:1IIIllIV
1992:1II .IllIV
1993:1IIIllIV
1994: 1 .IIIllIV
1995:1IIIllIV
1996:1IIIll
Grossdomesticproduct
507.2526.6544.8585.2617.4663.0719.1787.8833.6910.6982.2
1,035.61,125.41,237.31,382.61,496.91,630.61,819.02,026.92,291.42,557.52,784.23,115.93,242.13,514.53,902.44,180.74,422.24,692.35.049.65,438.75,743.85,916.76,244.46,553.06,935.77,253.85,660.45,751.05,782.45,781.55,822.15,892.35,950.06,002.36,121.86,201.26,271.76,383.06,442.66,506.26,574.46,688.66,776.06,890.56,993.17,083.27,149.87,204.97,309.87,350.67,426,87,545.17,616.3
Business '
Total
436.9451.1464.9499.5525.9564.7613.8670.4703.7766.1823.3860.3933.9
1,028.31,154.61,246.01,351.51,516.01,697.51,931.92,164.12,346.32,631.82,714.72,950.03,289.63,520.23,716.73,933.14,233.44,563.74,796.94,908.55,184.45,451.65,798.46,078.24,739.64,812.74,825.74,809.74,830.54,887.54,937.64,978.65,080.15,143.05,205.25,309.25,351.45,411.85,465.95,577.35,649.55,755.55,852.75,935.85,988.06,033.16,129.66,162.16,226.36,334.66,394.2
Nonfarm '
Total1
418.0431.3444.8479.3505.5545.5591.9647.5681.5743.4798.1834.1905.8995.6
1,104.91,198.61,302.71,469.61,650.31,877.12,099.72,290.22,561.92,649.52,900.83,221.13,453.13,653.73,868.04,169.64,487.54,717.34,835.65,103.85,379.55,716.15,999.64,660.94,730.14,746.14,732.14,759.94,810.54,866.84,905.15,000.95,062.75,121.05,230.65,279.75,336.75,400.85,500.75,562.45,673.15,773.15,855.85,911.35,956.36,051.06,079.86,137.36,237.06,290.3
Nonfarmless
housing
382.4392.7403.4434.7458.1495.3538.4590.6620.6678.6728.2759.2824.1906.9
1,007.91,092.81,188.41,344.61,510.91,721.31,923.62,085.02,326.62,390.02,624.12,918.63,121.13,295.23,481.63,750.44,036.14,234.14,325.74,560.64,821.95,123.05,375.04,192.14,252.04,256.44,236.14,259.34,305.64,354.54,383.34,475.04,531.54,549.74,686.24,723.74,781.84,843.14,938.84,971.65,089.85,178.75,251.95,298.05,335.85,425.95,440.45,496.95,591.65,634.9
Hous-ing
35.638.641.444.647.450.253.557.060.864.869.974.981.788.796.9
105.9114.3125.0139.4155.8176.1205.1235.3259.5276.7302.5332.0358.5386.4419.2451.4483.2509.9543.2557.6593.1624.6468.8478.1489.7496.0500.6504.9512.3521.8525.9531.2571.3544.4555.9554.9557.7561.9590.9583.3594.4603.9613.3620.5625.1639.4640.4645.4655.4
Farm
18.919.820.120.220.419.321.922.922.222.725.226.228.132.649.847.448.846.447.254.764.556.169.965.149.268.567.163.065.163.876.279.672.980.672.182.378.678.782.679.677.670.677.070.773.579.180.384.278.771.775.165.176.687.182.479.680.076.676.878.682.289.197.6
103.9
Households and institutions
Total
12.413.914.515.616.717.919.321.323.426.129.532.435.639.043.047.252.057.162.469.877.387.197.6
108.2119.2131.2140.9153.7173.3195.1214.6237.9257.4279.1294.9310.3323.0228.6235.5242.8244.8249.2255.7259.7265.1270.1278.3281.7286.2290.5290.8298.7299.4306.0309.5312.3313.4316.7321.3324.3329.6333.5338.3343.2
Privatehouse-holds
3.63.83.73.83.83.94.04.04.24.44.44.54.64.64.84.64.65.45.96.56.46.16.26.36.37.37.37.77.78.38.99.49.1
10.110.710.811.19.39.59.49.49.09.09.19.39.7
10.010.210.410.510.610.710.810.810.910.910.810.911.011.211.311.511.611.8
Non-profit
institu-tions
8.910.110.711.812.814.015.317.219.221.725.027.931.134.338.242.647.451.756.563.271.081.091.5
102.0112.9123.9133.6145.9165.6186.8205.7228.5248.3269.0284.2299.5311.8219.3226.0233.4235.4240.1246.7250.6255.9260.4268.3271.5275.8280.0280.2288.0288.6295.2298.6301.4302.6305.8310.3313.1318.2322.0326.7331.4
General government2
Total
57.961.565.570.174.880.486.096.1
106.5118.4129.5142.9155.9170.1185.0203.7227.1245.8266.9289.7316.0350.8386.4419.2445.3481.7519.6551.9586.0621.0660.3709.0750.7781.0806.5827.0852.6692.3702.8713.9727.0742.4749.1752.8758.6771.7780.0784.8787.6800.7803.6809.7812.0820.5825.5828.2834.0845.1850.4855.9859.0867.0872.2878.9
Federal
31.832.934.236.338.140.542.347.151.656.560.264.368.273.176.983.591.797.9
106.1113.8122.3135.6151.0164.0173.5190.8203.6211.1221.3230.0240.5252.7268.1274.4276.6275.7278.2248.7250.4253.1258.5267.9268.5268.1267.9274.4275.8275.2272.1278.8275.9276.9275.0277.1277.2274.0274.3278.6278.9278.8276.8279.0277.8276.6
Stateandlocal
26.128.631.333.836.740.043.749.054.961.969.378.787.796.9
108.1120.3135.4147.9160.9175.9193.7215.2235.4255.2271.8290.9316.0340.7364.7391.0419.8456.3482.6506.6529.9551.4574.4443.5452.4460.8468.4474.5480.6484.7490.6497.3504.2509.6515.5522.0527.7532.9537.0543.4548.3554.2559.7566.5571.6577.1582.2588.0594.4602.3
1 Gross domestic business product equals gross domestic product less gross product of households and institutions and of general govern-ment. Nonfarm product equals gross domestic business product less gross farm product.2 Equals compensation of general government employees plus general government consumption of fixed capital.
Source: Department of Commerce, Bureau of Economic Analysis.
310
Digitized for FRASER http://fraser.stlouisfed.org/ Federal Reserve Bank of St. Louis

TABLE B-9.—Real gross domestic product by sector, 1959-96[Billions of chained (1992) dollars; quarterly data at seasonally adjusted annual rates]
Year orquarter
195919601961196219631964 ..19651966196719681969197019711972197319741975197619771978197919801981 ...."'"!'.!..198219831984198519861987198819891990 ....19911992 ...1993199419951990:1
IIIllIV
1991:1IIIllIV
1992:1IIIIIIV
1993:1IIIllIV
1994:1IIIllIV
1995-1IIIllIV
1996:1IIIll
Grossdomesticproduct
2,212.32,261.72,309.82,449.12,554.02,702.92,874.83,060.23,140.23,288.63,388.03,388.23,500.13,690.33,902.33,888.23,865.14,081.14,279.34,493.74,624.04,611.94,724.94,623.64,810.05,138.25,329.55,489.95,648.45,862.96,060.46,138.76,079.06,244.46,386.46,608.76,742.96,154.16,174.46,145.26,081.06,047.96,074.16,089.36,104.46,175.36,214.26,260.96,327.36,326.46,356.56,393.46,469.16,508.56,587.66,644.96,693.96,701.06,713.56,776.46,780.76,814.36,892.66,928.4
Business '
Total
1,723.61,757;!
1,791.71,906.51,992.82,117.62,263.02,410.92,463.92,585.42,665.62,665.12,768.02,946.83,145.73,122.63,091.83,296.63,481.43,678.83,798.43,777.03,882.53,776.03,952.84,264.24,431.34,565.24,698.84,880.05,047.85,099.45,025.95,184.45,315.75,530.35,663.45,123.55,137.75,101.65,034.74,995.55,020.25,037.25,050.85,118.75,156.75,198.85,263.35,259.85,286.25,320.35,396.35,432.05,509.15,565.15,614.75,621.25,632.75,694.15,705.75,741.65,807.35,841.2
Nonfarm1
Total1
1,677.817112l',748.71,868.21,953.32,083.32,227.62,383.92,430.12,554.62,634.42,634.92,736.22,920.23,126.93,094.93,049.73,255.93,431.33,651.63,762.63,740.83,816.03,705.43,915.74,211.34,357.54,500.04,636.14,826.84,984.85,026.54,954.95,103.85,244.75,446.75,587.25,055.15,063.45,028.84,958.94,924.84,947.24,968.14,979.65,039.75,075.35,115.85,184.45,184.35,212.75,259.15,322.55,347.95,424.85,481.15,532.85,542.45,556.15,620.25,630.05,662.45,724.55,754.3
Nonfarmless
housing
1,525.11,548.61,577.01,685.31,760.91,881.62,014.32,159.92,195.62,310.52,379.82,373.42,464.02,633.92,826.72,781.02,733.32,929.23,093.23,294.63,387.73,345.63,406.13,291.43,496.43,774.23,906.04,040.24,162.14,335.74,477.84,510.54,428.14,560.64,702.04,885.35,013.44,544.14,549.64,511.34,437.24,401.64,423.14,440.44547.54,508.44,542.44,545.74,645.94,638.24,671.54,717.94,780.74,783.44,870.74,920.14,967.24,973.34,984.35,046.75,049.45,085.15,146.25,170.8
Hous-ing
149.8160.0169.4180.4189.9198.9210.0220.3231.2240.3251.1258.7269.3282.7295.9311.7315.4323.4333.6351.7370.7395.6411.6418.7421.3437.54519459.7473.9491.0506.8515.9526.8543.2542.6561.3573.8510.8513.6517.4521.7523.2524.1527.7532.2531.3532.9570.1538.5546.1541.2541.2541.9564.4554.1561.1565.7569.1571.7573.6580.7577.4578.6583.7
Farm
34.034.333.532.633.932.734.532.535.835.536.435.937.536.936.338.743.444.650.241.746.346.263.365.245.056.471.965.563.756.664.872.971.280.671.083.976.069.474.172.775.370.973.169.371.479.081.483.078.975.673.760.873.884.684.884.482.178.976.473.575.379.182.887.1
Households and institutions
Total
105.0112.1113.1117.2120.1123.4127.9132.6136.9141.0145.5144.0147.2151.4154.9156.1161.2163.0167.5170.3173.7178.7182.7188.0192.3197.1203.4213.5224.1240.6253.4264.1272.1279.1287.9296.2302.5259.3262.7266.5267.8269.0271.6272.8274.9277.3277.2279.8282.0283.5287.1289.6291.4293.5295.9296.8298.8300.1301.6303.1305.0305.5308.4310.1
Privatehouse-holds
18.518.618.117.917.717.516.916.316.315.514.713.813.112.712.410.710.110.410.510.89.48.37.87.67.68.7879.08.99.5
10.110.29.4
10.110.310.210.110.310.410.210.09.59.49.49.59.9
10.110.110.310.310.410.310.310.310.310.210.110.010.110.210.210.310.310.3
Non-profit
institu-tions
78.685.487.892.395.699.4
105.0110.9115.2120.6126.5126.4130.6135.4139.6143.2149.2150.6155.0157.5163.1169.8174.7180.4184.8188.2194.6204.3215.2231.0243.3253.8262.6269.0277.5286.0292.3249.0252.3256.2257.8259.5262.2263.4265.4267.4267.1269.6271.7273.1276.7279.2281.1283.2285.6286.7288.7290.1291.5292.9294.8295.3298.1299.8
General government 2
Total
415.1429.3444.6461.8475.7492.4509.3542.1571.1592.6607.3609.7611.3611.5614.8625.2631.1634.3639.1649.2654.2660.9662.3666.6668.7676.06932709.9724.2741.3758.1774.7781.1781.0782.9782.4777.5770.3773.3776.7778.5783.7782.5779.3778.9779.3780.3782.3782.0783.2783.2783.6781.5783.1782.7783.2780.7780.1779.6779.7770.8768.0777.7778.1
Federal
232.1236.4241.5251.7254.3256.8258.8276.4295.1300.6301.7288.9276.1263.5253.8252.0249.0247.5246.3247.3245.1246.7248.3250.3254.2258.22639266.9272.3274.1276.2280.3281.0274.4267.3256.8246.4279.8280.0280.9280.4284.9282.3279.4277.5275.8275.0274.0272.7271.5269.0266.4262.3261.1258.1255.9252.0250.2249.1247.7238.6238.7240.4239.0
Stateandlocal
186.4196.2206.4213.6224.6238.4253.0268.4279.2294.8307.8321.5334.9347.4360.2372.6381.7386.4392.6401.8409.3414.5414.2416.4414.4417.64292443.0452.0467.3481.9494.5500.1506.6515.6525.8531.7490.5493.4495.9498.1498.9500.2499.9501.5503.5505.3508.4509.3511.7514.3517.3519.2522.2524.7527.5529.0530.2530.9532.5533.0530.0538.1539.9
1 Gross domestic business product equals gross domestic product less gross product of households and institutions and of general govern-ment. Nonfarm product equals gross domestic business product less gross farm product.2 Equals compensation of general government employees plus general government consumption of fixed capital.
Source: Department of Commerce, Bureau of Economic Analysis.
311
Digitized for FRASER http://fraser.stlouisfed.org/ Federal Reserve Bank of St. Louis

TABLE B-10.—Gross domestic product by industry, 1959-94[Billions of dollars]
Year
Based on1972 SIC:
1959
I9601961196219631964
19651966196713681969
19701971197219731974
19751976197719781979
19801981198219831984
198519861987
Based on1987 SIC:
198719881989
19901991199219931994
Grossdomes-
ticproduct
507.2
526.6544.8585.2617.4663.0
719.1787.8833.6910.6982.2
1,035.61,125.41,237.31,382.61,496.9
1,630.61,819.02,026.92,291.42,557.5
2,784.23,115.93,242.13,514.53,902.4
4,180.74,422.24,692.3
4,692.35,049.65,438.7
5,743.85,916.76,244.46,550.26,931.4
Private industries
Agri-cul-ture,for-
estry,and
fishing
20.3
21.321.722.122.321.4
24.225.424.925.728.5
29.832.137.054.453.2
54.553.654.363.274.5
66.781.177.162.683.6
84.582.188.6
88.688.9
101.9
108.7102.9112.4105.3117.8
Mining
12.5
12.913.013.213.513.9
14.014.715.216.317.1
18.718.919.723.837.1
42.847.654.161.571.2
112.7151.7149.5127.5134.2
132.886.388.3
88.399.996.3
112.3101.192.289.090.1
Con-struc-tion
23.7
24.225.227.028.831.5
34.637.739.543.348.4
51.156.162.569.773.6
75.184.993.8
110.6124.7
128.6129.6129,8138.9165.0
185.5207.3217.0
217.0233.4242.2
245.2228.8229.7243.6269.2
Manufacturing
Total
140.3
142.5142.9156.7166.1177.9
196.3215.3220.8241.1254.4
249.6263.0290.4323.4337.3
354.7405.3462.4516.9571.3
584.4652.0649.8690.1780.5
802.9833.1889.0
889.0971.3
1,013.4
1,031.41,028.11,063.61,116.51,197.1
Dura-ble
goods
81.7
82.681.792.198.3
105.9
118.8131.1134.1146.3154.4
146.2154.2172.6195.7202.2
207.0239.9277.6316.9343.5
348.7388.1377.4397.3469.5
477.1487.0514.4
513.3556.6574.9
572.8558.3573.4612.3673.1
Non-durablegoods
58.6
59.961.364.667.872.0
77.584.386.794.8
100.0
103.4108.9117.8127.7135.1
147.7165.4184.7200.0227.8
235.7263.9272.3292.7311.0
325.9346.1374.6
375.7414.7438.5
458.5469.8490.2504.3524.0
Trans-porta-tionand
publicutilities
45.0
47.348.851.954.858.3
62.467.370.576.482.7
88.397.4
108.6119.4130.1
142.6161.6179.5202.5219.2
242.3276.3293.2328.3358.0
376.8394.0420.7
420.7443.6461.1
482.3511.8528.8566.2606.4
Whole-sale
trade
36.1
37.738.841.443.146.4
50.054.457.863.468.5
72.278.087.498.2
111.1
121.5129.2142.3161.0182.4
195.3216.4219.6229.2264.4
280.8293.6306.3
301.0336.5356.4
367.3388.2406.5423.1461.9
Retailtrade
49.1
50.451.755.457.963.5
68.072.778.286.694.2
100.2109.2118.8130.9136.7
152.8172.2190.2215.6234.2
245.9270.4288.1321.9362.2
395.0415.2436.5
435.8459.3490.2
503.5517.4544.3571.1609.9
Finance,insur-ance,andreal
estate
69.0
73.678.182.687.193.0
100.0108.1117.4127.0136.6
146.6163.4176.9193.5209.3
227.1250.4283.7328.1370.6
418.2470.9504.2565.6626.1
691.3761.3830.3
830.7892.4960.6
1,025.21,082.71,148.81,214.01,273.7
Services
48.4
51.655.059.363.469.1
74.782.790.899.4
110.8
120.5130.4144.9163.1179.3
199.1223.9255.5294.6333.2
377.3426.2471.8521.5590.4
651.1712.2785.1
784.6877.8965.5
1,059.41,107.61,200.81,266.11,342.7
Sta-tisti-caldis-
crep-ancy1
-2.1
-3.7-3.3-2.4-3.5-2.1
-1.42.7
.6
-2.2
1.05.13.22.44.5
11.218.917.517.627.8
27.414.6-2.936.5
4.2
1.322.1
-16.6
-16.6-48.6
11.6
16.18.8
43.755.131.3
Gov-ern-ment
64.8
68.973.078.283.990.1
96.3106.9117.9131.2143.3
157.6171.7187.8203.8224.8
249.3271.2293.5319.8348.2
385.5426.5461.9492.4533.8
578.6615.0653.2
653.2694.9739.2
792.5839.5873.6900.2931.3
1 Equals gross domestic product (GDP) measured as the sum of expenditures less gross domestic income.Note.—Data in this table incorporate the results of the comprehensive revision to the national income and product accounts (NIPA)
released in January 1996. See Survey of Current Business, August 1996 for details. Data do not reflect the limited annual NIPA revisions re-leased in August 1996.
Source: Department of Commerce, Bureau of Economic Analysis.
312
Digitized for FRASER http://fraser.stlouisfed.org/ Federal Reserve Bank of St. Louis

TABLE B-ll.—Real gross domestic product by industry, 1977-94[Billions of chained (1992) dollars]
Year
Based on1972 SIC:
197719781979
19801981198219831984
198519861987
Based on1987 SIC.
198719881989
19901991 . .199219931994
Grossdomes-
ticproduct
4,279.34,493.74,624.0
4,611.94,724.94,623.64,810.05,138.2
5,329.55,489.95,648.4
5,648.45,862.96,060.4
6,138.76,079.06,244.46,383.86,604.2
Private industries
Agri-cul-ture,for-
estry,and
fishing
60.652.057.3
57.775.678.659.472.9
90.587.287.6
87.680.788.2
101.5100.9112.4103.3115.7
Mining
82.484.673.6
82.081.478.873.782.0
87.183.686.4
86.4104.492.8
96.997.592.290.796.7
Con-struc-tion
213.8221.2227.8
214.7195.4172.8181.0210.1
232.9239.0239.6
239.6248.8251.9
247.5229.0229.7236.1253.1
Manufacturing
Total
796.5836.7865.1
822.8858.6810.2856.8948.3
976.5967.6
1,041.6
1,041.61,110.91,106.0
1,090.11,050.41,063.61,095.31,168.0
Dura-ble
goods
435.2461.8470.6
451.3468.8428.0448.4521.9
534.7527.5566.4
565.1616.1613.1
600.7568.1573.4601.2657.9
Non-durablegoods
361.8374.1395.7
371.5390.6386.3413.8426.1
442.1440.8476.4
477.8494.5492.6
489.3482.2490.2494.1510.2
Trans-porta-tionand
publicutilities
350.3366.4382.4
388.9394.9383.4409.2426.3
428.0425.9458.4
458.4472.7479.9
494.7514.7528.8555.8585.3
Whole-sale
trade
201.1215.6228.3
226.0241.1246.6251.6286.9
298.2333.2322.1
322.9343.9366.4
360.6381.3406.5418.6450.0
Retailtrade
364.5389.9389.1
374.5386.2387.9422.6465.0
496.8526.6510.1
509.2537.6553.4
546.4534.1544.3563.2595.4
Finance,insur-ance,andreal
estate
743.3786.6831.4
863.5878.8876.5900.8945.8
968.9969.8
1,016.0
1,016.51,070.21,102.7
1,109.91,106.61,148.81,159.*1,192.8
Services
712.5759.5787.3
810.8829.9838.1862.8920.8
963.9996.8
1,041.9
1,041.41,099.11,149.5
1,181.71,174.21,200.81,222.11,249.6
Sta-tisti-caldis-
crep-ancy1
36.934.450.3
45.322.2-4.150.05.5
1.727.4
-20.0
-20.0-56.4
13.0
17*9.0
43.753.729.8
Gov-ern-ment
717.4731.5739.4
748.8749.4748.3753.0760.1
777.9795.6810.0
810.0829.0847.7
867.0873.7873.6875.1875.8
Notallo-cated
byindus-try?
-38.0-62.2-74.3
•45.0-45.2-55.2-59.4-24.3
-26.55.3
30.1
31.16.32.0
20.66.1.0
7.0-14.5
'Equals the current-dollar statistical discrepancy deflated by the implicit price deflator for gross domestic product.2 Equals GDP less the statistical discrepancy and the sum of gross product originating of the detailed industries.
Note.—Data in this table incorporate the results of the comprehensive revision to the national income and product accounts (NIPA)released in January 1996. See Survey of Current Business, August 1996 for details. Data do not reflect the limited annual NIPA revisions re-leased in August 1996.
Source: Department of Commerce, Bureau of Economic Analysis.
313
Digitized for FRASER http://fraser.stlouisfed.org/ Federal Reserve Bank of St. Louis

TABLE B-12.—Gross domestic product of nonfinancial corporate business, 1959-96[Billions of dollars; quarterly data at seasonally adjusted annual rates]
Year orquarter
1959
1960196119621963196419651966196719681969
1970197119721973197419751976197719781979
1980198119821983198419851986198719881989
199019911992199319941995
1990:1IIIllIV
1991:1IIIllIV
1992:1IIIllIV
1993:1II ...IllIV
1994:1IIIllIV
1995:1IIIllIV
1996- 1IIIll
Grossdomes-
ticproduct
ofnon-
financialcorpo-ratebusi-ness
267.5
278.1285.5311.7331.8358.1393.5431.0453.4500.5543.3
561.4606.4673.3754.5814.6881.2995.3
1,125.41,284.11,429.7
1,553.81,767.31,823.41,950.32,187.52,319.32,416.32,589.62,805.22,950.9
3,084.03,132.13,262.63,437.53,689.43,885.8
3.042.83,103.03,092.73,097.4
3,107.73,119.13,142.03,159.5
3,202.23,236.13,270.53,341.7
3,344.23,407.33,459.73,538.7
3,601.73,663.03,709.53,783.2
3,803.33,841.93,924.83,973.2
4,011.64,081.64,143.1
Con-sump-tionof
fixedcap-ital
26.3
27.227.828.829.831.333.536.740.143.847.5
51.656.362.167.678.794.4
104.5125.8142.1163.7
187.8218.3235.4248.9255.1266.5283.7296.9316.5335.5
352.7366.7376.1390.1412.8424.0
346.4351.6356.0356.9
363.2365.7369.0369.1
368.6371.8387.9376.3
382.8387.5395.8394.2
427.9404.3408.7410.4
415.0421.3426.6433.0
434.8439.9445.5
Net domestic product
Total
241.2250.9257.8282.9302.0326.8360.0394.3413.4456.7495.8
509.8550.1611.2686.8736.0786.8890.8999.7
1,142.01,266.0
1,365.91,549.11,588.01,701.41,932.42,052.82,132.62,292.72,488.72,615.4
2,731.32,765.32,886.53,047.43,276.63,461.8
2,696.42,751.52,736.72,740.5
2,744.52,753.42,773.02,790.4
2,833.62,864.32,882.72,965.4
2,961.33,019.83,063.93,144.4
3,173.93,258.73,300.83,372.9
3,388.33.420.63,498.23,540.2
3,576.83,641.73,697.6
Indi-rectbusi-ness
taxes '
26.0
28.329.532.034.036.639.240.543.149.754.7
58.864.569.276.381.487.495.1
104.1116.4125.4
141.6170.4172.1189.0210.2224.4235.8246.7263.5280.8
296.8318.0337.0356.2379.6400.9
290.5292.6299.7304.3
309.2314.2321.2327.3
330.4331.8337.8348.0
346.9352.9355.9368.9
372.6376.5382.1387.2
394.1401.1401.6406.9
405.3403.0406.6
Domestic income
Total
215.2
222.6228.2250.9267.9290.2320.8353.8370.3407.0441.1
451.0485.6542.1610.5654.6699.5795.6895.6
1,025.51,140.6
1,224.31,378.71,415.91,512.41,722.21,828.41,896.82,046.02,225.32,334.6
2,434.52,447.32,549.52,691.22,896.93,060.9
2,405.92,458.92,437.02,436.2
2,435.32,439.22,451.82,463.1
2,503.12,532.52,544.92,617.4
2,614.42,666.92,708.02,775.5
2,801.32,882.22,918.62,985.7
2,994.23,019.43,096.63,133.3
3,171.53,238.83,290.9
Com-pensa-tionof
employ-ees
171.5
181.2185.3200.1211.1226.7246.5274.0292.3323.2358.8
378.7402.0447.1505.9556.8580.3657.4742.6852.9968.1
1,058.51,171.51,217.01,280.51,421.71,521.91,603.21,715.51,846.71,950.0
2,056.02,090.62,195.32,294.32,434.82,574.9
2,022.02,055.82,074.72,071.4
2,060.02,078.82,101.22,122.2
2,152.82,183.22,209.32,236.1
2,251.42,279.82,308.42,337.6
2,381.82,418.42,445.82,493.3
2,528.52,553.12,590.62,627.6
2,651.32,703.42,744.3
Corporate profits with inventory valuation and capitalconsumption adjustments
Total
40.6
38.038.946.352.058.268.272.569.273.669.1
55.265.575.882.169.590.4
110.7122.4136.3127.4
107.6135.3116.4155.3212.7215.9195.5225.2257.5238.7
231.0223.1250.0297.3364.6384.6
237.5254.2214.7217.7
232.6222.8219.4217.5
240.2243.3234.8281.6
260.5286.9301.1340.6
323.6366.3374.2394.3
364.6364.5405.0404.3
420.3433.8442.8
Profits
Profitsbefore
tax
43.6
40.340.145.049.856.066.271.467.574.070.8
58.167.178.698.6
109.2109.9137.3158.6183.5195.5
181.6181.4133.7157.4191.0167.6151.5214.9260.6237.0
237.3218.1257.8303.7372.5403.0
227.9239.0250.1232.3
213.3215.0220.6223.7
236.3262.6254.4277.9
275.9303.2296.4339.5
346.0364.4378.0401.8
405.1397.9406.0403.2
424.1429.5424.1
Profitstax
liability
20.7
19.219.520.622.824.027.229.527.833.633.3
27.229.933.840.242.241.553.059.967.169.6
67.063.946.359.473.769.975.693.5
101.798.8
95.785.491.1
103.5129.9140.7
90.596.4
101.194.7
83.184.086.887.5
82.493.689.998.4
93.8103.9100.1116.0
121.0126.9130.9140.6
142.2138.5141.3140.6
147.7149.2146.9
Profits after tax
Total
22.9
21.120.724.327.032.139.041.939.740.437.5
31.037.144.858.467.068.484.498.7
116.4125.9
114.6117.587.497.9
117.397.675.9
121.4158.8138.3
141.6132.8166.7200.3242.7262.4
137.3142.7148.9137.7
130.3131.0133.8136.2
153.9169.0164.5179.5
182.1199.3196.3223.4
225.0237.5247.1261.1
262.9259.4264.7262.6
276.4280.3277.1
Divi-dends
10.0
10.610.611.412.613.715.616.817.519.119.1
18.518.520.121.121.724.828.031.536.438.1
45.353.353.364.267.872.373.975.979.4
103.5
118.4124.6133.6152.6161.8175.9
119.5116.5118.1119.5
120.7125.4124.9127.5
124.0129.7134.3146.3
153.4150.1150.8156.3
154.9160.9161.0170.2
172.1176.1174.9180.3
185.6187.9186.2
Undis-tributedprofits
12.9
10.610.113.014.4-18.423.425.122.221.318.4
12.518.724.737.345.243.656.367.280.087.9
69.264.234.233.849.525.42.1
45.579.434.8
23.38.2
33.147.680.986.5
17.826.230.818.2
9.55.68.98.7
29.939.330.233.2
28.749.245.567.2
70.176.786.191.0
90.883.389.782.4
90.892.490.9
Inven-
£ation
adjust-ment
-0.3-.2
!o.1
-L2-2.1-1.6-3.7-5.9
-6.6-4.6-6.6
-20.0-39.5-11.0-14.9-16.6-25.0-41.6
-43.0-25.7-9.9-9.1-5.6
1L4-20.7-29.3-17.5
-13.54.0
-7.5-6.6
-13.3-28.1
-1.37.7
-40.0-20.3
17.66.8
-7.6
-2L9-8.6
.2
-14.6-15.6
7.9-4.0
-3.9-9.8
-16.5-22.8
-51.9-42.3-9.3-8.8
-17.4-11.0
2.0
Capitalcon-
sump-tion
adjust-ment
-2.8
-2.2-1.5
1.32.22.73.33.23.33.34.1
3.63.03.93.6
4'.5-11.7-19.5-22.1-26.6
-30.9-20.4-7.4
7.027.347.832.631.026.319.1
7.21.0
5'.39.7
10.97.44.75.6
1.71.1
l!s3.62.6
-11.03.5
-.7
-135.1
-18.411.712.715.3
11.48.98.49.9
13.615.416.8
Netinter-
est
3.1
3.54.04.54.85.36.17.48.8
10.113.2
17.118.119.222.528.328.727.530.636.345.1
58.271.982.576.687.890.698.1
105.3121.0145.9
147.5133.7104.299.697.5
101.3
146.5148.9147.6147.1
142.7137.6131.1123.3
110.2106.0100.899.7
102.5100.298.597.4
95.997.598.798.0
101.2101.8100.9101.4
100.0101.5103.9
i Indirect business tax and nontax liability plus business transfer payments less subsidies.Source: Department of Commerce, Bureau of Economic Analysis.
314
Digitized for FRASER http://fraser.stlouisfed.org/ Federal Reserve Bank of St. Louis
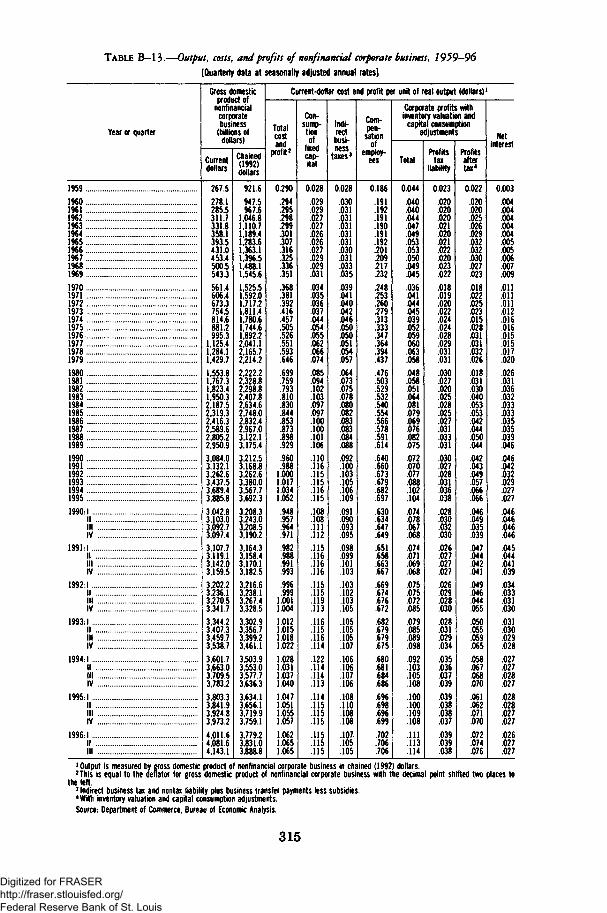
TABLE B-13.—Output, costs, and profits of nonfinancial corporate business, 1959-96[Quarterly data at seasonally adjusted annual rates]
Year or quarter
1959
1960196119621963196419651966196719681969
1970197119721973 .. .197419751976197719781979
198019811982198319841985 . .1986198719881989
199019911992199319941995
1990:1IIIIIIV
1991-1IIIll .IV
1992 1IIIllIV
1993:1 .III I I . . . .IV
1994:1IIIllIV
1995:1IIIllIV
1996:1IIIII
Gross domesticproduct of
nonfinancialcorporatebusiness
(billions ofdollars)
Currentdollars
267.5
278.1285.5311.7331.8358.1393.5431.0453.4500.5543.3
561.4606.4673.3754.5814.6881.2995.3
1,125.41,284.11,429.7
1,553.81,767.31,823.41,950.32,187.52,319.32,416.32,589.62,805.22,950.9
3,084.03,132.13,262.63,437.53,689.43,885.8
3.042.83,103.03,092.73,097.4
3,107.73,119.13,142.03,159.5
3,202.23,236.13,270.53,341.7
3,344.23,407.33,459.73,538.7
3,601.73,663.03,709.53,783.2
3,803.33,841.93,924.83,973.2
4,011.64,081.64,143.1
Chained(1992)dollars
921.6
947.5967.6
1,046.81,110.71,189.41,283.61,363.11,396.51,488.11,545.6
1,525.51,592.01,717.21,811.41,780.61,744.61,892.22,041.12,165.72,214.2
2,222.22,328.82,298.82,407.82,634.62,748.02,832.42,967.03,122.13,175.4
3,212.53,168.83,262.63,380.03,567.73,692.3
3.208.33,243.03,208.53,190.2
3,164.33,158.43,170.13,182.5
3,216.63,238.13,267.43,328.5
3,302.93,356.73,399.23,461.1
3,503.93,553.03,577.73,636.3
3,634.13,656.13,719.93,759.1
3,779.23,831.03,888.8
Current-dollar cost and profit per unit of real output (dollars)1
Totalcostand
profit2
0.290
.294
.295
.298
.299
.301
.307
.316
.325
.336
.351
.368
.381
.392
.416
.457
.505
.526
.551
.593
.646
.699
.759
.793
.810
.830
.844
.853
.873
.898
.929
.960
.9881.0001.0171.0341.052
.948
.957
.964
.971
.982
.988
.991
.993
.996
.9991.0011.004
1.0121.0151.0181.022
1.0281.0311.0371.040
1.0471.0511.0551.057
1.0621.0651.065
Con-sump-tionof
fixedcap-ital
0.028
.029
.029
.027
.027
.026
.026
.027
.029
.029
.031
.034
.035
.036
.037
.044
.054
.055
.062
.066
.074
.085
.094
.102
.103
.097
.097
.100
.100
.101
.106
.110
.116
.115
.115
.116
.115
.108
.108
.111
.112
.115
.116
.116
.116
.115
.115
.119
.113
.116
.115
.116
.114
.122
.114
.114
.113
.114
.115
.115
.115
.115
.115
.115
Indi-rectbusi-ness
taxes3
0.028
.030
.031
.031
.031
.031
.031
.030
.031
.033
.035
.039
.041
.040
.042
.046
.050
.050
.051
.054
.057
.064
.073
.075
.078
.080
.082
.083
.083
.084
.088
.092
.100
.103
.105
.106
.109
.091
.090
.093
.095
.098
.099
.101
.103
.103
.102
.103
.105
.105
.105
.105
.107
.106
.106
.107
.106
.108
.110
.108
.108
.107
.105
.105
Com-pen-
sationof
employ-ees
0.186
.191
.192
.191
.190
.191
.192
.201
.209
.217
.232
.248
.253
.260
.279
.313
.333
.347
.364
.394
.437
.476
.503
.529
.532
.540
.554
.566
.578
.591
.614
.640
.660
.673
.679
.682
.697
!647.649
.651
.658
.663
.667
.669
.674
.676
.672
.682
.679
.679
.675
.680
.681
.684
.686
.696
.698
.696
.699
.702
.706
.706
Corporate profits withinventory valuation and
capital consumptionadjustments
Total
0.044
.040
.040
.044
.047
.049
.053
.053
.050
.049
.045
.036
.041
.044
.045
.039
.052
.059
.060
.063
.058
.048
.058
.051
.064
.081
.079
.069
.076
.082
.075
.072
.070
.077
.088
.102
.104
.074
.078
.067
.068
.074
.071
.069
.068
.075
.075
.072
.085
.079
.085
.089
.098
.092
.103
.105
.108
.100
.100
.109
.108
.111
.113
.114
Profitstax
liability
0.023
.020
.020
.020
.021
.020
.021
.022
.020
.023
.022
.018
.019
.020
.022
.024
.024
.028
.029
.031
.031
.030
.027
.020
.025
.028
.025
.027
.031
.033
.031
.030
.027
.028
.031
.036
.038
.028
.030
.032
.030
.026
.027
.027
.027
.026
.029
.028
.030
.028
.031
.029
.034
.035
.036
.037
.039
.039
.038
.038
.037
.039
.039
.038
Profitsaftertax4
0.022
.020
.020
.025
.026
.029
.032
.032
.030
.027
.023
.018
.022
.025
.023
.015
.031
.031
.032
.026
.018
.031
.030
.040
.053
.053
.042
.044
.050
.044
.042
.043
.049
.057
.066
.066
.046
.049
.035
.039
.047
.044
.042
.041
.049
.046
.044
.055
.050
.055
.059
.065
.058
.067
.068
.070
.061
.062
.071
.070
.072
.074
.076
Netinterest
0.003
.004
.004
.004
.004
.004
.005
.005
.006
.007
.009
.011
.011
.011
.012
.016
.016
.015
.015
.017
.020
.026
.031
.036
.032
.033
.033
.035
.035
.039
.046
.046
.042
.032
.029
.027
.027
.046
.046
.046
.046
.045
.044
.041
.039
.034
.033
.031
.030
.031
.030
.029
.028
.027
.027
.028
.027
.028
.028
.027
.027
.026
.027
.027
'Output is measured by gross domestic product of nonfinancial corporate business in chained (1992) dollars.2 This is equal to the deflator for gross domestic product of nonfinancial corporate business with the decimal point shifted two places tothe ten.3 Indirect business tax and nontax liability plus business transfer payments less subsidies.4 With inventory valuation and capital consumption adjustments.
Source.- Department of Commerce, Bureau of Economic Analysis.
315
Digitized for FRASER http://fraser.stlouisfed.org/ Federal Reserve Bank of St. Louis
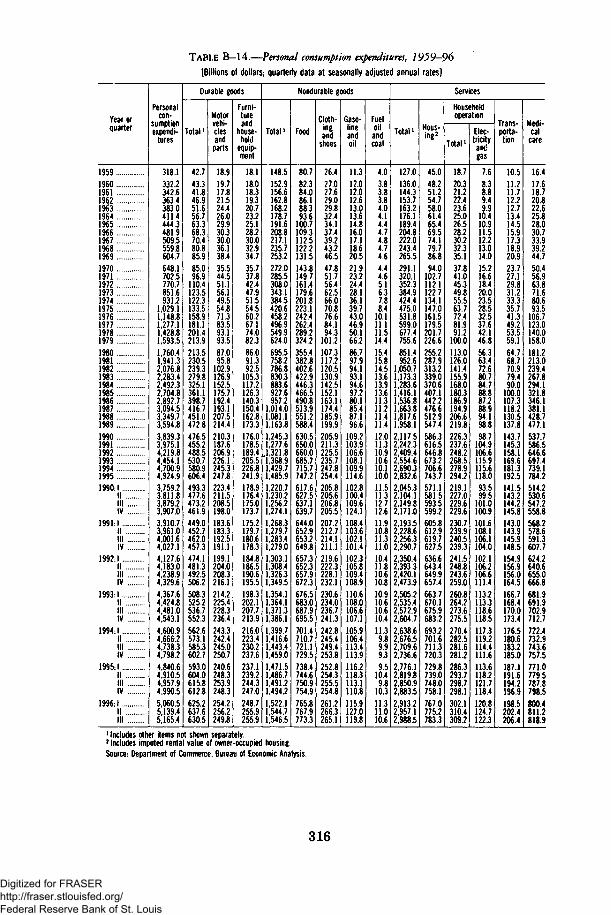
TABLE B-14.—Personal consumption expenditures, 1959-96
[Billions of dollars,- quarterly data at seasonally adjusted annual rates]
Year orquarter
1959196019611962196319641965196619671968196919701971197219731974197519761977197819791980198119821983 .19841985198619871988198919901991199219931994 .19951990:1
IIIllIV
1991:1IIIllIV
1992:1IIIllIV
1993:1IIIllIV
1994:1IIIllIV
1995:1IIIllIV
1996:1IIIll
Personalcon-
sumptionexpendi-
tures
318.13322342.6363.43830411.44443481.9509.5559.8604.76481702.5770.7851.6931.2
102911,148.8127711,428.81,593.51 76041,941.32,076.8228342,492.3270482,892.73,094.5334973;594!83,839.33,975.14,219.84,454.1470094,924.93,759.23.811.83,879.23,907.03,910.73,961.04,001.64,027.14,127.64,183.04,238.94,329.64,367.64,424.84,481.04,543.14,600.94,666.24,738.34,798.24,840.64,910.54,957.94,990.55,060.55,139.45,165.4
Durable goods
Total1
42.743341.846.951656.763.368.370.480.885.985096.9
110.4123.5122.31335158.9181 1201.4213.92135230.5239.3279.8325.1361 1398.7416.74510472.8476.5455.2488.5530.7580.9606.4493.3477.6473.2461.9449.0452.7462.0457.3474.1481.3492.5506.2508.3525.2536.7552.3562.6573.1585.3602.7593.0604.0615.8612.8625.2637.6630.5
Motorvehi-clesand
parts
18.919.717.821.524.426.029.930.330.036.138.435.544.551.156.149.554.871.383593.193.587095.8
102.9126.9152.51757192.4193.12075214.4210.3187.6206.9226.1245.3247.8223.4211.5208.5198.0183.6183.3192.5191.1199.1204.0208.3216.1214.2225.4228.3236.4243.3242.4245.0250.7240.6248.3253.9248.3254.2256.2249.8
Furni-tureand
house-hold
equip-rncnt
18.118.018.319.320.723.225.128.230.032.934.735.737.842.447.951.554.560.267174.082.386.091.392.5
105.3117.21263140.3150.41628173.3176.0178.5189.4205.5226.8241.9178.9176.4175.0173.7175.2179.7180.6178.3184.8186.5190.6195.5198.3202.1207.7213.9216.0223.4230.2237.6237.1239.2244.3247.0248.7255.9255.9
Nondurable goods
Total1
148.5152.9156.6162.8168.2178.7191.6208.8217.1235.7253.2272.0285.5308.0343.1384.5420.6458.2496.9549.9624.0695.5758.2786.8830.3883.6927.6957.2
1,014.01081 11,163.81,245.31,277.6
,1,321.81,368.91,429.71,485.91,220.71,230.21,256.21,274.11,268.31,279.71,283.41,279.01,303.11,308.41,326.31,349.51,354.11,364.11,371.31,386.11,399.71,416.61,443.41,459.01,471.51,486.71,491.21,494.21,522.11,544.71,546.5
Food
80.782384.086.188.393.6
1007109.3112.5122.2131.51438149.7161.4179.6201.82231242.42624289.2324.23554382.8402.6422.9446.34665490.8513.95512588.4630.5650.0660.0685.77157747.2617.6627.5637.1639.7644.0652.9653.2649.8657.3652.3657.9672.3676.5683.0687.9695.5701.4710.7721.1729.5738.4744.6750.9754.9765.8767.9773.3
Cloth-
an'dshoes
26.427027.629.029.832.434.137.439.243.246.547.851.756.462.566.070876.684194.3
101.2107.3117.2120.5130.9142.51521163.1174.41859199.9205.9211.3225.5235.7247.8254.4205.8205.6206.8205.5207.2212.7214.1211.1219.6222.3228.1232.1230.6234.0236.7241.3242.8245.4249.4253.8252.8254.3255.5254.8261.2266.3265.1
Gaso-lineanrlOlIU
oil
11.312012.012.613.013.614816.017.118.620.521923.224.428.136.139743.046950.166.286797.994.193194.697280.185.487196.6
109.2103.9106.6108.1109.9114.6102.8100.4109.6124.1108.4103.6102.1101.4102.3105.8109.4108.9110.6108.0106.6107.1105.9106.4113.4113.9116.2118.3113.1110.8115.9127.0119.8
Fueloil
andcoal
4.0383.83.84.04.14.44.74.84.74.64.44.65.16.37.884
10.111 111.514.415415.814.513.613.913611.311.211411.412.011.310.910.610.110.011.511.312.712.611.910.811.311.010.411.810.610.810.910.610.610.411.39.89.99.39.5
10.49.8
10.311.311.010.6
Services
Total1
127.0136.0144.3153.7163.2176.1189.4204.8222.0243.4265.5291.1320.1352.3384.9424.4475.0531.85990677.4755.68514952.6
1,050.71,173.31,283.6141611,536.81,663.8181761,958.12,117.52,242.32,409.42,554.62,690.32,832.62,045.32.104.12,149.82,171.02,193.52,228.62,256.32,290.72,350.42,393.32,420.12,473.92,505.22,535.42,572.92,604.72,638.62,676.52,709.62,736.62,776.12,819.82,850.92,883.52,913.22,957.12,988.5
Hous-jno2ing
45.048.251.254.758.061.465.469.574.179.786.894.0
102.7112.1122.7134.1147.0161.51795201.7226.6255.2287.9313.2339.0370.6407.1442.2476.65129547.4586.3616.5646.8673.2706.6743.7571.1581.5593.5599.2605.8612.9619.7627.5636.6643.4649.9657.4663.7670.1675.9683.2693.2701.6711.3720.3729.8739.0748.0758.1767.0775.2783.3
Householdoperation
Total1
18.720321.222.423.625.026.528.230.232.335.137.841.045.349.855.563772.481991.2
100.01130126.0141.4155.9168.01803186.9194.92066219.8226.3237.6248.2268.52789294.2219.1227.0229.6229.6230.7239.9240.5239.3241.5248.8243.6259.0260.8264.2273.6275.5270.4282.5281.6281.2286.3293.7298.7298.1302.1310.4309.2
Elec-tricityandgas
7.68.38.89.49.9
10.410.911.512.213.014.015.216.618.420.023.528.532.537642.146.856.363.472.680.784.788.887.288.994198.898.7
104.9106.6115.9115.6118.093.599.5
101.0100.9101.6108.1106.1104.0102.1106.2106.6111.4113.2113.3118.6118.5117.3119.2114.4111.6113.6118.2121.7118.4120.8124.7122.3
Trans-porta-tion
10.511211.712.212713.414.515.917.318.920.923727.129.831.233.335741.349253.559.164768.770.979.490.0
1000107.3118.21305137!8143.7145.3158.1169.6181.3192.5141.5143.2144.2145.8143.0143.9145.9148.5154.9156.9156.0164.5166.7168.4170.0173.4176.5180.6183.2185.0187.1191.6194.2196.9198.5202.4206.4
Medi-cal
care
16.417618.720.822625.828030.733.939.244.750456.963.871.680.6935
106.71230140.0158.018122110239.42678294.13218346.1381.14287477il537.7586.5646.6697.47391784.2514.2530.6547.2558.8568.2578.6591.3607.7624.2640.6655.0666.8681.9691.9702.9712.7722.4732.9743.6757.5771.0779.5787.8798.5800.4811.2818.9
1 Includes other items not shown separately.2 Includes imputed rental value of owner-occupied housing.Source-. Department of Commerce, Bureau of Economic Analysis.
316
Digitized for FRASER http://fraser.stlouisfed.org/ Federal Reserve Bank of St. Louis

TABLE B-15.—Real personal consumption expenditures, 1959-96
[Billions of chained (1992) dollars; quarterly data at seasonally adjusted annual rates]
Year orquarter
19591960196119621963196419651966196719681969197019711972197319741975197619771978197919801981198219831984198519861987198819891990199119921993199419951990:1
I II l lIV
1991:1I II l lIV
1992:1I II l lIV
1993:1IIIllIV
1994:1I IIllIV
1995:1I II l lIV
1996:1III I I
Personalcon-
sumptionexpendi-
tures
1,394.61,432.61,461.51,533.81,596.61,692.31 79911,902.0195862',070:22,147.52,197.82,279.52,415.9253262^514.72,570.02,714.32,829.82,951.63,020.23,009.73,046.43,081.53,240.63,407.63,566.53,708.7382233i972.74,064.64,132.24,105.84,219.84,339.54,473.24,577.84,128.94,134.74,148.54,116.44,084.54,110.04,119.54,109.14,173.84,196.44,226.74,282.34,289.74,318.84,359.54,390.04,420.54,458.74,489.44,524.04,534.84,569.94,597.34,609.44,649.14,687.64,693.5
Durable goods
Total1
103.1105.2101.2113.0124.0135.51526165.51681186.6193.3187.0205.7231.92558238.2238.1268.5293.4308.8307.3282.6285.8285.5327.43749411.4448.44549483.5496.2493.3462.0488.5524.1562.0579.8511.2495.4490.4476.3458.6460.5467.3461.5476.1481.1491.9505.0506.0519.6528.9541.9549.6555.4563.1579.8566.5576.2589.1587.5599.2615.6611.6
Motorvehi-clesand
parts
53.556.851.260.868.472.484085.583697.2
101.291.2
108.7124.31357112.5113.2136.8151.5158.0147.4127.5130.5133.9160.5187.7211.2224.82162229.4230.3224.3193.2206.9218.6228.2221.1237.6226.4223.1210.0191.4189.6197.2194.6201.7204.5207.4213.9210.8219.0
* 219.1225.3230.3226.6226.5229.4216.3220.9226.4220.6224.2225.9220.0
Furni-tureand
house-hold
equip-ment
31.731.331.933.936.441.144950.753156.558.058.660.967.574875.673.978.885.590.595.493.593.591.3
103.5115.5125.3140.61499160.8170.9173.5177.0189.4208.4230.1251.1176.0173.9172.5171.5173.0177.7179.2178.0183.7186.0191.3196.4200.7205.0211.0216.8219.0226.1232.6242.6243.1247.1254.1259.9264.1276.0279.0
Nondurable goods
Total1
606.3615.4626.7646.5660.0692,57293769.27814816.9838.6859.1874.5912.99429924.5938.3984.8
1,010.41,045.71,069.71,065.11,074.31,080.61,112.41,151.81,178.31,215.9123931,274.41,303.51,316.11,302.91,321.81,348.81,390.51,421.91,319.21,316.91,319.81,308.41,300.61,308.01,307.11,295.71,314.41,312.01,321.11,339.81,336.91,344.51,354.01,359.91,372.91,383.91,397.01,408.11,416.61,422.91,424.71,423.21,436.11,440.91,442.2
Food
355.9358.7362.7367.3371.4386.34079424.74302450.9462.5477.2481.6496.84984490.6502.6529.4541.2545.7555.1558.7557.9565.1579.7589.9602.2614.06208641.6650.1662.9659.6660.0674.3689.1702.1659.0664.2665.5662.9658.7661.5661.6656.5661.0653.9656.4668.6670.5672.9675.7677.9682.3688.6690.5694.9700.5701.3703.6703.0709.2704.9701.6
Cloth-ingon/4dllu
shoes
68.669.370.673.775.181.084390.090594.396.094.899.4
106.11135111.9115.7121.2127.8139.9145.8148.1156.0157.1167.3179.9186.5199.92054210.0220.7217.9215.9225.5233.3247.2257.2221.5217.3217.6215.1214.0218.9217.5213.1220.4223.2227.7230.9227.4232.3235.0238.6241.1243.3249.0255.5254.6257.9258.8257.3262.5268.9271.0
Gaso-lineandoil
46.948.549.051.152.755.558261.863868.272.877.381.184.488884.486.990.493.295.394.088.689.991.093.095.997.8
102.51053106.5108.1107.3103.4106.6109.1110.4113.3109.3107.5107.4104.9103.3104.0103.8102.5104.8106.1108.2107.3108.2108.0110.9109.3108.8109.5111.6111.6113.4113.6112.5113.7112.6114.3113.4
Fueloilonridill)
coal
26.725.624.424.325.526.527728.528627.025.623.823.025.327521.721.323.923.123.021.316.513.812.812.91?813.013.413013.212.611.210.810.910.710.310.310.711.812.39.9
10.410.811.410.610.511.910.510.710.910.610.710.611.410.010.29.69.9
10.610.010.710.710.110.1
Services
Total1
687.4717.4746.5783.4818.7868.49146961.0
100761,059.61,110.81,155.41,197.91,262.5131941,351.21,398.31,457.11,518.21,589.31,639.81,670.71,696.11,728.21,809.01,883.01,977.32,041.4212692,212.42,262.32,321.32,341.02,409.42,466.72,521.42,577.02,295.72,321.12,337.32,331.22,325.32,341.52,345.02,352.02,383.22,403.22,413.62,437.62,446.82,454.92,476.72,488.52,498.52,519.92,530.02,537.32,552.52,571.62,584.62,599.32,614.72,632.32,640.6
Hous-inn 2ing
195.4205.6215.3227.4237.9249.02626274.62868300.9316.8329.3343.5361.53794399.1410.6422.9433.3454.5472.7486.6497.8500.9511.8531.8551.1565.55834600.9614.6627.2635.2646.8655.0668.2681.7623.4626.3628.5630.6631.6634.1636.4638.6642.6645.5648.5650.6652.2653.5655.9658.5662.1666.1670.7674.1677.4680.0683.2686.3689.0691.6693.9
Householdoperation
Total1
79.783.586.590.794.699.2
1042109.81153119.9125.9130.2132.2138.91460147.5154.6161.4170.3178.6183.3187.4185.9187.0193.0197.7205.6209.82194229.2237.6240.1243.4248.2261.2266.0276.8233.7241.3243.7241.9238.2246.9246.1242.5243.6249.9243.3256.1257.0258.0264.9265.0258.8269.8268.1267.2270.1277.2280.8278.9280.8285.6282.2
Elec-tricity
andgas
36.938.940.943.745.848.350653.456459.462.765.467.270.872873.777.880.584.487.688.390.789.490.393.093.696.195.1984
103.4105.6103.7107.0106.6112.4111.5113.698.6
104.8106.2105.3103.5110.9108.5105.1103.2106.8106.6109.7111.6110.0114.1113.7112.9115.2110.4107.6109,4114.3117.2113.4115.4117.9114.4
Trans-porta-tion
55.156.957.559.762.165.468472.77 7 281.986.589.192.398.1
1006101.1103.0107.3114.8118.0121.7115.6111.7109.9117.0128.6140.6145.71510159.0160.8159.9152.3158.1162.6171.3177.0161.7160.9159.7157.3152.6152.1151.8152.6155.4156.7160.5159.6160.6161.5162.8165.7168.2170.3172.1174.5175.6175.9176.4180.0182.5183.3185.2
Medi-cal
care
132.7136.7141.7153.3162.7180.51889197.62048220.8237.2250.8268.3286.4307.6320.2337.3353.5371.2385.7401.1415.5436.4442.2459.74724490.7510.3537.3561.3575.8602.8621.6646.6658.8668.8684.1591.9600.7608.0610.6614.3617.9623.3630.8638.2645.9650.3652.2656.6
.657.5659.7661.4663.2667.6670.4674.2677.8681.3686.0691.2691.1696.1699.7
1 Includes other items not shown separately.2 Includes imputed rental value of owner-occupied housing.Source: Department of Commerce, Bureau of Economic Analysis.
317
Digitized for FRASER http://fraser.stlouisfed.org/ Federal Reserve Bank of St. Louis

TABLE B-16.—Private gross fixed investment by type, 1959-96
[Billions of dollars; quarterly data at seasonally adjusted annua l rates]
Year orquarter
19591960196119621963196419651966196719681969197019711972197319741975197619771978197919801981198219831984198519861987198819891990199119921993199419951990:1 ....
II ...Ill ..IV ..
1991:1 ....II ...lit ..IV ..
1992:1 ....II ...Ill ..IV ..
1993:1 ....II ...Ill ..IV ..
1994:1 ....II ...Ill ..IV ..
1995:1 ....II ...I I I . .IV ..
1996:1 ....II ...Ill ..
.Private
fixedinvest-
74.675.575.081.887.796.7
108.3116.7117.6130.8145.5148.1167.5195.7225.4231.5231.7269.6333.5403.6464.0
473.5528.1515.6552.0648.1688.9712.9722.9763.1797.5791.6738.5783.4850.5954.9
1,028.2
813.9794.0791.2767.5739.7736.2738.6739.5755.4780.5788.1809.7
823.8834.3851.8892.3917.4942.0968.9991.4
1,013.91,016.31,036.61,046.2
1,070.71,088.01,119.6
Nonresidential
Totalnon-
dential
46.549.248.652.855.662.474.184.485.292.1
102.9106.7111.7126.1150.0165.6169.0187.2223.2272.0323.0
350.3405.4409.9399.4468.3502.0494.8495.4530.6566.2575.9547.3557.9598.8667.2738.5581.2571.6580.3570.6555.4550.2544.3539.2544.1556.8561.0569.6
580.3591.1599.2624.6
638.8653.5678.5697.9
723.6734.4746.3749.7
769.0773.8807.0
Structures
Total >
18.119.619.720.821.223.728.331.331.533.637.740.342.747.255.061.261.465.974.691.4
114.9133.9164.6175.0152.7176.0193.3175.8172.1181.3192.3200.8181.7169.2171.8180.2199.7201.9202.4203.5195.4192.3187.6176.1170.8171.6170.4167.6167.1170.2169.7171.4175.8171.8179.1181.0188.8194.5197.6202.5204.0208.4207.4213.5
Non-resi-
dentialbuildingsincluding
farm
10.612.012.713.713.915.819.521.320.621.124.425.427.130.135.538.335.635.939.949.765.773.786.394.590.5
110.0128.0123.3126.0133.3142.7148.9126.1113.2116.6126.2142.0150.8151.2151.4142.1136.4130.9121.4115.7117.2114.0110.6111.0113.6113.8117.1121.8118.7125.3126.4134.4137.9140.3144.0145.8147.3146.2151.1
Utili-ties
4.95.04.64.65.05.46.17.17.89.29.6
11.111.913.115.016.517.120.021.524.127.530.233.032.528.730.030.631.226.527.129.427.531.634.532.033.738.527.027.027.528.430.031.332.333.034.334.834.734.232.831.931.731.732.333.034.235.236.337.939.740.240.941.541.3
Min ingexplo-ration,shafts,
andwells
2.52.32.32.52.32.42.42.52.42.62.82.82.73.13.55.27.48.6
11.515.419.027.442.544.830.031.327.915.713.115.714.417.517.113.315.613.512.016.817.617.618.119.418.915.215.012.813.313.313.815.816.015.515.114.414.113.012.413.211.511.911.413.914.115.0
Producers' durable equipment
Total1
28.329.728.932.134.438.745.853.053.758.565.266.469.178.995.1
104.3107.6121.2148.7180.6208.1216.4240.9234.9246.7292.3308.7319.0323.3349.3373.9375.1365.6388.7427.0487.0538.8379.3369.2376.7375.1363.1362.6368.2368.4
372.5386.3393.4402.5
410.1421.3427.7448.8
467.0474.4497.5509.1529.0536.8543.8545.7
560.6566.3593.5
Information processingand related equipment
Total
4.04.75.15.46.16.87.89.6
10.010.612.914.314.916.519.822.923.527.233.141.849.958.969.572.782.098.6
104.2108.8109.8118.2127.1124.2122.6134.2141.8160.4183.2127.8123.9121.5123.4119.3121.6123.5125.9129.2133.0137.7136.8136.8137.9144.5148.0152.5157.7161.6169.9174.6183.3183.1191.8198.2200.8212.2
Comput-ers andperiph-
eralequip-ment2
0.0.2.3.3.7.9
1.21.71.91.92.42.72.83.53.53.93.64.45.77.6
10.212.517.118.923.931.633.733.435.838.143.338.938.143.948.754.563.641.338.936.838.636.737.237.840.741.944.444.644.947.246.849.751.252.153.754.457.758.462.863.369.773.774.279.3
Other
4.04.54.85.15.35.86.67.98.18.6
10.411.612.113.116.319.019.922.827.534.239.846.452.353.958.167.070.575.474.080.183.885.284.590.293.0
106.0119.686.585.084.784.782.784.585.685.287.388.693.191.989.691.094.896.8
100.4104.0107.2112.2116.2120.6119.7122.0124.5126.6132.9
Indus-trialu idi
equip-merit
8.49.38.79.2
10.011.413.616.116.817.218.920.219.421.325.930.531.133.939.247.455.860.465.262.258.267.471.774.675.982.991.589.886.489.397.6
109.7124.5
91.788.990.388.187.886.486.385.286.287.790.592.894.395.697.8
102.8105.4107.6111.3114.6120.4126.9125.8124.9127.9131.2128.7
Trans-porta-tionand
relatedequip-ment
8.38.58.09.89.4
10.613.214.514.317.618.916.218.421.826.626.325.230.039.347.353.648.450.646.853.764.869.771.870.476.071.275.579.586.299.2
117.1124.9
74.071.478.578.378.177.381.980.679.587.885,591.994.0
100.997.0
105.1113.0110.5122.9122.1127.2121.0128.4123.0125.3123.7137.7
Resi-den-tial
28.126.326.429.032.134.334.232.332.438.742.641.455.869.775.366.062.782.5
110.3131.6141.0123.2122.6105.7152.5179.8186.9218.1227.6232.5231.3215.7191.2225.6251.7287.7289.8232.7222.4210.9196.9184.3185.9194.3200.3
211.3223.7227.1240.1243.5243.2252.6267.7
278.5288.5290.4293.5290.4281.9290.3296.5301.7314.2312.6
1 Includes other items, not shown separately.2 Includes new computers and peripheral equipment only.Source: Department of Commerce, Bureau of Economic Analysis.
318
Digitized for FRASER http://fraser.stlouisfed.org/ Federal Reserve Bank of St. Louis

TABLE B-17.—Real private gross fixed investment by type, 1959-96
[Billions of chained (1992) dollars; quarterly data at seasonally adjusted annual rates]
Year orquarter
19591960196119621963196419651966196719681969197019711972197319741975197619771978197919801981198219831984198519861987198819891990199119921993199419951990:1 ....
II ...Ill ..IV ..
1991:1 ....II ...Ill ..IV ..
1992:1 ....II ...Ill ..IV ..
1993:1 ....II ...Ill ..IV ..
1994:1 ....I I . . .Ill ..IV ..
1995:1 ....II ...Ill ..I V . .
1996:1 ....I I . . .Ill ..
Priuatprl IVdlcfixed
invest-
267.1269.22679292.0313.7343.7378.5399.13910418.1442.9432.1464.9520.3567.5530.2471.0517.6593.7660.8695.6648.4660.6610.4654.2762.4799.3805.0799.4818.3832.0805.8741.3783.4836.4921.1975.9834.7811.2803.1774.4
742.6739.4741.0742.0758.3782.4787.3805.8815.4821.1835.4873.5
892.4911.4930.8949.7
969.5965.7980.0988.5
1,013.31,031.11,057.5
Nonresidential
Totalnon-
dential
147.7155.91545168.0176.4197.12313259.42553266.4285.6
282.8282.4307.7352.5354.4317.3332.6371.8422.6463.3461.1485.7464.3456.4535.4568.4548.5542.4566.0588.8585.2547.7557.9593.6652.1714.3595.3583.4588.1573.9555.1550.9545.3539.5544.4557.5560.6569.1577.5586.4593.1617.6628.5639.5660.5679.7
704.4710.5719.0723.3
743.5750.5781.4
Structures
Total1
85.892.693998.199.2
109.51269135.61322134.1141.3141.7139.4143.7155.4152.2136.2139.6146.4162.3182.7195.0210.4207.2185.7212.2227.8203.3195.9196.8201.2203.3181.6169.2166.3168.8181.1206.5205.5205.2196.0192.2187.2175.5171.4172.7171.0167.4165.6167.0164.8165.1168.2163.0169.0169.1174.3178.5180.0182.8183.2186.6184.9188.6
Non-resi-
dentialbuildingsincluding
farm
52.459.963367467.575.089494.288786^292.791.189.491.8
100.397.682.580.683.695.3
113.5114.4122.8126.6117.6137.6155.2144.5142.4145.3150.2152.0126.9113.2112.8117.7127.9155.4154.7153.8143.8137.6131.7121.7116.4118.1114.4110.4109.8111.4110.6112.7116.3112.4117.8117.4123.3125.4126.8129.2130.3131.4129.7133.0
Utili-ties
20.220.418919.020.422.224.427.829833.333.435.736.137.640.037.634.438.038.240.041.341.242.039.534.235.435.636.530.730.030.928.132.034.531.131.735.127.727.628.128.930.431.732.633.334.634.834.633.932.431.030.730.530.731.232.132.733.734.835.836.036.436.836.4
Miningexplo-ration,shafts,
andwells
11.010.310511.010.411.111.010.499
10.010.49.89.19.7
10.412.314.415.618.020.021.330.034.932.226.730.327.015.815.515.813.916.115.713.314.812.611.215.816.316.116.317.317.014.014.412.713.313.413.715.215.214.614.213.413.312.211.512.510.711.010.512.812.913.5
Producers' durable equipment
Total1
71.474.372581.087.198.1
1159133.81325140.5152.2149.5150.7169.8201.2205.4183.9195.2225.6259.6280.7
268.2278.2260.3272.4324.6342.4345.9346.9369.2387.6381.9366.2388.7427.6484.1534.5388.8377.8383.0377.9362.9363.8369.8368.1371.7386.4393.1403.5410.5421.7428.2449.8
466.4471.1492.5506.5
527.2531.7537.4541.4558.3567.5595.0
Information processingand related equipment
Total
2.53.0323i4.14.6557.175s!o9.7
10.711.412.915.417.516.919.424.131.738.645.452.554.563.479.888.094.197.5
106.6116.2116.2117.8134.2147.1170.4201.1119.2116.1113.8115.7112.5116.2119.7122.5126.7132.4138.6138.9139.5142.2150.7156.0161.2166.6171.6182.4189.1199.7201.4214.4225.5234.1250.5
Comput-ers andperiph-
eralequip-ment2
o.'i'.1.1.2.2.2.2.3.5
1.01.52.43.84.77.1
11.614.516.721.024.029.429.432.443.956.269.391.530.629.327.929.929.230.833.236.639.243.445.747.551.152.958.362.564.567.169.376.380.288.291.9
105.6117.2126.3138.9
Other
9.811.111812.513.014.116.018.918919.522.824.524.726.031.734.833.336.643.852.459.564.968.567.070.479.081.984.680.285.788.188.285.990.291.5
102.6114.289.888.287.687.184.386.287.186.287.788.992.891.588.689.693.194.697.8
100.8103.6108.3111.5115.1114.0116.2118.1119.7125.5
Indus-triallildl
equip-ment
38.841.939741.845.151.060.269.269568.172.673.767.773.086.292.878.679.083.693.099.895.594.185.578.589.994.193.591.195.3
101.595.088.389.396.3
105.9116.298.694.895.191.489.788.788.486.486.888.189.892.693.794.496.3
100.7102.8104.3107.0109.4114.2118.4116.6115.4117.8120.6118.0
Trans-porta-
tionand
relatedequip-ment
28.028.827033:432.136.345550.148458.260.549.753.662.375.067.958.465.079.187.391.074.272.063.771.785.188.485.682.187.178.981.281.786.297.5
111.7118.180.377.484.382.881.279.983.981.679.987.985.491.593.099.595.0
102.7109.0105.3115.8116.6121.9114.9120.3115.4117.5114.9126.5
Resi-den-tial
131.1121.81222133.9149.6158.31537140.01356154.0158.6149.1190.0223.7222.3176.4153.5189.7229.8245.0236.0
186.1171.2140.1197.6226.4229.5257.0257.6252.5243.2
220.6193.4225.6242.7268.9262.8239.4227.8214.9200.3187.4188.3195.6202.4
213.9224.9226.7236.7
237.9234.8242.2255.8
263.6271.6270.3270.3
265.9256.5262.2266.3
271.1281.5277.8
1 Includes other items, not shown separately.2 Includes new computers and peripheral equipment only.Source: Department of Commerce, Bureau of Economic Analysis.
319
Digitized for FRASER http://fraser.stlouisfed.org/ Federal Reserve Bank of St. Louis

TABLE B-18.—Government consumption expenditures and gross investment by type, 1959-96
[Billions of dollars; quarterly data at seasonally adjusted annual rates]
Year orquarter
19591960196119621963196419651966196719681969197019711972197319741975197619771978197919801981198219831984198519861987198819891990199119921993199419951990:1 ....
II ...Ill ..IV ..
1991:1 ....II ...Ill ..IV ..
1992:1 ....II ...Ill ..IV ..
1993:1 ....II ...Ill ..IV ..
1994:1 ....II ...Ill ..IV ..
1995:1 ....II ...Ill ..IV ..
1996:1 ....II ...Ill ..
Government consumption expenditures and gross investment
TntflllU ld l
112.0113.2120.9131.4137.7144.4153.0173.6194.6212.1223.8236.1249.9268.9287.6323.2362.6385.9416.9457.9507.1572.8633.4684.8735.7796.6875.0938.5992.8
1,032.01,095.11,176.11,225.91,263.81,290.41,314.71,358.31,153.01,164.31,176.91,210.41,220.61,227.41,226.51,229.21,247.91,256.41,270.71,280.01,279.31,285.11,294.11,303.21,296.41,300.81,328.21,333.51,345.81,359.41,364.61,363.41,383.71,408.81,414.8
Federal
Total
67.265.669.176.578.179.481.894.1
106.6113.8115.8115.9117.1125.1128.2139.9154.5162.7178.4194.4215.0248.4284.1313.2344.5372.6410.1435.2455.7457.3477.2503.6522.6528.0522.6516.4516.6496.4500.1501.2516.7525.6528.2520.9515.5521.8523.2532.0535.0525.5520.1521.3523.5511.3509.4523.8520.9519.7522.0516.8507.7518.6529.6525.5
National defense
TntallOldl
55.754.957.762.362.261.362.073.485.592.092.490.688.793.294.7
101.9110.9116.1125.8135.6151.2174.2202.0230.9255.0282.7312.4332.4350.4354.0360.6373.1383.5375.8362.7352.0345.5369.7370.6368.9383.3389.7389.3382.1373.0372.8374.1380.9375.3365.7362.7361.2361.3346.7349.3362.3349.7347.6351.7345.7337.1343.9353.7348.8
Pnn.\A1H~
sump-110 II
expend-itures
42.042.543.947.849.649.952.061.271.378.980.078.679.282.383.790.197.0
101.3109.6118.4130.7150.9174.3197.6214.9236.3257.6272.7287.6297.9303.3312.7325.4319.7313.5305.8302.3311.7310.8307.3321.0331.3328.6323.1318.5317.2317.3323.5320.7314.4312.6315.1312.0301.3303.4313.5305.0302.8304.8301.4300.1298.7307.4304.7
Pinvestment
Struc-tures
2.52.22.42.01.61.31.11.31.21.21.51.31.81.82.12.22.32.12.42.52.53.23.24.04.84.96.26.87.77.46.46.14.65.24.84.95.36.36.36.45.34.84.84.54.55.25.54.85.54.74.74.94.74.84.75.14.95.74.95.55.35.05.15.1
Equip-ment
11.210.111.512.511.010.28.9
11.013.011.810.910.77.79.18.99.7
11.612.613.814.618.020.124.529.435.441.548.552.955.148.751.054.353.550.944.441.437.951.753.555.257.053.655.954.550.050.451.452.749.146.645.541.144.640.741.343.839.839.142.138.831.740.141.239.0
Nondefense
TntalI UUH
11.510.811.414.215.918.119.720.721.021.823.425.328.331.933.538.043.646.652.658.963.874.282.282.389.489.997.7
102.9105.3103.3116.7130.4139.1152.2159.9164.3171.0126.7129.5132.3133.3136.0138.9138.8142.6149.0149.1151.1159.7159.8157.4160.1162.2164.6160.0161.5171.2172.1170.3171.1170.6174.7175.8176.7
Con-sump-
tinnUOIIexpend-
itures
9.98.89.0
11.312.414.015.115.917.018.220.021.924.627.829.233.238.040.445.750.455.264.371.772.378.277.984.989.790.789.9
101.9113.9120.6131.4138.4144.9151.5110.0112.9115.9116.7119.3120.5120.6122.0128.5129.1130.9137.0136.9135.9138.4142.3145.4141.7142.2150.4151.8150.8152.2151.3154.9156.1156.6
«investment
Struc-tures
1.51.71.92.12.32.52.82.82.22.11.92.12.52.73.13.44.14.65.06.16.37.17.76.86.77.07.38.09.06.86.98.09.2
10.311.210.510.18.28.18.17.67.79.19.1
10.810.310.29.6
11.011.710.811.311.010.69.9
10.011.511.010.29.39.99.7
10.09.6
Equip-ment
0.20.30.50.81.11.61.82.01.81.61.51.31.31.31.21.41.41.61.92.32.42.92.83.24.55.05.45.25.66.67.98.69.3
10.510.38.99.48.58.48.39.19.09.39.19.8
10.19.9
10.511.611.210.710.58.98.58.49.49.49.39.39.69.4
10.19.7
10.5
State and local
Total
44.847.651.855.059.665.071.279.588.198.3
108.0120.2132.8143.8159.4183.3208.1223.1238.5263.4292.0324.4349.2371.6391.2424.0464.9503.3537.2574.7617.9672.6703.4735.8767.8798.4841.7656.6664.2675.7693.7695.0699.2705.5713.6726.1733.2738.7745.1753.8765.0772.7779.7785.0791.4804.4812.6826.1837.3847.7855.7865.1879.2889.3
vUll-
tioncxpciiu-
itures
30.933.736.739.142.246.050.556.562.970.879.891.6
102.9113.4126.4144.0164.9179.7196.1214.5235.9261.3285.3307.9326.2350.8382.6412.7441.1471.3507.2550.1579.4603.6627.9651.7682.6535.3543.9554.0567.3572.1576.9581.5587.3592.6600.8607.4613.6620.8626.0630.8634.1642.4647.3655.4661.9672.1680.1686.2691.9701.3710.2719.3
Grossinvestment
CtrnroliUl*tures
12.812.713.814.516.017.219.021.023.025.225.625.827.027.129.134.738.138.136.942.849.055.155.454.254.260.567.674.278.884.888.798.5
100.5108.1113.9119.0130.097.796.597.6
102.499.399.0
100.8102.9109.9108.6107.1106.9107.7113.3115.7119.1115.5116.7121.1122.7125.5128.3132.3134.0133.8138.7139.4
tv]Ulp-ment
1.11.21.21.31.51.71.82.02.22.32.62.82.93.33.84.65.15.35.46.17.18.18.59.4
10.812.714.816.417.218.621.923.923.424.025.927.729.123.623.924.124.123.723.323.223.423.623.824.224.625.325.726.226.527.127.527.928.128.528.929.329.730.030.330.6
Source: Department of Commerce, Bureau of Economic Analysis.
320
Digitized for FRASER http://fraser.stlouisfed.org/ Federal Reserve Bank of St. Louis
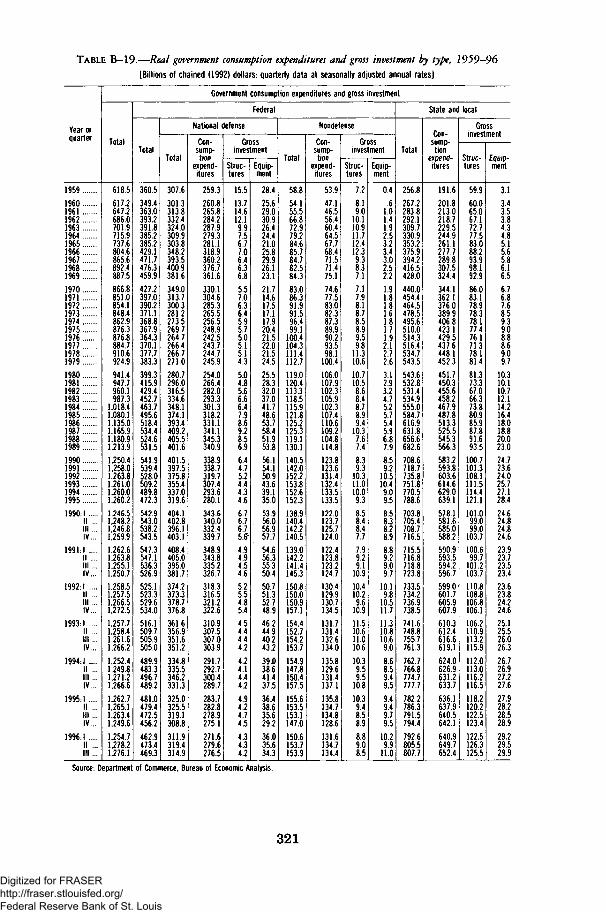
TABLE B-19-—Real government consumption expenditures and gross investment by type, 1959-96
[Billions of chained (1992) dollars; quarterly data at seasonally adjusted annual rates]
Year orquarter
19591960196119621963196419651966196719681969197019711972197319741975197619771978197919801981198219831984198519861987198819891990199119921993199419951990:1
II ...Ill ...IV. . .
1991:1II ....Ill ...IV. . .
1992:1II ...Ill ...IV...
1993:1II ...Ill ...IV...
1994:1II ...Ill ...IV...
1995:1II ...Ill ...IV...
1996:1II ...Ill ...
Government consumption expenditures and gross investment
Total
618.5617.2647.2686.0701.9715.9737.6804.6865.6892.4887.5
866.8851.0854.1848.4862.9876.3876.8884.7910.6924.9941.4947.7960.1987.3
1,018.41,080.11,135.01,165.91,180.91,213.91,250.41,258.01,263.81,261.01,260.01,260.21,246.51,248.21,246.81,259.91,262.61,263.81,255.11,250.7
1,258.51,257.51,266.51,272.51,257.71,258.41,261.61,266.2
1,252.41,249.81,271.21,266.6
1,262.71,265.11,263.41,249.61,254.71,278.21,276.1
Federal
Total
360.5349.4363.0393.2391.8385.2385.2429.1471.7476.3459.9
427.2397.0390.2371.1368.8367.9364.3370.1377.7383.3
399.3415.9429.4452.7463.7495.6518.4534.4524.6531.5541.9539.4528.0509.2489.8472.3542.9543.0538.2543.5547.3547.1536.3526.9525.1523.3529.6534.0516.1509.7505.9505.0
489.9483.3496.7489.2
481.0479.4472.5456.2
462.9473.4469.3
National defense
Total
307.6
301.3313.8332.4324.0309.9303.8348.2393.5400.9381.6349.0313.7300.3281.2273.5269.7264.7266.4266.7271.0280.7296.0316.5334.6348.1374.1393.4409.2405.5401.6401.5397.5375.8355.4337.0319.6404.1402.8396.1403.1408.4405.0395.0381.7374.2373.3378.7376.8361.6356.9351.6351.2334.8335.5346.2331.3325.0325.5319.1308.8
311.9319.4314.9
-sump-tion
expend-itures
259.3
260.8265.8284.2287.9279.3281.1318.9360.2376.7361.6330.1304.6285.3265.5256.5248.9242.5243.7244.7245.9
254.0266.4282.0293.3301.3318.2331.1341.1345.3340.9338.9338.7319.7307.4293.6280.1343.6340.0332.4339.7
348.9343.8335.2326.7
318.3316.5321.2322.6310.9307.5307.0303.9
291.7292.7300.4289.7
283.7282.8278.9275.1271.6279.6276.5
-investment
Struc-tures
15.513.714.612.19.97.56.77.06.46.36.85.57.06.36.45.95.75.05.15.14.35.04.85.66.66.47.98.69.28.56.96.44.75.24.44.34.66.76.76.75.6'4.94.94.54.65.25.54.85.44.54.44.44.24.24.14.44.24.94.24.74.54.34.34.2
Equip-ment
28.425.629.030.926.424.421.025.829.926.123.121.714.617.517.117.920.421.522.021.524.525.528.332.037.041.748.653.758.451.953.856.154.150.943.639.135.053.956.056.957.754.656.355.350.450.751.352.748.946.244.940.243.239.038.641.437.536.438.635.629.236.035.634.3
Nondefense
Total
58.854.155.566.872.979.284.685.784.782.584.383.086.391.991.596.499.1
100.4104.3111.4112.7119.0120.4113.3118.5115.9121.8125.2125.3119.1130.1140.5142.0152.2153.8152.6152.3138.9140.4142.2140.5139.0142.2141.4145.3150.8150.0150.9157.1154.4152.7154.2153.7154.9147.8150.4157.5155.6153.5153.1147.0150.6153.7153.9
Con-sump-
expend-itures
53.947.146.556.460.464.567.768.471.571.475.174.677.583.082.387.389.990.293.598.1
100.4106.0107.9102.3105.9102.3107.4110.6109.2104.8114.8123.8123.6131.4132.4133.5133.5122.0123.7125.7124.0122.4123.8123.2124.7130.4129.9130.7134.5131.7131.4132.6134.0135.8129.6131.4137.1135.8134.7134.8128.6131.6134.7134.4
Grossinvestment
Struc-tures
7.28.19.0
10.110.911.712.412.39.38.37.17.17.98.18.78.58.99.59.8
11.310.610.710.58.68.48.78.99.4
10.37.67.48.39.3
10.311.010.09.38.58.48.47.77.99.29.1
10.910.410.29.6
10.911.510.611.010.610.39.59.5
10.810.39.48.58.98.89.08.5
Equip-ment
0.4.6
1.01.41.92.53.23.43.02.52.21.91.81.81.61.81.71.92.12.72.63.12.93.24.75.25.75.45.96.87.98.59.2
10.510.49.09.58.58.38.28.98.89.29.09.7
10.19.8
10.511.711.310.810.69.08.68.59.49.59.49.49.79.5
10.29.9
11.0
State and local
Total
256.8267.2283.8292.1309.7330.9353.2375.9394.2416.5428.0
440.0454.4464.5478.5495.6510.0514.3516.4534.7543.5
543.6532.8531.4534.9555.0584.7616.9631.8656.6682.6708.6718.7735.8751.8770.5788.6703.8705.4708.7716.5715.5716.8718.8723.8733.5734.2736.9738.5741.6748.8755.7761.3762.7766.8774.7777.7
782.2786.3791.5794.4
792.6805.5807.7
fanWJH-
sump-tion
itures
191.6201.8213.0218.7229.5244.9261.1277.7289.8307.5324.4
344.1362.1376.0389.9406.8423.1429.5437.6448.1452.3451.7450.3455.6458.2467.9487.8513.3525.5545.3566.3583.2593.8603.6614.6629.0639.1578.1581.6585.0588.2590.9593.5594.2596.7
599.0601.7605.9607.9610.3612.4616.6619.1624.0626.9631.2633.7
636.1637.9640.5642.1640.9649.7652.4
Grossinvestment
Struc-tures
59.960.065.067.172.777.583.088.293.998.192.986.083.178.978.378.177.476.171.378.181.481.373.367.066.373.880.985.987.891.693.5
100.7101.3108.1111.5114.4121.1101.0
99.099.0
103.7100.6
99.7101.2103.7110.8108.8106.8106.1106.2110.9113.2115.9112.0113.0116.2116.5118.2120.2122.5123.4122.5126.3125.5
ment
3.13.43.53.84.34.85.15.65.86.16.56.76.87.68.59.39.08.88.69.09.7
10.310.110.712.114.216.418.018.820.023.024.723.624.025.727.128.424.624.824.824.623.923.723.523.423.623.824.224.625.125.526.026.326.726.927.227.627.928.228.528.929.229.529.9
Source: Department of Commerce, Bureau of Economic Analysis.
321
Digitized for FRASER http://fraser.stlouisfed.org/ Federal Reserve Bank of St. Louis

TABLE B—20.—Inventories and final sales of domestic business, 1959—96
[Billions of dollars, except as noted; seasonally adjusted]
Quarter
Fourth quarter:1959196019611962196319641965196619671968196919701971197219731974197519761977197819791980198119821983198419851986198719881989
1990:1III I IIV
1991-1I IIllIV
1992:1I II l lIV .. .
1993:1I II l lIV
1994:1I II I IIV
1995-1III l lIV
1996-1I IIll
Inventories '
Total2
131.0134.7138.0145.8148.3154.0168.8186.2198.4214.1233.7
242.0261.2289.7345.8398.6410.6443.4494.2581.9676.8737.5783.1768.4787.8860.7875.3862.7927.5992.8
1,044.61,051.91,062.71,087.11,082.41,072.31,056.51,053.01,058.11,065.61,070.81,076.31,077.91,097.41,101.31,103.51,112.81,130.21,147.11,167.41,196.5
1,235.31,245.91,251.91,260.9
1,263.51,271.51,279.7
Farm
32.132.934.636.833.932.537.037.537.040.343.842.349.760.978.168.472.368.373.397.9
114.9114.7104.9110.4106.7109.2106.394.598.0
102.0103.6106.2107.2109.1108.3111.2105.599.097.2
105.0104.1104.8104.9109.9105.5101.7101.6107.2103.3102.5104.9105.8101.299.2
100.798.2
102.5103.6
Nonfa rm
Total2
98.9101.8103.4109.0114.4121.4131.9148.6161.4173.8189.9199.7211.5228.8267.8330.3338.4375.1421.0484.0561.9622.8678.2658.0681.1751.5769.1768.2829.5890.8941.0945.7955.5977.9974.1961.1951.0954.1961.0960.6966.8971.5973.1987.5995.8
1,001.71,011.2
1,023.01,043.81,065.01,091.6
1,129.51,144.71,152.81,160.2
1,165.31,169.01,176.0
Manu-factur ing
51.652.854.357.659.663.268.278.385.291.499.0
102.8103.5109.4125.1158.2164.5181.1202.8228.4268.7
296.5318.1299.5302.6333.4325.3314.6332.9358.8382.1385.9387.5401.0399.7393.7385.5383.5383.4379.2378.1380.1375.5378.0380.5380.1380.9385.5390.3397.7406.7
421.0426.5429.5430.4
432.7430.9433.7
Whole-sale
trade
18.318.619.119.921.322.724.327.729.931.735.239.042.146.054.869.869.377.286.6
101.9120.5138.5151.4150.3154.1169.0173.4177.2190.6208.5218.4221.6226.3230.9232.4233.7230.3231.3235.5236.9240.5242.0245.3248.0249.6252.8255.2
257.3263.3270.7279.8
291.9297.8301.3304.0
307.3309.8306.2
Retailtrade
20.021.420.922.323.624.927.730.131.134.437.738.744.950.058.764.264.773.381.294.5
105.3113.7123.9123.5138.0157.3171.9176.8199.5213.8232.7
229.8234.1237.3237.1232.7233.6237.5240.1240.1244.1246.4249.4
259.0261.7263.3267.0270.2278.2283.4289.8
296.0297.9299.1299.1294.5296.0302.7
Other
9.08.99.29.29.8
10.611.712.515.316.318.119.320.923.429.238.039.843.550.459.167.574.084.984.686.491.898.499.5
106.4109.6107.8108.4107.6108.7104.8101.0101.7101.7102.0104.4104.1103.0103.0102.5104.0105.5108.1110.1111.9113.1115.3120.6122.5122.9126.7130.8132.3133.4
Finalsales ofdomestic
busi-ness3
36.537.739.541.844.547.452.555.659.265.169.172.979.488.597.5
105.4118.0129.7145.0167.6186.4204.8221.8232.8255.4276.7297.7315.7333.1362.8384.9394.2397.6401.0403.4403.9409.0411.0413.1423.4427.7432.8441.9444.3449.2453.7463.2467.4473.4482.3489.8494.2499.9507.6512.0519.0527.2529.8
Ratio of inventoriesto f ina l sales of
domestic business
Total
3.593.573.493.483.333.253.223.353353.293.383.323.293.283.553.783.483.423.413.473.633.603.533.303.083.112.942.732.782.742.712.672.672.712.682.652.582.562.562.522.502.492.442.472.452.432.402.422.422.422.442.502.492.472.462.432.412.42
Nonfarm
2.712.702.622.612.572.562.512.672.732.672.752.742.662.592.753.132.872.892.902.893.013.043.062.832.672.722.582.432.492.462.442.402.402.442.412.382.332.322.332.272.262.242.202.222.222.212.182.192.202.212.232.292.292.272.272.252.222.22
1 Inventories at end of quarter. Quarter-to-quarter change calculated from this table is not the current-dollar change in business inven-tories (CBI) component of GDP. The former is the difference between two inventory stocks, each valued at their respective end-of-quarterprices. The latter is the change in the physical volume of inventories valued at average prices of the quarter. In addition, changes calculatedfrom this table are at quarterly rates, whereas CBI is stated at annual rates.2 Inventories of construction establishments are included in "other" nonfarm inventories.
Quarterly totals at monthly rates. Final sales of domestic business equals final sales of domestic product less gross product of house-holds and institutions and of general government and includes a small amount of final sales by farms.
Note.—The industry classification of inventories is on an establishment basis. Estimates for nonfarm industries other than manufacturingand trade for 1986 and earlier periods are based on the 1972 Standard Industrial Classification (SIC). Manufacturing estimates for 1981 andearlier periods and trade estimates for 1966 and earlier periods are based on the 1972 SIC; later estimates for these industries are based onthe 1987 SIC. The resulting discontinuities are small.
Source: Department of Commerce, Bureau of Economic Analysis.
322
Digitized for FRASER http://fraser.stlouisfed.org/ Federal Reserve Bank of St. Louis

TABLE B-21.—Real inventories and final sales of domestic business, 1959-96
[Billions of chained (1992) dollars, except as noted; seasonally adjusted]
Quarter
Fourth quarter:195919601961196219631964 ..19651966196719681969197019711972197319741975197619771978197919801981198219831984 ..19851986198719881989
1990:1II ..I l lIV
1991:1ItI l lIV
1992-1I IillIV
1993:1I II I IIV
1994-1I II l lIV
1995:1III l lIV
1996-1IIIll
Inventories '
Total2
401.4412.0420.9440.9459.0474.7504.8547.2579.2606.1633.3
639.0661.7686.9725.9749.8738.8767.8805.8848.1871.2861.2894.3878.7872.8947.6977.4988.3
1,014.51,026.21,059.51,062.21,073.21,076.91,069.91,065.51,060.31,061.51,066.9
1,066.91,069.71,072.71,074.21,078.81,084.01,088.91,093.21,103.41,122.01,138.11,152.1
1,165.81,173.41,181.61,185.3
1,184.51,186.31,194.9
Farm
88.690.192.394.796.694.496.094.997.4
101.1101.499.3
103.6104.2106.5102.2107.6105.6111.7113.3117.0110.1119.6126.9109.8115.8122.2120.5111.598.898.998.9
100.0102.0101.4100.8101.599.399.7
101.6104.1105.4105.1103.3101.999.097.9
100.6105.9109.4110.1109.2108.2106.6105.4103.8102.5102.4
Nonfarm
Total2
303.6312.4318.6336.7353.1372.6400.3445.0474.5497.5524.8
533.0551.1576.5615.0646.8628.3660.4692.1733.6752.8
751.3774.1751.3763.4832.4855.8868.2902.5927.2960.7963.4973.2974.9968.4
964.7958.8962.2967.2
965.3965.6967.3969.1975.6982.3990.0995.5
1,003.01,016.51,029.11,042.41,056.71,065.21,074.81,079.5
1,080.31,083.21,091.8
Manu-facturing
148.2150.6155.1165.2171.5180.4192.6217.6234.4245.0256.0
256.0253.1259.8277.7296.8289.7303.4311.8325.8338.5
338.9343.5329.5329.5358.4353.9349.7354.8364.3383.5
386.9389.2391.1390.1390.4386.1384.5384.0
380.6377.5378.5374.7375.0377.7379.6380.2382.8383.9386.9388.5390.7393.5397.6400.4
403.4402.4405.4
Whole-sale
trade
56.557.959.361.966.370.374.784.691.094.1
100.6108.0113.8119.0122.4133.0127.5135.9146.5158.8166.3171.3176.0174.1173.5189.6194.8201.9208.5217.8223.3
225.9230.5231.1231.3234.1232.0233.1236.9
237.2239.8241.6244.7245.2247.0250.1250.6251.3256.4261.6267.2
273.2277.1280.4281.5283.1284.9284.0
Retailtrade
59.463.662.366.770.374.281.788.588.495.8
102.3102.4116.1124.9134.8132.9126.3136.0143.7153.1153.1148.9157.2153.3166.2186.4201.3204.4223.9231.3245.0
240.5244.1245.0243.5238.4238.0241.7243.3
242.0244.3245.1247.2255.1256.1257.5259.6262.2267.9271.8276.1279.2280.6281.4279.6
274.2275.5281.2
Other
37.638.340.140.142.245.048.449.856.958.161.462.664.969.977.480.881.581.787.193.291.588.794.491.792.496.7
105.1111.6115.1113.7108.9109.9109.3107.6103.4101.6102.6102.9103.0105.4104.1102.1102.6100.2101.5102.7105.1106.6108.2108.7110.4113.4113.8115.3117.9119.4120.2121.1
Finalsales ofdomestic
busi-ness3
144.3147.0153.5160.8169.5178.4194.2199.4206.4217.8221.7224.0234.4252.7261.1254.6265.6277.5291.7311.9319.3319.9318.9319.2338.2355.7370.8384.3393.8411.7420.7
426.2424.2423.6421.8417.7420.2419.4419.2426.6428.9432.3438.1436.7438.7441.5448.0449.3453.0458.5463.2464.0466.8471.6474.1478.5483.3483.8
Ratio of inventoriesto f inal sales of
domestic business
Total
2.782.802.742.742.712.662.602.742.812.782.862.852.822.722.782.942.782.772.762.722.732.692.802.752.582.662.642.572.582.492.522.492.532.542.542.552.522.532.552.502.492.482.452.472.472.472.442.462.482.482.492.512.512.512.502.482.452.47
Nonfarm
2.102.132.082.092.082.092.062.232.302.282.372.382.352.282.362.542.372.382.372.352.362.352.432.352.262.342.312.262.292.252.282.262.292.302.302.312.282.292.312.262.252.242.212.232.242.242.222.232.242.242.252.282.282.282.282.262.242.26
1 Inventories at end of quarter. Quarter-to-quarter changes calculated from this table are at quarterly rates, whereas the change in busi-ness inventories component of GDP is stated at annual rates.2 Inventories of construction establishments are included in "other" nonfarm inventories.
3 Quarterly totals at monthly rates. Final sales of domestic business equals final sales of domestic product less gross product of house-holds and institutions and of general government and includes a small amount of final sales by farms.
Note.—The industry classification of inventories is on an establishment basis. Estimates for nonfarm industries other than manufacturingand trade for 1986 and earlier periods are based on the 1972 Standard Industrial Classification (SIC). Manufacturing estimates for 1981 andearlier periods and trade estimates for 1966 and earlier periods are based on the 1972 SIC; later estimates for these industries are based onthe 1987 SIC. The resulting discontinuities are small.
Source: Department of Commerce, Bureau of Economic Analysis.
323
Digitized for FRASER http://fraser.stlouisfed.org/ Federal Reserve Bank of St. Louis

TABLE B-22.—Foreign transactions in the national income and product accounts, 1959-96
[Billions of dollars; quarterly data at seasonally adjusted annual rates]
Year orquarter
1959
1960196119621963196419651966196719681969197019711972197319741975197619771978197919801981198219831984198519861987198819891990199119921993199419951990:1
I IIll ....IV ...
1991:1I IIll ....IV ...
1992:1I IIll ....IV ...
1993:1IIIll ....IV ...
1994:1I IIll ....IV ...
1995:1IIIll ....IV ....
1996:1IIIll ....
Receipts from rest of the world
T » 1 1
25.030.231.433.536.141.043.547.250.255.661.270.874.283.4
115.6152.6164.4181.7196.6233.5300.3
361.9399.5379.5374.6421.8411.1427.1481.8591.9678.3
734.8757.9777.3798.5882.5
1,015.6715.2728.1728.6767.3751.4758.7750.6771.0773.1779.2774.0783.0
783.0801.8787.1822.2
826.8862.4899.6941.3976.9
1,009.21,026.11,050.3
1,059.91,073.91,070.7
Exports of goods andservices
Total
20.6
25.326.027.429.433.635.438.941.445.349.357.059.366.291.8
124.3136.3148.9158.8186.1228.7
278.9302.8282.6277.0303.1303.0320.7365.7447.2509.3
557.3601.8639.4657.8719.1807.4541.6554.8555.5577.3577.4602.7602.6624.4632.4635.9640.2649.1646.9660.4645.3678.7
678.9707.4729.2761.0776.1797.3819.0837.0
839.5850.0844.3
Goods 2
16.520.520.921.723.326.727.830.732.235.338.344.545.651.873.9
101.0109.6117.8123.7145.4184.0225.8239.1215.0207.3225.6222.2226.0257.5325.8371.7398.5426.4448.7459.6509.1581.4391.6399.8394.6408.2414.8428.8423.9438.1442.1445.9447.7459.0
451.2462.0447.7477.4
476.0498.4516.6545.1559.1575.2587.0604.5
603.6610.4605.4
Serv-ices2
4.2
4.85.15.76.16.97.68.29.2
10.011.012.413.814.417.823.326.731.135.140.744.753.263.767.669.777.580.894.7
108.2121.4137.6158.8175.4190.7198.3210.1225.9150.0155.1160.9169.1162.71739178.7186.3190.3190.0192.5190.1195.7198.5197.7201.3202.8209.0212.6215.9217.0222.2232.1232.5
235.9239.7239.0
Re-ceipts
offactor
in-come
4.3
5.05.46.16.67.48.18.38.9
10.311.913.014.116.423.830.328.232.937.947.470.481.895.696.997.6
118.7108.1106.5116.0144.7169.0177.5156.2137.9140.7163.4208.3173.6173.3173.1190.0174.0156.0148.1146.6140.7143.3133.8133.9136.1141.4141.7143.5147.9155.0170.4180.3200.8211.9207.0213.4220.4223.9226.4
Payments to rest of the world
Total
25.030.231.433.536.141.043.547.250.255.661.270.874.283.4
115.6152.6164.4181.7196.6233.5300.3361.9399.5379.5374.6421.8411.1427.1481.8591.9678.3
734.8757.9777.3798.5882.5
1,015.6715.2728.1728.6767.3751.4758.7750.6771.0773.1779.2774.0783.0
783.0801.8787.1822.2
826.8862.4899.6941.3976.9
1,009.21,026.11,050.3
1,059.91,073.91,070.7
Imports of goods andservices
Total
22.3
22.822.725.026.128.131.537.139.946.650.555.862.374.291.2
127.5122.7151.1182.4212.3252.7
293.8317.8303.2328.6405.1417.2452.2507.9553.2589.7
628.6622.3669.0720.5813.5902.0615.9615.1634.1649.2610.3615.0624.5639.3641.3664.9677.8691.8694.8720.0719.8747.5
757.6800.4836.1859.6
884.8912.6906.6904.2
925.8949.2964.5
Goods2
15.315.215.116.917.719.422.226.327.833.936.840.946.656.971.8
104.599.0
124.6152.6177.4212.8248.6267.8250.5272.7336.3343.3370.0414.8452.1484.5
508.0500.7544.9592.8677.0757.0500.4497.4511.3522.9488.3493.5504.6516.5516.8541.1557.2564.4
570.7593.2592.7614.4623.6664.6698.3721.6741.9767.3759.7759.0
776.7798.2812.1
Serv-ices2
7.07.67.68.18.48.79.3
10.712.212.613.714.915.817.319.322.923.726.529.834.839.945.349.952.656.068.873.982.293.1
101.1105.3120.6121.6124.1127.8136.4145.1115.5117.8122.7126.4122.1121.6119.9122.7124.5123.8120.6127.4124.0126.8127.1133.1134.0135.8137.9138.0142.8145.3146.9145.2149.2151.0152.5
mentsof
factorin-
come
1.51.81.81.82.12.42.73.13.44.15.86.66.47.7
11.114.614.915.717.225.337.546.560.965.865.687.687.793.6
107.1131.7154.8156.4140.5126.8130.1167.2215.3152.5156.4158.7157.9147.1143.8138.7132.2124.2132.3124.3126.4120.2131.1129.0140.2142.9157.1176.6192.1203.8214.3223.4219.7220.6231.4243.8
Transfer payments(net)
Total
2.4
2.42.72.82.83.03.03.23.43.23.23.64.14.34.65.45.46.06.06.47.59.0
13.416.717.720.623.124.323.325.126.128.4
-12.132.036.138.234.626.130.329.128.2
-61.3-16.1
10.018.927.530.727.842.030.633.734.545.532.734.537.448.434.533.134.236.643.337.436.9
Frompersons
(net)
0.4
.5
.5
.5
.6
.7
.8
.81.01.01.11.21.31.31.41.21.21.21.21.31.41.65.26.26.57.47.88.18.79.19.69.9
10.49.6
12.814.214.99.99.5
10.210.110.410.310.210.69.49.79.29.9
12.612.712.813.114.114.114.114.514.414.114.716.515.716.216.2
Fromgovern-
ment(net)
1.8
1.92.12.12.12.12.12.22.11.91.82.02.42.52.53.23.53.73.43.84.15.05.07.07.89.7
12.212.911.211.411.413.3
-27.916.617.316.511.511.515.513.212.9
-76.9-32.0-5.4
2.612.415.012.926.112.614.815.526.311.212.915.726.212.111.011.311.619.011.811.7
Frombusi-ness
0.1
.1
.1
.1
.1
.2
.2
.2
.2
.3
.3
.4
.4
.5
.71.0.7
1.11.41.42.02.43.23.43.43.53.13.33.34.65.15.25.45.86.07.58.24.75.35.75.35.25.65.25.75.76.05.85.95.56.26.26.17.37.47.67.78.18.08.28.58.69.49.1
Netforeigninvest-ment
-1.2
3.24.33.95.07.56.23.93.51.71.84.91.3
-2.98.75.1
21.48.9
-9.0-10.4
2.612.57.4
-6.1-37.3-91.5
-116.9-142.9-156.4-118.1
-92.4-78.6
7.3-50.5-88.2
-136.4-136.3
-79.4-73.8-93.3-68.1
55.316.0
-22.6-19.4-19.9-48.7-56.0-77.2-62.6-83.0-96.2
-111.0
-106.5-129.7-150.6-158.9
-146.2-150.8-138.1-110.2
-129.9-144.2-174.6
1 Includes capital grants received by the United States (net), not shown separately. See Table 6-30 for data.2 Certain goods, primarily military equipment purchased and sold by the Federal Government, are included in services. Beginning with1986, repairs and alterations of equipment were reclassified from goods to services.
Source: Department of Commerce, Bureau of Economic Analysis.
324
Digitized for FRASER http://fraser.stlouisfed.org/ Federal Reserve Bank of St. Louis

TABLE B—23.—Real exports and imports of goods and services and receipts and payments of factorincome, 1959-96
[Billions of chained (1992) dollars; quarterly data at seasonally adjusted annual rates]
Year or quarter
195919601961196219631964 . .1965196619671968196919701971197219731974 .1975197619771978197919801981198219831984 .19851986198719881989 .. ..1990199119921993199419951990:1
IIIllI V . .
1991:1III l lIV
1992-1III l lIV
1993-1III l lIV
1994:1IIIllIV
1995-1IIIllIV
1996:1IIIll
Exports of goods and services
Total
71.986.888.393.0
100.0113.3115.6123.4126.1135.3142.7158.1159.2172.0209.6229.8228.2241.6247.4273.1299.0331.4335.3311.4303.3328.4337.3362.2402.0465.8520.2564.4599.9639.4658.2712.0775.4555.2566.8561.8573.9572.3600.3603.6623.5633.0635.8639.7649.1647.1660.0645.5680.3677.6703.1719.6747.6752.3763.2783.0803.1806.7817.9816.1
Goods1
Total
51.763.864.267.072.382.282.688.488.895.8
100.8112.3111.9123.9152.4164.5160.7168.3170.5189.5211.9237.2234.7213.5207.3223.7231.7243.6270.5321.4361.7391.6419.2448.7464.5511.5565.9386.8394.8388.0397.0403.3419.8420.0433.7440.3445.1448.3461.0454.3466.0452.7485.0481.9502.9517.8543.4548.8557.7568.2588.8590.9600.6601.1
Dura-ble
goods
23.729.329.531.032.737.739.342.248.853.457.763162.769.286.399.697.598.998.7
110.0125.2139.6134.7117.0114.6127.0137.3145.3165.7205.5236.7260.0279.6300.9318.3358.0403.2256.1264.2258.6261.2263.1282.8281.9290.5294.5298.4299.5311.1308.1319.1310.6335.5336.8353.7361.8379.7386.5398.3405.9422.3424.0437.9439.0
Non-dura-
blegoods
30.436.536.838.642.247.245.948.840.442.843.249.549.655.166.565.964.270.372.880.687.998.9
101.498.494.498.195.399.1
105.0115.8124.9131.6139.6147.8146.2153.8163.7130.6130.6129.4135.8140.1137.1138.1143.3145.81466148.8149.9146.2146.9142.1149.6145.3149.6156.2163.9162.8160.51635167.9168.416531648
Serv-ices1
18.620.622.024.025.528.630.832.635.537.339.643.145.044.752.661.665.672.577.283.083.989.298.598.596.8
105.9106.1120.3133.4145.0158.7173.1180.8190.7193.7200.9210.4168.6172.2174.3177.3168.9180.6183.8189.8192.8190.7191.3188.2192.7194.0192.7195.5195.9200.5202.2204.9204.3206.4215.4215.3216.7218.3216.1
Re-ceipts
offactor
in-come
20.823.425.227.629.832.634.634.335.739.543.745.046.451.770.482.570.277.283.496.8
132.4141.1150.1143.5138.2160.3140.5134.6141.9170.2189.9190.6161.1137.9137.4155.9194.2189.5187.1185.1200.9181.4161.5152.0149.4141.9143.5133.4132.7133.9138.3138.2139.1142.5148.5162.2170.6188.8197.9192.6197.6203.2205.4207.0
Imports of goods and services
Total
106.6108.1107.3119.5122.7129.2143.0164.2176.2202.5214.0223.1235.0261.0272.6265.3235.4281.5311.6338.6344.3321.3329.7325.5366.6455.7485.2526.1558.2580.2603.06263622.2669.0730.2817.6883.0622.3633.5633.0616.4596.6617.4633.4641.4647.8668.3670.5689.1703.1724.4731.7761.8777.0810.4831.3851.9874.9884.6884.5888.0910.7932.6953.5
Goods '
Total
71.170.069.980.283.589.0
101.6117.6123.8149.4157.5163.7177.4201.6215.8209.8183.4224.8252.2274.8279.5258.7264.0257.4292.4363.1385.9425.5445.2463.2482.7497.3497.1544.9602.6684.1744.7494.2504.0503.2487.9472.2490.8509.4515.9521.2543.6552.8561.8578.4598.0604.1629.8644.5675.6697.1719.3735.4747.7745.6750.0768.4789.9810.0
Dura-ble
goods
23.722.621.825.627.030.037.146.249.563.067.369.276.187.693.293.676593.7
106.0122.5125.4126.3136.8138.4166.8221.9244.1266.7278.5290.1302.6310.9312.7346.4390.0455.6507.1303.1313.3315.4312.0298.9304.8320.2326.8331.2344.6351.0359.0372.7383.6390.5413.1424.1448.2462.6487.7500.1508.5506.0514.0529.7542.1556.9
Non-dura-
blegoods
49.550.151.858.460.162.567.272.57 4 784.687.892.698.3
109.8118.4111.0103.0126.4140.7145.3147.0126.6122.8115.6123.1140.2142.0158.8166.8173.2180.1186.4184.4198.4212.5228.2237.2191.1190.7187.7175.9173.3186.0189.2189.1190.0199.0201.8202.8205.6214.4213.6216.6220.2227.1234.1231.2235.0238.9239.3235.8238.5247.7253.0
Serv-ices1
34.937.737.038.838.739.740.946.051.752.655.958.857.259.156.755.452.556.258.462.563.461.865468.974.492.999.7
100.2113.1117.1120.2129.4125.3124.1127.7133.8138.8128.5129.8130.2129.0124.8126.8124.1125.6126.7124.7117.7127.4124.7126.5127.6132.0132.6135.0134.5133.1139.8137.4139.4138.5142.8143.2144.1
Pay-ments
offactor
in-come
7.58.78.88.99.9
11.012.013.414.316.621.923.622.025.334.141.038.738.739.553.573.083.199.4
100.795.9
121.9116.8120.9133.0157.1176.7170.2145.7126.8126.7158.6199.7169.5171.0171.7168.7154.7149.9143.0135.2125.6132.6123.9125.2117.9127.9125.3135.6137.0149.8166.9180.8190.5199.2206.8202.4202.3211.1221.4
•Certain goods, primarily military equipment purchased and sold by the Federal Government, are included in services. Beginning with1986, repairs and alterations of equipment were reclassified from goods to services.
Source: Department of Commerce, Bureau of Economic Analysis.
325
Digitized for FRASER http://fraser.stlouisfed.org/ Federal Reserve Bank of St. Louis
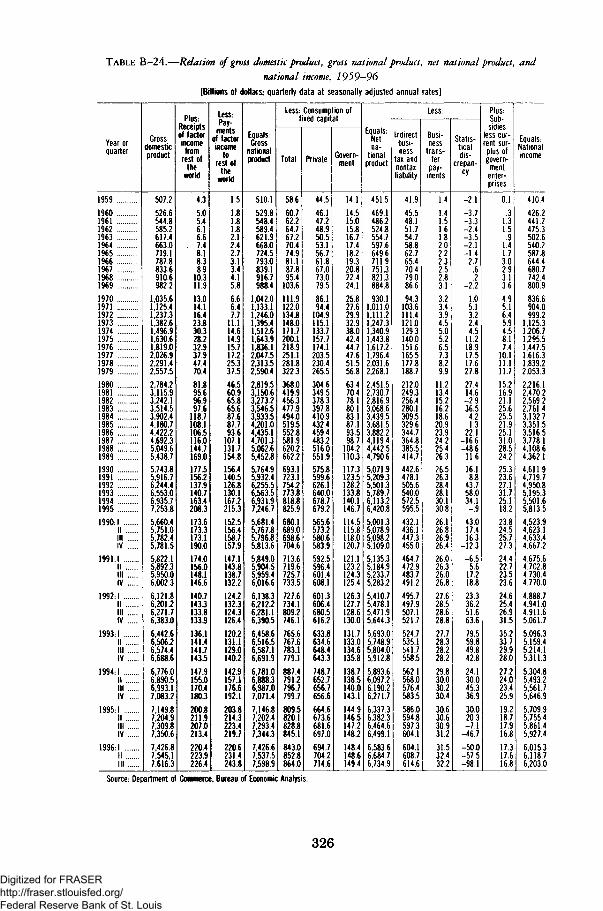
TABLE B—24.—Relation of gross domestic product, gross national product, net national product, and
national income, 1959—96
[Billions of dollars; quarterly data at seasonally adjusted annual rates]
Year orquarter
19591960196119621963196419651966196719681969197019711972197319741975197619771978197919801981198219831984198519861987198819891990199119921993199419951990:1
I II l lIV
1991:1III l lIV
1992:1III l lIV
1993:1III l lIV
1994:1III l lIV
1995:1I II l lIV
1996:1I II l l
Grossdomesticproduct
507.2526.6544.8585.2617.4663.0719.1787.88336910.6982.2
1,035.61,125.41,237.3138261,496.91,630.6181902,026.9229142i557.52,784.23,115.93,242.13,514.53,902.44,180.74,422.24,692.35,049.65,438.75,743.85,916.76,244.46,553.06,935.77,253.85,660.45,751.05,782.45,781.55,822.15,892.35,950.06,002.36,121.86,201.26,271.76,383.06,442.66,506.26,574.46,688.66,776.06.890.56,993.17,083.27,149.87,204.97,309.87,350.67,426.87,545,17,616.3
Plus-Receiptsof factorincome
fromrest of
theworld
4.35.05.46.16.67.48.18.389
10.311.913.014.116.423830.328.232937.947470.481.895.696.997.6
1187108.1106.5116.0144.7169.0177.5156.2137.9140.7163.4208.3173.6173.3173.1190.0174.0156.0148.1146.6140.7143.3133.8133.9136.1141.4141.7143.5147.9155.0170.4180.3200.8211.9207.0213.4220.4223.9226.4
Less:Pay-
mentsof factorincome
torest of
thpi neworld
1.51.81.81.82.12.42.73.1344.15.86.66.47.7
11 114.614.915717.225337.546.560.965.865.687.687.793.6
107.1131.7154.8156.4140.5126.8130.1167.2215.3152.5156.4158.7157.9147.1143.8138.7132.2124.2132.3124.3126.4120.2131.1129.0140.2142.9157.1176.6192.1203.8214.3223.4219.7220.6231.4243.8
Equals:Gross
nationalproduct
510.1529.8548.4589.4621.9668.0724.5793.08391916.7988.4
1,042.01,133.11,246.0139541512.61,643.91 836.12.047.5231352.590.42,819.53,150.63,273.23,546.53,933.54,201.04,435.14,701.35,062.65,452.85,764.95.932.46,255.56,563.56,931.97,246.75,681.45,767.85,796.85,813.65,849.05,904.55,959.46,016.66,138.36,212.26,281.16,390.56,458.66,516.56,587.16,691.96,781.06,888.36,987.07,071.47,146.87,202.47,293.47,344.37,426.67,537.57,598.9
Less: Consumption ofp
Total
58.660.762.264.767.270.474.981.187895.4
103.6111.9122.0134.81480171.7200.1218.9251.12818322.3368.0419.9456.3477.9494.0519.5552.8581.9620.2662.2693.1723.1754.2773.8818.8825.9680.1689.0698.6704.6713.6719.6725.7733.5727.6734.1809.2746.1765.6767.6783.1779.1887.4791.2796.7799.7809.5820.1828.8845.1843.0852.8864.0
Private
44.546.147.248.950.553.156.761.867073.079.586.194.4
104.91151133.7157.71741203.52304265.5304.6349.5378.3397.8410.9432.4459.4483.2516.0551.9575.8599.6626.1640.0678.7679.2565.6573.2580.6583.9592.5596.4601.4608.1601.3606.4680.5616.2633.8634.6648.4643.3748.7652.7656.7656.6664.6673.6681.6697.0694.7704.2714.6
Govern-ment
14.114.515.015.816.717.418.219.320822.424.125.827.629.932938.042.444747.651556.863.470.478.180.183.187.193.598.7
104.2110.3117.3123.5128.2133.8140.1146.7114.5115.8118.0120.7121.1123.2124.3125.4126.3127.7128.6130.0131.7133.0134.6135.8138.7138.5140.0143.1144.9146.5147.2148.2148.4148.6149.4
Equals:Netna-
tionalproduct
451.5469.1486.2524.8554.7597.6649.6711.97513821.3884.8930.1
1,011.01,111.2124731340.91,443.8161721,796.4203162]268.12,451.52,730.72,816.93,068.63,439.53,681.53,882.24,119.44,442.54,790.65,071.95,209.35,501.35,789.76,113.26,420.85,001.35,078.95,098.25,109.05,135.35,184.95,233.75,283.25,410.75,478.15,471.95,644.35,693.05,748.95,804.05,912.85,893.66,097.26,190.26,271.76,337.36,382.36,464.66,499.16,583.66,684.76,734.9
Less:
Indirectbusi-ness
tax andnontaxliability
41.945.548.151.754.758.862.765.470479.086.694.3
103.6111.41210129.3140.01516165.51778188.7212.0249.3256.4280.1309.5329.6344.7364.8385.5414.7442.6478.1505.6540.0572.5595.5432.1436.1447.3455.0464.7472.9483.7491.2495.7497.9507.1521.7524.7535.1541.7558.5562.1568.0576.4583.5586.0594.8597.3604.1604.1608.7614.6
Busi-ness
trans-fer
pay-ments
1.41.41.51.61.82.02.22.32 52.83.13.23.43.9455.05.2657.3829.9
11.213.415.216.218.620.923.924.225.426.326.526.328.428.130.130.826.126.826.926.426.026.326.026.827.628.528.628.827.728.328.228.229.830.030.230.430.630.630.931.231.532.432.2
Statis-ticaldis-
crepan-cy
-2.1-3.7-3.3-2.4-3.5-2.1-1.4
2.76
.2-2.2
1.05.13.22 44.5
11.218917.517627.827.414.6-2.936.5
4.21.3
22.1-16.6-48.6
11.616.18.8
43.758.034.1-.9
43.017.416.3
-12.3-6.5
5.617.218.823.336.251.663.679.559.849.842.824.130.045.336.930.020.3-7.1
-46.7-50.0-57.5-98.1
PIUS:Sub-sidies
less cur-rent sur-
plus ofgovern-
mententer-prises
0.1.3
1.31.5
.91.41.73.02 93.13.64.95.16.4594.58.17 4
10.111 111.715.216.921.125.625.521.925.131.028.524.225.323.627.131.725.118.223.824.525.727.324.422.723.523.624.625.426.931.535.233.729.928.027.224.023.425.919.218.717.916.817.317.616.8
Equals.-Nationalincome
410.4426.2441.2475.3502.6540.2587.8644.46807742.4800.9836.6904.0999.2
1 12531206.71,295.5144751,616.3183922,053.32,216.12,470.22,569.22,761.43,132.73,351.53,516.53,778.14,108.64,362.14,611.94,719.74,950.85,195.35,501.65,813.54,523.94,623.14,633.44,667.24,675.64,702.84,730.44,770.04,888.74,941.04,911.65,061.75,096.35,159.45,214.15,311.35,304.85,493.25,561.75,646.95,709.95,755.45,861.45,927.46,015.36,118.76,203.0
Source: Department of Commerce, Bureau of Economic Analysis.
326
Digitized for FRASER http://fraser.stlouisfed.org/ Federal Reserve Bank of St. Louis

TABLE B—25.—Relation of national income and personal income, 1959—96
[Billions of dollars; quarterly data at seasonally adjusted annual rates]
Year or quarter
19591960196119621963196419651966196719681969197019711972197319741975197619771978197919801981198219831984198519861987198819891990199119921993199419951990:1
I II I IIV
1991-1I II l lIV
1992:1I II l lIV
1993:1I II l lIV
1994:1I II l lIV
1995:1I II l lIV
1996:1I II l l
Nationalincome
410.4426.2441.24753502.65402587.8644.4680.7742.48009836.6904.0999.2
1,125.31,206.71,295.51,447.51,616.31,839.22,053.32,216.12,470.22,569.22,761.43,132.73351 53,516.5377814,108.64362 14611 94,719.74 950.85,195.3550165!813.54,523.9462314,633.44,667.2467564,702.8473044,770.04,888.74,941.04,911.65,061.75,096.35,159.45,214.15,311.35,304.85,493.25,561.75,646.95,709.95,755.45,861.45,927.46,015.36,118.76,203.0
Corporateprofitswith
inventoryvaluation
andcapital
consump-tion
adjust-ments *
50.248.849.857763.570480.986.383.690.387575.788.8
102.2115.1103.7121.1147.0167.3191.6194.0167.1183.9159.2212.3268.22822271.03097357.235643695382.54014464.45295586.6369.33928350.4365.53937380.03768379.6417.3409.3351.3427.7427.4447.8469.6512.8459.7534.3553.1570.9560.0562.3612.5611.8645.1655.8661.2
L
Netinterest
10.211.213.114616.118221.124.328.130.433640.045.449.356.571.880.085.1
100.7120.5150.3191.9234.5264.9275.9318.53372363.13722398.945664673443.04143398.93949403.6458.94650467.7477.54604450.64466434.3419.2417.5408.1412.4412.8403.2391.4388.0390.2395.5400.1393.8406.9405.2400.7401.9399.5402.3405.6
5SS:
Contribu-tions
forsocial
insurance
18.821.922.925428.530131.640.645.550.457862.069.679.597.9
111.7121.1137.7155.4177.0204.2225.0261.6280.6301.9345.53759402.04233462.849125185543.55714592.96283660.0511.15162522.4524.35368540.95460550.3565.1570.1574.8575.7578.3592.8597.5603.1614.2627.5632.2639.3651.0656.2664.0668.6676.0686.2694.4
Wageaccruals
lessdisburse-
ments
0.0.0.00.00.0.0.0.0o.0.6.0
-.5
!i.1.3
.0
.1
.0-.4
.2_ 2
.00.0o1
-.1-158
4.61552.7
.00.0.22
-.40.0.0.0.0
-63.064.0
1.01.0
-47.452.13.73.72.54.02.92,9
.91.9.0.0
Personalinterestincome
22.725.026.929332.436140.344.949.554.660869.275.781.894.1
112.4123.0134.6155.7184.5223.6274.7337.2379.2403.2472.35084543.35600595.567457044699.26672648.16637717.1690.6701 1711.6714.27054702.26970692.3674.1673.0661.2660.4659.3652.2640.9639.9641.0659.6673.3680.9704.6716.6719.9727.2726.1733.1742.9
PI
Personaldividendincome
12.713.414.015016.118020.220.922.124.525123.523.525.527.729.629.235.039.544.350.557.567.266.977.479.4883
105.1101 1109.913091429153.61594186.81996214.8142.01434143.3142.71493153.11564155.7152.3154.5160.8170.1180.0185.4189.7192.1193.2197.5201.0206.7209.5212.2215.8221.7226.6229.3231.5
US:
Govern-ment
transferpayments
topersons
25.727.531.532634.536039.143.652.360.667581.897.0
108.4124.1147.4185.7202.8217.5234.8262.8312.6355.7396.3426.6438.54687498.05225556.860496665749.18357888.69338
1,000.0649.26565669.3691.07256742.57541774.0816.4831.0842.5853.0873.6884.8894.3901.6917.1927.3938.7952.0979.8994.2
1,007.31,018.71,040.11,052.61,062.1
Businesstransfer
paymentsto
persons
1.31.31.4151.7182.02.12.32.5282.83.03.43.84.04.55.55.96.87.98.8
10.211.812.815.117820.720820.821 121320.822522.122622.621.321521.321.120820.720821.121.922.522.822.922.322.122.022.122.422.522.622.722.622.622.622.722.923.023.1
Equals:
Personalincome
393.5411.7429.14561479.15135555.8604.7649.7713.5778.2836.1898.9987.3
1,105.61,213.31,315.61,455.41,611.41,820.22,049.72,285.72,560.42,718.72,891.73,205.5343963,647.5387734,172.8448934791.64,968.55 264.25,480.15753.16,115.14,687.84,771.54,838.44,868.6488564,950.24,989.35,048.95,151.95,225.15,264.65,415.35,349.15,459.25,501.65,610.55,562.45,739.15,808.25,902.76,004.56,074.46,146.96,234.56,308.56,412.46,501.4
1 Includes rest of world.Source: Department of Commerce, Bureau of Economic Analysis.
327
Digitized for FRASER http://fraser.stlouisfed.org/ Federal Reserve Bank of St. Louis

TABLE B—26.—National income by type of income, 1959—96
[Billions of dollars; quarterly data at seasonally adjusted annual rates]
Year orquarter
19591960196119621963196419651966196719681969197019711972197319741975197619771978197919801981198219831984198519861987198819891990199119921993199419951990:1
II ...Ill ..IV ..
1991:1II ...Ill ..IV ..
1992:1II ...Ill ..IV ..
1993:1II ...Ill ..IV ..
1994:1II ...Ill ..IV ..
1995:1II ...Ill ..IV ..
1996:1II ...Ill ..
Nationalincome '
410.4426.2441.2475.3502.6540.2587.8644.4680.7742.4800.9836.6904.0999.2
1,125.31,206.71,295.51,447.51,616.31,839.22,053.32,216.12,470.22,569.22,761.43.132.73,351.53,516.53,778.14,108.64,362.14,611.94,719.74,950.85,195.35,501.65,813.54.523.94,623.14,633.44,667.24,675.64,702.84,730.44,770.04,888.74,941.04,911.65,061.75,096.35,159.45,214.15,311.35,304.85,493.25,561.75,646.95,709.95,755.45,861.45,927.46,015.36,118.76,203.0
Compensation of employees
Total
281.2296.7305.6327.4345.5371.0399.8443.0475.5524.7578.3618.1660.1726.8813.1892.4951.3
1,061.51,182.91,338.51,503.31,653.91,827.81,927.62,044.22,257.02.425.72,572.42,757.72,973.93.151.63,352.83.457.93,644.93,809.54,009.84.222.73,285.53,344.73,384.93.395.93,405.73,440.73,474.23,511.03,577.13,626.53,669.23,707.03,744.23,787.93,834.93,871.13,932.63,988.04,027.54.091.04,150.54.191.64,247.74,301.14,344.34,420.94,482.9
Wages and salaries
Total
259.8272.8280.5299.3314.8337.7363.7400.3428.9471.9518.3551.5584.5638.7708.6772.2814.7899.6994.0
1,121.11,255.71,377.61,517.61,593.91,684.81,855.31,995.72,116.52,272.72,453.62,598.12,757.52,827.62,970.63,095.33,257.33,433.22,704.02,753.02,784.52,788.82.789.52,814.72,838.82,867.12,916.52,956.22,988.23,021.73,046.03,075.23,115.03.145.03,194.13,237.53,270.33,327.43,371.93,406.03,454.03,501.13,540.23,606.53,659.6
fnuuUV-
ern-ment
46.049.252.456.360.064.969.978.386.496.6
105.5117.1126.7137.8148.7160.4176.1188.7202.4219.8236.9261.2285.6307.3324.5347.8373.5396.6423.1450.4479.4517.2546.0567.8584.2602.5621.7504.3514.3520.8529.4541.5544.9546.9550.8561.4567.2569.8572.5580.9581.4586.3588.3596.5601.7603.7608.3616.3619.6624.1626.9634.0638.9644.6
Other
213.8223.7228.0243.0254.8272.9293.8321.9342.5375.3412.7434.3457.8500.9560.0611.8638.6710.8791.6901.2
1,018.81,116.41,232.01,286.71,360.31,507.51,622.11,720.01,849.52,003.22.118.72,240.32,281.52,402.92,511.12,654.82,811.52,199.62,238.62,263.62,259.32,248.02,269.82,292.02,316.32,355.12,389.02,418.32,449.22,465.12,493.92,528.72,556.62,597.62,635.82,666.62,719.12,755.62,786.42,829.92,874.22,906.12,967.53,015.1
Supplements to wages andsalaries
Total
21.423.825.128.130.733.236.142.746.652.860.066.675.688.1
104.4120.3136.6162.0188.9217.4247.5276.3310.2333.7359.4401.7430.0455.9485.0520.3553.5595.2630.4674.3714.2752.4789.5581.5591.7600.5607.1616.2626.0635.4643.8660.7670.3681.0685.3698.2712.6719.9726.2738.5750.5757.2763.6778.6785.6793.7800.1804.1814.4823.3
Em-ployercon-
tribu-tions for
socialinsur-ance
10.912.613.315.116.717.518.322.824.927.631.534.138.945.155.363.770.682.294.1
107.3123.2136.4157.1168.3182.2212.8226.9239.9249.7268.6280.4294.6307.7323.0333.3350.2365.5290.1294.0296.4297.9303.8306.3309.1311.4319.9322.7325.1324.2325.9333.5335.6338.1342.9350.0352.3355.8360.8363.6367.8369.8375.0380.4384.6
Oth orUlllcilabor
income
10.611.211.813.014.015.717.819.921.725.228.532.536.743.049.256.565.979.794.7
110.1124.3139.8153.0165.4177.2188.9203.1216.0235.4251.7273.1300.6322.7351.3380.9402.2424.0291.4297.8304.0309.2312.4319.7326.3332.4340.8347.6355.9361.1372.2379.1384.3388.0395.6400.5404.9407.8417.7422.0425.9430.2429.1434.0438.6
Proprietors' income with inventory valuationand capital consumption adjustments
TntallUldl
50.550.553.055.056.359.063.567.669.173.377.178.083.995.2
113.3111.3116.5127.5140.8162.2177.3167.9178.3169.9181.7237.9257.4267.8292.9322.9345.0361.0362.9409.5420.0450.9478.3354.7362.7365.6360.9349.2365.1365.2372.1396.5406.9412.1422.4413.5417.6414.2434.9421.1454.4458.7469.4472.0474.7479.6486.7499.5515.2526.3
Farm
Total
10.911.512.112.112.010.813,014.112.712.814.614.815.519.532.625.924.218.717.922.926.613.823.716.46.0
24.824.925.232.328.236.836.330.238.032.035.029.036.139.436.033.927.634.228.031.036.737.939.937.331.535.826.134.4
40.835.131.932.328.527.628.131.838.445.851.8
Propri-etors'
in-come2
11.812.312.912.912.711.513.814.913.713.815.816.116.921.234.628.527.722.822.327.732.220.731.624.814.132.732.432.639.635.444.343.837.745.739.542.536.543.546.743.541.335.141.635.538.544.245.448.344.839.043.333.841.948.242.539.439.836.135.135.739.345.853.259.4
Nonfarm
Total
39.639.140.942.944.348.350.453.556.460.562.563.268.375.880.785.492.3
108.8122.9139.2150.8154.1154.6153.5175.8213.1232.5242.6260.6294.7308.2324.6332.7371.5388.1415.9449.3318.6323.3329.6327.1321.6331.0337.1341.1359.8368.9372.3385.1382.0381.8388.1400.5380.3419,3426.8437.1443.5447.1451.5454.9461.1469.4474.6
Propri-etors'
in-come3
40.239.841.843.945.249.251.955.458.363.065.066.072.079.385.993.499.2
116.3131.0148.7160.9165.2160.7158.2172.2199.7210.5215.9238.2272.0284.8312.7325.0363.1381.0411.5434.6302.2309.4319.7319.6313.0323.3329.9333.7350.8360.7364.4376.3375.5375.7380.0392.7399.3409.1415.1422.5429.6433.1436.3439.6446.4455.2459.4
1 National income is the total net income earned in production. It differs from gross domestic product mainly in that it excludes deprecia-tion charges and other allowances for business and institutional consumption of durable capital goods and indirect business taxes. See TableB-24.
See next page for continuation of table.
328
Digitized for FRASER http://fraser.stlouisfed.org/ Federal Reserve Bank of St. Louis

TABLE B-26.—National income by type of income, 1959-96—Continued
[Billions of dollars; quarterly data at seasonally adjusted annual rates]
Year orquarter
19591960196119621963196419651966196719681969197019711972197319741975197619771978197919801981198219831984198519861987198819891990199119921993199419951990:1
I II l lIV
1991:1I II I IIV
1992:1I II I IIV
1993:1||I I IIV
1994:1I II l lIV
1995:1I II l lIV
1996:1I II l l
Rental income of personswith capital consumption
adjustment
Total
18.219.119.820.621.321.722.523.224.423.724.424.725.825.727.427.526.626.324.726.528.435.345.747.647.251.049.142.345.555.752.461.468.480.6
102.5116.6122.255.557.964.867.366.666.367.673.078.680.970.892.398.4
102.9104.1104.5101.1121.0122.2121.9120.6121.6120.9125.8126.9124.5127.0
Rentalincome
ofpersons
19.720.621.222.022.623.024.024.926.326.027.327.829.530.332.834.434.935.736.441.246.757.370.774.774.879.279.072.677.689.791.098.6
107.0126.9144.3159.4158.692.394.9
102.3104.9104.1103.9105.3114.6114.8117.5144.8130.4142.6143.4146.5144.6162.2159.0159.2157.2156.3157.2156.0165.0160.0158.6162.5
Capitalcon-
sump-tion
adjust-ment
-1.5-1.5-1.4-1.4-1.3-1.3-1.5-1.7-1.9-2.3-2.8-3.1-3.7-4.6-5.4-6.9-3.4-9.5
-11.7-14.7-18.3-22.0-25.1-27.1-27.6-28.2-29.9-30.4-32.1-33.9-38.5-37.2-38.6-46.2-41.8-42.8-36.4-36.8-37.1-37.5-37.5-37.5-37.5-37.7-41.6-36.2-36.6-73.9-38.1-44.2-40.5-42.5-40.1-61.0-37.9-37.0-35.3-35.7-35.6-35.1-39.1-33.1-34.2-35.5
Corporate profits with inventory valuation and capital consumption adjustments
Total
50.248.849.857.763.570.480.986.383.690.387.575.788.8
102.2115.1103.7121.1147.0167.3191.6194.0167.1183.9159.2212.3268.2282.2271.0309.7357.2356.4369.5382.5401.4464.4529.5586.6369.3392.8350.4365.5393.7380.0376.8379.6417.3409.3351.3427.7427.4447.8469.6512.8459.7534.3553.1570.9560.0562.3612.5611.8645.1655.8661.2
Profits with inventory valuation adjustment and withoutcapital consumption adjustment
Total
53.151.051.356.461.267.577.683.080.386.983.271.885.597.9
110.9103.4129.4158.9186.8213.1220.2198.3204.1166.8203.72385230.5234.0272.9325.0330.6358.2378.2398.94577517.9570.8353.4381.1341.9356.5388.3375.5373.8375.2411.4404.3359.4420.5422.4442.0465.9500.5471.6516.2534.3549.6542.6547.3597.9595.3624.8633.5637.6
Profits
Profitsbefore
tax
53.451.151.056.461.268.078.885.181.890.689.078.490.1
104.5130.9142.8140.4173.82035238.1261.8241.4229.8176.7212.8244.2229.9222.6293.6354.3348.1371.7374.2406.4464.3531.2598.9354.7373.4381.9376.7370.7368.7374.6382.8411.1426.2368.0420.3437.0457.6458.0504.5475.5526.0550.8572.4594.5589.6607.2604.2642.2644.6635.6
Profitstax
liability
23.622.722.824.026.228.030.933.732.739.439.734.437.741.949.351.850.964.273.083.588.084.881.163.177.294.096.5
106.5127.1137.0141.3140.5133.4143.0163.8195.3218.7133.0141.2148.0139.7130.1132.3136.0135.2143.9150.9127.6149.7151.5162.6159.3181.7171.4192.8203.4213.5217.3214.2224.5218.7233.4236.4233.4
Profits after tax
Total
29.728.428.232.434.940.047.951.449.251.249.444.052.462.681.691.089.5
109.6130.4154.6173.8156.6148.6113.6135.5150.1133.4116.1166.5217.3206.8231.2240.8263.4300.5335.9380.2221.7232.2233.9237.1240.7236.4238.6247.6267.2275.2240.4270.6285.6295.0298.6322.8304.1333.3347.4358.8377.2375.3382.8385.5408.8408.1402.2
Divi-dends
12.713.414.015.016.118.020.220.922.124.625.223.723.725.828.130.430.135.940.846.052.559.369.569.880.883.292.8
110.2107.0116.8138.9151.9163.1169.5197.3211.0227.4150.7152.4152.4152.0158.6162.6165.9165.3162.1164.6170.9180.4190.2195.8200.2202.9204.4208.8212.5218.5221.7224.6228.5234.7239.9243.1245.2
Undis-tributedprofits
17.015.014.317.418.822.027.830.527.126.624.120.328.636.953.560.659.473.789.6
108.6121.397.379.143.854.866.940.65.8
59.5100.567.979.477.793.9
103.2124.8152.8
71.179.881.685.082.073.872.782.2
105.2110.669.590.395.399.298.4
119.999.7
124.5134.9140.3155.5150.8154.3150.8168.9165.1156.9
Inven-tory
valu-ation
adjust-ment
-0.3-.2
.3
.0
.1-.5
-1.2-2.1-1.6-3.7-5.9-6.6-4.6-6.6
-20.0-39.5-11.0-14.9-16.6-25.0-41.6-43.0-25.7-9.9-9.1-5.6
.511.4
-20.7-29.3-17.5-13.5
4.0-7.5-6.6
-13.3-28.1-1.3
7.7-40.0-20.3
17.66.8-.8
-7.6.3
-21.9-8.6
.2-14.6-15.6
7.9-4.0-3.9-9.8
-16.5-22.8-51.9-42.3-9.3-8.8
-17.4-11.0
2.0
Capitalcon-
sump-tion
adjust-ment
-2.9-2.2-1.5
1.32.32.83.43.33.33.44.43.93.34.34.1
.3-8.3
-11.8-19.6-21.5-26.2-31.2-20.1-7.6
8.629.751.837.036.832.225.811.34.32.56.7
11.615.915.911.78.59.05.44.63.04.55.95.0
-8.17.25.05.83.8
12.3-11.8
18.118.821.317.415.014.616.520.422.323.6
Netinter-est
10.211.213.114.616.118.221.124.328.130.433.640.045.449.356.571.880.085.1
100.7120.5150.3191.9234.5264.9275.9318.5337.2363.1372.2398.9456.6467.3448.0414.3398.9394.9403.6458.9465.0467.7477.5460.4450.6446.6434.3419.2417.5408.1412.4412.8403.2391.4388.0390.2395.5400.1393.8406.9405.2400.7401.9399.5402.3405.6
2 Without capital consumption adjustment.3 Without inventory valuation and capital consumption adjustments.Source: Department of Commerce, Bureau of Economic Analysis.
329
Digitized for FRASER http://fraser.stlouisfed.org/ Federal Reserve Bank of St. Louis
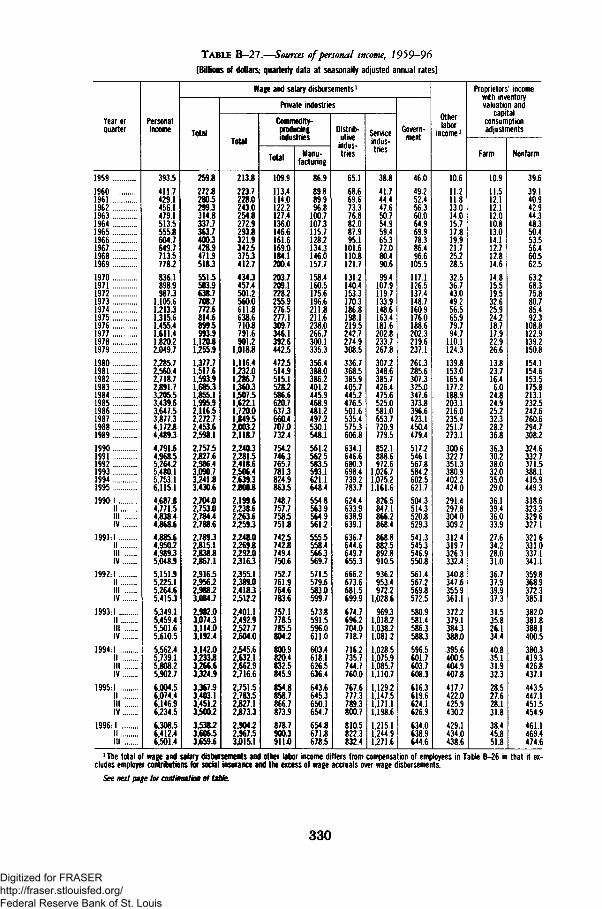
TABLE B-27.—Sources of personal income, 1959-96
[Billions of dollars,- quarterly data at seasonally adjusted annual rates]
Year orquarter
195919601961196219631964 : :..19651966196719681969197019711972197319741975197619771978197919801981198219831984 .. .19851986 .1987198819891990199119921993199419951990:1
I II l lIV
1991:1I II l lIV
1992:1I II l lIV
1993:1III l lIV
1994:1III l lIV
1995:1I II l lIV
1996: IIIIll
Personalincome
393.54117429.1456.1479.1513.5555.8604.7649.7713.5778.2836.1898.99873
1,105.6121331315.614554lieil.41,820.22,049.72,285.72,560.4271872,891.7320553,439.63,647.53,877.3417284,489.34,791.64,968.55,264.25,480.15,753.16,115.14,687.84,771.54,838.44,868.64,885.64,950.24,989.35,048.95,151.95,225.15,264.65,415.35,349.15,459.45,501.65,610.55,562.45,739.15,808.25,902.76,004.56,074.46,146.96,234.56,308.56,412.46,501.4
Wage and salary disbursements1
Total
259.8272.8280.5299.3314.8337.7363.74003428.9471.95183551.5583.9638.7708.77726814.68995993.9
1.120.81.255.91 377.71.517.61 593.91,68531855.11.995.92 116.52,272.72453.621598.12.757.52.827.62.986.43.090.73.241.83.430.62.704.02.753.02.784.42.788.62.78932.815.12.838.82,867.12.916.52.95622.988.23.084.72.982.03.07433,114.03,192.43.142.03,233.83,266.63.324.93.367.93.403.13.451.23.500.23.53823.606.53.659.6
Private industries
Total
213.82237228.0243.0254.8272.9293.8321.9342.5375.3412.74343457.4501.2560.06118638.67108791.6901.2
1.018.81.116.41,232.0U8671,360.31.507.51,622.11,720.01349.5200322,118.72,24032.281.52.418.62,506.42.63932308.82.199.62.238.62.263.62.259.32,248.02.269.82,292.0231632,355.12.389.02,418.32,512.22.401.12,492.92.527.72.604.02.545.62,632.12,662.92.716.62.751.52.783.52327.12.873.32.90422,967.53.015.1
Commodity-producingindustries
Totalloiai
109.91134114.0122.2127.4136.0146.6161.6169.0184.1200.4203.7209.12282255.92765277.13097346.1392.6442.5472.5514.9515152825866620.76373660.47070732.475427463765.7781.3824.9863.5748.7757.7758.57513742.5742.8749.4750.6752.7761.9764.6783.6757.1778.5785.58042800.9820.4832.5845.9854.8858.7866.7873.9878.7900.3911.0
Manu-facturing
86.989889.996.8
100.7107.3115.712821343146.0157.7158.4160.51756196.62118211.62380266.7300.1335.3356.4388.03862401.2445.9468.9481.249725301548.1561.2562.5583.5593.1621.1648.4554.8563.9564.95612555.5558.4566.3569.7571.5579.6583.0599.7573.8591.5596.0611.0603.4618.1626.5636.4643.6645.3650.1654.7654.8671.8678.5
Distrib-utive
indus-tries
65.168669.673.376.882.087.995.1
101.6110.8121.7131.2140.41533170.31868198.12195242.7274.9308.5336.7368.53859405.74452476.55016535.45753606.8634.1646.6680.3698.4739.2783.7624.4633.9638.9639.1636.7644.6649.7655.36662673.6681.5699.9674.76962704.0718.77162735.7744.7760.0767.6777.3789.3800.7810.5822.3832.4
Serviceindus-tries
38.841744.447.650.754.959.465.372.080.490.699.4
107.91197133.91486163.41816202.8233.7267.83072348.63857426.44756525.0581.0653.77209779.5852.1888.6972.6
1,026.71,07521,161.6
826.5847.18662868.4868.8882.5892.8910.59362953.49722
1,028.6969.3
1,01821,03821,08121,028.51,075.91,085.71,110.71,12921,147.51,171.11,198.61,215.11,244.91,271.6
Govern-ment
46.049252.456.360.064.969.978.386.496.6
105.5117.1126.51374148.71609176.01886202.3219.6237.1261.3285.63073325.03476373.83966423.14504479.4517.2546.1567.8584.2602.5621.7504.3514.3520.8529.3541.3545.3546.9550.8561.4567.2569.8572.5580.9581.4586.3588.3596.5601.7603.7608.3616.3619.6624.1626.9634.0638.9644.6
OtherlahnrlaDOr
income '
10.611211.813.014.015.717.819.921.725.228.532.536.743049256565!979794.7
110.1124.31398153.01654177.21889203.12160235.4251 7273.1300.6322.7351.3380.94022424.0291.4297.8304.03092312.4319.7326.3332.4340.8347.6355.9361.13722379.1384.3388.0395.6400.5404.9407.8417.7422.0425.94302429.1434.0438.6
Proprietors' incomewith inventoryvaluation and
capitalconsumptionadjustments
Farm
10.911512.112.112.010.813.014.112.712.814.614.815.519532.625924218717.922.926.613823.71646.0
24824.925232.328236'.836.330238.032.035.029.036.139.436.033.927.634228.031.036.737.939.937.331.535.826.134.440.835.131.932.328.527.628.131.838.445.851.8
Nonfarm
39.639140.942.944.348.350.453.556.460.562.563.268.375880.7854923
1088122:91392150.81541154.61535175.82131232.52426260.629473082324.6332.7371.5388.1415.9449.3318.6323.3329.6327.1321.6331.0337.1341.1359.8368.9372.3385.1382.0381.8388.1400.5380.3419.3426.8437.1443.5447.1451.5454.9461.1469.4474.6
'The total of wage and salary disbursements and other labor income differs from compensation of employees in Table B-26 in that it ex-cludes employer contributions for social insurance and the excess of wage accruals over wage disbursements.
See next page for continuation of table.
330
Digitized for FRASER http://fraser.stlouisfed.org/ Federal Reserve Bank of St. Louis
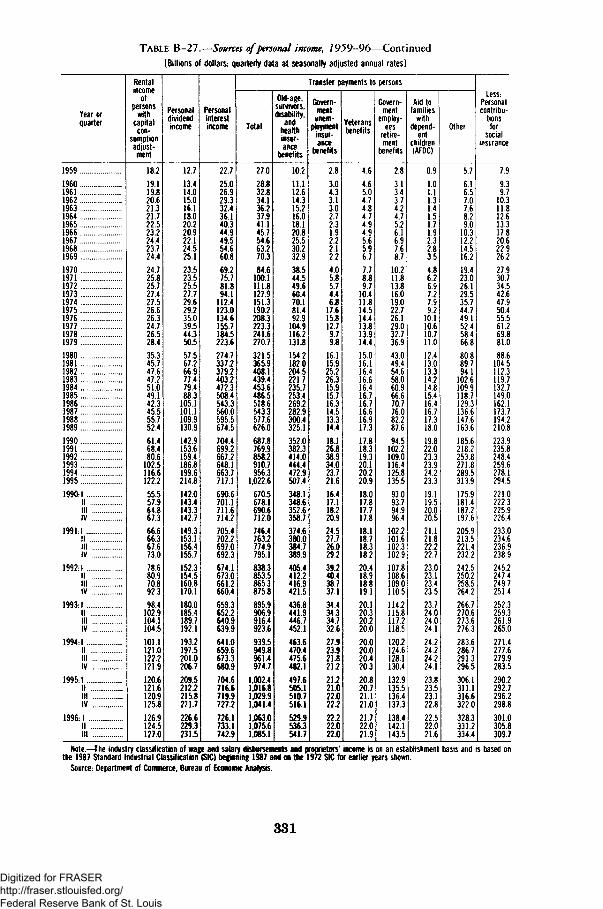
TABLE B—27.—Sources of personal income, 1959—96—Continued
[Billions of dollars; quarterly data at seasonally adjusted annual rates]
Year orquarter
19591960196119621963196419651966196719681969197019711972197319741975197619771978197919801981198219831984198519861987198819891990199119921993199419951990:1
I II l lIV
1991:1I II l lIV
1992-1III l lIV
1993-1III l lIV
1994:1I II l lIV
1995:1III l lIV
1996: 1III I I
Rentalincome
ofpersons
withcapital
con-sumptionadjust-
ment
18.219.119.820.621.321.722.523.224.423.724.424.725.825.727.427.526.626.324.726.528.435.345.747.647.251.049.142.345.555.752.461.468.480.6
102.5116.6122.255.557.964.867.366.666.367.673.078.680.970.892.398.4
102.9104.1104.5101.1121.0122.2121.9120.6121.6120.9125.8126.9124.5127.0
Personaldividendincome
12.713.414.015.016.118.020.220.922.124.525.123.523.525.527.729.629.235.039.544.350.557.567.266.977.479.488.3
105.1101.1109.9130.9142.9153.6159.4186.8199.6214.8142.0143.4143.3142.7149.3153.1156.4155.7152.3154.5160.8170.1180.0185.4189.7192.1193.2197.5201.0206.7209.5212.2215.8221.7226.6229.3231.5
Personalinterestincome
22.725.026.929.332.436.140.344.949.554.660.869.275.781.894.1
112.4123.0134.6155.7184.5223.6274.7337.2379.2403.2472.3508.4543.3560.0595.5674.5704.4699.2667.2648.1663.7717.1690.6701.1711.6714.2705.4702.2697.0692.3674.1673.0661.2660.4659.3652.2640.9639.9641.0659.6673.3680.9704.6716.6719.9727.2726.1733.1742.9
Transfer payments to persons
Total
27.028.832.834.136.237.941.145.754.663.270.384.6
100.1111.8127.9151.3190.2208.3223.3241.6270.7321.5365.9408.1439.4453.6486.5518.6543.3577.6626.0687.8769.9858.2910.7956.3
1.022.6670.5678.1690.67120746.4763.2774.9795.1838.3853.5865.3875.8895.9906.9916.4923.6939.5949.8961.4974.7
1,002.41.016.81,029.91,041.41.063.01,075.61,085.1
Old-age,survivors,disability,
andhealthinsur-ance
benefits
10.211.112.614.315.216.018.120.825.530.232.938.544.549.660.470.181.492.9
104.9116.2131.8154.2182.0204.5221.7235.7253.4269.2282.9300.4325.1352.0382.3414.0444.4472.9507.4348.1348.6352.6358.7374.6380.0384.7389.9405.4412.2416.9421.5436.8441.9446.7452.1463.6470.4475.6482.1497.6505.1510.7516.1529.9536.3541.7
Govern-mentunem-
ploymentinsur-ance
benefits
2.83.04.33.13.02.72.31.92.22.12.24.05.85.74.46.8
17.615.812.79.79.8
16.115.925.226.315.915.716.314.513.314.418.126.838.934.023.721.616.417.118.220.924.527.726.029.239.240.438.737.134.434.334.732.627.923.921.821.221.221.022.022.222.222.022.0
Veteransbenefits
4.64.65.04.74.84.74.94.95.65.96.77.78.89.7
10.411.814.514.413.813.914.415.016.116.416.616.416.716.716.616.917.317.818.319.320.120.220.918.017.817.717.818.118.718.318.220.418.918.819.120.120.320.220.020.020.020.420.320.820.721.121.021.722.021.9
Govern-ment
employ-ees
retire-ment
benefits
2.83.13.43.74.24.75.26.16.97.68.7
10.211.813.816.019.022.726.129.032.736.943.049.454.658.060.966.670.776.082.287.694.5
102.2109.0116.4125.8135.593.093.794.996.4
102.2101.6102.3102.9107.8108.6109.0110.5114.2115.8117.2118.5120.2124.6128.1130.4132.9135.5136.4137.3138.4142.1143.5
Aid tofamilies
withdepend-
entchildren(AFDC)
0.91.01.11.31.41.51.71.92.32.83.54.86.26.97.27.99.2
10.110.610.711.012.413.013.314.214.815.416.416.717.318.019.822.023.323.924.223.319.119.520.020.521.121.822.222.723.023.123.423.523.724.024.024.124.224.224.224.123.823.523.122.822.522.021.6
Other
5.76.16.57.07.68.29.0
10.312.214.516.219.423.026.129.535.744.749.152.458.466.880.889.794.1
102.6109.9118.7129.3136.6147.6163.6185.6218.2253.8271.8289.5313.9175.9181.4187.2197.6205.9213.5221.4232.2242.5250.2258.5264.2266.7270.6273.6276.3283.6286.7291.3296.53061311.1316.6322.0328.3331.2334.4
Less:Personalcontribu-
tionsfor
socialinsurance
7.99.39.7
10.311.812.613.317.820.622.926.227.930.734.542.647.950.455.561.269.881.088.6
1045112.3119.7132.7149.0162.1173.7194.2210.8223.9235.8248.4259.6278.1294.5221.0222.3225.9226.4233.0234.6236.9238.9245.2247.4249.7251.4252.3259.3261.9265.0271.4277.6279.9283.5290.2292.7296.2298.8301.0305.8309.7
Note.—The industry classification of wage and salary disbursements and proprietors' income is on an establishment basis and is based onthe 1987 Standard Industrial Classification (SIC) beginning 1987 and on the 1972 SIC for earlier years shown.
Source: Department of Commerce, Bureau of Economic Analysis.
331
Digitized for FRASER http://fraser.stlouisfed.org/ Federal Reserve Bank of St. Louis

TABLE B-28.—Disposition of personal income, 1959-96
[Billions of dollars, except as noted; quarterly data at seasonally adjusted annual rates]
Year or quarter
1959I96019611962196319641965196619671968196919701971197219731974197519761977197819791980198119821983198419851986198719881989199019911992-1993199419951990-1
I IIllIV
1991:1I II l lIV
1992-1III l lIV
1993-1I IIllIV
1994-1I II l lIV
1995:1I II I IIV
1996:1IIIll
Personalincome
393.5411.7429.1456.1479.1513.5555.8604.7649.7713.5778.2836.1898.9987.3
1.105.61.213.31,315.61.455.41.611.41.820.22.049.72,285.72.560.42.718.72.891.73.205.53.439.63.647.53.877.34.172.84,489.34,791.64.968.55,264.25.480.15.753.16.115.14.687.84.771.54,838.44,868.64,885.64.950.24.989.35.048.95.151.95,225.15.264.65.415.3
.5,349.15,459.25,501.65,610.55,562.45,739.15,808.25,902.76,00456,074.46,146.96,234.56,308.56.412.46,501.4
Less:Personaltax andnontax
payments
44.548.750.354.858.056.061.971.077.992.1
109.9109.0108.7132.0140.6159.1156.4182.3210.0240.1280.2312.4360.2371.4369.3395.5437.7459.9514.2532.0594.9624.8624.8650.5689.9731.4794.3613.0628.2630.8627.1622.3620.5623.7632.5636.7640.0650.6674.8662.4686.9696.4713.8705.5740.8731.3748.1770.0801.5798.4807.2824.9870.6872.5
Equals:DS!fpersonalincome
349.0362.9378.8401.3421.1457.6493.9533.7571.9621.4668.4727.1790.2855.3965.0
1.054.21.159.21.273.01.401.41.580.11,769.51,973.32.200.22,347.32.522.42.810.03,002.03,187.63.363.13,640.83.894.54.166.84,343.74.613.74.790.25.021.75.320.84.074.84.143.34.207.64,241.54.263.34,329.64,365.64.416.44.515.24.585.14,613.94,740.54,686.74,772.34,805.24396.74,856.84.998.35.076.95,154.65.234.55.272.95.348.55.427.35.483.55.541.85.628.9
Less: Personal outlays
Total
324.7339.6350.5371.8392.5422.1456.2494.7523.0574.6621.4666.1721.6791.6875.4956.6
1,054.81.176.71,308.91,467.61.639.51,811.52,001.12,141.82,355.52,574.42,795.82,991.13,194.73,451.73,706.73.958.14,097.44,341.04,575.84.832.35.071.53,875.83,929.43.999.34,027.94.032.54,083.34.123.94,149.84.250.04,304.84,359.54,450.04,489.24,545.54,602.24,666.34,728.04,796.14,870.84,934.24,980.35,054.45,106.65,144.75,218.15,300.75,329.8
Personalcon-
sumptionexpendi-
tures
318.1332.2342.6363.4383.0411.4444.3481.9509.5559.8604.7648.1702.5770.7851.6931.2
1,029.11,148.81,277.11.428.81,593.51,760.41,941.32.076.82,283.42,492.32,704.82,892.73,094.53,349.73,594.83,839.33,975.14,219.84,454.14,700.94.924.93,759.23,811.83,879.23,907.03,910.73,961.04,001.64,027.14,127.64,183.04,238.94,329.64,367.64,424.84,481.04,543.14,600.94,666.24,738.34,798.24,840.64,910.54,957.94,990.55,060.55,139.45,165.4
Interestpaidby
persons
6.17.07.37.88.9
10.011.112.012.513.815.716.817.819.622.424.224.526.730.737.544.549.454.658.865.574.783.290.391.592.9
102.4108.9111.9111.7108.9117.2131.7106.7108.0109.8110.9111.4112.0112.0112.1112.9112.1111.4110.4109.0108.0108.5110.0113.0115.8118.4121.5125.3129.8134.0137.8141.9145.1148.2
Per-sonal
transferpay-
mentsto restof theworld(net)
0.4.5.5
'6
'.K.8
1.01.01.11.21.31.31.41.21.21.21.21.31.41.65.26.26.57.47.88.18.79.19.69.9
10.49.6
12.814.214.99.99.5
10.210.110.410.310.210.69.49.79.29.9
12.612.712.813.114.114.114.114.514.414.114.716.515.716.216.2
Equals:Personalsaving
24.323.328.329.528.635.537.839.148.946.846.961.068.663.689.697.6
104.496.492.5
112.6130.1161.8199.1205.5167.0235.7206.2196.5168.4189.1187.8208.7246.4272.6214.4189.4249.3199.0213.9208.3213.5230.8246.3241.7266.6265.2280.3254.5290.5197.4226.8202.9230.5128.8202.2206.2220.4254.2218.5241.9282.6265.4241.1299.1
Percent of disposablepersonal income '
Personal outlays
Total
93.093.692.592.693.292.392.492.791.592.593.091.591.392.690.790.791.092.493.492.992.691.890.991.293.491.693.193.895.094.895.295.094.394.195.596.295.395.194.895.095.094.694.394.594.094.193.994.593.995.895.395.895.397.496.095.995.795.195.995.594.895.295.794.7
Personalcon-
sumptionexpendi-
tures
91.191.590.590.690.989.990.090.389.190.190.589.188.990.188.288.388.890.291.190.490.189.288.288.590.588.790.190.892.092.092.392.191.591.593.093.692.692.392.092.292.191.791.591.791.291.491.291.991.393.292.793.392.894.793.493.393.192.593.192.792.092.392.791.8
Personalsaving
7.06.47.57.46.87.77.67.38.57.57.08.48.77.49.39.39.07.66.67.17.48.29.18.86.68.46.96.25.05.24.85.05.75.94.53.84.74.95.25.05.05.45.75.56.05.96.15.56.14.24.84.24.72.74.04.14.34.94.14.55.24.84.35.3
i Percents based on data in millions of dollars.Source: Department of Commerce, Bureau of Economic Analysis.
332
Digitized for FRASER http://fraser.stlouisfed.org/ Federal Reserve Bank of St. Louis

TABLE B-29-—Total and per capita disposable personal income and personal consumption expenditures
in current and real dollars, 7939-96[Quarterly data at seasonally adjusted annual rates, except as noted]
Year orVJUOllcl
19591960196119621963196419651966196719681969
197019711972197319741975197619771978 .:19791980198119821983198419851986198719881989
1990199119921993199419951990:1
IIIllIV
1991:1IIIllIV
1992:1II111 Z~IV
1993:1IIIllIV
1994:1IIIllIV
1995:1IIIllIV
1996:1IIIII
Disposable personal income
Total (billions ofdollars)
Currentdollars
349.0362.9378.84013421.1457.6493.9533.7571.9621.4668.4727.1790.2855.3965.0
1,054.21.159.21.273.01.401.41.580.11.769.51.973.3220022.347.3252242.810.03.002.03.187.63.363.13.64083.894.54.166.84.343.74.613.74,790.25.021.75.320.84.074.84.143.34.207.64.241.54.263.34.329.64.365.64.416.44.515.24,585.14.613.94.740.54,686.74,772.34.805.24,896.74,856.84.998.35.076.95.154.65.234.55.272.95.348.55.427.35.483.55,541.85,628.9
Chained(1992)dollars
1.530.11.565.41.615.8169371.755.51.881.92.000.22.106.62.198.42.298.22.373.62.465.62.564.02.680.82.869.42,847.02.895.03.008.03.105.13,264.23353.93,373.3345233J483.0357993'.842.03.958.64.087.04.154.14,31814.403.74,484.64,486.54.613.74.666.94.778 24.945.84.475.54.494.34.499.74.468.84,452.74.492.64.494.24,506.34.565.64.599.84.600.64.688.74.603.04,658.04.674.84.731.74,666.54.776.04,810.24.859.94,903.84.907.14.959.55,012.95.037.65.054.55.114.6
Per capita(dollars)
Currentdollars
1.9702.0082.06221512.2252.3842,5412,7152.8773.0963.2973.5453.8054.0744.5534.9285.3675.8376.3627,0977.8618.6659566
10.1081076411,88712.58713.24413.84914.85715,74216.67017.19118.06218.55519,26420,2241636916.60216.81016,8%16.94117.16117.25317.40517.75317.97918.03618.47818.22518.51318.58918.89218.69919,20019.45219.70019.96520,0682030620.55520.72720,90021.177
Chained(1992)dollars
8.6388,6608,79490779.2749,805
10.29210.71511.06111,44811.70812.02212.34512.77013.53913.31013.40413.79314.09514,66214.89914.8131500914.9991527716.25216.59716.98117.1061762117.80117.94117.75618.06218.0781833018.79917.97918.00817.97717.80217.69417,80717,76117,75917,95118.03617.98418.27717.90018.06918,08418.25617,96618.34618.43018.57418.70418.67618.82918.98619.04119.06319,242
Personal consumption expenditures
Total (billions ofdollars)
Currentdollars
318.13322342.636343834411.4444.3481.9509.5559.8604.7648.1702.5770.7851.6931.2
1.029.11.148.81.277.11,428.81.593.51.760.4194132 076.8228342>92.32.704.82.892.73,094.5334973,594.83,839.33.975.14.219.84,454.1470094,924.93,759.23.811.83.879.23.907.03.910.73.961.04.001.64.027.14.127.64.183.04.238.94.329.64.367.64,424.84,481.04.543.14,600.94.666.24.738.34.798.24.840.64.910.54.957.94.990.55.060.55,139.45.165.4
Chained(1992)dollars
1394.614326M6L5153381,596.61.692.31,799.11,902.01,958.62,070.22,147.52,197.82,279.52,415.92,532.62,514.72,570.02,714.32,829.82,951.63,020.2300973046430815324063,407.63,566.53,708.73,822.3397274;064.64,132.24,105.84,219.84,339.5447324J577.84,128.94,134.74,148.54,116.44,084.54,110.04,119.54,109.14,173.84,196.44,226.74,282.34,289.74,318.84,359.54,390.04,420.54,458.74,489.44,524.04,534.84,569.94,597.34,609.44,649.14,687.64,693.5
Per capita(dollars)
Currentdollars
1,79618381,86519482i0232,1442,2862,4512,5632,7892,9823,1603,3833,6714,0184,3534,7655,2685,7976,4187,0797,73084408^9439744
W54311,34112,01912,7431366914,53115,36015,73216,52017,2531803318,71915,10215,27415,49815,56415,54015,70015,81515,87116,22916,40216,57016,87716,98417,16417,33517,52817,71417,92418,1541833818,46318,68918,82318,90119,12819,38319,433
Chained(1992)dollars
7,8737,9267,95482208,4348,8179,2579,6749,854
10,31310,59310,71710,97511.50811.95011,75611,89912,44612,84613,25813,41713,2161324513,2701382914,41514,95415,40915,7401621116,43016,53216,24916,52016,80917 15917,40016,58716,56816,57416,39816,23116,29116,28016,19416,41016,45416,52216,69216,68116,75416,86416,93717,01917,12717,20017,29017,29617,39317,45417,45817,57317,67917,657
Gross domesticproduct
per capita(dollars)
Currentdollars
2,86429132,96531363,2613,4553,7004.0074,1944,5364,8455,0505.4195,8946.5246.9987,5508,3419,201
10,29211.361122261354713,9611499816',50817,52918,37419,3232060521,98422,97923,41624,44725,3832660627,57122,73923,04423,10223,03123,13623,35523,51523,65524.07024,31624,51624,88125,05425,23925,43325,80626,08826,46926,79327,07127,27027,42127,75227,84028.07228,45528,653
Chained(1992)dollars
12,4901251212!5711312513>9214,08314,79215,56515.80016,38216,71216,52016,85317,57918.41218.17817,89618,71319,42620,18520,541202522054219'911205272173622,34522,81023,2602392424>9724,55924,05824,44724,7382535225,63024,72224,74124,55124,22424,03324,07524,06524,05824,28024,36624,47424.66424,60224,65824,73324,95925,05825,30525,45925,58325,55925,55125,72725,68125,75725,99426,066
Popula-tion
f thnuluiOU-sands) '
177.130180 760183.742186 590189.300191.927194,347196,599198.752200.745202,736205.089207,692209,924211,939213,898215,981218,086220,289222,629225,106227,726230 008232J218234 332236394238,506240,682242,842245061247,387249,956252,680255,432258,159260 681263,090248,928249,564250,299251,031251,650252,295253,033253,743254,338255,032255,815256,543257,155257,787258,501259,192259,738260,327261,004261,653262,181262,748263,399264,032264,563265,155265,806
1 Population of the United States including Armed Forces overseas-, includes Alaska and Hawaii beginning 1960. Annual data are averagesof quartern; data. Quarterly data are averages for the period.
Source: Department of Commerce (Bureau of Economic Analysis and Bureau of the Census).
333
Digitized for FRASER http://fraser.stlouisfed.org/ Federal Reserve Bank of St. Louis

TABLE B-30.—Gross saving and investment, 1959-96
[Billions of dollars, except as noted: quarterly data at seasonally adjusted annual rates]
Year orquarter
1959I96019611962196319641965196619671968196919701971197219731974197519761977B78197919801981198219831984198519861987198819891990199119921993199419951990:1
II ....Ill ...IV ...
1991:1II ....Ill ...IV ...
1992:1II ....Ill ...IV ...
1993:1II ....Ill ...IV ...
1994:1II ....Ill ...IV ...
1995:1II ....Ill ...IV ...
1996:1II ....Ill ...
Gross saving
Total
109.0113.911681274135.414581610171.7174.41858202.9198.2215.3244.9297.53023298.3340.9395.5477.4540.9547.4651.1604.7589.6751.5746.7721.0780.9877.2907.9904.4935.3905.4935.5
1,056.31,151.8
896.1940.7895.0885.7983.5928.1905.4924.0921.5915.1901.0884.0908.7923.8937.5972.1
1,034.31,065.41,054.91,070.7
1,115.01,102.91,168.61,220.61,217.91,244.51,314.0
Gross private saving
Total
82.882.188697.1
100.311291244132.6144.71461149.0164.7190.7202.7242.3252.7302.2317.5349.4405.0449.1489.5581.9610.1619.1737.5731.5710.1727.2808.4815.9861.7931.9971.9962.4
1,006.71,071.8
850.28863838.9871.2928.2927.8918.0953.7977.8980.5987.8941.3981.0951.8962.4954.6
1,013.59913
1,003.81,0183
1,043.81,018.51,085.91,138.91,133.81,121.61,196.1
Per-sonalsaving
24323328329.528.635.537839.148.946846.961.068.663.689.697.6
104.496.492.5
112.6130.1161.8199.1205.5167.0235.7206.2196.5168.4189.1187.8208.7246.4272.6214.4189.4249.3199.0213.92083213.5230.8246.3241.7266.6265.22803254.5290.5197.4226.8202.9230.5128.8202.2206.2220.4
254.2218.5241.9282.6265.4241.1299.1
Gross business saving
Total1
58.458.860267.671.777.486693.595.999.3
102.1103.8122.1139.1152.7155.2197.8221.1256.9292.4319.0327.6382.8404.6452.1501.9525.3513.6558.86193628.1653.0685.6699.2748.08173822.5651.2672.4630.6657.7697.4681.56763687.2712.6700.1733.4650.8783.6725.0759.5724.1884.7789.1797.6797.9
789.6800.0844.08563868.4880.5897.0
Undis-trib-uted-corpo-rate
profits2
13.912.713018.721.224.429931.728.926322.617.727334.537.621.540.147.053.462.053.523.033.326.354.391.092.954.275.7
103.376.277.286.088.9
1033123.2140.685.699.250.073.8
105.085.174.979.1
111.393.752.997.785.789.4
110.1128.283.9
132.7137.2138.8121.0123.5159.6158.4171.8176.3182.5
Corporateand non-corporateconsump-
tion offixed
capital
44.546.147248.950.553156761.867.073079.586.194.4
104.9115.1133.7157.7174.1203.5230.4265.5304.6349.5378.3397.8410.9432.4459.4483.2516.0551.9575.8599.6626.1640.0678.7679.2565.6573.2580.6583.9592.5596.4601.4608.1601.3606.4680.5616.2633.8634.6648.46433748.7652.7656.7656.6
664.6673.6681.8697.0694.7704.2714.6
Gross government saving
Total
26.231.828330335.132936639.229.739753.932.623.941.555.151.5-3.923.546.172.490.756.868.1-53
-29.414.015.210.853.668.892.042.73.3
-66.5-26.9
49.680.045.954.556.114.555.3
.2-12.6-29.7-563-65.3-86.9-573-723-28.0-24.9
17.520.874.151.152.471.284.482.781.784.1
122.9117.8
Federal
Total
12.817.813614.017.213.015915.65.6
12024.32.2
-8.5-2.48.75.1
-49.9-31.9-193-2.813.0
-26.8-20.6-92.8
-131.8-111.9-116.9-127.9-77.2-67.0-56.4-94.0
-132.2-215.0-187.4-119.6-87.8-94.8-84.4-81.9
-115.0-72.0
-132.9-149.7-174.0-2022-213.9-231.5-212.5-217.2-182.5-185.7-164.2-1432-99.7
-118.1-117.4
-992-86.9-84.6-80.7-82.0-54.1-48.4
Con-sump-tionof
fixedcapital
10.210.510.711.211.812.112513.013.914.915.616.216.918219.922.024.025.427.028.931.534.137.141.942.644.146.149.651.754.357.060.763.965.968270.673.859359.760.862.862.663.964.364.865265.866.066.567.367.768.669.169.570.070.472.773.574273.873.873272.6723
Currentsurplus
ordeficit
(NIPA)
2.67.42.92.85.4
3^42.6
-8.3-2.8
8.7-14.1-25.3-20.5-11.1-16.9-73.9-57.2-463-31.7-18.4-61.0-57.8
-134.7-174.4-156.0-162.9-177.5-128.9-121.3-113.4-154.7-196.0-280.9-255.6-190.2-161.7-154.1-144.1-142.6-177.7-134.6-196.7-214.0-238.8-267.4-279.6-297.5-279.0-284.5-250.2-254.4-2333-212.7-169.6-188.5-190.1
-172.6-161.1-158.5-154.5-1552-126.7-120.8
State and local
Total
13.514.014716.317.919.920823.524.127.629.630.432.443.946.446.546.055.365.475.177.783.688.787.5
102.4125.9132.0138.8130.8135.8148.4136.7135.5148.6160.5169.2167.9140.7138.9137.9129.4127.3133.1137.1144.4145.9148.5144.6155.2144.9154.5160.9181.7164.0173.7169.2169.8170.4171.3167.3162.4166.1177.01663
Con-sump-
tionof
fixedcapital
3.94.04 34.64.95.2576.36.8768.59.6
10.711.713.016.018.419.420.722.525.429.233.336.237.539.041.043.947.149.953.356.659.662.365.669.472.955.256.157.257.958.659.460.060.661.162.062.763.564.465.366.066.769.268.569.670.571.472.373.474.375.176.077.1
Currentsurplus
ordeficit
(NIPA)
9.69.9
10411.713.014715117.317.320021.120.821.732.233.430.527.635.944.752.652.354.455.451.364.986.991.094.983.885.995.180.175.886.394.999.795.085.582.880.771.568.873.777.183.884.886.682.091.780.589.194.9
115.094.8
105.299.699.399.099.093.988.191.0
101.089.2
Capi-tal
grantsreceived
by theUnitedStates(net) 3
0.9.7.7
0«-2.0
00001.11.21.100000000000000000000000000000000000000000
1 Includes private wai'With inventory valuation and capital consumption3 Consists mainly of allocations of special drawingSee next page for continuation of table.
(SORs).
334
Digitized for FRASER http://fraser.stlouisfed.org/ Federal Reserve Bank of St. Louis

TABLE B-30.—Gross saving and investment, 1959-96—Continued[Billions of dollars except as noted; quarterly data at seasonally adjusted annual rates]
Year or quarter
1959 .1960196119621963196419651966196719681969197019711972 ...197319741975197619771978197919801981198219831984198519861987198819891990199119921993199419951990 1
I IIIIIV
1991-1I IIIIIV
1992-1I IIIIIV
1993: 1III l lIV
1994-1III I IIV
1995-1III I IIV
1996-1I II I I
Gross investment
Total
106.9110.2113.5125.0131.9143.8159.6174.4175.1186.0200.7199.1220.4248.1299.9306.7309.5359.9413.0494.9568.7574.8665.7601.8626.2755.7748.0743.1764.2828.7919.5920.5944.0949.1993.5
1,090.41,150.9
939.2958.1911.3873.4977.0933.7922.6942.8944.7951.4952.6947.6988.2983.5987.4
1,014.81,058.41,095.31.100.21,107.61,145.01,123.21,161.51,173.91,167.91,187.01,215.9
Grossprivatedomes-
ticinvest-ment
78.878.877.987.993.4
101.7118.0130.4128.0139.9155.0150.2176.0205.6242.9245.6225.4286.6356.6430.8480.9465.9556.2501.1547.1715.6715.1722.5747.2773.9829.2799.7736.2790.4871.1
1,014.41,065.3
822.5835.2804.9736.1723.6716.2743.9760.9755.2790.8799.7816.1843.6855.9873.8911.2957.6
1,016.51,033.61,050.11,072.01,050.31,074.81,064.01,068.91,096.01,156.2
Grossgovern-
mentinvest-ment4
29.328.231.333.233.534.535.440.143.544.343.944.043.145.448.356.062.764.465.474.685.396.4
102.1106.9116.5131.7149.9163.5173.5172.9182.7199.4200.5209.1210.6212.3221.9196.0196.7199.7205.4198.1201.5201.3201.4209.5209.3208.9208.8207.1210.6209.8214.7207.3208.5217.2216.3219.1223.7224.7220.1228.8235.1234.2
Netforeigninvest-ment5
-1.23.24.33.95.07.56.23.93.51.71.84.91.3
-2.98.75.1
21.48.9
-9.0-10.4
2.612.5
7.4-6.1
-37.3-91.5
-116.9-142.9-156.4-118.1
-92.4-78.6
7.3-50.5-88.2
-136.4-136.3
-79.4-73.8-93.3-68.1
55.316.0
-22.6-19.4-19.9-48.7-56.0-77.2-62.6-83.0-96.2
-111.0-106.5-129.7-150.6-158.9-146.2-150.8-138.1-110.2-129.9-144.2-174.6
Statisti-cal
discrep-ancy
-2.1-3.7-3.3-2.4-3.5-2.1-1.4
2.7.6.2
-2.21.05.13.22.44.5
11.218.917.517.627.827.414.6-2.936.5
4.21.3
22.1-16.6-48.6
11.616.18.8
43.758.034.1-.9
43.017.416.3
-12.3-6.5
5.617.218.823.336.251.663.679.559.849.842.824.130.045.336.930.020.3-7.1
-46.7-50.0-57.5-98.1
Addenda:
Grosssavingas a
percentof
grossnationalproduct
21.421.521.321.621.821.822.221.720.820.320.519.019.019.721.320.018.118.619.320.620.919.420.718.516.619.117.816.316.617.316.615.715.814.514.315.215.915.816.315.415.216.815.715.215.415.014.714.313.814.114.214.214.515.315.515.115.115.615.316.016.616.416.517.3
Personalsavingas a
percentof
dispos-able
personalincome
7.06.47.57.46.87.77.67.38.57.57.08.48.77.49.39.39.07.66.67.17.48.29.18.86.68.46.96.25.05.24.85.05.75.94.53.84.74.95.25.05.05.45.75.56.05.96.15.56.14.24.84.24.72.74.04.14.34.94.14.55.24.84.35.3
4 For details on government investment, see Table B-185 Net exports of goods and services plus net receipts of factor income from rest of the world less net transfers plus net capital grantsreceived by the United States. See also Table B-22.6Consists of a U.S. payment to India under the Agricultural Trade Development and Assistance Act. This payment is included in capitalgrants received by the United States, net.
Source: Department of Commerce. Bureau of Economic Analysis.
335
Digitized for FRASER http://fraser.stlouisfed.org/ Federal Reserve Bank of St. Louis

TABLE B— 31.—Median money income (in 1995 dollars) and poverty status of families and persons,
by race, selected years, 1977-95
Year
ALL RACES197719781979 4
1980198119821983s
1984198519861987 6
19881989199019911992 7
199319941995WHITE1977197819794
1980198119821983s
1984198519861987 6
1988 .1989199019911992 7
199319941995BLACK197719781979 4
19801981 .19821983s
1984198519861987 6
19881989199019911992 7
19931994 ...1995
Families1
Num-ber
(mil-lions)
57.257.859.660.361.061.462.062.763.664.565.265.866.166.367.268.268.569.369.6
50.550.952.252.753.353.453.954.455.055.756.156.556.656.857.257.757.958.458.9
5.85.96.26.36.46.56.76.86.97.17.27.47.57.57.78.08.08.18.1
Medianmoneyincome
1995dol-
lars)2
$38,60439,82740,33938,93037.86837,35637,75438,77239.28340.96241,54841,47042,04941,22340.21439,72738,98039,88140,611
40,36741,47142.09340,56139.77839.22139,53440,61041,29042.84043,44643,69144,21443,04442,27742.00541,44942,04342.646
23,06024,56223.83623,46922,43921,67722,28022,63423,77524.47924,69324,90124,83824,98024,11122,92322,72025,39825,970
Below poverty level
Total
Num-ber
(mil-lions)
5.35.35.56.26.97.57.67.37.27.07.06.96.8717.78.18.48.17.5
3.53.53.64.24.75.15.24.95.04.84.64.54.44.65.05.35.55.35.0
1.61.61.71.82.02.22.22.12.02.02.12.12.12.22.32.52.52.22.1
Per-cent
9.39.19.2
10.311.212.212.311.611.410.910.710.410.310.71J.511.912.311.610.8
7.06.96.98.08.89.69.79.19.18.68.17.97.88.18.89.19.49.18.5
28.227.527.828.930.833.032.330.928.728.029.428.227.829.330.431.131.327.326.4
Femalehouseholder
Num-ber
(mil-lions)
2.62.72.63.03.33.43.63.53.53.63.73.63.53.84.24.34.44.24.1
1.41.41.41.61.81.81.91.92.02.02.01.91.92.02.22.22.42.32.2
1.21.21.21.31.41.51.51.51.51.51.61.61.51.61.81.91.91.71.7
Per-cent
31.731.430.432.734.636.336.034.534.034.634.233.432.233.435.635.435.634.632.4
24.023.522.325.727.427.928.327.127.428.226.926.525.426.828.428.529.229.026.6
51.050.649.449.452.956.253.751.750.550.151.149.046.543.151.250.249.946.245.1
Personsbelow
poverty level
Num-ber
(mil-lions)
24.724.526.129.331.834.435.333.733.132.432.231.731.533.635.738.039.338.136.4
16.416.317.219.721.623.524.023.022.922.221.220.720.822.323.725.326.225.424.4
7.77.68.18.69.29.79.99.58.99.09.59.49.39.8
10.210.810.910.29.9
Per-cent
11.611.411.713.014.015.015.214.414.013.613.413.012.813.514.214.815.114.513.8
8.98.79.0
10.211.112.012.111.511.411.010.410.110.010.711.311.912.211.711.2
31.330.631.032.534.235.635.733.831.331.132.431.330.731.932.733.433.130.629.3
Median money income (in 1995 dollars)of persons 15 years old and over with
income2 3
Males
Allpersons
$24,41124,68924,25823,20322.78922,23822,43322,88223.10223,79723,86124.35824,44923,66222.90422,21922,25622,33622,562
25,56825,85825,34224,68024,18123,51023.60124,15424,23525,11325,36225,71225,64124,68523,94023,25223,18323,31123,895
15,17215,49115.68714,83114,37914,08913,80213,85815,25115,04815,04515,51615,49715,00414,50414,19115,40315,40716,006
Year-round
full-timeworkers
$36,34036.26435,99735,50435,00034,52134,40235,20935,40836,00635,79435,22334,92833.79033,93933,49132,77632,50832,199
37,08236,93737.03736,51735,82235,44135,31736,41536,39037,01136,62836,40936,46835,07534,63534,28733,57233,35933,515
25,56628,29026,69325,69325,34525,17225,19624,85225,45326,09426,19026,68725,44625,04725,31924,97424.85425,09724,798
Females
Allpersons
$9,5039,1858,9639,1119,2329,3859,800
10,07410,22210,58211,12811,44511,82811,74211,72211,638li.65011,7911?.130
9,6489,2959,0479,1619,3359,5129,972
10,19310,42010,79011,41311,72712,05912,03011,99611,90811,88211,96012.316
8,3318,3708,2348,4818,2938,3908,5219,0418,8909,1309,3229,4679,6799,7119,8659,653
10,02810,84310,961
Year-round
full-t imeworkers
$21,25421.76721,68821.46421,07021,78122,13522,62123,01923,42023,56323,89124,13624,01023,77223.99823,69723,92423,777
21,38921,97321,87821,67121,42222,07422,43022,84523,34423,77923,99924,24924,42224,29924,11924,27624,23524,57124,264
19,99020,36520,04720,21219,34719,72919,91020,58820,66520,80821,43521,72921,96421,62321,41022,00521,42621,21321,079
'The term "family" refers to a group of two or more persons related by birth, marriage, or adoption and residing together. Every familymust include a reference person. Beginning 1979, based on householder concept and restricted to primary families.
'Current dollar median money income deflated by CPHJ-X13 Prior to 1979, data are for persons 14 years and over.4 Based on 1980 census population controls; comparable with succeeding years.s Reflects implementation of Hispanic population controls; comparable with succeeding years.6 Based on revised methodology, comparable with succeeding years.7 Based on 1990 census adjusted population controls; comparable with succeeding years.Note.—Poverty rates (percent of persons below poverty level) for all races for years not shown above are: 1959, 22A, 1960, 22.2; 1961,
21.9; 1962, 21.0; 1963, 19.5; 1964, 19.0; 1965, R3; 1966. 14.7; 1967. 14.2; 1968, 12.8; 1969, 12.1; 1970, 12.6; 1971, 12.5; 1972, 11.9;1973,11.1; 1974,11.2; 1975,12.3; and 1976,11.8.
Poverty thresholds are updated each year to reflect changes in the consumer price index (CPI-U).For details see "Current Population Reports," Series P-60.Source: Department of Commerce, Bureau of the Census.
336
Digitized for FRASER http://fraser.stlouisfed.org/ Federal Reserve Bank of St. Louis
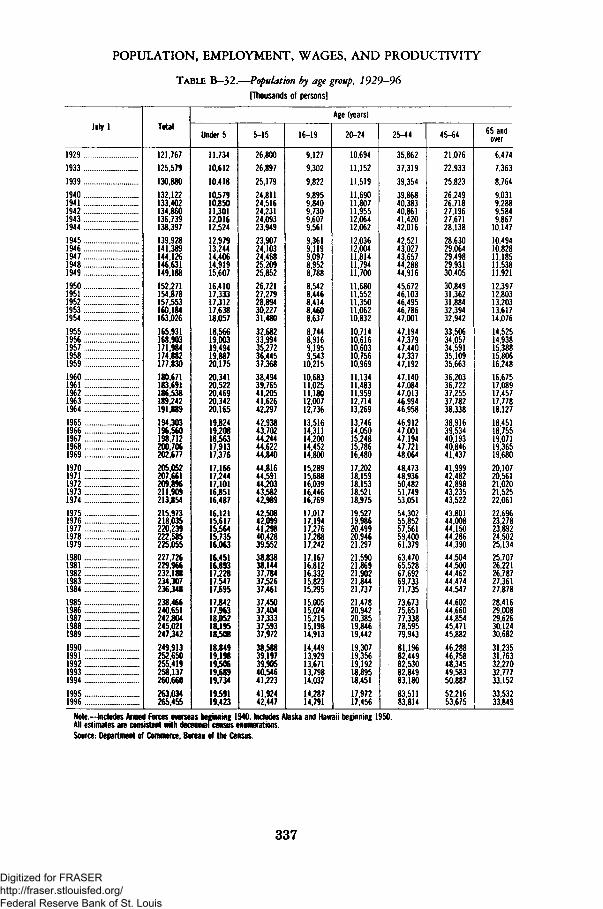
POPULATION, EMPLOYMENT, WAGES, AND PRODUCTIVITY
TABLE B-32.—Population by age group, 1929-96[Thousands of persons]
July 1
19291933193919401941194219431944 ..194519461947194819491950195119521953195419551956195719581959I960196119621963196419651966196719681969197019711972197319741975197619771978197919801981198219831984198519861987198819891990199119921993199419951996
Total
121,767125 579130,880132,122133402134*860136,739138397139,928141,389144126146;631149.188152,271154,878157553160*184163,026165,931168903171*984174,882177830180671183,691186538189,242191889194303196,560198712200*706202677205052207*6612098%211*909213854215 973218035220239222*585225 055227,726229,966232188234̂ 307236348238,466240,651242,804245,021247,342249,913252,650255,419258,137260,660263,034265,455
Under 5
11,7341061210,41810,579108501130112*0161252412,97913,2441440614,91915,60716,41017,3331731217,63818,05718,566190031949419*887201752034120!5222046920,3422016519824192081856317,913173761716617244171011685116487161211561715564157351606316,4511689317228175471769517,84217,96318.0521819518,50818,84919,19819.50619.68919,7341959119,423
5-15
26,8002689725,17924,811245162423124,0932394923,90724,1032446825120925,85226,72127,2792889430,22731,48032,682339943527236,445373683849439,7654120541,6264229742938437024424444,622448404481644,5914420343*582429894250842,0994129840*4283955238.83838.1443778437*5263746137,45037,40437,3333759337,97238.58839,19739,90540,54641,2234192442,447
16-19
9,127930298229895984097309i60795619,3619,11990978,9528,7888,5428,44684148,4608,6378744891691959̂ 543102151068311*02511 18012*007127361351614311142001445214800152891568816039164461676917017171941727617,2881724217,167168121633215,8231529515,00515,02415,2151519814,9131444913,92913,67113,798140321428714,791
Age (years)
20-24
10,69411 1521151911,690118071195512*0641206212,03612,0041181411,79411,70011,68011,5521135011,06210,832107141061610603107561096911 134114831195912,7141326913746140501524815,786164801720218,1591815318,5211897519527199862049920,9462129721,59021,8692190221*8442173721,47820,94220,3851984619,44219,30719,35619,19218,89518,4511797217,456
2M4
35,862373193935439868403834086141,4204201642,52143,0274365744,28844,91645,67246,1034649546,78647,00147194473794744047,337471924714047*0844701346*994469584691247001471944772148064484734893650482517495305154302558525756159,4006137963,4706552867692697337173573,67375,65177,3387859579,94381 19682,44982,53082,849831808351183*814
45-64
21,0762293325,82326,2492671827 19627*6712813828,63029,0642949829,93130,40530,84931,3623188432,39432,94233506340573459135409356633620336,7223725537,7823833838916395344019340,846414374199942*4824289843235435224380144,0084415044̂ 864439044,50444,5004446244,4744454744,60244,66044,8544547145,8824628846,75848,34549,58350,8875221653,675
65 andover
6,47473638,7649,031928895849*8671014710,49410,82811 18511,53811,92112,39712,8031320313,61714,07614,525149381538815̂ 806162481667517*0891745717J78181271845118755190711936519680201072056121020215252206122696232782389224*5022513425,70726,2212678727*3612787828,41629,00829,6263012430,6823123531,76332,27032,777331523353233,849
Note.—Includes Armed Forces overseas beginning 1940. Includes Alaska and Hawaii beginning 1950.All estimates are consistent with decennial census enumerations.Source: Department of Commerce, Bureau of the Census.
337
Digitized for FRASER http://fraser.stlouisfed.org/ Federal Reserve Bank of St. Louis

TABLE B-33.—Civilian population and labor force, 1929-96
[Monthly data seasonally adjusted, except as noted]
Year or month
192919331939
19401941194219431944194519461947
1947194819491950195119521953s
195419551956195719581959
I9605
196119625
19631964196519661967196819691970197119725
1973 s
19741975197619771978s
19791980198119821983198419851986s
1987198819891990s
1991199219931994s
19951996
Civiliannonmsti-tuttonalpopula-
tion1
Civilian labor force
Total
Employment
TotalAgri-cul-tural
Non-agri-
cultural
Un-employ-
ment
Not inlaborforce
Thousands of persons 14 years of age and over
99,84099,90098,64094.64093,220
94,090103,070106,018
49,18051,59055,230
55,64055,91056,41055,54054,630
53,86057,52060,168
47,63038,76045,750
47,52050,35053,75054,47053,960
52,82055,25057,812
10,45010,0909,6109,5409,1009,2509,0808,950
8,5808,3208,256
37,18028,67036,140
37,98041,25044,50045,39045,010
44,24046,93049,557
1,55012,8309,480
8,1205,5602,6601,070
6701,0402,2702,356
44,20043,99042,23039,10038,590
40,23045,55045,850
Thousands of persons 16 years of age and over
101,827103,068103,994
104,995104,621105,231107,056108,321109,683110,954112,265113,727115,329117,245118,771120,153122,416124,485126,513128,058129,874132,028134,335137,085140,216144,126147,096150,120153,153156,150159,033161,910164,863
167,745170,130172,271174,215176,383178,206180,587182,753184,613186,393189,164190,925192,805194,838196,814198,584200,591
59,35060,62161,286
62,20862,01762,13863,01563,64365,02366,55266,92967,63968,369
69,62870,45970,61471,83373,09174,45575,77077,34778,73780,734
82,77184,38287,03489,42991,94993,77596,15899,009
102,251104,962
106,940108,670110,204111,550113,544115,461117,834119,865121,669123,869
125,840126,346128,105129,200131,056132,304133,943
57,03858,34357,65158,91859,96160,25061,17960,10962,17063,79964,07163,03664,630
65,77865,74666,70267,76269,30571,08872,89574,37275,92077,90278,67879,36782,15385,06486,79485,84688,75292,01796,04898,824
99,303100,39799,526
100,834105,005107,150109,597112,440114,968117,342
118,793117,718118,492120,259123,060124,900126,708
7,8907,6297,6587,1606,7266,5006,2606,2056,4506,2835,9475,5865,565
5,4585,2004,9444,6874,5234,3613,9793,8443,8173,6063,4633,3943,4843,4703,5153,4083,3313,2833,3873,347
3,3643,3683,4013,3833,3213,1793,1633,2083,1693,1993,2233,2693,2473,1153,4093,4403,443
49,14850,71449,993
51,75853,23553,74954,91953,90455,72257,51458,12357,45059,065
60,31860,54661,75963,07664,78266,72668,91570,52772,10374,29675,21575,97278,66981,59483,27982,43885,42188,73492,66195,477
95,93897,03096,12597,450
101,685103,971106,434109,232111,800114,142
115,570114,449115,245117,144119,651121,460123,264
2,3112,2763,637
3,2882,0551,8831,8343,5322,8522,7502,8594,6023,740
3,8524,7143,9114,0703,7863,3662,8752,9752,8172,832
4,0935,0164,8824,3655,1567,9297,4066,9916,2026,1377,6378,273
10,67810,7178,5398,3128,2377,4256,7016,528
7,0478,6289,6138,9407,9967,4047,236
42,47742,44742,70842,78742,60443,09344,04144,67844,66044,40245,33646,08846,96047,61748,31249,53950,58351,39452,05852,28852,52753,29153,602
54,31555,83457,09157,66758,17159,37759,99160,02559,65959,900
60,80661,46062,06762,66562,83962,74462,75262,88862,94462,523
63,32464,57864,70065,63865,75866,28066,647
Civil-ian
laborforcepar-tici-
pationrate2
Civil-ianem-ploy-ment/pop-ula-tion
ratio3
Unem-ploy-mentrate,civil-
ianwork-ers4
Percent
55.756.057.258.758.657.255.856.8
58.358.858.959.259.259.058.958.859.360.059.659.559.359.459.358.858.758.758.959.259.659.660.160.460.260.460.861.361.261.662.363.263.763.863.964.064.064.464.865.365.665.966.566.566.266.466.366.666.666.8
47.650.454.557.657.956.153.654.5
56.056.655.456.157.357.357.155.556.757.557.155.456.056.155.455.555.455.756.256.957.357.558.057.456.657.057.857.856.156.857.959.359.959.259.057.857.959.560.160.761.562.363.062.861.761.561.762.562.963.2
3.224.917.214.6
9.94.71.91.21.93.93.9
3.93.85.95.33.33.02.95.54.44.14.36.85.55.56.75.55.75.24.53.83.83.63.54.95.95.64.95.68.57.77.16.15.87.17.69.79.67.57.27.06.25.55.35.66.87.56.96.15.65.4
1 Not seasonally adjusted.2 Civilian labor force as percent of civilian noninstitutiqnal population.3 Civilian employment as percent of civilian noninstitutional population.4 Unemployed as percent of civilian labor force.See next page for continuation of table.
338
Digitized for FRASER http://fraser.stlouisfed.org/ Federal Reserve Bank of St. Louis

TABLE B-33-—Civilian population and labor force, 1929-96—Continued
[Monthly data seasonally adjusted, except as noted]
Year or month
1993:JanFebMarAprMay ... .JuneJulyAugSeptOctNovDec .
1994- Jan 5
FebMarAprMayJuneJulyAugSeptOctNovDec
1995- JanFebMarAprMayJuneJulyAug ..z:r: z.rr: ::SeptOctNovDec ..
1996: Jan _FebMarAprMayJuneJulyAugSeptOctNovDec
Civiliannoninsti-tuttonalpopula-tion1
Civilian labor force
Total
Employment
TotalAgri-cul-tural
Non-agri-
cultural
Un-employ-
ment
Not inlaborforce
Thousands of persons 16 years of age and over
193.962194,108194,248194,398194,549194,719194,882195,063195,259195,444195.625195,794195,953196,090196,213196,363196,510196,693196.859197,043197.248197.430197,607197,765197,753197,886198,007198.148198.286198.453198.615198.801199.005199,192199.355199.508199.634199.772199.921200.101200.278200,459200.641200.847201.060201.273201.463201.636
128,400128,458128,598128,584129.264129,411129,397129,619129,268129,573129,711129,941130,709130.685130,501130,644130,828130.590130,644131.223131,284131,676131.846131,847132.198132,140132,271132,613131,935131,978132,300132.246132.450132,564132,533132,422132.899133.070133,464133,427133.759133.709134,165133.898134.291134,636134,831135,022
119,075119,275119,542119,474120,115120,290120,467120,856120,554120,823121,169121,464121,999122,104122,001122,331122,961122,653122,717123,274123,544124,052124,474124,689124,766124,937125,070125,023124,577124,533124,804124,729124,927125,235125,124125,068125,311125.706126,062126,125126,428126,590126,889126,988127,248127,617127,644127,855
3,2223,1253,1193,0743,1003,1083,1263,0263,1743,0843,1573,1163,3073,3253,3543,4253,4123,2953,3433,4603,4413,4863,5763,5773,5303,5793,6253,5723,3503,4553,3983,3873,3073,4273,3403,3443,4983,4993,4703,4123,4743,4083,4703,4183,4803,4503,3543,426
115,853116,150116,423116,400117,015117,182117,341117,830117,380117,739118,012118,348118,692118,779118,647118,906119,549119,358119,374119,814120,103120,566120,898121,112121,236121,358121,445121,451121,227121,078121,406121,342121,620121,808121,784121,724121,813122,207122,592122,713122,954123,182123,419123,570123,768124,167124,290124,429
9,3259,1839,0569.1109,1499,1218,9308,7638,7148,7508,5428,4778,7108,5818,5008,3137,8677,9377,9277,9497,7407,6247,3727,1587,4327,2037,2017,5907,3587,4457,4967,5177,5237,3297,4097,3547,5887,3647,4027,3027,3317,1197,2766,9107,0437,0197,1877,167
65,56265,65065,65065,81465,28565,30865,48565,44465,99165,87165,91465,85365,24465,40565,71265,71965,68266,10366,21565,82065,96465,75465,76165,91865,55565,74665,73665,53566,35166,47566,31566,55566,55566,62866,82267,08666,73566,70366,45766,67466,51966,75066,47666,94966,77066,63766,63266,614
Civil-ian
laborforcepar-tici-
pationrate2
Civil-ianem-ploy-ment/pop-ula-tion
ratio3
Unem-ploy-mentrate,civil-ian
work-ers4
Percent
66.266.266.266.166.466.566.466.466.266.366.366.466.766.666.566.566.666.466.466.666.666.766.766.766.966.866.866.966.566.566.666.566.666.666.566.466.666.666.866.766.866.766.966.766.866.966.967.0
61.461.461.561.561.761.861.862.061.761.861.962.062.362.362.262.362.662.462.362.662.662.863.063.063.163.163.263.162.862.862.862.762.862.962.862.762.862.963.163.063.163.263.263.263.363.463.463.4
7.37.17.07.17.17.06.96.86.76.86.66.56.76.66.56.46.06.16.16.15.95.85.65.45.65.55.45.75.65.65.75.75.75.55.65.65.75.55.55.55.55.35.45.25.25.25.35.3
sNot strictly comparable with earlier data due to population adjustments as follows: Beginning 1953, introduction of 1950 census dataadded about 600,000 to population and 350.000 to labor force, total employment, and agricultural employment. Beginning 1960, inclusion ofAlaska and Hawaii added about 500,000 to population, 300.000 to labor force, and 240,000 to nonagricultural employment. Beginning 1962,introduction of 1960 census data reduced population by about 50,000 and labor force and employment by 200,000. Beginning 1972, introduc-tion of 1970 census data added about 800,000 to civilian noninstrtutional population and 333,000 to labor force and employment. A subse-quent adjustment based on 1970 census in March 1973 added 60,000 to labor force and to employment. Beginning 1978, changes in sam-pling and estimation procedures introduced into the household survey added about 250,000 to labor force and to employment. Unemploymentlevels and rates were not significantly affected. Beginning 1986, the introduction of revised population controls added about 400,000 to thecivilian population and labor force and 350,000 to civilian employment. Unemployment levels and rates were not significantly affected.
Beginning 1990, the introduction of 1990 census-based population controls, adjusted for the estimated undercount, added about 1.1 mil-lion to the civilian population and labor force, 880.000 to civilian employment, and 175,000 to unemployment. The overall unemployment raterose by about 0.1 percentage point
Beginning 1994, data are not strictly comparable with data for 1993 and prior years because of the introduction of a major redesign ofthe Current Population Survey and collection methodology.
Note.—labor force data in Tables B-33 through B-42 are based on household interviews and relate to the calendar week including the12th of the month. For definitions of terms, area samples used, historical comparability of the data, comparability with other series, etc., see"Employment and Earnings."
Source: Department of Labor. Bureau of Labor Statistics.
339
Digitized for FRASER http://fraser.stlouisfed.org/ Federal Reserve Bank of St. Louis

TABLE B-34.—Civilian employment and unemployment by sex and age, 1948-96
[Thousands of persons 16 years of age and over; monthly data seasonally adjusted]
Year or month
19481949
1950195119521953195419551956195719581959
1960196119621963196419651966196719681969
1970197119721973197419751976197719781979
19801981198219831984198519861987198819891990199119921993199419951996
1995: JanFebMarAprMayJuneJulyAugSeptOctNovDec
1996-. JanFebMarAprMayJuneJulyAugSeptOctNovDec
Civilian employment
Total
58,34357,65158,91859,96160,25061,17960,10962,17063,79964,07163,03664,63065,77865,74666,70267,76269,30571,08872,89574,37275,92077,902
78,67879,36782,15385,06486,79485,84688,75292,01796,04898,824
99,303100,39799,526100,834105,005107,150109,597112,440114,968117,342
118,793117,718118,492120,259123,060124,900126,708
124,766124,937125,070125,023124,577124,533124,804124,729124,927125,235125,124125,068
125,311125,706126,062126,125126,428126,590
126,889126,988127,248127,617127,644127,855
Mates
Total
41,72540,925
41,57841,78041,68242,43041,61942,62143,37943,35742.42343,46643,90443,65644,17744,65745,47446,34046,91947,47948,11448,818
48,99049,39050,89652,34953,02451,85753,13854,72856,47957,607
57,18657,39756,27156,78759,09159,89160,89262,10763,27364,31565,10464,22364,44065,34966,45067,37768,207
67,49867,61767,70267,54467,16867,328
67,29067,13967,32867,42867,24067,290
67,52767,74267,85667,93268.18868,251
68,37668,36868,30468,64768,58968,707
16-19years
2,3442,124
2,1862,1562,1072,1361,9852.0952,1642.1152,0122,1982.3612.3152.3622,4062,5872,9183,2533,1863,2553.430
3.4093.4783,7654.0394,1033.8393.9474.1744.3364,300
4,0853.8153,3793.3003,3223.3283,3233,3813,4923,477
3,4273,0442,9442,9943,1563,2923,310
3,2763,2483,3473.3163.2423,327
3,3123,3083,2973,2453,2923,293
3,2693,3263,2943,3593,4003,318
3,3053,2033,3263,3483,2403,340
20years
over
39.38238,80339.39439.62639.57840,29639,63440.52641.21641,23940,41141.267
41,54341.34241.81542.25142.88643.42243.66844,29444,85945,388
45,58145,91247,13048.31048,92248,01849.19050,55552,14353,308
53,10153,58252,89153,48755,76956,56257,56958,72659,78160,837
61.67861,17861,49662.35563,29464.08564,897
64,22264,36964,35564,22863,92664.001
63.9786383164.03164,18363,94863,997
64,25864,41664.56264,57364,78864,933
65,07165.16564,97865,29965,34965,367
Females
Total
16.61716.723
17,34018.18118.56818,74918.49019,55120,41920,71420.61321,164
21.87422.09022.52523,10523,83124,74825.97626.89327,80729.084
29.68829,97631.25732.71533.76933,98935,61537,28939,56941,217
42.11743,00043,25644,04745.91547,25948.70650.33451.69653.027
53.68953,49654.05254.91056.61057,52358.501
57,26857,32057.36857.47957,40957,20557.51457.59057,59957.80757.88457.778
57.78457,96458,20658.19358.24058.339
58,51358,62058,94458,97059.05559.148
16-19years
1,6821.5881.5171.6111.6121.5841.4901,5471.6541,6631.5701.640
1.7681.7931.8331,8491,9292.1182,4682,4962.5262,687
2,7352,7302.9803,2313,3453.2633,3893,5143.7343,783
3,6253,4113.1703.0433.1223,1053.1493,2603.3133,2823,1542,8622,7242,8113,0053.1273.190
3,1173,0973,1993,1133.1173.167
3.0563.1713.1043,1503.1143.098
3.1003.1193.1523.1183.1733.143
3,1983,1223,3003,2893,3023,277
20yearsandover
14,93615,137
15.82416,57016,95817.16417,00018.00218,76719,05219,04319,524
20,10520,29620,69321,25721,90322.63023,51024.39725,28126,397
26.95227,24628,27629,48430.42430.72632,22633,77535,83637.434
38.49239,59040.08641.00442,79344.15445.55647,07448.38349.74550.53550.63451.32852.09953,60654.39655,311
54,15154,22354,16954,36654,29254,038
54,45854,41954,49554,65754,77054,680
54,68454,84555,05455.07555,06755.196
55.31555.49855.64455.68155.75355.871
Unemployment
Total
2.2763,6373,2882,0551,8831,8343,5322,8522,7502,8594,6023,7403,8524,7143,9114,0703,7863,3662,8752,9752,8172,832
4,0935,0164,8824,3655,1567,9297,4066,9916,2026,137
7,6378,27310,67810,7178,5398,3128,2377,4256.7016,5287,0478,6289,6138,9407,9967,4047,236
7,4327,2037,2017,5907,3587,445
7,4967,5177,5237,3297,4097,354
7,5887,3647,4027,3027,3317,119
7,2766,9107,0437,0197,1877,167
Males
Total
1,5592,572
2,2391,2211,1851,2022,3441,8541,7111,8413,0982,420
2,4862,9972,4232,4722,2051,9141,5511,5081,4191,403
2,2382,7892,6592,2752,7144,4424,0363,6673,1423,1204,2674,5776,1796,2604,7444,5214,5304,1013,6553,5253,9064,9465,5235,0554,3673,9833,880
4,0743,8523,8244,0024,0343,990
3,9684,0734,0353,8564,0324,073
4,0594,0024,0803,9903,9323,859
3,9413,5933,7833,7163,7733,707
16-19years
256353
318191205184310274269300416398
426479408501487479432448426440
599693711653757966939874813811913962
1,0901,003812806779732667658667751806768740744733
691774673726740754
750782761762743767
761730756734724704
790714705742731705
20yearsandover
1,3052,219
1,9221,029980
1,0192,0351,5801,4421,5412,6812,022
2,0602,5182,0161,9711,7181,4351,1201,060993963
1,6382,0971,9481,6241,9573,4763,0982,7942,3282,308
3,3533,6155,0895,2573,9323,7153,7513,3692,9872,867
3,2394,1954,7174,2873,6273,2393,146
3,3833,0783,1513,2763,2943,236
3,2183,2913,2743,0943,2893,306
3,2983,2723,3243,2563,2083,155
3,1512,8793,0782,9743,0423,002
Females
Total
7171,065
1,049834698632
1.188998
1,0391,0181,5041,3201,3661,7171,4881.5981,5811,4521,3241,4681,3971,429
1,8552,2272,2222,0892,4413,4863,3693,3243,0613,018
3,3703,6964,4994,4573,7943,7913,7073,3243,0463,0033,1403,6834,0903,8853,6293,4213,356
3,3583,3513,3773,5883,3243,455
3,5283,4443,4883,4733,3773,281
3,5293,3623,3223,3123,3993,260
3,3353,3173,2603,3033,4143,460
16-19years
153223
195145140123191176209197262256
286349313383385395405391412413
506568598583665802780789769743755800886825687661675616558536544608621597580602573
575572584623606591647587629575613627
619589573570581547
511585555552593603
20yearsandover
564841
854689559510997823832821
1,2421,063
1,0801,3681,1751,2161,1951,056921
1,078985
1,015
1,3491,6581,6251,5071,7772,6842,5882,5352,2922,276
2,6152,8953,6133,6323,1073,1293,0322,7092,4872,467
2,5963,0743,4693,2883,0492,8192,783
2,7832,7792,7932,9652,7182,864
2,8812,8572,8592,8982,7642,654
2,9102,7732,7492,7422,8182,7132,8242,7322,7052,7512,8212,857
Note.—See footnote 5 and Note, Table B-33.Source: Department of Labor, Bureau of Labor Statistics.
340
Digitized for FRASER http://fraser.stlouisfed.org/ Federal Reserve Bank of St. Louis

TABLE B—35.—Civilian employment by demographic characteristic, 1954—96[Thousands of persons 16 years of age and over; monthly data seasonally adjusted]
Year ormonth
19541955195619571958195919601961196219631964196519661967196819691970197119721973197419751976197719781979198019811982198319841985198619871988198919901991199219931994199519961995:Jan
FebMar
fc-JuneJulyAugSeptOctNovDec
1996:JanFebMarAprMayJune
JulyAugSeptOctNovDec
Allcivilianworkers
60,10962,17063,79964,07163,03664,63065,77865,74666,70267,76269,30571,08872,89574,37275,92077,902
78,67879,36782,15385,06486,79485,84688,75292,01796,04898,824
99,303100,39799,526100,834105,005107,150109,597112,440114,968117,342118,793117,718118,492120,259123,060124,900126,708124,766124,937125,070125,023124,577124,533124,804124,729124,927125,235125,124125,068125,311125,706126,062126,125126,428126,590
126,889126,988127,248127,617127,644127,855
White
Total
53,95755,83357,26957,46556,61358,006
58,85058,91359,69860.62261,92263,44665,02166,36167,75069,51870,21770,87873,37075,70877,18476,41178,85381,70084,93687,25987,71588,70987,90388,89392,12093,73695,66097,78999,812101,584102,261101.182101,669103,045105,190106,490107,808
106,438106,497106,531106,509106,123106,271
106.609106.510106,648106,724106,503106,525106.631107,192107,398107,364107,576107,733
107,862107,853108.217108.527108,570108,734
Males
37,84638,71939,36839,34938,59139,494
39,75539,58840,01640,42841,11541,84442,33142,83343,41144,04844.17844,59545,94447,08547,67446,69747,77549,15050,54451.45251.12751,31550,28750.62152,46253.04653.78554.64755,55056,35256.70355.79755,95956,65657,45258,14658,88858,22258,27858,29758,17757.88358,11858.14958,03758,15958,21258,07758,19558,35658,60958,63358,70458.84858,922
58,98758,90858.97059.23459,18359,299
Fe-males
16,11117,11417,90118,11618,02218,512
19,09519,32519,68220,19420,80721,60222,69023,52824,33925,47026,03926,28327,42628,62329,51129.71431,07832,55034,39235.80736.58737.39437,61538.27239,65940,69041,87643,14244.26245,23245,55845,38545,71046,39047,73848,34448,92048.21648,21948,23448,33248,24048,15348,46048,47348,48948,51248,42648,33048,27548.58348,76548,66048,72848,811
48,87548,94549.24749,29349,38749,435
Bothsexes16-19
3,0783,2253,3893,3743,2163,475
3,7003,6933,7743,8514,0764,5625,1765,1145,1955,5085,5715,6706,1736,6236,7966,4876,7247,0687,3677,3567,0216,5885,9845,7995,8365,7685,7925,8986,0305,9465,7795,2164,9855,1135,3985,5935,667
5,6675,5265,6855,6375,5755,7285,5955,6295,5205,5385,5085,5305,5605,6265,5875,6155,7055,666
5,6805,4785,7815,7945,7645,764
Black and other
Total
6,1526,3416,5346,6046,4236,6236,9286,8337,0037,1407,3837,6437,8778,0118,1698,3848,4648,4888,7839,3569,6109,4359,89910,31711,11211,56511,58811,68811,62411,94112,88513,41413,93714,65215,15615,75716,53316,53616,82317,21417,87018,40918,90018,24218,45018,48018,47418,44818,28918,22218,26418.29818,51418,66418,56718,58318,49118,63518,72818,85718,85619,03419,17619,06119,09319,13719,132
Males
3,7733,9044,0134,0063,8333,9714,1494,0684,1604,2294,3594,4964,5884,6464,7024,7704,8134,7964,9525,2655,3525,1615,3635,5795,9366,1566,0596,0835,9836,1666,6296,8457,1077,4597,7227,9638,4018,4268,4828,6938,9989,2319,3199,2619,3519,3569,3559,2539,2049,1499,1459,2129,2149,1799,1079,1449,1259,1999,2199,3199,304
9,3849,5049,3819,4129,4379,397
Fe-males
2,3792,4372,5212,5982,5902,652
2,7792,7652,8432,9113,0243,1473,2893,3653,4673,6143,6503,6923,8324,0924,2584,2754,5364,7395,1775,4095,5295,6065,6415,7756,2566,5696,8307,1927,4347,7958,1318,1108,3428,5218,8729,1799,5808,9819,0999,1249,1199,1959,0859,0739,1199,0869,3009,4859,4609,4399,3669,4369,5099,5389,552
9,6509,6729,6809,6819,7009,735
Bothsexes16-19
396418430407365362430414420404440474545568584609574538573647652615611619703727689637565543607666681742774813801690684691763826832744804827792793808808827873859911855830785840863881810837814839849804831
Black
Total
7,8028,1288,2037,8948,2278,5409,1029,3599,3139,3559,1899,37510,11910,50110,81411,30911,65811,95312,17512,07412,15112,38212,83513,27913,542
13,12913,32813,35113,31713,30013,18613,08613,11413,17413,38013,57613,31413,38813,32613,40113,43213,58413,478
13,61213,69913,56613,64713,67313,693
Males
4,3684,5274,5274,2754,4044,5654,7964,9234,7984,7944,6374,7535,1245,2705,4285,6615,8245,9285,9955,9615,9306,0476,2416,4226,4566,4216,5196,5516,4976,4196,4036,3366,3216,3976,4396,4326,3416,3826,3656,3806,3986,4876,403
6,4906,5946,4566,5026,5186,502
Fe-males
3,4333,6013,6773,6183,8233,9754,3074,4364,5154,5614,5524,6224,9955,2315,3865,6485,8346,0256,1806,1136,2216,3346,5956,8577,0866,7086,8096,8006,8206,8816,7836,7506,7936,7776,9417,1447,0727,0066,9617,0217,0347,0977,0757,1227,1057,1107,1457,1557,191
Bothsexes16-19
509570554507508508571579547505428416474532536587601625598494492494552586613521565580569563575570567613611682614600584632645683599603596604626576607
Note.—See footnote 5 and Note, Table B-33.Source: Department of Labor, Bureau of Labor Statistics.
341
Digitized for FRASER http://fraser.stlouisfed.org/ Federal Reserve Bank of St. Louis
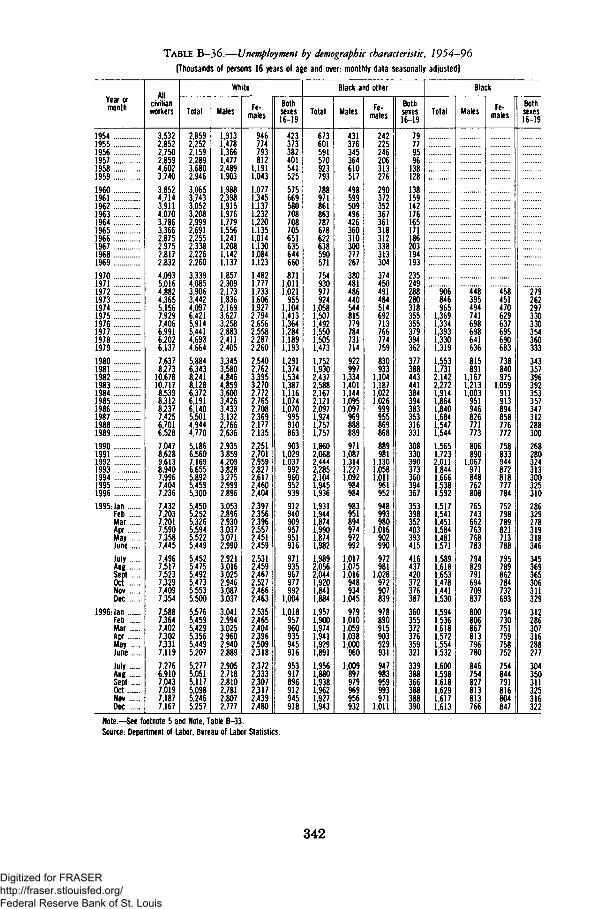
TABLE B—36.—Unemployment by demographic characteristic, 1954—96
[Thousands of persons 16 years of age and over; monthly data seasonally adjusted]
Year ormonth
19541955195619571958195919601961196219631964196519661967196819691970197119721973197419751976197719781979198019811982198319841985198619871988 . ..198919901991199219931994199519961995:Jan
FebMar
fc-June
JulyAugSeptOctNovDec
1996:JanFebMarAprMayJune
JulyAugSeptOctNovDec
Allcivilianworkers
3,5322,8522,7502,8594,6023,7403,8524,7143,9114,0703,7863,3662,8752,9752,8172,8324,0935,0164,8824,3655,1567,9297,4066,9916,2026,1377,6378,27310,67810,7178,5398,3128,2377,4256,7016,5287,0478,6289,6138,9407,9967,4047,2367,4327,2037,2017,5907,3587,4457,4967,5177,5237,3297,4097,354
7,5887,3647,4027,3027,3317,1197,2766,9107,0437,0197,1877,167
White
Total
2,8592,2522,1592,2893,6802,9463,0653,7433,0523,2082,9992,6912,2552,3382,2262,2603,3394,0853,9063,4424,0976,4215,9145,4414,6934,6645,8846,3438,2418,1286,3726,1916,1405,5014,9444,7705,1866,5607,1696,6555,8925,4595,3005,4505,2525,3265,5945,5225,4495,4525,4755,4925,4735,5535,5005,5765,4595,4295,3565,4495,2075,2775,0515,1175,0985,2465,257
Males
1,9131,4781,3661,4772,4891,9031,9882,3981,9151,9761,7791,5561,2411,2081,1421,1371,8572,3092,1731,8362,1693,6273,2582,8832,4112,4053,3453,5804,8464,8593,6003,4263,4333,1322,7662,6362,9353,8594,2093,8283,2752,9992,8963,0532,8962,9303,0373.0712,9902,9213,0163,0252,9463,0873,0373,0412,9943,0252,9602,9402,8892,9052,7182,8102,7812,8072,777
Fe-males
946774793812
1,1911,0431,0771,3451,1371,2321,2201,1351,0141,1301,0841,1231,4821,7771,7331,6061,9272,7942,6562,5582,2872,2602,5402,7623,3953,2702,7722,7652,7082,3692,1772,1352,2512.7012.9592,8272,6172,4602,4042,3972,3562,3962,5572,4512,4592,5312,4592,4672,5272,4662,4632,5352,4652,4042,3962,5092,3182,3722,3332,3072,3172,4392,480
Bothsexes16-19
423373382401541525575669580708708705651635644660871
1,0111,021955
1,1041,4131,3641,2841,1891,1931,2911,3741,5341,3871,1161,0741,070995910863903
1,0291,037992960952939912940909957951916971935967977992
1,0041,018957960935945916953917896912945918
Black and other
Total
673601591570923793788971861863787678622638590571754930977924
1,0581,5071,4921,5501,5051,4731,7521,9302.4372,5882,1672,1212,0971,9241,7571,7571,8602,0682.4442,2852,1041,9451,9361,9311,9441,8741,9901,8741,9821,9892,0562,0441,9201,8411,8841,9571,9001,9741,9411,9291,8911,9561,8801,9381,9621,9271,943
Males
431376345364610517498599509496426360310300277267380481486440544815779784731714922997
1,3341,4011,1441,0951,097969888889971
1,0871,3141,2271,092984984983951894974972992
1,0171,0751,016948934
1,045979
1,0101.0591,0381,000960
1,009897979969956932
Fe-males
242225246206313276290372352367361318312338313304374450491484514692713766774759830933
1,1041,1871,0221,026999955869868889981
1,1301,0581,011961952948993980
1,016902990972981
1,028972907839978890915903929931947983959993971
1,011
Bothsexes16-19
79779596138128138159142176165171186203194193235249288280318355355379394362377388443441384394383353316331308330390373360394367353398352403393415416437420372376387360355372376359321339388366388388390
Black
Total
906846965
1,3691,3341,3931,3301,3191,5531,7312,1422,2721,9141,8641,8401,6841,5471,5441,5651,7232,0111,8441,6661,5381,5921,5171,5411,4511,5841,4811,5711,5891,6181,6531,4781,4411,5301,5941,5361,6181,5721,5541,5321,6001,5981,6181,6291,6171,613
Males
448395494741698698641636815891
1,1671,2131,003951946826771773806890
1,067971848762808765743662763768783794829791694709837800806867813796780846754827813813766
Fe-males
458451470629637695690683738840975
1,059911913894858776772758833944872818777784752798789821713788795789862784732693794730751759758752754844791816804847
Bothsexes16-19
279262297330330354360333343357396392353357347312288300268280324313300325310286329278319318346345369365306311329312286307316288277304350311325316322
Note.—See footnote 5 and Note, Table B-33.Source: Department of Labor, Bureau of Labor Statistics.
342
Digitized for FRASER http://fraser.stlouisfed.org/ Federal Reserve Bank of St. Louis

TABLE B-37.—Civilian labor force participation rate and employment I population ratio, 1948-96
[Percent-1 monthly data seasonally adjusted]
Year or month
194819491950195119521953195419551956195719581959196019611962196319641965196619671968 ,19691970 .19711972197319741975197619771978197919801981198219831984 .. .1985198619871988198919901991199219931994199519961995- Jan
FebMarAprMayJuneJulyAugSeptOct . ;.""'"NovDec
1996- JanFebMarAprMayJune " ::: ::...July . .AugSeptOctNovDec
Labor force participation rate
Allcivilianwork-ers
58.858.959.259.259.058.958.859.360.059.659.559.359.459.358.858.758.758.959.259.659.660.160.460.260.460.861.361.261.662.363.263.763.863.964.064.064.464.865.365.665.966.566.566.266.466.366.666.666.866.966.866.866.966.566.566.666.566.666.666.566.466.666.666.866.766.866.766.966.766.866.966.967.0
Mates
86.686.486.486.386.386.085.585.485.584.884.283.783.382.982.081.481.080.780.480.480.179.879.779.178.978.878.777.977.577.777.977.877.477.076.676.476.476.376.376.276.276.476.475.875.875.475.175.074.975.575.475.475.374.975.074.974.774.874.674.674.674.874.975.075.075.175.075.274.774.774.974.974.9
Fe-males
32.733.133.934.634.734.434.635.736.936.937.137.137.738.137.938.338.739.340.341.141.642.743.343.443.944.745.746.347.348.450.050.951.552.152.652.953.654.555.356.056.657.457.557.457.857.958.858.959.358.958.958.959.258.858.759.059.059.059.159.058.859.059.059.159.159.159.059.259.359.559.559.659.7
Bothsexes16-19years
52.552.251.852.251.350.248.348.950.949.647.446.747.546.946.145.244.545.748.248.448.349.449.949.751.953.754.854.054.556.057.857.956.755.454.153.553.954.554.754.755.355.953.751.651.351.552.753.552.353.753.854.454.153.354.153.453.953.252.752.652.952.752.752.752.653.151.852.250.752.252.452.052.3
White
58.258.759.459.158.958.758.858.858.358.258.258.458.759.259.359.960.260.160.460.861.461.561.862.563.363.964.164.364.364.364.665.065.565.866.266.766.966.666.866.867.167.167.267.367.167.267.367.067.067.167.067.167.166.966.966.967.267.267.167.267.167.267.067.267.367.467.4
Blackand
other
64.064.264.964.464.864.364.564.163.263.063.162.963.062.862.262.161.860.960.260.560.359.659.860.462.262.261.761.361.662.162.663.363.764.364.064.764.463.864.663.863.964.364.664.364.964.664.964.464.163.864.064.064.164.364.064.363.764.364.364.664.465.065.164.864.864.764.7
Black
"59.960.259.858.859.059.861.561.461.060.861.061.562.262.963.363.863.864.264.063.363.963.263.463.764.163.464.364.064.363.763.663.163.363.663.664.263.864.063.464.063.864.363.764.464.764.164.464.364.3
Employment/population ratio
Allcivilianwork-ers
56.655.456.157.357.357.155.556.757.557.155.456.056.155.455.555.455.756.256.957.357.558.057.456.657.057.857.856.156.857.959.359.959.259.057.857.959.560.160.761.562.363.062.861.761.561.762.562.963.263.163.163.263.162.862.862.862.762.862.962.862.762.862.963.163.063.163.263.263.263.363.463.463.4
Males
83.581.382.084.083.983.681.081.882.381.378.579.378.977.677.777.177.377.577.978.077.877.676.274.975.075.574.971.772.072.873.873.872.071.369.068.870.770.971.071.572.072.572.070.469.870.070.470.870.971.271.371.471.170.770.870.770.570.670.670.370.370.670.770.870.871.071.071.171.070.871.171.071.0
Fe-males
31.331.232.033.133.433.332.534.035.135.134.535.035.535.435.635.836.337.138.339.039.640.740.840.441.042.042.642.043.244.546.447.547.748.047.748.049.550.451.452.553.454.354.353.753.854.155.355.656.055.655.655.655.755.655.455.655.655.655.755.855.655.655.755.955.955.955.956.056.156.356.356.356.4
Bothsexes16-19years
47.745.245.547.946.946.442.343.545.343.939.939.940.539.139.437.437.338.942.142.242.243.442.341.343.545.946.043.344.246.148.348.546.644.641.541.543.744.444.645.546.847.545.342.041.041.743.444.243.544.844.445.644.744.044.843.844.543.743.643.443.543.343.843.743.744.343.443.542.043.943.843.343.7
White
"55i256.557.356.855.355.955.955.355.455.355.556.056.857.257.458.057.556.857.458.258.356.757.558.660.060.660.060.058.858.960.561.061.562.363.163.863.762.662.462.763.563.864.164.064.064.063.963.763.763.963.863.863.863.663.663.663.964.063.964.064.064.164.064.264.364.364.3
Blackand
other
"M!O58.759.559.356.757.557.956.256.356.257.057.858.458.258.058.156.854.954.155.054.351.452.052.554.755.253.652.650.951.053.654.755.456.857.458.257.956.756.456.357.258.158.658.158.758.758.658.457.857.557.557.558.158.558.158.157.858.158.358.658.558.959.358.858.858.858.7
Black
•• ••'•
'"53754.553.550.150.851.453.653.852.351.349.449.552.353.454.155.656.356.956.755.454.955.056.157.157.456.957.757.757.557.356.856.356.356.557.358.057.357.256.857.157.157.757.257.757.957.357.557.557.5
1 Civilian labor force or civilian employment as percent of civilian noninstitutional population in group specified.Note.—Data relate to persons 16 years of age and over.See footnote 5 and Note, Table &-33.Source: Department of Labor, Bureau of Labor Statistics.
343
Digitized for FRASER http://fraser.stlouisfed.org/ Federal Reserve Bank of St. Louis

TABLE B—38.—Civilian labor force participation rate by demographic characteristic, 1954—96
[Percent;1 monthly data seasonally adjusted]
Year or month
1954195519561957195819591960196119621963196419651966196719681969197019711972
19721973197419751976197719781979198019811982198319841985198619871988198919901991199219931994199519961995=Jan
FebMar
f,-JuneJulyAugSeptOctNovDec
1996:JanFebMarAprMayJuneJulyAugSeptOctNovDec
Allcivil-ian
work-ers
58.859.360.059.659.559.359.459.358.858.758.758.959.259.659.660.160.460.260.4
60.460.861.361.261.662.363.263.763.863.964.064.064.464.865.365.665.966.566.566.266.466.366.666.666.866.966.866.866.966.566.566.666.566.666.666.566.466.666.666.866.766.866.766.966.766.866.966.967.0
White
Total
58.258.759.459.158.958.758.858.858.358.258.258.458.759.259.359.960.260.160.4
60.460.861.461.561.862.563.363.964.164.364.364.364.665.065.565.866.266.766.966.666.866.867.167.167.267.367.167.267.367.067.067.167.067.167.166.966.966.967.267.267.167.267.167.267.067.267.367.467.4
Males
Total
85.685.485.684.884.383.883.483.082.181.581.180.880.680.680.480.280.079.679.6
79.679,479.478.778.478.578.678.678.277.977.477.177.177.076.976.876.977.177.176.576.576.275.975.775.876.276.076.076.075.675.775.675.675.675.575.575.575.775.975.975.875.975.975.975.575.775.975.875.8
16-19years
57.658.660.459.256.555.955.954.553.853.152.754.155.956.355.956.857.557.960.1
60.162.062.961.962.364.065.064.863.762.460.059.459.059.759.359.060.061.059.657.356.956.657.758.557.158.758.559.259.258.459.458.958.758.158.057.758.058.358.257.558.058.757.157.254.056.557.056.356.3
20yearsandover
87.887.587.686.986.686.386.085.784.984.484.283.983.683.583.283.082.882.382.0
82.081.681.480.780.380.280.180.179.879.579.278.978.778.578.578.478.378.578.578.078.077.777.377.177.377.577.477.477.376.977.076.976.977.076.976.976.977.077.377.477.377.377.477.477.377.277.477.377.4
Females
Total
33.334.535.735.735.836.036.536.936.737.237.538.139.240.140.741.842.642.643.2
43.244.145.245.946.948.049.450.551.251.952.452.753.354.155.055.756.457.257.457.457.758.058.959.059.158.958.858.959.158.958.859.259.159.059.158.958.758.759.059.158.959.158.959.059.059.359.359.559.6
16-19years
40.640.743.142.240.139.640.340.639.838.737.839.242.642.543.044.645.645.448.1
48.150.151.751.552.854.556.757.456.255.455.054.555.455.256.356.557.257.156.354.152.553.555.155.554.757.355.356.656.355.756.655.455.454.454.754.654.554.954.754.553.654.254.354.753.655.555.255.754.9
20yearsandover
32.734.035.135.235.535.636.236.636.537.037.538.038.839.840.441.542.242.342.7
42.743.544.445.346.247.348.749.850.651.552.252.553.154.054.955.656.357.257.657.658.158.359.259.259.459.059.159.059.359.158.959.459.359.459.459.259.059.059.359.459.359.459.259.359.459.559.659.859.9
Black and other or black
Total
Males
Total 16-19years
20yearsandover
Females
Total 16-19years
20yearsandover
Black and other
64.064.264.964.464.864.364.564.163.263.063.162.963.062.862.262.161.860.960.2
85.285.185.184.284.183.483.082.280.880.280179.679.078.577.776.976.574.973.9
61.260.861.558.857.355.557.655.853.551.549.951.351.451.149.749.647.444.746.0
87.187.887.887.087.186.786.285.584.283.984.183.783.382.982.281.481.480.078.6
46.146.147.347.148.047.748.248.348.048.148.648.649.449.549.349.849.549.248.8
31.032.736.333.231.928.232.932.833.132.631.729.533.535.234.834.634.131.232.3
47.747.548.448.649.849.849.950.149.649.950.751.151.651.651.452.051.851.851.2
Black
59.960.259.858.859.059.861.561.461.060.861.061.562.262.963.363.863.864.264.063.363.963.263.463.764.163.464.364.064.363.763.663.163.363.663.664.263.864.063.464.063.864.363.764.464.764.164.464.364.3
73.673.472.970.970.070.671.571.370.370.070.170.670.870.871.271.171.071.071.070.470.769.669.169.068.769.570.269.670.069.269.168.568.668.868.268.168.468.568.368.968.569.068.069.369.368.668.868.868.1
46.345.746.742.641.343.244.943.643.241.639.839.941.744.643.743.643.844.640.737.340.639.540.840.139.538.042.736.639.838.740.940.641.441.038.641.740.438.837.641.342.542.636.942.140.037.540.137.137.1
78.578.477.676.075.475.676.276.375.174.574.775.274.874.474.874.774.674.475.074.674.373.272.572.572.373.373.473.673.673.072.571.871.872.271.871.671.872.172.072.371.672.371.872.773.072.672.472.772.0
48.749.349.048.849.850.853.153.153.153.553.754.255.256.556.958.058.058.758.357.558.557.958.759.560.458.559.659.459.759.359.058.859.059.359.961.060.160.359.459.960.060.460.160.460.960.460.860.761.2
32.234.233.434.232.932.937.336.834.934.033.533.035.037.939.139.637.940.436.833.535.234.636.339.838.934.237.139.638.938.340.039.940.843.740.842.341.040.237.639.740.040.437.735.039.238.639.137.940.6
51.251.651.451.152.553.655.555.455.656.056.256.857.658.658.960.060.160.660.660.060.860.260.961.462.660.961.861.361.861.460.960.660.860.961.862.962.062.361.662.062.062.462.463.063.162.763.063.063.3
1 Civilian labor force as percent of civilian noninstitutional population in group specified.Note.—See Note, Table B-37.Source: Department of Labor, Bureau of Labor Statistics.
344
Digitized for FRASER http://fraser.stlouisfed.org/ Federal Reserve Bank of St. Louis

TABLE B—39-—Civilian employment/population ratio by demographic characteristic, 1954—96
[Percent;1 monthly data seasonally adjusted]
Year or month
1954195519561957195819591960196119621963196419651966196719681969197019711972
19721973197419751976197719781979198019811982198319841985198619871988198919901991199219931994199519961995:Jan
FebMarAprMayJuneJulyAugSeptOctNovDec
1996JanFebMar
&::::JuneJulyAugSeptOctNovDec
Allcivil-
ianwork-
ers
55.556.757.557.155.456.056.155.455.555.455.756.256.957.357.558.057.456.657.0
57.057.857.856.156.857.959.359.959.259.057.857.959.560.160.761.562.363.062.861.761.561.762.562.963.263.163.163.263.162.862.862.862.762.862.962.862.762.862.963.163.063.163.263.263.263.363.463.463.4
White
Total
55.256.557.356.855.355.955.955.355.455.355.556.056.857.257.458.057.556.857.4
57.458.258356.757.558.660.060.660.060.058.858.960.561.061.562.363.163.863.762.662.462.763.563.864.164.064.064.063.963.763.763.963.863.863.863.663.663.663.964.063.964.064.064.164.064.264.364.364.3
Males
Total
81.582.282.781.879.279.979.478.278.477.777.877.978.378.478.378.276.875.776.0
76.076.575973.073.474.175.075.173.472.870.670.472.172.372.372.773.273.773.371.671.171.471.872.072.372.472.472.472.271.872.072.071.871.971.971.771.871.972.272.272.272.372.472.472.272.272.572.372.4
16-19years
49.952.054.152.447.648.148.145.946.444.745.047.150.150.250.351.149.649.251.5
51.554.354450.651.554.456.355.753.451.347.047.449.149.949.649.951.752.651.047.246.446.648.349.448.249.949.250.450.149.550.350.349.548.848.348.348.748.849.248.349.149.748.648.045.648.148.247.548.0
20yearsandover
84.084.785.084.181.882.882.481.481.581.181.381.581.781.781.681.480.179.079.0
79.079.278675.776.076.577.277.375.675.173.072.674.374.374.374.775.175.475.173.573.173.373.673.874.274.174.274.173.973.573.773.773.673.773.873.573.673.774.074.174.074.174.374.374.474.274.474.374.4
Females
Total
31.433.034.234.233.634.034.634.534.735.035.536.237.538.338.940.140.339.940.7
40.741.842442.043.244.546.347.547.848.348.148.549.850.751.752.853.854.654.754.254.254.655.856.156.356.156.156.156.256.055.956.256.256.256.256.055.955.856.156.356.156.256.256.356.356.656.656.756.7
16-19years
36.437.038.938.235.034.835.134.634.832.932.233.737.537.737.839.539.538.641.3
41.343.644342.544.245.948.549.447.946.244.644.547.047.147.949.050.250.548.345.944.245.747.548.147.650.048.049.448.648.149.747.248.447.047.646.846.646.947.347.246.647.247.347.946.648.948.848.748.0
20yearsandover
31.132.733.833.933.534.034.534.534.735.235.836.537.538.339.140.140.440.140.6
40.641.642241.943.144.446.147.347.848.548.448.950.051.052.053.154.054.955.254.854.955.256.456.757.056.556.656.556.756.656.356.956.756.856.856.756.556.456.756.956.856.856.956.957.057.257.257.357.3
Black and other or black
Total
Males
Total 16-19years
20yearsandover
Females
Total 16-19years
20yearsandover
Black and other
58.058.759.559.356.757.557.956.256.356.257.057.858.458.258.058.156.854.954.1
76.577.678.477.272.573.874.171.772.071.872.973.774.073.873.372.870.968.167.3
52.452.752.248.042.041.443.841.041.737.437.839.440.538.838.739.035.531.832.4
79.280.481.380.576.077.677.975.575.776.277.778.779.279.478.978.476.874.273.2
41.942.243.043.742.843.243.642.642.742.743.444.145.145.045.245.944.943.943.3
24.726.428.026.522.820.324.823.223.121.321.820.223.124.824.725.122.420.219.9
43.743.944.745.545.045.745.844.844.945.246.147.348.247.948.248.948.247.346.7
Black
53.754.553550.150.851.453.653.852.351.349.449.552.353.454.155.656.356.956.755.454.955.056.157.157.456.957.757.757.557.356.856.356.356.557.358.057.357.256.857.157.157.757.257.757.957.357.557.557.5
66.867.565860.660.661.463.363.460.459.156.056.359.260.060.662.062.762.862.661.359.960.060.861.761.162.163.063.262.661.861.660.960.661.261.561.460.460.860.660.760.761.560.661.462.260.861.161.261.0
31.632.831426.325.826.428.528.727.024.620.320.423.926.326.528.529.430.427.723.823.623.625.425.224.925.025.624.925.323.025.124.623.626.225.228.424.724.025.426.327.729.823.424.024.723.525.521.822.8
73.073.771966.566.867.569.169.165.864.561.461.664.164.665.166.467.167.067.165.964.364.365.066.165.566.567.467.867.166.666.065.265.165.566.065.664.865.364.964.864.865.465.265.966.965.665.666.065.7
43.043.843.541.642.843.345.846.045.745.144.244.146.748.148.850.351.252.051.950.650.850.952.353.454.452.653.353.253.353.752.952.652.852.653.855.354.754.253.754.154.254.654.454.654.454.454.654.654.8
19.222.020.920.219.218.522.122.421.019.717.717.020.123.123.825.825.827.125.821.522.121.624.526.127.121.624.826.625.226.225.525.526.126.927.729.228.327.925.128.127.728.627.627.125.226.726.726.528.0
46.547.246.944.946.447.049.349.349.148.547.547.449.850.951.653.053.954.654.753.653.653.855.056.157.155.656.155.856.156.455.655.355.555.256.457.957.356.856.656.756.857.257.157.457.457.257.457.457.5
1 Civilian employment as percent of civilian nonmstitutional population in group specified.Note.—Data relate to persons 16 years of age and over.See footnote 5 and Note, Table B-33.Source: Department of Labor, Bureau of Labor Statistics.
345
Digitized for FRASER http://fraser.stlouisfed.org/ Federal Reserve Bank of St. Louis

TABLE B^40.—Civilian unemployment rate, 1948-96
[Percent,-1 monthly data seasonally adjusted]
Year or month
19481949195019511952 .. .195319541955195619571958195919601961196219631964196519661967196819691970197119721973197419751976197719781979198019811982198319841985198619871988198919901991199219931994 .199519961995Jan
FebMar
MPayZ"JuneJulyAugSeptOctNovDec
1996JanFebMar
&:::June
JulyAugSeptOctNovDec
Allcivilianwork-
ers
3.85.95.333302.95.54.44 14.36.855556.75.5575.24 53.83.83.63.54.95.95.64 95.68.57.77.16.1587.17.69.79.67.57.27.06.25.55.35.66.87 56.9615.65.45.65.55.45.75.65.65.75.75.75.55.65.65.75.55.55.55.55.35.45.25.25.25.35.3
Total
3.65.95.128282.85.34.2384.16.852546.45.2524.6403.23.12.92.84.45.35.04 24.97.97.16.35.3516.97.49.99.97.47.06.96.25.55.25.77.27 97.26 25.65.45.75.45.35.65.75.65.65.75.75.45.75.75.7565.75.55.55.45.45.05.25.15.25.1
Males
16-19
years
9.814.312.781897.9
13.511.611 112.417.115315317.114.717215.814111712.311.611.415.016.615.913915.620.119.217.315.815918.320.124.423.319.619.519.017.816.015.916.319.821520.419018.418.117.419.216.718.018.618.518.519.118.819.018.418.918.918.018.717.917.617.519.318.217.518.118.417.4
20yearsandover
3.25.44.7252 42.54.93.8343.66.24 74 75.74.64 53.93 22.52.32.22.13.54.44.0333.86.85.95.24.34 25.96.38.88.96.66.26.15.44.84.55.06.4716.4544.84.65.04.64.74.94.94.84.84.94.94.64.94.94.94.84.94.84.74.64.64.24.54.44.44.4
Total
4.16.05.74 4363.36.04.9484.76.859597.26.2656.2554.85.24.84.75.96.96.6606.79.38.68.27.2687.47.99.49.27.67.47.16.25.65.45.56.4706.6605.65.45.55.55.65.95.55.75.85.65.75.75.55.45.85.55.45.45.55.35.45.45.25.35.55.5
Females
16-19
years
8.312.311.483807.2
11.410.211 210.614.313513916.314.617216.615714.113.514.013.315.617.216.715316.619.718.718.317.116417.219.021.921.318.017.617.615.914.414.014.717.518617.516216.115.215.615.615.416.716.315.717.515.616.815.416.416.816.615.915.415.515.514.813.815.814.414.415.215.5
20yearsandover
3.65.35.140322.95.54.44 24.16.152516.35.4545.2453.84.23.83.74.85.75.44 95.58.07.47.06.0576.46.88.38.16.86.66.25.44.94.74.95.7635.9544.94.84.94.94.95.24.85.05.05.05.05.04.84.65.14.84.84.74.94.74.94.74.64.74.84.9
Bothsexes16-19years
9.213.412.282857.6
12.611.011 111.615.914614716.814.717.216.214812.812.912.712.215.316.916.214516.019.919.017.816.416117.819.623.222.418.918.618.316.915.315.015.518.720119.017617.316.716.517.516.117.317.517.218.017.417.817.317.517.917.817.017.116.816.616.216.717.016.016.316.816.5
White
3.55.64.9312.82.75.03.9363.86.148506.04.95.04.64 13.43.43.23.14.55.45.1435.07.87.06.25.2516.36.78.68.46.56.26.05.34.74.54.86.1666.1534.94.74.94.74.85.04.94.94.94.94.94.95.04.95.04.84.84.84.84.64.74.54.54.54.64.6
Blackand
other
5.98.99.053544.59.98.7837.9
12.610710212.410.91089.681737.46.76.48.29.9
10.0909.9
13.813.113.111.911313.114.217.317.814.413.713.111.610.410.010.111.112711.7105
9,69.39.69.59.29.79.29.89.8
10.110.09.49.09.29.59.39.69.49.39.19.38.99.29.39.19.2
Black
..........
9 410.514.814.014.012.812314.315.618.919.515.915.114.513.011.711.411.412.514213.011 510.410.510.410.49.8
10.610.010.610.811.011.19.99.6
10.210.610.310.810.510.310.210.510.410.710.710.610.5
Experi-encedwageand
salaryworkers
4.36.86.037343.26.24.84 44.67.357576.85.6565.04 33.53.63.43.34.85.75.34 55.38.27.36.65.6556.97.39.39.27.16.86.65.85.25.05.36.67 26.6595.45.25.45.25.25.55.55.45.55.55.55.45.45.45.45.35.45.35.45.15.25.05.15.05.25.1
Marriedmen,
spousepresent2
154.615141.74.02.6232.85.136374.63.6342.82 4191.81.61.52.63.22.8232.75.14.23.62.8284.24.36.56.54.64.34.43.93.33.03.44.4514.4373.33.03.33.23.23.33.43.43.43.33.43.13.23.23.23.13.13.03.03.03.02.93.03.03.03.0
Womenwho
main-tain
families
4.94.44.45.47.37.2717.0
10.010.19.48.5839.2
10.411.712.210.310.49.89.28.18.18.39.3
1009.7898.08.28.98.47.99.28.08.58.07.08.07.97.76.88.27.67.77.38.57.88.88.58.38.58.88.4
1 Unemployed as percent of civilian labor force in group specified.'Data for 1949 and 1951-54 are for April; 1950, for March.Note.—Data relate to persons 16 years of age and over.See footnote 5 and Note, Table B-33.Source: Department of Labor, Bureau of Labor Statistics.
346
Digitized for FRASER http://fraser.stlouisfed.org/ Federal Reserve Bank of St. Louis
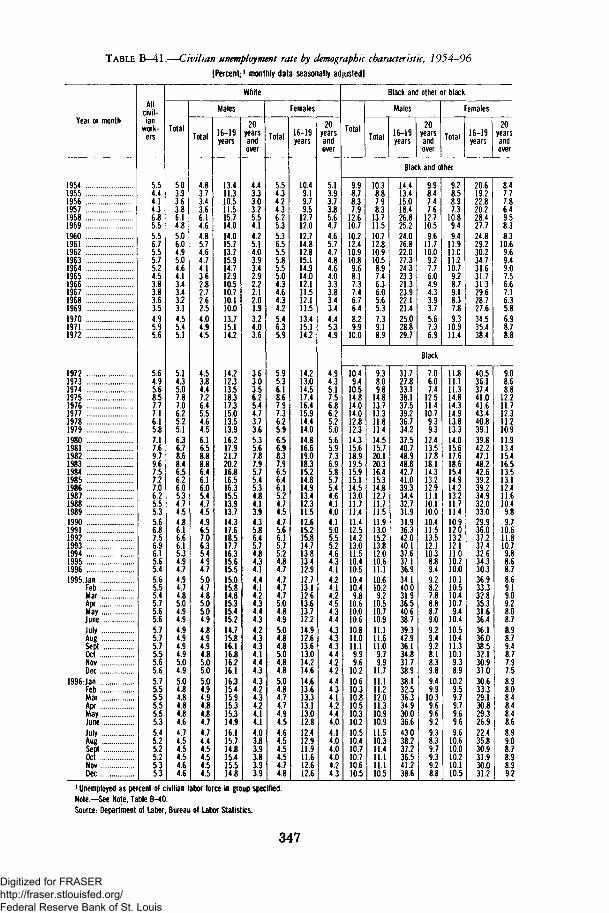
TABLE B-41.—Civilian unemployment rate by demographic characteristic, 1954-96[Percent;1 monthly data seasonally adjusted]
Year or month
1954195519561957195819591960196119621963196419651966196719681969197019711972
1972197319741975197619771978197919801981 ..198219831984198519861987198819891990199119921993 . . . .1994199519961995-Jan
FebMarAprMayJuneJulyAugSeptOctNovDec
1996:JanFebMarAprMayJuneJulyAugSeptOctNovDec
Allcivil-ian
work-ers
5.54.44.14.36.85.55.56.75.55.75.24.53.83.83.63.54.95.95.6
5.64.95.68.57.77.16.15.87.17.69.79.67.57.27.06.25.55.35.66.87.56.96.15.65.45.65.55.45.75.65.65.75.75.75.55.65.65.75.55.55.55.55.35.45.25.25.25.35.3
White
Total
5.03.93.63.86.14.85.06.04.95.04.64.13.43.43.23.14.55.45.1
5.14.35.07.87.06.25.25.16.36.78.68.46.56.26.05.34.74.54.86.16.66.15.34.94.74.94.74.85.04.94.94.94.94.94.95.04.95.04.84.84.84.84.64.74.54.54.54.64.6
Males
Total
4.83.73.43.66.14.64.85.74.64.74.13.62.82.72.62.54.04.94.5
4.53.84.47.26.45.54.64.56.16.58.88.86.46.16.05.44.74.54.96.57.06.35.44.94.75.04.74.85.05.04.94.84.94.94.85.05.05.04.94.94.84.84.74.74.44.54.54.54.5
16-19years
13.411.310.511.515.714.014.015.713.715.914.712.910.510.710.110.013.715.114.2
14.212.313.518.317.315.013.513.916.217.921.720.216.816.516.315.513.913.714.317.618.517.716.315.615.515.015.814.815.315.415.214.715.816.116.816.216.116.315.415.915.315.314.916.115.714.815.415.514.8
20yearsandover
4.43.33.03.25.54.14.25.14.03.93.42.92.22.12.01.93.24.03.6
3.63.03.56.25.44.73.73.65.35.67.87.95.75.45.34.84.13.94.35.86.45.74.84.34.14.44.14.24.34.44.34.24.34.34.14.44.34.34.24.34.24.14.14.03.83.93.83.93.9
Females
Total
5.54.34.24.36.25.35.36.55.55.85.55.04.34.64.34.25.46.35.9
5.95.36.18.67.97.36.25.96.56.98.37.96.56.46.15.24.74.54.75.66.15.75.24.84.74.74.74.75.04.84.95.04.84.85.04.84.85.04.84.74.74.94.54.64.54.54.54.74.8
16-19years
10.49.19.79.5
12.712.012.714.812.815.114.914.012.111.512.111.513.415.114.2
14.213.014.517.416.415.914.414.014.816.619.018.315.214.814.913.412.311.512.615.215.814.713.813.412.912.713.112.613.613.712.214.912.613.613.014.214.614.613.613.313.113.012.812.412.911.911.612.612.6
20yearsandover
5.13.93.73.85.64.74.65.74.74.84.64.03.33.83.43.44.45.34.9
4.94.35.17.56.86.25.25.05.65.97.36.95.85.75.44.64.14.04.15.05.55.24.64.34.14.24.14.24.54.34.44.34.34.34.44.24.24.44.34.14.24.44.04.14.04.04.04.24.3
Black and other or black
Total
Males
Total 16-19years
20yearsandover
Females
Total 16-19years
20yearsandover
Black and other
9.98.78.37.9
12.610.710.212.410.910.89.68.17.37.46.76.48.29.9
10.0
10.38.87.98.3
13.711.510.712.810.910.58.97.46.36.05.65.37.39.18.9
14.413.415.018.426.825.224.026.822.027.324.323.321.323.922.121.425.028.829.7
9.98.47.47.6
12.710.59.6
11.710.09.27.76.04.94.33.93.75.67.36.9
9.28.58.97.3
10.89.49.4
11.911.011.210.79.28.79.18.37.89.3
10.911.4
20.619.222.820.228.427.724.829.230.234.731.631.731.329.628.727.634.535.438.4
8.47.77.86.49.58.38.3
10.69.69.49.07.56.67.16.35.86.98.78.8
Black
10.49.4
10.514.814.014.012.812.314.315.618.919.515.915.114.513.011.711.411.412.514.213.011.510.410.510.410.49.8
10.610.010.610.811.011.19.99.6
10.210.610.310.810.510.310.210.510.410.710.710.610.5
9.38.09.8
14.813.713.311.811.414.515.720.120.316.415.314.812.711.711.511.913.015.213.812.010.611.110.610.29.2
10.510.710.911.111.611.09.79.9
11.711.111.212.011.310.910.911.510.311.411.111.110.5
31.727.833.138.137.539.236.734.237.540.748.948.842.741.039.334.432.731.931.936.342.040.137.637.136.934.140.031.936.540.638.739.342.936.134.831.738.938.132.536.334.930.036.643.038.237.236.541.238.6
7.06.07.4
12.511.410.79.39.3
12.413.517.818.114.313.212.911.110.110.010.411.513.512.110.38.89.49.28.27.88.88.79.09.29.49.28.18.39.89.49.9
10.39.69.69.29.38.39.79.39.28.8
11.811.111.314.814.314.913.813.314.015.617.618.615.414.914.213.211.711.410.912.013.212.111.010.210.010.110.510.410.7
9.410.410.510.411.310.19.38.9
10.29.59.79.79.69.69.6
10.610.010.210.110.5
40.536.137.441.041.643.440.839.139.842.247.148.242.639.239.234.932.033.029.936.037.237.432.634.330.336.933.332.835.331.636.436.136.038.532.130.931.030.633.329.130.829.326.922.435.830.931.930.031.2
9.08.68.8
12.211.712.311.210.911.913.415.416.513.513.112.411.610.49.89.7
10.611.810.79.88.68.78.69.19.09.28.08.78.98.79.48.77.97.58.98.08.48.48.48.68.99.08.78.98.99.2
1 Unemployed as percent of civilian labor force in group specified.Note.—See Note, Table B-40.Source. Department of Labor, Bureau of Labor Statistics.
347
Digitized for FRASER http://fraser.stlouisfed.org/ Federal Reserve Bank of St. Louis

TABLE B-42.—Unemployment by duration and reason, 1950-96
[Thousands of persons, except as noted; monthly data seasonally adjusted1]
Year or month
1950195119521953195419551956195719581959196019611962196319641965196619672196819691970197119721973197419751976197719781979198019811982198319841985198619871988198919901991199219931994199519961995Jan
FebMarAprMayJuneJulyAugSeptOctNovDec
1996-JanFebMarAprMayJuneJulyAugSeptOctNovDec
Unem-ploy-ment
3,2882,0551,8831,8343,5322,8522,7502,8594,6023,7403,8524,7143,9114,0703,7863,3662,8752,9752,8172,8324,0935,0164,8824,3655,1567,9297,4066,9916,2026,1377,6378,27310,67810,7178,5398,3128,2377,4256,7016,5287,0478,6289,6138,9407,9967,4047,2367,4327,2037,2017,5907,3587,4457,4967,5177,5237,3297,4097,3547,5887,3647,4027,3027,3317,1197,2766,9107,0437,0197,1877.167
Duration of unemployment
Lessthan5
weeks
1,4501,1771,1351,1421,6051,3351,4121,4081,7531,5851,7191,8061,6631,7511,6971,6281,5731,6341,5941,6292,1392,2452,2422,2242,6042,9402,8442,9192,8652,9503,2953,4493,8833,5703,3503,4983,4483,2463,0843,1743,2653,4803,3763,2622,7282,7002,6332,8132,5822,5892,6692,5952,7442,5732,7472,8482,8082,7392,6832,7742,7362,6322,4502,7542,5442,6032,5342,5222,5562,8192.671
5-14weeks
1,055574516482
1,116815805891
1,3961,1141,1761,3761,1341,2311,117983779893810827
1,2901,5851,4721.3141,5972,4842,1962,1321,9231,9462,4702,5393,3112,9372,4512,5092,5572,1962,0071,9782,2572,7912,8302,5842,4082,3422,2872,1552,2122,3002,3532,3022,3822,5482,4442,3132,3512,3832,3682,3702,2912,3052,3302,3102,2012,3072,1992,2452,2652,2522.357
15-26weeks
425166148132495366301321785469503728534535491404287271256242428668601483574
1,3031,018913766706
1,0521,1221,7081,6521,1041,0251,045943801730822
1,2461,4531,2971,2371,0851,0531,0321,109927
1,0591,2531,0971,0791,1561,0641,0361,0821,1201,1141,0971,1021,0981,0481,051994
1,0031,0401,0621,018976
27weeksandover
3571378478
317336232239667571454804585553482351239177156133235519566343381
1,2031,3481,028648535820
1,1621,7762,5591,6341,2801,1871,040809646703
1,1111,9541,7981,6231,2781,2621,3671,2451,3281,3771,2881,1831,2461,2391,2771,2501,2731,2471,2551,2251,3041,2891,3061,3021,3321,2701,2371,2321,1661.203
Average(mean)dura-tion
(weeks)
12.19.7848.011.813.011.310.513.914.412.815.614.714.013.311.810.48.78.47.88.611.312.010.09.814.215.814.311.910.811.913.715.620.018.215.615.014.513.511.912.013.717.718.018.816.616.717.117.117.217.416.915.716.516.216.316.216.516.416.216.617.217.316.917.216.917.216.916.716.015.8
Mediandura-tion
(weeks)
£34.54.44.96.36.25.25.28.48.27.05.95.46.56.98.7
10.17.96.86.96.55.94.85.36.88.78.39.28.38.37.98.38.28.38.97.88.78.38.08.18.18.28.28.18.28.68.48.18.58.58.68.37.77.8
Reason for unemployment
Job losers3
Total
'i',2291,0701,0171,8112,3232,1081,6942,2424,3863,6793,1662,5852,6353,9474,2676,2686,2584,4214,1394,0333,5663,0922,9833,3874,6945,3894,8483,8153,4763,3703,5603,3783,3773,4233,5253,4313,5163,5163,4523,5533,5113,5123,5863,5433,5083,5353,4093,3993,3483,0953,2363,1713,2613.221
Onlayoff
""394334339675735582472746
1,6711,050865712851
1,4881,4302,1271,7801,1711,1571,090943851850
1.0281,2921,2601,115977
1,0301,021999
1,0211,0281,067956
1,0591,1121,084922
1,0441,0621,0241,1061,0411,0311,0921,0701,000980931989957994987
Other
""836736678
1,1371,5881,5261,2211,4952,7142,6282,3001,8731,7842,4592,8374,1414,4783,2502,9822,9432,6232,2412,1332,3593,4024,1293,7332,8382,4462,3492,5612,3572,3492,3562,5692,3722,4042,4322,5302,5092,4492,4882,4802,5022,4772,4432.3392,3992,3682,1642,2472,2142,2672.234
Jobleav-ers
""438431436550590641683768827903909874880891923840830823877
1,015965983
1,0241,0411,0041,002976791824774716788798827879855836863871748830879835749783723688702754775800797825845
Reen-trants
""945909965
1,2281,4721,4561,3401,4631,8921,9281,9631,8571,8061,9272,1022,3842,4122,1842,2562.1601,9741,8091,8431,9302,1392,2852,1982,7862,5252,5122,5532,4852,4362,7652,4402,5402,5382,5322,5702,5112,5022,4432,4812,4992,5382,4872,7092,4372,5222,4672,4412,4892,5232.556
Newen-
trants
"396407413504630677649681823895953885817872981
1,1851,2161,1101,0391,029920816677688792937919604579580573575597618558564543587614560582587620603593567546545590552559577586626
1 Because of independent seasonal adjustment of the various series, detail will not add to totals.2 Data for 1967 by reason for unemployment are not equal to total unemployment,beginning January 1994, job losers and persons who completed temporary jobs.Note.—Data relate to persons 16 years of age and over.See footnote 5 and Note, Table B-33.Source: Department of Labor, Bureau of Labor Statistics.
348
Digitized for FRASER http://fraser.stlouisfed.org/ Federal Reserve Bank of St. Louis

TABLE B-43.—Unemployment insurance programs, selected data, 1963-96
Year or month
19631964196519661967196819691970197119721973197419751976197719781979198019811982198319841985 ...19861987198819891990199119921993199419951996^
1995- JanFebMarAprMayJuneJulyAugSeptOctNovDec
1996: JanFebMarApr .MayJuneJulyiug :: :.:.:::.:::::Septoct z:NovDec/'
All programs
Coveredemploy-ment1
Insuredunemploy-
ment(weeklyaver-
age)"
Thousands
48,43449,63751,58054,73956,34257,97759,99959,52659,37566,45869,89772,45171,03773,45976,41988,80492,06292,65993,30091,62891,89896,47499,186
101,099103.936107,157109,925111,498109,613110,167112,147115,2558 118,068
7 1,9731,7531,4501,1291,2701,1871,1772.0702,6082,1921,7932,5584.9373.8463.3082,6452.5923,8373,4104,5923.7742.5602.6992,7392,3692.1352.2052.5753.4063,3482,8452.7462.6412.654
3,2833.1822.9572.7282.4812.4022.6382.4652,2012.2972.4272.6753.5073,3433,1702,9412.3582.3872.5542.2582.1882.0492,1082.741
Totalbenefits
paid(millions
dollars)2*
3.0262.7492.3601.8912.2222.1912.2994.2096.1545.4914.5176.934
16.80212.34510.9999.0079.401
16.17515.28724.49121.00013.83815.28316.67014.92913,69414.94818.72126.717
9 26,460'22.950
22.84422.386
2.220.92.098.02.31721.788.41,815.71.718.31.723.01.807.51,483.51.572.51,672.71.823.82.568.12.371.72,247.92.130.01.793.71,550.61.838.71.599.61.452.01.520.01.418.61.9152
State programs
Insuredunem-
&Initialclaims
Exhaus-tions s
Weekly average; thousands7 1,806
1,6051.3281,0611,2051.1111,10113052.15013481.6322,2623.9862.9912.65523592,43433503.0474.05933952.4752.6172.64323002,0812.1582,52233423,2452.7512.6702.5752.594
2.5042,5082.4942.4962,5582.6362.6832.6342,6322.6782.6522.6252,6552,6602.6412,57623442.5702,5372^232,4622,4642.4562314
7 298268232203226201200296295261247363478386375346388488460583438377397378328310330388447408341340357356**
333336342352373376373346357365375363374371393356348356335323334332335355
30262115171616253935293781635539395957808050495246383745677462575153
575252575249545045484850585355615352564947464453
Insuredunemploy-ment aspercent
ofcoveredemploy-
ment
4.33.83.02.32.52.22.13.44.13.52.73.56.04.63.93.32.93.93.54.63.92.82.92.82.42.02.12.43.23.12.62.42.3
2.32.32.32.32.32.42.42.42.42.42.42.42.42.42.42.32.32.32.22.22.22.22.22.2
Benefits paid
Total(millions
ofdollars)4
2,7752,5222,1661,7712,0922,0322,1283,8494,9574,4714,0085,975
11,7558,9758,3577,7178,613
13,76113,26220,64917,78712,61014,13115,32913,60712,56513,76017,35624,52623,86920,53920,40120,125
2,146.92,030.42,244.11,730.01,753.01,660.41,668.01,745.91,430.51,508.61,606.41,758.62,488.22,305.32,188.12,073.81,744.31,504.01,782.31,549.11,405.41,467.31,371.31,858.2
Averageweeklycheck
(dollars)6
35.2735.9237.1939.7541.2543.4346.1750.3454.0256.7659.0064.2570.2375.1678.7983.6789.6798.95
106.70119.34123.59123.47128.14135.65140.55144.97151.73161.56169.88173.64179.62182.16187.29189.39
186.19189.50189.92188.46187.64186.74184.92183.31186.58187.48187.00188.88191.92193.85193.45192.11189.02187.70176.96184.79188.92189.07190.43190.92
** Monthly data are seasonally adjusted.1 Includes persons under the State. UCFE (Federal employee, effective January 1955), RRB (Railroad Retirement Board) programs, and UCX(unemployment compensation for ex-servtcemembers, effective October 1958) programs.2 Includes State, UCFE, RR, UCX, UCV (unemployment compensation for veterans, October 1952-January 1960), and SRA (Servicemen's Re-adjustment Act, September 1944-September 1951) programs. Abo includes Federal and State extended benefit programs. Does not includeFSB (Federal supplemental benefits), SUA (special unemployment assistance). Federal Supplemental Compensation, and Emergency Unemploy-ment Compensation programs, except as noted in footnote 9.3 Covered workers who have completed at least 1 week of unemployment.4 Annual data are net amounts and monthly data are gross amounts.
5 Individuals receiving final payments in benefit year.6 For total unemployment only.7 Programs include Puerto Rican sugarcane workers for initial claims and insured unemployment beginning July 1963.8 Latest data available for all programs combined. Workers covered by State programs account for about 97 percent of wage and salary
earners.9 Including Emergency Unemployment Compensation and Federal Supplemental Compensation, total benefits paid for 1992 and 1993 would
be approximately (in millions of dollars): for 1992,39.990 and for 1993.34,876.Source: Department of Labor, Employment and Training Administration.
349
Digitized for FRASER http://fraser.stlouisfed.org/ Federal Reserve Bank of St. Louis

TABLE B—44.—Employees on nonagricultural payrolls, by major industry, 1948—96
[Thousands of persons; monthly data seasonally adjusted]
Year or month
194819491950195119521953195419551956195719581959I96019611962196319641965196619671968196919701971197219731974197519761977197819791980198119821983 . . . .1984198519861987198819891990199119921993199419951996?1995- Jan
Feb „..MarAprMayJuneJulyA u g . . . . . .sept : :.OctNovDec
1996-JanFebMarAprMayJuneJulyAugsept" ..:.::: ...:::: ::::: .:::.: :OctNOVPDec**
Total
44,86643,75445,19747,81948,79350,20248,99050,64152,36952,85551,32253,27054,18953,99955,54956,65358,28360,76363,90165,80367,89770,38470,88071,21173,67576,79078,26576,94579,38282,47186,69789,82390,40691,15289,54490,15294,40897,38799,344101,958105,210107,895109,419108,256108,604110,730114,172117,203119,549116,250116,502116,701116,861116,907117,100117,201117,499117,623117,749117,899118,136118,070118,579118,750118,922119,332119,537119,772120,052120,050120,311120,438120.700
Goods-producing industries
Total
18,77417,56518,50619,95920,19821,07419,75120,51321,10420,96719,51320,41120,43419,85720,45120,64021,00521,92623,15823,30823,73724,36123,57822,93523,66824,89324,79422,60023,35224,34625,58526,46125,65825,49723,81223,33024,71824,84224,53324,67425,12525,25424,90523,74523,23123,35223,90824,20624,25824,26924,28124,28224,27624,21724.21224,17124,17924,17624,15124,13324,16024,11224,25424,19624,20924,26324,27424,26424,29824,25724,28424,30824.348
Mining
994930901929898866791792822828751732712672650635634632627613606619623609628642697752779813851958
1,0271,1391,128952966927777717713692709689635610601580570593587588585582580578576574573569570569573574573576575570570567566567565
Construc-tion
2,1982,1942,3642,6372,6682,6592,6462,8393,0392,9622,8173,0042,9262,8592,9483,0103,0973,2323,3173,2483,3503,5753,5883,7043,8894,0974,0203,5253,5763,8514,2294,4634,3464,1883,9043,9464,3804,6684,8104,9585,0985,1715,1204,6504,4924,6684,9865,1585,4055,1325,1375,1345,1365,1165,1395,1465,1645,1875,2005,2115,2235,2345,3495,3415,3535,3845,4015,4275,4375,4495,4645,4875.510
Manufacturing
Total
15,58214,44115,24116,39316,63217,54916,31416,88217,24317,17615,94516,67516,79616,32616,85316,99517,27418,06219,21419,44719,78120,16719,36718,62319,15120,15420,07718,32318,99719,68220,50521,04020,28520,17018,78018,43219,37219,24818,94718,99919,31419,39119,07618,40618,10418,07518,32118,46818,28218,54418,55718,56018,55518,51918,49318,44718,43918,41518,37818,35318,36718,30918,33218,28118,28318,30318,29818,26718,29118,24118,25418,25418.273
Durablegoods
8,2987,4628,0669,0599,32010,0809,1019,5119,8029,8258,8019,3429,4299,0419,4509,5869,78510,37411,25011,40811,59411,86211,17610,60411,02211,86311,89710,66211,05111,57012,24512,73012,15912,08211,01410,70711,47611,45811,19511,15411,36311,39411,10910,56910,27710,22110,44810,65410,67610,63210,65710,67410,67910,66810,65510,64710,65310,64810,63110,62810,66710,64310,65910,62310,65410,67910,69610,68010,71110,67510,68410,69010.708
Nondura-ble goods
7,2856,9797,1757,3347,3137,4687,2137,3707,4427,3517,1447,3337,3677,2857,4037,4107,4897,6887,9638,0398,1878,3048,1908,0198,1298,2918,1817,6617,9468,1128,2598,3108,1278,0897,7667,7257,8967,7907,7527,8457,9517,9977,9687,8377,8277,8547,8737,8147,6067,9127,9007,8867,8767,8517,8387,8007,7867,7677,7477,7257,7007,6667,6737,6587,6297,6247,6027,5877,5807,5667,5707,5647.565
Note.—Data in Tables EM4 and B-45 are based on reports from employing establishments and relate to full- and part-time wage and sal-ary workers in nonagricultural establishments who received pay for any part of the pay period which includes the 12th of the month. Notcomparable with labor force data (Tables B-33 through B-42), which include proprietors, self-employed persons, domestic servants,
See next page for continuation of table.
350
Digitized for FRASER http://fraser.stlouisfed.org/ Federal Reserve Bank of St. Louis

TABLE B-44.—Employees on nonagricultural payrolls, by major industry, 1948-96—Continued[Thousands of persons; monthly data seasonally adjusted]
Year or month
19481949 ...19501951195219531954 .19551956195719581959 ..1960 ... .19611962 ...19631964 ...19651966 ...19671968196919701971 ...19721973 .197419751976197719781979198019811982198319841985198619871988 .. .198919901991199219931994 ..19951996* .1995:Jan
FebMarAprMayJuneJulyAugSeptOctNovDec
1996JanFebMarAprMayJuneJulyAugSeptOctNov/>Dec/'
Service-producing industries
Total
26,09226,18926,69127,86028,59529,12829,23930,12831,26431,88931,81132,85733,75534,14235,09836,01337,27838,83940,74342,49544,15846,02347,30248,27650,00751,89753,47154,34556,03058,12561,11363,36364,74865,65565,73266,82169,69072,54474,81177,28480,08682,64284,51484,51185,37387,37890,26492,99795,29191,98192,22192,41992,58592,69092,88893,03093,32093,44793,59893,76693,97693,95894,32594,55494,71395,06995,26395,50895,75495,79396,02796,13096,352
Transpor-tation and
publicutilities
4,1894,0014,0344,2264,2484,2904,0844,1414,2444,2413,9764,0114,0043,9033,9063,9033,9514,0364,1584,2684,3184,4424,5154,4764,5414,6564,7254,5424,5824,7134,9235,1365,1465,1655,0814,9525,1565,2335,2475,3625,5145,6255,7935,7625,7215,8295,9936,1656,3186,0946,1146,1256,1346,1396,1526,1606,1876,1946,2126,2336,2496,2546,2706,2926,2946,3096,3296,3336,3426,3376,3386,3556,360
Wholesaletrade
2,6122,6102,6432,7352,8212,8622,8752,9343,0273,0372,9893,0923,1533,1423,2073,2583,3473,4773,6083,7003,7913,9194.0064,0144,1274,2914,4474,4304,5624,7234,9855,2215,2925,3755,2955,2835,5685,7275,7615.8486,0306,1876,1736.0815,9975,9816,1626,4126,5876,3126,3416,3606,3746,3896,4086,4276,4376,4516,4656,4786,4986,5126,5296,5486,5506,5676,5756,5856,6036,6196,6436,6486,657
Retailtrade
6,6596,6546,7437,0077,1847,3857,3607,6017,8317,8487,7618,0358,2388,1958,3598,5208,8129,2399,6379,90610,30810,78511,03411,33811,82212,31512,53912,63013,19313,79214,55614,97215,01815,17115,15815,58716,51217,31517,88018,42219,02319,47519,60119,28419,35619,77320.50721,17321,59121,00521,04821,05621,11521,11921,17921,19621,22521,25821,26321,30021,33421,26821,34021,35021,41521,48521,56821.67121.67221,70221.80321,83521.883
Finance,insurance,and realestate
1.8001,8281,8881,9562,0352,1112,2002,2982,3892,4382,4812,5492,6282,6882,7542,8302,9112,9773,0583,1853,3373,5123,6453,7723,9084,0464,1484,1654,2714,4674.7244,9755,1605,2985,3405,4665,6845,9486,2736,5336,6306,6686,7096,6466,6026,7576,8966.8306,9776,8236,8126,8096,8066,8076,8106,8216,8336,8426,8596,8716,8876,8946,9196,9316,9426,9646,9676,9876,9997,0097,0267,0367,053
Services
5,1815,2395,3565,5475,6995,8355,9696,2406,4976,7086,7657,0877,3787,6197,9828,2778,6609,0369,49810,04510,56711,16911,54811,79712,27612,85713,44113,89214,55115,30216,25217,11217,89018,61519,02119,66420,74621,92722,95724,11025,50426,90727,93428,33629,05230,19731,57933,10734.36032,49232,64432,79832,86732,94733,03833,10633,26933,37733,46033,54633,66133,69433,90234,03934,11734,28534,37834,44834,53234,60734,70934,77134,883
Government
Total
5,6505,8566,0266,3896,6096,6456,7516,9147,2787,6167,8398,0838,3538,5948,8909,2259,59610,07410,78411,39111,83912,19512,55412,88113,33413,73214,17014,68614,87115,12715,67215,94716,24116,03115,83715,86916,02416,39416,69317,01017,38617,77918,30418,40218,64518,84119,12819,31019,45919,25519,26219,27119,28919,28919,30119,32019,36919,32519,33919,33819,34719,33619,36519,39419,39519,45919,44619,48419,60619,51919,50819,48519,516
Federal
1,8631,9081,9282,3022,4202,3052,1882,1872,2092,2172,1912,2332,2702,2792,3402,3582,3482,3782,5642,7192,7372,7582,7312,6962,6842,6632,7242,7482,7332,7272,7532,7732,8662,7722,7392,7742,8072,8752,8992,9432,9712,9883,0852,9662,9692,9152,8702,8222,7572,8422,8352,8312,8302,8312,8312,8252,8222,8122,8012,7962,7902,7832,7802,7802,7762,7762,7562,7522,7392,7392,7312,7322,720
State andlocal
3,7873,9484,0984,0874,1884,3404,5634,7275,0695,3995,6485,8506,0836,3156,5506,8687,2487,6968,2208,6729,1029,4379,82310,18510,64911,06811,44611,93712,13812,39912,91913,17413,37513,25913,09813,09613,21613,51913,79414,06714,41514,79115,21915,43615,67615,92616,25816,48916,70316,41316,42716,44016,45916,45816,47016,49516,54716,51316,53816,54216,55716,55316,58516,61416,61916,68316,69016,73216,86716,78016,77716,75316,796
Note (cont'd).—which count persons as employed when they are not at work because of industrial disputes, bad weather, etc., even if theyare not paid for the time off; and which are based on a sample of the working-age population. For description and details of the variousestablishment data, see "Employment and Earnings."
Source: Department of Labor, Bureau of Labor Statistics.
351
Digitized for FRASER http://fraser.stlouisfed.org/ Federal Reserve Bank of St. Louis

TABLE B-45.—Hours and earnings in private nonagricultural indutries, 1959-961
[Monthly data seasonally adjusted, except as noted]
Year or month
195919601961196219631964196519661967196819691970197119721973197419751976197719781979198019811982198319841985 .19861987198819891990199119921993199419951996/>1995:Jan
FebMarAprMayJuneJulyAucsept':::::::::...::::::: :::....:.:OctNovDec
1996JanFebMarAprMayJune
July .. .Aug :.::SeptOctNovDec/*
Average weekly hours
Totalprivate
39.038.638.638.738.838.738.838.638.037.837.737.136.937.036.936.536.136.136.035.835.735.335.234.835.035.234.934.834.834.734.634.534.334.434.534.734.534.434.734.534.534.634.234.434.534.434.434.534.434.333.834.534.534.334.234.734.234.434.734.334.534.8
Manufacturing
Total
40.339.739.840.440.540.741.241.440.640.740.639.839.940.540.740.039.540.140.340.440.239.739.838.940.140.740.540.741.041.141.040.840.741.041.442.041.641.642.241.941.841.541.541.541.341.541.541.441.541.240.041.441.341.541.741.8'41.641.741.741.741.742.0
Over-time
2.72.52.42.82.83.13.63.93.43.63.63.02.93.53.83.32.63.13.53.63.32.82.82.33.03.43.33.43.73.93.83.63.63.84.14.74.44.54.84.74.64.44.34.24.24.34.44.34.34.24.14.34.34.64.64.64.44.54.54.44.54.7
Average hourly earnings
Total private
Currentdollars
$2.02
2.092.142.222.282.362.462.562.682.853.043.233.453.703.944.244.534.865.255.696.166.667.257.688.028.328.578.768.989.289.66
10.0110.3210.5710.8311.1211.4411.8211.3011.3111.3211.3811.3611.4311.4711.4611.5211.5511.5911.6111.6211.6511.6811.7211.7411.8311.8111.8711.9111.9011.9912.05
1982dollars2
$6.69
6.796.887.077.177.337.527.627.727.897.988.038.218.538.558.288.128.248.368.408.177.787.697.687.797.801117.817.737.697.647.527.457.417.397.407.407.437.407.397.377.397.367.397.417.397.427.427.447.447.417.427.407.407.397.447.417.457.457.427.457.47
Manu-fac-
turing(currentdollars)
$2.192.262.322.392.452.532.612.712.823.013.193.353.573.824.094.424.835.225.686.176.707.277.998.498.839.199.549.739.91
10.1910.4810.8311.1811.4611.7412.0712.3712.7812.2212.2512.2812.3112.3012.3312.3912.4212.4312.4612.4912.5112.6312.5612.5512.7412.7312.7712.7912.8912.8712.8812.9313.01
Average weekly earnings, total private
Level
Currentdollars
$78.7880.6782.6085.9188.4691.3395.4598.82
101.84107.73114.61
119.83127.31136.90145.39154.76163.53175.45189.00203.70219.91
235.10255.20267.26280.70292.86299.09304.85312.50322.02334.24
345.35353.98363.61373.64385.86394.68406.61392.11390.20390.54393.75388.51393.19395.72394.22396.29398.48398.70398.22
392.76401.93402.96402.00401.51410.50
403.90408.33413.28408.17413.66419.34
1982dollars2
$260.86261.92265.59273.60278.18283.63291.90294.11293.49298.42300.81298.08303.12315.44315.38302.27293.06297.37300.96300.89291.66
274.65270.63267.26272.52274.73271.16271.94269.16266.79264.22259.47255.40254.99254.87256.73255.29255.73
256.78255.03254.42255.68251.63254.16255.80254.34255.34255.93255.91255.11
250.48255.84255.36253.79252.68258.18
253.55256.17258.46254.47257.09259.98
Percent changefrom yearearlier3
Currentdollars
4.92.42.44.03.03.24.53.53.15.86.44.66.27.56.26.45.77.37.77.88.06.98.54.75.04.32.11.92.53.03.83.32.52.72.83.32.33.02.63.22.12.3
2^2.82.42.42.02.32.1
.22.73.12.63.64.62.53.54.42.53.85.2
1982dollars2
4.2.4
1.43.01.72.02.9
.8-.21.7.8
-.91.74.1-.0
-4.2-3.0
1.51.2-.0
-3.1-5.8-1.5-1.2
2.0.8
-1.3
-1.0-.9
-1.0-1.8-1.6
-.0
~:e.2
-.3
-:g-.9
-2.5-.8-.0
-J-.6
-A-2.5
.0
.3
~'.61.8-.4
.71.4
:51.8
1 For production or nonsupervisory workers; total includes private industry groups shown in Table B-44.2 Current dollars divided by the consumer price index for urban wage earners and clerical workers on a 1982=100 base.3 Percent changes are based on data that are not seasonally adjusted.Note.—See Note, Table B-44.Source: Department of Labor, Bureau of Labor Statistics.
352
Digitized for FRASER http://fraser.stlouisfed.org/ Federal Reserve Bank of St. Louis

TABLE B-46.—Employment cost index, private industry, 1980-96
Year and month
December:1980198119821983198419851986198719881989199019911992199319941995
1995-. MarJuneSeptDec
1996: MarJuneSept
1995: MarJuneSeptDec
1996: MarJuneSept
December:1980 ..198119821983198419851986198719881989199019911992199319941995
1995: MarJuneSeptDec
1996- MarJuneSept
1995: MarJuneSeptDec
1996: MarJuneSept
Total private
Totalcom-pen-
sation
Wagesandsala-ries
Bene-fits1
i
Goods-producing
Totalcom-pen-
sation
Wagesandsala-ries
Bene-fits1
Service-producing
Totalcom-pen-
sation
Wagesandsala-ries
Bene-f i ts1
Manufac tur ing
Totalcom-pen-
sation
Wagesand
sala-ries
Bene-f i t s 1
Non m a n u f a c t u r i n g
Totalcom-pen-
sation
Wagesand
sala-ries
Bene-f i t s 1
Index. June 1989=100; not seasonally adjusted
64.871.275.880.184.087.390.193.197.6
102.3107.0111.7115.6119.8123.5126.7124.5125.4126.2126.7127.9129.0129.8
67.173.077.681.484.888.391.194.198.0
102.0106.1110.0112.9116.4119.7123.1120.6121.5122.4123.1124.4125.6126.5
59.466.671.476.781.784.687.590.596.7
102.6109.4116.2122.2128.3133.0135.9134.5135.1135.6135.9136.6137.4138.1
66.773.377.881.685.488.291.093.897.9
102.1107.0111.91161120.6124.3127.3125.3125.9126.5127.3128.2129.3130.1
69.775.780.083.286.489.492.395.298.2
102.0105.8109.7112.8116.1119.6122.9120.4121.4122.1122.9123.9125.1126.1
60.568.273.278.383.285.788.390.997.3
102.6109.9116.7123.4130.3134.8137.1135.9135.9136.2137.1137.7138.6138.8
63.369.574.178.982.986.689.392.697.3
102.3107.0111.6115.2119.3122.8126.2123.9124.9125.8126.2127.6128.6129.5
65.371.175.980.283.787.790393.497.8
102.2106.3110.2113.0116.6119.7123.2120.7121.6122.6123.2124.7125.8126.7
58.465.169.675.280.483.686.890.296.1
102.6109.0115.7121.2126.7131.5134.7133.2134.1134.8134.7135.5136.2137.2
66.072.576.980.885.087.890.793.497.6
102.0107.2112.2116.5121.3125.1128.3126.2126.9127.3128.3129.3130.4131.3
68.974.979.182.586.189.292.195.298.1
101.9106.2110.3113.7117.3120.8124.3121.9122.9123.5124.3125.4126.5127.7
59.967.572.477.582.785.087.589.896.6
102.3109.5116.1122.6130.0134.3136.7135.4135.2135.5136.7137.5138.5138.8
64.270.475.179.683.487.089.792.997.5
102.3106.9111.5115.1119.0122.6125.9123.7124.6125.5125.9127.2128.2129.1
66.272.176.881.084.288090.693.797.8
102.2106.1109.8112.6116.0119.1122.5120.0120.9121.9122.5123.9125.1125.9
59.166.170.676.281.184.487.591.096.8
102.8109.3116.2122.0127.4132.3135.3133.9134.7135.4135.3136.0136.7137.5
Index, June 1989=100; seasonally adjusted
124.4125.3126.1126.9127.8128.8129.6
120.6121.5122.4123.2124.5125.6126.4
133.8134.6135.4136.1136.0136.9137.8
125.3126.0126.7127.7128.2129.4130.3
120.4121.4122.1122.9123.9125.1126.1
135.4135.7136.3137.7137.2138.4138.9
124.0124.9125.8126.5127.5128.5129.4
120.7121.6122.5123.3124.8125.8126.5
132.9133.9134.8135.2135.2136.0137.1
126.0126.7127.4128.4129.0130.2131.3
121.9122.9123.5124.3125.4126.5127.7
134.8135.1135.7137.1137.0138.4139.0
123.6124.6125.4126.2127.2128.2128.9
120.0120.9121.8122.6124.0125.1125.7
133.5134.5135.4135.9135.7136.5137.4
Percent change from 12 months earlier, not seasonally adjusted
9.69.96.55.74.93.93.23.34.84.84.64.43.53.63.12.62.92.82.62.62.72.92.9
9.18.86.34.94.24.13.23.34.14.14.03.72.63.12.82.82.92.92.82.83.23.43.3
11.712.1
7.27.46.53.53.43.46.96.16.66.25.25.03.72.22.92.62.12.21.61.71.8
9.99.96.14.94.73.33.23.14.44.34.84.63.83.93.12.42.92.42.12.42.32.72.8
9.48.65.74.03.83.53.23.13.23.93.73.72.82.93.02.83.02.92.72.82.93.03.3
10.812.77.37.06.33.03.02.97.05.47.16.25.75.63.51.72.41.51.01.71.32.01.9
9.79.86.66.55.14.53.13.75.15.14.64.33.23.62.92.82.93.12.92.83.03.02.9
8.88.96.85.74.44.83.03.44.74.54.03.72.53.22.72.92.92.92.92.93.33.53.3
12.511.56.98.06.94.03.83.96.56.86.26.14.84.53.82.43.33.42.72.41.71.61.8
9.89.86.15.15.23.33.33.04.54.55.14.73.84.13.12.63.02.82.32.62.52.83.1
9.48.75.64.34.43.63.33.43.03.94.23.93.13.23.02.93.33.32.92.92.92.93.4
10.512.7
7.37.06.72.82.92.67.65.97.06.05.66.03.31.82.61.71.21.81.62.42.4
9.79.76.76.04.84.33.13.65.04.94.54.33.23.43.02.72.82.82.62.72.82.92.9
8.98.96.55.54.04.53.03.44.44.53.83.52.63.02.72.92.72.72.72.93.33.53.3
12.611.86.87.96.44.13.74.06.46.26.36.35.04.43.82.33.13.02.42.31.61.51.6
Percent change from 3 months earlier, seasonally adjusted
0.7.7.6
'.7.8.6
0.8.7.7.7
1.1.9.6
0.1.6.6.6
~>.7
0.7.6.6.8.4.9.7
0.7.8.6
.81.0.8
0
'41.0-.4
.9
.4
0.9
.7
.6
.8
.8
.7
0.8
>.7
1.2.8.6
0.7.8.7.4
0.6.8
0.6.6.6.8
^9.8
0.9.8
:&.9.9.9
0.2.4
1.0-.11.0
.4
0.7.8.6.7.8.8.5
0.7.8.7.7
1.1.9.5
0.5.7.7.4
-.1.6.7
1 Employer costs for employee benefits.Note.—The employment cost index is a measure of the change in the cost of labor, free from the influence of employment shifts among
occupations and industries.Data exclude farm and household workers.Through December 1981, percent changes are based on unrounded data; thereafter changes are based on indexes as published.Source: Department of Labor, Bureau of Labor Statistics.
353
Digitized for FRASER http://fraser.stlouisfed.org/ Federal Reserve Bank of St. Louis
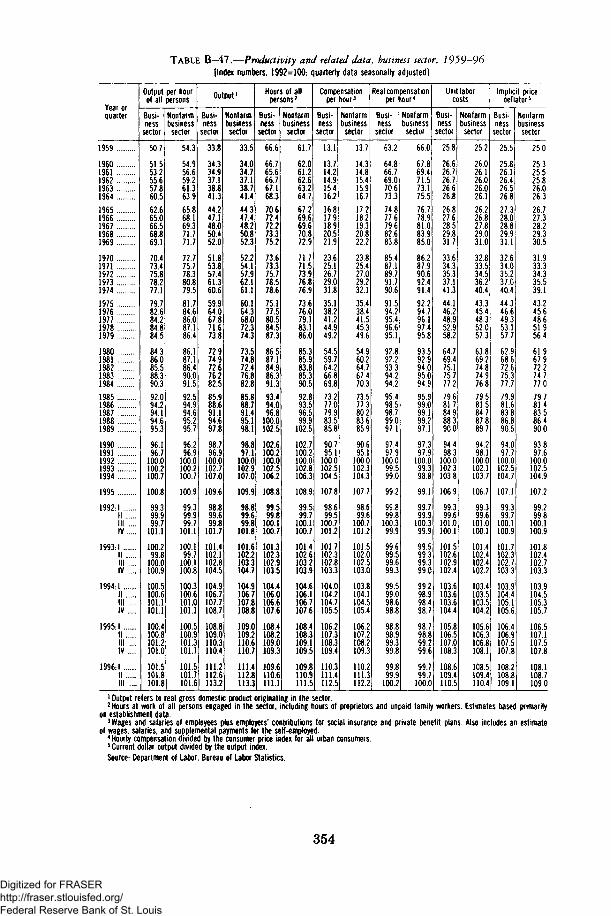
TABLE B-47.—Productivity and related data, business sector, 1959-96[Index numbers, 1992=100; quarterly data seasonally adjusted]
Year orquarter
1959
1960196119621963196419651966196719681969
1970197119721973197419751976197719781979
1980198119821983198419851986198719881989
19901991199219931994
1995
1992:1I IIll ....IV
1993:1IIIll ....IV
1994:1I IIll ....IV
1995:1IIIll ....IV
1996:1IIIll ....
Output per hourof all persons
Busi-ness
sector
50.7
51.553.255.657.860.562.665.066.568.869.1
70.473.475.878.277.179.782.684.284.884.5
84.386.085.588.390.392.094.294.194.695.3
96.196.7
100.0100.2100.7
100.8
99.399.999.7
101.1
100.299.8
100.0100.9
100.5100.6101.1101.1
100.4100.8101.2101.0
101.5101.8101.8
Nonfarmbusiness
sector
54.3
54.956.659.261.363.965.868.169.371.771.7
72.775.778.380.879.581.784.686.087.186.4
86.187.186.490.091.592.594.994.695.295.7
96.296.9
100.0100.2100.7
100.9
99.399.999.7
101.1
100.199.7
100.1100.8
100.3100.6101.0101.1
100.5100.9101.3101.1
101.5101.7101.6
Output'
Busi-ness
sector
33.8
34.334.937.138.841.344.247.148.050.452.0
51.853.857.461.360.659.964.067.871.673.8
72.974.972.676.282.585.988.691.194.697.8
98.796.9
100.0102.7107.0
109.6
98.899.699.8
101.7
101.4102.1102.8104.5
104.9106.7107.7108.7
108.8109.0110.3110.4
111.2112.6113.2
Nonfarmbusinesssector
33.5
34.034.737.138.741.444.347.448.250.852.3
52.254.157.962.161.160.164.368.072.374.3
73.574.872.476.882.885.888.791.495.198.1
98.897.1
100.0102.9107.0
109.9
98.899.699.8
101.8
101.6102.2103.3104.7
104.9106.7107.8108.8
109.0109.2110.6110.7
111.4112.!113.3
Hours of allpersons2
Busi-ness
sector
66.6
66.765.666.767.168.370.672.472.273.375.2
73.673.375.778.578.675.177.580.584.587.3
86.587.184.986.391.393.494.096.8
100.0102.5
102.6100.2100.0102.5106.2
108.8
99.599.8
100.1100.7
101.3102.3102.9103.5
104.4106.0106.6107.6
108.4108.2109.0109.3
109.6110.6111.1
Nonfarmbusinesssector
61.7
62.061.262.663.264.767.269.669.670.872.9
71.771.573.976.876.973.676.079.183.186.0
85.385.983.885.390.592.893.596.599.9
102.5
102.7100.2100.0102.8106.3
108.9
99.599.7
100.1100.7
101.4102.6103.2103.9
104.6106.1106.7107.6
108.4108.3109.1109.5
109.8110.9111.5
Compensationper hour3
Busi-ness
sector
13.1
13.714.214.915.416.216.817.918.920.521.9
23.625.126.729.031.835.138.241.244.949.2
54.559.764.266.869.873.277.079.983.585.8
90.795.1
100.0102.5104.5
107.8
98.699.5
100.7101.2
101.7102.3102.8103.3
104.0104.2104.7105.5
106.2107.3108.3109.4
110.3111.4112.5
Nonfarmbusiness
sector
13.7
14.314.815.415.916.717.218.219.320.822.2
23.825.427.029.232.135.438.441.545.349.6
54.960.264.767.470.373.577.380.283.685.9
90.695.1
100.0102.3104.3
107.7
98.699.6
100.7101.2
101.5102.0102.5103.0
103.8104.1104.5105.4
106.2107.2108.2109.3
110.2111.3112.2
Real compensationper hour 4
Busi-ness
sector
63.2
64.866.769.070.673.374.877.679.682.683.8
85.487.189.791.790.691.594.295.496.695.1
92.892.293.394.294.295.498.598.799.097.1
97.497.9
100.099.599.0
99.2
99.899.8
100.399.9
99.699.599.699.3
99.599.098.698.8
98.898.999.399.8
99.899.9
100.2
Nonfarmbusiness
sector
66.0
67.869.471.573.175.576.778.981.083.985.0
86.287.990.692.491.492.294.796.197.495.8
93.592.994.095.094.995.999.099.199.297.1
97.397.9
100.099.398.8
99.1
99.799.9
100.399.9
99.599.399.399.0
99.298.998.498.7
98.798.899.299.6
99.799.7
100.0
Unit laborcosts
Busi-ness
sector
25.8
26.626.726.726.626.826.827.628.529.831.7
33.634.335.337.141.344.146.248.952.958.2
64.769.475.175.777.279.681.784.988.390.0
94.498.3
100.0102.3103.8
106.9
99.399.6
101.0100.1
101.5102.6102.9102.4
103.6103.6103.6104.4
105.8106.5107.0108.3
108.6109.4110.5
Nonfarmbusiness
sector
25.2
26.026.126.026.026.126.226.827.829.031.0
32.833.534.536.240.443.345.448.352.057.3
63.869.274.874.976.879.581.584.787.889.7
94.298.1
100.0102.1103.7
106.7
99.399.6
101.0100.1
101.4102.4102.4102.2
103.4103.5103.5104.2
105.6106.3106.8108.1
108.5109.4110.4
Implicit pricedef later *
Busi-ness
sector
25.5
25.826.126.426.526.827.328.028.829.931.1
32.634.035.237.040.444.346.649.353.157.7
62.968.672.675.377.779.981.683.886.890.5
94.097.7
100.0102.5104.7
107.1
99.399.7
100.1100.9
101.7102.3102.7103.3
103.9104.4105.1105.6
106.4106.9107.5107.8
108.2108.8109.1
Nonfarmbusiness
sector
25.0
25.325.525.826.026.326.727.328.229.330.5
31.933.334.335.539.143.245.648.651.956.4
61.967.972.274.777.079.781.483.586.490.0
93.897.6
100.0102.5104.9
107.2
99.299.8
100.1100.9
101.8102.4102.7103.3
103.9104.5105.3105.7
106.5107.1107.5107.8
108.1108.7109.0
1 Output refers to real gross domestic product originating in the sector.2 Hours at work of all persons engaged in the sector, including hours of proprietors and unpaid family workers. Estimates based primarilyon establishment data.3 Wages and salaries of employees plus employers' contributions for social insurance and private benefit plans. Also includes an estimateof wages, salaries, and supplemental payments for the self-employed.4 Hourly compensation divided by the consumer price index for all urban consumers.5 Current dollar output divided by the output index.
Source: Department of Labor, Bureau of Labor Statistics.
354
Digitized for FRASER http://fraser.stlouisfed.org/ Federal Reserve Bank of St. Louis
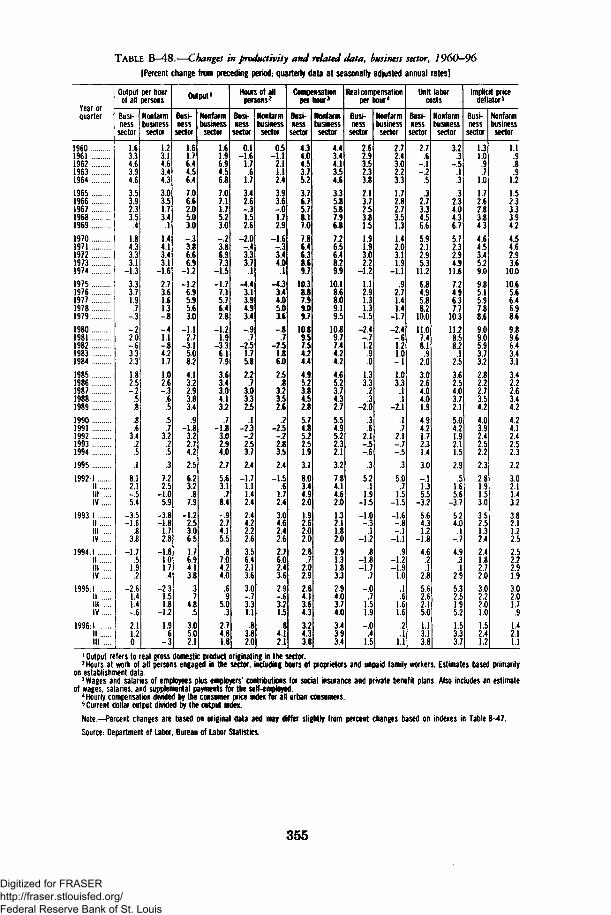
TABLE B-48.—Changes in productivity and related data, business sector, 1960-96
[Percent change from preceding period; quarterly data at seasonally adjusted annual rates]
Year nrTear Oiquarter
19601961196219631964
19651966196719681969
19701971197219731974
19751976197719781979
19801981198219831984
19851986198719881989
19901991199219931994
1995
1992:1IIIllIV
1993:1IIIll ....IV
1994:1IIIll ....IV
1995:1IIIll ....IV
1996:1IIIll ....
Output per hourof all persons
Busi-ness
sector
1.63.34.63.94.6
3.53.92.33.5
.4
1.84.33.33.1
-1.3
3.33.71.9
.7-.3
-.22.0-.63.32.3
1.82.5-.2
.5
.8
.8
.63.4
.2
.5
.1
8.12.1_ c
5.4
-3.5-1.6
.83.8
-1.7«jL9
.2
-2.61.41.4-.6
2.11.20
Nonfarmbusinesssector
1.23.14.63.44.3
3.03.51.73.4.1
1.44.13.43.1
-1.6
2.73.61.61.3-.8
-.41.1-.84.21.7
1.02.6-.3
.6
.5
.5
.73.2
.2
.5
.3
7.22.5
-105.9
-3.8-1.8
1.72.8
-1.81.01.7
.4
-2.31.51.8
-1.2
1.9.6
-.3
Output'
Busi-ness
sector
1.61.76.44.56.4
7.06.62.05.03.0
-.33.86.66.9
-1.2
-1.26.95.95.63.0
-1.12.7
-3.15.08.2
4.13.22.93.83.4
.9-1.8
3.22.74.2
2.5
6.23.2
87.9
-1.22.53.065
1.76.94.13.8
3>
4.8c
3.05.02.1
Nonfarmbusinesssector
1.61.96.94.56.8
7.07.11.75.23.0
-.23.86.97.3
-1.5
-1.77.15.76.42.8
-1.21.9
-3.36.17.9
3.63.43.04.13.2
.7-1.8
3.02.94.0
2.7
5.63.1
78.4_ g2.74.15.5
.87.04.24.0
.6c
5X
2.74.81.8
Hours of allpersons2
Busi-ness
sector
0.1-1.6
1.7.6
1.7
3.42.6-.31.52.6
-2.0-.43.33.7.1
-4.43.13.94.93.4
-.9.7
-2.51.75.8
2.2.7
3.03.32.5
.1-2.3-.22.53.7
2.4
-1.71.1142.4
2.44.22.22.6
3.56.42.13.6
3.0-.73.31.1
.83.12.0
Nonfarmbusinesssector
0.5-1.1
2.11.12.4
3.93.6-.01.72.9
-1.6-.33.44.0.1
-4.33.44.05.03.6
-.8.7
-2.51.86.0
2.5.8
3.23.52.6
.2-2.5-.22.83.5
2.4
-1.5.6
1 72.4
3.04.62.42.6
2.76.02.43.6
2.9-.63.21.5
.84.12.1
Compensationper hour ^
Busi-ness
sector
4.34.04.53.75.2
3.76.75.78.17.0
7.86.46.38.69.7
10.38.87.99.09.7
10.89.57.54.24.4
4.95.23.84.52.8
5.74.85.22.51.9
3.1
8.03.4492.0
1.92.62.02.0
2.8.7
2.02.9
2.84.13.64.3
3.24.33.8
Nonfarmbusinesssector
4.43.44.13.54.6
3.35.85.87.96.8
7.26.56.48.29.9
10.18.68.09.19.5
10.89.77.44.24.2
4.65.23.74.32.7
5.54.95.22.32.1
3.2
7.84.1462.0
132.\1J2.0
2.91.31.83.3
2.94.03.74.0
3.43.93.4
Real compensationper hour4
Busi-ness
sector
2.62.93.52.33.8
2.13.72.53.81.5
1.91.93.02.2
-1.2
1.12.91.31.3
-1.5
-2.4-.71.2.9.0
1.33.3.2.3
-2.0
.3
.62.1-.5-.6
.3
5.2.1
1 9-1.5
-1.C
!l-1.2
.8-1.8-1.7
.7
-.0.7
1.51.9
-.0.4
1.5
Nonfarmbusinesssector
2.72.43.02.23.3
1.72.82.73.51.3
1.42.03.11.9
-1.1
.92.71.41.4
-1.7
-2.4-.61.21.0-.1
1.03.3
.1
.1-2.1
.1
.72.1-.7-.5
.3
5.0.7
15-1.5
-1.6-.8-.1
-1.1
.9-1.2-1.9
1.0
.1
.61.61.6
.2
.11.1
Unit laborcosts
Busi-ness
sector
2.7.6
-.1-.2
.5
.32.73.34.56.6
5.92.12.95.3
11.2
6.84.95.88.2
10.0
11.07.48.1
2!0
3.02.64.04.01.9
4.94.21.72.31.4
3.0
-.11.355
-3.2
5.64.31.2
-1.8
4.6.2.1
2.8
5.62.62.15.0
1.13.13.8
Nonfarmbusinesssector
3.2.3
-.5.1.3
.32.34.04.36.7
5.72.32.94.9
11.6
7.24.96.37.7
10.3
11.28.58.2
2.5
3.62.54.03.72.1
5.04.21.92.11.5
2.95
1656
-3.7
5.24.0
-1
4.9.3.1
2.9
5.32.51.95.2
1.53.33.7
Vtittn**
Busi-ness
sector
1.31.0
.9
.71.0
1.72.62.83.84.3
4.64.53.45.29.0
9.85.15.97.88.6
9.09.05.93.73.2
2.82.22.73.54.2
4.03.92.42.52.2
2.3
2.81.9153.0
3.52.51.32.4
2.41.82.72.0
3.02.22.01.0
1.52.41.2
Nonfarmbusinesssector
1.1.9.8.9
1.2
1.52.33.33.94.2
4.54.62.93.6
10.0
10.65.66.46.98.6
9.89.66.43.43.1
3.42.22.63.44.2
4.24.12.42.52.3
2.2
3.02.11 43.2
3.82.11.22.5
2.52.22.91.9
3.02.01.7.9
1.42.11.1
1 Output refers to real gross domestic product originating in the sector.2 Hours at work of all persons engaged in the sector, including hours of proprietors and unpaid family workers. Estimates based primarilyon establishment data.3 Wages and salaries of employees plus employers' contributions for social insurance and private benefit plans. Also includes an estimateof wages, salaries, and supplemental payments for the self-employed.4 Hourly compensation divided by the consumer price index for all urban consumers.5 Current dollar output divided by the output index.
Note.—Percent changes are based on original data and may differ slightly from percent changes based on indexes in Table B-47.Source: Department of Labor, Bureau of Labor Statistics.
355
Digitized for FRASER http://fraser.stlouisfed.org/ Federal Reserve Bank of St. Louis

PRODUCTION AND BUSINESS ACTIVITY
TABLE B—49-—Industrial production indexes, major industry divisions, 1947—96[1987=100; monthly data seasonally adjusted]
Year or month
19471948194919501951195219531954195519561957195819591960196119621963196419651966196719681969197019711972197319741975197619771978197919801981198219831984198519861987198819891990199119921993199419951996*1995:Jan
FebMarAprMayJuneJulyAug .SeptOct ..NovDec
1996:JanFebMarAprMayJuneJulyAugSeptOct"NovDec/*
Totalindustrialproduction
22.723.622.325.828.029.131.629.933.735.135.633.337.338.138.441.644.047.051.756.357.560.763.561.462.268.373.872.766.372.478.282.685.784.185.781.984.992.894.495.3100.0104.4106.0106.0104.2107.7111.5118.1121.9125.8121.8121.7121.9121.4121.3121.4121.5122.7122.8122.2122.6122.8122.5124.2123.6124.5125.4126.4126.3126.9127.2127.1128.1129.1
Manufacturing
Total
21.222.020.824.226.127.229.627.731.332.532.930.634.535.235.338.440.743.548.252.653.656.659.156.457.363.368.967.961.167.473.377.880.978.880.376.680.989.391.694.3100.0104.7106.4106.1103.8108.2112.3119.7123.9128.0124.1123.9124.0123.5123.2123.3123.3124.2124.9124.4124.5124.8124.5126.2125.2126.5127.4128.5129.0129.2129.6129.5130.4131.8
Durable
19.920.818.923.025.927.531.127.431.332.432.628.532.833.332.736.338.741.447.152.352.955.557.753.353.159.366.264.856.762.668.773.978.375.777.472.776.888.491.893.9100.0106.6108.6107.4104.1109.3115.6125.8132.5139.9131.8132.1132.2131.6131.1131.5131.5133.2134.4133.5134.3134.8134.9137.5135.6138.3139.1141.1
141.5142.2142.3141.5142.8144.7
Nondurable
22.623.423.025.626.426.928.028.231.332.933.533.737.138.039.141.543.846.649.852.954.658.161.161.163.669.372.772.367.774.680.183.584.683.184.582.587.090.891.594.9100.0102.3103.7104.4103.4106.7108.6113.0114.3114.8115.6114.8115.1114.6114.4114.3114.3114.3114.4114.3113.7113.8113.1113.8113.6113.5114.4114.6115.2114.8115.6116.2116.7117.6
Mining
55.558.351.757.763.462.864.563.270.574.274.368.171.372.773.175.278.281.484.488.990.694.197.8100.497.899.9100.8100.398.098.9101.5104.6106.6110.0114.3109.3104.8111.9109.0101.0100.0101.3100.0102.0100.298.998.0100.399.9101.2100.6100.8100.3100.6100.5101.0100.7100.0100.098.298.398.197.198.0101.1100.4100.5102.8100.9102.7101.9102.0102.7104.0
Utilities
11.713.013.915.818.119.621.322.925.628.130.031.434.536.939.041.944.848.751.755.658.463.168.772.976.481.384.583.584.387.689.992.795.395.994.391.893.697.099.596.3100.0105.0108.7109.9112.3111.9116.3117.9122.0126.1117.3118.5119.2118.8122.1121.0122.7128.8122.7121.6125.4125.1125.6126.6128.0126.4128.4126.6122.6125.6125.4125.5128.4124.1
Source: Board of Governors of the Federal Reserve System.
356
Digitized for FRASER http://fraser.stlouisfed.org/ Federal Reserve Bank of St. Louis

TABLE B-50.—Industrial production indexes, market groupings, 1947-96[1987=100; monthly data seasonally adjusted]
Year or month
19471948194919501951195219531954195519561957195819591960196119621963 .19641965196619671968196919701971197219731974197519761977 ..1978197919801981198219831984198519861987198819891990199119921993199419951996 P1995: Jan
FebMarAprMay ...::: ::::::::::JuneJulyAug ....:: '"I"SeptOctNovDec
1996: JanFebMarAprMayJuneJulyAugSeptOct/>NOVA>Dec**
Totalindus-trialpro-duc-tion
22.723.622.325.828.029.131.629.933.735.135.633.337.338.138.441.644.047.051.756.357.560.763.561.462.268.373.872.766.372.478.282.685.784.185.781.984.992.894.495.3
100.0104.4106.0106.0104.2107.7111.5118.1121.9125.8121.8121.7121.9121.4121.3121.4121.5122.7122.8122.2122.6122.8122.5124.2123.6124.5125.4126.4126.3126.9127.2127.1128.1129.1
Final products
Total
20.821.520.923.525.427.329.127.629.831.632.531.034.035.135.438.440.642.947.151.653.756.358.156.056.561.365.965.761.866.271.676.179.080.082.180.883.091.094.295.7
100.0104.8106.8107.0105.4108.7112.71183121.4125.6120121.1121.5120.9120.6121.1121.2122.4122.6121.3121.9122.1121.9124.5123.4124.8125.1126.0126.7126.5126.8126.9128.2129.2
Consumer goods
Total
25.426.226.129.729.430.131.931.735.436.737.637.240.942.443.346.248.851.555.558.459.863.465.865.068.874.377.675.272.379.485.188.487.385.385.884.588.892.893.796.8
100.0102.9104.0103.4103.0106.0109.5113.7115.1116.4115.5114.9115.3114.4114.1114.8114.6115.9116.0114.9115.9115.7114.6116.6115.3115.9116.3116.8117.3116.5116.8116.7118.2118.7
Auto-motiveprod-ucts
21.722.622.528.325.022.528.426.535.228.930.324.130.234.631.638.341.943.954.153.947.456.456.747.760.865.672.462.659.073.284.086.378.559.559.257.571.986.692.795.3
100.0106.4108.2100.791.1
100.9115.1130.8130.7131.7134.4135.3134.4131.7127.1129.1125.3130.7132.9128.5130.5132.8125.9133.1120.3133.5134.1138.4143.4137.5135.8128.4135.2135.9
Otherdura-
blegoods
22.823.822.030.426.226.229.627.332.233.933.231.336.036.237.340.543.747.754.159.660.464.769.066.970.881.085.779.369.878.287.491.289.885.186.378.186.294.690.693.9
100.0103.0105.2103.6100.3104.9111.8118.5118.6119.0120.8120.4118.6119.0116.7116.3118.1118.1119.6118.9119.9120.5115.5118.1118.5118.5119.3123.4120.5118.7117.7117.2117.3121.8
Non-durablegoods
27.027.727.930.331.332.633.533.936.538.840.141.344.145.547.049.251.454.056.359.062.064.566.767.869.774.276.576.574.980.484.487.887.789.189.689.791.993.494.497.6
100.0102.4103.2103.8105.0106.9108.6111.2112.9114.4112.7111.9112.7111.8112.4113.1113.0113.9113.7112.9113.8113.2113.3114.5114.4113.6114.0113.5114.0113.8114.6115.4116.4116.4
Equipment
Total >
15.015.814.115.321.225.527.624.224.727.128.225.227.728.528.131.333.135.039.646.149.050.451.848.145.049.355.056.852.053.858.864.271.074.678.277.076.889.294.894.5
100.0107.6110.9112.1108.8112.5117.5125.3131.4140.5130.4131.0131.4131.3130.8131.2131.6132.9133.1131.5131.4132.3133.7137.3136.5139.2139.2140.8142.0142.8143.2143.4144.7146.3
Busi-ness
14.715.313.414.317.519.820.618.119.622.723.619.922.423.022.324.325.528.532.637.838.640.342.941.339.344.852.454.748.850.656.763.171.573.576.172.971.985.491.193.1
100.0110.7115.5116.9115.9123.4131.8144.91.55.7168.5153.2154.3155.1155.0154.3155.1155.7157.5158.2156.5156.9158.4160.5164.8162.7166.3166.0168.6170.3171.1172.0172.5174.6176.6
De-fenseand
space
7.58.89.2
10.826.537.244.639.335.935.136.736.838.839.940.646.950.649.054.363.772.772.969.458.752.851.350.149.448.549.249.249.551.557.458.565.771.878.989.496.0
100.099.7
100.198.890.884.879.371.965.963.968.968.267.867.166.866.866.566.165.264.462.962.061.663.164.264.064.363.764.565.064.764.163.563.8
Inter-mediate
prod-ucts
22.423.622.426.127.427.229.129.032.934.434.433.637.137.438.140.442.745.548.451.453.556.659.658.760.567.671.969.462.669.074.979.181.277.077.075.180.386.288.391.9
100.0101.8102.0101.296.899.3
101.8107.3109.0110.7109.5109.5109.2108.2108.2108.2108.5109.4109.5109.2109.3110.1108.5109.3109.6108.6110.1111.3109.9111.2111.9111.8112.7113.0
Materials
Total
25.126.223.928.631.632.135.632.938.939.939.935.941.442.042.045.848.752.658.763.963.367.571.569.070.077.284.582.872.681.287.391.895.491.392.885.188.396.696.695.9
100.0105.0106.7106.8105.5109.7113.8122.0127.4131.8127.1127.1127.2127.0127.2126.8126.8128.1128.1128.1128.4128.4128.5129.4129.1130.3131.6132.6132.1133.5133.4133.1133.8135.1
Dura-ble
21.522.119.824.928.328.933.829.235.735.835.830.135.936.335.539.442.145.952.657.955.959.262.356.556.864.273.371.259.368.475.381.485.379.382.173.479.292.192.993.7
100.0106.8108.4107.6105.6112.8120.1132.3141.5149.7140.0140.2140.3139.8139.8139.7140.2142.3144.1143.9145.3144.8145.8147.3145.5147.3148.8150.5150.3152.3152.0151.4151.8154.2
Non-dur-able
25.228.930.230.129.934.234.836.239.241.645.249.653.654.559.964.965.268.074.980.480.871.981.486.789.792.988.790.582.189.293.091.794.4
100.0104.4107.1108.0106.6110.1111.6118.0119.8119.2122.2121.5121.5121.7122.2120.4118.9118.8117.8118.7116.6117.4115.7116.1116.3118.8120.0120.1121.1119.9120.4120.3121.3122.1
Ener-gy
52.759.362.763.458.862.363.163.665.869.772.575.880.683.487.291.796.297.1
100.8101.598.896.799.0
101.1102.2105.0106.2104.3100.798.9
103.8103.499.5
100.0102.2103.1104.2104.4103.7103.5105.3106.6107.8106.2106.4106.4106.6107.2107.2107.5108.5105.8105.5105.7106.0105.9106.1108.2107.0108.1108.7106.3108.4108.2108.5109.7109.1
1 Two components—oil and gas well drilling and manufactured homes—are included in total equipment, but not in detail shown.Source: Board of Governors of the Federal Reserve System.
357
Digitized for FRASER http://fraser.stlouisfed.org/ Federal Reserve Bank of St. Louis

TABLE B-51.—Industrial production indexes, selected manufactures, 1947-96
[1987=100; monthly data seasonally adjusted]
Year or month
19471948194919501951195219531954195519561957195819591960196119621963196419651966196719681969197019711972197319741975197619771978197919801981198219831984198519861987198819891990199119921993199419951996*1995- Jan
FebMarAprMayJuneJulyAugSeptOctNovDec
1996JanFebMarAprMayJuneJulyAugsept .::.:...Oct/>NOVPDeep
Durable manufactures
Primarymetals
Total
70.273.061.477.384.176.887.070.491.590.987.169.080.780.478.984.691.2
102.9113.2120.2111.1115.1123.8115.2109.2122.4138.9134.5107.2119.9121.5130.7133.0110.8117.583.291.0
102.4101.8
93.7100.0108.7107.2106.5
98.6101.9107.7116.4119.2119.8121.5120.8121.3120.2119.5117.5118.3115.4121.0115.7120.8120.0121.5117.1118.0119.2118.6121.0118.6120.1120.9124.0118.3121.8
Ironandsteel
102.1106.891.2
112.4125.7110.6127.599.1
131.8129.3124.693.9
108.1109.9104.9109.3119.1135.5148.7153.1141.5146.1159.2148.2135.5150.6171.5166.1133.5147.1145.1155.3156.5126.0135.186.296.1
105.9104.590.8
100.0112.7111.2111.5100.5104.7111.9119.3122.4123.8125.5124.9125.8123.5123.0119.2119.3117.7127.0115.1126.1122.7128.1119.5120.2122.9121.0124.2122.8124.1123.6129.8122.9126.6
Fabri-catedmetalprod-ucts
37.538.234.442.245.144.049.644.751.051.853.147.653.453.452.156.758.562.168.373.176.580.681.975.975.682.992.188.476.784.992.796.299.592.591.183.285.593.394.593.8
100.0104.2102.899.594.599.0
103.1110.5113.9117.1114.3115.0114.3112.3113.7113.7112.4114.3115.1114.0114.5115.0115.6117.0116.1115.5116.7117.3117.2118.1117.9117.5118.3119.0
Indus-trialma-
chineryand
equip-ment
12.012.110.311.614.716.016.714.215.617.917.915.017.517.617.119.220.523.326.230.531.131.333.932.830.535.441.444.138.140.045.150.256.960.665.963.964.380.886.890.3
100.0113.0117.3117.6114.7124.0138.1157.7177.8205.4171.4171.8172.4174.3174.6174.4176.0179.5181.3183.8186.5190.1191.9196.1197.8199.0201.2205.2205.8210.5211.3212.3214.9218.4
Electri-cal
machin-ery
8.58.88.3
11.311.413.014.913.315.316.516.415.018.219.821.024.124.826.231.337.537.739.842.340.540.746.553.052.445.150.758.464.071.373.375.475.980.394.193.194.3
100.0108.5111.0111.4113.9123.5134.1154.3174.9189.0166.7167.7169.4169.6171.1173.0175.7178.7180.8182.4183.6182.8182.4188.7187.9187.3188.8191.0190.1190.2190.2189.3189.9193.5
Transportationequipment
Total
19.621.421.525.728.733.341.836.441.940.643.534.338.940.337.843.748.049.258.562.761.366.666.155.560.164.173.066.459.768.073.779.581.072.368.764.872.783.191.896.9
100.0105.2109.6107.0101.1104.8109.2115.3113.3114.0117.8118.5118.0115.7113.2113.4111.6114.1114.1109.3108.6109.7108.3112.1103.1114.6114.6116.6120.3118.7117.9113.8118.4119.3
Motorvehicles
andparts
27.329.630.439.035.830.738.733.344.636.238.028.036.441.136.043.948.649.963.762.655.166.066.353.366.973.085.073.462.281.994.799.291.067.064.458.874.590.699.098.5
100.0105.7106.9101.094.4
107.4122.9141.2141.9141.6147.3148.4147.6143.0138.8139.7136.7142.1143.3139.7140.7141.2135.5141.1121.3144.3144.7148.7154.5150.3148.0138.0146.3147.0
Lum-berand
prod-ucts
38.840.435.743.443.242.745.144.850.149.545.446.152.349.351.654.456.961.163.565.965.367.267.166.768.578.478.771.466.575.682.383.682.476.974.767.379.986.088.095.1
100.0100.199.497.190.295.297.1
104.0104.5107.5107.1105.0103.9103.9101.7103.0103.7103.7106.2105.7104.8106.9103.1103.3107.5108.4107.7110.6107.4109.0108.3107.3108.0107.9
Nondurable manufactures
Apparelprod-ucts
43.145.044.547.947.049.550.149.554.756.055.854.359.760.961.363.866.468.772.674.574.176.078.475.376.280.981.577.971.183.991.693.989.089.291.090.193.895.792.696.3
100.098.195.092.292.795.097.1
100.195.790.1
100.699.899.397.497.595.594.894.594.593.392.491.589.290.989.790.490.890.990.190.690.190.089.490.1
Textilemill
prod-ucts
35.237.734.839.639.238.939.937.342.543.741.641.146.445.646.950.151.956.061.064.764.872.376.074.478.586.089.681.577.786.391.692.095.092.189.483.093.293.789.793.9
100.098.6
100.397.196.5
104.0109.9113.5112.6109.3117.2115.9116.2117.2113.6110.4109.9112.4110.5111.1108.9108.3104.1106.2109.0108.2108.8111.1112.4110.1109.6110.3111.5112.5
Printingand
publish-ing
22.123.223.824.925.425.326.527.630.332.333.432.634.836.236.437.739.742.144.848.350.951.754.252.753.256.758.357.453.758.764.368.169.970.372.175.279.084.587.690.6
100.0100.9101.1100.8
97.098.198.8
100.199.498.1
100.1100.399.399.299.098.699.0
100.599.898.999.398.897.998.796.796.397.797.297.297.498.299.2
100.0100.0
Chem-icalsand
prod-ucts
8.79.49.3
11.613.113.714.815.017.618.919.920.624.024.926.129.031.734.838.742.244.249.653.755.959.566.973.175.869.177.383.388.091.387.889.281.887.591.491.494.6
100.0106.0109.2111.8110.5114.4115.4121.3125.0129.1126.2124.7125.0123.5124.0124.4124.0124.4125.3126.7126.0126.5127.1127.1126.5126.0127.7128.1129.7129.2130.7132.3132.5132.6
Foods
33.132.833.134.335.035.736.437.239.341.542.243.245.446.647.949.551.253.654.856.959.461.063.064.066.069.570.971.971.475.579.081.882.684.686.587.790.192.194.997.4
100.0101.5102.5103.7105.3106.9109.5113.2115.3115.9115.9114.2115.0115.1115.9116.1115.3115.5115.5115.4114.8114.8114.8116.0115.6115.4115.6115.1115.8114.6115.5116.5116.9118.3
Source: Board of Governors of the Federal Reserve System.
358
Digitized for FRASER http://fraser.stlouisfed.org/ Federal Reserve Bank of St. Louis

TABLE B-52.—Capacity utilization rates, 1948-96
[Percent-1 monthly data seasonally adjusted]
Year or month
19481949195019511952195319541955195619571958195919601961196219631964196519661967196819691970197119721973197419751976 .197719781979198019811982198319841985 . . . .19861987198819891990199119921993199419951996*1995-Jan
FebMarAprMayJune . ..Ju lyAuesept:..:.:::::..::OctNovDec
1996- JanFebMarAprMay .: ::TJuneJulyAugSeptOct/'NovDec*
Totalindustry
86486.886980.879284.388484274679383385.586.282.180975.075881.180379.281.583783782179.280381.483983883.285184.784684083.783583.383983.483083.483.882483.382.683083.383.783.483583483.083.483.8
Total
82.574282.885.885489380187086.183675.081680177.381483.585689.591 187.287.286.879.778283.788183.873278.582885.185.480.278.872.874.980.479.579.181.683683281378.079580.683383082.184684.284083482.882782.482782.381982.282.881482.381.381982.182.682.582482381.982.282.8
Durablegoods
87.186.886.376.774380.987582.770275.480383.584.978.676669.070.578.377.876.278.681981.679175.076979.182.682782.084484.283.883082.382181.782482.281381.682.281.382.580.982182.182.982.682682281.381.682.2
Manufacturing
Non-durablegoods
86386.686682.982886.687584076481885286285.181.481078.081 183.181983.085685985.384081.682582.384083382.284984.284.283783.583383.183082.482783.083.581.481.981.681.582.082.082.382082.482.783.083.5
Primaryprocessing
87376288590.284989480692089484775483079877981583887891091485486.386980.479386491586072980184086386.478.078069.074880.479880.984986986284179.882484.187987486.189789.388988287.887086.786286.786686.186.985.484.985.385586.186.886.686686786.686.186.9
Advancedprocessing
80073279883.485989380084284483 174981 180577281683484688891 188087.486579177482586582873577881984384.881379174.674980.379478.380182282080177.278279.081381 180.582582.081981380.880880.681280.580080.681.179781.179.680480.580.880.880680580.080.681.1
Mining
81283.586.688.987490.492592.589990.090991.391.994.094686579984.482978.279984185488487486987.089689390.589890.089689989.790290.089391.291291.993.086.887.690.389.789.891.990.391991291.391.993.0
Utilities
93.494.195.895.493994.692986.884084.884684.885.985.582.879.580.382.583.580.282.084286.085.785.884787.087.790392.287.388.288.688290.689.790.895.391.491.493.490.292.493.194.092.794.192.689.691.691.491.493.490.2
1 Output as percent of capacity.Source: Board of Governors of the Federal Reserve System.
359
Digitized for FRASER http://fraser.stlouisfed.org/ Federal Reserve Bank of St. Louis

TABLE B-53.—New construction activity, 1959-96
[Value put in place, billions of dollars; monthly data at seasonally adjusted annual rates]
Year or month
19591960196119621963
New series19641965196619671968196919701971197219731974197519761977197819791980198119821983 . .19841985 . . . . .1986198719881989199019911992 . . . .1993199419951995- Jan
FebMarAprMayJuneJulyAugy
SeptOctNovDec
1996- JanFebMarAprBay .:..:.::::::June
JulyAueSept ". ".Oct>Nov/>
Totalnew
construc-tion
55.454.756.460.264.8
75.181.985.887.296.8
104.9105.9122.4139.1153.8155.2152.6172.1200.5239.9272.9273.9289.1279.3311.6369.0401.4429.9441.6455.6469.8468.5424.2452.1482.7527.1547.1542.7545.5547.9549.3541.5545.1545.0542.3550.5550.0549.7555.7559.0544.6557.0564.6558.5563.1559.3564.7572.3581.0592.0
Private construction
Total
39.338.939.342.345.5
54.960.061.961.869.477.278.092.7
109.1121.4117.0109.3128.2157.4189.7216.2210.3224.4216.3248.1298.8323.6345.3351.0360.9371.6361.1314.1336.2362.6400.0410.2411.1414.9413.2410.8405.5406.8409.4405.9411.3410.6411.0417.2418.9411.2419.7424.2418.1423.1419.3426.7428.4434.3441.6
Residentialbuildings1
Total2
24.323.023.125.227.9
30.530.228.628.734.237.235.948.560.765.156.051.668.392.0
109.8116.4100.499.284.7
125.5153.8158.5187.1194.7198.1196.6182.9157.8187.8210.5238.9236.6242.5240.5237.8234.2232.5231.1231.3234.5237.7238.0239.9243.1242.5238.6245.9248.0247.5246.9244.9246.0246.4244.6247.6
Newhousing
units
19.217.317.119.421.7
24.123.821.821.526.729.227.138.750.154.643.436.350.872.285.689.369.669.457.094.6
113.8114.7133.2139.9138.9139.2128.0110.6129.6144.1167.9162.9169.2167.4163.8159.9157.6155.9158.3161.8164.3165.8166.4168.1169.2166.9173.8179.3178.2177.7175.6176.5176.2175.6176.3
Nonresidential buildings and otherconstruction '
Total
15.115.916.217.217.6
24.429.733.333.135.239.942.144.248.456.361.157.859.965.479.999.8
109.9125.1131.6122.6144.9165.1158.2156.3162.8175.1178.2156.2148.4152.1161.1173.6168.6174.4175.4176.6173.0175.7178.1171.4173.7172.6171.1174.1176.4172.7173.8176.2170.6176.2174.4180.7182.0189.7194.1
Com-mer-cial3
3.94.24.75.15.0
7.99.49.49.3
10.412.513.015.318.821.721.717.217.019.724.734.041.748.753.953.471.688.184.083.286.489.285.862.253.257.964.474.770.773.176.273.773.375.577.874.875.074.675.376.976.876.775.877.875.880.478.983.982.786.588.9
Indus-trial
2.12.92.82.82.9
5.07.29.38.48.59.69.37.86.79.0
11.511.710.511.316.222.020.525.426.119.520.924.121.021.223.228.833.631.429.026.528.932.330.132.232.134.333.632.733.131.832.431.432.032.032.530.830.630.327.328.828.827.129.733.030.9
Other4
9.08.98.79.29.7
11.513.114.615.416.317.819.821.122.925.627.928.932.434.539.043.747.751.051.649.852.452.953.252.053.257.158.862.666.267.767.866.667.869.167.168.666.167.567.364.866.266.663.865.267.165.267.468.267.567.066.769.769.670.274.2
Public construction
Total
16.115.917.117.919.4
20.221.923.825.427.427.827.929.730.032.338.143.344.043.150.156.663.664.763.163.570.277.884.690.694.798.2
107.5110.1115.8120.2127.1136.9131.6130.6134.7138.5136.1138.3135.6136.4139.1139.4138.7138.5140.1133.3137.3140.4140.4140.0140.0138.0143.9146.7150.3
Federal
3.73.63.93.94.0
3.73.93.83.33.23.23.13.84.24.75.16.16.87.18.18.69.6
10.410.010.611.212.012.414.112.312.212.112.814.414.414.415.715.915.816.415.616.115.415.416.216.713.715.915.415.716.315.214.715.015.014.513.514.616.214.8
State andlocal5
12.312.213.314.015.4
16.518.020.022.124.224.624.825.925.827.633.037.237.236.042.048.154.054.353.152.959.065.872.276.682.586.095.497.3
101.5105.7112.7121.1115.7114.9118.3122.9120.0123.0120.2120.3122.4125.7122.8123.1124.4117.1122.0125.7125.4125.0125.5124.5129.3130.5135.6
1 Beginning 1960, farm residential buildings included in residential buildings; prior to 1960, included in nonresidential buildings and otherconstruction.2 Includes residential improvements, not shown separately. Prior to 1964, also includes nonhousekeeping units (hotels, motels, etc.).3 Office buildings, warehouses, stores, restaurants, garages, etc., and, beginning 1964, hotels and motels; prior to 1964 hotels and motelsare included in total residential.4 Religious, educational, hospital and institutional, miscellaneous nonresidential, farm (see also footnote 1), public utilities (telecommuni-cations, gas, electric, railroad, and petroleum pipelines), and all other private.
Includes Federal grants-in-aid for State and local projects.Source: Department of Commerce, Bureau of the Census.
360
Digitized for FRASER http://fraser.stlouisfed.org/ Federal Reserve Bank of St. Louis
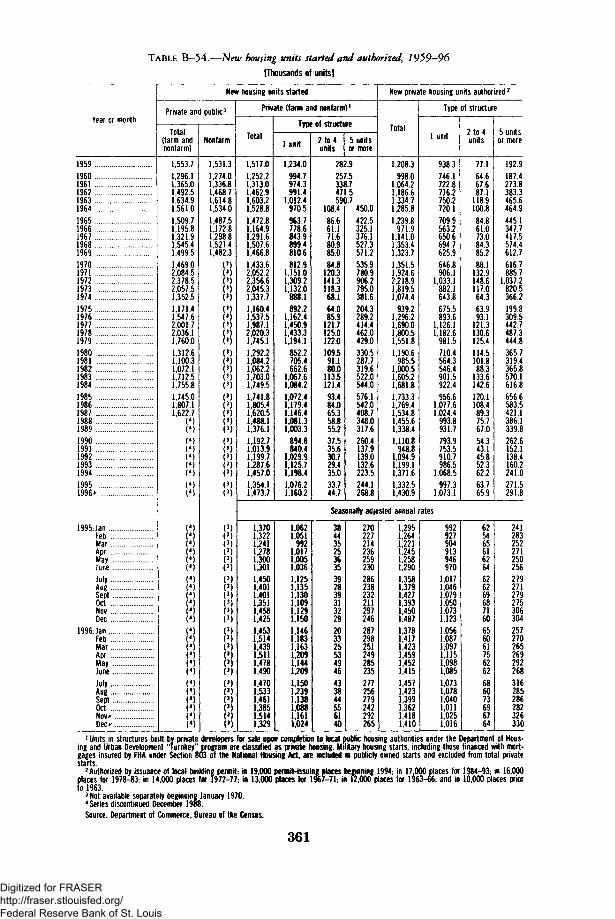
TABLE B-54.—New bousing units started and authorized, 1959-96[Thousands of units]
Year or month
19591960196119621963196419651966196719681969197019711972197319741975197619771978197919801981198219831984198519861987198819891990199119921993199419951996*>
1995:JanFebMarAprMayJuneJulyAugSept . .OctNovDec
1996 JanFebMarApr .MayJuneJulyAugSeptOctNovDec**
New housing units started
Private and public l
Total(farm andnonfarm)
1,553.71,296.11,365.01,492.51,634.91,561.01,509.71,195.81,321.91,545.41,499.51,469.02.084.52,378.52,057.51,352.51,171.41,547.62,001.72,036.11,760.01,312.61,100.31,072.11,712.51,755.81,745.01,807.11,622.7
))
(
Nonfarm
1,531.31,274.01,336.81,468.71,614.81,534.01,487.51,172.81,298.81,521.41,482.3
(3)(3)(3)(3)(3)(3)(3)(3)(3)(3)(3)(3)(3)(3)(3)(3)(3)(3)(3
(3
(3
(3
(3
(3
(3
(3
(3
(3
(3
(3
(3
(3
(3)(3)(3)(3)(3)(3)(3)(3)(3)(3)(3)(3)(3)(3)(3)(3)(3)(3)(3)
Private (farm and nonfarm) '
Total
1,517.01,252.21,313.01,462.91,603.21,528.81,472.81,164.91.291.61.507.61,466.81,433.62,052.22,356.62,045.31,337.71,160.41,537.51,987.12,020.31,745.11,292.21,084.21,062.21,703.01.749.51,741.81,805.41,620.51,488.11,376.11,192.71,013.91,199.71.287.61,457.01.354.11,473.7
Type of structure
1 unit
1,234.0994.7974.3991.4
1.012.4970.5963.7778.6843.9899.4810.6812.9
1,151.01,309.21,132.0
888.1892.2
1.162.41,450.91,433.31,194.1
852.2705.4662.6
1,067.61,084.21,072.41,179.41.146.41,081.31,003.3
894.8840.4
1,029.91,125.71,198.41,076.21.160.2
2 to 4units
28:253314759<
108.486.661.171.680.985.084.8
120.3141.3118368.164.085.9
121.7125.0122.0109591.180.0
113.5121.493.484.065.358.855.237.535.630.729.435.033.744.7
5 unitsor more
?.9f.5J.7.5
).7450.0422.5325.1376.1527.3571.2535.9780.9906.2795.0381.6204.3289.2414.4462.0429.0330.5287.7319.6522.0544.0576.1542.0408.7348.0317.6260.4137.9139.0132.6223.5244.1268.8
New private housing units authorized2
Total
1,208.3998.0
1,064.21,186.61,334.71,285.81,239.8
971.91,141.01,353.41,323.71,351.51,924.62,218.91,819.51,074.4
939.21,296.21,690.01,800.51,551.81,190.6
985.51,000.51,605.21,681.81,733.31,769.41,534.81,455.61,338.41,110.8
948.81,094.91,199.11,371.61,332.51,430.9
Type of structure
1 unit
938.3746.1722.8716.2750.2720.1709.9563.2650.6694.7625.9646.8906.1
1,033.1882.1643.8675.5893.6
1,126.11,182.6
981.5710.4564.3546.4901.5922.4956.6
1,077.61,024.4
993.8931.7793.9753.5910.7986.5
1,068.5997.3
1,073.1
2 to 4units
77.164.667.687.1
118.9100.884.861.073.084.385.288.1
132.9148.6117.064.363.993.1
121.3130.6125.4114.5101.888.3
133.6142.6120.1108.489.375.767.054.343.145.852.362.263.765.9
5 unitsor more
192.9187.4273.8383.3465.6464.9445.1347.7417.5574.4612.7616.7885.7
1,037.2820.5366.2199.8309.5442.7487.3444.8365.7319.4365.8570.1616.8656.6583.5421.1386.1339.8262.6152.1138.4160.2241.0271.5291.8
Seasonally adjusted annual rates
1,3701,3221,2411,2781.300U011,4501,4011,4011,3511,4581,4251,4531,5141,4391,5111.4781,4901.4701,5331,4611,3851,514U29
1,0621,051
9921.0171,0051,0361,1251,1351,1301,1091.1291.1501.1461.1831,1631,2091,1441.2091.1501.2391.1381.0881.1611,024
384435253635392839313229203325534946433844556140
270227214236259230286238232211297246287298251249285235277256279242292265
1,2951,2641,2211,2451,2581,2901,3581,3791,4271,3931,4501.4871,3781,4171,4231,4591,4521,4151,4571,4231,3991,3621,4181,410
992927904913946970
1,0171,0461,0791,0501,0731,1231,0561,0871,0971,1151,0981,0851,0731,0781,0401,0111,0251,016
625465616264626269687160656061756262686073696764
241283252271250256279271279275306304257270265269292268316285286282326330
1 Units in structures built by private developers for sale upon completion to local public housing authorities under the Department of Hous-ing and Urban Development "turnkey" program are classified as private housing. Military housing starts, including those financed with mort-gages insured by FHA under Section 803 of the National Housing Act, are included in publicly owned starts and excluded from total privatestarts.2 Authorized by issuance of local building permit.- in 19,000 permit-issuing places beginning 1994; in 17,000 places for 1984-93; in 16,000places for 1978-83; in 14,000 places for 1972-77-, in 13.000 places for 1967-71. in 12.000 places for 1963-66; and in 10,000 places priorto 1963.3 Not available separately beginning January 1970.
4 Series discontinued December 1988.Source: Department of Commerce, Bureau of the Census.
361
Digitized for FRASER http://fraser.stlouisfed.org/ Federal Reserve Bank of St. Louis

TABLE B-55.—Manufacturing and trade sales and inventories, 1954-96
[Amounts in millions of dollars; monthly data seasonally adjusted]
Year or month
1954195519561957195819591960196119621963196419651966196719681969197019711972197319741975197619771978197919801981198219831984198519861987198819891990199119921993199419951995:Jan
FebMarAprMayJuneJulyAugSeptOctNovDec
1996JanFebMarAprMayJuneJulyAugSeptOct"Nov»
Total manufacturing andtrade
Sales1
46,44351,69454,06355,87954,20159,72960,82761,15965,66268,99573,68280,28387,18790,82098,685105,690108,221116,895131,081153,677177,912182,198204,150229,513260,320297,701327,233355,822347,625369,2864101244221583430419457>35497 157527,039545,909542,815567 176595,240637 561679,700670,780670,696671,939670,826676,690681,343677,107685,051686,522685,638690,263695,490690,692699,208700,253709,541715,130711,760719,176717,532722,691725,787729,830
Inven-tories2
73,17579,51687,30489,05287,05592,09794,71995,580101,049105,463111,504120,929136,824145,681156,611170,400178,594188,991203,227234,406287,144288,992318,345350,706400,931452,640508,924545,786573,908590,287649 780664,039662 738709',846767 226815,486840,428834,281842 137874,515931 7029891839942,318948,860957,242965,376969,908973,914977,485981,703985,988991,142993,148989,839995,352996,008994,010998,430996,984997,322
1,002,4041,005,4351,006,4301,011,2611,011,955
Ratio3
1.601.471.551.591.611.541.561.561.541.531.511.511.571.601.591.611.651.621.551.531.611.591.561.531.541.521.561.531.671.561531.561 551.501491.521.521.531 481.451411.431.401.411.421.441.431.431.441.431.441.451.441.421.441.421.421.411.391.401.391.401.391.391.39
Manufac-turing
Sales1
23,35526,48027,74028,73627,24830,28630,87830,92233,35835,05837,33140,99544,87046,48650.22953,50152,80555,90663,02772.93184,79086,58998,797113,201126.905143,936154,391168129163,351172.5471906821941538194657206̂ 326224619236,698242,686239,847250394260,635278 652297̂ 44294,398294,205295,537293,156295,251296,877293,901299,808300,754299,824300,755301,284298,685301,763300.646308.003311,203308,851312.400312,847315.160315,510318,280
Inven-tories2
41,61245,06950,64251,87150,20352,91353.78654,87158.17260.02963.41068,20777,98684.64690,56098.145101,599102.567108.121124.499157.625159.708174.636188.378211,691242,157265,215283413311852312,379339516334,749322654338.107369 378391.243405.105390.944382480390.721406 207432,344410,341413,574416,681419,978422,807424.293426.722427,245429.959431.303431,652432,344434,724435,615435,413435,441434,220433,868434,446435.687436,700438,134439.889
Ratio3
1.811.621.731.801.841.751.741.771.741.711.701.661.741.821.801.831.921.831.721.711.861.841.771.661.671.681.721691.951.781 731.731681.591581.631.651.651 541.491431.431.391.411.411.431.431.431.451.431.431.441.441.441.461.441.451.411.401.401.391.391.391.391.38
Merchantwholesalers
Sales1
8,9939,89310,51310,47510,25711,49111,65611,98812,67413,38214,52915,61116,98719,57621,01222,81824.16726,49229,86638,11547,98246.63450,69856,13666,41379,05193,099101 18095,21199.2251121991131459114960122̂ 68134521143|760149,506148,306154.150161,681172973187!387183.285185,456183,828185,298186,946188,359187,591188,162189,171189,589191,349194,901192,878194.053195,379197,507198,258198,543202,057200,086201,404202,790204,578
Inven-tories2
10,63711,67813,26012.73012.73913.87914,12014.48814,93616,04817,00018,31720,76525,78627,16629,80033,35436,56840,29746,91858,66757,77464.62273,17986,93499,679122,631129,654127,428130,075142452147,409153 5741631903178801187I009195,550200,062207,663215,878234 893254̂ 16237,628239,785243,169245,596246,823249,252251,179252,078253,245254,563254,686254,616256,258255,569256,444259,592258,834259,262259,100258,822256,959257,770258,015
Ratio3
1.181.131.191.231.241.211.211.211.181.201.171.171.221.321.291.311.381.381.351.231.221.241.271.301.311.261.321.281.361.281 231.281321.291301.281.291.331.321.311301.321.301.291.321.331.321.321.341.341.341.341.331.311.331.321.311.311.311.311.281.291.281.271.26
Retailtrade
Sales1
14,09515,32115,81116,66716,69617,95118,29418,24919,63020,55621,82323,67725,33024,75727,44529,37131,24934,49738,18942,63145,14148,97554,65560,17667,00274,71379,7438651489,06297,514107 243114,586120803128>4J138017146,581153,718154,661162,632172,924185 936195,068193,097191,035192,574192,372194,493196,107195,615197,081196,597196,225198,159199,305199,129203,392204,228204,031205,669204,366204,719204,599206,127207,487206,972
Inven-tories2
20,92622,76923,40224,45124,11325,30526,81326,22127,94129,38631,09434,40538,07335,24938,88542,45543,64149,85654,80962,98970,85271,51079,08789,149102,306110,804121,078132719134,628147,833167812181,881186510207,836219047237,234239,773243,275251 994267,916290 602302,879294,349295,501297,392299,802300,278300,369299,584302,380302,784305,276306,810302,879304,370304,824302,153303,397303,930304,192308,858310,926312,771315,357314,051
Ratio3
1.511.431.471.441.441.411.471.441.421.431.421.451.501.421.421.451.401.451.441.481.571.461.451.481.531.481.521 531.491.441491.521 561.551 541.581.551.541 521.511 501.541.521.551.541.561.541.531.531.531.541.561.551.521.531.501.481.491.481.491.511.521.521.521.52
1 Annual data are averages of monthly not seasonally adjusted figures.2 Seasonally adjusted, end of period. Inventories beginning January 1982 for manufacturing and December 1980 for wholesale and retail
trade are not comparable with earlier periods.3 Inventory/sales ratio. Annual data are: beginning 1982, averages of monthly ratios; for 1958-81, ratio of December inventories to monthly
average sales for the year; and for earlier years, weighted averages. Monthly data are ratio of inventories at end of month to sales formonth.
Note.—Earlier data are not strictly comparable with data beginning 1958 for manufacturing and beginning 1967 for wholesale and retailtrade.
Source: Department of Commerce, Bureau of the Census.
362
Digitized for FRASER http://fraser.stlouisfed.org/ Federal Reserve Bank of St. Louis

TABLE B-56.—Manufacturers' shipments and inventories, 1954-96[Millions of dollars; monthly data seasonally adjusted]
Year or month
1954195519561957195819591960196119621963196419651966 .1967196819691970197119721973197419751976 -.19771978197919801981198219831984198519861987198819891990199119921993199419951995Jan
FebMarAprMayJuneJulyAugSeptOctNovDec
1996:JanFebMarAprMayJune
juiyAugSept .Oct/>Nov
Shipments1
Total
23,35526,48027,74028,73627,24830,28630,87830,92233,35835,05837,33140,99544,87046,48650,22953,50152,80555,90663,02772,93184,79086,58998,797113,201126,905143,936154,391168,129163,351172,547190,682194,538194,657206,326224,619236,698242,686239,847250,394260,635278,652297,244294,398294,205295,537293,156295,251296,877
293,901299,808300,754299,824300,755301,284298,685301,763300,646308,003311,203308,851312,400312,847315,160315,510318,280
Durablegoodsindus-tries
11,82814,07114,71515,23713,55315,597
15,87015,60117,24718,25519,61122,19324,61725,23327,62429,40328,15629,92433,98739,63544,17343,59850,62359,16867,73175,92777,41983,72779,21285,48197,940101,279103,238108,128118,458123,158123,776121,000128,489135,886148,916159,215158,022157,154158,816156,190157,307158,768156,108160,625162,281160,706161,360161,976159,125161,918160,377164,615167,487166,902167,774168,471170,705168,824170,846
Nondur-ablegoodsindus-tries
11,52712,40913.02513,49913,69514,68915.00815.32116.11116,80317,72018,80220,25321,25322,60524,09824,64925,98229,04033,29640,61742,99148,17454,03359,17468,00976,97284,40284,13987,06692,74293,25991,41998,198106,161113,540118,910118,847121,905124,749129,736138.029136,376137,051136,721136,966137,944138,109137,793139,183138,473139,118139,395139,308139,560139,845140,269143,388143,716141,949144,626144,376144,455146,686147,434
Inventories2
Total
41,61245,06950,64251,87150,20352,91353,78654,87158,17260,02963,41068,20777,98684,64690,56098,145101,599102,567108,121124,499157,625159,708174,636188,378211,691242,157265,215283,413311,852312,379339,516334,749322,654338,107369,378391,243405,105390,944382,480390,721406,207432.344410,341413,574416,681419,978422,807424,293426,722427,245429,959431,303431,652432,344434,724435,615435,413435,441434,220433,868434,446435,687436,700438,134439,889
Durable goods industries
Total
23,71026,40530,44731,72830,19432,01232,33732,49634,56535,77638,42142,18949,85254,89658,73264,59866,65166,13670,06781,192101,493102.590111.988120,877138,181160,734174,788186,443200.444199.854221.330218,193211.997220,778242.450257,513263,213250,006238,096243,476254,798270.356257.042258.570260,259262,231263,922264,343266,482266,987268,267269,971270,389270,356272,657273.400273,535273,870273,857273.649274,807275.926276.347277.328278.368
Mate-rialsand
supplies
7,8949,19410.41710.6089.97010,70910.30610,24610.79411.05311.94613.29815.46416.42317.34418,63619,14919,67920.80725.94435.07033.90337.45740.18645,19852.67055.17357.99859.13660,32566,03163,90461.33163.54669,59072.41873,54170.81169,38372,87278,27883.25178.28679,19979,45580,29180,77681,14581.87982.47282,54683,76283.61483,25183,99884.36484,27284,28583,81082.81783,56783.25083.37382,58582.580
Workin
proc-ess
9,72110.75612,31712,83712,40813,08612,80913,21114,12414,83516,15818,05521,90824,93327.21330,28229.74528,55030.71335,49042,53043,22746,07450,22658,84869,32576,94580,99886,70786,89998,25198,16297,000102.392112,961122,273124,154114,981104,549105,793108,478115,154110,767110,927111,190112,018112,883112,254113,294113,345113,907114,032114,820115,154115,988116,269116,828117,388117,640118,206118,383118,867118,830120,156121,285
Finishedgoods
6,0406,3487,5658.1257,8168,2179.2229,0399,6479,88810.31710,83612,48013,54014,17515,68017,75717,90718.54719,75823,89325,46028,45730,46534,13538,73942,67047.44754,60152,63057,04856,12753,66654,84059.89962,82265,51864,21464,16464,81168,04271,95167,98968,44469,61469.92270.26370,944
71,30971,17071,81472,17771,95571,95172,67172,76772,43572.19772,40772,62672,85773,80974,14474,58774.503
Nondurable goods industries
Total
17.90218,66420,19520.14320.00920,90121,44922,37523,60724,25324,98926,01828,13429,75031,82833,547
34,94836,43138,05443,30756,13257,11862,64867,50173,51081,42390,42796,970111,408112,525118,186116,556110,657117,329126,928133,730141,892140,938144,384147,245151,409161.988153.299155,004156.422157,747158.885159,950160,240160,258161,692161,332161,263161,988162,067162,215161,878161.571160,363160,219159,639159,761160,353160,806161,521
Mate-rialsand
supplies
8,1678.5568,9718,7758,6769,0949,0979,5059,83610,00910,16710.48711.19711.76012,32812,75313,16813,68614,67718,14723,74423,56525,84727,38729,61932,814
36,60638,16544,03944,81645,69244,10642,33545,32649,40450,68352,65153,00753,98355,50457,97562,04158,55659,22260,48160,87661,33861,91861,96862.05762,36762,04362,28562,04162,15062,11661,52361,38460.78860,372
60,24660,12860,22460,56760,493
Workin
proc-ess
2,4402,5712.7212,8642,8272,9422,9473,1083,3043,4203,5313,8254,2264,4314,8525,1205,2715,6785,9986,7298,1898,8349.92910,96112,08513,91015,88416,19418,61218,69119,32819,44218,12419,27420,56321,65822.81922,80523,51023,83624,64225,65524,81625,03625,03025.08425,32725,47525,59425.55425,72225,62325.61025,65525,89925,86725,82725,90925,90025,92825.81426,10025,98026,09726,249
Finishedgoods
7,4157,6668,6228,6248,5068,8659.4059.76210.46710.82411.29111.70612,71113,55914,64815.674
16,50917.06717,37918,43124,19924,71926,87229,15331,80634,69937,93742,61148,75749,01853.16653,00850,19852,72956,96161,38966,42265,12666,89167,90568,79274,29269,92770,74670,91171,78772,22072,55772,67872,64773,60373,66673.36874.29274.01874,23274,52874,27873,67573,919
73,57973,53374,14974,14274,779
1 Annual data are averages of monthly not seasonally adjusted figures.2 Seasonally adjusted, end of period. Data beginning 1982 are not comparable with data for prior periods.Note.—Data beginning 1958 are not strictly comparable with earlier data.Source: Department of Commerce, Bureau of the Census.
363
Digitized for FRASER http://fraser.stlouisfed.org/ Federal Reserve Bank of St. Louis

TABLE B-57.—Manufacturers' new and unfilled orders, 1954-96
[Amounts in millions of dollars; monthly data seasonally adjusted]
Year or month
19541955195619571958195919601961 ...196219631964196519661967 . .. .19681969197019711972197319741975197619771978197919801981198219831984198519861987198819891990199119921993199419951995-. Jan
FebMarAprMayJuneJulyAugSeptOctNovDec
1996- JanFebMarAprMayJuneJulyAugSeptOct/>Nov
Neworders1
Total
22,33527,46528,36827,55927,19330,71130,23231,11233,44035,51138,24042,13746,42047,06750,65753,99052,02255,92164,18276,00387,32785,13999,513115,109131,629147,604156,359168,025162,140175,451192,879195,706195,204209,389228,270239,572244,507238,805248,212257,698279,560298,092297,252296,723296,210291,333295,891294,233293,595298,670302,744301,467302,155306,155307,151302,648305,091307,001314,194312,139317,304310,575318,515321,887320,490
Durable goodsindustries
Total
10,76814,99615,36514,11113,38715,97915,28815,75317,36318,67120,50723,28626,16325,80328,05129,87627,34029,90535,03842,62746,86241,95751,30761,03572,27879,48379,39283,65478,06488,140100,164102,356103,647110,809122,076126,055125,583119,849126,308133,081149,505160,214
160,467159,332159,598154,156157,854156,300155,476160,400165,364162,792162,492167,520167,355163,146165,519163,472170,287169,994
172,402166,267173,811174,900172,319
Capitalgoods
industries,non-
defense
6,3147,0466,0726,6827,7459,92611,5949,88611,49013,68117,58821,154
21,13521,80619,21319,62423,66924,54523,98226,09431,10832,98833,33130,47131,52531,69335,84741,30239,54939,75340,24438,14341,41240,24637,97639,53244,88041,31044,27947,58646,16344,55546,61340,48744,97942,921
45,93541,17247,51547,48243,917
Non-durablegoods
industries
11,56612,46913,00313.44813,80514,73214,94415,35916,07816,84017,73218,85120,25821,26522,60624,11424,68226,01629,14433,37640,46543,18148,20654,07359,35168,12176,96784,37184,07787,31192,71593,35191,55798,579106,194113,516118,924118,957121,905124,617130.055137,877
136,785137,391136,612137,177138,037137,933138,119138,270137,380138,675139,663138,635139,796139,502139,572143,529143,907142,145
144,902144,308144,704146,987148,171
Unfilledorders2
Total
48,26660,00467.37553,18346,60951,717
44,21346,62447,79853,41764,51878,24996,846103,711108,377114,341105,008105,247119,349156,561187,043169,546178,128202,024259,169303,593327,416326,547311,887347,273373,529387.196393,515430,468474,192508,853531,115519,143493,104458,161469,450480,128472,304474,822475,495473,672474,312471,668471,362470,224472,214473,857475,257480,128488,594498,479493,924492,922495,913499,201504.105501,833505,188511,565513,775
Durablegoods
industries
45,25056.24163,88050,35243,80748,36941,65043,58245,17050,34661,31574.45993,00299,735104,393110,161100,412100,225113,034149.204181,519161,664169,857193,323248,281291,321315,202314,707300,798333,114359,651372,097376,699408.732452,192487,104509,106495,735469,542436,286443,610456.048446,055448.233449,015446,981447,528445,060444,428444,203447,286449,372450,504456,048
464,278465,506470,648469,505472,305475.397
480,025477,821480,927487,003488,476
Non-durablegoods
industries
3,0163,7633,4952,8312,8023,3482,5633,0422,6283,0713.2033,7903,8443,9763,9844,1804,5965,0226,3157,3575,5247,8828,2718.70110,88812,27212,21411,84011.08914,15913,87815,09916,81621,73622,00021,74922,00923,40823,56221.87525.84024,08026,24926,58926,48026,69126,78426.60826,93426,02124,92824,48524,75324,08024,31623,97323,27623,41723,60823,804
24,08024,01224,26124,56225,299
Unfilled orders — shipmentsratio3
Total
3.423.633.873.353.022.942.712.582.642.742.993.253.743.663.793.713.613.323.263.804.093.693.243.243.573.893.853.873.843.533.603.673.593.643.643.964.154.083.513.152.962.842.912.932.912.922.892.842.892.822.822.852.832.842.952.912.952.912.892.912.942.912.912.972.94
Durablegoods
industries
4.124.274.554.003.623.473.293.083.183.313.593.864.484.374.584.454.364.003.854.514.934.453.883.854.204.624.584.684.744.294.374.474.414.434.464.865.155.074.303.803.563.433.503.533.513.533.493.443.503.413.413.443.423.433.573.523.573.513.473.513.543.513.503.563.51
Non-durablegoodsindus-tries
0.961.121.04.85.85.92.71.78.68.72.71.79.75.73.69.69.76.76.86.91.62.82.74.71.81.82.75.69.62.69.64.68.70.83.76.77.76.79.75.71.76.67.75.76.75.75.74.73.75.71.69.68.69.67.68.67.65.65.66.66.67.67.68.69.70
1 Annual data are averages of monthly not seasonally adjusted figures.2 Seasonally adjusted, end of period.3 Ratio of unfilled orders at end of period to shipments for period; excludes industries with no unfilled orders. Annual figures relate to sea-sonally adjusted data for December.
Note.—Data beginning 1958 are not strictly comparable with earlier data.Source-. Department of Commerce, Bureau of the Census.
364
Digitized for FRASER http://fraser.stlouisfed.org/ Federal Reserve Bank of St. Louis

PRICES
TABLE B-58.—Consumer price indexes for major expenditure classes, 1954-96[For all urban consumers; 1982-84=100]
I
Year ormonth
19541955195619571958195919601961196219631964196519661967196819691970197119721973197419751976197719781979198019811982198319841985198619871988198919901991199219931994199519961995Jan
FebMarAprMayJuneJulyAugSeptOctNovDec
1996JanFebMarAprMayJuneJulyAugSeptOctNovDec
All items(CPI-U)
26926.827.228.128.929 129.629.930230.631.031 532.433.434.836.738.840.541.844.449.353.856960.665.272.682.490.996.599.6
103.9107.6109.6113.6118.3124.01307136.2140.3144.5148.2152.4156.9150.3150.9151.4151.9152.2152.5152.5152.9153.2153.7153.6153.5154.4154.9155.7156.3156.6156.7157.0157.3157.8158.3158.6158.6
Food andbeverases
Total1
35.036.238.140.141.443.148.855.560.262165'.872.279.986.793.597.399.5
103.2105.6109.1113.5118.2124.9132 1136.8138.7141.6144.9148.9153.7147.9147.8147.9148.9148.7148.4148.6148.9149.4149.8149.8150.3151.4151.3152.1152.7152.5153.1153.6154.2155.0155.8156.2156.6
Food
28227.828.028.930.229730.030.430631.131532233834.135.337.139.240.442.148.255.159.861665.572.079.986.893.697.499.4
103.210S.6109.0113.5118.2125.1132413€.3137.9140.9144.3148.4153.3147.5147.4147.4148.4143.3147.9148.1148.4144.9149.4149.4149.9151.0150.8151.6152.3152.0152.6153.2153.7154.6155.4155.9156.3
Housing
Total
" Id's32.034.036.438.039.441.245.850.753857.462.470.181.190.496.999.5
103.6107.7110.9114.2118.5123.01285133.6137.5141.2144.8148.5152.8146.4147.0147.4147.4147.6148.5149.2149.6149.5149.7149.4149.7150.6151.2151.7151.8152.0152.7153.6154.0153.9154.0153.9154.0
Shelter
22522723124.024524725.225425826.126527027828.830.132.635.537.038.740.544.448.851 554.96G.568.981.090.596.999.1
104.0109.8115.8121.3127.1132.81400146.3151.2155.7160.5165.7171.0162.9163.8164.5164.7164.8165.5166.4166.8166.8167.31673167.4168.6169.4170.1170.1170.1170.7171.9172.3172.0172.5172.41723
Fuel andother
utilities
22623023.624.324.825426.026.326326.626.626626.727.127.428.029.131.132.534.340.745.449454.758.564.875.486.494.9
100.2104.8106.5104.1103.0104.4107.81116115.3117.8121.3122.8123.7127.5122.9122.6122.3122.1122.5125.0125.1125.7124.9123.9123.1123.7124.7125.0125.2125.4126.7128.4129.0129.4129.8128.7128.4129.4
House-hold
furnish-ingsand
oper-ation
42.043.645.246.848.649.751.156.863.467370.474.779.986.393.098.0
100.2101.9103.8105.2107.1109.4111.2113.3116.0118.0119.3121.0123.0124.7121.8122.4122.6122.6122.7122.5123.0123.4123.8123.9123.6123.8124.1124.3124.6124.8124.4124.5124.7124.8125.1125.0124.8125.0
Appareland
upkeep
43142943.744.544645.045.746.146346!947.347849051.053.756.859.261.162.364.669.472.575278.681.484.990.995.397.8
100.2102.1105.0105.9110.6115.4118.61241128.7131.9133.7133.4132.0131.7129.4131.1134.4134.8133.4130.5128.3130.1132.7134.5133.7130.6130.0131.2134.8134.9133.7130.8128.3128.1131.5133.4133.4130.3
Trans-por-ta-tion
26125826.227.728629.829.830.130830.931.431932.333.334.335.737.539.539.941.245.850.155159.061.770.583.193.297.099.3
103.7106.4102.3105.4108.7114.11205123.8126.5130.4134.3139.1143.0137.3137.5138.0139.1140.3141.1140.1139.2138.8139.4139.4139.1139.9140.4141.2143.1144.4144.0143.5142.8143.2143.9144.8145.2
Medicalcare
17818218919.720621.522.322923524.124625226328.229.931.934.036.137.338.842447.552057.061.867.574.982.992.5
100.6106.8113.5122.0130.1138.6149.31628177.0190.1201.4211.0220.5228.2216.6217.9218.4218.9219.3219.8220.8221.6222.1222.9223.5223.8225.2226.2226.6227.0227.4227.8228.7229.2229.4230.1230.5230.6
Enter-tainment
40.743.045.247.550.051.552.956962.065168.371.976.783.690.196.0
100.1103.8107.9111.6115.3120.3126.51324138.4142.3145.8150.1153.9159.1152.1152.5152.6153.3153.6153.2153.6154.1154.9155.2156.0156.2157.0158.3158.4158.6158.8159.0159.0159.2159.8160.1160.7160.8
Othergoodsand
services
35.136.938.740.942.944.746.449853.957060'.464.368.975.282.691.1
101.1107.9114.5121.4128.5137.0147.71590171.6183.3192.9198.5206.9215.4203.0204.1204.0204.3204.9205.3205.7207.7210.2210.7211.2211.1212.0212.6213.0213.3214.1214.0214.6216.3218.3218.8219.2218.7
Ener-gy2
21.521 521.922.422522622.62252 2 923323.824.224.825.526.527.229.438.142.145149.452.565.786.097.799.299.9
100.9101.688.288.689.394.3
102.1102.5103.0104.2104.6105.2110.1104.2103.7103.2103.9106.3109.3108.1107.4106.2104.5102.8103.3105.0104.9106.1110.0112.9113.1112.5111.6111.7110.5111.1112.2
1 Includes alcoholic beverages, not shown separately.2 Household fuels—gas (piped), electricity, fuel oil, etc.—and motor fuel. Motor oil, coolant, etc. also included through 1982.Note.—Data beginning 1983 incorporate a rental equivalence measure for homeowners' costs.Source: Department of Labor, Bureau of Labor Statistics.
365
Digitized for FRASER http://fraser.stlouisfed.org/ Federal Reserve Bank of St. Louis

TABLE B—59-—Consumer price indexes for selected expenditure classes, 1954—96
[For all urban consumers; 1982-84=100, except as noted]
Year ormonth
195419551956195719581959I960196119621963196419651966196719681969197019711972 . ..1973197419751976197719781979198019811982198319841985198619871988198919901991199219931994199519961995: Jan
FebMarAprMay ....June ....JulyAugSept ....OctNovDec
1996: JanFebMar ....Apr ....May ...June ...July ....Aug ....Sept ....OctNovDec
Food and beverages
Total1
35.036.238.140.141.443.148.855.560.262.165.872.279.986.793.597.399.5
103.2105.6109.1113.5118.2124.9132.1136.8138.7141.6144.9148.9153.7147.9147.8147.9148.9148.7148.4148.6148.9149.4149.8149.8150.3151.4151.3152.1152.7152.5153.1153.6154.2155.0155.8156.2156.6
Food
Total
28.227.828.028.930.229.730.030.430.631.131.532.233.834.135.337.139.240.442.148.255.159.861.665.572.079.986.893.697.499.4
103.2105.6109.0113.5118.2125.1132.4136.3137.9140.9144.3148.4153.3147.5147.4147.4148.4148.3147.9148.1148.4148.9149.4149.4149.9151.0150.8151.6152.3152.0152.6153.2153.7154.6155.4155.9156.3
Athome
30.129.529.630.632.031.231.531.832.032.432.733.535.235.136.338.039.940.942.749.757.161.863.166.873.881.888.494.898.199.1
102.8104.3107.3111.9116.6124.2132.3135.8136.8140.1144.1148.8154.3148.2147.9147.6149.2148.7148.1148.2148.4149.2149.7149.5150.3151.9151.4152.5153.3152.6153.4154.1154.8155.9156.8157.2157.7
Awayfromhome
21.922.122.623.424.124.825.426.026.727.327.828.429.731.332.934.937.539.441.044.249.854.558.262.668.375.983.490.995.8
100.0104.2108.3112.5117.0121.8127.4133.4137.9140.7143.2145.7149.0152.7147.4147.6148.1148.3148.6148.8149.1149.4149.6150.0150.2150.4150.6150.9151.2151.6152.0152.3152.8153.1153.5154.2154.7155.0
Shelter
Total
22.522723.124.024.524.725.225.425.826.126.527.027.828.830.132.635.537.038.740.544.448.851.554.960.568.981.090.596.999.1
104.0109.8115.8121.3127.1132.8140.0146.3151.2155.7160.5165.7171.0162.9163.8164.5164.7164.8165.5166.4166.8166.8167.3167.3167.4168.6169.4170.1170.1170.1170.7171.9172.3172.0172.5172.4172.3
Renters' costs
Total2
103.0108.6115.4121.9128.1133.6138.9146.7155.6160.9165.0169.4174.3180.2170.7172.9174.6174.1173.7174.7176.7176.9175.1175.3173.8173.2176.6178.8180.4179.7178.9180.0183.0183.4180.9181.3179.9179.1
resi-dential
35.135.636.337.037.638.238.739.239.740.140.540.941.542.243.344746.548.750.452555.258061.164.869.374.380.987994.6
100.1105.3111.8118.3123.1127.8132.8138.4143.3146.9150.3154.0157.8162.0156.1156.4156.7157.0157.2157.5157.9158.2158.5158.9159.3159.6160.0160.4160.6160.9161.2161.7162.2162.5162.9163.3163.7164.0
Home-owners'costs2
••"•••
102.5107.3113.1119.4124.8131.1137.3144.6150.2155.3160.2165.5171.0176.5168.4168.9169.2169.6170.0170.6171.2171.6172.4173.0173.5174.0174.3174.6175.0175.3175.6176.0176.6177.0177.5178.1178.6178.8
Mainte-nanceand
repairs
20.921.422.323.223.624.024.424.825.025.325.826.327.528.930.633.235.838.640.643.649.554.157.662.067.274.082.490.796.499.9
103.7106.5107.9111.8114.7118.0122.2126.3128.6130.6130.8135.0139.0133.1133.8134.2134.2134.6135.0135.1135.4135.4136.3136.2136.6136.3137.0137.5138.0138.8138.8139.4139.7139.9140.2141.1141.5
Fuel and other utilities
Total
22.623.023.624.324.825.426.026.326.326.626.626.626.727.127.428.029.131.132.534.340.745.449.454.758.564.875.486.494.9
100.2104.8106.5104.1103.0104.4107.8111.6115.3117.8121.3122.8123.7127.5122.9122.6122.3122.1122.5125.0125.1125.7124.9123.9123.1123.7124.7125.0125.2125.4126.7128.4129.0129.4129.8128.7128.4129.4
Fuels
Total
•••"•""
"2l'.421.722.123.124.725.727.534.439.443.349.053.061.374.887.295.6
100.5104.0104.599.297.398.0
100.9104.5106.7108.1111.2111.7111.5115.2110.7110.4109.8109.3109.8113.8113.7114.6113.4111.5110.1110.9112.2112.5111.9112.9114.0116.5117.4117.9118.4116.2115.7117.1
Fuel oiland
otherhouse-
holdfuel
com-modities
12.612.713.314.013.713913.814.114.214.414.414.615.015.516.016.317.018.218.321.133.236.438.843.946.262.486.1
104.6103.497.299.495.977.677.978.181.799.394.690.790.388.888.199.289.489.689.088.488.387.987.186.686.686.987.789.697.697.799.3
102.199.694.692.392.295.6
102.9105.9110.3
Gas(piped)
andelec-tricity
(energyserv-ices)
20.220.720.921.121.922423.323.523.523.523.523.523.623.723.924.325.427.128.529.934.540.144.750.555.061.071.481.993.2
101.5105.4107.1105.7103.8104.6107.5109.3112.6114.8118.5119.2119.2122.1118.0117.6117.1116.6117.2121.9121.9123.0121.6119.3117.6118.3118.7119.1118.2118.9120.6124.1125.6126.1126.2122.7121.7122.8
Otherutilities
andpublic
services
"••"••"••••
46.647.148.450.053.456.257.860.763.967.770.873.774.377.084.393.399.5
107.2112.1117.9120.1122.9127.1131.7137.9142.5147.0150.2152.8157.2152.1151.8151.9152.2152.3152.7153.0153.1153.2153.5153.6153.9154.4154.9156.4155.4156.9157.6157.5158.0158.3158.6158.9159.1
1 Includes alcoholic beverages, not shown separately.2 December 1982=100.See next page for continuation of table.
366
Digitized for FRASER http://fraser.stlouisfed.org/ Federal Reserve Bank of St. Louis

TABLE B-59.—Consumer price indexes for selected expenditure classes, 1954-96—Continued
[For all urban consumers; 1982-84=100, except as noted]
Year or month
19541955195619571958195919601961196219631964196519661967196819691970197119721973197419751976197719781979198019811982198319841985198619871988198919901991199219931994199519961995-. Jan
FebMarAprMayJuneJu lyAugSeptOctNovDec
1996: JanFebMarAprMaxJuneJulyAugSeptOctNovDec
Transportation
Total
26.125.826.227.728.629.829.830.130.830.931.431.932.333.334.335.737.539.539.941.245.850.155.159.061.770.583.193.297.099.3
103.7106.4102.3105.41087114.1120.5123.8126.5130.4134.3139.1143.0137.3137.5138.0139.1140.3141.1140.1139.2138.8139.4139.4139.1139.9140.4141.2143.1144.4144.0143.5142.8143.2143.9144.8145.2
Private transportation
Total3
27.126.727.128.629.530.830.630.831.431.632.032.532.933.834.836.037.539.439.741.046.250.655.659.762.571.784.293.897.199.3
103.61062101.2104.2107.6112.9118.8121.9124.6127.5131.4136.3140.0134.9135.0135.21362137.5137.9136.9136.3135.9136.31365136.6137.4137.5138.3140.3141.7141.0140.5139.5140.0140.51415141.7
Newcars
46.544.846.148.550.052.251.551.551.351.050.949.748.849.350.751.553.055.254.754.857.962.966.970.475.881.888.493.797.499.9
102.8106.1110.6114.6116.9119.2121.0125.3128.4131.5136.0139.0141.4139.0139.11390139.3139.3139.1138.3137.9137.8138.6140.1140.7141.1141.3141.5141.3141.2141.3141.0140.7141.0141.5142.3143.0
Usedcars
22.721.520.723.224.026.825.026.028.428.730.029.829.029.9
30.931.233.033.135236.743.850.354.755.860262.376.988.898.7
112.5113.7108.8113.1118.0120.4117.6118.1123.2133.9141.7156.5157.0152.4153.3154.8156.7157.7158.3157.5157.0156.5157.2157.81582157.9157.5157.3157.4157.61572156.9156.6157.0157.0156.5155.6
Motorfuel4
21.822.122.823.823.423.724.424.124.324224.125.125.626.426.827.627.928.128.431.242.245.147.049.751.870.197.4
108.5102.899.497.998.777.180280.988.5
101299.499.098.098.5
100.0106.398.798.097.599.5
104.2106.1103.6101.199.898.396.496.498.698.2
101.4108.6113.6111.2108.9106.4106.2105.9107.8108.6
Auto-mobilemainte-nanceand
repair
22.723.224.225.025.426.026.527.127.527.828.228.729.230.432.134.136.639.341.143.247.653.757.661.967.073.781.589.296.0
100.3103.8106.8110.3114.8119.7124.9130.1136.0141.3145.9150.2154.0158.4152.0152.5152.71532153.8153.6154.0154.5155.1155.4155.7155.7156.2156.6156.9157.2157.5157.7158.1158.6160.0160.5160.5160.6
Other
•"••"•••"
37"939.241.645.248.648.948.450.253.561.867269.975.284.391.497.798.8
103.5109.0115.1120.8127.9135.8142.5149.1153.2156.8162.1170.6173.9168.8169.4170.2170.9170.5169.9169.6170.3170.1172.0172.7172.4172.7173.2172.5173.0173.1173.1173.5174.1174.1175.4176.2176.0
Publictranspor-
tation
18.018.519219.920.921.522.223.224.024.324.725.226.127.428.730.935.237.839.339.740.643.547.850.051.554.969.085.694.999.5
105.7110.5117.0121.1123.3129.5142.6148.9151.4167.0172.0175.9181.9168.4169.9174.5176.6176.7182.5181.8177.1176.1178.7177.5170.7171.6177.4178.9179.3180.21822182.7181.4184.6187.2187.3189.9
Medical care
Total
17.818.218.919.720.621.522.322.923.524.124.625.226.328.229.931.934.036.137.338.842.447.552.057.061.867.574.982.992.5
100.6106.8113.5122.0130.1138.6149.3162.8177.0190.1201.4211.0220.52282216.6217.9218.4218.9219.3219.8220.8221.6222.1222.9223.5223.8225.2226.2226.6227.0227.4227.8228.7229.2229.4230.1230.5230.6
Medicalcarecom-
modities
42.042.543.444.646.146.846.946.345.645.245.145.045.144.945.045.446.547.347.447.549.253.356.560264.469.075.483.792.3
100.2107.5115.2122.8131.0139.9150.8163.4176.8188.1195.0200.7204.5210.4203.1203.5203.7203.6203.4203.8204.4204.7204.8205.7206.3206.6207.7208.5208.9209.6209.7210.5211.0211.1211.2212.4211.9212.0
Medicalcare
services
15.315.716.317.017.918.719.520.220.921.522.022.723.926.027.930.232.334.735.937.541.446.651.356.461267.274.882.892.6
100.7106.7113.2121.9130.0138.3148.9162.7177.1190.5202.9213.42242232.4219.8221.3221.8222.4223.0223.5224.6225.6226.1226.9227.4227.8229.3230.3230.7231.1231.6231.9232.9233.4233.6234.2234.9235.0
3 Includes other new vehicles, not shown separately. Includes direct pricing of new trucks and motorcycles beginning 1982.4 Includes direct pricing of diesel fuel and gasohol beginning 1981.Note.—See Note, Table B-58.Source. Department of Labor. Bureau of Labor Statistics.
367
Digitized for FRASER http://fraser.stlouisfed.org/ Federal Reserve Bank of St. Louis

TABLE B-60.—Consumer price indexes for commodities, services, and special groups, 1954-96
[For all urban consumers; 1982-84=100. except as noted]
Year or month
19541955195619571958195919601961196219631964196519661967196819691970197119721973197419751976197719781979198019811982198319841985198619871988198919901991199219931994199519961995:Jan
FebMarAprMayJuneJulyAugSeptOctNovDec
1996:JanFebMarAprMayJuneJulyAugSeptOctNovDec
All items(CPMJ)
26.926.827.228.128.929.129.629.930.230.631.031.532.433.434.836.738.840.541.844.449.353.856.960.665.272.682.490.996.599.6
103.9107.6109.6113.6118.3124.0130.7136.2140.3144.5148.2152.4156.9150.3150.9151.4151.9152.2152.5152.5152.9153.2153.7153.6153.5154.4154.9155.7156.3156.6156.7157.0157.3157.8158.3158.6158.6
Commodities
Allcom-
modities
31.631.331.632.633.333.333.633.834.134.434.835.236.136.838.139.941.743.244.547.853.558.260.764.268.876.686.093.297.099.8
103.2105.4104.4107.7111.5116.7122.8126.6129.1131.5133.8136.4139.9135.1135.4135.9136.6136.9136.6136.2136.3136.8137.2137.2137.0137.8138.0139.2140.2140.4139.9139.5139.5140.3141.0141.5141.4
Food
28.227.828.028.930.229.730.030.430.631.131.532.233.834.135.337.139.240.442.148.255.159.861.665.5/2.079.986.893.697.499.4
103.2105.6109.0113.5118.2125.1132.4136.3137.9140.9144.3148.4153.3147.5147.4147.4148.4148.3147.9148.1148.4148.9149.4149.4149.9151.0150.8151.6152.3152.0152.6153.2153.7154.6155.4155.9156.3
Com-modi-tieslessfood
33.833.633.934.935.335.836.036.136.336.636.937.237.738.640041.743.445.146.147.752.857.660.563.867.575.385.793.196.9
100.0103.1105.2101.7104.3107.7112.0117.4121.3124.2126.3127.9129.8132.6128.3128.8129.5130.1130.6130.4129.5129.7130.1130.5130.4129.9130.6131.0132.4133.5134.0133.0132.0131.7132.5133.2133.7133.3
Services
Allservices
20.020.420.921.822.623.324.124.525.025.526.026.627.628.830.332.435.037.038.440.143.848.052.056.060.867.577.988.196.099.4
104.6109.9115.4120.2125.7131.9139.2146.3152.0157.9163.1168.7174.1165.91667167.3167.5167.7168.6169.2169.8170.0170.4170.3170.4171.31722172.6172.7173.1173.9174.8175.3175.6175.8175.9176.1
Medi-calcareserv-ices
15.315.716.317.017.918.719.520.220.921.522.022.723.926.027.930.232.334.735.937.541.446.651.356.461267.274.882.892.6
100.7106.7113.2121.9130.0138.3148.9162.7177.1190.5202.9213.4224.2232.4
219.8221.3221.8222.4223.0223.5224.6225.6226.1226.9227.4227.8
229.3230.3230.7231.1231.6231.9232.9233.4233.6234.2234.9235.0
Servicesless
medicalcare
services
22.823.624.225.025.425.926.326.827.428.329.330.832.935.637.538.940.644.348.352.255.960.767.578.288796.499.2
104.4109.6114.6119.1124.31301136.8143.3148.4153.6158.4163.5168.7160.9161.6162.2162.4162.6163.5164.1164.6164.7165.1165.0165.0165.9166.8167.2167.3167.7168.5169.4169.9170.2170.4170.4170.6
Special indexes
Allitemslessfood
26.626.627128.028.629.229.730.030.330.731.131.632.333.434.936.839.040.842.043.748.052.556.059.663.971.281.590.496.399.7
104.0108.0109.8113.6118.3123.7130.3136.1140.8145.1149.0153.1157.5150.8151.5152.1152.5152.9153.3153.4153.7154.0154.4154.4154.2155.0155.7156.5157.0157.4157.5157.7157.9158.4158.8159.0159.0
Allitemsless
energy
28.929.729.930.430.731.131.532.032.533.534.435.938.040.342.043.446.150.655.158.261.966.773.481.990.196.199.6
104.3108.4112.6117.2122.3128.1134.7140.9145.4150.0154.1158.7163.1156.5157.2157.8158.3158.3158.3158.5159.0159.5160.2160.3160.2161.0161.6162.3162.5162.5162.7163.1163.4164.0164.7164.9164.8
Allitemslessfoodand
energy
28.929.630.230.631.031.431.832.332.733.534.736.338.440.842.744.045.649.453.957.461.065.571.980.889.295.899.6
104.6109.1113.5118.2123.4129.0135.5142.1147.3152.2156.5161.2165.6158.7159.6160.4160.7160.8160.9161.1161.6162.1162.8163.0162.7163.4164.2164.9165.0165.1165.2165.5165.8166.4167.0167.2167.0
Allitemsless
medi-cal
care
28.729.529.830.230.530.831.131.532.033.033.735.137.039.240.842.144.849.854.357.260.865.472.982.891.496.899.6
103.7107.2108.8112.6117.0122.4128.8133.8137.5141.2144.7148.6152.8146.6147.1147.6148.1148.4148.7148.7149.0149.4149.8149.7149.6150.4150.9151.7152.3152.6152.7153.0153.2153.8154.2154.5154.5
CPI-U-X1(all items)(Dec. 1982
=97.6)'
29.229.129.630.531.431.632.232.532.833.333.734.235.236.337.739.441.343.144.447.251.956.259.463.267.574.082.390.195.699.6
103.9107.6109.6113.6118.3124.0130.7136.2140.3144.5148.2152.4156.9150.3150.9151.4151.9152.2152.5152.5152.9153.2153.7153.6153.5154.4154.9155.7156.3156.6156.7157.0157.3157.8158.3158.6158.6
1CPMJ-X1 is a rental equivalence approach to homeowners' costs for the consumer price index for years prior to 1983, the first year forwhich the official index (CPI-U) incorporates such a measure. CPMJ-X1 is rebased to the December 1982 value of the CPMJ (1982-84=100); thus it is identical with CPI-U data for December 1982 and all subsequent periods. Data prior to 1967 estimated by moving theseries at the same rate as the CPI-U for each year.
Note.—See Note. Table B-58.Source: Department of Labor. Bureau of Labor Statistics.
368
Digitized for FRASER http://fraser.stlouisfed.org/ Federal Reserve Bank of St. Louis

TABLE B-61.—Changes in special consumer price indexes, 1958-96
[For ail urban consumers; percent change]
Year or month
195819591960196119621963196419651966196719681969 ..1970 .. .1971197219731974197519761977197819791980198119821983198419851986198719881989199019911992 .1993199419951996
1995:JanFebMarApr .MayJuneJuly _..AugSept'LZI."OctNovDec
1996: JanFebMarAprMayJuneJulyAug ::::::::::::SeptOctNovDec
All items(CPMJ)
Dec.to
Dec.1
1.81.71.4.7
1.31.61.01.93.53.04.76.25.63.33.48.7
12.36.94.96.79.0
13.312.58.93.83.83.93.81.14.44.44.66.13.12.92.72.72.53.3
Yearto
year
2.8.7
1.71.01.01.31.31.62.93.14.25.55.74.43.26.2
11.09.15.86.57.6
1U13.510.3623.24.33.61.93.64.1485.44.23.03.02.62.83.0
All items lessfood
Dec.to
Dec.'
1.82.11.01.31.01.61.01.63.53.35.05.66.63.02.95.6
12.27.36.16.48.3
14.013.09.84.14.13.94.1
4!64.24.56.33.3322.72.62.73.1
Yearto
year
2.12.11.71.01.01.31.31.62.23.44.55.46.04.62.94.09.89.46.76.47.2
11.414.510.96.53.54.33.81.73.54.14.65.34.53.53.12.72.82.9
All items lessenergy
Dec.to
Dec.1
2.11.31.3.7
1.31.91.31.93.43.24.96.55.43.43.58.2
11.76.64.86.79.1
11.111.78.54.24.54.44.03.84.14.74.65.23.93.03.12.62.92.9
Yearto
year
2.8.7
1.71.01.31.31.61.63.12.74.45.86.14.23.36.29.88.95.66.47.8
10.011.610.06.73.64.73.93.94.14.44.75.24.63.23.22.73.02.8
All items less foodand energy
Dec.to
Dec.1
1.72.01.01.31.31.61.21.53.33.85.16.26.63.13.04.7
11.16.76.16.58.5
11.312.29.54.54.84.74.33.84.24.74.45.24.43.33.22.63.02.6
Yearto
year
2.42.01.31.31.31.31.61.22.43.64.65.86.34.73.03.68.39.16.56.37.49.8
12.410.4
7.44.05.04.34.04.14.44.55.04.93.73.32.83.02.7
All items lessmedical care
Dec.to
Dec.1
1.71.41.3.3
1.31.61.01.93.42.74.76.15.23.23.49.1
12.26.74.56.79.1
13.412.58.83.63.63.93.5
.74.34.24.55.92.72.72.62.52.53.3
Yearto
year
2.81.01.31.01.01.01.31.63.12.14.25.45.94.13.26.4
11.29.05.36.37.6
11.513.610.45.92.94.13.41.53.53.94.65.23.92.82.72.52.72.8
Percent change from preceding period
Unad-justed
0.4.4.3
.2
.20.3
.3-.1
.6
is.4.2.1.2
3
.20
Sea-sonally
ad-justed
0.3
J
.3
.1
.13.1
.4
.2
.4
.43.1.3.1
33
Unad-justed
0.4
A3
3.1.2
30
.5
.5
3•1.1
3
.10
Sea-sonally
ad-justed
0.3
3
3
.1
!l.3.1
.5
A.4.3
0.2.1
".3.3.3
Unad-justed
0.5.4.4.3
00
.1
.3
A
-.1.5.4.4.1
0
.2
AA.1
-.1
Sea-sonally
ad-justed
0.3
3
'.23.2
'.3.3.1.1.3.2.3.2.2.2.3.1
3.2.1
Unad-justed
0.5.6.5
'.I
.1
3A.1
.4
.5
.4
.1
.1
.1
.2
.2
.4
.4
.1-.1
Sea-sonally
ad-justed
0.3
A.3
'.2.2.2
3.1.1.3.2.3.1.2
.3
'.32.2.1
Unad-justed
0.4
'.3
22
0
'.3
-.1-.1
.5
.3
.5
.4
.2
.1
.2
!4.3
o'
Sea-sonally
ad-justed
0.2.2.3
!3.2
'.I
3
2A2AA.3
.3
.1
.3
!3
1 Changes from December to December are based on unadjusted indexes.Note.—See Note. Table &-58.Source: Department of Labor, Bureau of Labor Statistics.
369
Digitized for FRASER http://fraser.stlouisfed.org/ Federal Reserve Bank of St. Louis

TABLE B-62.—Changes in consumer price indexes for commodities and services, 1929-96[For all urban consumers,- percent change]
Year
1929
1933
1939
19401941194219431944 „
19451946194719481949
19501951195219531954
19551956195719581959
19601961196219631964
19651966196719681969
19701971197219731974
19751976197719781979
19801981 "...198219831984
19851986198719881989
1990199119921993 . .1994 „
19951996
All items(CPI-U)
Dec.to
Dec.1
0.6
.8
0
.79.99.03.02.3
2.218.18.83.0
-2.1
5.96.0.8.7
-.7
.43.02.91.81.7
1.4
L31.61.0
1.93.53.04.76.2
5.63.33.48.7
12.3
6.94.96.79.0
13.3
12.58.93.83.83.9
3.81.14.44.44.6
6.13.12.92.72.7
2.53.3
Yearto
year
0
-5.1
-1.4
.75.0
10.96.11.7
2.38.3
14.48.1
-1.2
1.37.91.9.8
-.41.53.32.8
1.71.01.01.31.3
1.62.93.14.25.5
5.74.43.26.2
11.0
9.15.86.57.6
11.3
13.510.36.23.24.3
3.61.93.64.14.8
5.44.23.03.02.6
2.83.0
Commodities
Total
Dec.to
Dec.1
-0.7
1.413.312.94.22.0
2.924.810.31.7
-4.1
7.85.9
-!3-1.6
2!62.81.2.6
1.20
.91.5.9
1.42.52.54.05.4
3.92.83.4
10.412.8
6.23.36.18.8
13.0
11.06.03.62.92.7
2.5-2.0
4.63.84.1
6.61.22.01.52.3
1.43.2
Yearto
year
-2.0
.76.7
14.59.31.0
3.010.620.5
7.2-2.7
.79.01.3-.3
-.91.03.22.10
i
!91.2
1.12.61.93.54.7
4.53.63.07.4
11.9
8.84.35.87.2
11.3
12.38.44.12.93.4
2.1
3^23.54.7
5.23.12.01.91.7
1.92.6
Food
Dec.to
Dec.1
2.5
69
-2.5
2.515.717.93.00
3.531.311.3
-Js9.87.1
-1.0-1.1-1.8
?92.82.4
-1.0
3.1-.71.32.01.3
3.54.01.24.47.0
2.34.34.6
20.312.0
6.6
1111.810.2
10.24.33.12.73.8
2.63.83.55.25.6
5.31.91.52.92.9
2.14.3
Yearto
year
1.2
-28
-2.5
1.79.2
17.611.0-1.2
2.414.521.78.3
-4.2
1.611.01.8
-1.4
-1.4.7
3.24.5
-1.7
1.01.3.7
1.61.3
2.25.0
.93.55.1
5.73.14.2
14.514.3
8.53.06.39.9
11.0
8.67.84.12.13.8
2.33.24.14.15.8
5.82.91.22.22.4
2.83.3
Services
Total
Dec.to
Dec.1
0
.82.42.32.32.2
.73.65.65.93.7
3.65.24.44.22.0
2.03.44.22.73.9
2.52.11.62.41.6
2.74.84.35.87.7
8.14.13.46.2
11.4
8.27.28.09.3
13.6
14.213.04.34.85.4
5.14.54.34.85.1
5.74.63.63.82.9
3.53.3
Yearto
year
0
.8
.83.12.32.2
1.51.44.36.15.1
3.05.34.54.33.1
2.02.54.33.73.1
3.41.72.02.02.0
2.33.84.35.26.9
8.05.73.84.49.2
9.68.37.78.6
11.0
15.413.19.03.55.2
5.15.04.24.64.9
5.55.13.93.93.3
3.43.2
Medical care
Dec.to
Dec.1
1.2
01.23.55.63.2
3.19.06.46.91.6
4.05.35.83.42.6
3.23.84.84.64.9
3.73.52.92.82.3
3.68.38.07.17.3
8.15.43.76.0
13.2
10.310.89.09.3
10.5
10.112.611.26.25.8
6.87.95.66.98.6
9.98.07.05.95.4
4.43.2
Yearto
year
1.2
003.54.54.3
3.15.18.77.13.3
2.44.76.73.53.4
2.63.84.35.34.5
4.33.63.52.92.3
3.25.38.87.38.2
7.07.43.54.5
10.4
12.610.19.98.59.8
11.310.711.88.76.0
6.17.76.66.47.7
9.38.97.66.55.2
5.13.7
Medicalcare2
Dec.to
Dec.1
1.0
01.03.84.62.6
2.68.36.95.81.4
3.45.84.33.52.3
3.33.24.74.53.8
3.23.12.22.52.1
2.86.76.36.26.2
7.44.63.35.3
12.6
9.810.08.98.8
10.1
9.912.511.06.46.1
6.87.75.86.98.5
9.67.96.65.44.9
3.93.0
Yearto
year
0
1.002.94.73.6
2.65.08.06.72.8
2.05.35.03.62.9
2.23.84.24.64.4
3.72.72.62.62.1
2.44.47.26.06.7
6.66.23.34.09.3
12.09.59.68.49.2
11.010.711.68.86.2
6.37.56.66.57.7
9.08.77.45.94.8
4.53.5
Energy'
Dec.to
Dec.1
..........
4.7
1.3-1.3
2.2-.90
1.81.71.71.72.9
4.83.12.6
17.021.6
11.47.17.27.9
37.5
18.011.91.3
'.2
1.8-19.7
8.2.5
5.1
18.1-7.4
2.0-1.4
2.2
-1.38.6
Yearto
year
if1.9
2.3.4.4
0-.4
1.81.72.11.72.5
2.83.92.68.1
29.6
10.57.19.56.3
25.1
30.913.6
1.5.7
1.0
.7-13.2
.5
.85.6
8.3.4
L2.4
.64.7
1 Changes from December to December are based on unadjusted indexes.2 Commodities and services.3 Household fuels—gas (piped), electricity, fuel oil, etc.-̂ and motor fuel. Motor oil, coolant, etc. also included through 1982.Note.—See Note. Table B-58.
Source: Department of Labor, Bureau of Labor Statistics.
370
Digitized for FRASER http://fraser.stlouisfed.org/ Federal Reserve Bank of St. Louis

TABLE B-63.—Producer price indexes by stage of processing, 1954-96
[1982=100]
Year or month
19541955195619571958195919601961196219631964196519661967 „19681969 .. . _1970 ..197119721973197419751976 ...19771978197919801981 . . .19821983 _198419851986198719881989199019911992 _ .199319941995 . . .19961995- Jan
FebMar .ADTMay ""June ~ .JulvAug ::~r"T"r:"ir*~Septoct ""7" ;..;;_;;;:;;;NovDec
1996- JanFeb „Mar „ .....AorMay " ""juiS.'i " .::...:::..„July _...Aug 1
SeptOct ." " "'NovDec
Finished goods
Totalfinishedgoods
30.430.531.332.533.233.133.433.433.533.433.534.135.235.636.638.039.340.541.845.652.658.260.864.769.877.688.096.1
100.0101.6103.7104.7103.2105.4108.0113.6119.2121.7123.2124.7125.5127.9131.3126.6126.9127.1127.6128.1128.2128.2128.1127.9128.7128.7129.1129.4129.4130.1130.6131.1131.7131.5131.9131.6132.5132.5132.7
Consumer foods
Total
34.233.433334.436.534.835.535.435.735.335.436.839238.540.042.443.844.546.956364.469.869.673379.987.392.497.8
100.0101.0105.4104.61073109.5112.6118.7124.412411233125.7126.8129.0133.5127.9128.4128.7128.7128.0127.41283128.8130.1129.9131.1131.0130.7130.7132.0131.2131.5133.6133.91353135.6136.4135.9135.5
Crude
37.539.139.138.541.037339.838.038.437.838.939.041.539.642.545.946.045.848.063.671.671.776.779.585.892393.9
104.4100.0102.4111.4102.9105.6107.1109.8119.6123.01193107.6114.41113118.8128.9120.1117.2118.6130.8122.7111.0110.2108.2123.3113.0126.2124.2125.0121.9145.3131.71173128.8123.7121.5127.4135.7135.1133.8
Proc-essed
34.032.732.734.136.134.735.235.335.635.235.236.839.238.840.042.343.944.747.255.863.970.369.072.779.486.892.397.2
100.0100.9104.9104.8107.4109.6112.7118.6124.4124.4124.4126.5127.9129.8133.8128.5129.2129.4128.5128.4128.6129.8130.3130.6131.1131.4131.5131.1131.3131.0131.11323133.9134.6136.3136.1136.4135.9135.5
Finished goods excluding consumer foods
Total
"35.035.936.938.239.640.442.048.854.758.162.266.774.686.795.6
100.0101.8103.2104.6101.9104.0106.5111.8117.4120.9123.1124.4125.1127.5130.5126.2126.4126.6127.2128.01283128.0127.8127.2128.3127.9128.4129.0128.9129.5130.4130.9131.0130.8130.9130.3131.3131.4131.8
Consumer goods
Total
31.131.332.132.932.933.333.533.433.433.433.333.634.134.735.536.337.438.739.441.248.253.256.560.664.973.587.196.1
100.0101.2102.2103398.5
100.7103.1108.91153118.7120.8121.7121.6124.0127.6122.4122.6122.9123.6124.7125.1124.7124.4123.9124.5123.9124.6125.41253126.1127.4128.2128.3128.0128.1127.8128.6128.7129.2
Durable
39.840.241.642.843.443.943.843.643.443.143.343.243.444.145.145.947.248.950.050.955.561.063.767.473.680.891.096.4
100.0102.8104.5106.5108.9111.5113.8117.6120.4123.9125.7128.0130.9132.7134.2132.6132.7132.4132.4132.3132.0132.1131.9130.0134.1134.7134.7134.21343134.3134.0134.2134.4133.8133.7132.4135.1135.1135.0
Non-durable
26.726.827.327.927.828.228.428.428.428.528.428.829.330.030.631.532.533.534.136.144.048.952.456.860.069.385.195.8
100.0100.5101.1101.793.394.997.3
103.8111.5115.0117.3117.6116.2118.8123.2116.7116.9117.3118.4120.1120.8120.1119.8119.9119.0117.8118.9120.1119.9121.2123.1124.1124.2124.0124.2124.2124.2124.5125.1
Capitalequipment
26.727.429.531.332.132.732.832.933.033.133.433.834.635.837.038.340.141.742.844.250.558.262.166.171377.585.894.6
100.0102.8105.2107.5109.7111.7114.3118.8122.9126.7129.1131.4134.1136.7138.3135.9136.1136.2136.4136.5136.4136.6136.6135.7138.0138.3138.1138.3138.4138.3138.3138.2138.2138.1138.2137.2138.6138.7138.8
Totalfinished
consumergoods
31.731.532.032.933.633.333.633.633.733.533.634.235.435.636.537.939.140.241.546.053.158.260.464.369.477.588.696.6
100.0101.3103.3103.8101.4103.6106.2112.1118.2120.5121.7123.0123.3125.6129.5124.2124.5124.7125.2125.9126.0126.0125.9125.9126.3126.2126.7127.1127.0128.0128.7129.3130.0129.9130.4130.2131.0131.0131.2
1 Data have been revised through August 1996 to reflect the availability of late reports and corrections by respondents. All data are sub-ject to revision 4 months after original publication.
See next page for continuation of table.
371
Digitized for FRASER http://fraser.stlouisfed.org/ Federal Reserve Bank of St. Louis
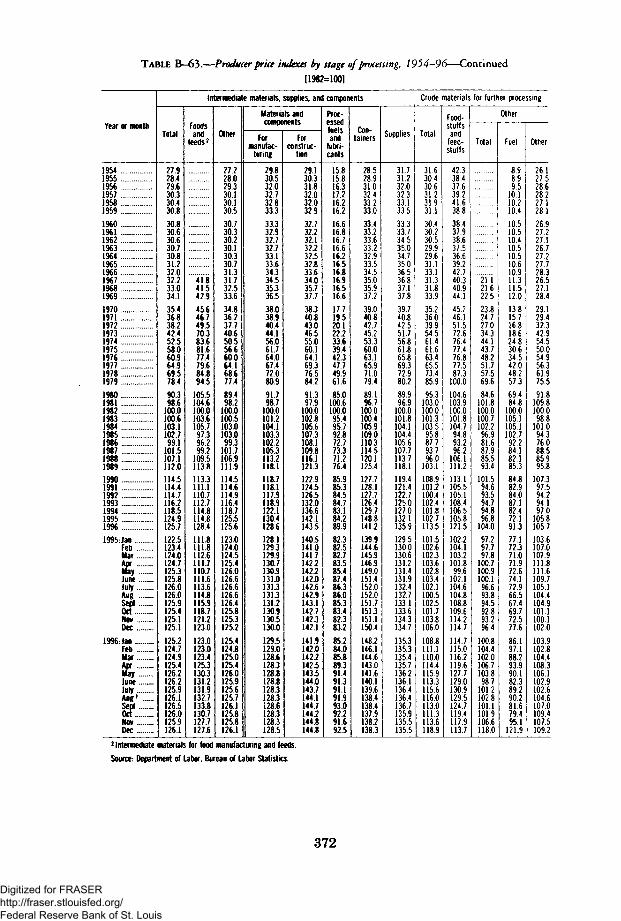
TABLE B—63.—Producer price indexes by stage of processing, 1954-96—Continued
[1982=100]
Year or month
1954195519561957195819591960 . .19611962196319641965 . ...1966196719681969197019711972197319741975197619771978197919801981 .. . .1982198319841985 .. . .19861987198819891990 . . .1991199219931994199519961995. Jan
FebMarApr«?»:::::June
JSrf :-NovDec
1996: JanFebMarApr£, :..:..Junea.-sef ..:..:NovDec
Intermediate materials, supplies, and components
Total
27.928.429.630.330.430.830.830.630.630.730.831232.032.233.034.135.436.838.242.452.558.060.964.969.578.4
90.398.6
100.0100.6103.1102.799.1
101.5107.1112.0114.5114.4114.7116.2118.5124.9125.7122.5123.4124.0124.7125.3125.8126.0126.0125.9125.4125.1125.1
125.2124.7124.9125.4126.2126.2125.9126.1126.5126.0125.9126.1
Foodsand
feeds2
41.841.542.945.646.749.570.383.681.677.479.684.894.5
105.5104.6100.0103.6105.7
97.396.299.2
109.5113.8113.3111.1110.7112.7114.8114.8128.4111.8111.8112.6111.7110.7111.6113.6114.8115.9118.7121.2123.0
123.0123.0123.4125.3130.3131.2131.9132.7133.8130.7127.7127.6
Other
27.228.029.330.130.130.530.730.330.230.130.330.731.331.732.533.634.836.237.740.650.556.660.064.168.677.489.498.2
100.0100.5103.0103.0
99.3101.7106.9111.9114.5114.6114.9116.4118.7125.5125.6123.0124.0124.5125.4126.0126.6126.6126.6126.4125.8125.3125.2125.4124.8125.0125.4126.0125.9125.6125.7126.1125.8125.8126.1
Materials andcomponents
Formanufac-
turing
29.830.532.032.732.833.333.332.932.732.733.133.634.334.535.336.538.038.940.444.156.061.764.067.472080.991.798.7
100.0101.2104.1103.3102.2105.3113.2118.1118.7118.1117.9118.9122.1130.4128.6128.1129.3129.9130.7130.9131.0131.3131.3131.2130.9130.5130.0
129.5129.0128.6128.3128.8128.8128.3128.3128.61283128.3128.5
Forconstruc-
tion
29.130.331.832.032.032.932.732.232.132.232.532.833.634.035.737.7
38.340.843.046.555.060.164.169.376.584.291.397.9
100.0102.8105.6107.3108.1109.8116.1121.3122.9124.5126.5132.0136.6142.1143.5140.5141.0141.7142.2142.2142.0142.6142.9143.1142.7142.3142.1
141.9142.0142.2142.5143.5144.0143.7144.1144.7144.2144.8144.8
Proc-essedfuelsand
lubri-cants
15.815.816.317.216.216.216.616.816.716.616.216.516.816.916.516.617.719.520.122.233.639.442.347.749.961.685.0
100.6100.095.495.792.872.773.371.276.485.985.384.584.783.184.289.982.382.582.783.585.487.486.386.085.383.482.383.2
85.284.085.889.391.491.391.191.993.092.291.692.5
Con-tainers
28.528.931.032.433.233.033.433.233.633.232.933.534.535.035.937.239.040.842.745.253.360.063.165.971.079.489.196.7
100.0100.4105.9109.0110.3114.5120.1125.4127.7128.1127.7126.4129.7148.8141.2139.9144.6145.9146.9149.0151.4152.0152.0151.7151.3151.1150.4
148.2146.1144.6143.0141.6140.1139.6138.4138.4137.9138.2138.3
Supplies
31.731.232.032.333.133.533.333.734.535.034.735.036.536.837.137.839.740.842.551.756.861.865.869.372.980.289.996.9
100.0101.8104.1104.4105.6107.7113.7118.1119.4121.4122.71250127.0132.1135.9129.5130.0130.6131.2131.4131.9132.4132.7133.1133.6134.3134.7
135.3135.3135.4135.7136.2136.1136.4136.4136.7135.9135.5135.5
Crude materials for further processing
Total
31.630.430.631.231.931.130.430.230.529.929.631.133.131.331.833.935.236.039.954561.461.663.465.573.485.995.3
103.0100.0101.3103.5
95.887.793.796.0
103.1108.9101.2100.4102.4101.8102.7113.5101.5102.6102.3103.6102.8103.4102.1100.5102.5101.7103.8106.0
108.81 1 1 . 1110.0114.4115.9113.3115.6116.0113.0111.3113.6118.9
Food-stuffs
andfeed-stuffs
42.338.437.639.241.638.838.437.938.637.536.639.242.740.340.944.145.246.151.572.676.477.476.877.587.3
100.0104.6103.9100.0101.8104.7
94.893.296.2
106.1111.2113.1105.5105.1108.4106.5105.8121.5102.2104.1103.2101.8
99.6102.1104.6104.8108.8109.6114.2114.7
114.7115.0116.2119.6127.7129.0130.9129.5124.7119.4117.9113.7
Other
Total
. . . . . . . . . .
21.622.523.824.727.034.344.143.748.251.757.569.684.6
101.8100.0100.7102.2
96.981.687.985.593.4
101.594.693.594.794.896.8
104.097.297.797.8
100.7100.9100.1
96.693.894.592.893.296.4
100.8104.4102.0106.7103.8
98.7101.2102.8101.1101.9106.6118.0
Fuel
8.98.99.5
10.110.210.4
10.510.510.410.510.510.610.911.311.512.013.815.716.818.624.830.634.542.048.257.369.484.8
100.0105.1105.1102.7
92.284.182.185.384.882.984.087.182.472.191.377.172.371.071.972.674.172.966.567.469.772.577.6
86.197.188.293.990.182.389.290.281.679.495.1
121.9
Other
26.127.528.628.227.128.126.927.227.126.727.227.728.326.527.128.4
29.129.432.342.954.550.054.956.361.975.591.8
109.8100.0
98.8101.0
94.376.088.585.995.8
107.397.594.294.197.0
105.8105.7103.6107.0107.9111.8111.6109.7105.1104.4104.9101.1100.1102.0
103.9102.8104.4108.3106.1102.9102.6104.6107.0109.4107.5109.2
2 Intermediate materials for food manufacturing and feeds.Source: Department of Labor, Bureau of Labor Statistics.
372
Digitized for FRASER http://fraser.stlouisfed.org/ Federal Reserve Bank of St. Louis

TABLE B-64.—Producer price indexes by stage of processing, special groups, 1974-96
[1982=100]
Year or month
197419751976197719781979198019811982198319841985198619871988198919901991199219931994199519961995Jan
FebMarAprMayJuneJulyAugSeptOctNovDec
1996JanFebMarAprMayJuneJulyAug 2
SeptOctNovDec
Finishedgoods
Total
52.658260.864.769877.688.0961
100.0101.6103.7104.71032105.4108.0113.61192121.7123.2124.7125.5127.9131.3126.6126.9127.1127.6128.1128.2128.2128.1127.9128.7128.7129.1
129.4129.4130.1130.6131.1131.7131.5131.9131.6132.5132.5132.7
Foods
64.469869.673.379987.392.4978
100.0101.0105.4104.61073109.5112.6118.71244124.1123.3125.7126.8129.0133.5127.9128.4128.7128.7128.0127.4128.5128.8130.1129.9131.1131.0
130.7130.7132.0131.2131.5133.6133.9135.3135.6136.4135.9135.5
Energy
26.230734J39.742357.185.2
1015100.095.291.287.663061.859.865.775078.177.878.077.078.1S3.176.676.676.878.280.481.479.979.479.077.275.276.7
78.577.880.183.384.684.784.284.684.684.584.985.9
Excluding foods andenergy
TntallOiai
53.659763.166.971978.387.1946
100.0103.0105.5108.11106113.3117.0122.11266131.1134.2135.8137.1140.0142.0138.7139.0139.2139.4139.7139.7139.9139.8139.1141.3141.6141.7
141.8141.9141.8141.7142.0142.0141.9141.9141.1142.5142.5142.6
Capitalequip-ment
50.558262.166.171377.585.8946
100.0102.8105.2107.51097111.7114.3118.81229126.7129.1131.4134.1136.7138.3135.9136.1136.2136.4136.5136.4136.6136.6135.7138.0138.3138.1
138.3138.4138.3138.3138.2138.2138.1138.2137.2138.6138.7138.8
Con-sumergoods
exclud-
fdodsand
energy
55.560663.767.372278.887.8946
100.01031105.7108.4111 1114.2118.5124.01288133.7137.3138.5139.0141.9144.3140.5140.8141.1141.3141.7141.7142.0141.9141.3143.4143.7143.9
143.9144.1144.0143.8144.3144.4144.3144.2143.5144.9144.9144.9
Intermediate materials, supplies,and components
Total
52.558060.964.9695m90.3986
100.01006103.1102.7991
101.5107.1112.01145114.4114.7116.2118.5124.9125.7122.5123.4124.0124.7125.3125.8126.0126.0125.9125.4125.1125.1
125.2124.7124.9125.4126.2126.2125.9126.1126.5126.0125.9126.1
Foodsand
feeds1
83.681677.479.684894.5
105.51046100.0103.6105.797.396299.2
109.5113.81133111 1110.7112.7114.8114.8128.4111.8111.8112.6111.7110.7111.6113.6114.8115.9118.7121.2123.0
123.0123.0123.4125.3130.3131.2131.9132.7133.8130.7127.7127.6
Energy
33.138741.546.849161.184.9
1005100.095.395.592.672673.070.976.185585.184.384.683.084.189.782.282.482.683.585.287.386.285.985.283.382.283.1
85.083.885.789.191.291.190.991.792.891.991.492.1
Other
54.060263.867.672580.790.3977
100.0101.6104.7105.21049107.8115.2120.21209121.4122.0123.8127.1135.2134.0132.6133.8134.4135.2135.6135.7136.1136.1136.1135.8135.4135.1
134.8134.4134.1133.9134.1134.0133.6133.6133.9133.6133.8133.9
Crude materials for furtherprocessing
Total
61.461663.465.573485.995.3
1030100.0101.3103.595.887793.796.0
103.11089101.2100.4102.4101.8102.7113.5101.5102.6102.3103.6102.8103.4102.1100.5102.5101.7103.8106.0
108.8111.1110.0114.4115.9113.3115.6116.0113.0111.3113.6118.9
Food-stuffsand
feed-stuffs
76.477476.877.5873
100.0104.61039100.0101.8104.794.893296.2
106.1111.21131105.5105.1108.4106.5105.8121.5102.2104.1103.2101.899.6
102.1104.6104.8108.8109.6114.2114.7
114.7115.0116.2119.6127.7129.0130.9129.5124.7119.4117.9113.7
Energy
27.833335.340.445254.973.1977
100.098.798.093.371875.067.775.985980.478.876.772.169.484.469.869.669.172.072.471.568.265.667.466.968.372.5
78.182.780.687.383.377.681.883.881.582.789.1
103.8
Other
83.369380.279.8878
106.2113.1111 7100.0105.3111.7104.91031115.7133.0137.91363128.2128.4140.2156.2173.6155.8174.1177.0179.1181.4180.5180.6177.0174.0170.7165.5162.2161.4
162.1162.3159.2157.6158.1155.3152.4152.9153.1152.6151.6152.4
1 Intermediate materials for food manufacturing and feeds.2 Data have been revised through August 1996 to reflect the availability of late reports and corrections by respondents. All data are sub-ject to revision 4 months after original publication.
Source: Department of Labor, Bureau of Labor Statistics.
373
Digitized for FRASER http://fraser.stlouisfed.org/ Federal Reserve Bank of St. Louis

TABLE B-65.—Producer price indexes for major commodity groups, 1954-96
[1982=100]
Year or month
19541955195619571958195919601961 .1962196319641965 . .196619671968 .19691970197119721973197419751976197719781979198019811982198319841985 . . . . . .198619871988198919901991199219931994199519961995- Jan
FebMarAprM :̂::::::::::::::.June . . .JulyAugsept".:..: :":"::::::OctNov . .Dec
1996-. JanFebMarAprMayJune :JulyAug2
SeptOct ".'"":.NovDec
Farm products and processedfoods and feeds
Total
38.536.636.437.739.437.637.737.738.137.737.539.041.640.241.143.444.945.849.263.971.374.073.675.983.092.398.3
101.1100.0102.0105.5100.7101.2103.7110.0115.4118.6116.4115.9118.4119.1120.5129.7118.0118.9119.2118.7117.5118.3119.9120.0122.1122.7125.2125.6125.5125.8126.7127.9131.2132.5133.2133.6132.4130.6129.3128.0
Farmproducts
43.240.540.041.142.940.240.139.740.439.639.040.743.741.342.345.045.846.651.672.777.477.078.879.487.799.6
102.91052100.0102.4105.595.192.995.5
104.9110.9112.2105.7103.6107.1106.3107.4122.3103.6104.9105.1104.8102.6104.2106.2105.1110.7110.2115.4116.5116.4116.6119.5121.7128.1129.6129.9128.6124.8119.8118.0114.7
Processedfoods and
feeds
35.433.833.834.836.535.635.636.236.536.836.738.040.239.840.642.744.645.548.058.968.072.670.874.080.688.595.998.9
100.0101.8105.4103.5105.4107.9112.7117.8121.9121.9122.1124.0125.5127.0133.4125.2125.9126.2125.6125.0125.3126.7127.5127.8128.9130.0130.2130.0130.3130.3130.9132.7134.0134.8136.1136.2135.9134.9134.6
Industrialcommodities
Total
27.227.829.129.930.030.530.530.430.430.330.530.931.532.032.833.935.236.537.840.349.254.958.462.567.075.788.097.4
100.0101.1103.3103.7100.0102.6106.3111.6115.8116.5117.4119.0120.7125.5127.2123.7124.4124.7125.6126.3126.6126.2126.0125.8125.7125.4125.8126.4126.3126.4127.3127.5127.1127.0127.3127.2127.4127.8128.9
Textileproducts
andapparel
48.248.248.248.347.448.148.647.848.248.248.548.848.948.950.751.852.453.355.560.568.067.472.475.378.182.589.797.6
100.0100.3102.7102.9103.2105.1109.2112.3115.0116.3117.8118.0118.3120.8122.4119.4119.9120.1120.4120.8120.8121.0121.1121.5121.6121.3121.3121.8121.9122.0122.0122.3122.3122.6122.5123.0122.9122.7122.8
Hides,skins,
leather,and
relatedproducts
29.529.431.231.231.635.934.634.935.334.334.435.939.438.139.341.542.043.450.054.555.256.563.968.376.196.194.799.3
100.0103.2109.0108.9113.0120.4131.4136.3141.7138.9140.4143.7148.5153.7150.3154.1155.2156.2156.1157.8155.0154.9153.2152.0150.6149.5149.5149.0149.3149.7148.4149.2149.2149.4150.3150.4152.0153.6153.7
Fuels andrelated
productsand
power1
13.213.213.614.313.713.713.914.014.013.913.513.814.114.414.314.615.316.617.119.430.135.438.343.646.558.982.8
100.2100.095.994.891.469.870.266.772.982.381.280.480.077.878.085.676.876.876.878.580.081.079.278.378.376.875.977.980.680.982.086.286.685.285.986.886.786.788.192.0
Chemicalsand alliedproducts1
33.833.733.934.634.934.834.834.533.933.533.633.934.034.234.134.235.035.635.637.650.262.064.065.968.076.089.098.4
100.0100.3102.9103.7102.6106.4116.3123.0123.6125.6125.9128.2132.1142.5142.1140.4141.8142.5144.1144.4143.8143.6142.9142.6141.8141.0140.7140.8140.9141.1141.4142.2142.2142.0142.5142.7142.9143.2143.6
1 Prices for some items in this grouping are lagged and refer to 1 month earlier than the index month.2 Data have been revised through August 1996 to reflect the availability of late reports and corrections by respondents. All data are sub-
ject to revision 4 months after original publication.See next page for continuation of table.
374
Digitized for FRASER http://fraser.stlouisfed.org/ Federal Reserve Bank of St. Louis
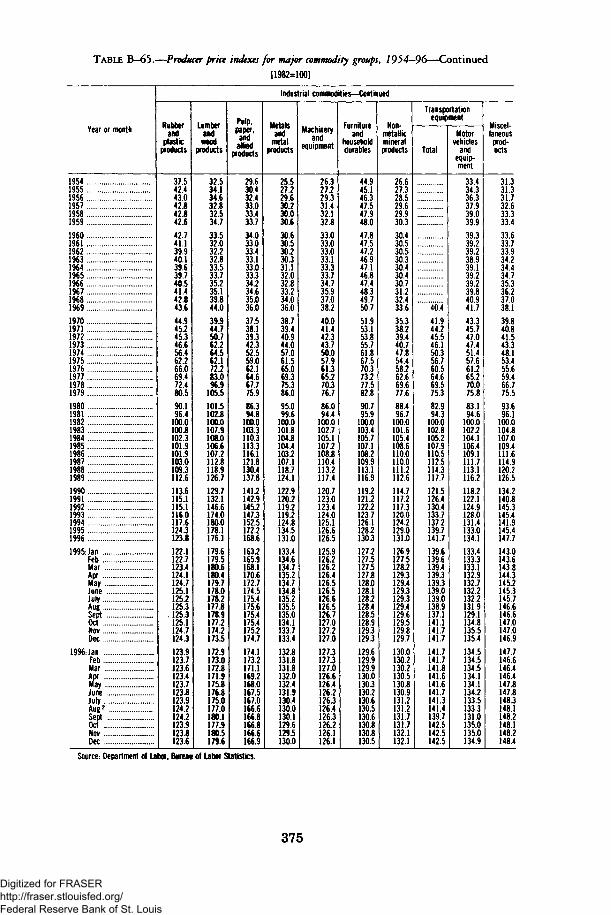
TABLE B-65.—Producer price indexes for major commodity groups, 1954-96—Continued
[1982=100]
Year or month
19541955195619571958195919601961196219631964196519661967196819691970197119721973197419751976197719781979198019811982 ...19831984198519861987198819891990 . . ..1991199219931994199519961995- Jan
Feb . ..MarAprMayJuneJulyAuesept":....::::::..:::::..::::OctNovDec
1996- JanFebMarAprMayJuneJulyAue2
sept ....:: :OctNovDec
Industrial commodities— Continued
Rubberand
plasticproducts
37.542.443.042.842.842.642.741.139.940.139.639.740.541.442.843.644.945.245.346.656.462.266.069.472.480.590.196.4
100.0100.8102.3101.9101.9103.0109.3112.6113.6115.1115.1116.0117.6124.3123.8122.1122.7123.4124.1124.7125.1125.2125.3
. 125.3125.1124.7124.3123.9123.7123.6123.4123.7123.8123.9124.2124.2123.9123.8123.6
Lumberand
woodproducts
32.534.134.632.832.534.733.532.032.232.833.533.735.235.139.844.039.944.750.762.264.562.172.283.096.9
105.5101.5102.8100.0107.9108.0106.6107.2112.8118.9126.7129.7132.1146.6174.0180.0178.1176.1179.6179.5180.6180.4179.7178.0178.2177.8178.9177.2174.2173.5172.9173.0172.8171.9175.8176.8175.0177.0180.1177.9180.5179.6
Pulp,paper,
andallied
products
29.630.432.433.033.433.734.033.033.433.133.033.334.234.635.036.037.538.139.342.352.559.062.164.667.775.986.394.8
100.0103.3110.3113.3116.1121.8130.4137.8141.2142.9145.2147.3152.5172.2168.6163.2165.9168.1170.6172.7174.5175.4175.6175.4175.4175.2174.7174.1173.2171.1169.2168.0167.5167.0166.6166.8166.8166.6166.9
Metalsand
metalproducts
25.527.229.630.230.030.630.630.530.230.331.132.032.833.234.036.038.739.440.944.057.061.565.069.375.386.095.099.6
100.0101.8104.8104.4103.2107.1118.7124.1122.9120.2119.2119.2124.8134.5131.0133.4134.6134.7135.2134.7134.8135.2135.5135.0134.1133.7133.4132.8131.8131.8132.0132.4131.9130.4130.0130.1129.6129.5130.0
Machineryand
equipment
26.327.229.331.432.132.833.033.033.033.133.333.734.735.937.038.240.041.442.343.750.057.961.365.270.376.786.094.4
100.0102.7105.1107.2108.8110.4113.2117.4120.7123.0123.4124.0125.1126.6126.5125.9126.2126.2126.4126.5126.5126.6126.5126.7127.0127.2127.0127.3127.3127.0126.6126.4126.2126.3126.4126.3126.2126.1126.1
Furnitureand
householddurables
44.945.146.347.547.948.047.847.547.246.947.146.847.448.349.750.751.953.153.855.761.867.570.373.277.582.890.795.9
100.0103.4105.7107.1108.2109.9113.1116.9119.2121.2122.2123.7126.1128.2130.3127.2127.5127.5127.8128.0128.1128.2128.4128.5128.9129.3129.3129.6129.9129.9130.0130.3130.2130.6130.5130.6130.8130.8130.5
Non-metallicmineralproducts
26.627.328.529.629.930.330.430.530.530.330.430.430.731.232.433.635.338.239.440.747.854.458.262.669.677.688.496.7
100.0101.6105.4108.6110.0110.0111.2112.6114.7117.2117.3120.0124.2129.0131.0126.9127.5128.2129.3129.4129.3129.3129.4129.6129.5129.8129.7130.0130.2130.2130.5130.8130.9131.2131.2131.7131.7132.1132.1
Transportationequipment
Total
::::::: :::::
40.441.944.245.546.150.356.760.564.669.575.382.994.3
100.0102.8105.2107.9110.5112.5114.3117.7121.5126.4130.4133.7137.2139.7141.7139.6139.6139.4139.3139.3139.0139.0138.9137.1141.1141.7141.7141.7141.7141.8141.6141.6141.7141.3141.4139.7142.5142.5142.5
Motorvehicles
andequip-ment
33.434.336.337.939.039.939.339.239.238.939.139.239.239.840.941.743.345.747.047.451.457.661.265.270.075.883.194.6
100.0102.2104.1106.4109.1111.7113.1116.2118.2122.1124.9128.0131.4133.0134.1133.4133.3133.1132.9132.7132.2132.2131.9129.1134.8135.5135.4134.5134.5134.5134.1134.1134.2133.5133.3131.0135.0135.0134.9
Miscel-laneousprod-ucts
31.331.331.732.633.333.433.633.733.934.234.434.735.336.237.038.139.840.841.543.348.153.455.659.466.775.593.696.1
100.0104.8107.0109.4111.6114.9120.2126.5134.2140.8145.3145.4141.9145.4147.7143.0143.6143.8144.3145.2145.3145.7146.6146.6147.0147.0146.9147.7146.6146.4146.4147.8147.8148.3148.1148.2148.1148.2148.4
Source: Department of Labor, Bureau of Labor Statistics.
375
Digitized for FRASER http://fraser.stlouisfed.org/ Federal Reserve Bank of St. Louis

TABLE B-66.—Changes in producer price indexes for finished goods, 1958-96[Percent change]
Year ormonth
19581959 . ...
1960196119621963 .. .19641965196619671968 . ..1969
1970197119721973197419751976197719781979
1980198119821983198419851986198719881989
1990199119921993199419951996
1995Jan ....Feb ....Mar ...Apr ....May ...June ..
July ...Aug ...Sept ..Oct ....Nov ...Dec ...
1996:Jan ....Feb ....Mar ...
&::June ..
July ...Aug2..Sept ..Oct....Nov ...Dec ...
Totalfinishedgoods
Dec. toDec.1
0.3
1.8-.6
.3-.3
.6332.0173.14.9
2.13.33.9
11.718.36.63.86.79.3
12.8
11.87.13.6
.61.71.8
-2.32.24.04.9
5.7
L6.2
232.8
Year toyear
2.2
.90
.3
183.21 12.83.8
3.43.13.29.1
15.410.64.56.47.9
11.2
13.49.24.11.62.11.0
-1.42.12.55.2
4.92.11.21.2
.61.92.7
Finishedconsumer
foods
Dec. toDec.1
0.6-3.7
5.3-1.9
.6-1.4
.6911.3-34.68.1
-2.35.87.9
22.712.85.6
-2.56.9
11.77.4
7.51.52.02.33.5
.62.8
I'J5.2
2.6-1.5
1.62.41.11.93.4
Year toyear
6.1-4.7
2.0
.S-1.1
406.5
-183.96.0
3.31.65.4
20.514.08.4
539.09.3
5.85.82.21.04.4-.82.62.12.85.4
4.8
-!e1.9.9
1.73.5
Finished goods excluding consumer foods
Total
Dec. toDec.1
2.53,3
4.32.02.36.6
21.17.26.26.88.3
14.8
13.48.74.201.12.2
-4.03.23.24.8
6.9.3
1.6-.41.92.32.6
Year toyear
2.62.8
3.53.72.04.0
16.212.16.27.17.2
11.8
16.210.34.61.81.41.4
-2.62.12.45.0
5.03.01.81.1
.61.92.4
Consumergoods
Dec. toDec.1
0.3.9
.3
o'0
.91.82.02.02.8
3.82.12.17.5
20.36.86.06.78.5
17.6
14.18.64.2-.9
.82.1
-6.64.13.15.3
8.7-.71.6
-1.42.02.33.7
Year toyear
01.2
.6-.300-.3
.91.51.82.32.3
3.03.51.84.6
17.010.46.27.37.1
13.3
18.510.34.11.21.01.1
-4.62.22.45.6
5.92.91.8.7
Jo2.9
Capitalequipment
Dec. toDec.1
1.2.9
o'!e.9
1.53.83.13.04.8
4.82.42.15.1
22.78.16.57.28.08.8
11.49.23.92.01.82.72.11.33.63.8
3.42.51.71.82.02.2
Year toyear
2.61.9
.3
3
!91.22.43.53.43.5
4.74.02.63.3
14.315.26.76.47.98.7
10.710.35.72.82.32.22.01.82.33.9
3.53.11.91.82.11.91.2
Finishedenergygoods
Dec.to
Dec.1
'""16311.612.08.5
58.1
27.914.1-.1
-9.2-4.2
-38.'l11.2-3.6
9.5
30.7-9.6
-t'.l3.51.1
12.0
Yearto
year
.._
11.715.76.5
35.0
49.219.1-1.5-4.8-4.2-3.9
-28.1-1.9-3.2
9.9
14.24.1-.4
-1.31.46.4
Finished goodsexcluding foods
and energy
Dec. toDec.1
17J6.05.76.28.49.4
10.87.74.91.92.02.72.72.14.34.2
3.53.12.0
.41.62.6
.6
Year toyear
iu11.45.76.07.58.9
11.28.65.73.02.42.52.32.43.34.4
3.73.62.41.21.02.11.4
Percent change from preceding month
Unad-justed
0.3
'.2.4.4.1
0-.1
~!60
o'!4.4.5
-.2.3
-.2
o'.2
Sea-son-
ally ad-justed
0.2.2.1.2.2
0
'.3
.6
.2-.1
.2
.2
-.1.4.2.4.4.5
Unad-justed
-0.5.4.2
0
-3.9
IX)-.2
.9
01.0-.6
.21.6
.21.0
,6-.4-.3
Sea-son-
ally ad-justed
-0.7
o'.2
-.5
.9
1.2-.11.1.1
-.4
~3-.5
L8
!s.3.8
-.1-.1
Unad-justed
0.6.2
!s.6
-.2-.2
~3-.3
.4
.5-.1
'.7.4.1
-.2
-i.8
3
Sea-son-
ally ad-justed
0.5
J.3.4
-.2
-.20
.2
.8
.3-.1
.5
.5
-.3
~'.2.2.2.6
Unad-justed
0.5
'.2.6
3
-.3
-.4.5
-.5.6
.6
~!61.0
!l
-.2.1
-.2.6.1
Sea-son-
ally ad-justed
0.5
'.2
i
-.30
'.201.0
.6
J.6.2
-.5
-.2.3.2.4.7.9
Unad-justed
0.6.1
'.I.1
.10
U.2
-.1
.1
.1
o'-.10
-.1.1
-.71.0.1.1
Sea-son-
ally ad-justed
0.4
'.I.2.1
.1
.1
3.4
0
-.10
o'0
0
'.}~3
Unad-justed
0.90
1.82.81.2
-1.8-.6
-23-2.6
2.0
2.3-.93.04.01.6
-.6
o'-.1
ll2
Sea-son-allyad-
justed
1.2-.1-.1
.51.0
-1.1
-1.9-.3
-J-1.0
3.8
2.4-.92.62.7-.4
-2.4
-.6
.}1.92.33.1
Unad-justed
0.4.2
'.I
o'.1
-.1
?.6.2.1
.1
-.1-.1
o'
o'-.61.00
.1
Sea-son-
ally ad-justed
0.3.2
'.2.2
.2
.1
3
'.I
-.1
-.10
.'l
0.1
-3.1.1
1 Changes from December to December are based on unadjusted indexes.2 Data nave been revised through August 1996 to reflect the availability of late reports and corrections by respondents. All data are sub-
ject to revision 4 months after original publication.
Source: Department of Labor, Bureau of Labor Statistics.
376
Digitized for FRASER http://fraser.stlouisfed.org/ Federal Reserve Bank of St. Louis

MONEY STOCK, CREDIT, AND FINANCE
TABLE B—67.—Money stock, liquid assets, and debt measures, 1959—96[Averages of daily figures, except debt; billions of dollars, seasonally adjusted]
Yearand
month
December:19591960196119621963196419651966196719681969197019711972197319741975197619771978197919801981198219831984198519861987198819891990199119921993199419951996*>
1995- JanFebMarAprMay"::":::::":""""::::::::""JuneJulyAuesept :::::::::::::::::::::::::::r:OctNov .Dec
1996: JanFebMarApr .May : ::.: ::JuneJulyAugsept'.... :Oct "" "NovDec/'
Ml
Sum ofcurrency,demanddeposits,travelers
checks, andother
checkabledeposits(OCOs)
140.0140.7145.2147.8153.3160.3167.9172.0183.3197.4203.9214.4228.3249.2262.8274.3287.5306.3331.3358.4382.8408.8436.5474.5521.1552.1619.8724.4749.8786.9794.2825.8897.2
1,024.41.128.61,148.71,124.91.076.91,149.21,147.71,148.71.151.21,146.11,144.51.145.41,143.81,140.11,131.81,129.01,124.91,119.2,117.3,126.7,123.6.117.0,116.4
1.107.91.098.81.090.91.075.71,075.81.076.9
M2
Ml plusretail
MMMFbalances,savingsdeposits
(includingMMDAs),
andsmall timedeposits
297.8312.4335.5362.7393.3424.8459.2480.2524.8566.9587.9626.6710.3802.3855.5902.5
1,017.01,152.71,271.51,368.01,475.71,601.01,756.01,910.92,127.92.312.42.497.82,734.62,834.42,997.93,164.03,282.23.383.73,438.73.494.03,509.23,657.43,825.63,513.93,513.83,518.83.528.43.540.83,569.13,587.03,607.33,620.83,628.43,640.23,657.43,671.63,687.23,722.13,727.13,720.63,736.73,741.73,753.63,764.03,773.33.797.83.825.6
M3
M2pUislarge timedeposits,
RPs, Euro-dollars, andinstitution-only MMMF
balances
299.7315.2340.8371.3405.9442.4482.1505.4557.9607.2615.9677.2776.0886.0985.0
1,070.11,172.11,311.91.472.51,646.81,806.51,992.22,240.72,442.32,685.02,979.73,198.03,486.43,673.23,912.44,065.54,124.14,178.44,187.14,249.54,319.24,572.14,894.44,341.84.351.94,369.24,390.84,417.04,453.14.480.04.508.44,529.54.545.44.557.44,572.14,600.34,638.14,680.14,688.64,701.64,722.24,733.74,751.84,780.74,816.34,845.54.894.4
L
M3 plusother liquid
assets
388.6403.5430.6465.9503.6540.3584.4615.1667.3729.9764.4816.0902.9
1,022.91.142.51,250.01,366.81,516.81,705.41,911.12,119.82,329.22,603.22,851.33,147.53,522.03.825.34,122.44,328.54,664.24,894.24,975.85.004.45,075.65,164.45.302.95,681.5
5,329.15,360.65.395.45,427.75,453.05,489.85,537.95,574.75,621.75,649.15,656.05,681.55,700.25,720.75,779.85,806.95,804.35,834.35,850.55,881.55,922.95,943.6
Debt1
Debt ofdomestic
nonfinancialsectors
(monthlyaverage ofadjacent
month-endlevels)
687.6723.0765.7818.4873.3936.8
1,003.71,070.91,145.21,236.81,326.71,416.11,549.61,705.71,890.82,063.52,251.22,495.52,811.53,201.63,591.23,933.74,330.84,760.05,327.96,112.77,025.37,906.38,664.19,441.6
10,171.610,852.611.337.111,880.712,506.513,148.413,866.9
13,201.713,277.313,345.213,405.513,482.613,560.613,613.913,654.213,704.413,764.113,820.713,866.913,917.513,990.214,066.314,133.814,189.914,246.214,317.014,372.314,418.414,480.114,545.2
Percent change f rom year or 6months earlier2
Ml
0.53.21.83.74.64.72.46.67.73.35.16.59.25.54.44.86.58.28.26.86.86.88.79.85.9
12.316.93.54.9
.94.08.6
14.210.21.8
-2.1-4.3-.4-.4-.3
.4-.5-.7-.7-.7
-1.5-3.4-3.0-3.4-4.6-4.6-2.4-1.4-2.1-1.5-2.0-3.3-6.4-8.5-7.4-7.1
M2
4.97.48.18.48.08.14.69.38.03.76.6
13.413.06.65.5
12.713.310.3
7.67.98.59.78.8
11.48.78.09.53.65.85.53.73.11.61.6.4
4.24.6
:&.9
1.42.03.44.25.35.85.75.64.94.74.45.65.44.44.33.83.62.32.54.14.8
M3
5.28.18.99.39.09.04.8
10.48.81.4
10.014.614.211.28.69.5
11.912.211.89.7
10.312.59.09.9
11.07.39.05.46.53.91.41.3
.21.51.65.97.03.03.53.94.55.26.26.47.27.37.06.45.35.45.86.66.36.36.65.84.94.35.46.17.3
Debt
7.65.15.96.96.77.37.16.76.98.07.36.79.4
10.110.99.19.1
10.912.713.912.29.5
10.19.9
11.914.714.912.59.69.07.76.74.54.85.35.15.5
5.35.65.65.75.86.36.25.75.45.45.04.54.54.95.35.45.35.55.75.55.04.95.0
1 Consists of outstanding credit market debt of the U.S. Government, State and local governments, and private nonfinancial sectors, dataderived from flow of funds accounts.2 Annual changes are from December to December; monthly changes are from 6 months earlier at a simple annual rate.
Note.—See Table B-68 for components.Source: Board of Governors of the Federal Reserve System.
377
Digitized for FRASER http://fraser.stlouisfed.org/ Federal Reserve Bank of St. Louis
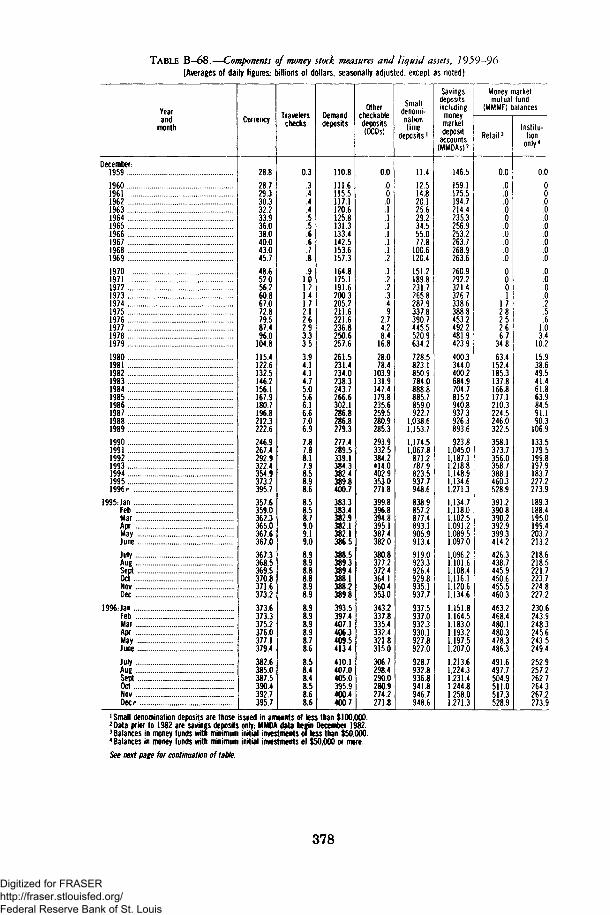
TABLE B—68.—Components of money stock measures and liquid assets, 1959—96[Averages of daily figures; billions of dollars, seasonally adjusted, except as noted]
Yearand
month
December:1959
I960196119621963196419651966196719681969
197019711972197319741975 ...19761977 .19781979
1980198119821983198419851986198719881989
1990199119921993199419951996* .
1995: JanFebMar .AprMay .:::::::::::::::::::::::'':::::::::June .
JulyAue .SeptOctNovDec
1996- JanFebMarAprMayJune
JulyAugsept ...::".::: ::: :~::OctNov .Dw ..
Currency
28.8
28.729.330.332.233.936.038.040.043.045.7
48.652.056.260.867.072.879.587.496.0
104.8
115.4122.6132.5146.2156.1167.9180.7196.8212.3222.6
246.9267.4292.9322.4354.9373.2395.7
357.6359.0362.3365.0367.6367.0
367.3368.5369.5370.8371.6373.2
373.6373.3375.2376.0377.1379.4
382.6385.0387.5390.4392.7395.7
Travelerschecks
0.3
.3
.4
.4
.4
.5
.5
.6
.6
A
.91.01.21.41.72.12.62.93.33.5
3.94.14.14.75.05.66.16.67.06.9
7.87.88.17.98.58.98.6
8.58.58.79.09.19.0
8.98.98.88.88.98.9
8.98.98.98.98.78.6
8.58.48.48.58.68.6
Demanddeposits
110.8
111.6115.5117.1120.6125.8131.3133.4142.5153.6157.3
164.8175.1191.6200.3205.2211.6221.6236.8250.6257.6
261.5231.4234.0238.3243.7266.6302.1286.8286.8279.3
277.4289.5339.1384.3382.4389.8400.7
383.3383.4382.9382.1382.1386.5
388.5389.3389.4388.1388.2389.8
393.5397.4407.1406.3409.5413.4
410.1407.0405.0395.9400.4400.7
Othercheckabledeposits(OCDs)
0.0
.0
.0
.0
.1
.1
.1
.1
.1
.1
.2
.1
.2
.2
.3
.4
.92.74.28.4
16.8
28.078.4
103.9131.9147.4179.8235.6259.5280.9285.3
293.9332.5384.2414.0402.9353.0271.8
399.8396.8394.8395.1387.4382.0
380.8377.2372.4364.1360.4353.0
343.2337.8335.4332.4321.8315.0
306.7298.4290.0280.9274.2271.8
Smalldenomi-nationtime
deposits1
11.4
12.514.820.125.629.234.555.077.8
100.6120.4
151.2189.8231.7265.8287.9337.8390.7445.5520.9634.2
728.5823.1850.9784.0888.8885.7859.0922.7
1,038.61,153.7
1,174.51,067.8
871.2787.9823.5937.7948.6
838.9857.2877.4893.1905.9913.4
919.0923.3926.4929.8935.1937.7
937.5937.0932.3930.1927.8927.0
928.7932.8936.8941.8946.7948.6
Savingsdeposits,including
moneymarketdeposit
accounts(MMDAs)2
146.5
159.1175.51947214.4235.3256.9253.2263.7268.9263.6
260.9292.2321.4326.7338.6388.8453.2492.2481.9423.9
400.3344.0400.2684.9704.7815.2940.8937.3926.3893.6
923.81,045.01,187.11,218.81,148.91,134.61,271.3
1,134.71,118.01,102.51,091.21,089.51.097.0
1,096.21,101.61,108.41,116.11,120.61,134.6
1,151.81,164.51,183.01,193.21,197.51,207.0
1,213.61,224.31,231.41,244.81,258.01.271.3
Money marketmutual fund
(MMMF) balances
Retail3
0.0
.0
.0
.0
.0
.0
.0
.0
.0
.0
.0
.0
.0
.0
.11.72.82.52.66.7
34.8
63.4152.4185.3137.8166.8177.1210.3224.5246.0322.5
358.1373.7356.0358.7388.1460.3528.9
391.2390.8390.2392.9399.3414.2
426.3438.7445.9450.6455.5460.3
463.2468.4480.1480.3478.3486.3
491.6497.7504.9511.0517.3528.9
Institu-tion
only4
0.0
.0
.0
.0
.0
.0
.0
.0
.0
.0
.0
.0
.0
.0
.0
.2
.5
.61.03.4
10.2
15.938.649.541.461.863.984.591.190.3
106.9
133.5179.5199.8197.9183.7227.2273.9
189.3188.4195.0199.4203.7213.2
218.6218.5221.7223.7224.8227.2
230.6243.9248.3245.6243.5249.4
252.9257.2262.7264.3267.2273.9
1 Small denomination deposits are those issued in amounts of less than $100,000.2 Data prior to 1982 are savings deposits only; MMDA data begin December 1982.3 Balances in money funds with minimum initial investments of less than $50,000.'Balances in money funds with minimum initial investments of $50,000 or more.
See next page for continuation of table.
378
Digitized for FRASER http://fraser.stlouisfed.org/ Federal Reserve Bank of St. Louis

TABLE B-68.—Components of money stock measures and liquid assets, 1959-96—Continued
[Averages of daily figures; billions of dollars, seasonally adjusted, except as noted]
Yearand
month
December:1959196019611962196319641965196619671968196919701971197219731974197519761977197819791980198119821983198419851986198719881989 „.1990199119921993199419951996'
1995- JanFebMarAprMayJuneJulyAUBsept ZIZZZZ7 ZZZZT"OctNovDec
1996- JanFebMarAprMay ZLZ ZL-ZZT"JuneJulyAugSentOctNovDec p
Largedenomi-nationtime
deposits*
1.22.0397.0
10815221.223130.937420.445.157673.3
1110144.7129.71181145.21956223.1260.23038324.83164403.2422.44202467.0518.3541.5480.94165353.6333.7363.141724943363.83713377.2380.63841387.2393.5396.4400.34097415.3417.2416.1421.642854313437.5444.2
449.8452.5459647594816494.3
Over-night
and termrepur-chaseagree-ments(RPs)(net)
0.0.00.0o0.0o.0o
4.93.0526.6
12814214.725132.944647757.465367.4945
1054119.9143.3172.61890158.0138.81194128.11575180.91794191118741920191.1192.2197.3191.81887193.5193.51912186.81794186.6188.718681876203.0194.3192.5191.6194719691949191.1
Over-night
and termEuro-
dollars(net)
0.7.8
151619241.8222.2292.72.4293.95885
10.215421.935149.857.777089.8
104896.994.0
1039108.2117095.288.779.366.966.382.3909
109687386487.290.191.191.892.292.793.292590.390.995.496.694497.097.197.696.896.9997
105.81039109.6
Savingsbonds
46145746546948149049.650251.251851752.054357660463367.271876480379572.367868.071174279.5918
100.61094117.5126.01379156.61715180.31848
18051805180.7181.21817182.41830183.5183.91842184.51848185.0185.018521856186.0186.4186.8187.21873187.3
Short-term
Treasurysecurities
38.636.737039840738540.743238.746159.548.836040.749352868.469878.4814
108.2133.91494182.92132261.9298.22758249.52668324.0334.2329.1345.93428386.94755
38703999410.9411.8405.2414.4433.9437.1456.84656464.4475.5466.0445.04596461.4432.6443.4
445.5452.64609449.4
Bankersaccept-ances
069
1 11 112131.6181.8233.33.5383550
12610.710814.122027132.039944.545045442.137144.540240.736.123920.914914.2120
13613513.713.412011.012.112.412.813412.612.011.810.398
10310.811.411.411.311511.6
Commer-cial
paper
3.65.152687 791
10.214417.822534.034.532735.242851248.552564.080798.398.8
1053113.61332160.7207.52313260.63354346.5
355.3335.2365.0385.6402.4437.1
4063414.9420.9430.6437.0428.9429.0433.3438.6440.5437.1437.1437.2442.34451461.0473.4470.9
473.1478.6482.4479.1
5 Large denomination deposits are those issued in amounts of more than $100,000.Note.—See also Table B-67.Source: Board of Governors of the Federal Reserve System.
379
Digitized for FRASER http://fraser.stlouisfed.org/ Federal Reserve Bank of St. Louis

TABLE B-69-—Aggregate reserves of depository institutions and monetary base, 1959-96
[Averages of daily figures L, millions of dollars; seasonally adjusted, except as noted]
Year and month
December:1959I96019611962 . .19631964196519661967196819691970197119721973 . .1974197519761977 . .. .197819791980198119821983198419851986 .1987198819891990199119921993199419951996*
1995- JanFebMarAprMayJune zzzzzzzzzzJulyAugSe&ZZ7ZZT.ZZZZ'OctNovDec
1996: JanFebMarAprMay "... . "." I.."JuneJulyAugSeptOct ZZZZZ ZZ"~NovDeep
Adjusted for changes in reserve requirements2
Reserves of depository institutions
Total
11,10911,24711,49911,60411,73012,0111231612,22313,18013,76714,16814,55815,23016,64517,02117,55017,8221838818,99019,75320,72022,01522,44323.60025,3672635431,46038,95038,86640,41040,50841,78045,5475436760,5195936456,36450,16659,14558,85758,50057,98857,80157,38357,68057,4995734456,839563335636455,6065434855,72755,18254,22754,11253,19752,2695135150,13549,87550.166
Nonbor-rowed
10.16811,17211,36611.3441139711.74711,87211,69012.95213.02113.04914.22515.10415.59515.72316.82317.69218.33518.42018.88519.24820.3252130722.96624,59323.66730.14138.12338.08938,69440,24241.45545.35554,24360.43759.15656.10650.01159.00958.79858.43157.87757.65157.11057.30957.21757.06656.59356,12956.10655.56854.81355,70655.09154.10053.72652.82951.93550.98349.84849.66150.011
Nonbor-rowedplus
extendedcredit
10.16811.17211,36611.3441139711.74711,87211,69012,95213,02113,04914,22515,10415.59515.72316.97017.70418,33518,42018,88519.24820.32821.95623.15224.59526,27230,64138,42638,57239,93840.26241.47845.35654,24460.43759.15656.10650.01159.01358.79858.43157,87757.65157.11057,30957,21757,06656,59356.12956,10655.56854.81355,70655,09154,10053.72652.82951.93550.98349,84849,66150.011
Required
10,60310,50310,91511,03311,23911,60511,89211,88412,80513,34113,88214,30915,04916,36116,71717,29217,55618,11518,80019,52120,27921,50122,12423,10024,80625,99930,42337,58037,82039,36239,58540,11644,56953,21259,45658,19655,08648,74657,80657,91157,70657,23556,92156,41856,59056,51256,39455,75855,39055,08654,12153,99754,59054,06253,36852,96252,13251,30850,31349,14248,84048.746
Mone-tarybase
40,88040,97741,85342,95745,00347,16149,62051,56554,57958,35761,56965,01369,10875,16781,07387,53593,887
101,515110,323120,445131,143142,004149,021160,127175,467187,237203,529223,571239,784256,920267,723293,332317,502351,244386,877418,723435,006453,509421,032422,421425,165427,551430,112429,308429,822430,807431,685432,737433,206435,006435,182433,667436,871436,644437,009439,088441,881444,204445,880447,187449,345453.509
Borrowings of depositoryinstitutions from theFederal Reserve, NSA
Total
94174
133260332264444532228746
1,119332126
1,0501,298
72713053
569868
1,4731,690
636634774
3,1861,318
827777
1,71626532619212482
2092571551365969
11115027227128227824520425738352191
127386368334368287214155
Seasonal
4132141355
13582
116543396
113563893
1308476381831
100406846335182
1371722312582521997340
78
1034
10519228430930621210968
Extendedcredit
14712
148186
2,604499303483
1,2442023
0000400000000000000000000000
1 Data are prorated averages of biweekly (maintenance period) averages of daily figures.2 Aggregate reserves incorporate adjustments for discontinuities associated with regulatory changes to reserve requirements. For details onaggregate reserves series see Federal Reserve Bulletin
Note.—NSA indicates data are not seasonally adjusted.Source: Board of Governors of the Federal Reserve System.
380
Digitized for FRASER http://fraser.stlouisfed.org/ Federal Reserve Bank of St. Louis

TABLE B-70.—Bank credit at all commercial banks, 1972-96[Monthly average; billions of dollars, seasonally adjusted']
Year and month
December:1972197319741975197619771978197919801981198219831984198519861987
New series198819891990199119921993 ..199419951996
1995JanFebMarAprMayJuneJulyADCSeptOctNovDec
1996-JanFebMarAprMayJuneJulyAucsept'::::::::::::::::::::OctNovDec
Totalbankcredit
572.5647.8713.7745.1804.6891.5
1.013.91.135.61,238.61.307.01.400.41.552.21.722.91,910.42.093.72.241.2
2.435.72,608.92,751.52,856.22,957.73,113.63,326.23,610.13,767.73,355.53,370.53,398.03,474.73,495.53.517.03,536.83,548.33,568.53,588.03.598.73,610.13,640.33,650.43,642.83,669.53,674.03,680.73,685.33,675.53,690.03,717.93,745.43,767.7
Securities in bank credit
Totalsecuri-
ties
182.4187.6193.8227.9249.8259.3266.8286.2325.0339.8366.5428.3400.7449.8504.0531.6
562.0584.5633.7745.0843.5918.8952.3
1,001.9993.6952.3944.2949.3
1,001.9993.6995.5987.8989.1992.4996.9999.1
1,001.9999.6
1,005.0989.4990.7996.6989.7983.7972.3966.5968.5986.5993.6
U.S.Govern-
mentsecuri-
ties
89.088.286.3
116.7136.3136.6137.6144.3170.6179.3201.7259.2259.8270.8310.1335.8
366.8400.0455.6565.2666.8733.9732.1710.5704.3730.3727.0715.0708.0709.7708.5701.7705.8705.4712.3714.1710.5701.6713.3702.6704.5713.2708.5707.6701.3702.2700.9705.7704.3
Othersecuri-
ties
93.499.4
107.5111.2113.5122.7129.2141.9154.4160.5164.8169.1140.9179.0193.9195.8
195.2184.5178.1179.8176.7184.9220.2291.4289.3222.0217.1234.3294.0283.9286.9286.1283.3286.9284.6285.0291.4298.0291.7286.7286.2283.4281.3276.1271.0264.3267.6280.8289.3
Loans and leases in bank credit
Totalloansand
leases2
390.1460.2519.9517.2554.8632.3747.1849.4913.5967.3
1,033.91,123.91,322.21,460.61,589.71,709.6
1.873.82,024.42,117.82,111.22,113.32,194.82,373.92,608.12,774.02,403.22,426.32,448.72,472.72,501.82,521.52,549.02,559.22.576.22,591.12,599.62,608.12,640.72,645.42,653.52,678.82,677.42,691.02,701.62,703.32,723.52,749.42,759.02,774.0
Com-mercial
andindus-trial
137.1165.0196.6189.3190.9211.0246.2291.4325.7355.4392.5414.2473.2500.2536.7566.4
608.0639.3640.9619.5596.2585.9645.1716.4786.0655.7668.0670.8680.8687.6691.6696.9699.0703.8709.4713.6716.4722.6725.6723.4732.6735.4738.5743.1744.5759.1770.3774.9786.0
Real estate
Total
98.1117.3130.1134.4148.8175.2210.5241.9262.6284.1299.9331.0376.3425.9494.1587.2
675.0770.1855.1879.9901.2940.4
1,002.41,077.51,124.71.013.71,021.61,028.61,035.41,041.31,049.41,062.01,067.31,071.01,075.31,076.71,077.51,085.91,089.01.094.11.097.61,100.11,103.31,103.81,110.01,111.81,114.21,117.61,124.7
Re-volv-ing
homeequity
39.950.162.169.573.472.975.279.185.275.776.076.176.677.177.778.078.378.578.478.879.179.579.779.780.079.679.379.980.681.282.483.485.2
Other
635.1719.9793.1810.4827.8867.5927.2998.4
1,039.6938.0945.6952.5958.8964.2971.7984.0989.0992.5996.9997.9998.4
1,006.41.009.21,014.31,017.61,020.51,024.11,023.91,029.51,030.61,031.81,034.21,039.6
Con-sumer
86.398.6
102.4104.9116.3138.3164.7184.5179.2182.5188.2212.9254.2295.0315.4328.2
357.7378.1383.2366.5358.9390.4451.2493.1518.7457.3459.9465.0470.1472.5478.0480.8485.2488.8489.1490.9493.1499.7499.4502.6507.1504.6510.0513.0514.3517.9517.5518.1518.7
Secu-rity
15.612.912.713.517.721.019.718.718.021.425.328.035.043.340.334.5
40.741.445.054.464.187.576.283.076.273.273.075.477.788.187.787.184.286.686.786.383.085.185.985.185.382.081.579.172.773.478.678.776.2
Other
53.066.478.175.181.186.8
106.0112.9128.0123.9128.0137.8183.5196.2203.2193.3
192.4195.6193.5190.9192.8190.6199.0238.1268.4203.4203.9208.9208.7212.4214.8222.3223.5225.9230.6232.1238.1247.2245.5248.3256.1255.3257.6262.6261.7261.4268.8269.6268.4
1 Data are Wednesday values or prorated averages of Wednesday values for domestically chartered commercial banks, branches and agen-cies of foreign banks, New York State investment companies (through September 1996), and Edge Act and agreement corporations. Beginning1988, data are adjusted for breaks caused by ^classifications of assets.2 Excludes Federal funds sold to, reverse repurchase agreements (RPs) with, and loans to commercial banks in the United States.
Note.—Data are not strictly comparable because of breaks in the series.Source: Board of Governors of the Federal Reserve System.
381
Digitized for FRASER http://fraser.stlouisfed.org/ Federal Reserve Bank of St. Louis

TABLE B-71.—Bond yields and interest rates, 1929-96[Percent per annum]
Year andmonth
19291933 .. .19391940194119421943194419451946194719481949195019511952195319541955 .. .1956195719581959I9601961196219631964196519661967196819691970197119721973197419751976197719781979198019811982198319841985198619871988198919901991199219931994
19951996
U.S. Treasury securities
Bills(new issues)1
3-month
0.515023.014.103.326.373.375.375.375.594
1.0401.102121815521.7661.931.953
1.7532.6583.2671.8393.405
2.9282.3782.7783.1573.5493.9544.8814.3215.3396.6776.4584.3484.0717.0417.8865.8384.9895.2657.221
10.041
11.50614.02910.6868.639.587.485.985.826.698.127.515.423.453.024.295.515.02
6-month
18323.2472.6052.9083.2533.6864.0555.0824.6305.4706.8536.5624.5114.4667.1787.9266.1225.2665.5107.572
10.01711.37413.77611.0848.759.807.666.036.056.928.047.475.493.573.144.665.595.09
Constantmaturities2
3-year
2.471.632.473.193.982.844.463.983.543.473.674.034.225.235.035.687.027.295.655.726.957.827.496.776.698.299.71
11.5514.4412.9210.4511.899.647.067.688.268.558.266.825.304.446.276.255.99
10-year
2.852.402.823.183.653.324.334.123.883.954.004.194.284.925.075.656.677.356.166.216.847.567.997.617.428.419.44
11.4613.9113.0011.1012.4410.627.688.398.858.498.557.867.015.877.096.576.44
30-year
'•'"•" '
"7.758.499.28
11.2713.4512.7611.1812.4110.797.788.598.968.458.618.147.676.597.376.886.71
Corporatebonds
(Moody's)
Aaa
4.734.493.012.842.772.832.732.722.622.532.612.822.662.622.862.963.202.903.063.363.893.794.384.414.354.334.264.404.495.135.516.187.038.047.397.217.448.578.838.438.028.739.63
11.9414.1713.7912.0412.7111.379.029.389.719.269.328.778.147.227.977.597.37
Baa
5.907.764.964.754.334.283.913.613.293.053.243.473.423.243.413.523.743.513.533.884.714.735.055.195.085.024.864.834.875.676.236.947.819.118.568.168.249.50
10.619.758.979.49
10.6913.6716.0416.1113.5514.1912.7210.3910.5810.8310.1810.369.808.987.938.638.208.05
High-grade
munici-pal
bonds(Stand-ard &Poor's)
4.274.712.762.502.102.362.061.861.671.642.012.402.211.982.002.192.722.372.532.933.603.563.953.733.463.183.233.223.273.823.984.515.816.515.705.275.186.096.896.495.565.906.398.51
11.2311.579.47
10.159.187.387.737.767.247.256.896.415.636.195.955.75
New-homemort-gage
yields3
::::::....
5.895.835.816.256.466.977.818.457.747.607.968.929.009.009.029.56
10.7812.6614.7015.1412.5712.3811.5510.179.319.19
10.1310.059.328.247.207.497.877.80
Com-mer-cial
paper,6
months4
5.851.73.59.56.53.66.69.73.75.81
1.031.441.491.452.162.332.521.582.183.313.812.463.973.852.973.263.553.974.385.555.105.907.837.715.114.738.159.846.325.345.617.99
10.9112.2914.7611.898.89
10.168.016.396.857.688.807.955.853.803.304.935.935.42
Primerate
chargedby
banks s
5.50-6.001.5M.OO
1.501.501.501.501.501.501.501.50
1.50-1.751.75-2.00
2.002.072.563.003.173.053.163.774.203.834.484.824.504.504.504.504.545.635.616.307.967.915.725.258.03
10.817.866.846.839.06
12.6715.2718.8714.8610.7912.049.938.338.219.32
10.8710.018.466.256.007.158.838.27
Discountrate,
FederalReserve
Bankof NewYork5
5.162.561.001.001.007 1.007 1.00
7 1.0071.007 1.00
1.001.341.501.591.751.751.991.601.892.773.122.153.363.533.003.003.233.554.044.504.195.165.875.954.884.506.447.836.255.505.467.46
10.2811.7713.4211.028.508.807.696.335.666.206.936.985.453.253.003.605.215.02
Federalfundsrate6
1.782.733.111.573.303.221.962.683.183.504.075.114.225.668.207.184.664.438.73
10.505.825.045.547.93
11.1913.3616.3812.269.09
10.238.106.816.667.579.218.105.693.523.024.215.835.30
1 Rate on new issues within period; bank-discount basis.2 Yields on the more actively traded issues adjusted to constant maturities by the Department of the Treasury.3 Effective rate (in the primary market) on conventional mortgages, reflecting fees and charges as well as contract rate and assuming, onthe average, repayment at end of 10 years. Rates beginning January 1973 not strictly comparable with prior rates.4 Bank-discount basis; prior to November 1979, data are for 4-6 months paper.5 For monthly data, high and low for the period. Prime rate for 1929-33 and 1947-48 are ranges of the rate in effect during the period.6 Since July 19,1975, the daily effective rate is an average of the rates on a given day weighted by the volume of transactions at theserates. Prior to that date, the daily effective rate was the rate considered most representative of the day's transactions, usually the one atwhich most transactions occurred.7 From October 30, 1942, to April 24,1946, a preferential rate of 0.50 percent was in effect for advances secured by Government securi-ties maturing in 1 year or less.
See next page for continuation of table.
382
Digitized for FRASER http://fraser.stlouisfed.org/ Federal Reserve Bank of St. Louis

TABLE B-71.—Bond yields and interest rates, 1929-96—Continued[Percent per annum]
Year andmonth
1992:JanFebMar
86—JuneJulyAugSeptOctNovDec
1993:JanFebMar . ..
frJulyAug '.::::SeptOctNovDec
1994:JanFebMarAprMayJuneJulyAugSeptOctNovDec
1995:JanFebMar
f,=JuneJuly...::AugSeptorf ..::::NovDec
1996:JanFebMar
£June ::J4 :::::::tfNovDec
U.S. Treasury securities
Bills(new issues) '
3-month
3.843.844.053.813.663.703.283.142.972.843.143.25
3.062.952.972.892.963.103.053.052.963.043.123.08
3.023.213.523.744.194.184.394.504.644.965.255.64
m5.735.675.705.505.475.415.265.305.355.16
5.024.874.964.995.025.115.175.095.155.015.034.87
6-month
3.883.944.193.933.783.813.363.233.012.983.353.39
3.173.083.083.003.073.233.153.173.063.133.273.25
3.193.383.794.134.644.584.814.915.025.395.696.21
6.316.105.915.805.735.465.415.405.285.345.295.15
4.974.794.965.085.125.265.325.175.295.125.075.02
Constantmaturities2
3-year
5.405.726.185.935.815.604.914.724.424.645.145.21
4.934.584.404.304.404.534.434.364.174.184.504.54
4.484.835.405.996.346.276.486.506.697.047.447.71
7.667.256.896.686.275.805.896.105.895.775.575.39
5.205.145.796.116.276.496.456.216.416.085.825.91
10-year
7.037.347.547.487.397.266.846.596.426.596.876.77
6.606.265.985.976.045.965.815.685.365.335.725.77
5.755.976.486.977.187.107.307.247.467.747.967.81
7.787.477.207.066.636.176.286.496.206.045.935.71
5.655.816.276.516.746.916.876.646.836.536.206.30
30-year
7.587.857.977.967.897.847.607.397.347.537.617.44
7.347.096.826.856.926.816.636.326.005.946.216.25
6.296.496.917.277.417.407.587.497.717.948.087.87
ffi7.457.366.956.576.726.866.556.376.266.06
6.056.246.606.796.937.067.036.847.036.816.486.55
Corporatebonds
(Moody's)
Aaa
8.208.298.358.338.288.228.077.957.927.998.107.98
7.917.717.587.467.437.337.176.856.666.676.936.93
6.927.087.487.887.997.978.118.078.348.578.688.46
8.468.268.128.037.657.307.417.577.327.127.026.82
6.816.997.357.507.627.717.657.467.667.397.107.20
Baa
9.139.239.259.219.139.058.848.658.628.848.968.81
8.678.398.158.148.218.077.937.607.347.317.667.69
7.657.768.138.528.628.658.808.748.989.209.329.10
m8.708.608.207.908.048.197.937.757.687.49
7.477.638.038.198.308.408.358.188.358.077.797.89
High-grade
munici-pal
bonds(Stand-ard &Poor's)
6.416.676.696.646.576.506.126.086.246.436.356.24
6.185.875.655.785.815.735.605.505.315.295.475.35
5.305.445.936.286.266.146.196.196.336.506.966.76
6.536.246.106.015.905.835.986.075.885.775.615.42
5.425.455.825.935.986.035.915.725.865.715.595.62
New-homemort-
yBJs3
8.498.658.518.588.598.438.008.007.937.908.077.88
7.827.777.467.467.377.237.207.056.956.806.806.92
6.956.856.997.317.437.627.717.677.707.767.817.83
8.188.288.218.157.997.737.787.757.697.587.467.40
7.327.207.497.767.808.058.018.087.987.957.807.79
Com-mer-cial
paper,
months4
4.064.134.384.133.973.993.533.443.263.333.673.70
3.353.273.243.193.203.383.353.333.253.273.433.40
3.303.624.084.404.924.865.135.195.325.706.016.62
6.636.386.306.196.075.795.685.755.665.715.595.43
5.234.995.265.385.425.575.675.515.665.455.405.44
Primerate
charged
banks5
High-low
6.50-6.506.50-6.506.50-6.506.50-6.506.50-6.506.50-6.506.50-6.006.00-6.006.00-6.006.00-6.006.00-6.006.00-6.00
6.00-6.006.00-6.006.00-6.006.00-6.006.00-6.006.00-6.006.00-6.006.00-6.006.00-6.006.00-6.006.00-6.006.00-4.00
6.00-6.006.00-6.006.00-6.256.25-6.756.75-7.257.25-7.257.25-7.257.25-7.757.7^-7.757.75-7.757.75-8.508.50-8.50
8.50-8.508.50-9.009.00-9.009.00-9.009.00-9.009.00-9.009.00-8.758.75-8.758.75-8.758.75-8.758.75-J.758.75-8.50
8.50-8.508.50-8.258.25-8.258.25-8.258.25-8.258.25-8.258.25-S.258.25-8.258.25-8.258.25-8.258.25-8.258.25-8.25
Discountrate,
FederalReserve
Bankof NewYork*
High-low
3.50-3.503.50-3.503.50-3.503.50-3.503.50-3.503.50-3.503.50-3.003.00-3.003.00-3.003.00-3.003.00-3.003.00-3.00
3.00-3.003.00-3.003.00-3.003.00-3.003.00-3.003.00-3.003.00-3.003.00-3.003.00-3.003.00-3.003.00-3.003.00-3.00
3.00-3.003.00-3.003.00-3.003.00-3.003.00-3.503.50-3.503.50-3.503.50-4.004.00-4.004.00-4.004.00-4.754.75-4.75
4.75-4.754.75-5.255.25-5.255.25-5.255.25-5.255.25-5.255.25-5.255.25-5.255.25-5.255.25-5.255.25-5.255.25-5.25
5.25-5.005.00-5.005.00-5.005.00-5.005.00-5.005.00-5.005.00-5.005.00-5.005.00-5.005.00-5.005.00-5.005.00-5.00
Federalfundsrate6
4.034.063.983.733.823.763.253.303.223.103.092.92
3.023.033.072.963.003.043.063.033.092.993.022.96
3.053.253.343.564.014.254.264.474.734.765.295.45
5.535.925.986.056.016.005.855.745.805.765.805.60
5.565.225.315.225.245.275.405.225.305.245.315.29
Sources: Department of the Treasury, Board of Governors of the Federal Reserve System, Federal Housing Finance Board, Moody's InvestorsService, and Standard & Poor's Corporation.
383
Digitized for FRASER http://fraser.stlouisfed.org/ Federal Reserve Bank of St. Louis

TABLE B-72.—Credit market borrou'ing, 1987-96[Billions of dollars; quarterly data at seasonally adjusted annual rates]
Item
NONFIMANCIAL SECTORS
DOMESTIC
FEDERAL GOVERNMENT
Treasury securitiesBudget agency securities and mortgages
NONFEDERAL BY INSTRUMENT
Commercial paperMunicipal securities and loansCorporate bonds :Bank loans n e eOther loans and advances
MortgagesHomeMultifamily residentialCommercialFarm
Consumer credit
NONFEDERAL BY SECTOR
Household sectorNonfinancial business
CorporateNonfarm noncorporateFarm
State and local governments
FOREIGN BORROWING IN THE UNITED STATES
Commercial paperBondsBank loans n.e.cOther loans and advances
NONFINANCIAL DOMESTIC AND FOREIGN BORROWING ...
FINANCIAL SECTORS
BY INSTRUMENT
Federal Government relatedGovernment-sponsored enterprises securitiesMortgage pool securitiesU.S. Government loans
Private financial sectorsOpen market paperCorporate bondsBank loans n e eOther loans and advancesMortgages
BY SECTOR
Commercial bankingSavings institutionsGovernment-sponsored enterprisesFederally related mortgage poolsAsset-backed securities issuersFinance companiesFunding corporations * . . . .
ALL SECTORS
BY INSTRUMENT ..
Open market paperU.S. Government securitiesMunicipal securities and loansCorporate and foreign bondsBank loans n.e.cOther loans and advancesMortgages ..Consumer credit
1987
734.0
143.9142.4
1.5
590.1
1.691.678.810.843.8
330.3247.6
16.973.3-7.433.2
590.1
306.8192.2148.755.2
-11.691.1
6.3
3.87.4
-3.6-1.4
740.2
291.6
168.330.2
138.8-.8
123.326.978.6-8325.*
291.6
21.528.7295
138.849.923.29.7
-9.7
1,031.8
32.3312.191.6
164.7-1.167.5
330.633.2
1988
776.5
155.1
137.717.4
621.4
11.959.3
103.133.955.6
298.8229.3
17.756.5-4.858.8
621.4
267.9299.0225.084.2
-10.254.5
7.5
8.76.9
-1.8-6.4
784.0
249.2
119.844.974.S
129.554.852.227
19.4
249.2
2.021.644.974.937.623.938.(
1,033.2
75.4274.959.3
162.234.868.6
299.158.8
1989
719.1
146.4
144.71.6
572.7
21.452.973.827.858.5
293.7235.2
10.650.3-2.544.5
572.7
268.2253.4183.269.6
.651.1
10.2
13.14.9-.1
-7.6
729.2
225.0
149.525.2
124.3
75.531.340.8135
-10.5.3
225.0
5.2-15.0
25.2124.327.727.412.517.7
954.3
65.9295.«
52.9119.541.240.5
294.044.5
1990
669.8
246.9
238.78.2
422.9
9.749.347.1
.468.1
232.4226.3
1.56.1
-1.616.1
422.9
264.1112.2110.0
1.11.0
46.6
23.9
12.321.4-2.9-7.0
693.7
211.4
167.417.1
150.3
44.08.6
54.04.7
-23.9.6
211.4
-26.8-30.9
17.0150.3
60.223.J15.42.3
905.1
30.7414.4
49.3122.5
2.237.1
233.016.1
1991
481.7
278.2
292.0-13.8
203.5
-18.487.878.8
-40.9-48.5
158.4173.6-5.5
-10.0.4
-13.7
203.5
183.8-61.9-53.0-11.0
2.181.6
14.8
6.415.03.1
-9.8
496.5
155.6
145.79.2
136.6.0
9.8-32.0
69.98.8
-37.3c
155.6
-13.2-44.7
9.1136.6
54.C17.7-6.5
2.5
652.1
-44.0424.(
87.8163.6-29.1-95.6158.9-13.7
1992
543.0
304.0
303.8.2
239.0
8.630.567.6
-13.710.1
130.9187.6-10.4-47.8
1.45.0
239.0
198.319.534.1
-16.01.3
21.1
23.7
5.216.82.3-.6
566.7
240.0
155.840.3
115.6.0
84.2-.7
82.72.2
~!6
240.0
10.0-7.C40.2
115.658.5-1.613.211.1
806.6
13.1459.8
30.5167.1-9.3
8.9131.5
5.0
1993
627.0
256.1
248.37.8
370.9
10.074.875.23.6
-9.4
155.2185.8-6.0
-25.0
6L5
370.9
255.952.746.5
4.22.0
62.3
70.4
-9.082.9
-4^2
697.4
292.2
165.380.684.7
.0
126.9-6.2
120.1-13.0
22.43.6
292.2
13.411.380.684.783.J
2!<15.9
989.6
-5.1421.4
74.8278.2-8.6
8.7158.861.5
1994
621.2
155.9
155.7.2
465.4
21.4-29.3
23.373.254.4
196.0203.9
1.7-11.3
1.8126.3
465.4
372.4136.4121.7
11.92.8
-43.4
-15.3
-27.312.2
1.4-1.6
606.0
466.7
287.5176.9115.4-4.8
179.241.6
117.5-12.3
22.69.8
466.7
20.112.8
172.1115.468.550.224.2
3.3
1,072.7
35.7448.1293
153.062370.7
205.8126.3
1995
7204
1444
142.91.5
576.0
18.1-44.2
73.399.659.0
228.6196.910.519.5
1.6141.6
576.0
383.1241.5205.134.8
1.6-48.6
69.5
13.648.3
8.5-.8
789.9
446.7
205.1106.998.2
.0
241.642.6
184.75.53.45.3
446.7
22.52.6
106.998.2
132.351.632.0
.7
1,236.5
74.3349.5-44.2306.3113.561.6
233.9141.6
1 Credit unions, life insurance companies, mortgage companies, real estate investment trusts, and brokers and dealers.
See next page for continuation of table.
384
Digitized for FRASER http://fraser.stlouisfed.org/ Federal Reserve Bank of St. Louis

TABLE B-72.—Credit market borrowing, 1987-96—Continued[Billions of dollars; quarterly data at seasonally adjusted annual rates]
Item
NONFINANCIAL SECTORS
DOMESTIC
FEDERAL GOVERNMENT
Treasury securitiesBudget agency securities and mortgages
NONFEDERAL BY INSTRUMENT
Commercial paperMunicipal securities and loansCorporate bonds . .. . ...Bank loans n.e.cOther loans and advancesMortgages
HomeMultifamily residentialCommercialFarm
Consumer creditNONFEDERAL B Y SECTOR . . .
Household sectorNonfinancial business
CorporateNonfarm noncorporateFarm . .
State and local governmentsFOREIGN BORROWING IN THE UNITED STATES
Commercial paperBondsBank loans nee. . .Other loans and advances
NONFINANCIAL DOMESTIC AND FOREIGN BORROWING
FINANCIAL SECTORS
BY INSTRUMENT
Federal Government relatedGovernment-sponsored enterprises securitiesMortgage pool securitiesU S Government loans
Private financial sectorsOpen market paperCorporate bondsBank loans n e e .Other loans and advancesMortgages
BY SECTORCommercial bankingSavings institutionsGovernment-sponsored enterprisesFederally related mortgage poolsAsset-backed securities issuersFinance companiesFunding corporations
ALL SECTORS
BY INSTRUMENT
Open market paperU.S. Government securitiesMunicipal securities and loansCorporate and foreign bondsBank loans n e.c . ...Other loans and advancesMortgagesConsumer credit
1
845.7
247.8
2490-1.2
5979
60-54.9
530145.5825
22822099
66100
1.71376
5979
38232698230438.5
8-54.2
67.1
43213.9811.9
912.8
2677
867629238o
1810376
1676-50
-24552
267.7
217-18.9
62.9238676802625
-320
1,180.5
8683345-54.923451487598
2334137.6
19
II
866.0
1847
18311.6
6813
34.3-2.298499.1573
23951908109361
1.71550
6813
389930042683
29.130
-9.0
45.5
-8751256
-26
911.4
4399
19651272693o
2434339
1823207
1352
4399
390-7.2
127.2693
113.2520264200
1,351.3
595381 1-22
33191254560
2447155.0
55
III
578.7
86.0
856.4
4927
18.1-107.2
59875.3352
2550227.9
113137
2.21564
4927
424617841405
34.43 5
-110.3
88.3
23755.28 21.3
667.0
5070
227710151262o2793437
2176794 952
507.0
3895.1
101.51262164.819839411.3
1,174.0
8553137
-107.2332591441.3
2603156.4
IV
591.4
59.3
54151
5321
141-12.6
820785610
191 71591
1331821 1
1175
5321
335621741813371-10
-209
769
-397 2 7119-39
6683
5720
3095136 11734
o2625551
1716-1832056
5720
-9731.5
136.117341835543-434
1,240.3
6533688-1263263886892
1972117.5
1
874.5
239.9
2422-2.3
6346
301-14.2
609298329
36363191
1382842 4
1315
6346
461018621398463
1-125
49.2
-84479871 1
923.7
3303
1438374
1065o1865178
1438249-55
5 5
330.3
-32611.037.4
1065132.8471316-34
1,254.0
3953837-14.22525633286
3691131.5
1996
II
6937
62.4
6022.2
6313
10736.971 5788269
31872488
184461
53878
6313
398420271584372
7 l301
366
9 611 1151
7
7303
6875
302013291691o38551057201823648658
687.5
40142.1
132.91691128.2684709358
1,417.8
12603644
36.928451175
76.23245
87.8
III
6704
1613
1644-3.1
5091
-165-76.2
7381329569
26802242
1472603 2
702
5091
329725592159416-1 5
-765
1058
3865944 731
7763
4537
2444840
1604o209385274796
33958
453.7
11 131.284.0
160486.2309350149
1,229.9
10734057-76220791471940
273970.2
Source: Board of Governors of the Federal Reserve System.
385
Digitized for FRASER http://fraser.stlouisfed.org/ Federal Reserve Bank of St. Louis

TABLE B-73.—Mortgage debt outstanding by type of property and of financing, 1940-96
[Billions of dollars]
End of yearor quarter
194019411942194319441945194619471948194919501951195219531954195519561957195819591960196119621963 .196419651966196719681969197019711972197319741975197619771978197919801981198219831984198519861987198819891990199119921993199419951994: I
I II l lIV
1995- 1||IIIIV
1996: II IIlk
Allproper-
ties
36.537.636.735.334.735.541.848.956.262.772.882.391.4
101.3113.7129.9144.5156.5171.8190.8207.5228.0251.4278.5305.9333.3356.5381.2411.1441.6473.7524.2597.4672.6732.5791.9878.6
1,010.31,163.01,328.41,463.01,572.81,650.71,841.92,071.12,334.22,635.12,985.33,280.33,582.13,802.33,960.24,091.84,266.94,472.74,706.64,299.84,358.54,417.94,472.74,514.24,581.64,657.94,706.64,782.04,869.44,949.1
Farmproper-
ties
6.56.46.05.44.94.84.95.15.35.66.16.77.27.78.29.09.8
10.411.112.112.813.915.216.818.921.223.125.127.529.430.532.435.439.844.949.955.463.972.886.897.5
107.2111.3113.7112.4105.995.287.783.080.578.979.380.781.283.084.681.382.182.683.083.483.884.484.685.286.587.3
Nonfarm properties
Total
30.031.230.829.929.730.836.943.950.957.166.775.684.293.6
105.4120.9134.6146.1160.7178.7194.7214.1236.2261.7287.0312.1333.4356.1383.5412.2443.2491.8562.0632.8687.5742.0823.2946.4
1,090.21,241.71,365.51,465.51,539.31,728.21,958.72,228.32,539.92,897.63,197.33,501.73,723.43,880.94,011.14,185.74,389.74,622.04,218.54,276.44,335.34,389.74,430.84,497.84,573.54,622.04,696.84,782.94,861.7
1-to 4-familyhouses
17.418.418.217.817.918.623.028.233.337.645.251.758.566.175.788.299.0
107.6117.7130.9141.9154.6169.3186.4203.4220.5232.9247.3264.8283.2297.4325.9366.5407.9440.7482.1546.3642.7753.5870.5969.0
1,049.11,096.41,219.41,360.41,535.71,741.71,976.52,217.42,459.52,674.82,848.23,036.33,225.53,429.43,626.33,263.23,316.83,374.33,429.43,465.03,519.03,587.13,626.33,689.23,757.73,824.9
Multi-familyproper-
ties
5.75.95.85.85.65.76.16.67.58.6
10.111.512.312.913.514.314.915.316.818.720.323.025.829.033.637.240.343.947.352.260.170.182.893.1
100.0100.6105.7114.0124.9134.9141.0138.9140.8154.0177.0205.3238.5260.9277.5288.5289.8284.4274.2270.8275.7288.0271.5273.6276.2275.7277.8280.9284.2288.0291.9297.0301.1
Com-mercialproper-
ties
6.97.06.76.36.26.47.79.1
10.210.811.512.513.414.516.318.320.723.226.129.232.436.541.146.250.054.560.164.871.476.985.695.9
112.7131.7146.9159.3171.2189.7211.8236.3255.5277.5302.2354.8421.4487.3559.7660.2702.4753.7758.8748.3700.6689.4684.6707.7683.8686.1684.7684.6688.0697.9702.2707.7715.7728.2735.7
Nonfarm properties by type of mortgage
Government underwritten
Total1
2.33.03.74.14.24.36.39.8
13.617.122.126.629.332.136.242.947.851.655.259.362.365.669.473.477.281.284.188.293.4
100.2109.2120.7131.1135.0140.2147.0154.1161.7176.4199.0225.1238.9248.9279.8294.8328.3370.5431.4459.7486.8517.9537.2533.3513.4559.3584.3521.2533.5551.1559.3565.4571.3578.4584.3592.3599.5611.0
1- to 4-family houses
Total
2.33.03.74.14.24.36.19.3
12.515.018.822.925.428.132.138.943.947.250.153.856.459.162.265.969.273.176i79.984.490.297.3
105.2113.0116.2121.3127.7133.5141.6153.4172.9195.2207.6217.9248.8265.9288.8328.6387.9414.2440.1470.9493.3489.8469.5514.2537.1476.7488.8506.2514.2520.3525.8531.0537.1544.3551.9562.4
FHAinsured
2.33.03.74.14.24.13.73.85.36.98.59.7
10.812.012.814.315.516.519.723.826.729.532.335.038.342.044.847.450.654.559.965.768.266.265.166.166.568.071.481.093.6
101.3108.0127.4136.7153.0185.5235.5258.8282.8310.9330.6326.0303.2336.8352.3309.7318.8331.9336.8341.7345.5348.5352.3357.2362.5370.3
VAguar-
anteed
0.22.45.57.28.1
10.313.214.616.119.324.628.430.730.430.029.729.629.930.930.931.131.332.533.835.737.339.544.750.056.261.667.073.682.092.0
101.6106.2109.9121.4129.1135.8143.1152.4155.4157.3160.0162.7163.8166.2177.3184.7167.0170.0174.3177.3178.6180.3182.5184.7187.2189.3192.0
Conventional 2
Total
27.728.227.125.825.526.530.634.137.340.044.749.154.961.569.378.086.894.6
105.5119.4132.3148.5166.9188.2209.8231.0249.3267.9290.1312.0333.9371.1430.9497.7547.3595.0669.0784.6913.9
1,042.71,140.41,226.71,290.51,448.41,663.91,900.02,169.42,466.12,737.73,014.83,205.53,343.73,477.83,672.33,830.44,037.73,697.33,742.93,784.23,830.43,865.43,926.63,995.24,037.74,104.54,183.44,250.8
1-to 4-familyhouses
15.115.414.513.713.714.316.918.920.822.626.328.933.238.043.649.355.160.467.677.085.595.5
107.1120.5134.1147.4156.9167.4180.4193.0200.2220.7253.5291.7319.4354.3412.8501.0600.2697.6773.9841.5878.5970.5
1,094.51,246.91,413.11,588.61,803.32,019.42,203.92,354.92,546.52,756.12,915.23,089.32,786.52,827.92,868.12,915.22,944.72,993.23,056.13,089.33,144.83,205.83,262.6
1 includes FHA insured multifamily properties, not shown separately.2 Derived figures. Total includes commercial properties, and multifamily properties, not shown separately.Source: Board of Governors of the Federal Reserve System, based on data from various Government and private organizations.
386
Digitized for FRASER http://fraser.stlouisfed.org/ Federal Reserve Bank of St. Louis

TABLE B-74.—Mortgage debt outstanding by holder, 1940-96[Billions of dollars]
End of yearor quarter
19401941194219431944194519461947194819491950195119521953195419551956195719581959I9601961196219631964 . . . .1965196619671968 .1969197019711972197319741975197619771978197919801981198219831984198519861987198819891990199119921993199419951994- 1
I IIll .IV
1995:1III l lIV ....
1996- 1 .IIHip .
Total
36.537.636.735.334.735.541.848.956.262.772.882.391.4
101.3113.7129.9144.5156.5171.8190.8207.5228.0251.4278.5305.9333.3356.5381.2411.1441.6473.7524.2597.4672.6732.5791.9878.6
1,010.31,163.01,328.41,463.01,572.81,650.71,841.92,071.12,334.22,635.12,985.33,280.33,582.13,802.33,960.24,091.84,266.94,472.74,706.64,299.84,358.54,417.94,472.74,514.24,581.64,657.94,706.64,782.04,869.44,949.1
Major financial institutions
Total
19.520.720.720.220.221.026.031.837.842.951.759.566.975.185.799.3
111.2119.7131.5145.5157.6172.6192.5217.1241.0264.6280.8298.8319.9339.1355.9394.2450.0505.4542.6581.2647.5745.2848.2938.2996.8
1,040.51,021.31,108.21,245.91,361.51,474.31,665.31,831.51,931.51,914.31,846.71,769.21,768.11,815.81,889.01,746.71,763.31,786.21,815.81,842.01,868.21,895.41,889.01,901.51,925.01,951.8
Savingsinstitu-tions'
9.09.49.29.09.19.6
11.513.816.118.321.925.529.834.941.148.955.561.268.978.187.098.0
111.1127.2141.9154.9161.8172.3184.3196.4208.3236.2273.7305.0324.2355.8404.6469.4528.0574.6603.1618.5578.1626.7709.7760.5778.0860.5924.6910.3801.6705.4628.0598.4596.2596.8584.5585.7587.5596.2601.8599.7604.6596.8602.6612.9628.0
Commer-cial
banks2
4.64.94.74.54.44.87.29.4
10.911.613.714.715.916.918.621.022.723.325.528.128.830.434.539.444.049.754.459.065.770.773.382.599.3
119.1132.1136.2151.3179.0214.0245.2262.7284.2301.3330.5379.5429.2502.5592.4674.0767.1844.8876.1894.5940.6
1,004.31,080.4
938.2957.0981.5
1,004.31,025.01,053.21,072.81,080.41,087.21,099.61,113.0
Lifeinsur-ancecom-
panies
6.06.46.76.76.76.67.28.7
10.812.916.119.321.323.326.029.433.035.237.139.241.844.246.950.555.260.064.667.570.072.074.475.576.981.486.289.291.696.8
106.2118.4131.1137.7142.0151.0156.7171.8193.8212.4232.9254.2267.9265.3246.7229.1215.3211.8224.0220.7217.2215.3215.2215.4217.9211.8211.7212.6210.8
Other holders
Federaland
relatedagen-cies3
4.94.74.33.63.02.42.01.81.82.32.83.54.14.64.85.36.27.78.0
10.211.512.212.611.812.213.517.520.925.131.138.346.454.664.882.2
101.1116.7140.5170.6216.0256.8289.4355.4433.4490.6581.9733.7858.9937.8
1,067.31,258.91,422.61,558.31,683.81,791.51,884.11,727.01,759.91,781.11,791.51,796.11,812.01,841.01,884.11,912.71,958.11,990.9
Indi-viduals
andothers4
12.012.211.711.511.512.113.815.316.617.518.419.320.421.723.225.327.129.132.335.138.443.146.349.552.755.258.261.466.171.479.483.692.8
102.4107.7109.6114.4124.6144.3174.3209.4242.9273.9300.3334.6390.8427.0461.1511.1583.3629.1690.9764.3815.1865.4933.6826.2835.3850.6865.4876.1901.4921.6933.6967.8986.3
1,006.31 Includes savings banks and savings and loan associations. Data reported by Federal Savings and Loan Insurance Corporation-insured
institutions include loans in process for 1987 and exclude loans in process beginning 1988.Includes loans held by nondeposit trust companies, but not by bank trust departments.Includes Government National Mortgage Association (GNMA), .Federal Housing Administration, Veterans Administration, Farmers Home
Administration (FmHA), Federal Deposit Insurance Corporation, Resolution Trust Corporation (through 1995), and in earlier years Reconstruc-tion Finance Corporation, Homeowners Loan Corporation, Federal Farm Mortgage Corporation, and Public Housing Administration. Also includesU.S.-sponsored agencies such as Federal National Mortgage Association (FNMA), Federal Land Banks, Federal Home Loan Mortgage Corpora-tion (FHLMC), and mortgage pass-through securities issued or guaranteed by GNMA, FHLMC, FNMA or FmHA. Other U.S. agencies (amountssmall or current separate data not readily available) included with "individuals and others."
4 Includes private mortgage pools.Source: Board of Governors of the Federal Reserve System, based on data from various Government and private organizations.
387
Digitized for FRASER http://fraser.stlouisfed.org/ Federal Reserve Bank of St. Louis

TABLE B-75.—Consumer credit outstanding, 1955-96
[Amount outstanding (end of month); billions of dollars, seasonally adjusted]
Year and month
December:19551956195719581959
I960196119621963196419651966196719681969
197019711972197319741975 . . .1976197719781979
198019811982198319841985198619871988 4
1989
199019911992199319941995
1995:JanFebMarAprMayJune
JulyAugsept ".:::...::::::::: ::.::":i:::::::::::::::i:::::::::::'":::::::::':::::::OctNovDec
1996:JanFebMar . . .AprMayJune
JulyAuJ " ..I.:"" '.". '. :sept ' " r "OctNov
Totalconsumercredit1
41.945448148.3559
60062268.176686.096.0
101 9106911741271
131 5146.91661190.019882036224.82575302.13435
3501367.63846433.75128584.76389671.77299781.9
796.4781 1784984419665
1 1033
978.19843999.7
1,01071024410370
104751 059 91,074.7108271094.41 1033
1 11351,125.01 13621,14421,150.81 1567
1 17041 17681,176.71,183.21.190.6
Automobile
13.514515.514.3166
18117.720.022925.929.431031.1344369
36340.547853.754256.865.979095.8
1087
112.0119.8127.5146.21753210.92472266.12855291.0
282.4259325712798317.23508
320.13223325.0326.833023326
33693392341.03441347.23508
352.9355.83586361.2362.33677
37433749376.2377.2377.7
Revolving2
/
2036
498.39 4
11.313214516.636745.2534
55161.166579.1
1003122.11360153.31745198.6
223.324582578287033934139
346.23523359.5363837183788
38223901399.54046407.44139
4190425.74313437.9443.54451
45214546455.4456.8460.0
Other 3
28.430932.634.1393
41944.548.153760.166.670875.7810866
90.298.1
1089124.91313132.3142.31418161.01815
183.0186.71907208.4237.2251.72557252.42699292.3
290.727612699277330993386
311.83097315.1320.132243256
328.43306334.23340339.7338.6
341.6343.53462345.2345.13439
34403472345.1349.2352.8
1 Covers most short- and intermediate-term credit extended to individuals through regular business channels, usually to finance the pur-chase of consumer goods and services or to refinance debts incurred for such purposes. Credit secured by real estate is excluded.2 Consists of credit cards at retailers, gasoline companies, and commercial banks, and check credit at commercial banks. Excludes 30-daycharge credit held by travel and entertainment companies. Prior to 1968, included in "other." Beginning 1977, includes open-end credit atretailers, previously included in "other." Also beginning 1977, some retail credit was reclassified from commercial into consumer credit.3 Includes mobile home loans and all other loans not included in automobile or revolving credit, such as loans for education, boats, trailers,or vacations. Includes all noninstallment credit. These loans may be secured or unsecured.4 Data newly available in January 1989 result in breaks in many series between December 1988 and subsequent months.
Source.- Board of Governors of the Federal Reserve System.
388
Digitized for FRASER http://fraser.stlouisfed.org/ Federal Reserve Bank of St. Louis

GOVERNMENT FINANCE
TABLE B-76.—Federal receipts, outlays, surplus or deficit, and debt, selected fiscal years, 1929-98
[Billions of dollars; fiscal years]
Fiscal yearor period
19291933 .19391940194119421943194419451946194719481949195019511952195319541955195619571958195919601961196219631964196519661967196819691970197119721973197419751976Transition
quarter197719781979198019811982198319841985198619871988198919901991199219931994199519961997 2
19982
Total
Re-ceipts
39206.36.58.7
14.624.043.745.239.338.541.639.439.451.666.269.669.765.574.680.079.679.292.594.499.7
106.6112.6116.8130.8148.8153.0186.9192.8187.1207.3230.8263.2279.1298.1
81.2355.6399.6463.3517.1599.3617.8600.6666.5734.2769.3854.4909.3991.2
1,032.01,055.01,091.31,154.41,258.61,351.81,453.11,505.41,566.8
Outlays
314 69.19.5
13.735.178.691.392.755.234.529.838.842.645.567.776.170.968.470.676.682.492.192.297.7
106.8111.3118.5118.2134.5157.5178.1183.6195.6210.2230.7245.7269.4332.3371.8
96.0409.2458.7504.0590.9678.2745.8808.4851.9946.5990.5
1,004.21,064.51,143.7
1,253.21,324.41,381.71,409.41,461.71,515.71,560.31,631.01,687.5
Surplusor
deficit(-)
0 7-26-2.8-2.9-4.9
-20.5-54.6-47.6-47.6-15.9
4.011.8
.6-3.1
6.1-1.5-6.5-1.2-3.0
3.93.4
-2.8-12.8
.3-3.3-7.1-4.8-5.9-1.4-3.7-8.6
-25.23.2
-2.8-23.0-23.4-14.9-6.1
-53.2-73.7
-14.7-53.7-59.2-40.7-73.8-79.0
-128.0-207.8-185.4-212.3-221.2-149.8-155.2-152.5
-221.2-269.4-290.4-255.0-203.1-163.9-107.3-125.6-120.6
On-budget
Re-ceipts
39205.86.08.0
13.722.942.543.838.137.139.937.737.348.562.665.565.160.468.273.271.671.081.982.387.492.496.2
100.1111.7124.4128.1157.9159.3151.3167.4184.7209.3216.6231.7
63.2278.7314.2365.3403.9469.1474.3453.2500.4548.0569.0641.0667.8727.5
750.3761.2788.9842.5923.6
1,000.81,085.61,116.51,161.9
Outlays
31469.29.5
13.635.178.591.292.655.034.229.438.442.044.266.073.867.964.565.770.674.983.181.386.093.396.4
102.8101.7114.8137.0155.8158.4168.0177.3193.8200.1217.3271.9302.2
76.6328.5369.1404.1476.6543.1594.4661.3686.1769.7807.0810.3861.8932.8
1,028.11,082.71,129.31,142.81,182.41,227.11,259.91,316.01,358.9
Surplusor
deficit(-)
07-26-3.4-3.5-5.6
-21.3-55.6-48.7-48.7-17.0
2910.5-.7
-4.74.3
-3.4-8.3-2.8-4.1
2.52.6
-3.3-12.1
.5-3.8-5.9-4.0-6.5-1.6-3.1
-12.6-27.7
-.5-8.7
-26.1-26.4-15.4-8.0
-553-70.5
-13.3-49.8-54.9-38.7-72.7-74.0
-120.1-208.0-185.7-221.7-238.0-169.3-194.0-205.2
-277.8-321.6-340.5-300.4-258.8-226.3-174.3-199.5-197.0
Off-budget
Re-ceipts
0.5.6.7.9
1.11.31.31.21.51.61.72.13.13.64.14.65.16.46.88.08.3
10.612.112.314.216.416.719.124.424.929.033.535.839.946.153.962.566.4
18.076.885.498.0
113.2130.2143.5147.3166.1186.2200.2213.4241.5263.7
281.7293.9302.4311.9335.0351.1367.5388.9404.9
Outlays
-0.0-.0
.0
.1
.1
.1
.1
.2
.3
.4
.4
.51.31.72.32.94.05.06.07.59.0
10.911.713.515.015.716.519.720.422.325.227.632.836.945.652.160.469.6
19.480.789.7
100.0114.3135.2151.4147.1165.8176.8183.5193.8202.7210.9225.1241.7252.3266.6279.4288.7300.5315.0328.6
Surplusor
deficit(-)
0.5.6.7.8
1.01.21.21.01.21.21.31.61.81.91.81.71.11.5.8.5
-.7-.2
.4-1.3-.8
.6
.2-.64.02.63.75.93.03.1
.51.82.0
-3.2
-1.4-3.9-4.3-2.0-1.1-5.0-7.9
.2
.39.4
16.719.638.852.856.652.250.145.355.762.467.073.976.4
Federal debt (endof period)
GrossFederal
'169'22548.250.757.579.2
142.6204.1260.1271.0257.1252.0252.6256.9255.3259.1266.0270.8274.4272.7272.3279.7287.5290.5292.6302.9310.3316.1322.3328.5340.4368.7365.8380.9408.2435.9466.3483.9541.9629.0
643.6706.4776.6829.5909.1994.8
1,137.31,371.71,564.71,817.52,120.62,346.12,601.32,868.0
3,206.63,598.54,002.14,351.44,643.74,921.05,181.95,453.75,736.2
Held bythe
public
41.442.848.267.8
127.8184.8235.2241.9224.3216.3214.3219.0214.3214.8218.4224.5226.6222.2219.3226.3234.7
236.8238.4248.0254.0256.8260.8263.7266.6289.5278.1283.2303.0322.4340.9343.7394.7477.4
495.5549.1607.1640.3709.8785.3919.8
1,131.61,300.51,499.91,736.71,888.72,050.82,189.9
2,410.72,688.12,998.83,247.53,432.13,603.43,733.03,875.84,021.4
Adden-dum:Gross
domes-tic
prod-uct
58290.197.8
115.4145.3179.8206.7217.4217.8228.5253.5269.5272.6321.0349.2372.4377.1395.5426.6449.9458.8489.7
518.3530.4567.3599.0639.8686.8752.7811.9868.0948.1
1,009.41,077.41,177.01,306.81,438.11,554.51,730.4
454.81,971.42,212.62,495.92,718.93,049.13,211.33,421.93,812.04,102.14,374.34,605.14,953.55,351.8
5,684.55,858.86,143.26,470.86,830.47,186.97,484.77,853.88,218.6
1 Not strictly comparable with later data.2 Estimates.Note.—Through fiscal year 1976, the fiscal year was en a July 1-June 30 basis; beginning October 1976 (fiscal year 1977), the fiscal year
is on an October 1-September 30 basis. The 3-month period from July 1.1976 through September 30,1976 is a separate fiscal period knownas the transition quarter.
Refunds of receipts are excluded from receipts and outlays.See Budget of the United States Government, Fiscal Year 1998. Febriary 1997, for additional information.Sources: Department of Commerce (Bureau of Economic Analysis). Department of the Treasury, and Office of Management and Budget.
389
Digitized for FRASER http://fraser.stlouisfed.org/ Federal Reserve Bank of St. Louis

TABLE B—77.—Federal budget receipts, outlays, surplus or deficit, and debt, as percent of gross domestic
product, fiscal years 1934-98
[Percent; fiscal years]
Fiscal year or period
1934193519361937193819391940 .19411942 . .194319441945 .194619471948194919501951195219531954195519561957195819591960196119621963 .19641965196619671968196919701971197219731974 .19751976Transition quarter197719781979 ..19801981 ...19821983198419851986198719881989 .1990 .199119921993 .199419951996 .1997'1998 »
Receipts
4.85.14.96.17.57.06.77.5
10.113.321.220.818.016.916.414.614.516.118.918.718.516.517.517.817.416.217.817.817.617.817.617.017.418.317.619.719.117.417.617.718.318.017.217.918.018.118.619.019.719.217.617.517.917.618.618.418.518.218.017.817.818.418.819.419.219.1
Outlays
Total
10.69.1
10.48.57.6
10.19.7
11.824.243.744.242.625.415.111.714.415.614.219.420.418.817.316.617.018.018.817.818.418.818.618.517.217.919.420.519.419.419.519.618.818.721.421.521.120.820.720.221.722.223.223.622.323.122.621.821.521.4
22.022.622.521.821.421.120.820.820.5
Nationaldefense
1.75.6
17.737.138.338.219.65.63.64.95.07.3
13.214.213.110.810.010.110.210.09.39.49.28.98.67.47.78.89.48.78.17.36.75.95.55.65.24.94.94.74.74.95.25.86.16.06.26.26.15.95.75.34.74.94.54.13.83.63.43.2
Surplus ordeficit (-)
-5.8-4.0-5.4-2.5-.1
-3.2-3.0-4.3
-14.1-30.3-23.0-21.9
-7.31.84.7
-1.11.9-.4
-1.7
-!s.9.8
-.6-2.6
-^6-1.3-.8-.9-.2
-T.I-2.9
.3-.3
-2.1-2.0
~-A-3.4-4.3-3.2-2.7-2.7-1.6-2.7-2.6-4.0-6.1-4.9-5.2-5.1-3.3-3.1-2.8-3.9-4.6-4.7-3.9-3.0-2.3-1.4-1.6-1.5
Federal debt (end of period)
GrossFederal
51551.849.954.579.398.7
119.7124.4112.599.493.794.279.574.271.471.869.463.960.561.058.756.155.253.451.849.446.943.641.942.538.637.737.937.035.733.634.936.335.435.835.133.233.432.635.440.141.044.348.550.952.553.656.461.465.167.268.068.569.269.469.8
Held bypublic
45.943.741.846.671.189.4
108.2111.098.285.379.580.366.861.558.659.557.352.148,749.347.945.744.943.742.440.138.035.032.833.429.328.128.127.426.123.925.427.627.227.927.425.726.125.828.633.134.136.639.741.041.440.942.445.948.850.250.250.149.949.348.9
'Estimates.Note—See Note, Table B-76.Sources: Department of the Treasury and Office of Management and Budget.
390
Digitized for FRASER http://fraser.stlouisfed.org/ Federal Reserve Bank of St. Louis

TABLE B-78.—Federal receipts and outlays, by major category, and surplus or deficit, fiscal years
1940-98
[Billions of dollars; fiscal years]
Fiscal year orperiod
1940194119421943194419451946194719481949195019511952195319541955195619571958195919601961196219631964196519661967196819691970197119721973197419751976Transition
quarter197719781979198019811982198319841985 z.:::..:::1986 . . .1987198819891990199119921993199419951996199711998 1
Receipts (on-budget and off-budget)
Total
6.58.7
14.624.043.745.239.338.541.639.439.451.666.269.669.765.574.680.079.679.292.594.499.7
106.6112.6116.8130.8148.8153.0186.9192.8187.1207.3230.8263.2279.1298.1
81.2355.6399.6463.3517.1599.3617.8600.6666.5734.2769.3854.4909.3991.2
1,032.01,055.01,091.31,154.41,258.61,351.81,453.11,505.41,566.8
Indi-vidual
in-cometaxes
0.91.33.36.5
19.718.416.117.919.315.615.821.627.929.829.528.732.235.634.736.740.741.345.647.648.748.855.461.568.787.290.486.294.7
103.2119.0122.4131.6
38.8157.6181.0217.8244.1285.9297.7288.9298.4334.5349.0392.6401.2445.7466.9467.8476.0509.7543.1590.2656.4672.7691.2
Corpo-ration
incometaxes
1.22.14.79.6
14.816.011.98.69.7
11.210.414.121.221.221.117.920.921.220.117.321.521.020.521.623.525.530.134.028.736.732.826.832.236.238.640.641.4
8.554.960.065.764.661.149.237.056.961.363.183.994.5
103.393.598.1
100.3117.5140.4157.0171.8176.2189.7
Socialinsur-ancetaxesandcon-tri-bu-
tions
1.81.92.53.03.53.53.13.43.83.84.35.76.46.87:27.99.3
10.011.211.714.716.417.019.822.022.225.532.633.939.044.447.352.663.175.184.590.8
25.2106.5121.0138.9157.8182.7201.5209.0239.4265.2283.9303.3334.3359.4380.0396.0413.7428.3461.5484.5509.4535.8557.8
Other
2.73.34.24.95.77.38.28.58.88.98.9
10.210.611.711.911.012.213.213.613.515.615.716.517.618.520.319.820.721.723.925.226.827.828.330.631.534.3
8.836.637.740.850.669.569.365.671.873.173.374.679.382.891.593.1
101.498.9
113.7120.1115.4120.8128.2
Outlays (on-budget and off-budget)
Total
9.513.735.178.691.392.755.234.529.838.842.645.567.776.170.968.470.676.682.492.192.297.7
106J111.3118.5118.2134.5157.5178.1183.6195.6210.2230.7245.7269.4332.3371.8
96.04092458.7504.0590.9678.2745J801.4851.9M6.5990.5
1,00421,06451,143.71,253.21,324.41,381.71,409.41,4(1.71,515.71.5W.31,631.01,687.5
Nationaldefense
Total
1.76.4
25.766.779.183.042.712.89.1
13.213.723.646.152.849.342.742.545.446.849.048.149.652.353.454.850.658.171.481.982.581.778.979.276.779.386.589.6
22.3972
104.5116.3134.0157.5185.3209.9227.4252.7273.4282.0290.4303.6299.3273.3298.4291.1281.6272.1265.72672259.4
Depart-ment ofDefense,military
50.151.152.648.856.670.180.480.880.177.577.675.077.984.987.9
21.895.1
102.3113.6130.9153.9110.7204.4220.9245.2215.5274.0281.9294.92S9.8262.4286.9278.6268.6259.42532254.3247.5
Inter-na-
tion-alaf-
fairs
0.11
101.31.41.91.95.84.66.14.73.62.7211.62.22.43.13.43.13.03.25.65.34.95.35.65.65.34.64.34.24.84.15.77.16.4
2.56.47.57.5
12.713.112.311.815.916.214211.610.59.6
13.815.916.117217.116.413.514.814.9
Health
0.1111
.2
.2
'.2
.2
.3
'.33
3.4.5.5
.8
121.51.81.82.53.44.45.25.96.88.79.4
10.712.915.7
3.917.318.520.523.226.927.428.630.433.535.940.044541457.771289.599.4
107.1115.4119.4127.6138.2
Medi-care
(Ti2.74.65.76.26.67.58.19.6
12.915.8
4.319.322.826.532.139.146.652.657.565.870.275.178.985.098.1
104.5119.0130.6144.7159.9174.2194.3207.1
In-comesecu-
rity
1.51.91.81.71.51.12.42.82.53.24.13.43.73.84.45.14.75.47.58.27.49.79.29.39.79.59.7
10.311.813.115.722.927.728.333.750.260.8
15.061.161.566.486.699.7
107.7122.6112.7128.2119.8123.3129.4136.1147.1170.3197.0207.3214.1220.5226.0238.9247.5
Socialsecu-
rity
0.0.1.1
'.2.3.4
.6
.7
162.12.73.44.45.56.78.29.7
11.612.514.415.816.617.520.721.723.927.330.335.940.249.155.964.773.9
19.885.193.9
104.1118.5139.6156.0170.7178.2188.6198.8207.4219.3232.5248.6269.0287.6304.6319.6335.8349.7367.7384.3
Netinter-est
0.9.9
1.11.52.23.14.14.24.34.54.84.74.75.24.84.95.15.45.65.86.96.76.97.78.28.69.4
10.311.112.714.414.815.517.321.423.226.7
6.929.935.542.652.568.885.089.8
111.1129.5136.0138.7151.8169.3184.2194.5199.4198.8203.0232.2241.1247.4249.9
Other
5.34.15.47.06.63.13.68.28.5
11.114.28.48.19.17.119
10.110.110.315.514.415.217.218.322.fi25.028.532.135.132.637.240.047.352.852.974.882.7
21.493.0
114.7120.2131.3133.5125.4122.2118.6131.9142.3121.1139.7159.3204.3225.7174.7160.4174.5163.4170.7173.2186.2
Surplusor
deficit(-)(on-
budgetandoff-
budget)
-2.9-4.9
-20.5-54.6-47.6-47.6-15.9
4.011.8
.6-3.1
6.1-1.5-6.5-1.2-3.0
3.93.4
-2.8-12.8
-13-7.1-4.8-5.9-1.4-3.7-8.6
-25.23.2
-2.8-23.0-23.4-14.9-fi.l
-53.2-73.7
-14.7-53.7-59.2-40.7-73.8-79.0
-121.0-207.8-185.4-212.3-2212-149.8-155.2-152.5-2212-269.4-290.4-255.0-203.1-163.9-107.3-125.6-120.6
' Estimates.Note.—See Note, Table B-76.Sources: Department of the Treasury and Office of Management and Brffet.
391
Digitized for FRASER http://fraser.stlouisfed.org/ Federal Reserve Bank of St. Louis

TABLE B-79.—Federal receipts, outlays, deficit, and debt, fiscal years 1992-98[Millions of dollars; fiscal years]
Description
RECEIPTS AND OUTLAYS:Total receipts .Total outlays
Total surplus or deficit (-)
On-budget receiptsOn-budget outlays
On-budget surplus or deficit (-)Off-budget receiptsOff-budget outlays
Off-budget surplus or deficit HOUTSTANDING DEBT, END OF PERIOD:Gross Federal debt
Held by Government accountsHeld by the public
Federal Reserve SystemOther
RECEIPTS: ON-8UDGET AND OFF-BUDGET
Individual income taxesCorporation income taxesSocial insurance taxes and contributions ........
On-budget .Off-budget
Excise taxesEstate and gift taxesCustoms duties and feesMiscellaneous receipts . .
Deposits of earnings by FederalReserve System
All otherOUTLAYS: ON-BUDGET AND OFF-BUDGET
National defenseInternational affairsGeneral science, space, and technologyEnergyNatural resources and environmentAgricultureCommerce and housing credit
On-budgetOff-budget
TransportationCommunity and regional developmentEducation, training, employment, and
social servicesHealth . .MedicareIncome securitySocial security
On-budgetOff-budget
Veterans benefits and servicesAdministration of justiceGeneral governmentNet interest
On-budgetOff-budget
Undistributed offsetting receipts
On-budgetOff-budcet
Actual
1992
1,091,2791,381,681-290,402
788,8531,129,343
-340,489302,426252,33950,087
4,002,136
1,003,3022,998,834
296,3972,702,437
1,091,279
475,964100,270413,689
111,263302,426
45,56911,14317,35927,284
22,9204,364
1,381,681
298,35016,10716,4094,500
20,02515,20510,919
10,260659
33,3326,838
45,24889,497
119,024197,022287,585
6,166281,418
34,06414,42612,990
199,421
223,059-23,637
-39,280
-33,179-6.101
1993
1,154,4011,409,414
-255,013
842,4671,142,827
-300,360
311,934266,587
45,347
4,351,416
1,103,9453,247,471
325,6532,921,818
1,154,401
509,680117,520428,300
116,366311,934
48,05712,57718,80219,465
14,9084,557
1,409,414
291,08617,24817,0304,319
20,23920,363
-21,853
-23,2941,441
35,0049,052
50,01299,415
130,552207,299304,585
6,236298,349
35,67114,95513,009
198,811
225,599-26,788
-37,386
-30,970-6.416
1994
1,258,6271,461,731
-203,104
923,6011,182,359
-258,758
335,026279,372
55,654
4,643,705
1,211,5883,432,117
355,1503,076,967
1,258,627
543,055140,385461,475
126,450335,026
55,22515,22520,09923,164
18,0235,141
1,461,731
281,64217,08316,2275.219
21,06415,046-4,228
-5,3311,103
38,06610,454
46,307107,122144,747214,089319,565
5,683313,881
37,58515,25611,303
202,957
232,160-29,203
-37,772
-31,362-6.409
1995
1,351,8301,515,729
-163,899
1,000,7511,227,065
-226,314
351,079288,664
62,415
4,921,018
1,317,6453,603,373
374,1143,229,259
1,351,830
590,244157,004484,473
133,394351,079
57,48414,76319,30128,561
23,3785,183
1,515,729
272,06616,43416,7244,936
22,0789,778
-17,808
-15,839-1,969
39,35010,641
54,263115,418159,855220,493335,846
5,476330,370
37,89016,21613,835
232,169
265,474-33,305
-44,455
-38,023-6.432
1996
1,453,0621,560,330
-107,268
1,085,5701,259,872
-174,302
367,492300,458
67,034
5,181,930
1,448,9673,732,964
390,9243,342,039
1,453,062
656,417171,824509,414
141,922367,492
54,01417,18918,67025,534
20,4775,057
1,560,330
265,74813,49616,7092,836
21,6149,159
-10,646
-10,020-626
39,56510,685
52,001119,378174,225225,989349,676
5,807343,869
36,98517,54811,892
241,090
277,597-36,507
-37,620
-31,342-6.278
Estimates
1997
1,505,4251,631,016
-125,591
1,116,5221,316,014
-199,492
388,903315,002
73,901
5,453,677
1,577.9023,875,775
1,505,425
672,683176,199535,766
146,863388,903
57,24717,58817,32828,614
23,1845,430
1,631,016
267,17614,82216,5512,053
22,77310,252-8,808
-10,7841,976
39,26212,752
51,291127,630194,256238,855367,713
6,944360,769
39,65020,78413,109
247,382
288,620-41,238
-46,487
-39,982-6.505
1998
1,566,8421,687.475
-120,633
1,161,8981,358,896
-196.998
404,944328,579
76,365
5,736,159
1,714,8014,021,358
1,566,842
691,199189,662557,783
152,839404,944
61,23918,81718,30729,835
23,0066,829
1,687,475
259,38814,90516,4882,279
22,31412,3413,359
-7354,094
39,25911,435
56,204138,241207,084247,499384,338
7,626376,712
40,97124,22812,873
249,859
295,058-45,199
-55,590
-48,562-7.028
Note.-See Note, Table B-76.Sources: Department of the Treasury and Office of Management and Budget.
392
Digitized for FRASER http://fraser.stlouisfed.org/ Federal Reserve Bank of St. Louis

TABLE B—80.—Federal Government receipts ami current expenditures, national income and product
accounts (NIPA), 1978-96
[Billions of dollars; quarterly data at seasonally adjusted annual rates]
Year orquarter
Fiscal:197819791980198119821983198419851986198719881989199019911992199319941995
Calendar:1978197919801981198219831984 . .1985198619871988198919901991199219931994]995
1990:1IIIllIV
1991:1IIIllIV
1992-1IIIllIV
1993:1IIIllIV
1994:1IIIllIV
1995:1IIIllIV
1996:1IIIll
Receipts
Total
429.2497.0546.7633.5653.7658.1723.7798.7836.4922.5981.5
1,069.91,112.51,141.51,181.01,253.01,357.51,458.8
446.5511.1561.5649.3646.4671.9746.9811.3850.1937.4997.2
1,079.31,129.81,149.01,198.51,275.31,377.01,478.41,107.31,132.71,144.11,135.21,140.11,142.61,152.31,160.91,183.41,193.11,187.01,230.51,225.21,271.31,280.31,324.4
1,321.91,382.81,387.11,416.31,449.31,483.21,486.61,494.7
1,523.11,575.61,581.9
Per-sonaltaxand
nontaxre-
ceipts
185.5221.6249.1287.9308.4291.0300.7337.8353.6398.3407.9458.3477.3477.4485.8513.4555.9602.7
193.8229.7256.2297.2302.9293.0308.3343.7358.3402.4414.4463.4485.7476.9490.8523.6561.4614.9477.4490.7489.7484.9478.4474.3476.0479.0481.0481.6490.7510.0501.0521.0529.1543.4
539.3571.3560.4574.5594.6624.4617.3623.3639.6681.4680.2
Cor-porateprofits
taxaccru-
als
67.475.370.469.351.656.475.175.080.599.3
107.7119.1116.5111.5115.4130.9157.61832
71.474.470.365.749.061.375.276.383.8
103.2111.0117.1118.0109.8118.6137.5164.4184.3111.6118.5124.3117.4107.3108.9111.8111.1119.6125.3106.0123.7127.5136.5133.7152.2144.31622171.3180.0183.1180.7189.1184.3196.4199.0196.5
ndirectbusi-ness
tax andnontaxaccru-
als
27.929.936.254.351.551.657.458.953.756.460.461.763.675.880.986.492.791.7
28.930.139.757.349.753.357.958253257.860.961.765.179.781.988292.691263.264265.567.477.279.179.982.880.880.280286.584.387587.293.7
92.891.393.393.291.793.588.491.384.483285.7
Contri-butions
forsocialinsur-ance
148.4170.2190.9222.0242.2259.1290.5326.9348.7368.5405.6430.8455.1476.7499.05223551.25812
152.4176.8195.3229.1244.826423053333.1354.7374.1410.9437.1461.1482.6507.1526.0558.6588.0455.14593464.5465.64772480.3484.7488.1502.0506.1510.1510.3512.45262530.3535.1545.5558.1562.1568.6579.9584.659U595.9602.6612.0619.4
Current expenditures
Total1
467.5514.8597.0690.1758.5836.8877.0958.2
1.017.61,048.81,103.51.179.71.25921.318.11,456.71,515.11,563.91,629.4
478.1529.5622.5707.1781.08463902.99742
1,027.61,066.31.118.51.192.71.284.51.345.01.479.41.530.91.56731,640.11.261.51.276.91,286.71,313.01.274.71.33931.366.31.399.81.450.71.472.81.484.51,509.51,509.71.52151.534.71.557.7
1,534.61.552.51.575.71.606.4
1.621.91.64431.645.01.649.31,67831,70231.702.6
Consumptionexpenditures
Total
165.5181.2207.5239.0263.7292.0297.1334.4358.9371.1382.6407.8417.2442.5448.9452.3454.3454.8
168.8185.9215.2246.0270.0293.0314.1342.5362.3378.2387.84052426.6445.9451.0451.9450.7453.8421.7423.7423.2437.7450.5449.1443.7440.5445.8446.3454.4457.7451.3448.5453.54543446.7445.1455.7455.3454.6455.6453.6451.4453.6463.5461.3
Na-tionalde-
fense
116.2126.9145.3168.6192.2212.1222.5250.7271.0280.8293.4308.2306.1324.4318.9315.0310.8303.5
118.4130.7150.9174.3197.6214.9236.3257.6272.7287.6297.9303.3312.7325.4319.7313.5305.83023311.7310.8307.3321.0331.3328.6323.1318.53172317.3323.5320.7314.4312.6315.1312.0301.3303.4313.5305.0302.8304.8301.4300.1298.7307.4304.7
Transferpayments
Toper-sons
179.3198.5235.4274.6305.6339.9342.4360.7380.6399.4420.5449.7490.7535.7595.8633.6661.7697.3
182.4205.7247.0282.1316.4340.0344.6366.9386.2401.8425.8460.3500.0550.1608.5641.8666.4708.4492.7494.1500.0513.3538.6547.5551.0563.2598.7606.9611.3617.2633.4639.8645.3648.7659.7663.4667.8674.7696.2705.2713.0719.3737.2746.0751.2
Torest
of theworld(net)
3.54.04.35.26.37.09.0
12.313.310.711.111.714.9
-26.011.517.715.315.1
3.84.15.05.07.07.89.7
12.212.911.211.411.413.3
-27.916.617.316.511.511.515.513212.9
-76.9-32.0-5.4
2.612.415.012.926.112.614.815.526.311.212.915.726.212.111.011.311.619.011.811.7
Grants-in-aid
toStateandlocalgov-ern-
ments
74.779.186.790.183.486.291.698.6
108.2103.3108.4115.8128.4147.1168.4180.1196.3204.4
77.380.588.787.983.987.094.4
100.3107.6102.9111.2118.2132.4153.4172.2185.7195.9206.1128.4132.2131.8137.1144.8151.8154.4162.7165.4173.0174.2176.3177.3181.5187.2197.0192.2197.5196.9196.9205.8211.3203.8203.3207.6219.3214.5
Netinter-estpaid
33.140.250.166.181.889.9
107.2125.4129.9134.2146.5161.9178.5187.1197.9192.0195.9224.3
34.642.152.771.784.492.8
113.3126.9130.5137.8148.4166.7179.9192.7195.8192.3201.4229.1176.2179.7185.8177.8186.3192.6191.9200.0196.8198.4196.4191.8190.5193.2192.7192.8188.31983204.3214.8220.9229.3232.3233.9230.5230.8233.7
Subsi-dies lesscurrent
surplus ofgovern-
mententer-prises
11.611.713.015.217.721.429.926.626.730.234.432.929.531.734.139.340.533.5
11.411.313.914.419.425.427.125.228.034.433.830.832.430.835.141.836.431.330.931.732.734.431.630.030.730.931.833.135.340.344.743.640.538.636.535.335238.532.332.031.129.930.430.830.3
Currentsurplus
ordeficit
(-)(NIPA)
-38.3-17.8-50.3-56.6
-104.8-178.7-153.3-159.5-181.2-126.4-122.0-109.9-146.7-176.6-275.7-262.1-206.4-170.6
-31.7-18.4-61.0-57.8
-134.7-174.4-156.0-162.9-177.5-128.9-121.3-113.4-154.7-196.0-280.9-255.6-190.2-161.7-154.1-144.1-142.6-177.7-134.6-196.7-214.0-238.8-267.4-279.6-297.5-279.0-284.5-250.2-254.4-233.3-212.7-169.6-188.5-190.1-172.6-161.1-158.5-154.5-1552-126.7-120.8
1 Includes an item for the difference between wage accruals and disbursements, not shown separately.Note-See Note, Table B-76.Source: Department of Commerce. Bureau of Economic Analysis.
393
Digitized for FRASER http://fraser.stlouisfed.org/ Federal Reserve Bank of St. Louis

TABLE B—81.—Federal and State ami local government receipts and current expenditures, nationalincome and product accounts (NIPA), 1959-96
[Billions of dollars; quarterly data at seasonally adjusted annual rates]
Year orquarter
195919601961196219631964196519661967 .19681969197019711972197319741975197619771978197919801981198219831984198519861987 .1988 ....19891990199119921993199419951990-1
IIIll .IV
1991:1IIIllIV
1992:1IIHIIV
1993-1III l lIV .
1994-1III l lIV
1995:1IIIllIV
1996-.IIIIll
Total government
Receipts
128.8138.8144.1155.8167.5172.9187.0210.7226.4260.9293.9299.6319.6364.8408.8451.8468.4535.9603.9678.5761.1834.2952.2971.5
1,028.61,144.51,239.71,313.11,429.41,517.31,642.11.726.41,779.81,870.61,986.62,127.52,268.41,689.21,721.81,748.51,746.11,753.91,766.61,789.41,809.31,841.41,858.91360.11,921.81,916.81,977.41,995.02,057.12,053.32,129.12,143.32,184.42,224.42,266.72,284.22,298.62,338.52,402.02.414.9
Currentexpendi-
tures
116.6121.5130.8141.3149.1157.3168.6190.8217.5243.7264.1292.9323.2353.1386.5438.3514.7557.1605.5657.5727.3840.8954.6
1,054.91,138.11,213.71,311.71,395.71,474.51,552.71,660.41.800.91,900.02,065.22,147.32,218.02,335.11,757.81,783.11,810.41.852.41,819.71.889.61,926.31.964.32,024.02,051.92,075.72,109.12,120.92,138.52,154.52,175.42.17122,193.52,232.22,275.22,298.02,328.72,344.82,365.02.402.72,427.62.446.5
Currentsurplus
or deficit(-)
(NIPA)
12.217.313.314518.415.618.519.98.9
17.229.86.7
-3.711.622.213.6
-46.3-21.3-1.520.933.8-6.6-2.4
-*3.4-109.5-69.1-71.9-S2.6-45.1-35.4-18.3-74.5
-120.2-194.6-160.7-90.5-66.7-68.6-61.4-61.9
-106.2-65.9
-123.0-136.9-155.1-182.6-193.0-215.5-187.3-204.0-161.0-159.5-118.3-117.9-64.4-W.9-90.7-73.7-62.1-64.6-66.4
-64.3-25.7-31.6
Federal Government
Receipts
90.697.099.0
107.2115.5116.2125.8143.5152.6176.8199.5195.1203.3232.6264.0295.1297.4343.1389.6446.5511.1561.5649.3646.4671.9746.9811.3850.1937.4997.2
1.079.31,129.81.149.01.198.51.275.31,377.01.478.41.107.31,132.71,144.11,135.21,140.11,142.61,152.31,160.91,183.41,193.11,187.01,230.51,225.21,271.31,28031.324.41,321.91,382.81,387.11,416.31,449.31,483.21,486.61,494.71,523.11,575.61.581.9
Currentexpendi-
tures
88.089.696.1
104.4110.2115.4122.4140.9160.9179.7190.8209.1228.6253.1275.1312.0371.3400.3435.9478.1529.5622.5707.1781.0846.3902.9974.2
1,027.61,066.31,118.51,192.71.284.51,345.01,479.41,530.91,567.31,640.11,261.51,276.91,286.71,313.01,274.71,339.31,366.31,399.81,450.71,472.81,484.51,509.51,509.71,521.51,534.71,557.71,534.61,552.51,575.71,606.41,621.91,644.31,645.01,649.31,678.31,702.31.702.6
Currentsurplus
or deficit(-)
(NIPA)
2.67.42.92.85.4
.93.42.6
-8.3-2.8
8.7-14.1-25.3-20.5-11.1-16.9-73.9-57.2-46.3-31.7-18.4-61.0-57.8
-134.7-174.4-156.0-162.9-177.5-128.9-121.3-113.4-154.7-196.0-280.9-255.6-190.2-161.7-154.1-144.1-142.6-177.7-134.6-196.7-214.0-238.8-267.4-279.6-297.5-279.0-284.5-250.2-254.4-233.3-212.7-169.6-188.5-190.1-172.6-161.1-158.5-154.5-155.2-126.7-120.8
State and local government
Receipts
45.048.352.456.661.167.172.381.589.8
102.7114.8129.0145.3169.7185.3200.6225.6253.9281.9309.3330.6361.4390.8409.0443.6492.0528.7570.6594.9631.4681.0728.9784.2844.3897.1946.4996.1710.3721.3736.2748.0758.5775.8791.4811.0823.4838.8847.3867.7869.0887.6901.9929.7923.6943.8953.1965.0980.9994.8
1,001.41,007.11,023.01,045.71.047.6
Currentexpendi-
tures
35.438.442.044.848.152.457.264.372.582.693.7
108.2123.7137.5152.0170.2198.0217.9237.1256.7278.3307.0335.4357.7378.8405.1437.8475.7511.1545.5585.9648.8708.4758.0802.2846.6901.1624.8638.5655.5676.5689.8702.1714.3727.2738.6752.2765.4775.9788.5798.5807.0814.7828.8838.6853.5865.6882.0895.8907.5919.0932.0944.7958.4
Currentsurplus
or deficit(-)
(NIPA)
9.69.9
10.411.713.014.715.117.317.320.021.120.821.732.233.430.527.635.944.752.652.354.455.451.364.986.991.094.983.885.995.180.175.886.394.999.795.085.582.880.771.568.873.777.183.884.886.682.091.780.589.194.9
115.094.8
105.299.699.399.099.093.988.191.0
101.089.2
Adden-dum:
Grants-in-aid
toStateandlocal
govern-ments
6.86.57.28.09.1
10.411.114.415.918.620.324.429.037.540.643.954.661.167.577.380.588.787.983.987.094.4
100.3107.6102.9111.2118.2132.4153.4172.2185.7195.9206.1128.4132.2131.8137.1144.8151.8154.4162.7165.4173.0174.2176.3177.3181.5187.2197.0192.2197.5196.9196.9205.8211.3203.8203.3207.6219.3214.5
Note.—federal grants-in-aid to State and local governments are reflected in Federal current expenditures and State and local receipts.Total government receipts and current expenditures have been adjusted to eliminate this duplication.
Source: Department of Commerce, Bureau of Economic Analysis.
394
Digitized for FRASER http://fraser.stlouisfed.org/ Federal Reserve Bank of St. Louis

TABLE B-82.—Federal and State and local government receipts and current expenditures, nationalincome and product accounts (NIPA), by major type, 1959-96
[Billions of dollars; quarterly data at seasonally adjusted annual rates]
Year orquarter
19591960196119621963196419651966 ....1967196819691970197119721973 .. ..19741975197619771978197919801981198219831984198519861987198819891990 . ...199119921993199419951990:1
III l lIV
1991:1I II l lIV
1992:1III l lIV
1993:1I IIllIV
1994:1I II l lIV
1995:1IIIllIV
1996:1IIIll
Receipts
Total
128.8138.81441155.81675172.9187.02107226.42609293.9299.63196364.84088451.8468.4535.9603967*5761.1834.2952.2971.5
1,028.61,144.51,239.71,313.11,429.41,517.31,642.1172641779.81,870.61,986.62,127.52.268.41,689.21,721.81,748.51,746.11,753.91,766.61,789.41,809.31,841.41,858.91,860.11,921.81,916.81,977.41,995.02,057.12,053.32,129.12,143.32,184.42,224.42,266.72,284.22,298.62,338.52,402.02,414.9
Darrer-sonaltaxand
nontaxre-
ceipts
44.548.750354.858056.061.9710779921
109.9109.01087132.01406159.1156.418232100240.1280.2312.4360.2371.4369.3395.5437.7459.9514.2532.0594.96248624.8650.5689.9731.4794.3613.0628.2630.8627.1622.3620.5623.7632.5636.7640.0650.6674.8662.4686.9696.4713.8705.5740.8731.3748.1770.0801.5798.4807.2824.9870.6872.5
Corpo-rate
profitstaxac-
cruals
23.622.722824.026228030.933732739439.734.437741.949351.850.964273083.588.084.881.163.177.294.096.5
106.5127.1137.0141.31405133.4143.0163.8195.3218.7133.0141.2148.0139.7130.1132.3136.0135.2143.9150.9127.6149.7151.5162.6159.3181.7171.4192.8203.4213.5217.3214.2224.5218.7233.4236.4233.4
In-directbusi-nesstaxandnon-taxac-
cruals
41.945.54815U54758862.765470479086.694.3
1036111.41210129.3140.015161655177.8188.7212.0249.3256.4280.1309.5329.6344.7364.8385.5414.74426478.1505.6540.0572.5595.5432.1436.1447.3455.0464.7472.9483.7491.2495.7497.9507.1521.7524.7535.1541.7558.5562.1568.0576.4583.5586.0594.8597.3604.1604.1608.7614.6
Contri-butions
forsocialinsur-ance
18.821.922925.428530131.640645.550457.862.069679.5979
111.7121.113771554177.0204.2225.0261.6280.6301.9345.5375.9402.0423.3462.?491.25185543.5571.4592.9628.3660.0511.1516.2522.4524.3536.8540.9546.0550.3565.1570.1574.8575.7578.3592.8597.5603.1614.2627.5632.2639.3651.0656.2664.0668.6676.0686.2694.4
Current expenditures
Total1
116.6121.5130814L31491157.3168.61908217.52437264.1292.93232353.13865438.3514.755716055657.5727.3840.8954.6
1,054.91,138.11,213.71,311.71,395.71,474.51,552.71,660.4180091,900.02,065.22,147.32.218.02,335.11,757.81,783.11,810.41,852.41,819.71,889.61,926.31,964.32,024.02,051.92,075.72,109.12,120.92,138.52,154.52,175.42,171.22,193.52,232.22,275.22,298.02,328.72,348.82,365.02,402.72,427.62,446.5
Con-sump-twn
expend-itures
82.785.08969*2
10421099117.61335151*21678179.919212067223'623942672299.932143515383!3421.8476.4531.3577.9619.2664.9725.1775.0819.3859.1912.49767
1.025.41,054.71,079.81,102.41,136.4
957.0967.6977.2
1,005.01,022.61,025.91,025.21,027.81,038.41,047.11,061.81,071.31,072.11,074.51,084.21,088.41,089.01,092.31,111.11,117.21,126.71,135.61,139.11,143.31,154.91,173.71,180.6
Trans-fer
Pay-ments
27.529.333634>36638141.145854562669.383.8994
110.91266150.5189.220652209238.6266.9317.6360.7403.3434.4448.2480.9510.9533.7568.3616.36798721.1852.3905.S950.3
1,011.5660.7672.0682.5703.8648.7710.5748.7776.6828.8846.0855.4879.1886.2899.7909.8927.8928.3940.2954.5978.2991.9
1,005.21,018.51,030.31,059.11,064.51,073.8
Net interest paid
Total
6.36.9646.974798.18589
103IliS12.412512.915216.318.522824426.528.733.448.155.561.879.188.089.896.3
103.7115.51282139.4141.2140.4151.6181.7125.0128.0134.1125.8133.7139.6138.3145.9142.0143.5141.7137.6137.5141.0141.1141.9137.8148.3154.7165.7172.5181.6185.2187.5184.8185.6189.1
Inter-estpaid
10.199
10.811612.513.214515.718111822.323124.829633.637.743647956.868.683.9
110.2130.6146.7174.7195.9208.0216.0229.7251.02686282.8282.7278.8288.3318.0260.6264.6271.9277.2279.2282.7282.4286.9283.2285.1282.9279.4276.7279.8279.6279.0274.6284.7291.2302.6309.6318.9320.7322.8319.8319.7322.3
1 AC*Less:Inter-estre-
ceivedby
govern-ment2
3.3353i94 24.65.160687 78.399
10611914417319.220923530.339.950.562.175.084.995.6
107.9118.2119.7125.9135.51404143.5141.5138.4136.6136.3135.6136.6137.8151.5145.5143.2144.1141.0141.2141.6141.3141.9139.2138.9138.5137.1136.8136.4136.5136.9137.1137.3135.5135.3135.0134.0133.2
Less:Divi-
dendsre-
ceivedby
govern-ment ^
0.1
23359.99
131.72.01.92.32.93.43.94.55.15.96.98.1909.5
10.110.511.412.68.79.09.09.39.49.59.59.69.8
10.110.110.310.210.410.510.811.111.311.511.812.212.412.713.013.313.713.7
Subsi-iliacUleolesscur-rentsur-
plus ofgovern-
mententer-prises
0.1.3
131.5
914173029313.64 95164594.58.17 4
10111.111.715.216.921.125.625.521.925.131.028.524.225323.627.131.725.118.223.824.525.727.324.422.723.523.624.625.426.931.535.233.729.928.027.224.023.425.919.218.717.916.817.317.616.8
Currentsurplus
ordeficitH
(NIPA)
12.217.313314.518415618.519989
17229.86 7
-37116222136
-46.3-213-1 520.933.8-6.6-2.4
-83.4-109.5-69.1-71.9-82.6-45.1-35.4-18.3-745
-120.2-194.6-160.7-90.5-66.7-68.6-61.4-61.9
-106.2-65.9
-123.0-136.9-155.1-182.6-193.0-215.5-187.3-204.0-161.0-159.5-118.3-117.9-64.4-88.9-90.7-73.7-62.1-64.6-66.4-64.3-25.7-31.6
Adden-dum:
Grants-in-aid
toStateandlocal
govern-ments
6.86.57 28.091
10411.114415918620.32 4 429037.540643.954.661 167577.380.588.787.983.987.094.4
100.3107.6102.9111.2118.21324153.4172.2185.7195.9206.1128.4132.2131.8137.1144.8151.8154.4162.7165.4173.0174.2176.3177.3181.5187.2197.0192.2197.5196.9196.9205.8211.3203.8203.3207.6219.3214.5
1 Includes an item for the difference between wage accruals and disbursements, not shown separately.2 Prior to 1968, dividends received is included in interest received.Source: Department of Commerce, Bureau of Economic Analysis.
395
Digitized for FRASER http://fraser.stlouisfed.org/ Federal Reserve Bank of St. Louis

TABLE B-83.—State and local government receipts and current expenditures, national income andproduct accounts (NIPA), 1959-96
[Billions of dollars; quarterly data at seasonally adjusted annual rates]
Year orquarter
19591960196119621963196419651966196719681969197019711972197319741975197619771978197919801981198219831984198519861987198819891990199119921993199419951990:1
IIIllIV
1991:1IIIllIV
1992:1IIIllIV
1993:1IIIl lIV
1994:1IIIllIV
1995:1IIIllIV
1996:1IIIll
Receipts
Total
45.048.352.456.661.167.172.381.589.8
102.7114.8129.0145.3169.7185.3200.6225.6253.9281.9309.3330.6361.4390.8409.0443.6492.0528.7570.6594.9631.4681.0728.9784.2844.3897.1946.4996.1710.3721.3736.2748.0758.5775.8791.4811.0823.4838.8847.3867.7869.0887.6901.9929.7923.6943.8953.1965.0980.9994.8
1,001.41,007.1
1,023.01,045.71,047.6
Personaltaxand
nontaxreceipts
4.65.25.76.36.77.58.19.5
10.612.715.216.718.724.226.328.231.035.841.046.350.556.263.068.576.287.194.0
101.6111.8117.6131.4139.1147.8159.7166.2170.0179.4135.6137.5141.2142.3143.9146.3147.7153.5155.7158.4159.9164.9161.4165.9167.3170.4166.2169.5170.8173.6175.5177.0181.2183.8185.3189.2192.3
Corpo-rate
profitstax
accruals
1.21.21.31.51.71.82.02.22.63.33.63.74.35.36.06.77.39.6
11.412.113.614.515.414.015.918.820.222.723.926.024.222.523.624.426.330.934.421.422.723.722.222.823.424.324.224.325.721.625.924.026.125.729.527.130.632.233.634.233.535.434.4
36.937.436.9
Indirectbusiness
taxand
nontaxaccruals
29.332.034.437.039.442.646.149.753.960.867.474.883.191.299.5
107.2115.8127.8139.9148.9158.6172.3192.0206.8226.8251.5271.4291.5307.1324.6353.0377.6398.4423.7451.8479.9504.3368.9371.9381.8387.7387.5393.8403.8408.4414.9417.7427.0435.2440.4447.6454.5464.9469.3476.7483.1490.3494.3501.3508.9512.8519.7525.5528.9
Contri-butions
forsocialInsur-ance
3.13.43.73.94.24.75.05.76.77.28.39.2
10.211.513.014.616.819.522.124.727.429.732.535.837.740.242.847.349.251.954.157.460.964.366.969.771.956.056.957.958.759.660.561.362.263.164.064.765.465.966.667.267.968.869.470.170.671.171.672.272.873.474.274.9
Federalgrants-in-aid
6.86.57.28.09.1
10.411.114.415.918.620.324.429.037.540.643.954.661.167.577.380.588.787.983.987.094.4
100.3107.6102.9111.2118.2132.4153.4172.2185.7195.9206.1128.4132.2131.8137.1144.8151.8154.4162.7165.4173.0174.2176.3177.3181.5187.2197.0192.2197.5196.9196.9205.8211.3203.8203.3207.6219.3214.5
Current expenditures
Total'
35.438.442.044.848.152.457.264.372.582.693.7
108.2123.7137.5152.0170.2198.0217.9237.1256.7278.3307.0335.4357.7378.8405.1437.8475.7511.1545.5585.9648.8708.4758.0802.2846.6901.1624.8638.5655.5676.5689.8702.1714.3727.2738.6752.2765.4775.9788.5798.5807.0814.7828.8838.6853.5865.6882.0895.8907.5919.0932.0944.7958.4
Con-sump-
tionexpendi-
tures
30.933.736.739.142.246.050.556.562.970.879.891.6
102.9113.4126.4144.0164.9179.7196.1214.5235,9261.3285.3307.9326.2350.8382.6412.7441.1471.3507.2550.1579.4603.6627.9651.7682.6535.3543.9554.0567.3572.1576.9581.5587.3592.6600.8607.4613.6620.8626.0630.8634.1642.4647.3655.4661.9672.1680.1686.2691.9701.3710.2719.3
Trans-fer
pay-ments
toper-sons
5.65.96.57.07.58.28.8
10.112.114.516.720.124.027.530.432.338.943.647.452.457.265.773.679.986.693.9
101.9111.8120.7131.0144.5166.5199.0227.2246.8267.4291.6156.5162.4169.3177.7186.9195.0203.1210.8217.7224.1231.2235.8240.3245.0249.0252.8257.4263.8270.9277.2283.6289.0294.3299.4302.9306.6310.9
Netinterest
paidlessdivi-
dendsreceived
0.1.1.1.2.1
-.1-.3-.6-.9
-1.1-1.4-2.0-1.7-1.8-3.4-5.3-5.4-5.0-6.0-9.8
-15.3-21.2-25.9-31.8-34.4-38.0-43.4-45.8-47.4-51.5-59.3-60.7-62.8-64.8-62.4-61.2-60.0-59.9-60.7-60.8-61.3-62.0-62.5-$3.1-63.6-64.5-65.0-64.9-64.5-63.1-62.7-62.1-61.7-61.6-61.2-61.1-60.9-€0.7-60.1-59.7-59.4-59.0-58.8-58.3
Subsi-diesless
currentsurplus
ofgovern-
mententer-prises
-1.2-1.3-1.4-1.4-1.7-1.7-1.7-1.7-1.6-1.6-1.5-1.6-1.4-1.6-1.5-.9-.4-.4-.3-.3
.41.22.41.7.2
-1.6-3.3-3.0-3.4-5.3-6.6-7.1-7.2^8.0
-10.1-11.2-13.1-7.1-7.1-7.0-7.1-7.2-7.2-7.2-7.2-7.2-7.7-8.3-8.9-9.5-9.9
-10.6-10.6-9.3
-11.3-11.8-12.6-13.1-13.3-13.2-13.0-13.1-13.3-13.4
Currentsurplus
ordeficit
(-)(NIPA)
9.69.9
10.411.713.014.715.117.317.320.021.120.821.732.233.430.527.635.944.752.652.354.455.451.364.986.991.094.983.885.995.180.175.886.394.999.795.085.582.880.771.568.873.777.183.884.886.682.091.780.589.194.9
115.094.8
105.299.699.399.099.093.988.191.0
101.089.2
1 Includes an item for the difference between wage accruals and disbursements, not shown separately.Source: Department of Commerce, Bureau of Economic Analysis.
396
Digitized for FRASER http://fraser.stlouisfed.org/ Federal Reserve Bank of St. Louis

TABLE B-84.—State and local government revenues and expenditures, selected fiscal years, 1927-93
[Millions of dollars]
Fiscal year'
1927193219341936 . . ..193819401942194419461948 : ::.:....19501952 " '.'.'.195319541955 ZZZ19561957 . ..19581959I9601961196219631962-631963-641964-651965-661966-671967-681968-691969-701970-71 ..1971-721972-731973-741974-751975-761976-771977-781978-791979-301980-811981-821982-831983-841984-851985-861986-871987-88 ..1988-891989-901990-911991-92 .. .1992-93
General revenues by source2
Total
7,2717,2677,6788,3959,2289,609
10,41810,90812,35617,25020,91125,18127,30729,01231,07334,66738,16441,21945,30650,50554,03758,25262,89062,26968,44374,00083,03691,197
101,264114,550130,756144,927167,541190,222207,670228,171256,176285,157315,960343,236382,322423,404457,654486,753542,730598,121641,486686,860726,762786,129849,502902,207979,137
1,038,300
Propertytaxes
4,7304,4874,0764,0934,4404,4304,5374,6044,9866,1267,3498,6529,3759,967
10,73511,74912,86414,04714,98316,40518,00219,05420,08919,83321,24122,58324,67026,04727,74730,67334,05437,85242,87745,28347,70551,49157,00162,52766,42264,94468,49974,96982,06789,10596,457
103,757111,709121,203132,212142,400155,613167,999180,337188,535
Satesand
grossreceiptstaxes
470752
1,0081,4841,7941,9822,3512,2892,9864,4425,1546,3576,9277,2767,6438,6919,4679,829
10,43711,84912,46313,49414,45614,44615,76217,11819,08520,53022,91126,51930,32233.23337,51842,04746.09849,81554.54760.64167.59674.24779.92785.97193.613
100.247114.097126,376135,005144,091156.452166.336177,885185,570197,731209.546
Indi-vidualincometaxes
707480
153218224276342422543788998
1,0651,1271,2371,5381,7541,7591,9942,4632,6133.0373,2693,2673,7914,0904,7605,8257,3088.908
10.81211,90015.22717.99419.49121,45424,57529,24633.17636,93242.08046,42650.73855.12964.52970,36174,365m97.806
105.640109.341115,638123.221
Corpo-ration
netincometaxes
927949
113165156272451447592593846817778744890984
1.0181,0011,1801,2661,3081,5051,5051,6951.9292,0382,2272,5183.1803,7383,4244,4165.4256,0156,6427,2739,174
10.73812.12813,32114.14315,02814.25817,14119.15219.99422,42523,66325.92623,56622,24223,88026,417
Revenuefrom
FederalGovern-
ment
116232
1,016948800945858954855
1,8612,4862,5662,8702,9663,1313,3353,8434,8656,3776,9747.1317,8718,7228,663
10,00211,02913,21415.37017,18119.15321,85726,14631,34239,26441,82047!03455,58962,44469.59275,16483,02990,29487,28290,00796,935
106.158113.099114857117,602125,824136:802154,099179.174198.529
Allother'
1,7931,6431,4491,6041,8111,8722,1232.2692,6613,6854,5415,7636,2526,8977,5848,4659,2529,699
10.51611,63412,56313,48914,85014,55615,95117,25019,26921,19723,59826,11829,97132,37436,16240,21046,54151,73557,19161,12468.43679.82195.466
111.599128.926138.008153,570172,317187,314200,350208,482227,838249.996262,955282,376292.052
General expenditures by function2
Total
7,2107,7657,1817.6448,7579,2299,1908,863
11,02817,68422,78726,09827,91030,70133,72436,71140,37544,85148,88751,87656,20160,20664,81663,97769,30274,67882,84393,350
102,411116,728131,332150,674168,549181,357198,959230,722256,731274,215296,984327,517369,086407,449436,733466,516505,008553,899605,623657,134704,921762,360834,818908,108981,253
1,027,488
Edu-cation
2,2352,3111,8312,1772,4912,6382,5862,7933,3565,3797,1778,3189,390
10,55711,90713,22014,13415,91917,28318,71920,57422,21623,77623,72926,28628,56333,28737,91941,15847,23852,71859,41365,81469,71475,83387,85897,216
102,780110,758119,448133,211145,784154,282163,876176,108192,686210,819226,619242,683263,898288,148309,302324,652342,595
High-ways
1,8091,7411,5091,4251,6501,5731,4901,2001,6723,0363,8034,6504,9875,5276,4526,9537,8168,5679,5929,4289,844
10,35711,13611,15011,66412,22112,77013,93214,48115,41716,42718,09519,02118,61519,94622,52823,90723,05824,60928,44033,31134,60334,52036,65539,41944,98949,36852,35555,62158,10561,05764,93767,35168,134
Publicwelfare
151444889827
1,0691,1561,2251,1331,4092,0992,9402,7882,9143,0603,1683,1393,4853,8184,1364,4044,7205,0845,4815,4205,7666,3156,7578,2189,857
12,11014,67918,22621,11723,58225,08528,15632,60435,90639,14041,89847,28854,10557,99660,90666,41471,47975,86882,65089,09097,879
110,518130,402158,723170,653
Allother4
3,0153,2692,9523,2153,5473,8623,8893,7374,5917,1708,867
10,34210,61911,55712,19713,39914,94016,54717,87619,32521,06322,54924,42323,67825,58627,57930,02933,28136,91541,96347,50854,94062,59769,44678,09692,180
103,004112,472122,477137,731155,277172,957189,935205,079223,068244,745269,568295,510317,528342,479375,095403,467430,526446,105
1 Fiscal years not the same for all governments. See Note.2 Excludes revenues or expenditures of publicly owned utilities and liquor stores, and of insurance-trust activities. Intergovernmentalreceipts and payments between State and local governments are also excluded.3 Includes other taxes and charges and miscellaneous revenues.
'Includes expenditures for libraries, hospitals, health, employment security administration, veterans' services, air transportation, watertransport and terminals, parking facilities, and transit subsidies, police protection, fire protection, correction, protective inspection and regu-lation, sewerage, natural resources, parks and recreation, housing and community development, solid waste management, financial adminis-tration, judicial and legal, general public buildings, other government administration, interest on general debt, and general expenditures,n.e.c.
Note.—Data for fiscal years listed from 1962-63 to 1992-93 are the aggregations of data for government fiscal years that ended in the12-month period from July 1 to June 30 of those years. Data for 1963 and earlier years include data for government fiscal years endingduring that particular calendar year.
Data are not available for intervening years.Source-. Department of Commerce, Bureau of the Census.
397
Digitized for FRASER http://fraser.stlouisfed.org/ Federal Reserve Bank of St. Louis

TABLE B-85.—Interest-bearing public debt securities by kind of obligation, 1967-96
[Millions of dollars]
End of yearor month
Fiscal year:1967 . .196819691970197119721973197419751976197719781979
198019811982198319841985198619871988 !19891990199119921993199419951996
1995: JanFebMar
&•:::::JuneJulyAugSeptOctNovDec
1996: JanFebMar
ft :JuneJulyAug*SeptOctNovDec
Totalinterest-bearingpublicdebt
securities
322,286344,401351,729369,026396,289425,360456,353473,238532,122619,254697,629766,971819,007906,402996,495
1,140,8831,375,7511,559,5701,821,0102,122,6842,347,7502,599,8772,836,3093,210,9433,662,7594,061,8014,408,5674,689,5244,950,6445,220,7904,812,2084,850,5214,860,5024,831,5334,900,3464,947,8144,956,6254,967,1924,950,6444,981,7394,985,7904,964,3714,983,2475,012,8725,082,9525,097,9895,124,4225,126,7485,184,9085,173,7345,220,7905,243,3395,263,4235,317,188
Marketable
Total1
'210,672226,592226,107232,599245,473257,202262,971266,575315,606392,581443,508485,155506.693594,506683,209824,422
1,024,0001,176,5561,360,1791 1,564,3291 1,675,9801 1,802,9051 1,892,763
1 2,092,7591 2,390,660•2,677,4761 2,904,9101 3,091,6021 3,260,447•3,418,371'3,173,398'3,211,929» 3,227,333'3,182.253'3.241,464'3,252,620'3,270,977'3,286,057'3,260.447'3,293.172'3.351.483'3.307,179'3,331.836'3,387,122'3,375.055'3,367,197•3,387,187'3,348,433'3,411,190'3,395,960'3,418,371'3,431,060'3,444,643'3,459,691
Treasurybills
58,53564.4406835676,15486,67794,648
100,061105,019128,569161.198156.091160.936161.378199.832223,388277,900340,733356,798384,220410.730378.263398.451406,597482.454564.589634,287658.381697,295742,462761.232741,771756^51756.447735,178750,702748302759354750,167742,462738,605785.682760.680756.723795328811.919769.061782,756773.612789,809781.044761,232763392802,272777,414
Treasurynotes
49,10871,07378,94693.489
104.807113,419117,840128,419150,257191,758241,692267,865274,242310,903363,643442.890557.525661.687776,449896,884
1,005,1271,089.5781,133,1931,218,0811387.7171,566,3491,734,1611367.5071.980.3432,098.6701,906.3321,922,9131.938.2231,914.4131,961,1071.974,6631,981,9681.998,2471,980,3432,016,9252,029,6422.010,3402,038,9552,042,7322,014,0742,049,0742,055,3702,025,7612,072,3212,056,4472.098.6702.109.1982,072,4102,112,315
Treasurybonds
97,41891,07978,80562,95653,98949,13545,07133,13736,77939,62645,72456,35571,07383,77296,178
103,631125,742158,070199,510241,716277,590299,875337,974377,224423,354461,840497,367511,800522,643543,469510,294517,665517,664517,662514,655514,654514,654522,643522,643522,642521,159521,158521,158534,062534,062534,062534,061534,061534,060543,469543,469543,469554,962554,962
Nonmarketable
Total
111,614117,808125,623136,426150,816168,158193,382206,663216,516226,673254,121281,816312,314311,896313,286316,461351,751383,015460,831558,355671,769796,972943,546
1,118,1841,272,0991,384,3251,503,6571,597,9221,690,1971,802,4191,638,8101,638,5931,633,1691,649,2791,658,8811,695,1941,685,6481,681,1351,690,1971,688,5671,634,3081,657,1911,651,4111,625,7501,707,8971,730,7921,737,2351,778,3151,773,7181,777,7741,802,4191,812,2801,818,7801,857,497
U.S.savingsbonds
51,21351,71251,71151,28153,00355,92159,41861,92165,48269,73375,41179,79880,44072,72768,01767,27470,02472,83277,01185,55197,004
106,176114,025122,152133,512148,266167,024176,413181,181184,147178,041178,465178,839179,458179,824180,136180,547180,785181,181181,819182,203181,918182,238182,691182,992183,481183,594183,770183,949184,037184,147184,301184,379182,442
Foreigngovern-
mentand
publicseries2
1,5143,7414,0704,7559,270
18,98528,52425,01123,21621,50021,79921,68028,11525,15820,49914,64111,4508,8066,6384,1284,3506,3206,818
36,04141,63937,03942,45941,99640,95037,48842,53642,97941,79741,66241,61441,44241,23741,26140,95040,80040,80040,80539,67840,36140,36140,36238,00437,78137,61537,61537,48837,84237,63537,427
Govern-ment
accountseries
56,15559,52666,79076,32382,78489,598
101,738115,442124,173130,557140,113153,271176,360189,848201,052210,462234,684259,534313,928365,872440,658536,455663,677779,412908,406
1,011,0201,114,2891,211,6891,324,2701,454,6901,262,6421,262,7111,259,1841,275,5681,283,7651,322,0411,320,6851,314,9731,324,2701,325,1551,273,0591,299,5851,299,9671,274,6991,357,6471,380,4331,387,2351,428,5081,427,1851,429,8501,454,6901,462,8671,466,9611,505,937
Others
2,7322,8293,0524,0675,7593,6543,7024,2893,6454,883
16,79827,06727,39924,16323,71824,08435,59341,84363,254
102,804129,757148,021159,026180,579188,542188,000179,885167,824143,796126,094155,591154.438153,349152,591153,678151,575143,179144,116143,796140,793138,246134,883129,528127,999126,897126,516128,402128,256124,969126,272126,094127,270129,805131,691
' Includes Federal Financing Bank securities, not shown separately, in the amount of 15,000 million dollars.2 Nonmarketable certificates of indebtedness, notes, bonds, and bills in the Treasury foreign series of dollar-denominated and foreign-
currency denominated issues.3 Includes depository bonds, retirement plan bonds, Rural Electrification Administration bonds, State and local bonds, and special issuesheld only by U.S. Government agencies and trust funds and the Federal home loan banks.4 Includes $5,610 million in certificates not shown separately.
Note.—Through fiscal year 1976, the fiscal year was on a July 1-June 30 basis,- beginning October 1976 (fiscal year 1977), the fiscal yearis on an October 1-September 30 basis.
Source: Department of the Treasury.
398
Digitized for FRASER http://fraser.stlouisfed.org/ Federal Reserve Bank of St. Louis
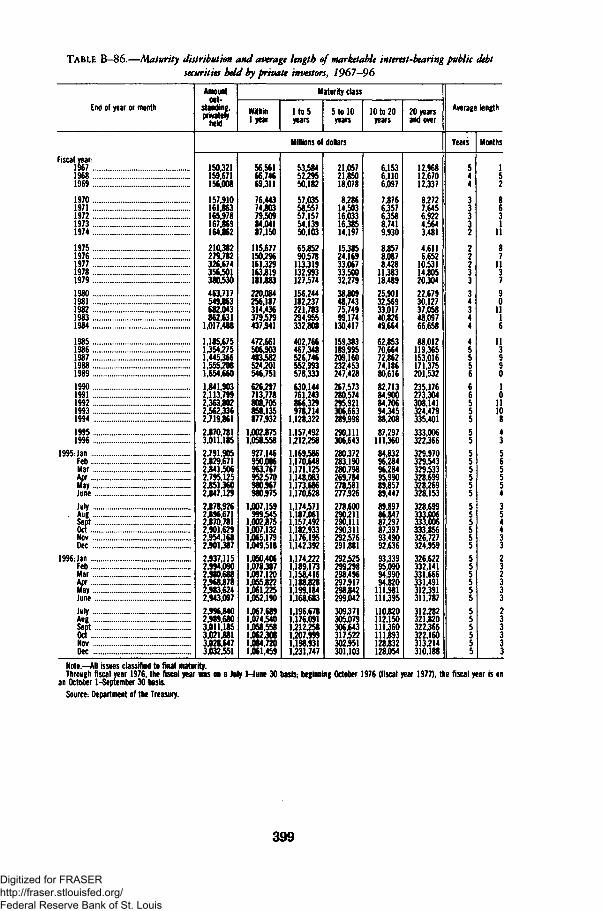
TABLE B-86.—Maturity distribution and average length of marketable interest-bearing public debtsecurities bdd by private investors, 1967-96
End of year or month
Fiscal year-.19671968 ..1969
19701971197219731974
1975197619771978197919801981198219831984
198519861987198819891990199119921993199419951996
1995: JanFebMarAprMay".""':::::::::.:::::..::::::::""::::.::"..:JuneJuly ..Aug..""1 SeptOctNovDec
1996- JanFebMarAprMay:.::::::::::::::::::"::::::::::rJuneJulyAucSeptOctNovDec
Amountout-
standing,pgt
Maturity class
Withinlyear
I t o 5years
5 to 10years
10 to 20years
20 yearsand over
Millions of dollars
150,321159,671156,008
157,910161,863165,978167,869164,862
210,382279,782
3*1530463,717549.863682.043862,631
1.017,488
1,185.6751.354.2751.4453661,555,2081.654.6601,841,9032.113,7992.363.8022.562,3362,719,8612,870,7813.011.1852.791,9052329,6712,841.5062,795.12523513602.847,1292378,9262396.671
IfiBm2,937,1152:994,0902.980,6882,968,8782.983.6242.943.0972.996.8402.989.6803,011,1853.021,8813,028,6473,032.551
56.56166.74669311
76,44374,80379,50984,04187,150
115.677150,296161329163319181383220.084256.187314,436379379437.941
472.661506.903483382524,201546.751626,297713.778808.705858.135877.932
1,0023751.058358
927.146950306963,767952370980.967980,975
1.007.159999345
1.002.8751,007.1321.065.1791.049,5181,050,4061,078.3871.097.1201,0553221,061,2251.052,1901,067,689
!:&$1,0623081,084.7201.061.459
53.58452,29550,182
57.03558,55757,15754,13950,103
65,85290,578
113,319132,993127,574156,244182,237221,783294.955332.808
402.766467.348526,746552,993578:333630,144761.243866,329978,714
1,128,3221,157,4921,212,2581.169,5861.170.6481,171.1251.148.0831.173.6861,170,6281,174,5711.187,0611,157.4921,182.9331.176.1951.142.3921.174,2221,189,1731,158,4161,188,8281,199,1841,168,6831.196,6781.176.0911.212.2581,207,9991,198,9311,231,747
21,05721,85018,078
8,28614,50316,03316,38514,197
15,38524,16933,06733,50032,27938,80948,74375,74999,174
130,417
159,383189,995209,160232,453247,428267,573280,574295,921306,663289,998290,111306,643280372283,190280,798269,784278,581277,926278,600290711290,111290311292,576291,881292,525299,298298.496297,917298342299,042309371305,079306,643317322302,951301,103
6,1536,1106,097
7,8766,3576,3588,7419,930
8,857
£5m25,90132,56933,01740,82649:664
62,85370,66472,86274,18680,61682,71384,90084,70694,34588,20887,297
111,36084,83296,2849628495,99089,85789,4478939786,84787,29787,39793,49092,63693,33995,09094,99094,820
111,981111,395110,820112,150111,360111,893128,832128,054
12,96812,67012,337
8,2727,6456,9224,5643,481
4,6116,652
10,53114,80520,30422,67930,12737,05848,09766,658
88,012119,365153,016171,375201,532235,176273,304308,141324,479335,401333,006322,366329,970329,543329,533328,699328,269328,153328,699333,006333,006333,856326,727324,959326,622332,141331,666331,491312,391311,787312,282321,820322,366322,160313,214310,188
Average length
Years
5
4
3
3
2
2
3
3
4
455
6665
55
5
5
5
55
55
5
5
5
5
5
5
Months
15
8
11
8
11
790
11
6
11
990
01110843
65
5
3
44
32
2
3
2
3
3
Note.—All issues classified to final maturity.Through fiscal year 1976, the fiscal year was on a July 1-June 30 basis; beginning October 1976 (fiscal year 1977), the fiscal year is on
an October 1-September 30 basis.Source: Department of the Treasury.
399
Digitized for FRASER http://fraser.stlouisfed.org/ Federal Reserve Bank of St. Louis

TABLE B-87.—Estimated ownership of public debt securities by private investors, 1976-96[Par values; Millions of dollars]
End of month
1976: JuneDec
1977- JuneDec
1978- JuneDec
1979: JuneDec
1980- JuneDec .....
1981-. JuneDec
1982: JuneDec
1983: JuneDec
1984- JuneDec
1985- JuneDec
1986- JuneDec
1987- JuneDec
1988- June . .Dec
1989- JuneDec
1990: JuneDec .
1991- JuneDec
1992- MarJuneSeptDec
1993- MarJuneSeptDec
1994- MarJuneSeptDec ::: :::.:
1995: MarJuneSeptDec
1996- MarJuneSept
Held by private investors
Total
376.4409.5421.0461.3477.8508.6516.6540.5
558.2616.4
651.2694.5740.9848.4
948.61,022.61,102.21,212.51,292.01,417.21,502.71,602.01,658.11,731.41,786.71,858.51,909.12,015.82,141.82,288.32,397.92,563.22,664.02,712.42,765.52,839.92,895.02,938.42,983.03,047.4
3,094.63,088.23,127.83,168.03,239.23,245.03,279.53,294.9
3,382.83,347.33,396.2
Com-mer-cial
banks2
92.5103.8
102.9102.099.695.3
94.695.6
98.5111.5115.0113.8114.7134.0167.4179.5180.6181.5195.6189.4194.4197.7192.5194.4190.8185.3178.4165.3177.3172.1196.2232.5255.9267.0287.5294.4310.2307.2313.9322.2344.4330.1313.2290.1307.7298.0289.0280.1
281.0285.0280.0
Nonbank investors
Total
283.9305.7
318.1359.3378.24133
422.0444.9459.7504.9536.2580.7626.2714.4
781.2843.1921.6
1.031.01,096.41,227.81,308.31,404.31,465.61,537.01,595.91,673.21,730.71,850.51,964.52,116.22,201.72,330.72,408.12.445.42,478.02.545.52,584.82,631.22,669.12,725.22,750.22,758.12,814.62,877.9
2,931.52,947.02,990.53,014.8
3,101.83,06233,116.2
Individuals3
Total
96.1101.6104.9107.8109.0114.0
115.5118.0
116.5117.1107.4110.8114.1116.5121.3133.4
142.2143.8148.7154.8159.5162.7165.6172.4
182.0190.4211.7216.4229.6233.8243.5263.9268.1275.1281.2289.2297.7303.0305.8309.9
315.1321.1327.2331.2
342.8344.2345.9347.7
347.2347.6354.0
Savingsbonds4
69.672.0
74.476.7
79.180.7
80.679.9
73.472.5
69.268.1
67.468.3
69.771.5
72.974.5
76.779.8
83.892.3
96.8101.1106.2109.6114.0117.7121.9126.2133.2138.1142.0145.4150.3157.3163.6166.5169.1171.9175.0177.1178.6180.5181.4182.6183.5185.0
185.8186.5186.8
Othersecuri-
ties
26.529.6
30.531.1
29.933.3
34.938.1
43.144.6
38.242.7
46.748.2
51.661.9
69.369.3
72.075.0
75.770.4
68.871.3
75.880.8
97.798.7
107.7107.6110.3125.8126.1129.7130.9131.9134.1136.4136.7137.9140.1144.0148.6150.7
161.4161.6162.4162.7
161.4161.1167.2
Insur-ance
compa-nies
10.712.7
13.015.1
14.215.3
16.015.6
15.318.1
19.921.6
24.430.6
37.846.0
51.264.5
69.180.5
87.9101.6104.7108.1113.5118.6120.6123.9133.7138.2156.8181.8188.4192.8194.8197.5208.0217.8229.4234.5233.4238.0243.7240.1245.7248.3249.8250.8
256.0258.0240.0
Moneymarketfunds
0.81.1.8.9
1.31.5
3.85.6
5.33.59.0
21.5
22.442.6
28.322.8
14.925.9
24.825.1
22.828.6
20.614.6
13.411.8
11.314.9
28.045.5
55.480.0
84.879.479.479.7
77.976.274.880.8
69.359.959.967.6
67.758.764.271.3
87.382.285.3
Corp-ora-
tions s
23.323.5
22.118.2
17.317.3
18.617.0
14.019.3
19.917.9
17.624.5
32.839.7
45.350.1
54.959.0
61.268.8
79.784.6
87.686.0
91.093.4
96.9108.9130.8150.8166.0175.0180.8192.5199.3206.1215.6213.0216.3226.3229.3226.5230.3227.7224.1228.8
229.0230.9249.1
Stateandlocal
govern-ments6
36.744.3
56.768.1
82.693.1
102.7100.2
100.1114.2128.1135.9157.9163.2184.3199.1222.2242.4279.4359.6405.7446.6492.7500.3506.0509.1481.9489.5538.7542.5561.8579.2594.8587.8578.9563.3578.9599.9603.5605.9600.9584.1534.8483.4
467.1433.9389.8352.2
336.8340.0300.0
Foreignand
interna-tional7
69.878.1
87.9109.6119.5133.1
114.9119.0118.2129.7
136.6136.6137.2149.5160.1166.3171.6205.9213.8224.8250.9263.4281.1299.7345.4362.2369.1429.6427.3458.4473.6491.7507.9529.6535.2549.7564.2567.7591.3622.9633.3633.1655.6688.6729.0784.1848.1861.8
930.3958.2
1,027.7
Otherinves-tors8
46.544.4
32.739.6
34.339.0
50.569.5
90.3103.0115.3136.4
152.6187.5216.6235.8274.1298.4305.7324.1
320.2332.6321.2357.3347.9395.1445.1482.8510.3588.9579.8583.3598.1605.8627.7673.5658.9660.5648.6658.3681.9695.7764.1840.5848.8850.1868.6902.2
915.2845.4860.1
1 U.S. savings bonds, series A-F and J, are included at current redemption value.2 Includes domestically chartered banks, U.S. branches and agencies of foreign banks, New York nvestment companies majority owned by
foreign banks, and Edge Act corporations owned by domestically chartered banks, foreign banks, and banks in U.S. affiliated territories.3 Includes partnerships and personal trust accounts.< Includes U.S. savings notes. Sales began May 1. 1967, and were discontinued June 30, 1970.5 Exclusive of banks and insurance companies.6State and local government holdings (beginning 1979) include their fully defeased debt that is backed by U.S. Treasury securities. In-
cludes State and local pension funds.7 Consists of the investments of foreign and international accounts (both official and private) in U.S. public debt issues. Reflects 1978
benchmark through December 1984; December 1984 benchmark through 1989; and December 1989 benchmark thereafter.8 Includes savings and loan associations, credit unions, nonprofit institutions, mutual savings banks, corporate pension trust funds, dealers
and brokers, certain Government deposit accounts, and Government-sponsored enterprises.
Source: Department of the Treasury.
400
Digitized for FRASER http://fraser.stlouisfed.org/ Federal Reserve Bank of St. Louis

CORPORATE PROFITS AND FINANCE
TABLE B-88.—Corporate profits with inventory valuation and capital consumption adjustments,1959-96
[Billions of dollars,- quarterly data at seasonally adjusted annual rates]
Year or quarter
1959
I960196119621963196419651966196719681969 . . . .
197019711972197319741975197619771978197919801981198219831984198519861987198819891990199119921993199419951990-1
IIIIIIV
1991:1 . . . .IIIIIIV
1992:1II .IllIV
1993- 1||IllIV
1994:1HIII .IV
1995-1IIIllIV
1996- 1II . .Ill
Corporateprofits with
inventoryvaluation
and capitalconsumptionadjustments
50.248.849.857.763.570.480.986.383.690.387.575.788.8
102.2115.1103.7121.1147.0167.3191.6194.0167.1183.9159.2212.3268.2282.2271.0309.7357.2356.4369.5382.5401.4464.4529.5586.6369.3392.8350.4365.5393.7380.0376.8379.6417.3409.3351.3427.7427.4447.8469.6512.8459.7534.3553.1570.9560.0562.3612.5611.8645.1655.8661.2
Corporateprofits
taxliability
23.622.722.824.026.228.030.933.732.739.439.734.437.741.949.351.850.964.273.083.588.084.881.163.177.294.096.5
106.5127.1137.0141.3140.5133.4143.0163.8195.3218.7133.0141.2148.0139.7130.1132.3136.0135.2143.9150.9127.6149.7151.5162.6159.3181.7171.4192.8203.4213.5217.3214.2224.5218.7233.4236.4233.4
Corporate profits after tax with inventoryvaluation and capital consumption adjustments
Total
26.626.127.033.737.342.450.152.650.951.047.941.451.060.365.851.970.282.894.2
108.1106.082.3
102.896.1
135.1174.2185.7164.5182.6220.2215.1229.0249.1258.4300.6334.2368.0236.3251.6202.4225.9263.6247.7240.7244.4273.4258.3223.8278.0275.9285.2310.3331.1288.3341.5349.7357.3342.7348.1388.1393.1411.8419.4427.7
Dividends
12.713.414.015.016.118.020.220.922.124.625.223.723.725.828.130.430.135.940.846.052.559.369.569.880.883.292.8
110.2107.0116.8138.9151.9163.1169.5197.3211.0227.4150.7152.4152.4152.0158.6162.6165.9165.3162.1164.6170.9180.4190.2195.8200.2202.9204.4208.8212.5218.5221.7224.6228.5234.7239.9243.1245.2
Undistributedprofits with
inventoryvaluation
and capitalconsumptionadjustments
13.912.713.018.721.224.429.931.728.926.322.617.727.334.537.621.540.147.053.462.053.523.033.326.354.391.092.954.275.7
103.376.277.286.088.9
103.3123.2140.685.699.250.073.8
105.085.174.979.1
111.393.752.997.785.789.4
110.1128.283.9
132.7137.2138.8121.0123.5159.6158.4171.8176.3182.5
Source.- Department of Commerce, Bureau of Economic Analysis.
401
Digitized for FRASER http://fraser.stlouisfed.org/ Federal Reserve Bank of St. Louis

TABLE B-89.—Corporate profits by industry, 1959-96
[Billions of dollars; quarterly data at seasonally adjusted annual rates]
Year orquarter
19591960196119621963196419651966196719681969197019711972197319741975197619771978197919801981198219831984198519861987198819891990199119921993 .199419951990:1
IIIllIV
1991-1 .IIIllIV
1992:1||IllIV
1993:1||IllIV
1994:1||IllIV
1995:1IIIllIV
1996:1IIIII
Corporate profits with inventory valuation adjustment and without capital consumption adjustment
Total
53.151.051.356.461.267.577.683.080.386.983.271.885.597.9
110.9103.4129.4158.9186.8213.1220.2198.3204.1166.8203.7238.5230.5234.0272.9325.0330.6358.2378.2398.9457.7517.9570.8353.4381.1341.9356.5388.3375.5373.8375.2411.4404.3359.4420.5422.4442.0465.9500.5471.6516.2534.3549.6542.6547.3597.9595.3624.8633.5637.6
Domestic industries
Total
50.447.848.052.657.163.072.978.575.581.376.664.777.788.496.085.9
114.8142.3167.7190.2185.6162.9174.4139.4173.1205.8197.1199.3231.3274.3272.6292.5309.5334.0388.1453.7494.1289.7316.2281.5282.5313.2309.2311.9303.6341.7337.6295.6361.2347.0375.7393.1436.8407.0452.4469.9485.5467.5468.2527.1513.7541.6555.1561.0
Financial1
Total
7.07.77.57.67.37.57.99.29.5
10.911.613.115.216.417.516.215.919.925.731.831.624.318.715.624.820.529.036.437.143.053.168.687.483.791.094.4
119.163.169.471.570.582.287.592.287.6
105.196.949.783.185.788.188.8
101.364.997.8
108.4106.4114.3112.6130.4119.3134.9136.6135.0
FederalReservebanks
0.7.9.8
141.11.31.72.02.53.13.53.33.34.55.75.65.96.17.69.4
11.814.415.214.616.416.315.515.717.620.221.420.317.816.117.821.920.621.222.221.421.020.220.119.718.818.417.316.716.516.115.915.916.116.918.119.821.522.321.921.721.521.721.6
Other
6.36.76.86.86.46.46.57.57.68.48.59.6
11.913.113.010.510.314.019.624.122.212.64.3
.410.24.1
12.620.921.425.432.947.267.165.974.976.697.342.548.249.249.061.267.372.067.986.378.532.466.469.272.072.985.548.880.990.386.692.790.3
108.597.6
113.4114.9113.4
Nonf inanc ia l
Total
43.440.240.445.049.855.565.069.366.070.465.051.662.572.078.569.798.9
122.4142.0158.4153.9138.5155.7123.8148.3185.3168.1162.9194.2231.2219.6223.8222.1250.3297.2359.3375.0226.5246.7210.0212.1230.9221.7219.8216.1236.6240.7245.9278.1261.2287.6304.3335.4342.1354.6361.5379.0353.2355.6396.7394.4406.7418.5426.1
Manu-fac-
turing2
26.523.823.426.329.632.439.742.439.041.737.027.134.841.446.740.754.570.778.589.688.375.887.563.472.886.681.660.285.0
115.1109.3112.392.796.3
109.7142.7145.7115.9125.199.8
108.4104.391.790.883.892.089.698.4
105.190.4
108.4106.0134.0145.3134.2142.8148.4134.7137.8153.2157.3161.3164.7170.6
Trans-porta-tionand
publicutilities
7.17.57.98.59.5
10.211.011.910.911.010.68.28.99.49.07.6
10.915.318.521716.918.320.120.929.739.734.338.141.748.742.643.253.957.870.681.394.842.148.746.835.352.355.653.554.561.257.454.358.368.566.473.674.073.381.381.689.088.592.5
102.395.895.6
104.5102.5
Whole-sale
trade
2.82.52.52.82.83.43.83.94.04.54.84.35.16.88.0
11.313.612.715.415.418.516.721.919.018.727.820.622.916.719.320.417.220.623.025.534.529.618.919.013.916.921.022.921.417.014.621.827.428.317.928.627.028.728.839.534.335.429.726.431.231.237.532.834.5
Retailtrade
3.32.83.03.43.64.54.94.85.66.46.46.07.27.46.62.38.2
10.512.412.39.86.19.8
13.118.721.522.523.723.919.620.720.626.132.239.242.238.719.922.717.022.825.323.826.528.632.034.325.237.336.338.142.439.838.343.243.743.636.036.642.539.641.744.344.5
Other
3.63.63.63.94.4515.66.26.46.86.25.96.67.18.27.7
11.613.317.119.420.521.616.37.48.49.89.1
18.026.928.526.630.628.941.052.158.666.229.831.332.528.628.127.827.532.236.837.540.649.348.246.255.259.056.356.559.062.564.362.367.570.570.672.273.9
Restof theworld
2.73.13.33.84.14.54.74.54.85.66.67.17.99.5
14.917.514.616.519.122.934.635.529.727.430.632.733.434.641.650.758.065.768.764.969.664.376.763.764.960.473.975.266.261.971.569.766.763.959.375.466.372.863.764.663.864.464.275.179.170.881.783.278.476.6
1 Consists of the following industries: Depository institutions; nondepository credit institutions; security and commodity brokers; insurancecarriers; regulated investment companies; small business investment companies-, and real estate investment trusts.2 See Table B-90 for industry detail.
Note.—The industry classification is on a company basis and is based on the 1987 Standard Industrial Classification (SIC) beginning 1987,and on the 1972 SIC for earlier years shown.
Source: Department of Commerce, Bureau of Economic Analysis.
402
Digitized for FRASER http://fraser.stlouisfed.org/ Federal Reserve Bank of St. Louis

TABLE B-90.—Corporate profits of manufacturing industries, 1959-96
[Billions of dollars,- quarterly data at seasonally adjusted annual rates]
Year orquarter
19591960196119621963196419651966196719681969197019711972197319741975197619771978197919801981198219831984198519861987198819891990199119921993199419951990:1
IIIll ....IV ....
1991:1IIIll ....IV ....
1992:1I IIll ....IV ....
1993:1IIIll ....IV ....
1994:1IIIll ....IV ....
1995:1IIIll ....IV ....
1996:1IIIll ....
Corporate profits with inventory valuation adjustment and without capital consumption adjustment
Totalmanufac-
turing
26.523.823.426.329.632.439.742.439.041.737.027.134.841.446.740.754.570.778.589.688.375.887.563.472.886.681.660.285.0
115.1109.3112.392.796.3
109.7142.7145.7115.9125.199.8
108.4104.391.790.883.892.089.698.4
105.190.4
108.4106.0134.0145.3134.2142.8148.4134.7137.8153.2157.3161.3164.7170.6
Durable goods
Total
13.711.711.414.116.418.023.223.921.222.419.010.416.622.625.015.120.331.237.645.036.517.918.14.9
18.636.730.128.640.149.249.340.930.537.154.277.277.248.944.642.327.922.635.332.231.933.435.337.242.636.952.455.472.176.075.175.681.875.874.078.180.889.592.494.6
Pri-marymetalindus-tries
2.32.01.61.62.02.53.13.62.71.91.4.8.8
1.62.35.02.72.11.03.63.52.63.0
-4.7-5.0-.5-.8
.92.75.96.03.31.3-.1
.2
.73.05.63.71.52.61.71.51.11.0.5.3
-.5-.8
-1.21.4-.51.3.6.9.8.4
2.24.72.52.72.31.43.2
Fabri-catedmetalprod-ucts
1.1.8
1.01.21.31.42.12.42.52.32.01.11.52.22.61.83.23.94.55.05.24.34.42.63.04.64.75.25.46.36.56.25.46.57.7
10.711.17.66.55.65.03.66.25.66.16.26.47.26.45.37.88.19.5
10.910.610.211.110.211.510.712.213.914.416.0
Indus-trial
machin-ery andequip-ment11X111
2.21.81.92.42.53.34.04.54.14.13.73.03.04.34.73.14.86.78.3
10.49.17.58.23.43.75.55.52.74.79.4
11.110.24.35.67.09.0
12.112.410.410.07.95.45.02.05.04.75.46.06.43.87.19.17.98.79.18.0
10.112.512.112.511.114.313.613.0
Elec-tronicand
otherelectricequip-ment
1.71.31.31.51.61.72.73.03.02.92.31.31.92.83.2
.52.63.85.86.65.45.04.91.33.45.12.52.76.55.79.58.48.9
10.014.822.525.610.39.58.55.47.49.98.69.79.88.59.7
11.812.611.915.918.818.921.223.826.123.222.427.329.527.127.429.2
Motorvehicles
andequip-ment
3.03.02.54.04.94.66.25.14.05.54.81.35.15.95.9
.72.27.49.38.94.6
-4.3.2
-.35.28.97.34.43.85.72.2
-2.2-5.4-1.1
4.210.24.4
-4.0.0
1.9-6.6-9.6-5.2-2.3-4.7-2.0-.2
-2.8.4
-.44.22.3
10.714.29.58.58.66.73.04.43.68.1
10.610.2
Other
3.52.83.13.54.04.55.25.35.05.74.93.04.25.76.34.14.87.48.6
10.58.62.8
-2.72.78.3
13.010.812.717.016.213.915.016.016.220.324.120.917.014.614.813.714.118.017.114.814.214.817.618.416.920.120.523.822.723.824.325.521.020.420.621.723.825.023.0
Nondurable goods
Total
12.812.112.012.213.214.416.418.417.819.218.016.818.218.821.725.734.139.541.044.651.857.869.458.554.249.951.631.745.065.960.071.462.159.155.565.568.567.080.557.580.581.756.358.651.958.654.361.262.453.556.050.761.969.359.167.166.758.863.875.076.571.872.376.1
Foodand
kindredprod-ucts
2.52.22.42.42.72.72.83.33.23.23.03.23.52.92.52.68.67.16.86.15.86.09.07.36.16.58.67.3
11.311.911.014.518.218.316.219.117.79.5
14.916.117.517.717.621.516.115.920.220.017.218.815.216.014.619.518.019.719.418.318.416.817.515.713.218.3
Chem-icalsand
alliedprod-ucts
3.53.13.33.23.74.14.64.94.35.24.63.94.55.26.15.26.38.27.78.27.15.57.64.76.97.76.18.0
15.119.319.017.015.716.516.418.020.918.120.217.012.612.914.517.018.517.115.216.217.317.515.315.317.517.618.517.019.016.821.323.622.120.721.923.0
Petro-leumandcoalprod-ucts
2.62.62.22.22.22.32.93.43.93.73.33.63.73.25.2
10.79.8
13.312.915.524.533.638.631.622.516.117.3-5.8-3.810.45.0
17.05.9
-1.6-2.2-.1
.815.721.3-.3
31.432.4
1.7-6.1-4.5
1.8-6.9-1.8
.4-8.7-1.6-2.6
4.2.5
-8.23.34.2
-2.3-.25.2.3
-4.51.3
-1.2
Other
4.34.24.24.44.75.36.16.86.47.07.06.16.57.57.97.29.4
11.013.614.814.612.914.214.918.619.619.622.122.424.325.022.922.326.025.128.429.123.724.224.719.018.722.526.321.923.825.826.827.625.927.121.925.631.730.827.124.226.024.329.436.639.935.935.9
Note.—The industry classification is on a company basis and is based on the 1987 Standard Industrial Classification (SIC) beginning 1987and on the 1972 SIC for earlier years shown. In the 1972 SIC, the categories shown here as "industrial machinery and equipment" and"electronic and other electric equipment" were identified as "machinery, except electrical" and "electric and electronic equipment," respec-tively.
Source: Department of Commerce, Bureau of Economic Analysis.
403
Digitized for FRASER http://fraser.stlouisfed.org/ Federal Reserve Bank of St. Louis

TABLE B-91.—Sales, profits, and stockholders' equity, all manufacturing corporations, 1952-96
[Billions of dollars]
Year orquarter
19521953195419551956195719581959I9601961196219631964 . . .1965196619671968196919701971197219731973: IVNew series:1973: IV1974197519761977197819791980198119821983198419851986198719881989199019911992 3
1993199419951994:1
IIIIIIV
1995-.IIIIllIV
1996:1IIIll
All manufacturing corporations
Sales(net)
250.2265.9248.5278.4307.3320.0305.3338.0345.7356.4389.4412.7443.1492.2554.2575.4631.9694.6708.8751.1849.5
1,017.2275.1
236.61,060.61,065.21,203.21,328.11,496.41,741.81,912.82,144.72,039.42,114.32,335.02,331.42,220.92,378.22,596.22,745.12,810.72,761.12,890.23,015.13,255.83,524.9
758.0819.7823.2854.9843.0889.0881.2911.6881.5941.4940.4
Profits
Beforeincometaxes1
22.924.420.928.629.828.222.729.727.527.531.934.939.646.551.847.855.458.148.152.963.281.421.4
20.692.179.9
104.9115.1132.5154.2145.8158.6108.2133.1165.6137.0129.3173.0216.1188.8159.699.832.5
118.6245.3276.6
50.265.165.664.473.479.570.852.970.186.284.6
Afterincometaxes
10.711.311.215.116.215.412.716.315.215.317.719.523.227.530.929.032.133.228.631.036.548.113.0
13.258.749.164.570.481.198.792.6
101.370.985.8
107.687.683.1
115.6154.61363111.667.523.283.9
176.6200.135.547.046.947.352.557.650.739.351.163.063.1
Stock-holders'equity*
103.7108.2113.1120.1131.6141.1147.4157.1165.4172.6181.4189.7199.8211.7230.3247.6265.9289.9306.8320.8343.4374.1386.4
368.0395.0423.4462.7496.7540.5600.5668.1743.4770.2812.8864.2866.2874.7900.9957.6999.0
1.043.81,064.11,034.71.039.71.110.11,240.11.072.81.094.31.120.41.153.01.194.61,234.8U54.71,276.11,295.71,325.71,354.8
Durable goods industries
Sales(net)
122.0137.9122.8142.1159.5166.0148.6169.4173.9175.2195.3209.0226.3257.0291.7300.6335.5366.5363.1381.8435.8527.3140.1
122.7529.0521.1589.6657.3760.7865.7889.1979.5913.1973.5
1.107.61,142.61.125.51.178.01,284.71,356.61,357.21,304.01,389.81,490.21,657.61,803.9
384.1421.0412.9439.6431.6457.6445.9468.8451.6485.4476.1
Profits
Beforeincometaxes1
12.914.011.416.516.515.811.415.814.013.616.818.521.226.229.225.730.631.523.026.533.643.610.8
10.141.135.350.757.969.672.457.467.234.748.775.561.552.178.091.775.257.614.1
-33.539.0
121.6131.323.336.630.830.936.339.529.226.331.742.437.2
Afterincometaxes
5.55.85.68.18.37.95.88.17.06.98.69.5
11.614.516.414616.516.912.914.518.424.86.3
6.224.721.430.834.841.845.235.641.621.730.048.938.632.653.067.155.740.9
7.4-23.7
27.687.694.816.326.722.422.226.129.220.818.622.530.727.2
Stock-holders'equity2
49.852.454.958.865.270.572.877.982.384.989.193.398.5
105.4115.2125.0135.6147.6155.1160.4171.4188.7194.7
185.8196.0208.1224.3239.9262.6292.5317.7350.4355.5372.4395.6420.9436.3444.3468.7501.3515.0506.8473.9482.7533.3613.3504.0522.9541.7564.7588.8616.4619.0628.9638.0654.5669.1
Nondurable goods industries
Sales(net)
128.0128.0125.7136.3147.8154.1156.7168.5171.8181.2194.1203.6216.8235.2262.4274.8296.4328.1345.7369.3413.7489.9135.0
113.9531.6544.1613.7670.8735.7876.1
1,023.71,165.21,126.41,140.81,227.51,188.81,095.41,200.31,311.51,388.51,453.51,457.11,500.41,524.91,598.21,721.0
373.9398.7410.3415.3411.5431.4435.3442.8429.9456.0464.3
Profits
Beforeincometaxes1
10.010.49.6
12.113.212.411.313.913.513.915.116.418.320.322.622.024.826.625.226.529.637.810.6
10.551.044.654.357.262.981.888.491.373.684.490.075.677.295.1
124.4113.5102.085.766.079.6
123.7145.326.928.534.833.637.140.041.526.638.543.847.3
Afterincometaxes
5.25.55.67.07.87.56.98.38.28.59.2
10.011.613.014.614.415.516.415.716.518.023.3
6.7
7.034.127.733.735.539.353.556.959.649.355.858.849.150.562.687.580.670.660.147.056.489.1
105.319.220.324.525.126.428.429.920.728.632.235.9
Stock-holders'equity2
53.955.758.261.366.470.674.679.283.187.792.396.3
101.3106.3115.1122.6130.3142.3151.7160.5172.0185.4191.7
182.1199.0215.3238.4256.8277.9308.0350.4393.0414.7440.4468.5445.3438.4456.6488.9497.7528.9557.4560.8557.1576.8626.8568.8571.4578.6588.3605.8618.4635.8647.2657.7671.3685.7
1 In the old series, "income taxes" refers to Federalnew series, no income taxes have been deducted.
taxes only, as State and local income taxes had already been deducted. In the2 Annual data are average equity for the year (using four end-of-quarter figures).3 Data for 1992 (most significantly 1992:1) reflect the early adoption of Financial Accounting Standards Board Statement 106 (Employer's
Accounting for Post-Retirement Benefits Other Than Pensions) by a large number of companies during the fourth quarter of 1992. Data for1993:1 also reflect adoption of Statement 106. Corporations must show the cumulative effect of a change in accounting principle in the firstquarter of the year in which the change is adopted.
Note.—Data are not necessarily comparable from one period to another due to changes in accounting principles, industry classifications,sampling procedures, etc. For explanatory notes concerning compilation of the series, see "Quarterly Financial Report for Manufacturing,Mining, and Trade Corporations," Department of Commerce, Bureau of the Census.
Source: Department of Commerce, Bureau of the Census.
404
Digitized for FRASER http://fraser.stlouisfed.org/ Federal Reserve Bank of St. Louis

TABLE B—92.—Relation of profits after taxes to stockholders' equity and to sales, all manufacturing
corporations, 1947-96
Year or quarter
1947194819491950195119521953195419551956195719581959I96019611962196319641965196619671968196919701971 . . ..19721973 . . .1973: IVNew series:1973 IV1974197519761977197819791980198119821983198419851986198719881989199019911992 2
1993199419951994 1
IIIIIIV
1995:1III l lIV
1996-1I IIll
Ratio of profits after income taxes (annualrate) to stockholders' equity— percent '
Allmanufacturingcorporations
15.616.011.615.412.110.310.59.9
12.612.310.98.6
10.49.28.99.8
10.311.613.013.411.712.111.59.39.7
10.612.813.4
14.314.911.613.914.215.016.413.913.69.2
10.612.510.19.5
12.816.113.610.76.32.28.1
15.916.113.217.216.716.417.618.616.212.315.819.018.6
Durablegoods
industries
14.415.712.116.913.011.111.110.313.812.811.38.0
10.48.58.19.6
10.111.713.814.211.712.211.48.39.0
10.813.112.9
13.312.610.313.714.516.015.411.211.96.18.1
12.49.27.5
11.914.311.18.01.5
-5.05.7
16.415.512.920.416.615.717.718.913.511.914.118.816.3
Nondurablegoods
industries
16.616.211.214.111.29.79.99.6
11.411.810.69.2
10.49.89.69.9
10.411.512.212.711.811.911.510.310.310.512.614.0
15.317.112.914.213.814.217.416.315.211.912.712.511.011.513.717.916.213.410.88.4
10.115.416.813.514.216.917.117.418.418.812.817.419.221.0
Profits after income taxes per dollar ofsates— cents
Allmanufacturingcorporations
6.77.05.87.14.94.34.34.55.45.34.84.24.84.44.34.54.75.25.65.65.05.14.84.04.14.34.74.7
5.65.54.65.45.35.45.74.84.73.54.14.63.83.74.96.05.04.02.4.8
2.85.45.74.75.75.75.56.26.55.84.35.86.76.7
Durablegoods
industries
6.77.16.47.75.34.54.24.65.75.24.83.94.84.03.94.44.55.15.75.64.84.94.63.53.84.24.74.5
5.04.74.15.25.35.55.24.04.22.43.14.43.42.94.55.24.13.0
.6-1.7
1.95.35.34.26.35.45.06.16.44.74.05.06.35.7
Nondurablegoods
industries
6.76.85.46.54.54.14.34.45.15.34.94.44.94.84.74.74.95.45.55.65.35.25.04.54.54.44.85.0
6.16.45.15.55.35.36.15.65.14.44.94.84.14.65.26.75.84.94.13.13.75.66.15.15.16.06.06.46.66.94.76.77.17.7
1 Annual ratios based on average equity for the year (using four end-of-quarter figures). Quarterly ratios based on equity at end of quarter
'See footnote 3, Table B-91.Note.—Based on data in millions of dollars.See Note, Table B-91.Source: Department of Commerce, Bureau of the Census.
405
Digitized for FRASER http://fraser.stlouisfed.org/ Federal Reserve Bank of St. Louis

TABLE B-93.—Common stock prices and yields, 1955-96
Year or month
1955195619571958195919601961196219631964196519661967196819691970197119721973197419751976197719781979198019811982198319841985198619871988198919901991199219931994199519961995:Jan
FebMarAprMayJuneJulyAugSeptOct .NovDec
1996:JanFebMar
ftJuneJulyAugSeptOct .N o v . . .Dec
Common stock prices '
New York Stock Exchange indexes(Dec. 31,1965=50)2
Composite
21.5424.4023.6724.5630.7330.0135.3733.4937.5143.7647.3946.1550.7755.3754.6745.7254.2260.2957.4243.8445.7354.4653.6953.7058.3268.1074.0268.9392.6392.46
108.09136.00161.70149.91180.02183.46206.33229.01249.58254.12291.15358.17253.56261.86266.81274.37281.81289.52298.18300.05310.41311.78317.58327.90329.22346.46346.73347.50354.84358.32345.52354.59360.96373.54388.75391.61
Industrial
46.1851.9758.0057.4448.0357.9265.7363.0848.0850.5260.4457.8658.2364.7678.7085.4478.18
107.45108.01123.79155.85195.31180.95216.23225.78258.14284.62299.99315.25367.34453.98319.93328.98337.96347.69357.01366.75379.13379.79390.42389.63398.66412.11412.71435.92439.56441.99452.63458.30438.58449.41459.69473.98490.60494.38
Transpor-tation
50.2653.5150.5846.9632.1444.3550.1737.7431.8931.1039.5741.0943.5047.3460.6172.6160.4189.3685.63
104.11119.87140.39134.12175.28158.62173.99201.09242.49247.29269.41327.33230.25237.29244.45254.36254.69256.80279.15285.63295.54291.16300.06303.53300.30315.29324.76326.42334.66331.57316.66321.61323.12332.93348.32352.28
Utility3
90.8190.8688.3885.6074.4779.0576.9575.3859.5863.0073.9481.8478.4476.4174.6977.8179.4993.9992.89
113.49142.72148.59143.53174.87181.20185.32198.91228.90209.06220.30249.77201.16207.73204.16208.93211.58216.27219.18221.99229.64236.43238.98247.59254.07257.80245.77244.87249.73247.20245.31244.74242.25249.61258.85257.09
Finance
44"4549.8265.8570.4960.0070.3878.3570.1249.6747.1452.9455.2556.6561.4264.2573.5271.9995.3489.28
114.21147.20146.48127.26151.88133.26150.82179.26216.42209.73238.45303.89201.05211.76213.29219.38228.55236.26240.50245.27260.72265.12266.12273.36273.73290.97290.45287.92290.43294.42287.89302.95308.16324.42345.30350.01
DowJones
industrialaverage 2
442.72493.01475.71491.66632.12618.04691.55639.76714.81834.05910.88873.60879.12906.00876.72753.19884.7695071923.88759.37802.49974.92894.63820.23844.40891.41932.92884.36
1,190.341,178.481,328.231,792.762,275.992,060.822,508.912,678.942,929.333,284.293,522.063,793.774,493.765,742.893,872.463,953.724,062.784,230.664,391.574,510.764,684.764,639.274,746.764,760.464,935.815,136.105,179.375,518.735,612.245,579.865,616.715,671.515,496.265,685.505,804.015,996.216,318.366,435.87
Standard& Poor's
compositeindex
(1941-43=10)2
40.4946.6244.3846.2457.3855.8566.2762.3869.8781.3788.1785.2691.9398.7097.8483.2298.29
109.20107.4382.8586.16
102.0198.2096.02
103.01118.78128.05119.71160.41160.46186.84236.34286.83265.79322.84334.59376.18415.74451.41460.33541.64670.83465.25481.92493.15507.91523.81539.35557.37559.11578.77582.92595.53614.57614.42649.54647.07647.17661.23668.50644.07662.68674.88701.46735.67743.25
Common stock yields(S&P)(percent)4
Dividend-price
ratio 5
4.084.094.353.973.233.472.983.373.173.013.003.403.203.073.243.833.142.843.064.474.313.774.625.285.475.265.205.814.404.644.253.493.083.643.453.613.242.992.782.822.562.192.872.812.762.682.602.552.502.492.422.412.372.302.312.222.222.242.212.212.282.222.202.112.012.01
Earnings-price
ratio*
7.957.557.896.235.785.904.625.825.505.325.596.635.735.676.086.455.415.507.12
11.599.158.90
10.7912.0313.4612.6611.9611.608.03
10.028.126.095.488.017.426.474.794.224.465.836.09
6.50
6"32
6.02
5.51
5.27
5.21
5.25
1 Averages of daily closing prices, except NYSE data through May 1964 are averages of weekly closing prices.2 Includes stocks as follows: for NYSE, all stocks listed (more than 2,000); for Dow-Jones industrial average, 30 stocks; and for S&P com-posite index, 500 stocks.
Effective April 1993, the NYSE doubled the value of the utility index to facilitate trading of options and futures on the index. Annualindexes prior to 1993 reflect the doubling.4 Based on 500 stocks in the S&P composite index.5 Aggregate cash dividends (based on latest known annual rate) divided by aggregate market value based on Wednesday closing prices.Monthly data are averages of weekly figures; annual data are averages of monthly figures.6 Quarterly data are ratio of earnings (after taxes) for 4 quarters ending with particular quarter to price index for last day of that quarter.Annual data are averages of quarterly ratios.
Note.—All data relate to stocks listed on the New York Stock Exchange.Sources: New York Stock Exchange (NYSE), Dow Jones & Co., Inc., and Standard & Poor's Corporation (S&P).
406
Digitized for FRASER http://fraser.stlouisfed.org/ Federal Reserve Bank of St. Louis

TABLE B-94.—Business formation and business failures, 1955-96
Year or month
1955195619571958195919601961 .19621963196419651966196719681969 !....!'.!...!!.'.197019711972 '.'....',19731974 !....!"...'"1975197619771978197919801981 .!...'....'."1982198319841985198619871988 .. ..198919901991199219931994 ...19951996
1995: JanFebMarAprMayJuneJulyAugSeptOctNovDec
1996: JanFebMar
&•::::::June{uiyAuesel:::::::::OctNovDec
Indexof net
businessformation(1967=
100)
96.694.690.390.297.994.590.892.694.498.299.899.3
100.0108.3115.8108.8111.1119.3119.1113.2109.9120.4130.8138.1138.3129.9124.8116.4117.5121.3120.9120.4121.2124.1124.8120.7115.2116.3121.1125.5
(3)(3)
Newbusinessincorpo-rations
(number)
139,915141,163137,112150,781193,067182,713181,535182,057186,404197,724203,897200,010206,569233,635274,267264,209287,577316,601329,358319,149326,345375,766436,170478,019524,565533,520581,242566,942600,420634,991664,235702,738685,572685,095676,565647,366628,604666,800706,537741,249767,996
Seasonally adjusted
(3)(3)
fl8(3)(3)(3)(3)(3)(3)(3)(3)(3)(3)(3)(3)
8(3)WW(3)
66,23664,56665,29257,83965,42263,49359,94669,17461,75967,14665,99261,14269,51569,70960,55667,45468,26961,60273,208
Business failures1
Businessfailurerate2
41.648.051.755.951.857.064.460.856.353.253.351.649.038.637.343.841.738.336.438.442.634.828.423.927.842.161.388.4
109.7107.0115.0120.0102.098.065.074.0
107.0110.0109.086.090.0
— ™
::::
Number offailures
Total
10,96912,68613,73914,96414,05315,44517,07515,78214,37413,50113,51413,06112,3649,6369,154
10,74810,3269,5669,3459,915
11,4329,6287,9196,6197,564
11,74216,79424,90831,33452,07857,25361,61661,11157,09750,36160,74788,14097,06986,13371,55871,12871,811
6,2995,6636,6865,5916,4085,9134,6806,3385,4296,5496,0765,4966,0435,5526,6316,7067,2346,2794,5474,95447556,4956,2226,393
Liability size class
Under$100,000
10,11311,61512,54713,49912,70713,65015,00613,77212,19211,34611,34010,83310,1447,8297,1928,0197,6117,0406,6276,7337,5046,1764,8613,7123,9305,6828,233
11,50915,57233,52736,55138,90838,9493830033,31240,83360,61768,26461,18850,81449,49549,547
4,5174,0354,7143,8434,3764,0603,1864,3723,7494,6374,2743,7324,2193,8884,5624,6174,9514,3313,1703,3333,3654,4564,2784,377
$100,000and over
8561,0711,1921,4651,3461,7952,0692,0102,1822,1552,1742,2282,2201,8071,9622,7292,7152,5262,7183,1823,9283,4523,0582,9073,6346,0608,561
13,39915,76218,55120,70222,70822,16218,79717,04919,91427,52328,80524,94520,74421,63322,264
1,7821,6281,9721,7482,0321,8531,4941,9661,6801,9121,8021,7641,8241,6642,0692,0892,2831,9481,3771,6211,3902,0391,9442,016
Amount of current liabilities(millions of dollars)
Total
449.4562.7615.3728.3692.8938.6
1,090.11,213.61,352.61,329.21,321.71,385.71,265.2
941.01,142.11,887.81,916.92,000.22,298.63,053.14,380.23,011.33,095.32,656.02,667.44,635.16,955.2
15,610.816,072.929,268.636,937.444,724.034,723.839,573.042,328.856,130.196,825.394,317.547,755.528,977.937,283.634,021.1
2,237.41,253.91,943.81,725.62,842.61,302.92,268.02,187.82,685.8
14,763.61,982.62,089.54,302.92,067.01,683.93,199.92,568.31,646.84,793.21,221.22,903.12,097.21,395.76,142.0
Liability size class
Under$100,000
206.4239.8267.1297.6278.9327.2370.1346.5321.0313.6321.7321.5297.9241.1231.3269.3271.3258.8235.6256.9298.6257.8208.3164.7179.9272.5405.8541.7635.1409.8423.9838.3746.0686.9670.5735.6
1,044.91,096.7
947.6845.0866.1913.1
69.167.280.370.381.976.058.479.367.279.073.164.466.865.381.190.488.980.448.773.654.392.787.783.3
$100,000and over
243.0322.9348.2430.7413.9611.4720.0867.1
1,031.61,015.61,000.01,064.1
967.3699.9910.8
1,618.41,645.61,741.52,063.02,796.34,081.62,753.42,887.02,491.32,487.54,362.66,549.3
15,069.115,437.828,858.836,513.543,885.733,977.838,886.141,658.255,394.595.780.493,220.846,807.928,132.936,417.433,108.0
2,168.31,186.71,863.51,655.32,760.71,226.92,209.62,108.62,618.7
14,684.61,909.52,025.14,236.12,001.71,602.73,109.62,479.31,566.54,744.51,147.72,848.82,004.51,308.06,058.7
1 Commercial and industrial failures only through 1983, excluding failures of banks, railroads, real estate, insurance, holding, and financialcompanies, steamship lines, travel agencies, etc.
Data beginning 1984 are based on expanded coverage and new methodology and are therefore not generally comparable with earlier data.Data for 1996 are subject to revision due to amended court filings.2 Failure rate per 10,000 listed enterprises.'Series discontinued in 1995.Sources: Department of Commerce (Bureau of Economic Analysis) and The Dun & Bradstreet Corporation.
407
Digitized for FRASER http://fraser.stlouisfed.org/ Federal Reserve Bank of St. Louis

AGRICULTURE
TABLE B-95.—Farm income, 1945-96
[Billions of dollars,- quarterly data at seasonally adjusted annual rates]
Year or quarter
194519461947 .194819491950195119521953195419551956195719581959I9601961 .196219631964196519661967 . .196819691970197119721973 . . .197419751976197719781979198019811982 .19831984198519861987 .-.198819891990199119921993199419951994:1
IIIllIV
1995:1IIIllIV .
1996- \f\\P . .
Income of farm operators from farming
Gross farm income
Total1
25.429.632.436.530.833.138.337.834.434.233.534.034.839.037.938.640.542.343.442.346.550.550.551.856.458.862.171.198.998.2
100.6102.9108.8128.4150.7149.3166.3164.1153.9168.0161.2156.1168.4177.9191.9198.2191.9200.6204.2215.8210.4221.2208.6214.1219.4208.3206.4218.5208.4233.1245.4
Cash marketing receipts
Total
21.724.829.630.227.828.532.932.531.029.829.530.429.733.533.634.035.236.537.537.339.443.442.844.248.250.552.761.186.992.488.995.496.2
112.4131.5139.7141.6142.6136.8142.8144.1135.4141.8151.2160.8169.5167.9171.3177.6180.8185.8179.9170.8186.9185.5180.6181.0199.8181.5193.5209.5
Livestockand
products
12.013.816.517.115.416.119.618.216.916.316.016.417.419.218.919.019.520.220.019.921.925.024.425.528.629.530.535.645.841.343.146.347.659.269.268.069.270.369.672.969.871.676.079.683.989.285.885.690.288.186.892.182.997.779.983.281.696.186.585.389.7
Crops
9.711.013.113.112.412.413.214.314.113.613.514.012.314.214.715.015.716.317.417.417.518.418.418.719.621.022.325.541.151.145.849.048.653.262.371.772.572.367.269.974.363.865.871.676.980.382.185.787.592.698.987.988.089.2
105.597.499.4
103.795.1
108.2119.8
Value ofinventorychanges*
-0.4.0
-1.81.7-.9
.81.2
.9-.6
'.2
!s.0.4.3.6.6
-.81.0
~.'7
!l.0
1.4.9
3.4-1.6
3.4-1.5
1.11.95.0
-6.36.5
-1.4-10.9
6.0-2.3-2.2-2.3-4.1
3.83.3
4^2-4.5
8.2-3.410.29.67.35.8
-4.1-3.9-3.0-2.4
6.46.1
Produc-tion
expenses
13.114.517.018.818.019.522.322.821.521.822.222.723.725.827.227.428.630.331.631.833.636.538.239.542.144.547.151.764.671.075.082.788.9
103.2123.3133.1139.4140.3139.6142.0132.6125.2131.0139.9146.7153.4153.3152.5160.5167.4175.6164.5166.8168.8169.6172.4175.4177.5177.0178.4185.6
Net farmincome
12.315.115.417.712.813.615.915.013.012.411.311.311.113.210.711.212.012.111.810.512.914.012.312.314.314.415.019.534.427.325.520.219.925.227.416.126.923.814.226.028.630.937.438.045.344.838.548.043.648.434.856.741.845.349.835.930.941.031.454.759.8
1 Cash marketing receipts and inventory changes plus Government payments, other farm cash income, and nonmoney income furnished byfarms.2 Physical changes in end-of-period inventory of crop and livestock commodities valued at average prices during the period.
Note.—Data include net Commodity Credit Corporation loans and operator households.Source-. Department of Agriculture, Economic Research Service.
408
Digitized for FRASER http://fraser.stlouisfed.org/ Federal Reserve Bank of St. Louis

TABLE B-96.—Farm business balance sheet, 79.50-9.5
[Billions of dollars]
End of year
1950195119521953195419551956195719581959196019611962196319641965196619671968196919701971197219731974 7
19751976197719781979198019811982198319841985198619871988198919901991 . .1992199319941995
Assets
Totalassets
121.6136.1133.0128.7132.6137.0145.7154.5168.7173.0174.3181.6188.9196.7204.2
220.8234.0245.9257.1267.8278.9301.7339.9418.4449.1510.7590.7651.5767.3898.1981.5980.7942.8941.7855.2771.0723.6754.7786.3812.4839.9843.5868.9904.6938.1978.0
Physical assets
Realestate
75.483.885.184.387.893.0
100.3106.4114.6121.2123.3129.1134.6142.4150.5161.5171.2180.9189.4195.3202.4217.6243.0298.3335.6
383.6456.5509.3601.8706.1782.8785.6750.0753.4661.8586.2542.3563.5582.7600.8620.0625.5642.8674.0706.9755.7
Nonreal estate
Live-stockand
poul-try*
17.119.514.811.711.210.611.013.917.715.215.616.417.315.914.417.619.018.820.222.823.727.333.742.424.629.429.031.950.161.460.653.553.049.549.546.347.858.062.266.270.968.171.072.867.958.1
Machin-ery andmotor
vehicles
12.314.315.015.615.716.316.917.018.119.319.119.319.920.421.222.424.126.327.728.630.432.434.639.748.557.463.369.368.575.480.385.586.085.885.082.981.978.781.084.186.385.985.586.787.986.9
Crops2
7.18.27.96.87.56.56.86.46.96.26.36.56,57.47.07.98.17.97.48.38.79.9
12.921.322.520.520.620.423.829.931.127.924.022.024.321.215.116.221.621.921.520.722.720.422.525.1
Pur-chased
in-puts'
••"••••"•
:::::::::::
2"01.22.13.23.52.62.82.73.94.25.03.4
Financial assets
Invest-ments
incooper-atives
2.72.93.23.33.53.74.04.24.54.84.24.54.65.05.25.45.75.86.16.47.27.98.79.7
11.213.014.313.516.118.119.320.621.922.824.324.324.425.325.126.327.528.729.431.332.433.9
Other4
7.07.37.17.06.96.96.76.66.96.25.85.95.95.75.86.06.06.16.36.46.56.76.97.16.96.96.97.07.17.37.47.67.88.18.39.0
10.09.9
10.410.510.911.813.615.315.514.9
Claims
Totalclaims
121.6136.1133.0128.7132.6137.0145.7154.5168.7173.0174.3181.6188.9196.7204.2
220.8234.0245.9257.1267.8278.9301.7339.9418.4449.1510.7590.7651.5767.3898.1981.5980.7942.8941.7855.2
771.0723.6754.7786.3812.4839.9843.5868.9904.6938.1978.0
Realestatedebt*
5.25.76.26.67.17.88.59.09.7
10.611.312.313.515.016.918.920.722.624.726.427.529.332.036.140.845.350.558.466.779.789.798.8
101.8103.2106.7100.190.482.477.876.074.774.975.476.077.779.3
Non-real
estatedebt6
5.76.97.16.36.77.37.48.29.4
10.711.111.813.214.615.316.918.519.619.220.021.224.026.731.635.139.745.652.460.771.877.183.687.087.987.177.566.662.061.761.963.264.363.665.969.171.5
Propri-etors'equity
110.7123.7119.7115.7118.9121.9129.8137.3149.7151.7151.9157.5162.2167.1172.0185.0194.8203.7213.2221.4230.1248.5281.2350.8373.3425.7494.6540.6639.9746.6814.7798.3754.0750.6661.4593.4566.6610.3646.7674.5701.9704.3729.9762.6791.3827.2
1 Excludes commercial broilers; excludes horses and mutes beginning 1959; excludes turkeys beginning 1986.2 Non-Commodity Credit Corporation (CCC) crops held on farms plus value above loan rate for crops held under CCC.3 Includes fertilizer, chemicals, fuels, parts, feed, seed, and other supplies.4 Currency and demand deposits.s Includes CCC storage and drying facilities loans.6 Does not include CCC crop loans.7 Beginning 1974, data are for farms included in the new farm definition, that is, places with sales of $1,000 or more annually.Note.—Data exclude operator households.Beginning 1959, data include Alaska and Hawaii.Source: Department of Agriculture, Economic Research Service.
409
Digitized for FRASER http://fraser.stlouisfed.org/ Federal Reserve Bank of St. Louis

TABLE B-97.—Farm output and productivity indexes, 1948-94
[1992=100]
Year
194819491950195119521953195419551956195719581959I96019611962196319641965196619671968196919701971197219731974197519761977197819791980198119821983198419851986 . .19871988198919901991199219931994
Farmoutput
Total1
444444464748485050505254555656585859596162636367687066717276778279868776868987888289949410094105
Livestockandprod-ucts
4952545758596162636364666669697173717274757578798080797579808082858786888789909194949598100101105
Crops
Total2
424038404142414242424646484849514952515455575561616559686773768375878768858984857586929110089106
Feedcrops
47434442444345474651545457535456525958646264
f!7073617273788489769193619010095846285888610076102
Foodgrains
474138374844393738365343514743455052525962575463606671848378738594111108921019583847683107821009696
Oil crops
17151816161618202323292527323233334043455152535959715771608287105819210176879689887288879410085115
Productivityindicators3
Farmoutputper unitof totalfactorinput
434040414344454445454747485051525354545758595863636460656469676966747669788484878290939310094104
Farmoutputper
unit offarmlabor
131414151617181819202323242626282930333638393943434546495055586464697264748284877687918910099110
1 Gross production.2 Includes items not included in groups shown.3 See Table B-98 for farm inputs.Source: Department of Agriculture, Economic Research Service.
410
Digitized for FRASER http://fraser.stlouisfed.org/ Federal Reserve Bank of St. Louis

TABLE B-98.—Farm input use, selected inputs, 1948-96
Year
194819491950195119521953195419551956195719581959196019611962196319641965196619671968196919701971197219731974197519761977197819791980198119821983198419851986198719881989199019911992199319941995imp
Farm population,April >
Number(thou-sands)
24,38324,19423,04821,89021,74819,87419,01919,07818,71217,65617,12816,59215,63514,80314,31313,36712,95412,36311,59510,87510,45410.3079,7129,4259,6109,4729,2648,8648,25386,194• 6,50186,2418 6,0518 5,8508 5,6288 5,7875,7545,3555,2264,9864,9514,8014,5914,632
Aspercentof totalpopula-tion?
16.616.215.214.213.912.511.711.511.110.39.89.38.78.17.77.16.76.45.95.55.25.14.74.54.64.54.34.13.88 2.88 2.98 2.88 2.78 2.58 2.48 2.52.42.22.22.12.12.01.91.9
Farm employment(thousands)3
Total
10,3639,9649,9269,5469,1498,8648,6518,3817,8527,6007,5037,3427,0576,9196,7006,5186,1105,6105,2144,9034,7494,5964,5234,4364,3734,3374,3894,3314,3634,1433,9373,7653,699'3,5829 3,4669 3,3499 3,2333,1162,9122,8972,9542,8632,8912,87728102>002,7672,8362,842
Self-em-
ployedand
unpaidwork-ers*
8,0267,7127,5977,3107,0056,7756,5706,3455,9005,6605,5215,3905,1725,0294,8734,7384,5064,1283,8543,6503,5353,4193,3483,2753,2283,1693.0753.0212.9922,8522,6802,4952,4019 2,3249 2.24892,1719 2,0952,0181.8731,8461,9671,9352,0001,9681944l!9421,9251,9672.010
Hiredwork-ers
2.3372.2522.3292.2362.1442.0892.0812.0361.9521,9401.9821.9521,88513901,8271,7801,6041,4821,3601.2531,2131,1761,1751.1611.1461,1681,3141.3101.3711.2911,2561,2701,2989 1,2589 1,2189 1,1789 1,1381,0981.0391.0511.037928892910866857842869832
Cropshar-vested(mil-
lions ofacres) 5
356360345344349348346340324324324324324302295298298298294306300290293305294321328336337345338348352366362306348342325302297318322318319308321314326
Selected indexes ofinput use (1992=100)
Total
10411011011211111010611211211111111411311111111110910811010910710810810710811011010811111011611812011711411011010610310110099100102100100101
Farmlabor
3363293163032942782712742602432312312252192162111991931801711651631611581561561451451431381321281241261201181161091021021091031031051009596
Farmreal
estate
1021031051071081091101111111111111111111081071081071071061081071051051071051091111101101101091101121121101021081071041001001021011001009899
Dura-ble
equip-ment
627485951031071121141151131111111121101091091101121151191251271281291291321391441481521561611661661631551471391301201131081051031009794
Ener-gy
707880838689889191898788899193949697999898100100989799941101241301361241211161091061109891102102101100101100100103
Agri-culturalchemi-cals6
3335424142414244494748555659546065697976657073778291968897951051151271279689101961069689929599100105106
Feed,seed,andpur-
chasedlive-stock'
586060626263586568717576757275777574808081868886888888838883961031091031061089799999796919999100101102
Otherpur-
chasedinputs
4272727779757275747780929189919090909193918986848491969497981171251141071021051059786939699101102100108113
regaraiess 01 occupation, dee aiso looinote 5. aeries aiscominueo m iroi.al population of United States including Armed Forces overseas, as of July 1.ludes persons doing farmwork on all farms. These data, published by the Department of Agriculture, differ from those on agriculturalment by the Department of Labor (see Table B-33) because of differences in the method of approach, in concepts of employment, and
1 Farm population as defined by Department of Agriculture and Department of Commerce, i.e., civilian population living on farms in ruralareas, regardless of occupation^ See also footnote 8. Series discontinued in 1992.
'Incfud!employment I. . ._ . . . . . . . . . .in time of month for which the data are collected.
4Prior to 1982 this category was termed "family workers" and did not include nonfamily unpaid workers.5 Acreage harvested plus acreages in fruits, tree nuts, and farm gardens.6 Fertilizer, lime, and pesticides.7 Includes purchases of broiler- and egg-type chicks and turkey poults and livestock imports for purposes other than immediate slaughter.8 Based on new definition of a farm. Under old definition of a farm, farm population (in thousands and as percent of total population) for
1977,1978,1979,1980,1981,1982, and 1983 is 7.806 and 3.6; 8,005 and 3.6; 7,553 and 3.4; 7,241 and 3.2; 7,014 and 3.1; 6,880 and 3.0;7,029 and 3.0, respectively.
9 Basis for farm employment series was discontinued for 1981 through 1984. Employment is estimated for these years.
Note-Population includes Alaska and Hawaii beginning 1960.
Sources: Department of Agriculture (Economic Research Service) and Department of Commerce (Bureau of the census).
411
Digitized for FRASER http://fraser.stlouisfed.org/ Federal Reserve Bank of St. Louis

TABLE B-99.—Indexes of prices received ami prices paid by farmers, 1975-96[1990-92=100. except as noted]
Year ormonth
197519761977197819791980 . .19811982198319841985198619871988198919901991199219931994199519961995: Jan
FebMarAprMayJuneJulyAugSeptOctNovDec
1996: JanFebMar
&::::::June{«iyAugSeptOctNovDec
Prices received byfarmers
Allfarmprod-ucts
7375738394981009498101918789991041041009810110010211298979999100100101103104104106108108106109108111118118116116112110108
Crops
888783899810711198108111988786104109103101101102105112126103101107112117113114114115114117118122122129129131141136130125119116112
Live-stockandprod-ucts
62646478908989908891868891931001059997100959299939493908890919294929496949393939699103103106103102103
Prices paid by farmers
All
ities,services,interest,taxes,andwagerates1
47505358667582868689868587919699100101104106110115109109109109109110110110110111111112113113114114115115115115115115115114
Production items
Total2
55596167768592949294918687909599100101103106109115108108108108108109109109109110111112113113114114115115116116116114114114
Feed
8383828089981109910711295888310411010398999910510412897979810099100102104105110115121124125128130137136138137133122117113
Live-stockandpoul-try
39474865888580787673747385919310210296104958276928884828183818080807779747372697073757880798282
Fertil-izer
87747272779610410510010398908694999710310097106122126116120124126126125121120118119121123126128130130128125124121122125126127
Agri-cul-turalchemi-cals
72787166677177838790908987899395101103107110115118113114115115115115115116116116117117118118119119117117117117118118118119
Fuels
4043464861869897949393767677831001049692889110388878791959490909392929510098104105105969799102109110110
Farmma-chin-ery
38434751566370768185858385899496100104106113121125119119119119119120120121121123124125123123124124124125125125125126127127
Farmserv-ices
45
668898888889
9698103108113118118116117117117118119119120120119118119117117117117117117118119119118118118
Rent
B
70619;15
45
96100104100108116119116116116116116116116116116116116116119119119119119119119119119119119119
Wagerates
44485155606570747677788185879596100105108111113117116116116112112112111111111114114114119119119117117117113113113120120120
Adden-dum:
Averagefarmreal
estatevalueperacre(dol-lars)3
340397474531628737819823788801713640599632668682703713736782832890832
890
1 Includes items used for family living, not shown separately.'Includes other production items not shown separately.'Average for 48 States. Annual data are: March 1 for 1975, February 1 for 1976-41, April 1 for 1982-85, February 1 for 1986-89, and
January 1 for 1990-96.
Note—Data on a 1990-92 base prior to 1975 have not been calculated by Department of Agriculture.Source: Department of Agriculture (National Agricultural Statistics Service and Economic Research Service).
412
Digitized for FRASER http://fraser.stlouisfed.org/ Federal Reserve Bank of St. Louis

TABLE B-100.—U.S. exports and imports of agricultural commodities, 1940-96
[Billions of dollars]
Year
19401941194219431944194519461947194819491950195119521953195419551956195719581959I96019611962196319641965196619671968 !."" '.19691970197119721973197419751976197719781979198019811982198319841985198619871988198919901991199219931994
1995
Jan-Nov:19951996
Total1
05
122.12.1233.1403.53.6294034283.1324.2453.94048505.0566.36.26.96.46.36073779.4
17.721921.923023.629434.741243336636.137829.026228737139939439242.942.645.7558
50555.2
Feedgrains
(«)(4)(4)(4)(4)(4)
0.1
.12
32
3.4.3
655.8.8
1.1U1.1.99
11101.53.5465.2(04.9597.79894647.3816.0313.8597770575.75.04.78.2
7.38.6
Foodgrains*
(4)0.1(4).1.14.7
141.51.1
61.111
.56
1.010
912141.3151.71.41.81.51.41.2141.31.84.7546.2473.6556.37996797.47.54.53.8385.9714.84.25.45.65367
6.07.1
Exports
Oil-seedsand
prod-ucts
(4)(4)(4)01
(4)
H.2
2
22
4
5.4666.78
1.01.21.21.3131319222.44.3574.5516.68.28.99496918.7845.86564776.357647.27.31289
809.5
Cot-ton
02.112
3.54
!91011
95.85.7
10
410
9.56
.5
!s5.34s
131.0101.5172.22923201.8241.6A
162.02328252.01.52.737
322.4
To-bacco
(4)01
12
2.43
[33323
4.34.4344.44.4.4.5'5655
.78.9
1.1141.21315151.51.51.5121 11.3131.4141.71.31.314
1.31.3
Ani-malsand
prod-ucts
01
8121.3
9.9
.5
3534.56
7
6.66
7.8.8.7.7.789
101.11.6181.72 42.7303.83842393.84.24.145526.4646.7707.97.99.1
109
10.010.4
Total1
131.7131.51.8172.3283.12.9405.2454.24.0404.0403.9413.8373.9404.14.14.54.5505058586.58.4
1029.3
11013.414816.717416915316.519.320.021.520421.021722.822724.625.026.8300
27.630.6
Crops,fruits,and
vege-tables3
(4)0.1(4).1.11
'l
'.22
2
.22
2
.2
.22
3
.3
.4
.4
.5556
.8
.8
.89
1.2151.71720232.33.13.536363.84 24.9484.95.05.458
5.36.2
mports
Ani-malsand
prod-ucts
0 25
.4
.34.44.6.47
1.176
545
867.99.8.9
1.21.1131416151.82.62 21.82 32.3313.93835373.8414.2454 95.2515.6555.75.95.760
5.55.5
Cof-fee
01
22
3
6.7.8
1 11.414151.5141.4141.21 1
10101.0101.21.11.11.012
9
12121.31.7161.72 94.2404.24 229292.83.33.346292.52 41.9191,71.52.533
3.02.5
Cocoabeansand
prod-ucts
«)<)4)4)4)
(<)
0.1
.2
222232
2
222
2
.1
.1
2232.2
'5
61.0141.2
997.8
1.11.41 11 21.0101.11.11.11.11.01 1
1.01.3
Agri-culturaltrade
balance
-08-10-1
6
5.8
12.3
-1 1-1 1-1 1-13-.9-8
26
(4)-1
101312162.32.12.41.9131 1
15192.99.3
11712.612010.214618023826421319.61859.14 783
16.118216.616518.317.618.9258
22.924.6
'Total includes items not shown separately.2Rice, wheat, and wheat flour.^Includes nuts, fruits, and vegetable preparatiois.
Note.—Data derived from official estimates released by the Bureau of the Census, Department of Commerce. Agricultural commodities aredefined as (1) nonmarine food products aid (2) other products of agriculture which have not passed through complex processes of manufac-ture. Export value, at U.S. port of exportation, is based on the selling price and includes inland freight, insurance, and other charges to theport. Import value, defined generaby as the market value in the foreign country, excludes import duties, ocean freight, and marine insurance.
Source: Department of Agriculture, Economic Research Service.
413
Digitized for FRASER http://fraser.stlouisfed.org/ Federal Reserve Bank of St. Louis
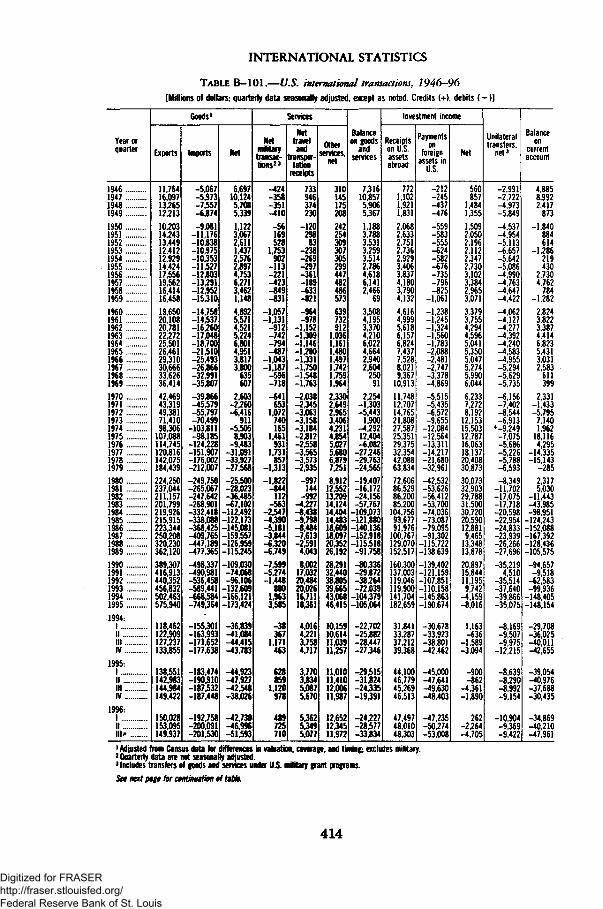
INTERNATIONAL STATISTICS
TABLE B-l 01.—U.S. international transactions, 1946-96[Millions of dollars; quarterly data seasonally adjusted, except as noted. Credits (+), debits (-)]
Year orquarter
1946194719481949195019511952 :: :.195319541955195619571958195919601961196219631964196519661967196819691970197119721973 .1974197519761977197819791980198119821983198419851986 zz:19871988198919901991 .:.:19921993199419951994:
nZZZIIIIV
1995:IIIIllIV
1996:|IIIll'
Goods1
Exports
11,76416,09713,26512,21310.20314,24313,44912,41212,92914,42417,55619,56216,41416,45819,65020,10820,78122,27225,50126,46129,31030,66633,62636,41442,46943,31949,38171,41098,306
107,088114,745120,816142,075184,439224,250237,044211,157201,799219,926215,915223,344250,208320,230362,120389,307416,913440,352456,832502,463575,940
118,462122,909127,237133,855
138,551142,983144,984149,422
150,028153,095149,937
Imports
-5,067-5,973-7,557-6,874-9,081
-11,176-10,838-10,975-10.353-11,527-12303-13.291-12.952-15310-14.758-14.537-16,260-17.048-18.700-21,510-25.493-26366-32.991-35307-39,866-45.579-55,797-70.499
-103.811-98.185
-124,228-151,907-176,002-212,007-249,750-265,067-247,642-268,901-332.418-338.088-368.425-409.765-447,189-477,365-498,337-490,981-536.458-589.441-668,584-749,364
-155301-163.993-171,652-177.638
-183.474-190.910-187,532-187,448
-192.758-200.091-201.530
Net
6.69710,1245,7085,3391.1223.0672.6111.4372.5762.8974.7536.2713.4621.1484.8925.5714.5215.2246.8014.9513,8173,800
635607
2.603-2.260-6.416
911-5.5058.903
-9.483-31.091-33.927-27.568-25.500-28,023-36,485-67.102
-112.492-122.173-145.081-159,557-126.959-115.245-109.030-74.068-96.106
-132.609-166,121-173,424
-36,839-41,084-44,415-43,783
-44,923-47,927-42.548-38.026
-42.730-46.9%-51,593
Services
Netmilitarytransac-tions"
-424-358-351-410-56169528
1.753902
-113-221-423-849-431
-1.057-1.131
-912-742-794-487
-1.043-1.187
-596-718-641
6531.072
740165
1.461931
1.731857
-1.313-1.822
-844112
-563-2.547-4390-5.181-3344-€320-6.749-7,599-5,274-1.448
8801.9633.585
-38367
1.171463
628859
1.120978
489725710
Nettraveland
transpor-tation
receipts
733946374230
-12029883
-238-269-297-361-189-633-821-964-978
-1.152-1309-1.146-1.280-1331-1.750-1,548-1,763-2,038-2,345-3.063-3.158-3.184-2312-2.558-3,565-3,573-2.935
-997144
-992-4.227-8.438-9.798-8.484-7.613-2.5914,0438,002
17.03220.48420.02616.71118361
4.0164,2213.7584.717
3.77033345.0875.670
5.36253495.077
Otherservices,
net
310145175208242254309307305299447482486573639732912
1.0361.1611.4801.4971.7421.7591.9642.3302.6492,9653.4064.2314.8545,0275.6806.8797,2518,912
12,55213,20914.12414.40414.48318.60918.09720.35226.19228.29132.44038.80539.66543.06846.415
10.15910,61411.03911.257
11.01011.41012.00611.987
12.65212.34511.972
Balanceon goods
andservices
7,31610.8575,9065,3671,1883,7883,5313,2593,5142,7864,6186,1412,466
693,5084,1953,3704,2106,0224,6642,9402,604
25091
2,254-1,303-5,443
1,900-4,29212,404-6,082
-27,246-29,763-24,565-19,407-16,172-24.156-57.767
-109.073-121.880-140.136-152.918-115,518-91,758-80336-29372-38,264-72,039
-104,379-105,064
-22,702-25,882-28,447-27346
-29,515-31324-24,335-19391
-24,227-28,577-33334
Investment income
Receiptson U.S.assetsabroad
7721,1021,9211,8312,0682,6332,7512,7362,9293,4063,8374,1803,7904,1324,6164,9995,6186,1576,8247,4377,5288,0219,367
10,91311,74812,70714,76521,80827,58725,35129,37532,35442,08863,83472,60686,52986,20085,200
104,75693,67791,976
100,767129,070152,517160,300137,003119,046119,900141,704182,659
31,84133,28737,21239,368
44,10046,77945,26946,513
47,49748,01048,303
Paymentson
foreignassets in
U.S.
-212-245-437-476-559-583-555-624-582-676-735-796-825
-1,061-1,238-1,245-1,324-1,560-1,783-2,088-2,481-2,747-3,378-4,869-5,515-5,435-6,572-9,655
-12,084-12,564-13,311-14,217-21,680-32,961-42,532-53,626-56,412-53,700-74,036-73,087-79,095-91,302
-115,722-138,639-139,402-121,159-107,851-110,158-145,863-190,674
-30,678-33,923-38,801-42,462
-45,000-47,641-49,630-48,403
-47,235-50,274-53,008
Net
560857
1,4841,3551,5092,0502,1962,1122,3472,7303,1023,3842,9653,0713,3793,7554,2944,5965,0415,3505,0475,2745,9906,0446,2337,2728,192
12,15315,50312,78716,06318,13720,40830,87330,07332,90329,78831,50030,72020,59012,8819,465
13,34813,87820,89715,84411,1959,742
-4,159-8,016
1,163-636
-1,589-3,094
-900-862
-4,361-1,890
262-2,264-4,705
Unilateraltransfers,
net3
-2,991-2,722-4,973-5,849-4,537-4,954-5,113-6,657-5,642-5,086-4,990-4,763-4,647-4,422-4,062-4,127-4,277-4,392-4,240-4,583-4,955-5,294-5,629-5,735-6,156-7,402-8,544-6,913
«-9,249-7,075-5,686-5,226-5,788-6,593-8,349
-11,702-17,075-17,718-20,598-22,954-24,833-23,939-26,266-27,696-35,219
4,510-35,514-37,640-39,866-35,075
-8,169-9,507-9,975
-12,215
-8,639-8,290-8,992-9,154
-10,904-9,369-9,422
Balanceon
currentaccount
4,8858,9922,417
873-1,840
884614
-1,286219430
2,7304,762
784-1,282
2,8243,8223,3874,4146,8235,4313,0312,583
611399
2,331-1,433-5,795
7,1401,962
18,1164,295
-14,335-15,143
-2852,3175,030
-11,443-43,985-98,951
-124,243-152,088-167,392-128,436-105,575-94,657-9,518
-62,583-99,936
-148,405-148,154
-29,708-36,025-40,011-42,655
-39,054-40,976-37,688-30,435
-34,869-40,210-47,961
1 Adjusted from Census data for differences in valuation, coverage, and timing; excludes military.2 Quarterly data are not seasonally adjusted.3 Includes transfers of goods and services under U.S. military grant programs.See next page for continuation of table.
414
Digitized for FRASER http://fraser.stlouisfed.org/ Federal Reserve Bank of St. Louis

TABLE B-101.—US. international transactions, 1946-96—Continued[Millions of dollars; quarterly data seasonally adjusted, except as noted]
Year or quarter
194619471948194919501951195219531954195519561957195819591960196119621963196419651966196719681969197019711972197319741975197619771978197919801981198219831984198519861987198819891990199119921993199419951994:
IIHIIV
1995:1IIIIIIV
19S6:
IIIII*
U.S. assets abroad, net[increase&apftal outflow (-)]
Total
-4,099-5,53«-4,174-7,270-9,560-5,716-7.321-9,757
-10,977-11,585-9,337
-12,475-14,497-22,874-34,745-39,703-51,269-34,785-61,130-46,054-86,967
-114,147-122,335-61,573-36,313-39J89
-106,753-72,617
-100,087-168,744-74,011-57,881-€8.622
-194,609-150.695-307,856
-36,897-28,627-25,569-59,603
-€1,747-108,299-39,595-98,214
M-54,676
U.S.officialreserveassets"
-623-3,315-1.736
-2661.758-33
-4151,256
480182
-469-1.1652.2921.0352.145
6071.535
378171
1,22557053
-870-1.179
2.481urn
158-1.467
-849-2.558
-375732
-1.133
-*.155-5.175
35«BJ8
-3,912-25.293-2.158
5.7633.901
-U795346
-9.742
-593,537-1652,033
-5318-2.722-1J93
191
17-5237,489
OtherU.S
Govern-mentassets
-1.100-910
-1.085-1.662-1,680-1,605-1.543-2.423-2,274-2,200
:!J8-1.568-2.644
«366-3.474-4,214
3%-3.746-5.162-5.097-6.131-5.006-5,489-2.821-2.022
1.0062,9671,25923072.911
-1657-342-341-280
399491
-288-943
-154-179
252-199
-152-353
72
U.S.privateassets
-5,144-5,235-4,623-5,986-8,050-5,336-6,347-7,386-7,833-*,206
-10,229-12,940-12,925-20388-33,643-35,380-44,498-30,717-57,202-61,176-73,651
-103,875-111,239-55372-27,694-33,211
-105,044-82,771-99,141
-144,710-74,160-66,555-70866
-192,889-155,700-297,834
-37,237-32.655-25,116-60,693
-56,275-105,398-37,954-98,206
-€8,615-49350-62,237
Foreign assets in the U.S., net[increase/capital inflow (+)]
Total
2,2942,7051,9113,2173,643
7423,6617,3799,928
12,7026,359
22,97021,46118,38834,24115,67036,51851,31964,03638,75258,11283,03292,41883,380
113,932141,183226,111242,983240,265218,490122,19294,241
154.285250,996285,376424,462
83,23545,88983,61972,632
90,995115,421118,81699,229
99,471100,549123,999
Foreignofficialassets2
1,473765
1,2701,9861,660
134-6723,451-774
-1,3016,908
26,87910,4756,026
10,5467,027
17,69336,81633,678
-13,66515,4974,9603,5935,8453,140
-1,11935,64845,38739,7588,503
33,91017,38940,47772,15340,253
109,757
11,0369,166
19,785266
21,82237,38039,18611,369
52,02113,56623,642
Otherforeignassets
8211,939
6411,2311,983
6074,3333,928
10,70314,002-550
-3,90910,98612,36223,6968,643
18,82614,50330,35852,41642,61578,07288,82677,534
110,792142,301190,463197,596200,507209,98788,28276,853
113,808178,843245,123314,705
72,19936,72363,83472,366
69,17378,04179,63087,860
47,45086,983
100,357
Altarations ofspecial
drawingrights(SORs)
•"—
867717710
0'391,1521,093
Statisticaldiscrepancy
Total(sum of
theitems
with signreversed)
-1,019-989
-1 124-360-907-457
629-205
438-1,516
-219-9,779-1,879-2,654-1,458
5,91710,455-2,19912,23626,44925,38624,99241,35922,17921,33122,95032729-2i974
-11,74355,83046,476
-26,843-23,080
43,55013,72431,548
-16,63018,763
-18,03929,626
9,806-33,854-41,533
29,420
4,148-9,613
-21,362
Ofwhich:
Seasonaladjust-
mentdiscrep-
ancy
5,105274
-€,4901,107
6,519-266
-7,4071,153
6,279-801
-8,6994 Includes extraordinary U.S. Got swrth India.s Consists of gold, special drawing rifKs, foreign currencies, and the U.S. reserve position in the International Monetary Fund (IMF).Source: Department of Commerce, Bureau of Economic Analysis.
415
Digitized for FRASER http://fraser.stlouisfed.org/ Federal Reserve Bank of St. Louis

TABLE B-102.—U.S. international trade in goods by principal end-use category, 2965-96[Billions of dollars; quarterly data seasonally adjusted]
Year orquarter
196519661967 .. .19681969
19701971197219731974
1975197619771978 •1979 . .
19801981198219831984 .. ..
19851986198719881989
19901991199219931994
1995
1994:1II . .IllIV
1995:1IIIllIV
1996-1IIIII P
Exports
Total
26.529.330.733.636.4
42.543.349.471.498.3
107.1114.7120.8142.1184.4
224.3237.0211.2201.8219.9
215.9223.3250.2320.2362.1
389.3416.9440.4456.8502.5
575.9
118.5122.9127.2133.9
138.6143.0145.0149.4
150.0153.1149.9
*«£turalprod-ucts
6.36.96.56.36.1
7.47.89.5
18.022.4
22.223.424.329.935.5
42.044.137.337.138.4
29.627.229.838.842.2
40.240.144.043.747.1
57.2
10.910.911.713.5
13.913.514.715.2
15.815.115.0
Nonagricultural products
Total
20.222.424.227.330.3
35.135.539.953.475.9
84.891.496.5
112.2149.0
182.2193.0173.9164.7181.5
186.3196.2220.4281.4319.9
349.1376.8396.3413.1455.4
518.7
107.6112.0115.5120.4
124.7129.5130.3134.3
134.2138.0135.0
Indus-trial
suppliesand
mate-rials
7.68.28.59.6
10.3
12.310.911.917.026.3
26.828.429.834.252.2
65.163.657.752.756.8
54.859.463.782.691.8
96.9101.7101.7105.0112.6
135.5
26.527.128.830.2
32.934.934.133.6
33.835.533.5
Capitalgoodsexceptauto-motive
8.18.99.9
11.112.4
14.715.416.922.030.9
36.639.139.847.560.2
76.384.276.571.777.0
79.382.892.7
119.1138.9
152.5166.5176.1182.1205.2
233.8
48.851.051.753.7
54.458.059.162.3
62.163.061.1
Auto-motive
1.92.42.83.53.9
3.94.75.56.98.6
10.612.113.415.217.9
17.419.717.218.522.4
24.925.127.633.434.9
36.540.047.052.557.8
61.8
13.514.114.715.4
15.914.915.515.5
15.515.816.5
Other
2.62.93.03.23.7
4.34.55.67.6
10.0
10.811.713.515.318.7
23.425.522.421.825.3
27.228.936.446.354.3
63.268.671.573.579.8
87.6
18.719.720.321.0
21.421.721.622.9
22.823.823.8
Imports
Total
21.525.526.933.035.8
39.945.655.870.5
103.8
98.2124.2151.9176.0212.0
249.8265.1247.6268.9332.4
338.1368.4409.8447.2477.4
498.3491.0536.5589.4668.6
749.4
155.3164.0171.7177.6
183.5190.9187.5187.4
192.8200.1201.5
Petro-leumand
prod-ucts
2.02.12.12.42.62.93.74.78.4
26.6
27.034.645.042.660.4
79.578.462.055.158.1
51.434.342.939.650.9
62.351.751.651.551.3
55.1
10.512.915.112.8
13.114.614.013.4
14.017.517.9
Nonpetroleum products
Total
19.523.424.830.633.2
36.941.951.162.177.2
71.289.7
106.9133.4151.6
170.2186.7185.7213.8274.4
286.7334.1366.8407.6426.5
436.1439.2484.9538.0617.3
694.3
144.8151.1156.5164.9
170.4176.3173.5174.1
178.8182.6183.7
Indus-trial
suppliesand
mate-rials
9.110.210.012.011.8
12.413.816.319.627.8
24.029.835.740.747.5
53.056.148.653.766.1
62.669.970.883.184.5
82.981.289.0
101.0113.6
128.7
27.527.628.530.0
31.734.431.431.3
32.835.434.2
Capitalgoodsexceptauto-motive
1.52.22.52.83.4
4.04.35.98.39.8
10.212.314.019.324.6
31.637.138.443.760.4
61.372.085.1
102.2112.2
116.1120.8134.3152.3184.4
221.4
42.844.946.849.8
51.954.956.758.0
58.456.456.3
Auto-motive
0.91.82.44.04.9
5.57.48.7
10.312.0
11.716.218.625.026.6
28.331.034.343.056.5
64.978.185.287.987.4
88.585.791.8
102.4118.3
124.8
26.928.930.432.0
32.631.930.429.8
31.232.833.9
Other
8.09.29.9
11.813.0
15.016.420.223.927.5
25.331.438.648.452.8
57.462.464.373.391.4
97.9114.2125.7134.4142.5
148.6151.5169.8182.3201.1
219.3
47.649.750.853.1
54.255.155.154.9
56.458.059.2
1 End-use categories beginning 1978 are not strictly comparable with data for earlier periods. See Survey of Current Business, June 1988.Note.—Data are on an international transactions basis and exclude military.In June 1990, end-use categories for goods exports were redefined to include reexports, beginning with data for 1978, reexports (exports of
foreign goods) are assigned to detailed end-use categories in the same manner as exports of domestic goods.Source: Department of Commerce, Bureau of Economic Analysis.
416
Digitized for FRASER http://fraser.stlouisfed.org/ Federal Reserve Bank of St. Louis

TABLE B-103.—U.S. international trade in goods by area, 1987-96[Billions of dollars]
Item
EXPORTS
Industrial countries
CanadaJapanWestern Europe2
Australia, New Zealand,and South Africa
Australia
Other countries, exceptEastern Europe
OPEC3
Other4
Eastern Europe2
International organizationsand unallocated
IMPORTS
Industrial countries
CanadaJapanWestern Europe2
Australia, New Zealand,and South Africa
Australia
Other countries, exceptEastern Europe
OPEC3
Other4
Eastern Europe2 . ..
International organizationsand unallocated
BALANCE (excess ofexports +)
Industrial countries
CanadaJapanWestern Europe2
Australia, New Zealand,and South Africa
Australia
Other countries, exceptEastern Europe
OPEC3
Other4
Eastern Europe2 . ..
International organizationsand unallocated
1987
2502
165.662027.668.6
7.4
5.3
82310.771.6
23
409.8
259.7
73.684696.1
5.4
3.0
148.224.4
1238
19
-159.6
-94.1
-11.6-56.9-27.5
2.02.3
-65.8-137-52.1
3
1988
3202
207.374337.286.4
9.4
6.8
1091
13.895.3
38
.1
447.2
283.2
84.6898
102.6
6.23.5
161.823.0
1388
22
-127.0
-75.9-10.3-52.6-16.2
3.23.3
-52.7-92
-43.516
.1
1989
3621
2342
81 143.998.4
10.9
8.1
1222
127109.5
55
2
4774
292.5
89.9935
102.4
6.63.9
1828
29.21536
21
-115.2
-58.2-88
-49.7-4.0
4.242
-60.6-166-44.1
3 5
.2
1990
3893
2538
83547.8
111.4
11.2
8.3
1306
127117.9
4 3
6
4983
299.9
93.1904
109.2
7.34.4
196.137.0
1591
23
-109.0
-46.1-96
-42.62.2
3.93.9
-65.5-243-41.2
21
.6
1991
4169
2613
85947.2
116.8
11.4
8.3
1504
184132.0
48
4
4910
294.3
93.0923
102.0
7.04.1
194.933.4
1615
1.8
-74.1
-33.0-71
-45.014.8
4.4
4.2
-44.5-150-29.5
30
.4
1992
4404
2651
91446.9
114.5
12.4
8.7
1695
197149.8
56
1
536.5
316.3
100.9974
111.4
6.63.7
218.232.4
1858
20
-96.1-51.2
-9.5-50.5
3.1
5.85.0
-48.7-127-36.0
3.7
.1
1993
456.8
270.6
101246.7
111.3
11.5
8.1
1798
18.7161.1
62
.2
589.4
347.8
113.31072120.9
6.4
3.3
238.132.6
2054
3.5
-132.6
-77.2-12.2-60.5
-9.7
5.24.8
-58.3-140-44.3
2.7
.2
1994
5025
2952
114851.8
115.4
13.2
9.6
2018
171184.7
53
1
6686
389.8
131.11191132.9
6.73.2
272.9
3172412
58
-166.1
-94.6-163-67.3-17.6
6.66.4
-71.1-146-56.6
-5
.1
1995
5759
3381
127663.1
132.4
15.0
10.5
2321
184213.7
5 7
749.4
426.3
148.11235147.7
7.13.4
316.1352
2809
70
-173.4
-88.1-205-60.4-15.2
7.97.1
-84.0-168-$7.2-13
1996 first3 quartersat annual
rate1
6041
352.81334
66.9135.9
16.7
11.8
2440
20.0224.0
72
792.5
441.8159.41144160.5
7.4
3.6
344.3
41.23031
6.5
-188.4
-89.0-261-47.4-24.7
9.28.2
-100.2
-212-79.1
8
1 Preliminary; seasonally adjusted.2 The former'German Democratic Republic (East Germany) included in Western Europe beginning fourth quarter 1990 and in Eastern Europe
prior to that time.3 Organization of Petroleum Exporting Countries, consisting of Algeria, Ecuador (through 1992), Gabon, Indonesia, Iran, Iraq, Kuwait, Libya,
Nigeria, Qatar, Saudi Arabia, United Arab Emirates, and Venezuela.4Latin America, other Western Hemisphere, and other countries in Asia and Africa, less members of OPEC.
Note.—Data are on an international transactions basis and exclude military.
Source: Department of Commerce, Bureau of Economic Analysis.
417
Digitized for FRASER http://fraser.stlouisfed.org/ Federal Reserve Bank of St. Louis

TABLE B-104.—U.S. international trade in goods on balance of payments (BOP) and Census basis,and trade in services on BOP basis, 1974-96
[Billions of dollars; monthly data seasonally adjusted]
Year or month
1974197519761977197819791980
198119821983 '.""..'.'..." "...198419851986198719881989 ::: : ".:::....199019911992199319941995
1995:JanFebMarAprMayJune
July .Augsept ::::::...OctNovDec
1996JanFebMarAprMayJuneJulyAu£SeftOctNov*
Goods: Exports(f.a.s. value) ' 2
Total,BOP
basis3
Census basis (by end-use category)
Total,Censusbasis34
Foods,feeds,andbev-er-
ages
In-dus-trialsup-pliesandma-
terials
Cap-ital
goodsex-
ceptauto-mo-tive
Auto-mo-tivevehi-cles,parts,anden-
gines
Con-sumer
&food)ex-ceptauto-mo-tive
F.a.s. value 2
983107.1114.7120.8142.1184.4224.3
237.0211.2201.8219.9215.9223.3250.2320.2362.1389.3416.9440.4456.8502.5575.9
44.945.648.047.248.147.8
46.648.749.749.549.850.1
48.750.950.550.751.451.0
48.851.150.352.952.7
994108.9116.8123.2145.8186.4225.6
238.7216.4205.6224.0
^218.87 227.2
254.1322.4363.8
393.6421.7448.2465.1512.6584.7
45.646.248.847.848.848.6
47.349.550.350.350.650.9
49.351.751.451.652.551.9
50.252.551.653.954.0
31.330.931.524.022.324.332.337.2
35.135.740.340.641.950.5
3.84.04.14.14.03.9
4.14.54.74.44.44.5
4.74.54.94.74.74.5
4.74.74.44.55.0
61.756.761.758.557.366.785.199.3
104.4109.7109.1111.8121.4146.3
11.611.712.612.412.412.7
11.912.112.412.511.912.1
11.912.212.512.712.512.3
11.412.212.012.712.2
72.767.272.073.975.886.2
109.2138.8
152.7166.7175.9181.7205.2233.0
17.118.019.118.919.419.5
19.120.019.820.320.721.2
19.921.320.821.121.120.7
20.021.020.122.422.2
15.716.820.622.921.724.629.334.8
37.440.047.052.457.661.8
5.55.2
85.14.8
4.85.1
H5.15.2
5.25.44.94.95.45.5
5.25.46.15.25.5
14.313.413.312.614.217.723.136.443.345.951.454.760.064.45.15.25.45.35.55.4
5.25.55.45.55.55.5
5.55.85.75.85.95.9
5.55.85.96.26.1
Goods: Imports (customs value, except asnoted) 5
Total,BOPbasis
Census basis (by end-use category)
Total,Censusbasis4
Foods,feeds,andbev-er-
ages
In-dus-trialsup-pliesandma-
terials
Cap-ital
goodsex-ceptauto-mo-tive
Auto-mo-tivevehi-cles,parts,anden-
gines
Con-sumergoods(non-food)ex-ceptauto-mo-tive
F.a.s. value2
103.898.2
124.2151.9176.0212.0249.8
103.399.3
124.6151.5176.1210.3245.3
Customs value
265.1247.6268.9332.4338.1368.4409.8447.2477.4
498.3491.0536.5589.4668.6749.4
61.059.962.663.264.163.6
62.562.262.962.662.162.7
64.263.764.966.368.265.6
66.367.567.867.067.5
261.0244.0258.0
* 330.7«336.5
365.4406.2441.0473.2
495.3488.5532.7580.7663.3743.4
60.759.761.762.462.962.7
62.361.962.762.261.862.5
63.963.363.764.766.964.7
65.866.767.566.667.2
17.118.221.021.924.424.824.825.1
26.626.527.627.931.033.2
2.82.82.92.72.72.8
2.72.72.82.82.72.7
2.82.83.03.03.02.9
2.93.03.03.03.0
112.0107.0123.7113.9101.3111.0118.3132.3
143.2131.6138.6145.6162.0180.7
14.514.315.315.315.815.7
15.214.815.314.714.914.8
15.614.715.316.617.016.3
17.016.917.417.516.8
35.440.959.865.171.884.5
101.4113.3
116.4120.7134.3152.4184.4221.4
17.117.117.718.118.218.6
18.818.819.019.519.219.3
19.519.419.518.819.018.6
18.618.818.918.719.1
33.340.853.566.878.285.287.786.1
87.385.791.8
102.4118.3124.8
11.210.810.711.010.610.3
10.010.210.29.69.9
10.3
10.610.610.010.511.510.8
11.111.611.210.311.3
39.744.960.068.379.488.795.9
102.9
105.7108.0122.7134.0146.3160.0
13.313.013.313.413.613.3
13.413.413.413.413.113.2
13.513.713.713.514.213.9
13.914.414.814.914.7
Services(BOP basis)
Ex-ports
22.625.528.031.536.439.747.6
57.464.164.371.273.285.998.3
110.9127.0
147.5163.8177.3186.1195.8210.6
16.916.417.117.217.417.2
17.818.118.418.018.218.0
17.918.318.818.418.718.8
18.518.618.518.819.2
Im-ports
21.422.024.627.632.236.741.5
45.551.755.067.772.981.091.799.5
103.5
118.8119.6119.5125.5134.1142.2
11.611.611.811.811.911.9
11.912.112.011.812.011.8
12.012.312.312.412.612.5
12.712.712.512.812.9
1 Department of Defense shipments of grant-aid military supplies and equipment under the Military Assistance Program are excluded fromtotal exports through 1985 and included beginning 1986.2 F.a.s. (free alongside ship) value basis at U.S. port of exportation for exoorts and at foreign port of exportation for imports.3 Includes undocumented exports to Canada through 1988. Beginning 1989, undocumented exports to Canada are included in the appro-priate end-use category.4 Total includes "other" exports or imports, not shown separately.5 Total arrivals of imported goods other than intransit shipments.
'Total includes revisions not reflected in detail.'Total exports are on a revised statistical month basis; end-use categories are on a statistical month basis.Note.—Goods on a Census basis are adjusted to a BOP basis by the Bureau of Economic Analysis, in line with concepts and definitions
used to prepare international and national accounts. The adjustments are necessary to supplement coverage of Census data, to eliminateduplication of transactions recorded elsewhere in international accounts, and to value transactions according to a standard definition.
Data include trade of the U.S. Virgin Islands.Source: Department of Commerce (Bureau of the Census and Bureau of Economic Analysis).
418
Digitized for FRASER http://fraser.stlouisfed.org/ Federal Reserve Bank of St. Louis

TABLE B-105.—International investment position of the United States at year-end, 1987-95[Billions of dollars]
Type ofinvestment
NET INTERNATIONAL INVESTMENT POSITION OF THEUNITED STATES:
With direct investment at current costWith direct investment at market value
U.S. ASSETS ABROAD:
With direct investment at current costWith direct investment at market value
U S. official reserve assetsGold 'Special drawing rightsReserve position in the International Monetary Fund ..Foreign currencies
US. Government assets other than official reserves .U.S. credits and other long-term assets
Repayable in dollarsOther
U.S. foreign currency holdings and U.S. short-termassets
U.S. private assets.With direct investment at current costWith direct investment at market value
Direct investment abroad:At current costAt market value
Foreign securitiesBondsCorporate stocks
U.S. claims on unaffiliated foreignersreported by U.S. nonbanking concerns
U.S. claims reported by U.S. banks, not included else-where
FOREI6N ASSETS IN THE UNITED STATES:
With direct investment at current costWith direct investment at market value
Foreign official assets in the United StatesU.S. Government securities
U.S. Treasury securitiesOther
Other U.S. Government liabilitiesU.S. liabilities reported by U.S. banks, not included
elsewhereOther foreign official assets
Other foreign assets in the United States:With direct investment at current costWith direct investment at market value
Direct investment in the United States:At current costAt market value
U.S. Treasury securities . ...U.S. securities other than U.S. Treasury securities
Corporate and other bondsCorporate stocks .
U.S. liabilities to unaffiliated foreigners reported by U.S.nonbanking concerns
U.S. liabilities reported by U.S. banks, not included else-where
1987
-11.1713
1,637.117223
1624127.610311.3131
88988.1865
1.6
.8
138591,471.0
505.15902154084.3696
1774
549.5
1,648.216509
2831220.52137
6815.7
31.8150
1,365 113679
3135316.2826
341.7166.11756
1102
517.2
1988
-134.5148
1,784.11 949.7
1442107.4
969.7
174
86185.483.9
1.5
.7
155381,719.4
52686925176090.0860
1978
653.2
1,918.619350
3220260.92530
80152
315144
1596616129
3752391.51009392.3191.32010
1445
583.7
1989
-250.3-771
1,979.322514
1687105.21009.0
446
84583.98241.5
.6
172611,998.2
560.48325217697.8
1199
2343
713.8
2 229.723285
3419263.72573
6415.4
36.5263
1887.819866
4359534.71665482.923172512
1671
635.5
1990
-251.1-211 7
2,066.42,178.1
1747102.41109.1
522
82081.4800
1.3
.6
1,80971,921.5
620.07318228.7118.7110.0
265.3
695.7
2,317.523898
375.3295.0287.9
7117.2
39.9232
1,942.220144
4673539.6162.4467.4245.7221 7
213.4
631.6
1991
-355.1-3490
2,131.723150
159292.61129.5
459
79177.4762
1.2
1.6
189342,076.7
644.38275302.4143.61588
2563
690.4
2,486.826640
4017315.9307.1
8818.6
38.4287
2,085.122623
4919669.1189.5559.2287.32719
208.9
635.6
1992
-512.8-5684
2,146.422856
147487.285
11.8400
80779.07791.1
1.6
191832,057.5
659.479863365156.81797
2543
668.0
2,659.228540
4428335.7323.0
12720.8
55.0313
2,216.424112
4994694.22251620.2319.83004
2207
651.0
1993
-503.5-4125
2,437.627503
1649102.6
9011.8415
80979.0780
1.0
19
219172^504.4
714810275
5506247.83028
2420
684.2
2,941.231629
5166388.33712
17122.5
69.7361
2,424.626463
5392760.92539730.6389.93406
2290
671.9
1994
-580.1-4925
2,546.22 825.8
1634100.110012.0412
81379.2783
2.1
230152i581.2
779.310589'556.2232.33240
273.7
692.3
3,126.333183
546.0415.0393.421624.9
73.3329
2,580.32 772.3
5798771.9266.6752.8413.9338.9
197.3
783.7
1995
-814.0-7737
2,931.933529
1761101.311014.6491
81579.6788
.8
2.0
267433,095.3
880.11301 1'721.7310.7411 1
311 1
761.3
3,745.941266
677.9498.9471.5
27425.9
106.1469
3,068.03,448.7
63851,019.2
388.9998.6533.2465.4
232.9
809.01 Valued at market price.
Note.—For details regarding these data, see Survey of Current Business, June issues 1991-1995 and July 1996.
Source: Department of Commerce, Bureau of Economic Analysis.
419
Digitized for FRASER http://fraser.stlouisfed.org/ Federal Reserve Bank of St. Louis

TABLE B-106.—Industrial production and consumer prices, major industrial countries, 1970-96
Year or quarter
19701971197219731974 .19751976 .. .1977197819791980198119821983198419851986198719881989199019911992199319941995 . .1996*1995 1
IIIllIV
1996:1IIIIIIV/> . .
1970197119721973 . .. .197419751976 . ...19771978197919801981 .198219831984198519861987198819891990199119921993199419951996'1995 1
IIIllIV
1996:1IIIIIIV/>
UnitedStates Canada Japan European
Union1 France Germany2 Italy UnitedKingdom
Industrial production (1987=100)3
61.462.268.373.872.766.372.478,282.685.784.185.781.984.992.894.495.3
100.0104.4106.0106.0104.2107.7111.5118.1121.9125.8121.8121.4122.3122.5123.4125.4126.8128.1
59.062.367.875.877.371.676.579.081.885.782.884.576.281.291.096.195.3
100.0105.3105.2101.797.498.5
102.9110.1113.8
114.4113.5113.9113.6114.0114.4116.3
54.556.060.169.066.359.365.968.673.078.281.882.683.085.593.596.996.7
100.0109.4115.7120.6122.9115.8111.0112.3116.0
116.0116.3114.7117.0117.7117.4118.9
71.573.176.982.884.178.784.486.388.292.492.991.3
'89.990.692.795.897.9
100.0104.4108.5110.7110.5109.1105.5110.9114.7
113.8114.6115.1114.7113.8114.5115.8
727781879083909294
99.999.999.398.397.598.198.198.8
100.0104.6108.5110.1108.7107.5103.4107.3109.0
109.4109.4109.8107.9108.7108.9110.9
75.577.079.985.084.879.686.888.090.494.795.093.290.390.993.597.799.6
100.0103.9108.8114.5117.8115.8107.1110.4111.5
110.6112.2112.2110.3110.4111.5112.6
68.368.070.877.781.273.782.983.885.491.196.294.791.788.991.892.996.2
100.0105.9109.2109.4108.4108.2105.5111.0117.0
115.2116.5120.4118.9115.9115.0114.4
78.478.079.486.684.780.182.887.189.593.187.084.285.888.989.093.996.2
100.0104.8107.0106.7102.8102.7104.9110.1113.0
112.3112.7113.6113.5113.7113.8114.3
Consumer prices (1982-84=100)
38.840.541.844.449.353.856.960.665.272.682.490.996.599.6
103.9107.6109.6113.6118.3124.0130.7136.2140.3144.5148.2152.4156.9150.9152.2152.9153.6155.0156.5157.4158.5
35.136.137.940.845.250.153.858.163.369.176.185.694.9
100.4104.8108.9113.4118.4123.2129.3135.5143.1145.2147.9148.2151.4153.7150.4151.5151.8151.9152.5153.7153.9154.9
38.540.942.947.959.065.972.278.181.484.490.995.398.199.8
102.1104.1104.8104.8105.6108.1111.4115.0116.9118.4119.3119.1
119.1119.4119.1119.0118.7119.5119.3
27.328.930.833.538.043.448.654.559.465.674.383.592.3
100.2107.4114.0118.2122.0126.5133.2140.8148.1154.7160.2165.0170.2
168.2170.0170.7171.6172.9174.5174.8
28.830.432.234.539.343.948.252.757.563.772.382.091.6
100.5107.9114.2117.2120.9124.2128.6133.0137.2140.6143.5145.9148.4151.5147.4148.2148.6149.5150.5151.7151.4152.0
52.855.658.762.867.171.174.276.979.082.286.792.297.1
100.3102.7104.8104.7104.9106.3109.2112.2116.2120.9125.2128.6130.8132.6130.1130.8131.3131.1131.9132.6133.1133.0
17.117.919.020.925.029.334.140.345.352.463.575.387.7
100.8111.5121.1128.5134.4141.1150.4159.5169.8178.8186.3193.6204.0
199.6203.4205.4208.0209.6212.1212.6
21.823.825.527.932.340.246.854.258.766.678.587.995.499.8
104.8111.1114.9119.7125.6135.4148.2156.9162.7165.3169.3175.2179.4172.5175.6176.1176.4177.3179.6179.9181.0
1 Consists of Austria, Belgium, Denmark, Finland, France, Germany, Greece, Ireland, Italy, Luxembourg, Netherlands, Portugal, Spain,Sweden, and United Kingdom.2 Data are for West Germany only.3 All data exclude construction. Quarterly data are seasonally adjusted.
Sources: National sources as reported by Department of Commerce (International Trade Administration, Office of Trade and EconomicAnalysis), Department of Labor (Bureau of Labor Statistics), and Board of Governors of the Federal Reserve System.
420
Digitized for FRASER http://fraser.stlouisfed.org/ Federal Reserve Bank of St. Louis

TABLE B—107.—Civilian unemployment rate, and hourly compensation, major industrial countries,1970-96
[Quarterly data seasonally adjusted]
Year or quarter
19701971197219731974 _19751976 - > . _19771978 ~ ..197919801981 _ „1982198319841985 .... . . .19861987 - > .„19881989 _.>199019911992199319941995 . .19961995-1
IIIllIV „
1996-1 „ .IIIIIIV
19701971 „ . ... „ ..1972197319741975 „ _ .197619771978 _ .19791980 ..198119821983198419851986198719881989
19901991 . . .1992199319941995
UnitedStates Canada Japan France Ger-
many1 Italy UnitedKingdom
Civilian unemployment rate (percent) 2
4.95.95.64.95.68.57.77.16.15.87.17.69.79.67.57.27.06.25.55.3
3 5.66.87.56.9
36.15.65.45.55.65.75.65.65.4'5.35.3
5.76.26.25.55.36.97.28.18.47.57.57.6
11.011.911.310.59.68.97.87.58.1
10.411.311.210.49.59.79.79.59.59.49.59.69.79.9
1.21.31.41.31.41.92.02.02.32.12.02.22.42.7
8H2.52.32.12.12.22.52.93.2
3.03.23.23.43.33.53.4
2.52.82.92.82.94.24.65.25.46.16.57.68.38.6
10.010.510.610.810.39.69.19.63 10.4
11.812.311.7
11.911.611.511.712.212.512.7
0.5.6
'.11.63.43.43.43.32.92.84.05.6
3 6.97.17.26.66.36.35.75.0
M.3"4.6"5.7"6.5"6.5
6.56.56.66.77.07.17.2
3.23.33.83.73.13.43.94.14.14.44.44.95.45.95.96.0
3 7.57.97.97.87.03 6.9
"7.33"10.2"11.3"12.0
12.012.111.911.912.012.511.9
3.13.94.23.23.14.65.96.46.35.47.0
10.511.311.811.811.211.210.38.67.37.08.9
10.110.5"9.6"8.8
8.98.88.88.68.48.48.1
Manufacturing hourly compensation in U.S. dollars (1992=100)*
23.825.326.628.631.835.738.642.045.449.855.861.367.269.071.475.378.680.884.086.790.995.7
100.0102.4105.1109.0
21.223.625.827.732.635.842.343.543.646.851.858.262.566.466.166.067.472.781.888.294.5
102.4100.093.790.691.3
5.86.99.2
12.515.317.518.823.031.532.032.936.133.536.137.238.557.368.378.477.379.390.3
100.0119.3132.6148.8
10.111.313.717.819.426.727.530.337.344.751.946.645.843.641.343.558.870.273.572.4
89.390.3
100.096.8
101.4114.6
8.910.412.617.120.023.124.328.835.942.246.239.538.738.736.337.252.566.370.569.086.089.3
100.0100.1106.4126.6
9.110.612.614.917.421.921.423.828.535.340.336.636.237.837.538.851.762.865.067.886.392.5
100.083.981.483.0
8.810.312.213.615.719.818.620.326.134.345.345.843.540.538.641.050.362.572.369.984.593.5
100.089.593.199.1
1 Data are for West Germany only.2 Civilian unemployment rates, approximating U.S. concepts. Quarterly data for France and Germany should be viewed as less precise indi-cators of unemployment under U.S. concepts that the annual data.
^ There are breaks in the series for Germany (1983), France (1992). Italy (1986,1991, and 1993), and United States (1990 and 1994).Based on the prior series, the rate for Germany was 12 percent in 1983, the rate for France was 10.5 in 1992,11.9 in 1993,12.7 in 1994and 12.3 in 1995, and the rate tar to* was CJ percent in 1986 and 6.6 in 1991. The break in 1993 raised Italy's rate by approximately 1percentage point. For detais « break in series in 1990 and 1994 for United States, see footnote 5, Table B-33.4 Hourly compensation M HttMifacturiag. U.S. dollar basis. Data relate to all employed persons (wage and salary earners and the self-employed) in the United States. Canada, Japan. France, and Germany, and to all employees (wage and salary earners) in the other countries.For France and United Kingdom, compensation adjusted to include changes in employment taxes that are not compensation to employees, butare labor costs to employers.
Source: Department of Labor. Bweau of Labor Statistics.
421
Digitized for FRASER http://fraser.stlouisfed.org/ Federal Reserve Bank of St. Louis
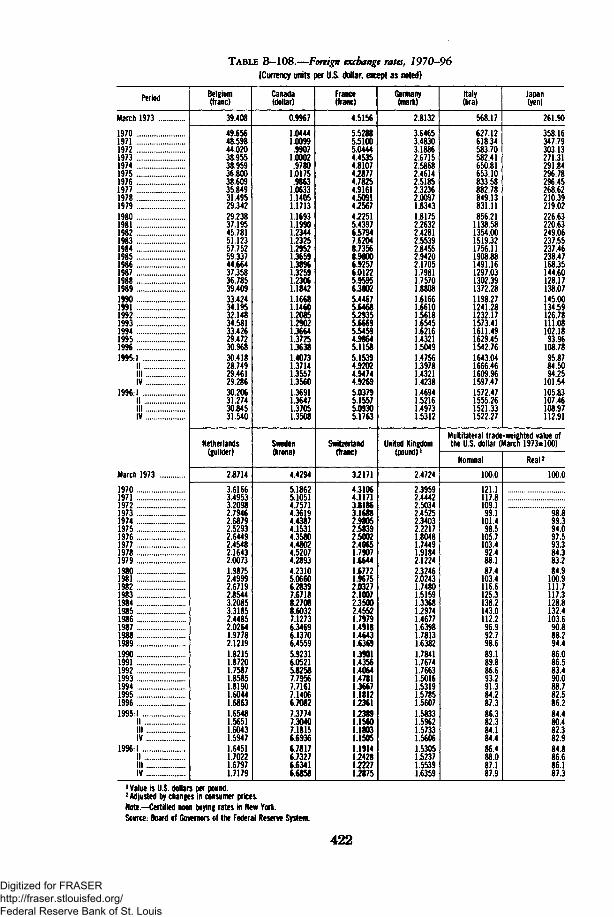
TABLE B-108.—Foreign exchange rates, 1970-96[Currency units per U.S. dollar, except as noted]
Period
March 1973
19701971197219731974197519761977197819791980 . .198119821983198419851986 .. .19871988198919901991199219931994199519961995-1
IIIllIV
1996:1IIIIIIV
March 1973
19701971197219731974197519761977197819791980 . ...19811982198319841985198619871988198919901991 . . . .199219931994199519961995-1
IIIllIV
1996:1||IllIV
Belgium(franc)
39.408
49.65648.59844.02038.95538.95936.80038.60935.84931.49529.34229.23837.19545.78151.12357.75259.33744.66437.35836.78539.40933.42434.19532.14834.58133.42629.47230.96830.41828.74929.46129.28630.20631.27430.84531.540
Netherlands(guilder)
2.8714
3.61663.49533.20982.79462.68792.52932.64492.45482.16432.00731.98752.49992.67192.85443.20853.31852.44852.02641.97782.12191.82151.87201.75871.85851.81901.60441.68631.65481.56511.60431.59471.64511.70221.67971.7179
Canada(dollar)
0.9967
1.04441.0099.9907
1.0002.9780
1.0175.9863
1.06331.14051.17131.16931.19901.23441.23251.29521.36591.38961.32591.23061.18421.16681.14601.20851.29021.36641.37251.36381.40731.37141.35571.35601.36911.36471.37051.3508
(krona)
4.4294
5.18625.10514.75714.36194.43874.15314.35804.48024.52074.28934.23105.06606.28397.67188.27088.60327.12736.34696.13706.45595.92316.05215.82587.79567.71617.14066.70827.37747.90407.18156.69366.78176.73276.63416.6858
France(franc)
4.5156
5.52885.51005.04444.45354.8107428774.78254.91614.509142567422515.43976.57947.62048.73568.98006.92576.01225.9595638025.44675.6468529355.6669534594.98645.11585.15394.92024.94744.92695.03795.15575.09305.1763
Switzerland(franc)
3.2171
431064.11713.81863.16882.9805258392.50022.40651.79071.66441.67721.96752.03272.1007235002.45521.79791.49181.46431.6369139011.43561.40641.4781136671.181212361123891.15601.18031.15051.1914124281222712875
Germany(mark)
2.8132
3.64653.48303.18862.67152.58682.46142.51852.32362.00971.83431.81752.26322.42812.55392.84552.94202.17051.79811.75701.88081.61661.66101.56181.65451.62161.43211.50491.47561.39781.43211.42381.46941.52161.49731.5312
United Kingdom(pound)1
2.4724
2.39592.44422.50342.45252.34032.22171.80481.74491.91842.12242.32462.02431.74801.51591.33681.29741.46771.63981.78131.63821.78411.76741.76631.50161.53191.57851.56071.58331.59621.57331.56061.53051.52371.55391.6359
Italy(lira)
568.17
627.12618.34583.70582.41650.81653.10833.58882.78849.13831.11856.21
1138.581354.001519.321756.111908.881491.161297.031302.391372.281198.271241.281232.171573.411611.491629.451542.761643.041666.461609.961597.471572.471555.261521.331522.27
Japan(yen)
261.90358.16347.79303.13271.31291.84296.78296.45268.62210.39219.02226.63220.63249.06237.55237.46238.47168.35144.60128.17138.07145.00134.59126.78111.08102.1893.96
108.7895.8784.5094.25
101.54105.83107.46108.97112.91
Multilateral trade-weighted value ofthe U.S. dollar (March 1973=100)
Nominal
100.0
121.1117.8109.199.1
101.498.5
105.7103.492.488.187.4
103.4116.6125.3138.2143.0112.296.992.798.689.189.886.693.291.384.287.386.382.384.184.486.488.087.187.9
Real2
100.0
98.899.394.097.593.384.383.284.9
100.9111.7117.3128.8132.4103.690.888.294.486.086.583.490.088.782.586.284.480.482.382.984.886.686.187.3
•Yajue is U.S.doHars per pound.2 Adjusted by changes in consumer prices.Note.-Certified noon buying rates in New York.Source: Board of Governors of the Federal Reserve System.
422
Digitized for FRASER http://fraser.stlouisfed.org/ Federal Reserve Bank of St. Louis
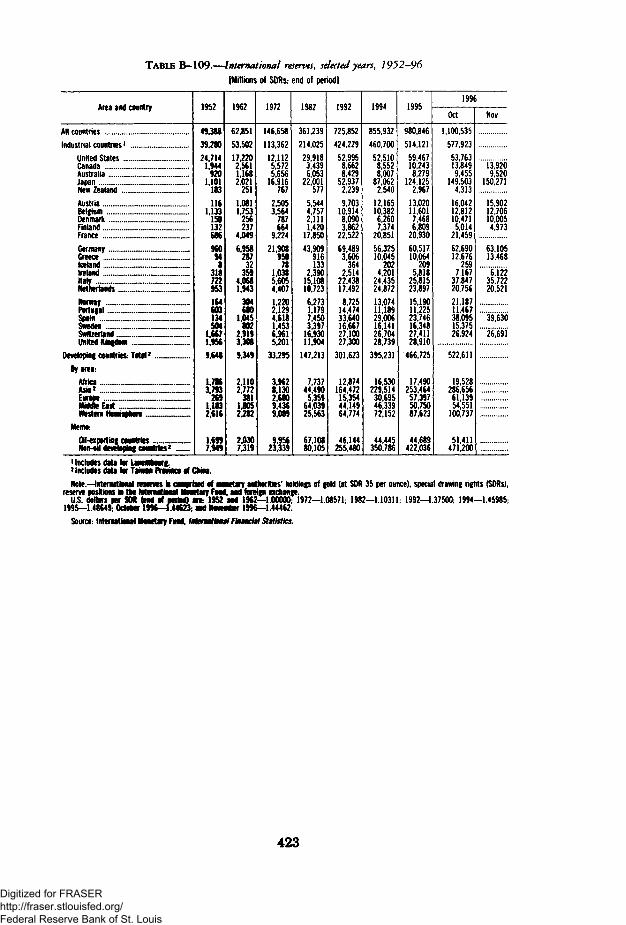
TABLE B-109.—International reserves, selected years, 1952-96
[Millions of SDRs; end of period]
All countriesIndustrial countries1
United StatesCanadaAustraliaJapanNew Zealand _.....AustriaBelgium _DenmarkFinlandFranceGermany „Greece _. ..IcelandIrelandItalyNetherlandsNorwayPortugalSMtnSwedenSwitzerlandUnited Kingdom
Developing countries Total2
By area:AfricaAsia2
EuropeMiddle EastWestern HtmiiaAtrt
Memo:Oil-exportmg countries
1QCO
4938839.28024714
1.944920
1.101183116
1.133150132686960949
3187229S3164603134504
1,66719569648
17163793
2191.1832.616
1.6997949
IQfi?
6285153.502
17.2202.5611.1682.021
2511.0811.753
256237
4.049
6.95828732
3594,0681.943
304680
1.045802
2.91933089349
21102772
3811,8052.282
2.0307319
1Q79
146658113,362
121125.5725.656
16.916767
2,5053,564
787664
9,224
21,908950
78103856054>07
1,22021294,61814536.9615201
33295
39628*1302.6809.4369,089
9,95623339
iqoo
361 239214,025
29,9183,4396,053
22,001577
5,5444,7572,1111,420
17,850
43,909916133
23901510810>23
6,27311797,4503397
16,93011904
147 213
7737444905,359
64,03925,563
67,10880105
1QQ9
725,852
424,22952,9958,6628,429
52,9372,239
9,70310,9148,0903,862
22,522
69,4893,606
3642,514
2243817,492
8,7251447433,6401666727,10027300
301 623
12874164 47215,35444,14964,774
46,144255480
1QQ4
855 932460,700
52,5108,5528,007
87,0622,540
12,16510,3826,2607,374
20,851
56,32510,045
2024,201
2443524i87213,07411 18929,0061614126,70428739
395 231
16530229,51430,69546,33972,152
44,445350 786
iqqc
980,846
514,12159,46710,2438,279
124,1252,967
13,02011,6017,4686,809
20,93060,51710,064
2095,818
2581523,897
15,19011,22523,74616,34827,41128,910
466,725
17490253,46457,39750,75087,623
44,689422 036
199(
Oct
1,100,535
577,92353,76313,8499,455
149,5034,313
16,04212,81210,4715,014
21,459
62,69012,676
2597,167
37,84720,75621,18711,46738,09515,37526,924
522,611
19528286,65661,13954,551
100,737
51,411471 200
Nov
13,9209,520
150,271
15,90212,70610,0054,973
63,10513,468
6,1223572220,521
39,630
26,691
"—•••
'Includes data far jjMMtiitr2 Includes data for TamM PrwiMf if CMn.Note.—Hrtematiwal reams * comprised tf Monetary authorities' hoWinfs of fold (at SDR 35 per ounce), special drawing rights (SORs),
reserve positions in the Mem*** Monetary FMN). and foreign exchange.U.S. dollars per SDK fend tf period) art: 1952 and 1962—1.00000; 1972—1.08571; 1982—1.10311; 1992—1.37500; 1994—1.45985,
1995—1.48649; October 1996—M4623; and Nfventer 1996—1.44462.Source: Intei r Find, f«taMtiMif F,MMKW/ Statistics.
423
Digitized for FRASER http://fraser.stlouisfed.org/ Federal Reserve Bank of St. Louis

TABLE B-l 10.—Growth rates in real gross domestic product, 1978-96[Percent change at annual rate]
Area and country
World
Industrial countriesUnited StatesCanadajapanEuropean Union
FranceGermany2
ItalyUnited Kingdom3
Developing countries .... . . .AfricaAsiaMiddle East and EuropeWestern Hemisphere
Countries in transition
Central and eastern EuropeRussia, Transcaucasus, and central
Asia
1978-417
332.7
2.83237
21
211.8272.345
2.1682.53.130
1988
47
4.33.8506.24.2443.7415.0544191
41.142
1989
373.63.4244.83.5
433.62922
433.46.22.71.621
1990
26
2.51.3-.25.13.0
2.55.721.4
4.31.8595.31.1
-37
1991
15.8
-1.0-18
4.01.6
85.012
-2.0
511.8693.53.3
-115
-108
-12.0
1992
24
1.72.7.8
1.1
1.01.22.2.7
-.56.4
.8886.22.8
-14.7
-99
-18.7
1993
2 4
.9
2.32 2
-.5
-13-1.1-12
2.1
6.3.9
874.23.2
-85-49
-11.7
1994
3 7
2.83.541
2.8
2.82.92.23.9
6.62.991
4.7-8.8
-29
-14.8
1995
352.12.023
.9
2.5
2 21.9302.5
5.93.0863.6
.9-13
12
-4.1
1996 *
38
2.32.4143.51.6
131.31 12.2
635.0803.93.0
4
16
-.9
' All figures are forecasts as published by the International Monetary Fund.2 Through 1991 data are for West Germany only.3 Average of expenditure, income, and output estimates of GOP at market prices.Sources: Department of Commerce (Bureau of Economic Analysis) and International Monetary Fund.
Digitized for FRASER http://fraser.stlouisfed.org/ Federal Reserve Bank of St. Louis